DFPS CPS Mobile Technology Implementation Evaluation · 7/31/2007 · 2006. The final Mobile...
41
1 DFPS CPS Mobile Technology Implementation Evaluation Implementation Report FY 2005 & FY 2006 July 31, 2007 DFPS Performance Management Group Michael Tecci Maria Cervania Cindy Cannon Brad Pierson Child Protective Services Donn Baumann, Ph.D. Management Reporting and Statistics
Transcript of DFPS CPS Mobile Technology Implementation Evaluation · 7/31/2007 · 2006. The final Mobile...

1
DFPS CPS Mobile Technology Implementation Evaluation
Implementation Report FY 2005 & FY 2006
July 31, 2007
DFPS Performance Management Group Michael Tecci Maria Cervania Cindy Cannon Brad Pierson
Child Protective Services Donn Baumann, Ph.D.
Management Reporting and Statistics

DFPS CPS Mobile Technology Implementation Evaluation
Table of Contents
Part I: Executive Summary 3 A. Background 4 B. Specific Findings Part II: Introduction 7 A. Background 9 B. Purpose 9 C. Limitations 10 D. Audience 10 E. Research Questions 10 F. Implementation Evaluation 10 G. Study Population 11 H. Reporting Period 11
I. Caseworker Tablet Training 11 J. About the Tablet PC 11
L. Possible Confounding and Interaction Variables 12 M. Methods 12 Part III: Question 1: Has Mobile Technology maintained or improved CPS Performance Measures? 13 A. Investigation Performance Data
• P1 Investigation Policy Requirements 14 • P1 Initiated Timely 15 • P1 Timely Documentation 16 • P1 Average Days to Document 17 • P2 Investigation Policy Requirements 18 • P2 Initiated Timely 18 • P2 Timely Documentation 19 • P2 Average Days to Document 20 • Supervisor Submit 21
Part IV: Question 2: How have work processes changed since the implementation of Mobile Technology? 23 A. Investigation
• Total Overtime Hours 24 • Average Overtime Hours 25 • Total & Average Number Employees Worked Overtime 26
B. FBSS • Total Overtime Hours 27 • Average Overtime Hours 28 • Total & Average Number Employees Worked Overtime 29
Part V: Question 3: What impact has Mobile Technology Implementation had on CPS Client Outcomes? 30 A. Recurrence of Maltreatment, Six Month Recidivism 31 Part VI: Summary 33 Part VII: Next Steps 35 Part VIII: Appendix A: Data Sources 37 Part IX: Appendix B: DFPS CPS Mobile Technology Evaluation Timeline 39 Part X: Appendix C: Percent Increase and Percent Decrease Explanation and Formula 41
2

Executive Summary
3

Executive Summary
On July 2, 2004, Governor Rick Perry issued Executive Order RP 35 directing the Health and Human Services Commission (HHSC) to review and reform Texas’ Child Protective Services (CPS) program. The executive order required HHSC to review CPS case files, state laws and policies, administrative practices, organizational structure, and agency relations with law enforcement and local communities. HHSC found that weaknesses in management prevented staff from focusing on clear missions and goals and that there was inadequate accountability to ensure the quality of casework needed to keep children safe. In response to their findings in January 6, 2005, HHSC developed a plan, which included more than 160 recommendations to strengthen and improve six key areas of CPS. One specific recommendation was to provide tablet PCs to caseworkers to enable them to access policy and case information in the field, reduce duplication of data entry, and improve the timeliness, quality and integrity of data entered. The Child Protective Services (CPS) Mobile Technology Reform Initiative was begun to implement this recommendation. The Child Protective Services (CPS) program is one of the first Texas Health and Human Services organizations to complete a large-scale mobile computing initiative. Nationally, CPS is one of the few Child Protective programs to incorporate tablet PCs into the day-to-day aspects of casework. The implementation evaluation investigates mobile technology’s effect on established performance measures, work processes, and client outcomes. The reporting period for the implementation evaluation is the 3rd and 4th quarters FY 2005 and FY 2006. The population of participants consists of CPS Investigative1 and Family Based Safety Services (FBSS)2 caseworkers. The Mobile Technology Initiative is expected to maintain or improve the effectiveness of Investigative and FBSS casework. When analyzing and interpreting the data, a variation across time is not the only desired outcome. For example, data may not change between fiscal years, suggesting that performance of the specific task was not delayed or obstructed by the addition of mobile casework. As a result, the status quo performance of casework practice was maintained. Also the data provided in this report is only for two time periods: data before the caseworkers were issued tablet PCs and during the implementation phase of tablet PCs. The implementation phase can also be viewed as the learning phase. As a component of learning, unexplained spikes or dips may occur in the data. These spikes and dips will not be altogether logical until the addition of the FY 2007, post implementation data. In March 2008, a final report will be completed to include all data sources for the 3rd and 4th quarters FY 2005, FY 2006 and FY 2007, and address each research question. The final report will also include a more in-depth and comprehensive data analysis, statistical analysis and next steps. Specific Findings3
CPS Priority 1 Investigations
• Priority 1 investigations initiated within 24 hours decreased 0.3 percent between March and August FY 2005 from 88.5 percent to 88.2 percent, and decreased 0.8 percent between March and August FY 2006 from in 90.1 percent to 89.4 percent.
• Priority 1 investigations documented within 7 days increased 9.0 percent between March and August
FY 2005 from 36.4 percent to 39.7 percent, and increased 6.7 percent between March and August FY 2006 from 39.3 percent to 41.9 percent.
1 CPS INV Tablet PC Users: Job Codes: 5024C, 5024Y, 5025C, 5025F, 5025K, 5025Y, 5026C, 5026Y, 5027C, 5027Y. 2 CPS FBSS Tablet PC Users: Job Codes: 5024C, 5024Y, 5025C, 5025Y, 5026C, 5026Y, 5027Y
43 Refer to APPENDIX C on page 41 for the Percent Increase and Percent Decrease Explanation and Formula
5
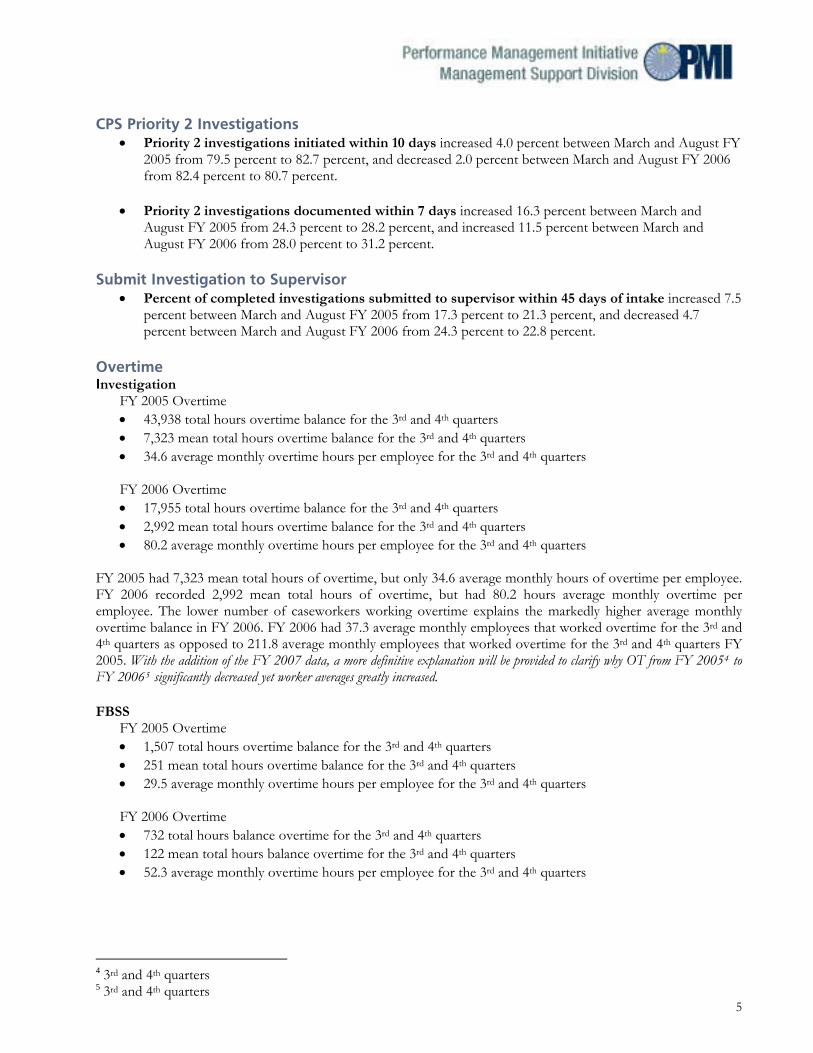
CPS Priority 2 Investigations • Priority 2 investigations initiated within 10 days increased 4.0 percent between March and August FY
2005 from 79.5 percent to 82.7 percent, and decreased 2.0 percent between March and August FY 2006 from 82.4 percent to 80.7 percent.
• Priority 2 investigations documented within 7 days increased 16.3 percent between March and
August FY 2005 from 24.3 percent to 28.2 percent, and increased 11.5 percent between March and August FY 2006 from 28.0 percent to 31.2 percent.
Submit Investigation to Supervisor
• Percent of completed investigations submitted to supervisor within 45 days of intake increased 7.5 percent between March and August FY 2005 from 17.3 percent to 21.3 percent, and decreased 4.7 percent between March and August FY 2006 from 24.3 percent to 22.8 percent.
Overtime Investigation
FY 2005 Overtime • 43,938 total hours overtime balance for the 3rd and 4th quarters • 7,323 mean total hours overtime balance for the 3rd and 4th quarters • 34.6 average monthly overtime hours per employee for the 3rd and 4th quarters
FY 2006 Overtime • 17,955 total hours overtime balance for the 3rd and 4th quarters • 2,992 mean total hours overtime balance for the 3rd and 4th quarters • 80.2 average monthly overtime hours per employee for the 3rd and 4th quarters
FY 2005 had 7,323 mean total hours of overtime, but only 34.6 average monthly hours of overtime per employee. FY 2006 recorded 2,992 mean total hours of overtime, but had 80.2 hours average monthly overtime per employee. The lower number of caseworkers working overtime explains the markedly higher average monthly overtime balance in FY 2006. FY 2006 had 37.3 average monthly employees that worked overtime for the 3rd and 4th quarters as opposed to 211.8 average monthly employees that worked overtime for the 3rd and 4th quarters FY 2005. With the addition of the FY 2007 data, a more definitive explanation will be provided to clarify why OT from FY 20054 to FY 20065 significantly decreased yet worker averages greatly increased. FBSS
FY 2005 Overtime • 1,507 total hours overtime balance for the 3rd and 4th quarters • 251 mean total hours overtime balance for the 3rd and 4th quarters • 29.5 average monthly overtime hours per employee for the 3rd and 4th quarters FY 2006 Overtime • 732 total hours balance overtime for the 3rd and 4th quarters • 122 mean total hours balance overtime for the 3rd and 4th quarters • 52.3 average monthly overtime hours per employee for the 3rd and 4th quarters
4 3rd and 4th quarters 5 3rd and 4th quarters

6
FY 2005 had 1,507 mean total hours of overtime, but only 29.5 average monthly hours of overtime per employee. FY 2006 recorded 732 mean total hours of overtime, but had 52.3 hours average monthly overtime per employee. The lower number of caseworkers working overtime explains the distinctly higher average monthly overtime balance in FY 2006. FY 2006 had 2.3 average monthly employees that worked over time for the 3rd and 4th quarters as opposed to 8.5 average monthly employees that worked over time for the 3rd and 4th quarters FY 2005. With the addition of the FY 2007 data, a more definitive explanation will be provided to clarify why OT from FY 20056 to FY 20067 significantly decreased yet worker averages greatly increased. Changes in Client Outcomes
• The percent of child victims with RTB finding within prior 6 months increased 15 percent between the 3rd quarter FY 2005 and the 4th quarter FY 2005.
• The percent of child victims with RTB finding within prior 6 months decreased 2.3 percent between
the 3rd quarter FY 2006 and the 4th quarter FY 2006.
6 3rd and 4th quarters 7 3rd and 4th quarters

Introduction
7
Introduction
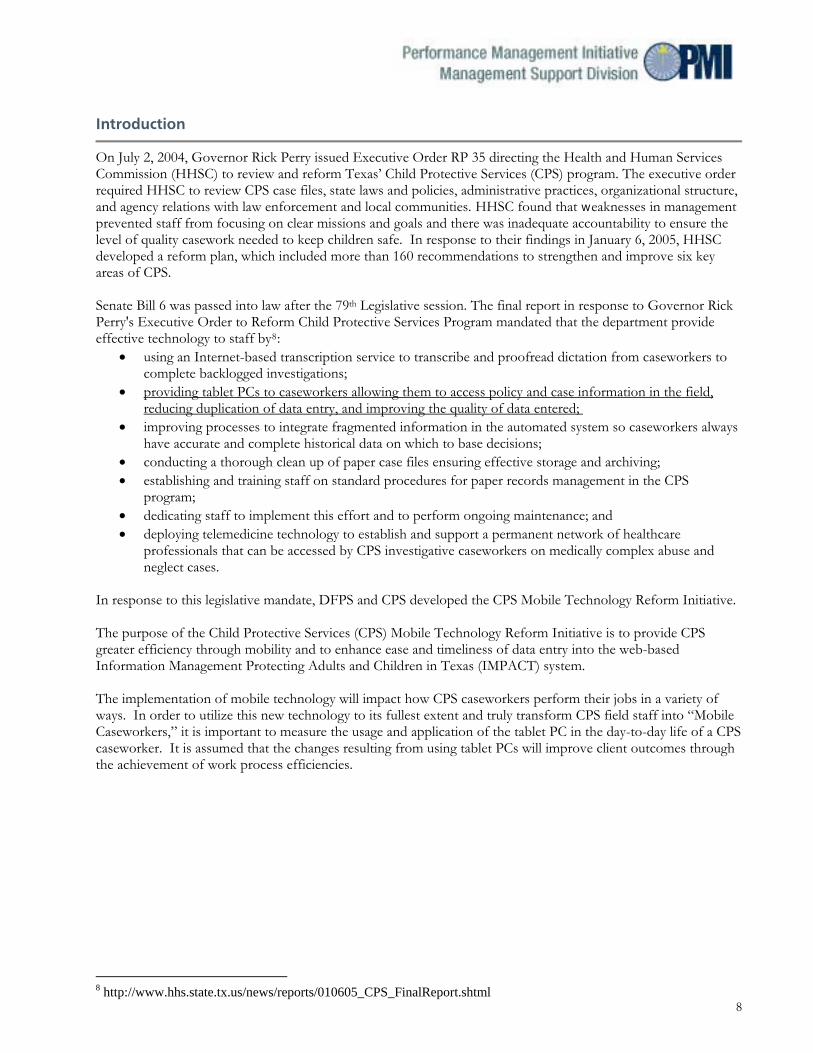
On July 2, 2004, Governor Rick Perry issued Executive Order RP 35 directing the Health and Human Services Commission (HHSC) to review and reform Texas’ Child Protective Services (CPS) program. The executive order required HHSC to review CPS case files, state laws and policies, administrative practices, organizational structure, and agency relations with law enforcement and local communities. HHSC found that weaknesses in management prevented staff from focusing on clear missions and goals and there was inadequate accountability to ensure the level of quality casework needed to keep children safe. In response to their findings in January 6, 2005, HHSC developed a reform plan, which included more than 160 recommendations to strengthen and improve six key areas of CPS. Senate Bill 6 was passed into law after the 79th Legislative session. The final report in response to Governor Rick Perry's Executive Order to Reform Child Protective Services Program mandated that the department provide effective technology to staff by8:
• using an Internet-based transcription service to transcribe and proofread dictation from caseworkers to complete backlogged investigations;
• providing tablet PCs to caseworkers allowing them to access policy and case information in the field, reducing duplication of data entry, and improving the quality of data entered;
• improving processes to integrate fragmented information in the automated system so caseworkers always have accurate and complete historical data on which to base decisions;
• conducting a thorough clean up of paper case files ensuring effective storage and archiving; • establishing and training staff on standard procedures for paper records management in the CPS
program; • dedicating staff to implement this effort and to perform ongoing maintenance; and • deploying telemedicine technology to establish and support a permanent network of healthcare
professionals that can be accessed by CPS investigative caseworkers on medically complex abuse and neglect cases.
In response to this legislative mandate, DFPS and CPS developed the CPS Mobile Technology Reform Initiative. The purpose of the Child Protective Services (CPS) Mobile Technology Reform Initiative is to provide CPS greater efficiency through mobility and to enhance ease and timeliness of data entry into the web-based Information Management Protecting Adults and Children in Texas (IMPACT) system. The implementation of mobile technology will impact how CPS caseworkers perform their jobs in a variety of ways. In order to utilize this new technology to its fullest extent and truly transform CPS field staff into “Mobile Caseworkers,” it is important to measure the usage and application of the tablet PC in the day-to-day life of a CPS caseworker. It is assumed that the changes resulting from using tablet PCs will improve client outcomes through the achievement of work process efficiencies.
88 http://www.hhs.state.tx.us/news/reports/010605_CPS_FinalReport.shtml

Background
The Child Protective Services (CPS) program is one of the first Texas Health and Human Services organizations to complete a large-scale mobile computing initiative. Nationally, CPS is one of the few Child Protective programs to incorporate tablet PCs into the day-to-day aspects of casework. The purpose of the CPS Mobile Technology Initiative is to provide greater flexibility to caseworkers, by allowing ease of access to case information and case documentation from the field, resulting in greater efficiency in completing required work tasks. To accomplish this, a mobile version of the case management system (IMPACT) was developed to allow access to key case details without relying on a wireless connection. This application, Mobile Protective Services (MPS), allows caseworkers to “check out” cases they need to use in the field and then “check in” all information they have documented at a later time. All tablet PCs are equipped with a wireless card intended for intermittent network access from the field. CPS conducted a Tablet PC Pilot that consisted of 90 CPS Super Skilled Users (SSU): Investigation and Family Based Safety Services (FBSS) caseworkers, selected by the regions, from a pool projected to receive a tablet PC. By allowing a small group of users to test the hardware in the field, CPS and IT were able to estimate the extent of the tablet PC benefits, prior to implementing MPS. As a result of the pilot, a full CPS rollout of tablet PCs was completed on October 19, 2006. The SSUs remained a technical resource for other Investigation and FBSS caseworkers during statewide implementation. As of October 19, 2006, the distribution of all CPS Investigation and Family Based Safety Service (FBSS) caseworkers’ tablet PCs has been completed. Eighty-four of the aforementioned caseworkers were also part of the tablet PC pilot group. Even though the distribution of tablet PCs is complete, the project implementation is far from over. The technologies being introduced (e.g. tablet PCs, XP Operating System, wireless broadband cards) are all very new and cutting edge tools. DFPS continues to learn how best to support these users through timely resolution of problems, on-going communication, and assessment of training needs. Purpose
The purpose of the DFPS CPS Mobile Technology Evaluation is to examine and analyze:
• patterns of mobile technology usage; • mobile technology impact on CPS performance as measured by established metrics; • apparent and potential best practices; • changes in timeliness and quality of documentation; • changes in client outcomes; • employee retention data; • changes in work processes; and • mobile technology’s impact on the user’s job satisfaction.
9
Limitations
Concurrent with the mobile technology deployment, several agency changes were instituted during CPS Renewal. These included improvements in training, staffing, community engagement, caseload management, and performance management. These elements of reform limit DFPS’ ability to directly attribute an improvement in casework practice solely to the implementation of mobile technology. Audiences
The DFPS CPS Mobile Technology Evaluation will be available to all Texas Department of Family and Protective Services staff, members of the Texas Legislature, external organizations and groups, other state and federal agencies, and the general public. Research Questions
The purpose of the CPS Mobile Technology Evaluation is to answer the following six research questions:
• Has mobile technology maintained or improved CPS performance on established measures? • How have work processes changed since the implementation of mobile technology? • What impact has mobile technology implementation had on CPS client outcomes? • Utilization of mobile technology: 9
o What specific features of the Tablet PC are the users employing, and how often? o Where and when are the Table PCs being used in the INV and FBSS casework process?
• What impact has mobile technology had on the timeliness and quality of CPS documentation?10 • What impact has mobile technology had on user job satisfaction?11
Implementation Evaluation
The CPS Mobile Technology Implementation Evaluation will only contain data for FY 2005 and FY 2006. The Implementation Evaluation will also only address three of the six research questions:
• Has mobile technology maintained or improved CPS performance on established measures? (INV only) • What impact has mobile technology implementation had on CPS client outcomes? • How have work processes changed since the implementation of mobile technology?
In March 2008, a final report will be completed to include all data sources for the 3rd and 4th quarters FY 2005, FY 2006 and FY 2007, and address each research question. The final report will also include a more in-depth and comprehensive data analysis, statistical analysis and next steps. Additionally, FBSS performance data will not be included in the implementation evaluation, but will be in the final CPS Mobile Technology Evaluation. At the time of this report, the FBSS PM report query logic has not been finalized by CPS program, and Management Reporting and Statistics (MRS).
9 Data will be available in the Final Report on March 2008. 10 Data will be available in the Final Report on March 2008.
1011 Data will be available in the Final Report on March 2008.

Study Population
The evaluation (including both the quantitative and qualitative analysis) will include all CPS Investigative12 and FBSS13 caseworkers employed during the mobile technology pre-implementation phase and post-implementation phase. Reporting Periods
Prior to mobile technology implementation 3rd and 4th Quarters of Fiscal Year 2005 Mobile technology implementation phase 3rd and 4th Quarters of Fiscal Year 2006 Mobile technology post implementation phase14 3rd and 4th Quarters of Fiscal Year 2007
Caseworker Tablet PC Training
CPS mobile technology users (Investigative and Family Based Safety Service caseworkers) receive their tablet PCs from IT during the first week of hire. Upon receiving the tablet PC, the mobile technology users are given written instructions telling them how to turn on the tablet PCs, how to find the tutorials on the tablet PCs, how to take care of the tablet PCs, and how to set up the docking station. Before Basic Skills Development (BSD) starts, caseworkers attend a four-hour training on tablet PC basics, and an additional four -hour training on how to use IMPACT. Once BSD starts, the trainees use their tablet PCs everyday to look up policies, procedures and laws. They are encouraged to take notes using their tablet PCs so they can become accustomed to documenting with the digitizer. CPS mobile technology users are also taught how to use air cards, how to use MPS (Mobile Protective Services), and how to download pictures and burn them onto CDs. The tablet PC is incorporated into BSD throughout the entire course. About The Tablet PC
Tablet PC Description The LE 1600TC Motion Tablet PC is one of the few “hybrid” tablet PC designs available on the market. This model combines the mobility of a slate tablet PC (where there is no keyboard and the device is thin) with the reliability of a fully functioning computer system. In addition, Motion’s portable keyboard will be supplied to all of the mobile technology participants to convert the device into a laptop format. Other slate tablet PC designs have plug-in keyboards that remain separated from the device and decrease the usage options. This is a breakthrough in optimizing the balance between performance, battery life and a sleek, lightweight design. Features of the Tablet PC The features expected to provide fieldwork benefits to CPS Investigation and FBSS workers are:
• combined usage of the digital pen and Microsoft Journal software create an “electronic notepad” format for easy note taking;
• wireless technology provides improved communication and oversight by management; • mapping software improves daily route planning; and • handwriting recognition software aids in documentation and increases quality through more timely entry.
12 CPS INV Tablet PC Users: Job Codes: 5024C, 5024Y, 5025C, 5025F, 5025K, 5025Y, 5026C, 5026Y, 5027C, 5027Y. 13 CPS FBSS Tablet PC Users: Job Codes: 5024C, 5024Y, 5025C, 5025Y, 5026C, 5026Y, 5027Y.
1114 FY 2007 data will be available in the Final Report on March 2008.
Possible Confounding or Interaction Variables
During the mobile technology implementation phase, DFPS and the CPS Program changes were instituted in response to the overall CPS Renewal. These possible confounding or interaction variables limit DFPS’ ability to directly relate an improvement in practice to the implementation of mobile technology. The elements include, but are not limited to:
• caseloads; • workload; • staff tenure; • turnover; • culture change; and • performance management.
Methods
The implementation evaluation targets on three data sources to provide principal indicators used to measure the effects and impact of the CPS mobile technology implementation. The targeted data sources were:
• quantitative data from IMPACT System; • aggregate Federal Child and Family Safety Review Program Improvement Plan (PIP) data; and • overtime hours.
Quantitative Data from IMPACT System
CPS Performance Measures Quantitative data from the IMPACT System was used to assess if mobile technology has maintained or improved CPS performance measures and quarterly aggregate PIP data. Investigations • Initial contact with principle or primary (timeliness of initiating contacts) • Timeliness of documentation of ongoing investigative activity • Timely completion of investigation • Timely supervisory approval of case • Six month recidivism (PIP data)
Overtime Hours
Comparison of How Work Processes Changed Overtime hours data was used to assess the impact mobile technology implementation has had on the composition of CPS Investigative and FBSS staff.
12

Question 1: Has mobile technology maintained or
improved CPS performance measures?
13
INVESTIGATIONS
Question 1: Has mobile technology maintained or improved CPS Investigation performance measures?
This section of the evaluation will examine the CPS Investigation performance measures to ascertain if mobile technology influenced any improvement. CPS Priority 1 Investigations Performance Management Data
CPS Policy Time Frames for Initiating and Documenting Priority 1 Investigations15
CPS must initiate an investigation within 24 hours of receiving a Priority 1 report. The 24-hour period starts with the date and time the intake report was received. The worker must also document the first date he or she contacted or attempted to contact a person to initiate the investigation. This documentation must be made within seven days16 after the contact or attempted contact. The first day of the seven-day period is the day after the contact or attempted contact.
15 http://www.dfps.state.tx.us/Handbooks/CPS_Handbook/CPS_Handbook.htm
1416 24 hour or Same day next day documentation on September 1, 2007

Chart 1 is the Percent of Priority 1 investigations initiated within 24 hours from the date of intake for the 3rd and 4th quarters, FY 2005 and FY 2006.
Chart 1: Percent of Priority 1 Investigations Initiated Within 24 hours
FY 2005 and FY 2006, 3rd and 4th Quarters(By Month)
88.5% 88.4%
89.4%
89.5%
87.8%88.2%
90.1%89.6% 90.0%
89.3%
90.2%
89.4%
87.0%87.5%88.0%88.5%89.0%89.5%90.0%90.5%
March April May June July August
Per
cen
t P
1 In
itit
ated
Tim
ely
FY 2005 FY 2006
Highlights of Chart 1:
With one exception, for 3rd and 4th Quarter data, FY 2006, when Tablet PC’s were available to staff, yielded slightly better performance then FY 2005 when the tablet PCs were not available.
• FY 2005, 3rd and 4th quarters o 88.9 percent mean Priority 1 investigations initiated within 24 hours o The percent of Priority 1 investigations initiated within 24 hours decreased 0.3 percent between
March and August.
• FY 2006, 3rd and 4th quarters o 89.2 percent mean Priority 1 investigations initiated within 24 hours o The percent of Priority 1 investigations initiated within 24 hours decreased 0.8 percent between
March and August An Analysis of Variance was performed to test for differences among the mean Priority 1 investigations initiated within 24 hours for FY 2006 when tablet PCs were available and FY 2005 when they were not available. There is no statistically significant mean difference between FY 2005 and FY 2006.17 At this time, with only the FY 2005 and FY 2006 time periods, the data available is not sufficient to answer the research question whether mobile technology maintained or improved CPS Priority 1 investigations initiated within 24 hours.
1517 Analysis of Variance P>0.05

Chart 2 is the percent of Priority 1 investigations documented within 7 days of the initiation of the investigation for the 3rd and 4th quarters, FY 2005 and FY 2006.
Chart 2: Percent of Priority 1 Investigations Documented Within 7 days of INV Initiation
FY 2005 and FY 2006, 3rd and 4th Quarters(By Month)
36.4%37.2% 37.1%
38.5%
37.0%
39.7%
39.3% 39.3%38.7%
39.5%38.9%
41.9%
35.0%36.0%37.0%38.0%39.0%40.0%41.0%42.0%43.0%
March April May June July August
Per
cen
t P
1 D
ocu
men
ted
Tim
ely
FY 2005 FY 2006
Highlights of Chart 2:
Overall, 3rd and 4th Quarter data, FY 2006, when tablet PCs were available, had slightly better performance then FY 2005 when they were not.
o 39.6 percent mean Priority 1 investigations documented within 7 days of the initiation of the investigation
o Percent of Priority 1 investigations documented within 7 days increased 9.0 percent between March and August
• FY 2006, 3rd and 4th quarters
o 41.5 percent mean Priority 1 investigations documented within 7 days of the initiation of the investigation
o Percent of Priority 1 investigations documented within 7 days increased 6.7 percent between March and August
An Analysis of Variance was performed to test for differences among the mean of Priority 1 investigations documented within 7 days of the initiation of the investigation for FY 2006 when tablet PCs were available and FY 2005 when they were not available. There is a statistically significant difference between the means.18 However, with only the FY 2005 and FY 2006 time periods, the data available is not sufficient to definitively answer the research question whether mobile technology maintained or improved CPS Priority 1 investigations documented within 7 days of the initiation of the investigation.
1618 Analysis of Variance P<0.05
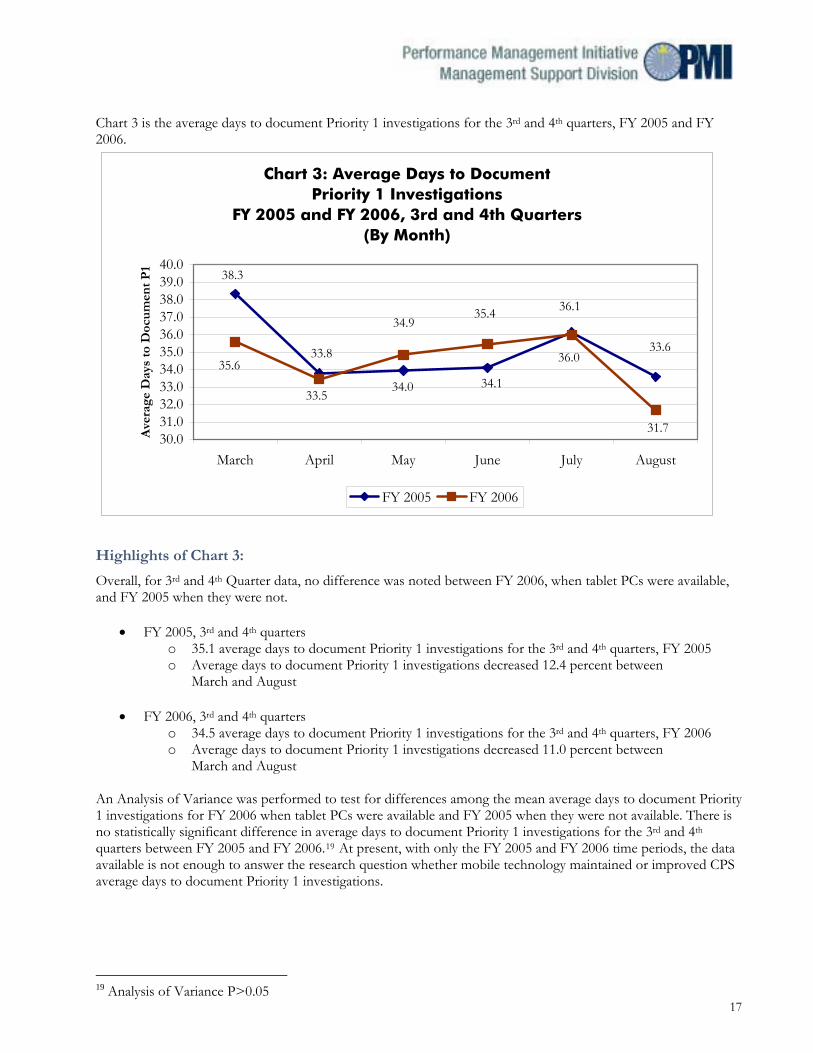
Chart 3 is the average days to document Priority 1 investigations for the 3rd and 4th quarters, FY 2005 and FY 2006.
Chart 3: Average Days to Document Priority 1 Investigations
FY 2005 and FY 2006, 3rd and 4th Quarters(By Month)
33.6
36.1
34.134.0
33.8
38.3
31.7
36.0
35.434.9
33.5
35.6
30.031.032.033.034.035.036.037.038.039.040.0
March April May June July August
Ave
rage
Day
s to
Doc
um
ent
P1
FY 2005 FY 2006
Highlights of Chart 3:
Overall, for 3rd and 4th Quarter data, no difference was noted between FY 2006, when tablet PCs were available, and FY 2005 when they were not.
• FY 2005, 3rd and 4th quarters o 35.1 average days to document Priority 1 investigations for the 3rd and 4th quarters, FY 2005 o Average days to document Priority 1 investigations decreased 12.4 percent between
March and August
• FY 2006, 3rd and 4th quarters o 34.5 average days to document Priority 1 investigations for the 3rd and 4th quarters, FY 2006 o Average days to document Priority 1 investigations decreased 11.0 percent between
March and August
An Analysis of Variance was performed to test for differences among the mean average days to document Priority 1 investigations for FY 2006 when tablet PCs were available and FY 2005 when they were not available. There is no statistically significant difference in average days to document Priority 1 investigations for the 3rd and 4th quarters between FY 2005 and FY 2006.19 At present, with only the FY 2005 and FY 2006 time periods, the data available is not enough to answer the research question whether mobile technology maintained or improved CPS average days to document Priority 1 investigations.
1719 Analysis of Variance P>0.05

CPS Priority 2 Investigations Performance Management Data CPS Policy Time Frames for Initiating and Documenting Priority 2 Investigations20
CPS must initiate an investigation within 1021 days of receiving a Priority 2 report. The 10-day timeframe for Priority 2 investigations starts the day after the intake was received. The worker must document the first date he or she contacted or attempted to contact a person to initiate the investigation. This documentation must be made within seven days22 after the contact or attempted contact. The first day of the seven-day period is the day after the contact or attempted contact. Chart 4 is the percent of Priority 2 investigations initiated within 10 days from the date of intake for the 3rd and 4th quarters, FY 2005 and FY 2006.
Chart 4: Percent of Priority 2 Investigations Initiated Within 10 Days
FY 2005 and FY 2006, 3rd and 4th Quarters(By Month)
82.7%
80.9%
82.4%
81.4%
80.6%
79.5%
80.7%
81.3%82.1%
82.8%82.1%
82.4%
78.0%
79.0%
80.0%
81.0%
82.0%
83.0%
84.0%
March April May June July August
Per
cen
t P
2 In
itit
ated
Tim
ely
FY 2005 FY 2006
Highlights of Chart 4:
Overall, for 3rd and 4th Quarter data, FY 2006 has slightly better performance then FY 2005. • FY 2005, 3rd and 4th quarters
o 81.4 mean Priority 2 investigations initiated within 10 days from the date of intake o Percent of Priority 2 investigations initiated within 10 days increased 4.0 percent between
March and August
• FY 2006, 3rd and 4th quarters o 81.9 mean Priority 2 investigations initiated within 10 days from the date of intake o Percent of Priority 2 investigations initiated within 10 days decreased 2.0 percent between
March and August
20 http://www.dfps.state.tx.us/Handbooks/CPS_Handbook/CPS_Handbook.htm 21 The timeline for documentation CPS Priority 2 Investigation Initiations will change from 10 days to 72 hours
1822 The policy of 24 hour or Same Day, Next Day documentation commences on September 1, 2007.

An Analysis of Variance was performed to test for differences among the mean Priority 2 investigations initiated within 10 days from the date of intake for FY 2006 when tablet PCs were available and FY 2005 when they were not available. There is no statistically significant mean difference between FY 2005 and FY 2006.23 At present, with only the FY 2005 and FY 2006 time periods, the data available is not enough to answer the research question whether mobile technology maintained or improved CPS Priority 2 investigations initiated within 10 days from the date of intake. Chart 5 is the percent of Priority 2 investigations documented within 7 days of the initiation of the investigation for the 3rd and 4th quarters FY 2005 and FY 2006.
Chart 5: Percent of Priority 2 Investigations Documented Within 7 days of INV Initiation
FY 2005 and FY 2006, 3rd and 4th Quarters(By Month)
28.2%
26.1%26.0%26.5%
27.2%
24.3%
31.2%
27.9%28.0%27.2%
26.7%
28.0%
23.0%24.0%25.0%26.0%27.0%28.0%29.0%30.0%31.0%32.0%
March April May June July August
Per
cen
t P
2 D
ocu
men
ted
Tim
ely
FY 2005 FY 2006
Highlights of Chart 5:
In four of six months, for 3rd and 4th Quarter data, FY 2006, when tablet PCs were available, has somewhat improved performance over FY 2005, when they were not.
• FY 2005, 3rd and 4th quarters o 30.8 percent mean Priority 2 investigations documented within 7 days of the initiation of the
investigation o Percent of Priority 2 investigations documented within 7 days increased 16.3 percent between
March and August • FY 2006 3rd and 4th quarter
o 31.8 percent mean Priority 2 investigations documented within 7 days of the initiation of the investigation
o Percent of Priority 2 investigations documented within 7 days increased 11.5 percent between March and August
.
1923 Analysis of Variance P>0.05
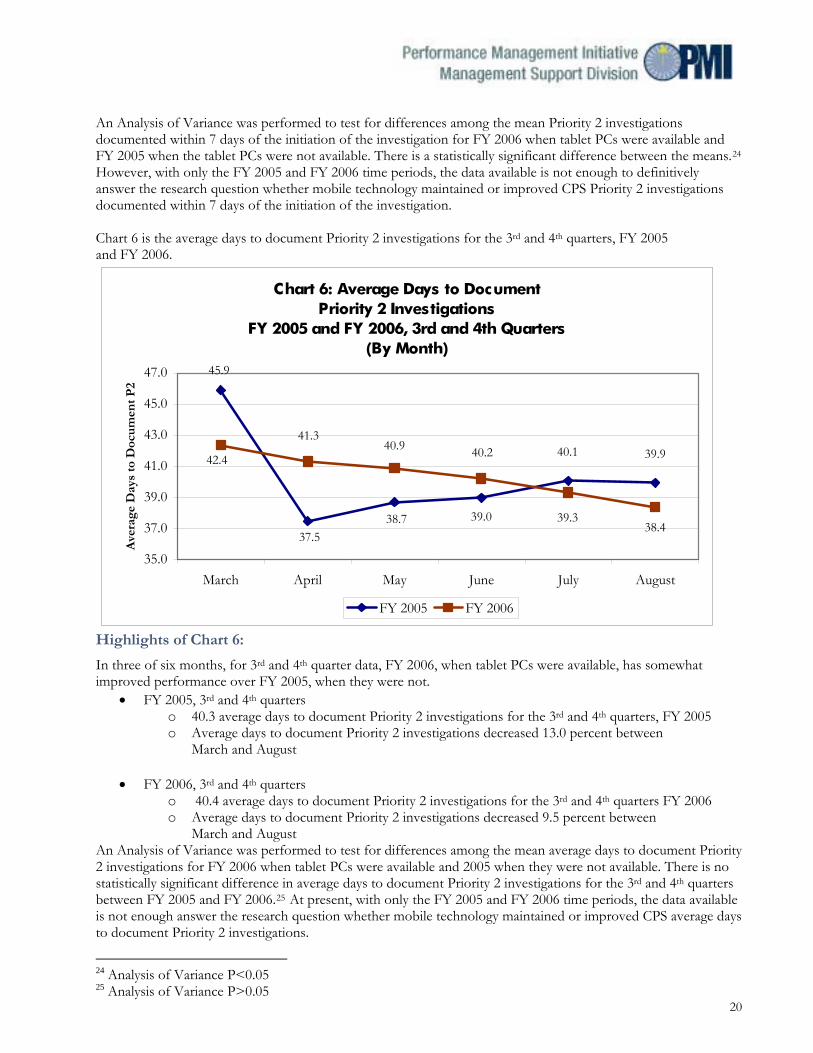
An Analysis of Variance was performed to test for differences among the mean Priority 2 investigations documented within 7 days of the initiation of the investigation for FY 2006 when tablet PCs were available and FY 2005 when the tablet PCs were not available. There is a statistically significant difference between the means.24 However, with only the FY 2005 and FY 2006 time periods, the data available is not enough to definitively answer the research question whether mobile technology maintained or improved CPS Priority 2 investigations documented within 7 days of the initiation of the investigation. Chart 6 is the average days to document Priority 2 investigations for the 3rd and 4th quarters, FY 2005 and FY 2006.
Chart 6: Average Days to Document Priority 2 Investigations
FY 2005 and FY 2006, 3rd and 4th Quarters(By Month)
45.9
37.538.7 39.0
40.1 39.942.4
41.340.9 40.2
39.338.4
35.0
37.0
39.0
41.0
43.0
45.0
47.0
March April May June July August
Ave
rage
Day
s to
Doc
um
ent
P2
FY 2005 FY 2006
Highlights of Chart 6:
In three of six months, for 3rd and 4th quarter data, FY 2006, when tablet PCs were available, has somewhat improved performance over FY 2005, when they were not.
• FY 2005, 3rd and 4th quarters o 40.3 average days to document Priority 2 investigations for the 3rd and 4th quarters, FY 2005 o Average days to document Priority 2 investigations decreased 13.0 percent between
March and August
• FY 2006, 3rd and 4th quarters o 40.4 average days to document Priority 2 investigations for the 3rd and 4th quarters FY 2006 o Average days to document Priority 2 investigations decreased 9.5 percent between
March and August An Analysis of Variance was performed to test for differences among the mean average days to document Priority 2 investigations for FY 2006 when tablet PCs were available and 2005 when they were not available. There is no statistically significant difference in average days to document Priority 2 investigations for the 3rd and 4th quarters between FY 2005 and FY 2006.25 At present, with only the FY 2005 and FY 2006 time periods, the data available is not enough answer the research question whether mobile technology maintained or improved CPS average days to document Priority 2 investigations.
24 Analysis of Variance P<0.05
2025 Analysis of Variance P>0.05

Submit to Supervisor CPS Policy Time Frame for Submitting the Investigation to the Supervisor26 The worker must finish investigation documentation (according to the requirements in Section 2284 and related items), save it, and submit it to the supervisor on IMPACT no later than 45 days after the intake report was received. (The first day of this time period is the day after the intake was received.) The system stores the date of the save-and-submit action as the date the documentation was finished. Chart 7 is the percent of completed investigations submitted to supervisor within 45 days of intake date for the 3rd and 4th quarters, FY 2005 and FY 2006.
Chart 7: Percent of Completed Investigations Submitted to Supervisor within 45 Days of Intake
FY 2005 and FY 2006, 3rd and 4th Quarters(By Month)
17.3%
21.3%
17.8%
22.9%
25.4%25.7%24.3%
22.8%
19.1%20.9%20.3%20.5%
15.0%
17.0%
19.0%
21.0%
23.0%
25.0%
27.0%
March April May June July August
Per
cen
t Su
bm
itte
d w
ith
in 4
5 D
ays
FY 2005 FY 2006
Highlights of Chart 7:
In three of six months, for 3rd and 4th quarter data, FY 2006, when tablet PCs were available, has somewhat improved performance over FY 2005, when they were not.
• FY 2005, 3rd and 4th quarters o 28.4 percent mean completed investigations submitted to supervisor within 45 days of intake o Percent of completed investigations submitted to supervisor within 45 days of intake increased
7.5 percent between March and August
• FY 2006, 3rd and 4th quarters o 26.9 percent mean completed investigations submitted to supervisor within 45 days of intake o Percent of completed investigations submitted to supervisor within 45 days of intake decreased
4.7 percent between March and August
2126 http://www.dfps.state.tx.us/Handbooks/CPS_Handbook/CPS_Handbook.htm

22
An Analysis of Variance was performed to test for differences among the mean completed investigations submitted to supervisor within 45 days of intake for FY 2006 when tablet PCs were available and 2005 when they were not available. There is a statistically significant difference between the means.27 However, with only the FY 2005 and FY 2006 time periods, the data available is not enough to answer the research question whether mobile technology maintained or improved CPS completed investigations submitted to supervisor within 45 days of intake.
27 Analysis of Variance P<0.05

Question 2: How have work processes changed since
the implementation of mobile technology?
23

INVESTIGATIONS
Question 2: How have work processes changed since the implementation of mobile technology?
Comparison of How Work Processes Changed
Overtime Balance
Fair Labor Standards Act (FLSA) non-exempt employees accrue overtime any time they physically work more than 40 hours in a workweek (“physically worked” does not include paid holidays or paid leave). 28
Chart 8 looks at the overtime usage of CPS INV workers by showing the overtime balance (in hours).
Chart 8: INV Total Overtime Balance FY 2005 and FY 2006, 3rd and 4th Quarters
(In Hours, By Month)
3,612.0
5,298.6
842.3
6,221.8
21,734.1
4,058.04,358.43,954.2
3,544.33,955.62,913.11,400.90.0
5,000.0
10,000.0
15,000.0
20,000.0
25,000.0
March April May June July August
Tot
al N
um
ber
of
Hou
rs
FY 2005 FY 2006
Highlights of Chart 8:
Chart 8 is the overtime balance (in hours) for CPS INV caseworkers by month for FY 2005 and FY 200629: FY 2005 Overtime • 43,938 total hours overtime balance for the 3rd and 4th quarters, FY 200530 • 7,323 mean total hours overtime balance for the 3rd and 4th quarters, FY 2005
FY 2006 Overtime • 17,955 total hours overtime balance for the 3rd and 4th quarters, FY 2006 • 2,992 mean total hours overtime balance for the 3rd and 4th quarters, FY 2006
28 Texas Health and Human Services (HHS) Commission, HHS Enterprise Human Resource Manual, 2003. 29 CPS INV Tablet PC Users: Job Codes: 5024C, 5024Y, 5025C, 5025F, 5025K, 5025Y, 5026C, 5026Y, 5027C, 5027Y.
2430 An explanation of what happened in August FY 2005 will be provided in the Final Report.

An Analysis of Variance was performed to test for differences among the mean total hours overtime balance for the fiscal years.
• 7,323 mean total hours – FY 2005 • 2,992 mean total hours – FY 2006
There is no statistically significant mean difference between for overtime balance between the fiscal years. However, with only the FY 2005 and FY 2006 time periods, the data available is not enough to satisfy answering the research question have work processes changed since the implementation of Mobile Technology.
Chart 9 looks at the average overtime balance (in hours) of CPS INV workers.
Chart 9: INV Average Overtime BalanceFY 2005 and FY 2006, 3rd and 4th Quarters
(Per Person, By Month)
28.9 28.0 29.6 24.7 27.1
46.8
68.857.1
79.1
126.6116.7
140.4
0.0
20.040.0
60.080.0
100.0
120.0140.0
160.0
March April May June July August
Ave
rage
Nu
mb
er o
f H
ours
FY 2005 FY 2006
Highlights of Chart 9:
Chart 9 is the average overtime balance (in hours) for CPS INV Caseworkers by month for FY 2005 and FY 200631:
• FY 2005: 34.6 average monthly overtime balance in hours for the 3rd and 4th quarters • FY 2006: 80.2 average monthly overtime balance in hours for the 3rd and 4th quarters
An Analysis of Variance was performed to test for differences among the fiscal years. There is a significant difference in the mean overtime balance between the time periods32. However, with only the FY 2005 and FY 2006 time periods, the data available is not enough to satisfy answering the research question have work processes changed since the implementation of mobile technology.
31 CPS INV Tablet PC Users: Job Codes: 5024C, 5024Y, 5025C, 5025F, 5025K, 5025Y, 5026C, 5026Y, 5027C, 5027Y.
2532 SPSS Independent Sample T-Test: p < 0.05

Chart 10 looks at the number of CPS INV caseworkers that worked overtime by month for FY 2005 and FY 2006.
Chart 10: Number of INV Employees Working Overtime FY 2005 and FY 2006, 3rd and 4th Quarters
(Per Person, By Month)
125 141 147 164
230
464
77
51 50 28 12 6
050
100150200250300350400450500
March April May June July August
Nu
mb
er o
f E
mp
loye
es
FY 2005 FY 2006
Highlights of Chart 10:
Chart 10 is the number of CPS INV caseworkers that worked overtime by month for FY 2005 and FY 200633: • FY 2005
o 1,271 total employees worked overtime for the 3rd and 4th quarters, FY 2005 o 211.8 average monthly employees worked overtime for the 3rd and 4th quarters, FY 2005
• FY 2006 o 224 total employees worked overtime for the 3rd and 4th quarters, FY 2006 o 37.3 average monthly employees worked overtime for the 3rd and 4th quarters, FY 2006
FY 2005 had 7,323 mean total hours of overtime, but only 34.6 average monthly hours of overtime per employee. FY 2006, on the other hand, recorded 2,992 mean total hours of overtime, but had 80.2 hours average monthly overtime per employee. The lower number of caseworkers working overtime explains the markedly higher average monthly overtime balance in FY 2006. FY 2006 had 37.3 average monthly employees that worked overtime for the 3rd and 4th quarters as opposed to 211.8 average monthly employees that worked overtime for the 3rd and 4th quarters FY 2005. With the addition of the FY 2007 data, a more definitive explanation will be provided to clarify why OT from FY 200534 to FY 200635 significantly decreased yet worker averages greatly increased. 33 CPS INV Tablet PC Users: Job Codes: 5024C, 5024Y, 5025C, 5025F, 5025K, 5025Y, 5026C, 5026Y, 5027C, 5027Y 34 3rd and 4th quarters
2635 3rd and 4th quarters

Family Based Safety Services (FBSS)
Question 2: How have work processes changed since the implementation of mobile technology?
Comparison of How Work Processes Changed
Overtime Balance
Chart 11 looks at the overtime usage of CPS FBSS workers by showing the overtime balance (in hours).
Chart 11:FBSS Total Overtime Balance FY 2005 and FY 2006, 3rd and 4th Quarters
(In Hours, By Month)
20.0
147.0
851.4
265.9 247.8 218.0
0.5
126.1
182.0179.90.0 0.0
0.0100.0200.0300.0400.0500.0600.0700.0800.0900.0
March April May June July August
Tot
al N
um
ber
of
Hou
rs
FY 2005 FY 2006
Highlights of Chart 11:
Chart 11 is the overtime balance (in hours) for CPS FBSS caseworkers by month for FY 2005 and FY 200636: FY 2005 Overtime • 1,507 total hours overtime for the 3rd and 4th quarters, FY 2005 • 251 mean total hours overtime for the 3rd and 4th quarters, FY 2005 FY 2006 Overtime • 732 total hours overtime for the 3rd and 4th quarters, FY 2006 • 122 mean total hours overtime for the 3rd and 4th quarters, FY 2006
2736 CPS FBSS Tablet PC Users: Job Codes: 5024C, 5024Y, 5025C, 5025Y, 5026C, 5026Y, 5027Y

An Analysis of Variance was performed to test for differences among the mean total hours for the fiscal years. • 251 total hours overtime for the 3rd and 4th quarters – FY 2005 • 122 total hours overtime for the 3rd and 4th quarters – FY 2006
There is no statistically significant mean difference between fiscal years.37 However, with only the FY 2005 and FY 2006 time periods, the data available is not enough to satisfy answering the research question regarding whether work processes changed since the implementation of mobile technology. Chart 12 looks at the average overtime balance (in hours) for CPS FBSS caseworkers by month for FY 2005 and FY 2006.
Chart 12: FBSS Average Overtime BalanceFY 2005 and FY 2006, 3rd and 4th Quarters
(Per Person, By Month)
4.0
16.321.0
44.3
82.6
54.5
0.5
50.1
22.830.0
0.00.00.0
10.020.030.040.050.060.070.080.090.0
March April May June July August
Ave
rage
Nu
mb
er o
f H
ours
FY 2005 FY 2006
Highlights of Chart 12:
Chart 12 is the average overtime balance (in hours) for CPS FBSS caseworkers by month for FY 2005 and FY 200638:
• FY 2005: 29.5 average monthly hours overtime for the 3rd and 4th quarters, FY 2005 • FY 2006: 52.3 average monthly hours overtime for the 3rd and 4th quarters, FY 2006
An Analysis of Variance was performed to test for differences among the fiscal years. There is no statistically significant mean difference between fiscal years.39 However, with only the FY 2005 and FY 2006 time periods, the data available is not enough to satisfy answering the research question regarding whether work processes changed since the implementation of mobile technology.
37 SPSS Independent Sample T-Test: p > .05 38 CPS FBSS Tablet PC Users: Job Codes: 5024C, 5024Y, 5025C, 5025Y, 5026C, 5026Y, 5027Y
2839 SPSS Independent Sample T-Test: p > .05

Chart 13 looks at the number of CPS FBSS caseworkers that worked overtime by Month for FY 2005 and FY 2006.
Chart 13: Number of FBSS Employees Working Overtime FY 2005 and FY 2006, 3rd and 4th Quarters
(Per Person, By Month)
9
668
17
54
6
00 1
302468
1012141618
March April May June July August
Nu
mb
er o
f E
mp
loye
es
FY 2005 FY 2006
Highlights of Chart 13:
Chart 13 is the number of CPS FBSS caseworkers that worked overtime by Month for FY 2005 and FY 200640: • FY 2005
o 51 total employees worked overtime for the 3rd and 4th quarters, FY 2005 o 8.5 average monthly employees worked overtime for the 3rd and 4th quarters, FY 2005
• FY 2006 o 14 total employees worked overtime for the 3rd and 4th quarters, FY 2006 o 2.3 average monthly employees worked overtime for the 3rd and 4th quarters, FY 2006
FY 2005 had 1,507 mean total hours of overtime, but only 29.5 average monthly hours of overtime per employee. FY 2006, on the other hand, recorded 732 mean total hours of overtime, but had 52.3 hours average monthly overtime per employee. The distinctly higher average monthly overtime balance in FY 2006 is partially explained by the lower number of caseworkers working overtime. FY 2006 had 2.3 average monthly employees that worked overtime for the 3rd and 4th quarters as opposed to 8.5 average monthly employees that worked overtime for the 3rd and 4th quarters FY 2005. With the addition of the FY 2007 data, a more definitive explanation will be provided to clarify why OT from FY 200541 to FY 200642 significantly decreased yet worker averages greatly increased.
40 CPS FBSS Tablet PC Users: Job Codes: 5024C, 5024Y, 5025C, 5025Y, 5026C, 5026Y, 5027Y 41 3rd and 4th quarters
2942 3rd and 4th quarters

Question 3: What impact has mobile technology
implementation had on CPS client outcomes?
30

Question 3: What impact has mobile technology implementation had on CPS client outcomes?
Changes in Client Outcomes Of the 6 Federal Child and Family Safety Review Program Improvement Plan (PIP) indicators, only Recurrence of Maltreatment (Six Month Recidivism) is applicable to CPS INV caseworkers. Currently, none of the PIP indicators are applicable to FBSS. Recurrence of Maltreatment is a measure of all children who were victims of substantiated or indicated maltreatment and of those, how many experienced another incident of maltreatment within six months. In a situation involving maltreatment, services are offered to family members to reduce the risk of future abuse or neglect. If a child suffers another incident of maltreatment, the case is examined to determine why earlier interventions were not successful in stopping the maltreatment.43
Chart 14 looks at the percent of child victims with Reason to Believe (RTB) finding within prior 6 months for CPS INV caseworkers for the 3rd and 4th quarters, FY 2005 and FY 2006
Chart 14: Six Month Recidivism, Percent of Child Victims with RTB Finding Within Prior 6 Months
FY 2005 and FY 2006, 3rd and 4th Quarters
3.9%
4.5%
4.3%
4.4%
3.6%3.7%3.8%3.9%4.0%4.1%4.2%4.3%4.4%4.5%4.6%
Quarter 3 Quarter 4
Per
cen
t C
hild
Vic
tim
s
FY 2005 FY 2006
3143 Six Data Indicators Explanation.doc

32
Highlights of Chart 14:
Chart 14 is the percent of child victims with RTB finding within prior 6 months for CPS INV caseworkers for the 3rd and 4th quarters, FY 2005 and FY 2006:
• The percent of child victims with RTB finding within prior 6 months increased 15 percent between the 3rd quarter and the 4th quarter, FY 2005
• The percent of child victims with RTB finding within prior 6 months decreased 2.3 percent between the 3rd quarter and the 4th quarter, FY 2006
An Analysis of Variance was performed to test for differences among the mean of percent of child victims with RTB finding within prior 6 months for the fiscal years. There is no statistically significant mean difference between fiscal years.44 However, with only the FY 2005 and FY 2006 time periods, the data available is not enough to satisfy answering the research question have work processes changed since the implementation of mobile technology.
44 SPSS Independent Sample T-Test: p >0.05

Summary
33

Summary
The goal of the Child Protective Services (CPS) Mobile Technology Reform Initiative is to provide CPS greater efficiency through mobility and to enhance ease and timeliness of data entry into the web-based Information Management Protecting Adults and Children in Texas (IMPACT) system. The Mobile Technology Initiative is expected to maintain or improve the effectiveness of Investigative and FBSS casework. When analyzing and interpreting the data, a variation across time is not the only desired outcome. For example, data may not change between fiscal years, suggesting that performance of the specific task was not delayed or obstructed by the addition of mobile casework. As a result, the status quo performance of casework practice was maintained. Much of the data provided in this report predate the full distribution and implementation of tablet PCs. The implementation phase can also be viewed as the learning phase. As a component of learning, unexplained spikes or dips may occur in the data. These spikes and dips will not be altogether logical until the addition of the FY 2007, post implementation data.
CPS Priority 1 Investigations In FY 2005, Priority 1 investigations initiated within 24 hours decreased 0.3 percent between March and August FY 2005 from 88.5 percent to 88.2 percent, and decreased 0.8 percent between March and August FY 2006 from in 90.1 percent to 89.4 percent. Although FY 2006 recorded a higher decrease between March and August, the mean Priority 1 investigations initiated within 24 hours was still higher for FY 2006. CPS foresees the continuation of this trend with the inclusion of the FY 2007 data. Priority 1 investigations documented within 7 days increased 9.0 percent between March and August FY 2005 from 36.4 percent to 39.7 percent, and increased 6.7 percent between March and August FY 2006 from 39.3 percent to 41.9 percent. The mean for the Priority 1 Investigations documented within 7 days was slightly higher for FY 2006. This tendency is expected to continue in the FY 2007 data.
CPS Priority 2 Investigations Priority 2 investigations initiated within 10 days increased 4.0 percent between March and August FY 2005 from 79.5 percent to 82.7 percent, and decreased 2.0 percent between March and August FY 2006 from 82.4 percent to 80.7 percent. The mean Priority 2 investigations initiated within 10 days for FY 2005 and FY 2006 were almost equal. The FY 2007 data is anticipated to show continued improvement in Priority 2 investigations initiated within 10 days.
Priority 2 Investigations documented within 7 days increased 16.3 percent between March and August FY 2005 from 24.3 percent to 28.2 percent, and increased 11.5 percent between March and August FY 2006 from 28.0 percent to 31.2 percent. The mean Priority 2 investigations documented within 7 days was slightly higher for FY 2006 compared to FY 2005. The FY 2007 data is expected to maintain this trend of positive progress. Completed Investigations Submitted to Supervisor Percent of completed investigations submitted to supervisor within 45 days of intake increased 7.5 percent between March and August FY 2005 from 17.3 percent to 21.3 percent, and decreased 4.7 percent between March and August FY 2006 from 24.3 percent to 22.8 percent. The mean percent of completed investigations submitted to supervisor within 45 days of intake was slightly higher for FY 2005 compared to FY 2006. This trend is anticipated to change with the inclusion of FY 2007 data, and also show a positive improvement.
34
35
Overtime Investigation FY 2005 had 7,323 mean total hours of overtime balance, but only 34.6 average monthly hours of overtime balance. FY 2006, on the other hand, recorded 2,992 mean total hours of overtime balance, but had 80.2 hours average monthly overtime balance. The justification for FY 2006 having a markedly higher average monthly overtime balance is found in the lower number of caseworkers working overtime. FY 2006 had 37.3 average monthly employees that worked over time for the 3rd and 4th quarters as opposed to 211.8 average monthly employees that worked over time for the 3rd and 4th quarters, FY 2005 FBSS FY 2005 had 251 mean total hours of overtime balance, but only 29.5 average monthly hours of overtime. FY 2006, on the other hand, recorded 732 mean total hours of overtime balance, but had 52.3 hours average monthly overtime balance.
Changes in Client Outcomes Child victims with Reason to Believe (RTB) findings within prior 6 months increased 15 percent between the 3rd quarter and the 4th quarter, FY 2005, and decreased 2.3 percent between the 3rd quarter and the 4th quarter, FY 2006. The final Mobile Technology Evaluation will break down child victims with RTB finding within prior 6 months by month for the 3rd quarter and 4th quarters, FY 2005, FY 2006 and FY 2007, to further illuminate changes over time. Next Steps The CPS Mobile Technology Implementation Evaluation includes limited data sources from FY 2005 and FY 2006. In March 2008, a final report will be completed to include all data sources for the 3rd and 4th quarters, FY 2005, FY 2006 and FY 2007. The final report will also include a more in-depth and comprehensive data analysis, statistical analysis, and next steps.

APPENDIX
36

APPENDIX A
Data Sources
Mobile Technology Usage GOAL: The evaluation will assess how CPS staff is using the mobile technology. DATA SOURCES:
• User Survey Responses o Mobile Technology Usage (What, Where & When)
• Help Desk Calls o Tablet PC Issues (Hardware, Software) o MPS o Connectivity, Wireless, VPN
• Transcription Services (SpeakWrite) Data
CPS Performance Measures GOAL: The evaluation will assess the impact of mobile technology on worker efficiency and CPS performance for investigations and FBSS mobile technology users. DATA SOURCES:
• Quantitative data from IMPACT MEASUREMENT: Investigations
• Initial Contact with Principle or Primary (Timeliness of Initiations Contacts) • Timeliness of Documentation of Ongoing Investigative Activity • Timely Completion of Investigation • Timely Supervisory Approval of Case
FBSS
• Initial Face to Face Contact with Primary after Progression to FBSS Stage • The Plan of Service is Completed Timely • Face to Face Contacts Comply with Policy-prescribed Frequency of Visitation • Documentation of Face to Face Contacts are Entered into IMPACT Within 24 hours of Delivery • Timely ending of FBSS Stage in IMPACT After Case Closure
Client Outcomes and Documentation Quality GOAL: The evaluation will assess the impact of mobile technology has had on CPS client outcomes. DATA SOURCES:
• Quantitative data from IMPACT
MEASUREMENT:
• CPS Client Outcome Metrics (Aggregate PIP measures for INV and FBSS)
37
38
Job Satisfaction GOAL: The evaluation will assess the impact mobile technology implementation has had on the job satisfaction of INV and FBSS Caseworkers. DATA SOURCES: The following resources will be used:
• CPS Mobile Technology User Survey MEASUREMENTS:
• Assess the job satisfaction of INV and FBSS mobile technology caseworkers
Secondary Data Sources - Possible Confounding or Interaction Variables GOAL: The evaluation will also analyze confounding variables, turnover, tenure and workload, for INV and FBSS Mobile Technology caseworkers. DATA SOURCES: The following resources will be used:
• Quantitative data from IMPACT • Quantitative data from HHSAS/Convergys
MEASUREMENTS:
• Staff tenure/retention • Turnover • Caseload
Changes in Work Processes GOAL: The evaluation will assess the impact of mobile technology on the composition of CPS work to moderate overtime. DATA SOURCES: The following resource will be used:
• Monthly CPS Pending Report
MEASUREMENT: The following metrics will be used: • Total Overtime Balance Hours • Overtime Hours Per Person

APPENDIX B
DFPS CPS Mobile Technology Evaluation Timeline
Milestones July 2007 Data Included
March 2008 All Data
Implementation Report - July 2007 Final Report- March 2008
Examination of Mobile Technology Usage
User Survey Responses (What, Where & When) FY 2005- FY 2007
Help Desk Calls:
Tablet PC Issues (Hardware, Software) FY 2005- FY 2007
MPS FY 2005- FY 2007
Connectivity, Wireless, VPN FY 2005- FY 2007
Transcription Services (SpeakWrite) Data FY 2005- FY 2007 CPS Performance Measures Investigations
Initial Contact with Principle or Primary FY 2005 & FY 2006 FY 2007
Timeliness of Documentation of Ongoing Investigative Activity FY 2005 & FY 2006 FY 2007
Timely Completion of Investigation FY 2005 & FY 2006 FY 2007
Timely Supervisory Approval of Case FY 2005 & FY 2006 FY 2007 FBSS
Initial Face to Face Contact with Primary after Progression to FBSS Stage FY 2005- FY 2007
The Plan of Service is Completed Timely FY 2005- FY 2007
Face to Face Contacts Comply with Policy-prescribed Frequency of Visitation FY 2005- FY 2007
Documentation of Face to Face Contacts are Entered into IMPACT Within 24 hours of Delivery FY 2005- FY 2007
Timely Ending of FBSS Stage in IMPACT After Case Closure FY 2005- FY 2007
39

Milestones July 2007
Data Included March 2008
All Data
Implementation Report - July 2007 Final Report- March 2008
Client Outcomes and Documentation Quality
CPS Client Outcome Metrics (Aggregate PIP measures for FBSS and INV) FY 2005 & FY 2006 FY 2007
Mobile Technology Effect on Job Satisfaction FY 2005- FY 2007
Secondary Data Sources - Possible Confounding or Interaction Variables
Staff Tenure/ Retention FY 2005- FY 2007
Turnover FY 2005- FY 2007
Caseload FY 2005- FY 2007 Comparison on How Work Process Changed
Use of Overtime FY 2005 & FY 2006 FY 2007
Change in Overtime FY 2005 & FY 2006 FY 2007
40

APPENDIX C
Percent Increase and Percent Decrease Explanation and Formula45
Percent increase and percent decrease are measures of percent change, which is the extent to which a variable gains or loses intensity, magnitude, extent, or value. The percent increase and percent decrease is determined by comparing the initial (or before) and final (or after) quantities according to a specific formula. It is assumed that both the initial and the final quantities are positive (larger than 0). Suppose a quantity has an initial value of x1, and then increases or decreases to a final value of x2. The percent change, D%, is calculated by finding the difference, x2 - x1 (subtracting the initial value from the final value), then dividing the result of this subtraction by x1 (the initial value), and finally multiplying by 100. Expressed as a formula: D% = ((x2 - x1) / x1) *100 If x2 > x1 (the final value is larger than the initial value, representing an increase in the variable quantity), then D% is a positive number. If x2 < x1 (the final value is smaller than the initial value, representing a decrease), then D% is a negative number. As an example, suppose you buy stock in two companies A and B, both at a price of USD $1.25 per share in January of a given year. Suppose that by July, stock A has risen in value to USD $3.35 per share. Then for stock A: DA% = 100 ($3.35 - $1.25) / $1.25 = +168% Percent change is +168%, also expressed as a percent increase of 168%. Imagine that stock B has fallen to USD $1.00 per share in the same time period. Then for stock B: DB% = 100 ($1.00 - $1.25) / $1.25 = -20% Percent change is -20%, also expressed as a percent decrease of 20% The link below contains a program that will automatically calculate percent increase and percent decrease. Once the page opens, insert the two values in the appropriate fields and click solve. http://www.coolmath.com/calculators/increase.htm
4145 http://whatis.techtarget.com/definition/0,,sid9_gci1163859_top1,00.html