DF – Deep-frozen FD – Freeze-dried Tissue/Bone Bank Types of Tissue/Bone AllograftNational...
17
DF – Deep-frozen FD – Freeze-dried Tissue/Bone Bank Types of Tissue/Bone Allograft National Tissue Bank, USM No. (pieces) DF Knee slices 0 DF Femur 5 DF Femoral head 75 DF Humerus 0 DF Tibia 4 DF Radius 1 DF Ulna 0 FD Cancellous 37 FD Cortical 0 FD Cortico-cancellous 0 Patella 4 Other tendon / fascia / cartilage 1 Amniotic membranes 379 TOTAL 506 Table 7.1.1: Types Of Tissue/Bone Allografts Supplied by National Tissue Bank, USM in 2006
-
Upload
marvin-hines -
Category
Documents
-
view
218 -
download
2
Transcript of DF – Deep-frozen FD – Freeze-dried Tissue/Bone Bank Types of Tissue/Bone AllograftNational...

DF – Deep-frozen
FD – Freeze-dried
Tissue/Bone Bank
Types of Tissue/Bone Allograft National Tissue Bank, USM
No. (pieces)
DF Knee slices 0
DF Femur 5
DF Femoral head 75
DF Humerus 0
DF Tibia 4
DF Radius 1
DF Ulna 0
FD Cancellous 37
FD Cortical 0
FD Cortico-cancellous 0
Patella 4
Other tendon / fascia / cartilage 1
Amniotic membranes 379
TOTAL 506
Table 7.1.1: Types Of Tissue/Bone Allografts Supplied by National Tissue Bank,USM in 2006

Tissue/Bone Bank
National Tissue Bank, USM
No. (pieces)
MOH
Hospital Selayang 3
Hospital Seremban 1
Hospital Sultanah Aminah, Johor Bahru 11
Hospital Pantai Air Keroh, Melaka 4
Hospital Pulau Pinang 7
Hospital Ipoh 9
Hospital Alor Setar 6
Hospital Umum Sarawak 10
Hospital Kuala Terengganu 2
Hospital Kemaman 10
Hospital Tengku Ampuan Afzan, Kuantan 2
Hospital Raja Perempuan Zainab II, Kota Bharu 1
Queen Elizabeth Hospital, Sabah 12
TOTAL 78
University
HUKM 3
HUSM 29
TOTAL 32
Private and other sectors
Antal Rastu Sdn Bhd 2
Kota Bharu Medical Centre 2
Kota Medical Centre, Melaka 1
Lam Wah Ee Penang 3
Pantai Medical Centre, Air Keroh 1
Stryker 6
Sunway Medical Centre 1
TOTAL 16
Table 7.1.2: Hospitals/Other Sectors Using Bone Allografts in 2006

Tissue/Bone Bank
National Tissue Bank, USM
No. (pieces)
MOH
Hospital Kuala Lumpur 13
Hospital Selayang 1
Hospital Sultanah Aminah, Johor Bahru 200
Hospital Melaka 10
Hospital Alor Setar 2
Hospital Teluk Intan 1
Hospital Tengku Ampuan Afzan, Kuantan 7
Hospital Queen Elizabeth 4
TOTAL 238
University
HUSM 8
UMMC 4
HUKM 2
TOTAL 14
Private and other sectors
Gleneagles Medical Centre, Penang 8
Hospital Pakar Johor 100
Sri Kota Medical Centre, Klang 4
Pusat Rawatan Islam Al-Zahirah, Bangi Selangor 10
Hospital Tawakal, Kuala Lumpur 4
Putra Medical Centre 1
TOTAL 127
Table 7.1.3: Hospitals/Other Sectors Using Amniotic Membranes in 2006

Centre 2004 2005 2006
TOTALNo. No. No.
Orthopaedics Department
Orthopaedics Department, HUSM 1 7 2 10
Department of Orthopaedics Surgery, UMMC 1 0 0 1
Institute of Orthopaedic & Traumatology, HKL 2 0 0 2
Department of Orthopaedics, Hospital Ipoh 0 1 0 1
Department of Orthopaedics, Hospital Kota Bharu 9 3 0 12
Orthopaedic Department, Hospital Umum Sarawak 1 0 1 2
Orthopaedics Department, Hospital Sultanah Aminah, Johor Bahru 0 1 0 1
Wan Orthopaedic, Trauma & Sports Injury Centre (WOTSIC), Seremban Specialist Hospital 0 0 2 2
Orthopaedics Department, Hospital Island, Penang 0 1 0 1
Orthopaedics Department, Hospital Fatimah, Ipoh 0 3 0 3
Orthopaedics Department, Kota Bharu Medical Centre 0 0 2 2
Normah Medical Specialist Centre, Kuching 0 1 0 1
Spine Unit, HUSM 0 0 1 1
Ophthalmology Department
Ophthalmology Dept, Hospital Tengku Ampuan Rahimah, Klang 1 1 0 2
Ophthalmology Dept, Hospital Tengku Ampuan Afzan, Kuantan 1 1 0 2
Ophthalmology Department, Hospital Teluk Intan 0 0 1 1
Ophthalmology Department, HKL 0 0 23 23
Ophthalmology Department, Hospital Alor Setar 0 0 1 1
Ophthalmology Department, Sri Kota Medical Centre, Klang 0 1 0 1
Ophthalmology Department, HUSM 0 0 1 1
Others Department
Maxillofacial Surgery, HUSM 1 1 0 2
Timberland Medical Centre 0 1 0 1
Sri Kota Medical Centre, Klang 0 0 1 1
TOTAL 17 22 35 74
Table 7.2.1: Distribution of Reporting Centre by Year

Gender2004 2005 2006 TOTAL
No. % No. % No. % No. %
Male 9 53 10 45 27 77 46 62
Female 8 47 12 55 8 23 28 38
TOTAL 17 100 22 100 35 100 74 100
Ethnic Group2004 2005 2006 TOTAL
No. % No. % No. % No. %
Malay 11 65 14 64 26 74 51 69
Chinese 3 18 5 23 7 20 15 20
Indian 1 6 1 5 1 3 3 4
Bumiputra Sabah 0 0 0 0 0 0 0 0
Bumiputra Sarawak 1 6 0 0 0 0 1 1
Others 1 6 2 9 1 3 4 5
TOTAL 17 100 22 100 35 100 74 100
Table 7.3.1: Distribution of Patients by Gender
Table 7.3.2: Distribution of Patients by Ethnic Group

Age Group2004 2005 2006 TOTAL
No. % No. % No. % No. %
0-9 0 0 1 5 4 11 5 7
10-19 1 6 6 27 2 6 9 12
20-39 9 53 6 27 16 46 31 42
40-59 5 29 3 14 8 23 16 22
≥60 1 6 5 23 4 11 10 14
Missing 1 6 1 5 1 3 3 4
TOTAL 17 100 22 100 35 100 74 100
Mean 35 34 36 35
SD 13 22 19 19
Median 33 26 35 33
Min 15 7 0 0
Max 60 75 75 75
Table 7.3.3: Distribution of Patients by Age Group

Diagnosis2004 2005 2006 TOTAL
No. % No. % No. % No. %
Congenital deformity 1 6 0 0 1 3 2 3
Infection 0 0 0 0 3 9 3 4
Trauma 5 29 1 5 6 17 12 16
Degenerative disease 1 6 2 9 0 0 3 4
Tumour-benign 5 29 4 18 1 3 10 14
Tumour-malignant 0 0 6 27 1 3 7 9
Burn 0 0 1 5 2 6 3 4
Scald 0 0 0 0 1 3 1 1
Sports injury 0 0 1 5 0 0 1 1
Failed primary surgery 1 6 2 9 1 3 4 5
Ophthalmological 0 0 0 0 16 46 16 22
Others 5 29 3 14 6 17 14 19
TOTAL 17 100 22 100 35 100 74 100
Table 7.3.4: Distribution of Patients by Diagnosis Warranting Tissue Graft Transplantation

Name Tissue Bank2004 2005 2006 TOTAL
No. % No. % No. % No. %
Tissue Bank, USM 13 76 18 82 31 89 62 84
Bone Bank, UMMC 1 6 0 0 0 0 1 1
Bone Bank, HKL 3 18 0 0 0 0 3 4
Eucara Pharmaceutical 0 0 0 0 2 6 2 3
Osteo Tech Inc 0 0 1 5 0 0 1 1
Missing 0 0 3 14 2 6 5 7
TOTAL 17 100 22 100 35 100 74 100
Origin of Tissue Graft2004 2005 2006 TOTAL
No. % No. % No. % No. %
Local 17 100 15 68 31 89 63 85
Imported 0 0 3 14 2 6 5 7
Missing 0 0 4 18 2 6 6 8
TOTAL 17 100 22 100 35 100 74 100
Table 7.4.1: Distribution of Patients According to Tissue Provider
Table 7.4.2: Distribution of Patients by Origin of Tissue Graft

Tissue Graft Type Tissue Graft Types
2004 2005 2006 TOTAL
No. % No. % No. % No. %
Deep frozen tissues 9 53 14 64 5 14 28 38
Femur 3 33 3 21 0 0 6 21
Femoral Head 2 22 12 86 2 40 16 57
Humerus 0 0 1 7 3 60 4 14
Tibia 1 11 1 7 1 20 3 11
Radius 2 22 5 36 0 0 7 25
Freeze dried (Lyophilised) 6 35 4 18 29 83 39 53
Amniotic membranes 2 33 3 75 25 86 30 77
Not Available 2 12 2 9 0 0 4 5
Missing 0 0 2 9 1 3 3 4
TOTAL 17 100 22 100 35 100 74 100
Table 7.4.3: Distribution of Patients by Tissue Graft Type

Type Graft Sterilisation2004 2005 2006 TOTAL
No. % No. % No. % No. %
Gamma Irradiation 16 94 8 36 0 0 24 32
Glycerol 0 0 0 0 2 6 2 3
Sterile Freeze Dried Bone 0 0 1 5 0 0 1 1
Missing 1 6 13 59 33 94 47 64
TOTAL 17 100 22 100 35 100 74 100
Mode of Transport Storage to recipient hospital2004 2005 2006 TOTAL
No. % No. % No. % No. %
By Flight 1 6 1 5 2 6 4 5
By Courier 2 12 3 14 24 69 29 39
By Hand 4 24 8 36 1 3 13 18
Dry Ice Box 5 29 4 18 0 0 9 12
Sterile package 0 0 0 0 2 6 2 3
Missing 5 29 6 27 6 17 17 23
TOTAL 17 100 22 100 35 100 74 100
Table 7.4.4: Distribution of Type of Sterilisation of the Graft
Table 7.4.5: Distribution of Mode of Transport Storage to Recipient Hospital during Transportation

Temperature of storage during transportation (oC)2004 2005 2006 TOTAL
No. % No. % No. % No. %
-80 2 12 0 0 0 0 2 3
-40 0 0 1 5 0 0 1 1
-20 4 24 4 18 0 0 8 11
-10 0 0 6 27 2 6 8 11
0 2 12 0 0 0 0 2 3
37 0 0 0 0 2 6 2 3
Missing 9 53 11 50 31 89 51 69
TOTAL 17 100 22 100 35 100 74 100
Table 7.4.6: Distribution of Temperature of Storage during Transportation

Mode of storage in recipient hospital2004 2005 2006 TOTAL
No. % No. % No. % No. %
Refrigerator 0 0 1 5 25 71 26 35
Deep freezer-20 degree Celsius 0 0 3 14 2 6 5 7
Deep freezer-40 degree Celsius 1 6 2 9 0 0 3 4
Deep freezer-80 degree Celsius 3 18 4 18 1 3 8 11
Glycerol 0 0 1 5 3 9 4 5
Room temperature 0 0 1 5 1 3 2 3
Others 12 71 5 23 2 6 19 26
Not available 1 6 0 0 0 0 1 1
Missing 0 0 5 23 1 3 6 8
TOTAL 17 100 22 100 35 100 74 100
Table 7.5.1: Distribution of Mode of Storage in Recipient Hospitals
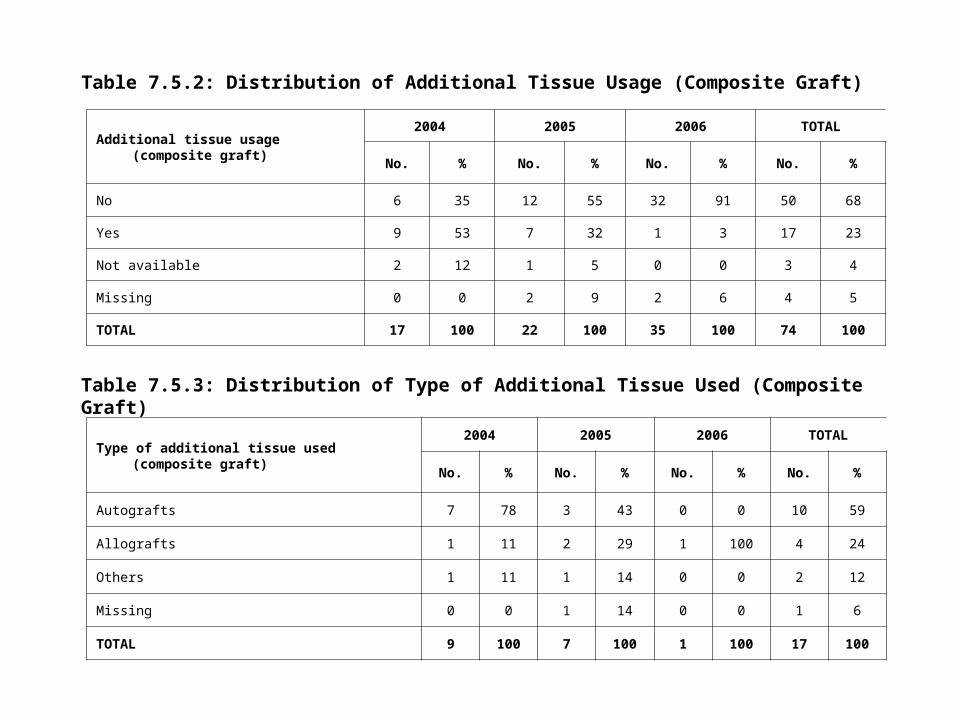
Additional tissue usage (composite graft)2004 2005 2006 TOTAL
No. % No. % No. % No. %
No 6 35 12 55 32 91 50 68
Yes 9 53 7 32 1 3 17 23
Not available 2 12 1 5 0 0 3 4
Missing 0 0 2 9 2 6 4 5
TOTAL 17 100 22 100 35 100 74 100
Type of additional tissue used (composite graft)2004 2005 2006 TOTAL
No. % No. % No. % No. %
Autografts 7 78 3 43 0 0 10 59
Allografts 1 11 2 29 1 100 4 24
Others 1 11 1 14 0 0 2 12
Missing 0 0 1 14 0 0 1 6
TOTAL 9 100 7 100 1 100 17 100
Table 7.5.2: Distribution of Additional Tissue Usage (Composite Graft)
Table 7.5.3: Distribution of Type of Additional Tissue Used (Composite Graft)

Presence of pre operative infectionat implant site
2004 2005 2006 TOTAL
No. % No. % No. % No. %
No 15 88 21 95 31 89 67 91
Yes 0 0 0 0 4 11 4 5
Not Available 2 12 0 0 0 0 2 3
Missing 0 0 1 5 0 0 1 1
TOTAL 17 100 22 100 35 100 74 100
Pre implant graft culture swab 2004 2005 2006 TOTAL
No. % No. % No. % No. %
No 15 88 16 73 17 49 48 65
Yes 0 0 1 5 0 0 1 1
Not Available 2 12 0 0 6 17 8 11
Missing 0 0 5 23 12 34 17 23
TOTAL 17 100 22 100 35 100 74 100
Table 7.5.4: Distribution of Presence of Pre Operative Infection at Implant Site
Table 7.5.5: Distribution of Pre Implant Graft Culture Swab

Type of infection of pre implant graft 2004 2005 2006 TOTAL
No. % No. % No. % No. %
Cytomegalovirus 0 0 1 100 0 0 1 100
Proteus 0 0 0 0 0 0 0 0
TOTAL 0 0 1 100 0 0 1 100
Grafts soaked in antibiotics prior to transplantation
2004 2005 2006 TOTAL
No. % No. % No. % No. %
No 8 47 5 23 28 80 41 55
Yes 7 41 16 73 6 17 29 39
Not Available 2 12 0 0 1 3 3 4
Missing 0 0 1 5 0 0 1 1
TOTAL 17 100 22 100 35 100 74 100
Table 7.5.6: Distribution of Type of Infection of Pre Implant Graft
Table 7.5.7: Distribution of Grafts Soaked in Antibiotics Prior to Transplantation

Antibiotics used to soak the grafts in prior to transplantation
2004 2005 2006 TOTAL
No. % No. % No. % No. %
Ceftriazone 4 57 9 56 3 50 16 55
Gentamycin 3 43 4 25 3 50 10 34
Ceftriazone and Gentamycin 0 0 0 0 0 0 0 0
Vancomycin, Postome iodine 0 0 1 6 0 0 1 3
Povidone iodine, Ceftriazone 0 0 1 6 0 0 1 3
Missing 0 0 1 6 0 0 1 3
TOTAL 7 100 16 100 6 100 29 100
Systemic antibiotics prior to transplantation2004 2005 2006 TOTAL
No. % No. % No. % No. %
No 4 24 3 14 26 74 33 45
Yes 12 71 17 77 9 26 38 51
Not Available 1 6 0 0 0 0 1 1
Missing 0 0 2 9 0 0 2 3
TOTAL 17 100 22 100 35 100 74 100
Table 7.5.8: Distribution of Antibiotics Used to Soak the Grafts in Prior to Transplantation
Table 7.5.9: Distribution of Patients by Systemic Antibiotics Given Prior to Transplantation

Type of systemic antibiotics given to patient prior to transplantation
2004 2005 2006 TOTAL
No. % No. % No. % No. %
Cefeperazone 2 17 2 12 0 0 4 11
Ceftriazone 0 0 0 0 1 11 1 3
Cefuroxine 7 58 7 41 4 44 18 47
Ciproflaxacin 0 0 2 12 0 0 2 5
Chloramphenicol 0 0 0 0 1 11 1 3
Metronidazole 1 8 1 6 0 0 2 5
Ceftazidine 0 0 0 0 1 11 1 3
Ceftriazone/Imipenam 2 17 2 12 2 22 6 16
Ampicillin/Sulbactam 0 0 2 12 0 0 2 5
Missing 0 0 1 6 0 0 1 3
TOTAL 12 100 17 100 9 100 38 100
Table 7.5.10: Distribution of Patients by Type of Systemic Antibiotics Given Prior to Transplantation