Devyani International Limited
43
Devyani International Limited Corporate Office : Plot No-18, Sector-35, Gurugram - 122004, Haryana (India) • Tel. : +91-124-4566300, 4786000 E-mail: [email protected] • Website : www.dil-rjcorp.com November 01, 2021 CIN No.: L15135DL1991PLC046758 To, National Stock Exchange of India Ltd. BSE Limited Exchange Plaza, Block G, C/l, Bandra Kurla Phiroze Jeejeebhoy Towers, Complex, Bandra (E), Mumbai - 400 051 Dalai Street, Mumbai - 400 001 Email: cmlist(5)nse.co.in Email: corp.relations(5)bseindia.com Symbol: DEVYANI Security Code: 543330 Sub: Regulation 30: Presentation on Unaudited Financial Results of the Company for the Quarter and Half Year ended September 30, 2021 Dear Sir/Madam, Pursuant to Regulation 30 of the SEBI (Listing Obligations and Disclosure Requirements] Regulations, 2015, please find attached herewith a copy of the Presentation on Unaudited Financial Results of the Company for the Quarter and Half Year ended September 30, 2021. The same is also being uploaded on website of the Company at www.dil-rjcorp.com. You are requested to take the above on record. Yours faithfully, For Devyani International Limited Jatin Mahajan Company Secretary & Compliance Officer Enel: As above If! COITA KFC \faangoi Registered Office : F-2/7, Okhla Industrial Area Phase-1, New Delhi-110020 (India) Tel.: +91 11 41706720-725 • Devyani International (Nigeria) Pvt. Ltd. • Devyani International (Nepal) Pvt. Ltd. • Devyani Food Street Pvt. Ltd.
Transcript of Devyani International Limited

Devyani International LimitedCorporate Office : Plot No-18, Sector-35, Gurugram - 122004, Haryana (India) • Tel. : +91-124-4566300, 4786000
E-mail: [email protected] • Website : www.dil-rjcorp.com
November 01, 2021 CIN No.: L15135DL1991PLC046758
To,National Stock Exchange of India Ltd. BSE LimitedExchange Plaza, Block G, C/l, Bandra Kurla Phiroze Jeejeebhoy Towers,Complex, Bandra (E), Mumbai - 400 051 Dalai Street, Mumbai - 400 001Email: cmlist(5)nse.co.in Email: corp.relations(5)bseindia.comSymbol: DEVYANI Security Code: 543330
Sub: Regulation 30: Presentation on Unaudited Financial Results of the Company for theQuarter and Half Year ended September 30, 2021Dear Sir/Madam,Pursuant to Regulation 30 of the SEBI (Listing Obligations and Disclosure Requirements] Regulations, 2015, please find attached herewith a copy of the Presentation on Unaudited Financial Results of the Company for the Quarter and Half Year ended September 30, 2021.The same is also being uploaded on website of the Company at www.dil-rjcorp.com.You are requested to take the above on record.Yours faithfully,
For Devyani International Limited
Jatin Mahajan Company Secretary & Compliance Officer
Enel: As above
If! COITAKFC
\faangoi
Registered Office : F-2/7, Okhla Industrial Area Phase-1, New Delhi-110020 (India) Tel.: +91 11 41706720-725
• Devyani International (Nigeria) Pvt. Ltd. • Devyani International (Nepal) Pvt. Ltd. • Devyani Food Street Pvt. Ltd.

Quarterly Results Presentation
Q2 FY-2022

2
Disclaimer
The information contained in this presentation is for information purposes only and does not constitute an offer or invitation to sell or the solicitation of an offer or invitation to purchase any securities
(“Securities”) of Devyani International Limited (the “Company”) in India, the United States or any other jurisdiction. This presentation should not, nor should anything contained in it, form the basis of,
or be relied upon in any connection with any contract or commitment whatsoever. This presentation is not an offer of securities for sale in the United States or elsewhere. This presentation does not
constitute a prospectus, a statement in lieu of a prospectus, an offering circular, information memorandum, an invitation or advertisement or an offer document under the Companies Act, 2013,
together with the rules thereunder, the Securities and Exchange Board of India (Issue of Capital and Disclosure Requirements) Regulations, 2018 each as amended, or any other applicable law in
India.
This presentation may contain forward‐looking statements that involve risks and uncertainties. Forward‐looking statements are based on certain assumptions and expectations of future events.
Actual future performance, outcomes and results may differ materially from those expressed in forward‐looking statements as a result of a number of risks, uncertainties and assumptions. There is
no obligation on the Company or any of its directors, officers, employees, agents or advisers, or any of their respective affiliates, advisers or representatives to update or revise any forward-looking
statements, whether as a result of new information, future events or otherwise and none of them shall have any liability (in negligence or otherwise) for any loss howsoever arising from any use of
this presentation or its contents or otherwise arising in connection with this presentation. You are cautioned not to place undue reliance on these forward-looking statements, which are based on
current view of the Company’s management on future events.
The data and opinion expressed herein with respect to the Company is based on a number of assumptions, and is subject to a number of known and unknown risks, which may cause the
Company’s actual results or performance to differ materially from any projected future results or performance expressed or implied by such statements. Further, certain figures (including amounts,
percentages and numbers), as applicable, have been rounded-off to the nearest number and may not depict the exact number.
We use a variety of financial and operational performance indicators to measure and analyze our financial performance and financial condition from period to period and to manage our business.
Further, financial or performance indicators used here, have limitations as analytical tools, and should not be considered in isolation from, or as a substitute for, analysis of our historical financial
performance, as reported and presented in our financial statements. Further, past performance is not necessarily indicative of future results.
This presentation has been prepared by the Company. This document is a summary only and does not purport to contain all of the information that may be required to evaluate any potential
transaction and any recipient hereof should conduct its own independent analysis of the Company and their businesses, including the consulting of independent legal, business, tax and financial
advisers. The information in this presentation has not been independently verified and has not been and will not be reviewed or approved by any statutory or regulatory authority or stock exchange
in India. No representation, warranty, express or implied, is made as to, and no reliance should be placed on, the fairness, accuracy, completeness or correctness of the information and opinions in
this presentation. Further, nothing in this document should be construed as constituting legal, business, tax or financial advice.

Chairman’s Comment
3
Commenting on the performance for Q2 & H1 2022 Mr. Ravi Jaipuria, Chairman, Devyani International Limited said,
“We are pleased to report our first financial results post our successful listing in August 2021. Our IPO witnessed a strong
reception from the investor community and has brought on board marquee investors. We welcome all our shareholders and look
forward to your support in our journey forward.
The foodservice industry is expected to grow at a CAGR of 12% to 15% in future. QSRs being the largest constituent of this
segment will be a key beneficiary and will lead this growth. DIL with its multiple strong and well recognized western and Indian
QSR brands stand to gain the most as we continue to expand our footprint in India.
India is a large consumption market and QSR is still significantly under penetrated in the Country – even compared with our
South East Asian peers. At Devyani, our focus remains on constantly improving the quality and safety of our operations, enriching
customer experience, efficient delivery & strategically expanding our store network in India. As on September 30, 2021, we
operated 309 KFC stores, 351 Pizza Hut stores and 45 Costa Coffee stores in India. Our total system store count across all our
operations stands at 803.
Despite the pandemic, we have continued with our growth strategy to steadily expand presence across new cities while
simultaneously broadening our foothold in existing markets. We have opened 111 net new stores across core brands in the 6
months ended September 30, 2021 with 68 net new stores getting added in Q2 FY22. Our long-term focus is on consolidating our
presence in key metro cities while tapping into smaller towns, enabling us to take our brands closer to our customers.
We have seen a great recovery on the demand side as the Covid-19 restrictions ease and the vaccination coverage improves.
Leveraging this demand momentum across our markets, we expect to deliver a strong operational and financial performance. We
are also cognizant of input cost inflation across various industries including QSR on both capex and opex side. We have built in
multiple levers in our business to mitigate the impact of input inflation and we hope to deliver consistent results for all of you.”

Table of Contents
Q2 FY2022 - at a glance1
DIL Consolidated Performance2
Core Brands – KFC, Pizza Hut & Costa3
Sustainability & Social Initiatives4
Company Background5
5
Successful completion of Initial Public offering & Listing in August 2021
PAT positive for the quarter.
111 net new stores in H1 FY-2022; Total count at 803.
Strong business recovery post Covid 2nd wave.
Robust recovery in KFC in Aug-Sep’21.
Encouraging PH performance post brand-restructuring.
Negative Working Capital; Store expansion to be internally funded.
Net Debt Free (External basis).
Revised Development Agreement signed with Costa-Coffee.
H1 Overview & Key Developments

Revenue from operations - 124% growth to Rs. 5,161 million
All round encouraging performance on Core Brands.
India - KFC revenues up 141%, Pizza Hut up 111%.
Healthy growth in International business. Revenue growth - 90% to Rs. 500 million.
Robust SSSG; KFC @72% and Pizza Hut @76%
Q2 FY22 Financial Highlights (Y-o-Y)
Consolidated EBITDA increased by 225% to Rs. 1,233 million from Rs. 380 million
Brand contribution increased by 346% to Rs. 1,067 million, with margins at 20.6%
Healthy EBITDA margins at 23.9%
PAT at Rs. 466 million
Healthy growth in revenue from operations, new stores additions and sustainable cost optimizations enabled the Company to turn
profitable during the quarter.
6

New Store Additions – Great Momentum
7
NET NEW UNITS (NNU) Stores as at
31 Mar 21
Stores as at
30 Sept 21Brand Q1 FY22 Q2 FY22 LTM
KFC 20 25 95 264 309
PH 20 34 93 297 351
Costa - 1 (10) 44 45
Others 1 3 (9) 50 54
Total India 41 63 169 655 759
Nigeria 1 2 4 24 27
Nepal 1 3 5 13 17
G. Total 43 68 178 692 803
Note:
1. NNU = Gross additions (including acquired stores) less Closures.
2. LTM = Last Twelve (12) Months.
3. Others = Vaango, Food Court, etc.

Store Expansion – Cluster Focus
8
Core Brands Stores; India – Regional split
North
East
West
South
As on Sept. 30, 2021
279, 39%
133, 19%
55, 8%
238, 34%
Core Brands Stores March 31, 2021 Sept. 30, 2021
NCR 135 141
Bengaluru 80 91
Kolkata 42 48
Hyderabad 32 43
Other Metro cities 15 17
Total Metros 304 340
% of Total Core Brand
Stores
50% 48%
254, 42%
116, 19%
47, 8%
188, 31%
As on March 31, 2021
Cities in Metro Cluster 9 9
Other Cities 146 168
Total Cities 155 177

9
Business Performance – DIL Consolidated
Revenue from Operations - Annual
692610566Stores 803
Revenue from Operations - Quarterly
625 644 692 735 803
Gross Margin - Annual
71.1%*69.3%70.0% 69.1%
Gross Margin - Quarterly
67.8% 68.7% 71.4% 71.2% 71.0%*
2,036
3,440 3,946
3,117
4,661 263
351
385
410
500
2,299
3,791
4,331
3,528
5,161
Q2 FY21 Q3 FY21 Q4 FY21 Q1 FY22 Q2 FY22
12,002 13,673
10,195 7,778
1,104
1,491
1,154
910
13,106
15,164
11,348
8,688
FY 2019 FY 2020 FY 2021 H1 FY2022
India
International
GM %
124% y/y growth
*Gross Margin = Revenues from Operations less Cost of Goods Sold
46%
1,393
2,373 2,840
2,227
3,324 166
230
251
284
341
1,559
2,603
3,091
2,511
3,664
Q2 FY21 Q3 FY21 Q4 FY21 Q1 FY22 Q2 FY22
8,446 9,539
7,095 5,551
723
969
746
624
9,169
10,508
7,841
6,175
FY 2019 FY 2020 FY 2021 H1 FY2022

10
Financial Performance – DIL Consolidated
Brand Contribution - Quarterly
10.4%* 16.9% 20.7% 13.0% 20.6%
Brand Contribution - Annual
13.9%*11.2%13.7% 17.6%
EBITDA (Pre-IndAS) - Annual
11.4%3.8%7.3% 7.4%*
EBITDA (Pre-IndAS) - Quarterly
4.1%* 12.1% 15.4% 5.6% 15.3%
India
International
%
%
346% y/y growth
132%
230
580
805
388
965
9
59
91
71
101
239
639
897
459
1,067
Q2 FY21 Q3 FY21 Q4 FY21 Q1 FY22 Q2 FY22
1,646 1,471 1,409 1,354
143 225
164 172
1,789 1,696
1,573 1,525
FY 2019 FY 2020 FY 2021 H1 FY2022
84
400
577
127
690
9
59
91
71
101
93
459
668
198
791
Q2 FY21 Q3 FY21 Q4 FY21 Q1 FY22 Q2 FY22
818
351
678 817
143
225
164
172
961
576
842
989
FY 2019 FY 2020 FY 2021 H1 FY2022
*Includes FX impact for International Business

336
793
1,065
525
1,106
44
90
119
91
128
380
883
1,184
616
1,233
Q2 FY21 Q3 FY21 Q4 FY21 Q1 FY22 Q2 FY22
11
Profitability – DIL Consolidated
EBITDA - Quarterly EBITDA - Annual PAT*
Net Debt** Net Worth
**Net Debt excludes Promoter Debt
225% y/y growth
16.5%* 23.3% 27.3% 17.4% 23.9% 21.3% 16.8% 20.0%* 21.3% -4.5% -5.2% -7.2% -9.5% 8.7%
100%
-551 -479
-739
-227
430
-42 -308
-74
-107
36
-593
-788 -813
-334
466
FY 2019 FY 2020 FY 2021 Q1 FY22 Q2 FY22
2,550 2,235
1,997 1,630
240
320
272
218
2,790 2,555
2,269
1,849
FY 2019 FY 2020 FY 2021 H1 FY2022
*Includes FX impact for International Business
1,138
5,309
FY 2021 Q2 FY22
3,541
-646
FY 2021 Q2 FY22
*For continuing operations only

12
Performance Trend – DIL India
Revenue from Operations Gross Profit Brand Contribution
2,036
3,440
3,946
3,117
4,661
Q2 FY21 Q3 FY21 Q4 FY21 Q1 FY22 Q2 FY22
1,393
2,373
2,840
2,227
3,324
Q2 FY21 Q3 FY21 Q4 FY21 Q1 FY22 Q2 FY22
230
580
805
388
965
Q2 FY21 Q3 FY21 Q4 FY21 Q1 FY22 Q2 FY22
84
400
577
127
690
Q2 FY21 Q3 FY21 Q4 FY21 Q1 FY22 Q2 FY22
336
793
1,065
525
1,106
Q2 FY21 Q3 FY21 Q4 FY21 Q1 FY22 Q2 FY22
EBITDA (Pre-IndAS 116) EBITDA PAT
-551 -479
-739
-227
430
FY 2019 FY 2020 FY 2021 Q1 FY22 Q2 FY22
68.4% 69.0% 72.0% 71.5% 71.3% 11.3% 16.8% 20.4% 12.5% 20.7%
4.1% 11.6% 14.6% 4.1% 14.8% 16.5% 23.0% 27.0% 16.8% 23.7%
129% y/y growth 320% y/y growth
229% y/y growth
50%
111%

Core Brands – KFC

Net New Stores added in the Qtr - 25
VISHAKHAPATNAM
CHAMPAPET, HYDDHARAMSHALA
GANGTOK
KOTABENGALURU

15
Revenue from Operations - Quarterly
Business Performance – KFC
Revenue from Operations - Annual
1,251
2,211
2,540
2,029
3,014
Q2 FY21 Q3 FY21 Q4 FY21 Q1 FY22 Q2 FY22
4,641
6,091 6,443
5,043
FY 2019 FY 2020 FY 2021 H1 FY22
284264214 240 309 134 172 264 309
Avg. Daily Sales per Store (ADS) - Quarterly ADS - Annual
68,517
1,12,237 1,18,498
92,136
1,16,380
Q2 FY21 Q3 FY21 Q4 FY21 Q1 FY22 Q2 FY22
1,13,852
1,16,740
1,00,270
1,05,189
FY 2019 FY 2020 FY 2021 H1 FY22
158.0%19.6%-51.6% -13.0% 72.0% 4.7% 3.1% -33.7% 99.3%SSSG %
Stores
141% y/y growth

16
Financial Performance – KFC
Gross Profit - Quarterly Gross Profit - Annual
Brand Contribution - Quarterly Brand Contribution - Annual
%
GM %69.4%69.7%65.9% 67.1% 69.1% 66.0% 64.8% 67.7% 69.2%
22.4%16.0%13.0% 19.1% 22.6% 18.4% 16.0% 18.3% 19.8%
824
1,484
1,769
1,408
2,083
Q2 FY21 Q3 FY21 Q4 FY21 Q1 FY22 Q2 FY22
3,064
3,950
4,360
3,491
FY 2019 FY 2020 FY 2021 H1 FY22
162
423
575
325
676
Q2 FY21 Q3 FY21 Q4 FY21 Q1 FY22 Q2 FY22
854 973
1,182
1,001
FY 2019 FY 2020 FY 2021 H1 FY22
153% y/y growth
17
Channel Sales Mix - KFC
On-Premise = Dine-in, Eat-in or Takeaway
Off-Premise = Delivered (either Own or Aggregator)
KFC Sales Mix - Quarterly KFC Sales Mix - Annual
56%
67% 68%
35%
56%
44%
33% 32%
65%
44%
Q2 FY21 Q3 FY21 Q4 FY21 Q1 FY22 Q2 FY22
89%84%
63%
48%
11%16%
37%
52%
FY 2019 FY 2020 FY 2021 H1 FY22
On-Premise
Off-Premise
On-premise recovering
as Covid-related
restrictions ease

Brand Building Activities
18

19
Core Brands – Pizza Hut

Net New Stores added in the Qtr - 34
20
PURNIA ROURKELA
NOIDA HYDERABAD KOLKATA
KHARAR
21
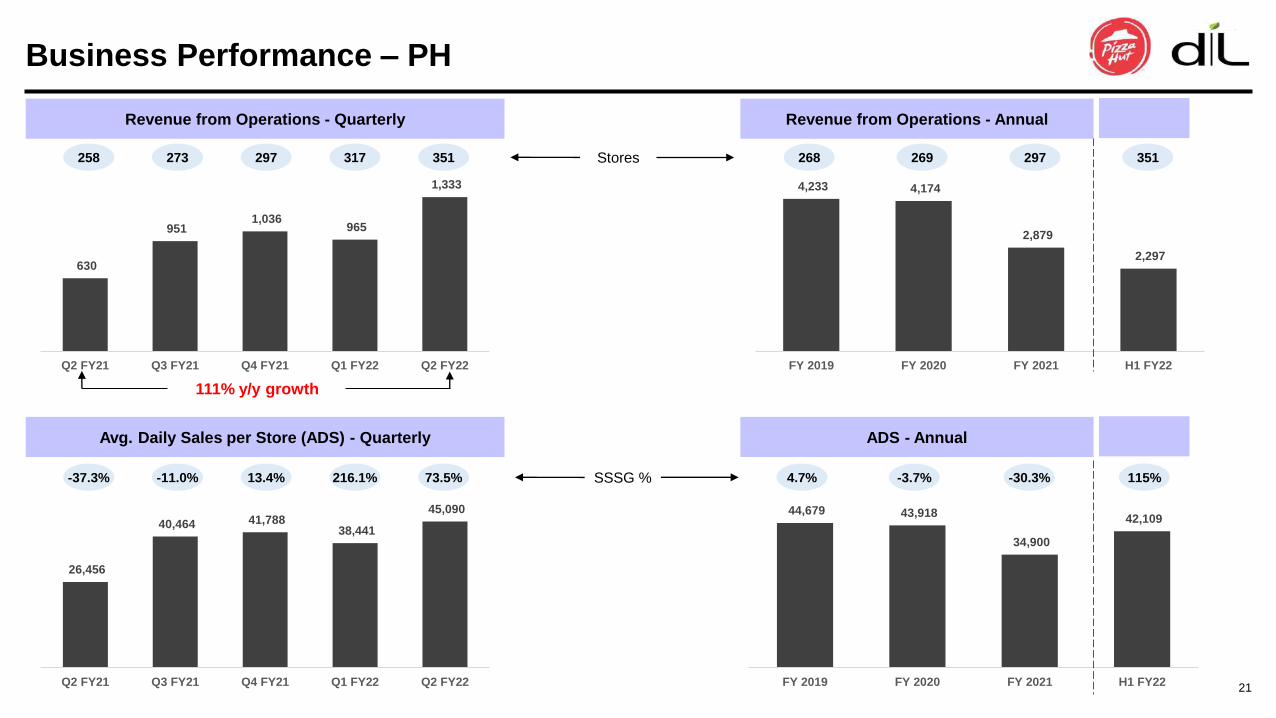
Business Performance – PH
Revenue from Operations - Quarterly Revenue from Operations - Annual
Avg. Daily Sales per Store (ADS) - Quarterly ADS - Annual
SSSG %
Stores
630
951 1,036
965
1,333
Q2 FY21 Q3 FY21 Q4 FY21 Q1 FY22 Q2 FY22
4,233 4,174
2,879
2,297
FY 2019 FY 2020 FY 2021 H1 FY22
351317258 273 297 268 269 297 351
26,456
40,464 41,788 38,441
45,090
Q2 FY21 Q3 FY21 Q4 FY21 Q1 FY22 Q2 FY22
44,679 43,918
34,900
42,109
FY 2019 FY 2020 FY 2021 H1 FY22
73.5%216.1%-37.3% -11.0% 13.4% 4.7% -3.7% -30.3% 115%
111% y/y growth
22
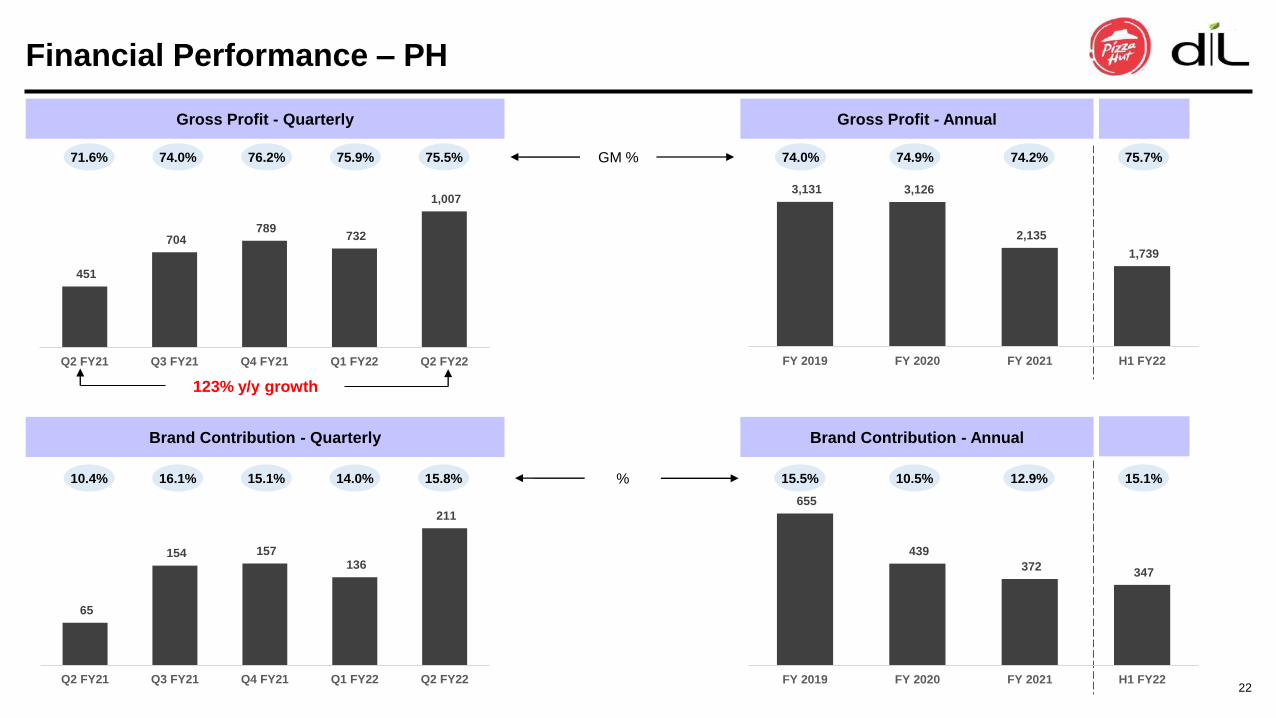
Financial Performance – PH
Gross Profit - Quarterly Gross Profit - Annual
Brand Contribution - Quarterly Brand Contribution - Annual
%
GM %
451
704 789
732
1,007
Q2 FY21 Q3 FY21 Q4 FY21 Q1 FY22 Q2 FY22
3,131 3,126
2,135
1,739
FY 2019 FY 2020 FY 2021 H1 FY22
75.5%75.9%71.6% 74.0% 76.2% 74.0% 74.9% 74.2% 75.7%
15.8%14.0%10.4% 16.1% 15.1% 15.5% 10.5% 12.9% 15.1%
65
154 157 136
211
Q2 FY21 Q3 FY21 Q4 FY21 Q1 FY22 Q2 FY22
655
439
372 347
FY 2019 FY 2020 FY 2021 H1 FY22
123% y/y growth
23
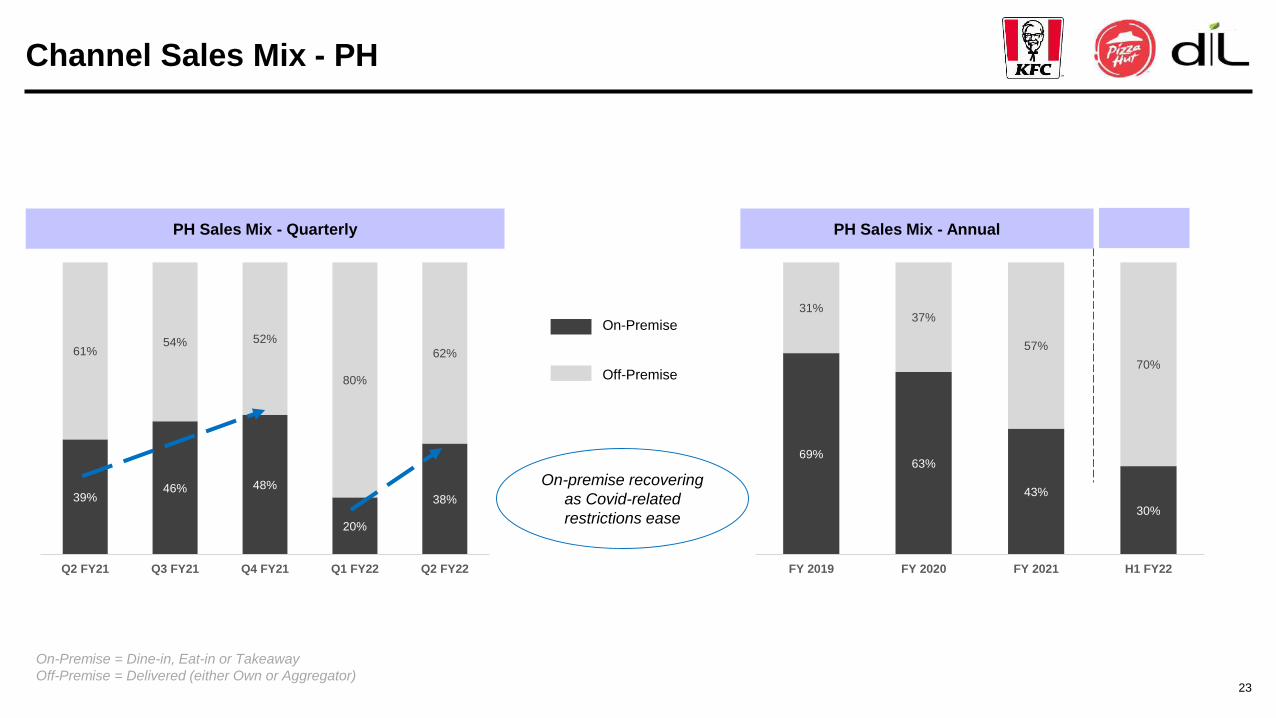
Channel Sales Mix - PH
On-Premise = Dine-in, Eat-in or Takeaway
Off-Premise = Delivered (either Own or Aggregator)
On-premise recovering
as Covid-related
restrictions ease
PH Sales Mix - Quarterly PH Sales Mix - Annual
39%46% 48%
20%
38%
61%54% 52%
80%
62%
Q2 FY21 Q3 FY21 Q4 FY21 Q1 FY22 Q2 FY22
69%63%
43%
30%
31%37%
57%
70%
FY 2019 FY 2020 FY 2021 H1 FY22
On-Premise
Off-Premise

New Initiatives
24

25
Core Brands – Costa Coffee

26
Business Performance – Costa
Revenue from Operations - Quarterly Revenue from Operations - Annual
Avg. Daily Sales per Store (ADS) - Quarterly ADS - Annual
SSSG %
Stores
40
76
85
37
94
Q2 FY21 Q3 FY21 Q4 FY21 Q1 FY22 Q2 FY22
902 820
214 131
FY 2019 FY 2020 FY 2021 H1 FY22
454455 45 44 67 63 44 45
225.9%344.9%-78.7% -55.9% -24.9% 2.7% -4.4% -61.6% 241%
12,255
20,706
24,592
16,060
27,390
Q2 FY21 Q3 FY21 Q4 FY21 Q1 FY22 Q2 FY22
37,458 37,414
18,510
22,880
FY 2019 FY 2020 FY 2021 H1 FY22
139% y/y growth
27
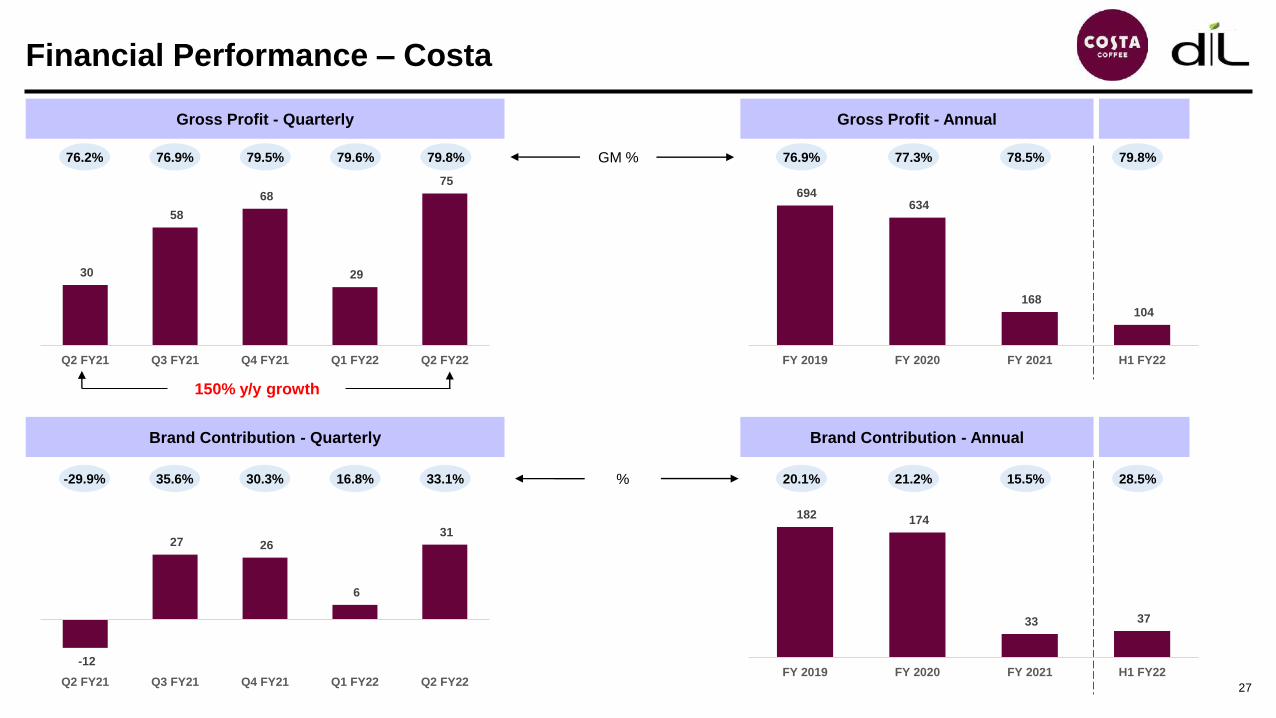
Financial Performance – Costa
Gross Profit - Quarterly Gross Profit - Annual
Brand Contribution - Quarterly Brand Contribution - Annual
%
GM %79.8%79.6%76.2% 76.9% 79.5% 76.9% 77.3% 78.5% 79.8%
33.1%16.8%-29.9% 35.6% 30.3% 20.1% 21.2% 15.5% 28.5%
30
58
68
29
75
Q2 FY21 Q3 FY21 Q4 FY21 Q1 FY22 Q2 FY22
694 634
168 104
FY 2019 FY 2020 FY 2021 H1 FY22
-12
27 26
6
31
Q2 FY21 Q3 FY21 Q4 FY21 Q1 FY22 Q2 FY22
182 174
33 37
FY 2019 FY 2020 FY 2021 H1 FY22
150% y/y growth

Summary Financials

Consolidated Profit & Loss Statement
29
Particulars (Rs. Million) Q2 FY22 Q2 FY21 YoY (%) H1 FY22 H1 FY21 YoY (%)
Revenue from Operations 5,161 2,299 124% 8,688 3,226 169%
Other Income 52 260 98 731
Total Income 5,213 2,560 8,787 3,958
Raw Material Cost 1,497 741 2,513 1,019
Gross Profit 3,664 1,559 6,175 2,208
Gross Margin 71.0% 67.8% 71.1% 68.4%
Employee benefits expense 594 347 71% 1,131 627 80%
Other expenses 1,837 764 140% 3,196 1,312 144%
Total Expenses 2,431 1,111 4,327 1,939
EBITDA 1,233 448 175% 1,849 269 587%
23.9% 19.5% 21.3% 8.3%
Finance Costs 328 422 652 734
Depreciation & Amortization Expense 526 658 1,008 1,238
Impairment (48) 208 (1) 483
Exceptional (Gain)/ Loss 7 83 151 78
Profit before Tax (PBT) 472 (664) 137 (1,533)
Tax Expense 6 (9) 5 (13)
Profit after Tax (PAT)* 466 (655) nm 132 (1,520) nm
*For continuing operations only
30
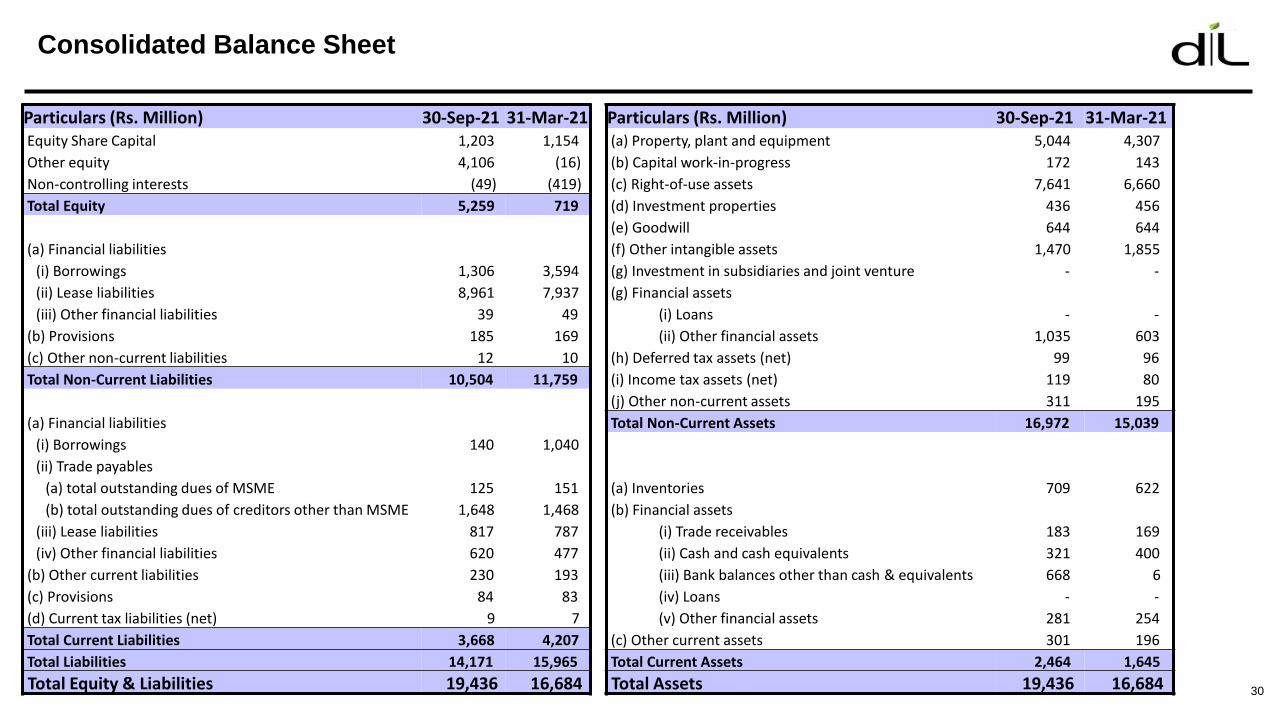
Consolidated Balance Sheet
Particulars (Rs. Million) 30-Sep-21 31-Mar-21Equity Share Capital 1,203 1,154
Other equity 4,106 (16)
Non-controlling interests (49) (419)
Total Equity 5,259 719
(a) Financial liabilities
(i) Borrowings 1,306 3,594
(ii) Lease liabilities 8,961 7,937
(iii) Other financial liabilities 39 49
(b) Provisions 185 169
(c) Other non-current liabilities 12 10
Total Non-Current Liabilities 10,504 11,759
(a) Financial liabilities
(i) Borrowings 140 1,040
(ii) Trade payables
(a) total outstanding dues of MSME 125 151
(b) total outstanding dues of creditors other than MSME 1,648 1,468
(iii) Lease liabilities 817 787
(iv) Other financial liabilities 620 477
(b) Other current liabilities 230 193
(c) Provisions 84 83
(d) Current tax liabilities (net) 9 7
Total Current Liabilities 3,668 4,207
Total Liabilities 14,171 15,965
Total Equity & Liabilities 19,436 16,684
Particulars (Rs. Million) 30-Sep-21 31-Mar-21(a) Property, plant and equipment 5,044 4,307
(b) Capital work-in-progress 172 143
(c) Right-of-use assets 7,641 6,660
(d) Investment properties 436 456
(e) Goodwill 644 644
(f) Other intangible assets 1,470 1,855
(g) Investment in subsidiaries and joint venture - -
(g) Financial assets
(i) Loans - -
(ii) Other financial assets 1,035 603
(h) Deferred tax assets (net) 99 96
(i) Income tax assets (net) 119 80
(j) Other non-current assets 311 195
Total Non-Current Assets 16,972 15,039
(a) Inventories 709 622
(b) Financial assets
(i) Trade receivables 183 169
(ii) Cash and cash equivalents 321 400
(iii) Bank balances other than cash & equivalents 668 6
(iv) Loans - -
(v) Other financial assets 281 254
(c) Other current assets 301 196
Total Current Assets 2,464 1,645
Total Assets 19,436 16,684

Sustainability &
Social Initiatives

32
Social & Sustainability Initiatives
Launched another all-women KFC outlet in Gangtok.
Total 3 stores pan-India.

Company Background
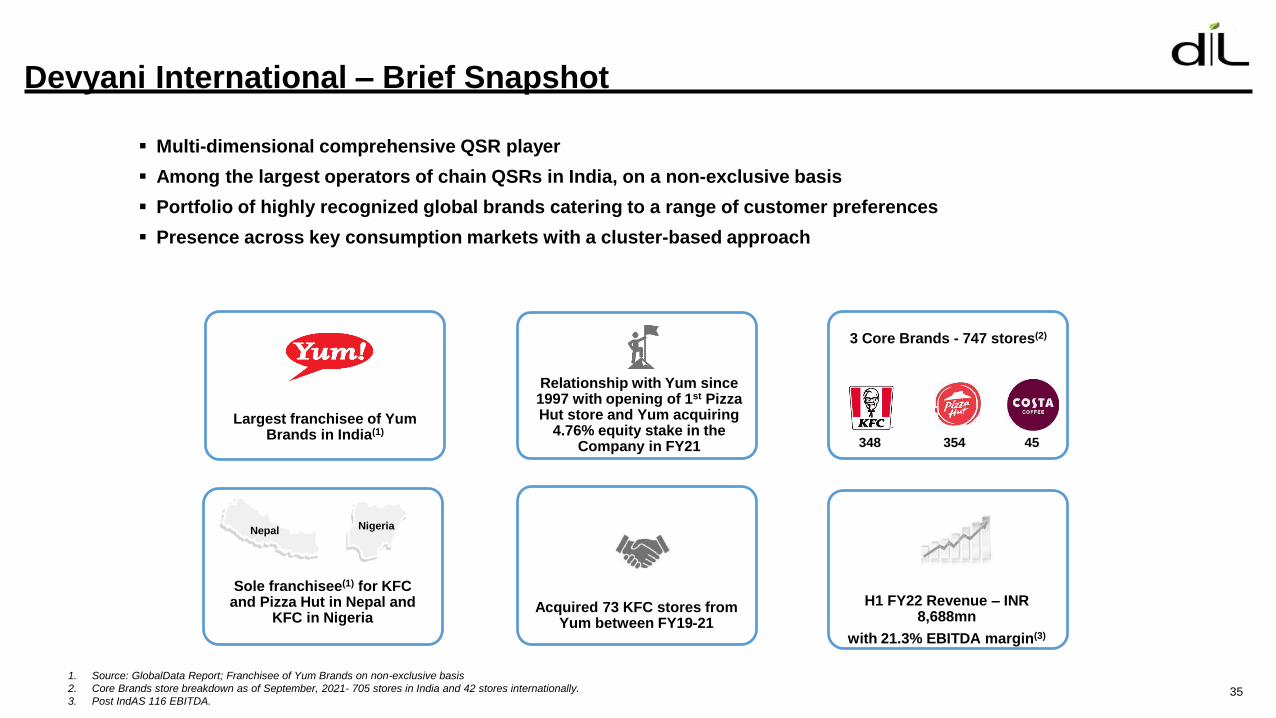
Devyani International – Brief Snapshot
1. Source: GlobalData Report; Franchisee of Yum Brands on non-exclusive basis
2. Core Brands store breakdown as of September, 2021- 705 stores in India and 42 stores internationally.
3. Post IndAS 116 EBITDA.
Multi-dimensional comprehensive QSR player
Among the largest operators of chain QSRs in India, on a non-exclusive basis
Portfolio of highly recognized global brands catering to a range of customer preferences
Presence across key consumption markets with a cluster-based approach
Relationship with Yum since 1997 with opening of 1st Pizza Hut store and Yum acquiring
4.76% equity stake in the Company in FY21
Largest franchisee of Yum Brands in India(1)
Sole franchisee(1) for KFC and Pizza Hut in Nepal and
KFC in Nigeria
Nepal Nigeria
Acquired 73 KFC stores from Yum between FY19-21
3 Core Brands - 747 stores(2)
348 354 45
H1 FY22 Revenue – INR 8,688mn
with 21.3% EBITDA margin(3)
35

Key Strengths and Strategies
36
Multi-dimensional comprehensive QSR
player
Portfolio of well recognized global brands
across spectrum and key consumption
markets
Disciplined Financial Approach
Strategically expand store network of
Core Brands Business
Continue to improve unit-level
performance
Focus on delivery channel for Core
Brands
Invest in technology and focus on
digital capabilities
1
2
4
Cross brand synergies leading to Operating
leverage3

Well Recognized Brands Across Spectrum and Key Consumption Markets
37
Core Brands (3 International Chain QSR Brands) Others (Own / 3rd Party)
# of stores(as at Sep. 30, 2021)
% of H1 FY22
Revenue from
Operations
& Other
Brands
Type QSR QSR Coffee QSR
309 351 45 42
58% 26% 2% 10%
Core Brands – 747 stores; 96% of H1 FY22 revenue
Devyani International is among the largest operators of chain QSR in India
QSR
54
4%
Nepal &
NigeriaNepal
International
(Nepal & Nigeria)India India

Distinguished Board and Experienced Senior Management Team
38
Ravi JaipuriaNon-executive
Director
Varun JaipuriaNon-executive
Director
Raj GandhiNon-executive
Director
Virag JoshiWhole-time
Director, President & CEO
Manish DawarWhole-time
Director & CFO
Ravi GuptaIndependent Director
Rashmi DhariwalIndependent Director
Naresh TrehanIndependent Director
Girish AhujaIndependent Director
Pradeep SardanaIndependent Director
Board of Directors Senior Management Team
Virag JoshiWhole-time
Director, President & CEO
Manish DawarWhole-time
Director & CFO
Rajat LuthraCEO, KFC
Amitabh Negi CEO, Pizza Hut
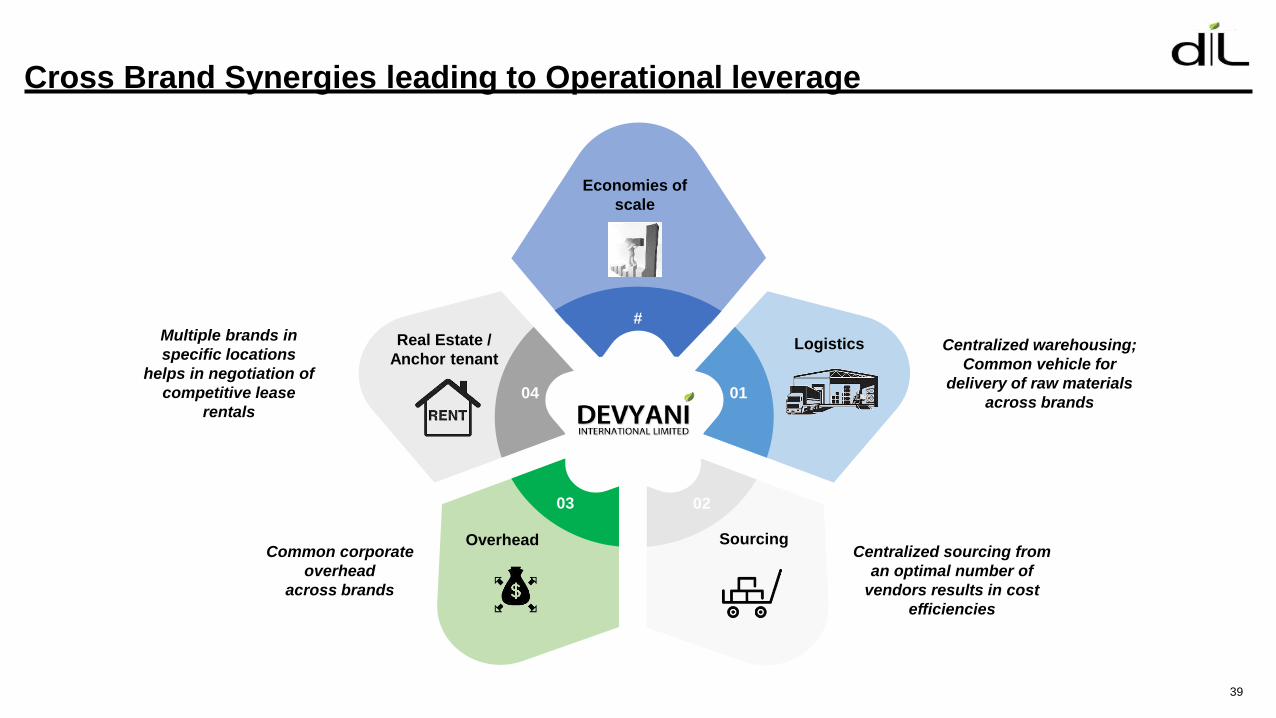
Cross Brand Synergies leading to Operational leverage
39
04
#
01
03 02
Centralized warehousing;
Common vehicle for
delivery of raw materials
across brands
Centralized sourcing from
an optimal number of
vendors results in cost
efficiencies
Multiple brands in
specific locations
helps in negotiation of
competitive lease
rentals
Common corporate
overhead
across brands
Logistics
Economies of
scale
Overhead
Real Estate /
Anchor tenant
Sourcing

Focus to Improve Unit Level Profitability
40
Cost Efficiency
Optimisation of supply chain
with focus on and benefits of
cost, quality and quantity for
sourcing
Rent – Smaller store format to
expand faster
Employee Cost – optimisation of
staff; Flexible work
arrangements
Rationalization of
underperforming assets
Revenue Expansion
Store expansion – both
organically and inorganically
Delivery – Investment in
technology; Delivery-focused
stores; Engagement with
delivery aggregators
Menu – Innovative product
offerings; Re-developing
menus to focus on delivery and
takeaways
Drive order frequency and
order ticket size
Store expansion with focus on bringing cost efficiencies at each level to result in higher profitability

Focus on Safety and Hygiene
41

About Us
Devyani International Limited (DIL) is the largest franchisee of Yum Brands in India and are among the largest operators of
chain quick service restaurants (QSR) in India, on a non-exclusive basis, and operate 803 stores across more than 175 cities
in India, Nigeria and Nepal, as of September 30, 2021. In addition, DIL is a franchisee for the Costa Coffee brand and stores
in India.
Yum! Brands Inc. operates brands such as KFC, Pizza Hut and Taco Bell brands and has presence globally with more than
50,000 restaurants in over 150 countries, as of December 31, 2020.
Founded in London by Italian brothers Sergio and Bruno Costa in 1971, Costa Coffee is present in 41 countries around the
world, with over 2,800+ coffee shops in the UK&I and 1,100+ globally.
Please visit www.dil-rjcorp.com for more information. You may also reach out to:
Manish Dawar / Rajiv Kumar Anoop Poojari / Jenny Rose
Devyani International Limited CDR India
+91 124 478 6000 / +91 88601 68600 +91 98330 90434 / +91 86899 72124
Email:

Thank You!