Developments in Power Quality Management: A CIGRE...
60
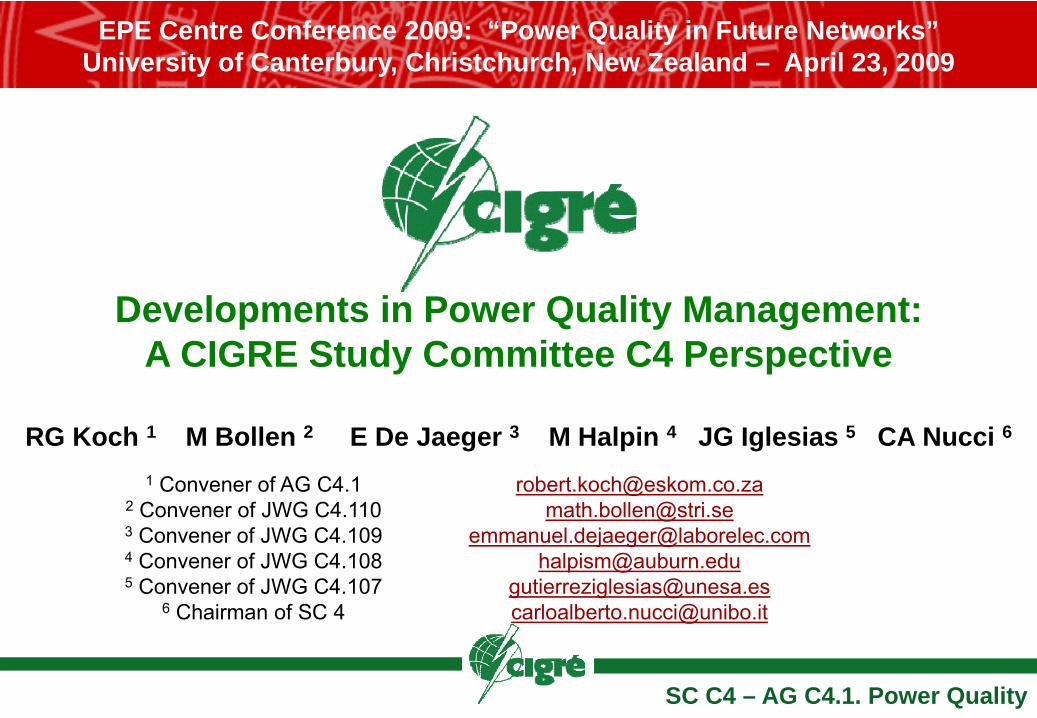
EPE Centre Conference 2009: “Power Quality in Future Networks” University of Canterbury, Christchurch, New Zealand – April 23, 2009 Developments in Power Quality Management: A CIGRE Study Committee C4 Perspective RG Koch 1 M Bollen 2 E De Jaeger 3 M Halpin 4 JG Iglesias 5 CA Nucci 6 1 Convener of AG C4.1 [email protected] 2 Convener of JWG C4.110 [email protected] 3 Convener of JWG C4.109 [email protected] 4 Convener of JWG C4.108 [email protected] 5 Convener of JWG C4.107 [email protected] 6 Chairman of SC 4 [email protected] SC C4 – AG C4.1. Power Quality
Transcript of Developments in Power Quality Management: A CIGRE...
ALMA MATER STUDIORUM – UNIVERSITA’ DI BOLOGNA
EPE Centre Conference 2009: “Power Quality in Future Networks”University of Canterbury, Christchurch, New Zealand – April 23, 2009
Developments in Power Quality Management:A CIGRE Study Committee C4 Perspective
RG Koch 1 M Bollen 2 E De Jaeger 3 M Halpin 4 JG Iglesias 5 CA Nucci 6
1 Convener of AG C4.1 [email protected] Convener of JWG C4.110 [email protected] Convener of JWG C4.109 [email protected] Convener of JWG C4.108 [email protected] Convener of JWG C4.107 [email protected]
6 Chairman of SC 4 [email protected]
SC C4 – AG C4.1. Power Quality
ALMA MATER STUDIORUM – UNIVERSITA’ DI BOLOGNA
EPE Centre Conference 2009: “Power Quality in Future Networks”University of Canterbury, Christchurch, New Zealand – April 23, 2009
Developments in Power Quality Management:A CIGRE Study Committee C4 Perspective
Presented by
NameAfffiliation
SC C4 – AG C4.1. Power Quality
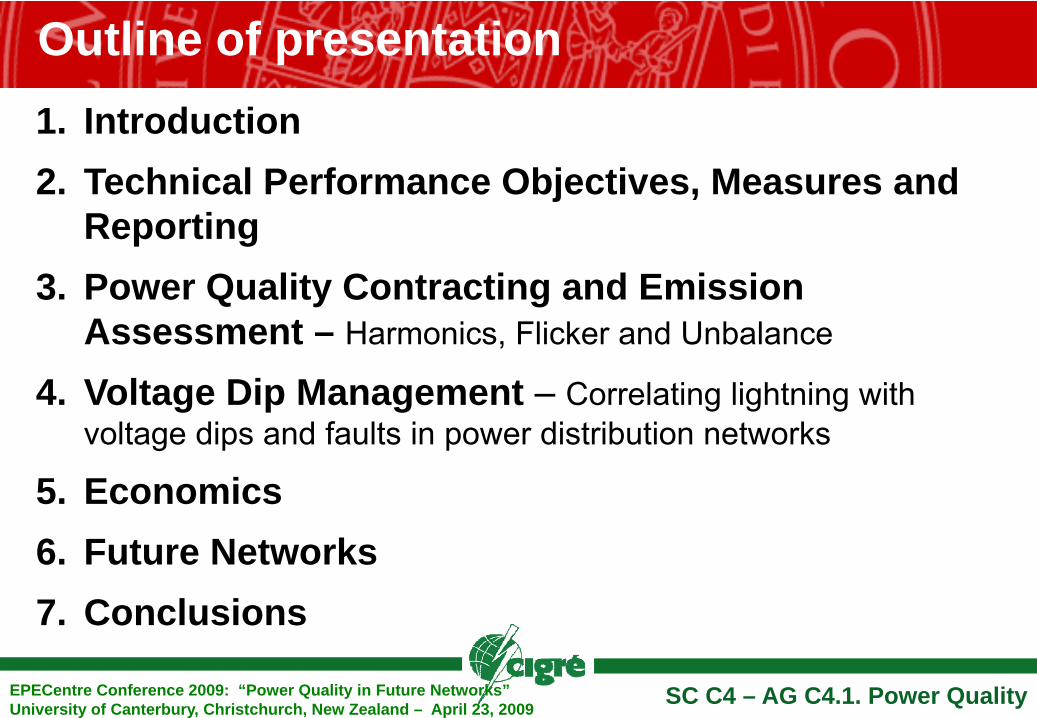
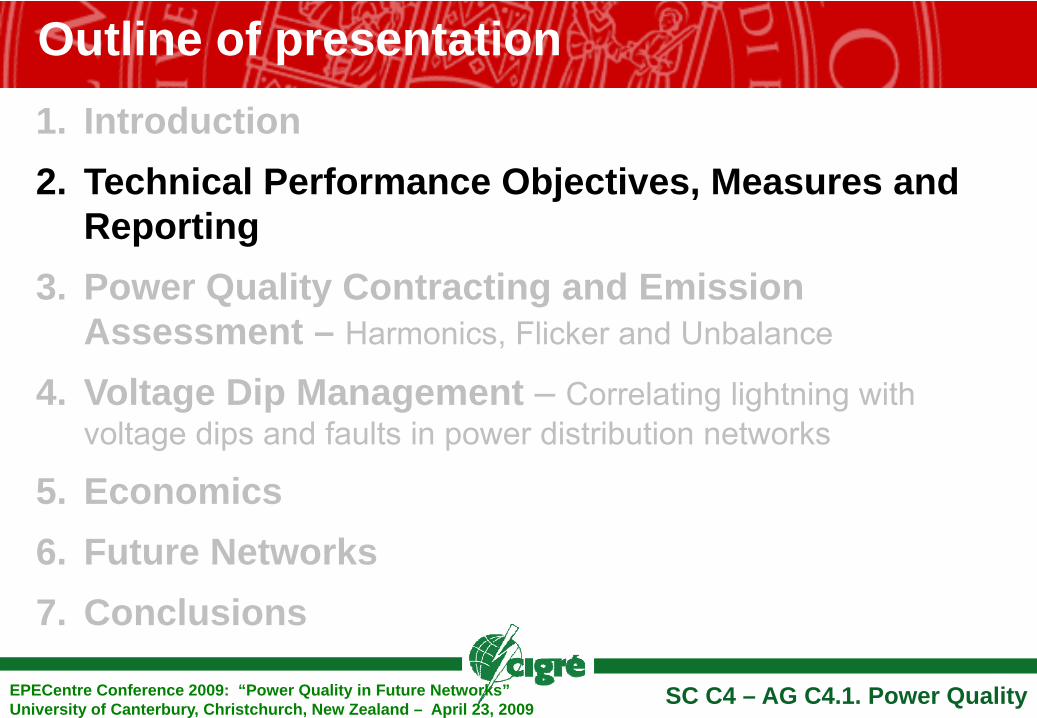
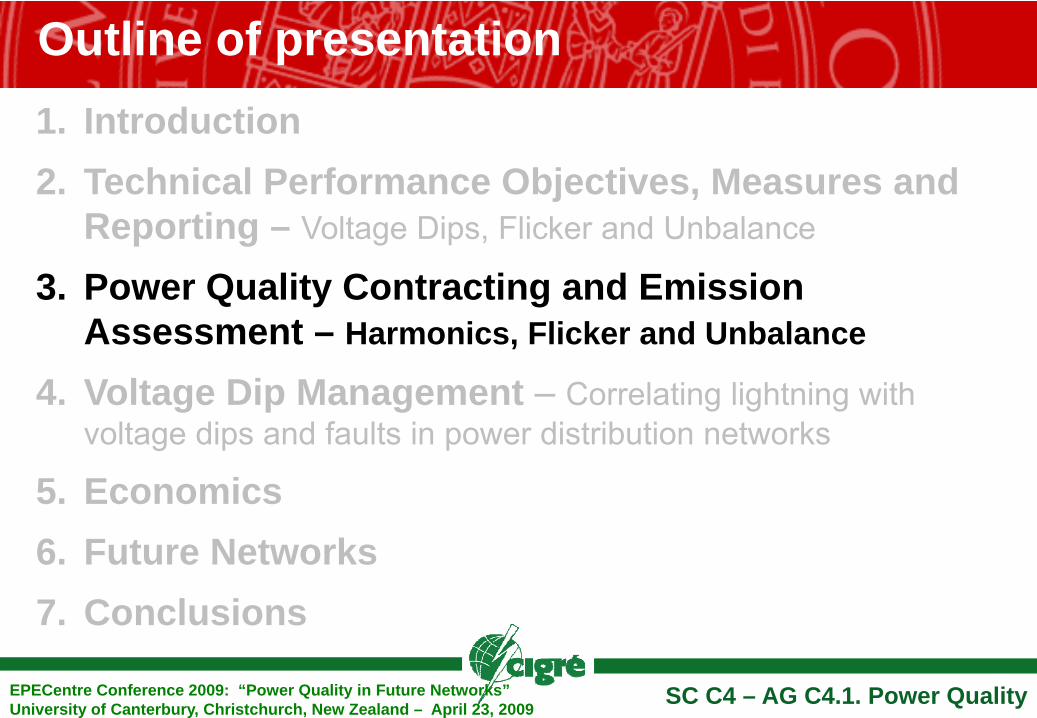
Outline of presentation1. Introduction2. Technical Performance Objectives, Measures and
Reporting 3. Power Quality Contracting and Emission
Assessment – Harmonics, Flicker and Unbalance
4. Voltage Dip Management – Correlating lightning with voltage dips and faults in power distribution networks
5. Economics6. Future Networks7. Conclusions
SC C4 – AG C4.1. Power QualityEPECentre Conference 2009: “Power Quality in Future Networks” University of Canterbury, Christchurch, New Zealand – April 23, 2009
Outline of presentation
SC C4 – AG C4.1. Power QualityEPECentre Conference 2009: “Power Quality in Future Networks” University of Canterbury, Christchurch, New Zealand – April 23, 2009
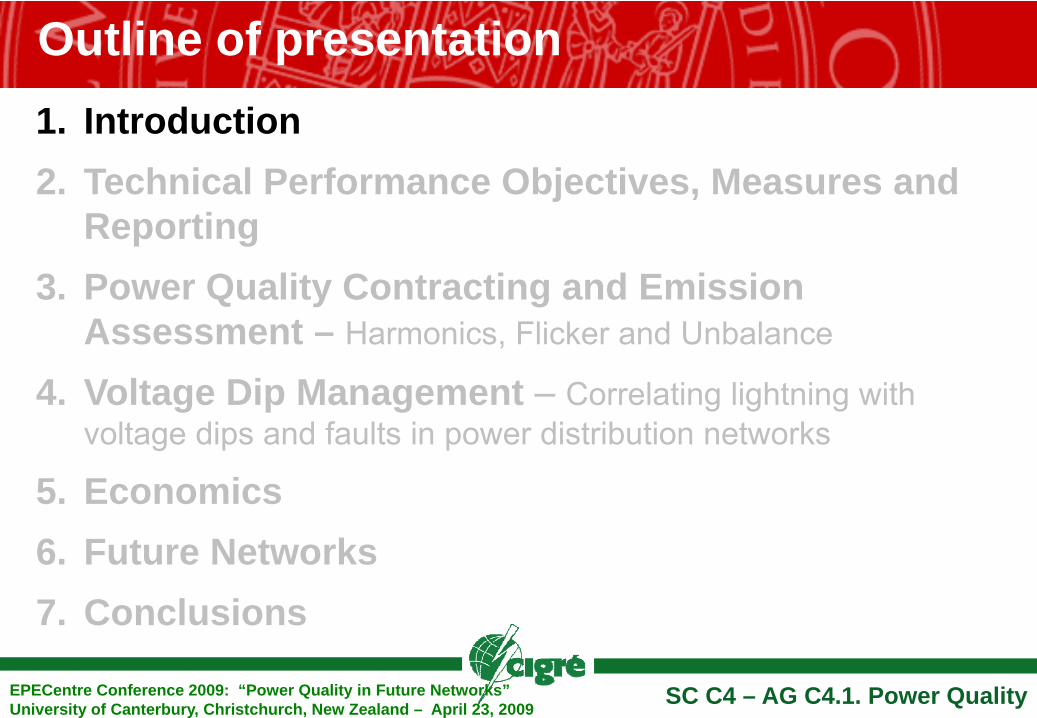
1. Introduction2. Technical Performance Objectives, Measures and
Reporting 3. Power Quality Contracting and Emission
Assessment – Harmonics, Flicker and Unbalance
4. Voltage Dip Management – Correlating lightning with voltage dips and faults in power distribution networks
5. Economics6. Future Networks7. Conclusions
Introduction
SC C4 – AG C4.1. Power QualityEPECentre Conference 2009: “Power Quality in Future Networks” University of Canterbury, Christchurch, New Zealand – April 23, 2009
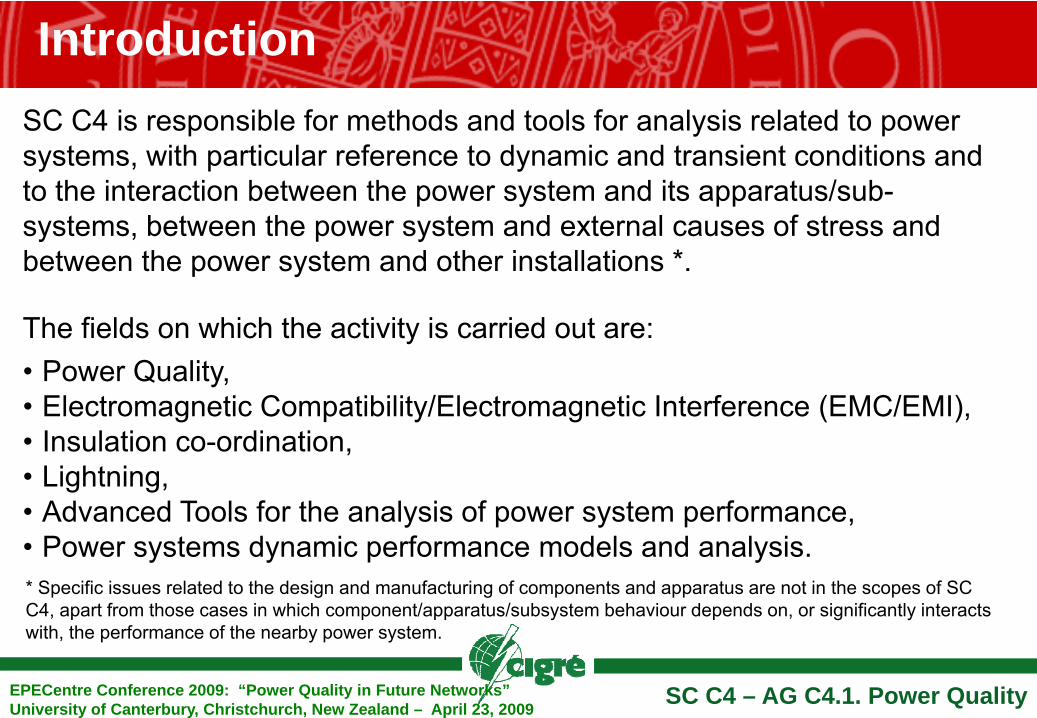
SC C4 is responsible for methods and tools for analysis related to power systems, with particular reference to dynamic and transient conditions and to the interaction between the power system and its apparatus/sub-systems, between the power system and external causes of stress and between the power system and other installations *.
The fields on which the activity is carried out are: • Power Quality, • Electromagnetic Compatibility/Electromagnetic Interference (EMC/EMI), • Insulation co-ordination, • Lightning, • Advanced Tools for the analysis of power system performance, • Power systems dynamic performance models and analysis.* Specific issues related to the design and manufacturing of components and apparatus are not in the scopes of SC C4, apart from those cases in which component/apparatus/subsystem behaviour depends on, or significantly interacts with, the performance of the nearby power system.
Introduction
SC C4 – AG C4.1. Power QualityEPECentre Conference 2009: “Power Quality in Future Networks” University of Canterbury, Christchurch, New Zealand – April 23, 2009
* Specific issues related to the design and manufacturing of components and apparatus are not in the scopes of SC C4, apart from those cases in which component/apparatus/subsystem behaviour depends on, or significantly interacts with, the performance of the nearby power system.
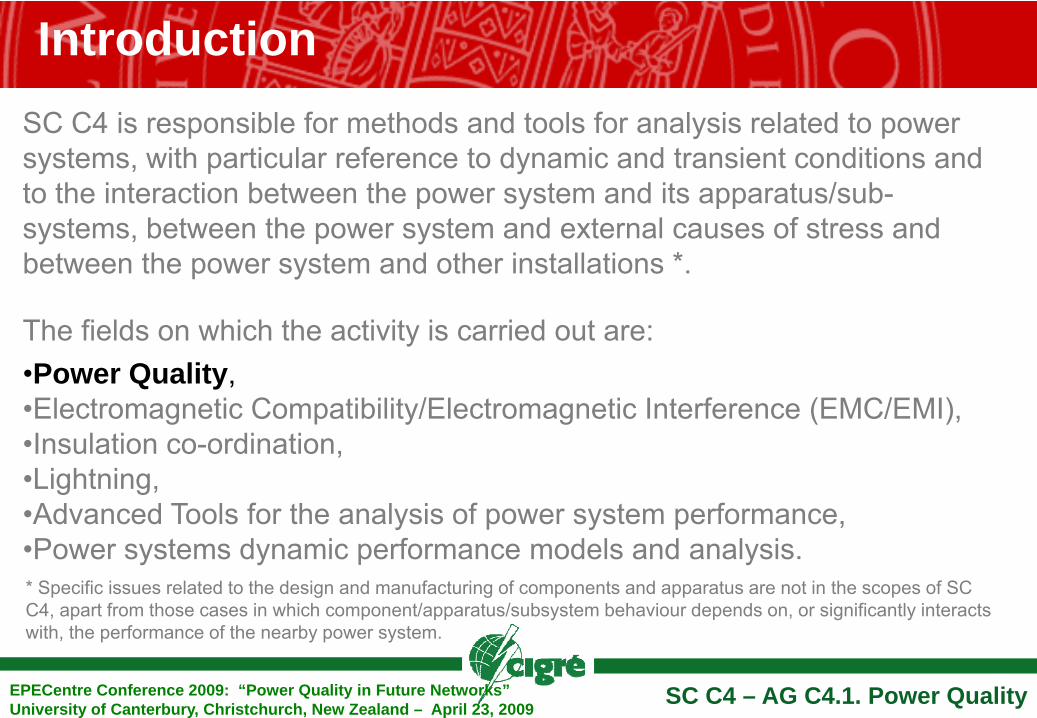
SC C4 is responsible for methods and tools for analysis related to power systems, with particular reference to dynamic and transient conditions and to the interaction between the power system and its apparatus/sub-systems, between the power system and external causes of stress and between the power system and other installations *.
The fields on which the activity is carried out are: •Power Quality, •Electromagnetic Compatibility/Electromagnetic Interference (EMC/EMI), •Insulation co-ordination, •Lightning, •Advanced Tools for the analysis of power system performance, •Power systems dynamic performance models and analysis.
Introduction – Advisory Group ‘Power Quality
SC C4 – AG C4.1. Power QualityEPECentre Conference 2009: “Power Quality in Future Networks” University of Canterbury, Christchurch, New Zealand – April 23, 2009
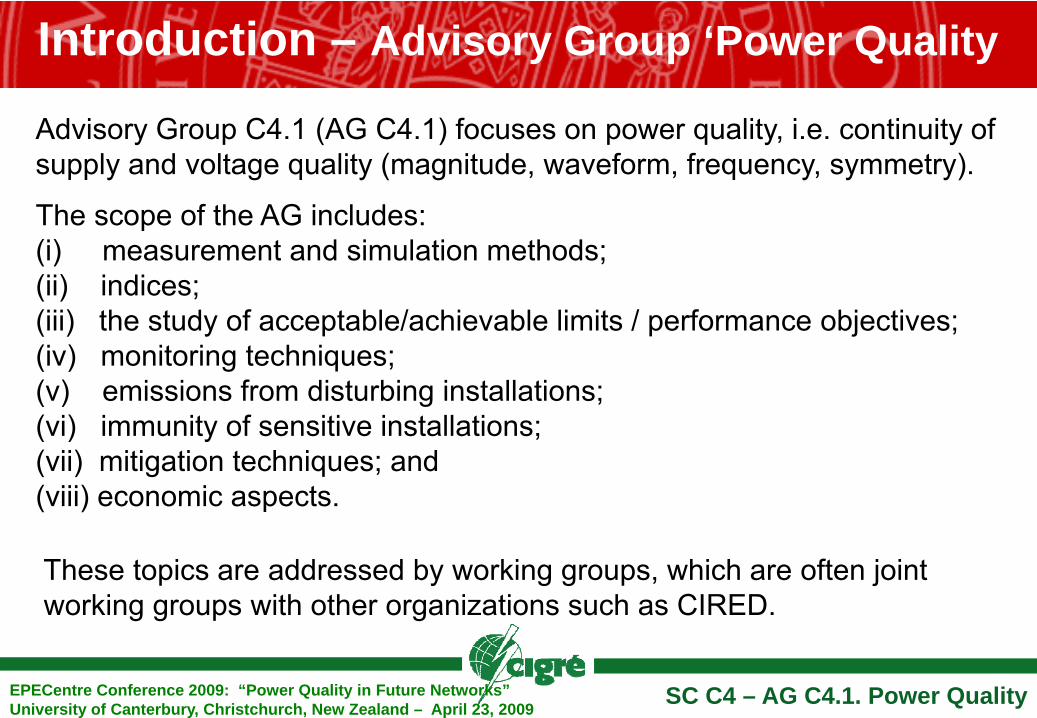
Advisory Group C4.1 (AG C4.1) focuses on power quality, i.e. continuity of supply and voltage quality (magnitude, waveform, frequency, symmetry).
The scope of the AG includes: (i) measurement and simulation methods; (ii) indices; (iii) the study of acceptable/achievable limits / performance objectives;(iv) monitoring techniques; (v) emissions from disturbing installations; (vi) immunity of sensitive installations; (vii) mitigation techniques; and (viii) economic aspects.
These topics are addressed by working groups, which are often joint working groups with other organizations such as CIRED.
Introduction – Advisory Group ‘Power Quality
SC C4 – AG C4.1. Power QualityEPECentre Conference 2009: “Power Quality in Future Networks” University of Canterbury, Christchurch, New Zealand – April 23, 2009
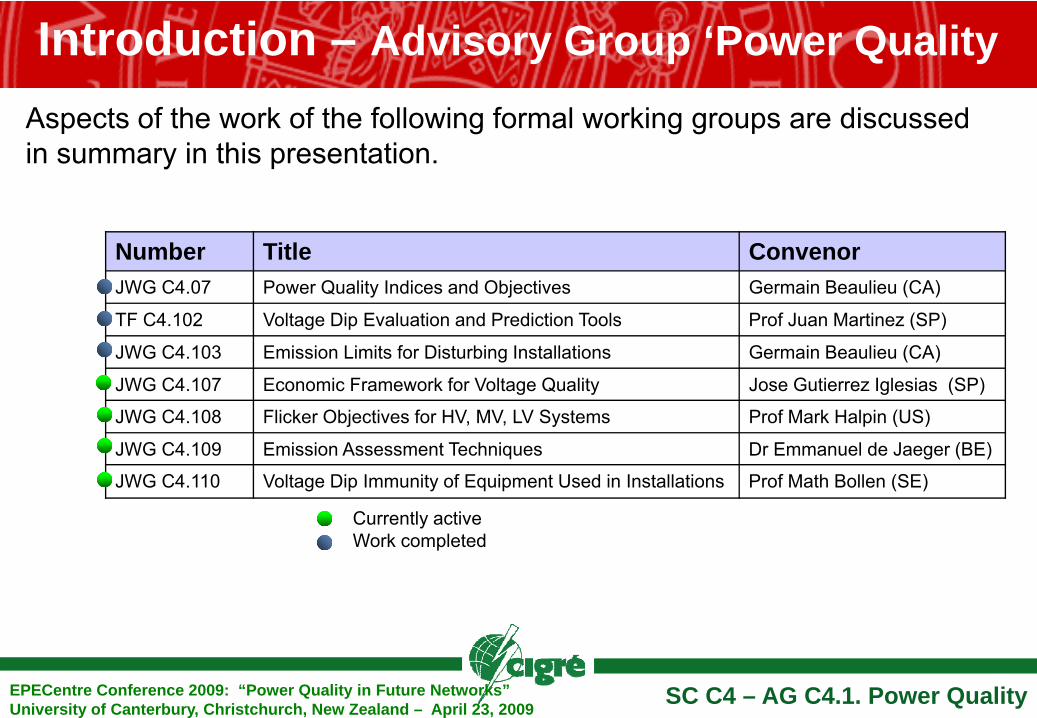
Aspects of the work of the following formal working groups are discussed in summary in this presentation.
Number Title ConvenorJWG C4.07 Power Quality Indices and Objectives Germain Beaulieu (CA)
TF C4.102 Voltage Dip Evaluation and Prediction Tools Prof Juan Martinez (SP)
JWG C4.103 Emission Limits for Disturbing Installations Germain Beaulieu (CA)
JWG C4.107 Economic Framework for Voltage Quality Jose Gutierrez Iglesias (SP)
JWG C4.108 Flicker Objectives for HV, MV, LV Systems Prof Mark Halpin (US)
JWG C4.109 Emission Assessment Techniques Dr Emmanuel de Jaeger (BE)
JWG C4.110 Voltage Dip Immunity of Equipment Used in Installations Prof Math Bollen (SE)
Currently active Work completed
Outline of presentation
SC C4 – AG C4.1. Power QualityEPECentre Conference 2009: “Power Quality in Future Networks” University of Canterbury, Christchurch, New Zealand – April 23, 2009
1. Introduction2. Technical Performance Objectives, Measures and
Reporting 3. Power Quality Contracting and Emission
Assessment – Harmonics, Flicker and Unbalance
4. Voltage Dip Management – Correlating lightning with voltage dips and faults in power distribution networks
5. Economics6. Future Networks7. Conclusions
Technical Performance Objectives, Measures and Reporting
SC C4 – AG C4.1. Power QualityEPECentre Conference 2009: “Power Quality in Future Networks” University of Canterbury, Christchurch, New Zealand – April 23, 2009
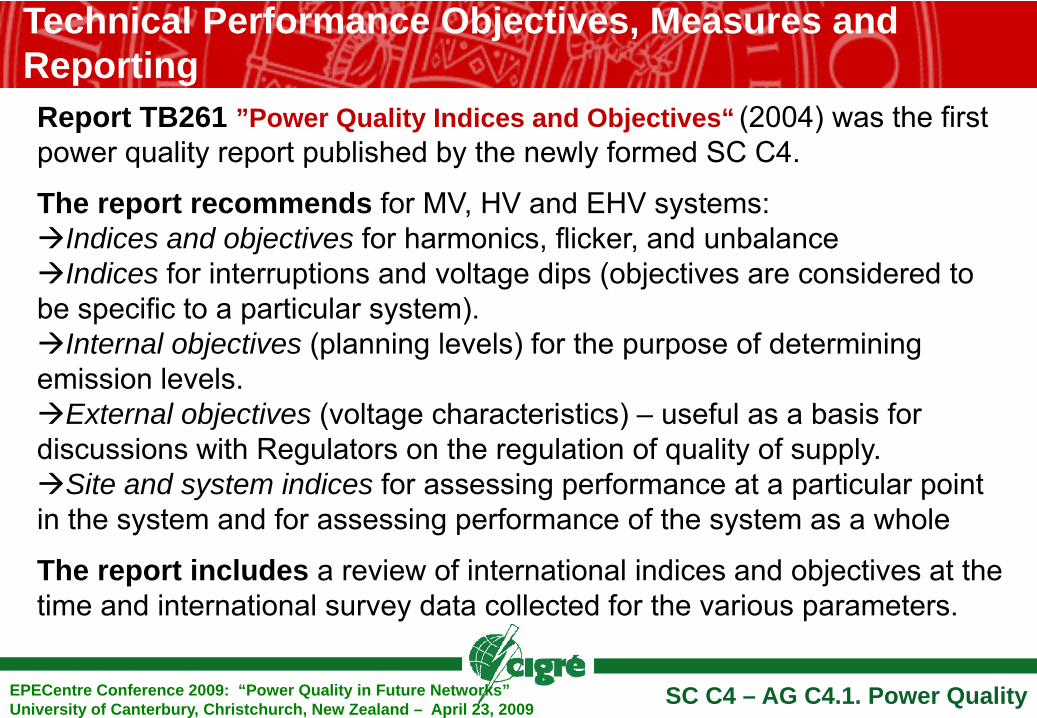
Report TB261 ”Power Quality Indices and Objectives“ (2004) was the first power quality report published by the newly formed SC C4.
The report recommends for MV, HV and EHV systems: Indices and objectives for harmonics, flicker, and unbalance Indices for interruptions and voltage dips (objectives are considered to
be specific to a particular system).Internal objectives (planning levels) for the purpose of determining
emission levels.External objectives (voltage characteristics) – useful as a basis for
discussions with Regulators on the regulation of quality of supply.Site and system indices for assessing performance at a particular point
in the system and for assessing performance of the system as a whole
The report includes a review of international indices and objectives at the time and international survey data collected for the various parameters.
Technical Performance Objectives, Measures and Reporting – Harmonics, Unbalance, Flicker
SC C4 – AG C4.1. Power QualityEPECentre Conference 2009: “Power Quality in Future Networks” University of Canterbury, Christchurch, New Zealand – April 23, 2009
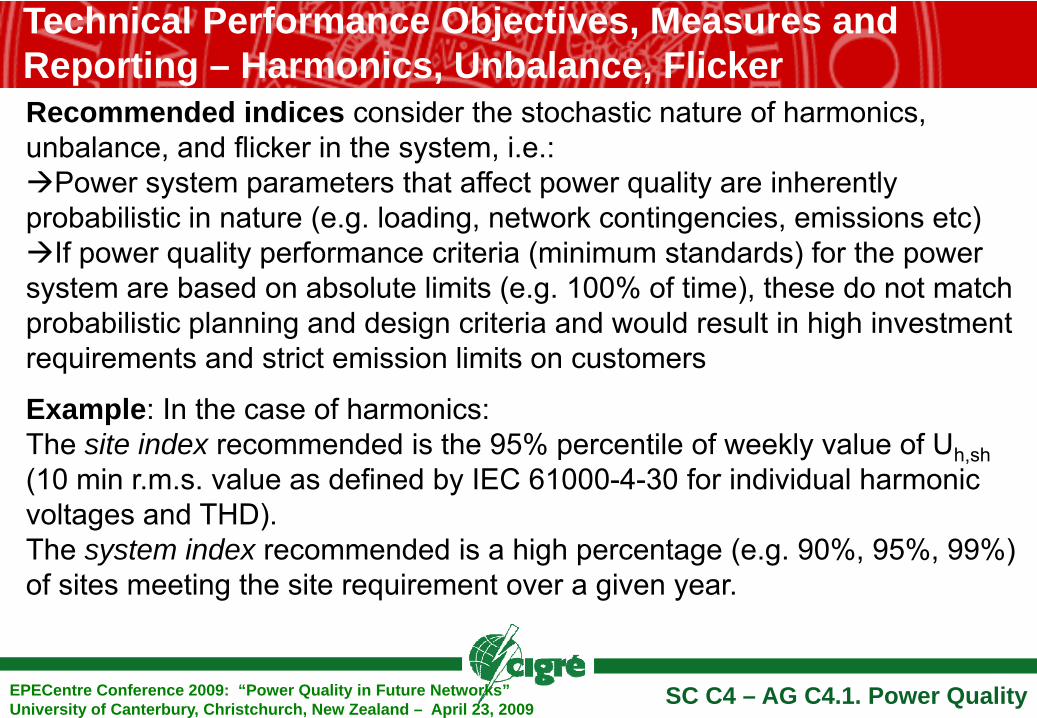
Recommended indices consider the stochastic nature of harmonics, unbalance, and flicker in the system, i.e.:
Power system parameters that affect power quality are inherently probabilistic in nature (e.g. loading, network contingencies, emissions etc)
If power quality performance criteria (minimum standards) for the power system are based on absolute limits (e.g. 100% of time), these do not match probabilistic planning and design criteria and would result in high investment requirements and strict emission limits on customers
Example: In the case of harmonics:The site index recommended is the 95% percentile of weekly value of Uh,sh(10 min r.m.s. value as defined by IEC 61000-4-30 for individual harmonic voltages and THD).The system index recommended is a high percentage (e.g. 90%, 95%, 99%) of sites meeting the site requirement over a given year.
Technical Performance Objectives, Measures and Reporting – Interruptions
SC C4 – AG C4.1. Power QualityEPECentre Conference 2009: “Power Quality in Future Networks” University of Canterbury, Christchurch, New Zealand – April 23, 2009
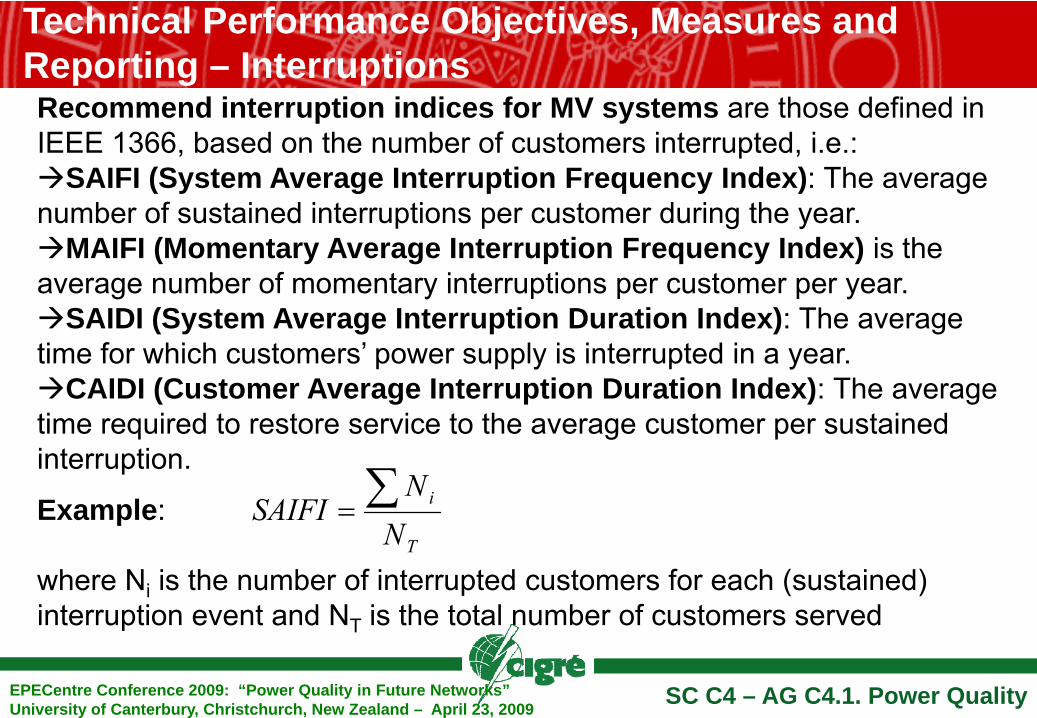
Recommend interruption indices for MV systems are those defined in IEEE 1366, based on the number of customers interrupted, i.e.:
SAIFI (System Average Interruption Frequency Index): The average number of sustained interruptions per customer during the year.
MAIFI (Momentary Average Interruption Frequency Index) is the average number of momentary interruptions per customer per year.
SAIDI (System Average Interruption Duration Index): The average time for which customers’ power supply is interrupted in a year.
CAIDI (Customer Average Interruption Duration Index): The average time required to restore service to the average customer per sustained interruption.
Example:
where Ni is the number of interrupted customers for each (sustained) interruption event and NT is the total number of customers served
T
i
NN
SAIFI ∑=
Technical Performance Objectives, Measures and Reporting – Interruptions
SC C4 – AG C4.1. Power QualityEPECentre Conference 2009: “Power Quality in Future Networks” University of Canterbury, Christchurch, New Zealand – April 23, 2009
Recommend interruption indices for HV and EHV systems are provided for three reporting philosophies, i.e.:
Connection point interruption reporting: Based on connection points of customers, generators, and other supply systems, these indices allow the performance of a transmission system to be evaluated independently from how downstream systems are connected and restored after an interruption (see next slide).
End customer interruption reporting: Based on the impact on end-customers using the same indices for MV reporting.
System interrupted energy reporting: Based on the interrupted power (MW) and interrupted energy (MWh) only.
Technical Performance Objectives, Measures and Reporting – Interruptions
SC C4 – AG C4.1. Power QualityEPECentre Conference 2009: “Power Quality in Future Networks” University of Canterbury, Christchurch, New Zealand – April 23, 2009
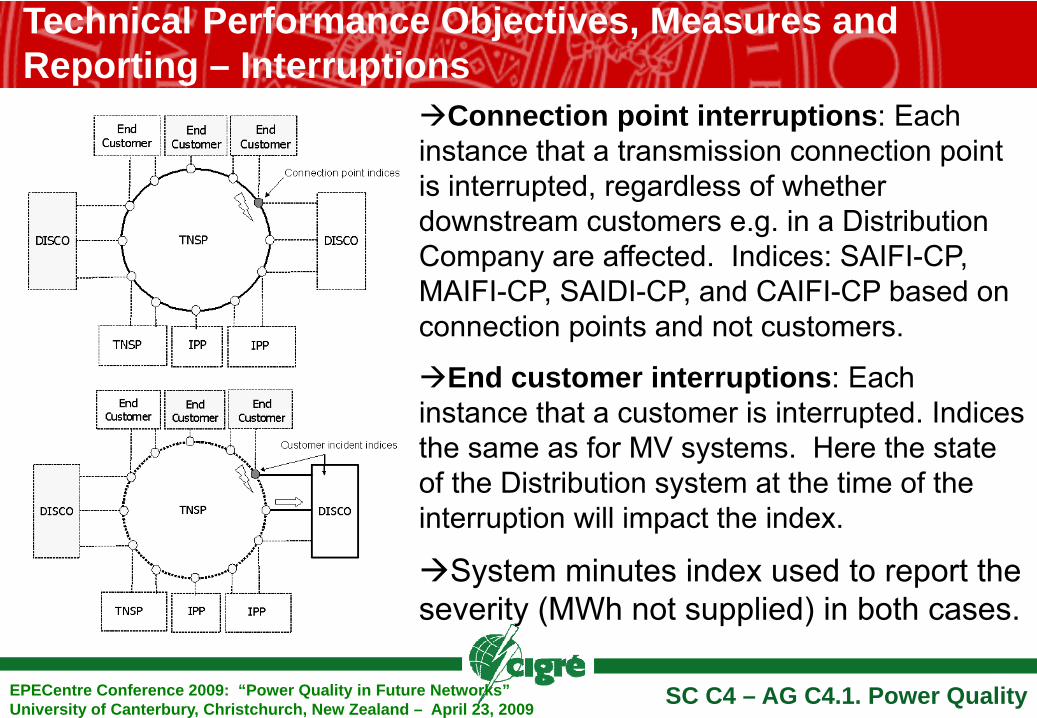
Connection point interruptions: Each instance that a transmission connection point is interrupted, regardless of whether downstream customers e.g. in a Distribution Company are affected. Indices: SAIFI-CP, MAIFI-CP, SAIDI-CP, and CAIFI-CP based on connection points and not customers.
End customer interruptions: Each instance that a customer is interrupted. Indices the same as for MV systems. Here the state of the Distribution system at the time of the interruption will impact the index.
System minutes index used to report the severity (MWh not supplied) in both cases.
sam p ledv o ltag es
ch arac te ris tic sv ersu s tim e
sin g le -ev en tin d ices
sin g le -sitein d ices
sy stemin d ices
m o re ev en ts
m o re s ite s
m easu rem en ts
d e ta ile
sim p le
Technical Performance Objectives, Measures and Reporting – Voltage Dips
SC C4 – AG C4.1. Power QualityEPECentre Conference 2009: “Power Quality in Future Networks” University of Canterbury, Christchurch, New Zealand – April 23, 2009
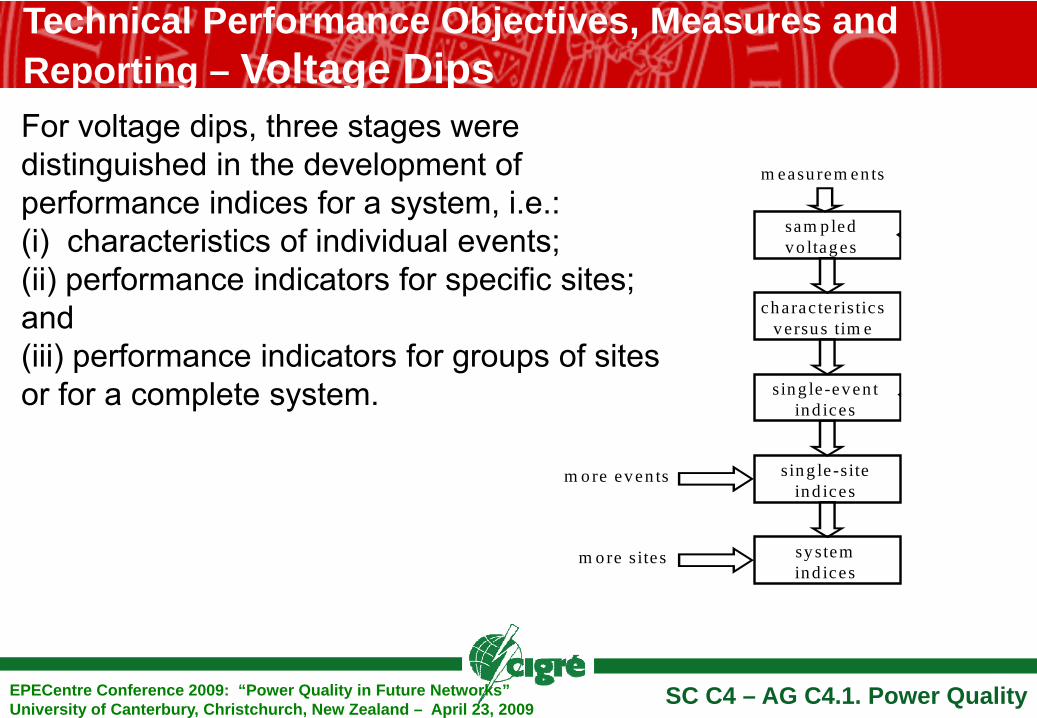
For voltage dips, three stages were distinguished in the development of performance indices for a system, i.e.: (i) characteristics of individual events; (ii) performance indicators for specific sites; and (iii) performance indicators for groups of sites or for a complete system.
Technical Performance Objectives, Measures and Reporting – Voltage Dips
SC C4 – AG C4.1. Power QualityEPECentre Conference 2009: “Power Quality in Future Networks” University of Canterbury, Christchurch, New Zealand – April 23, 2009
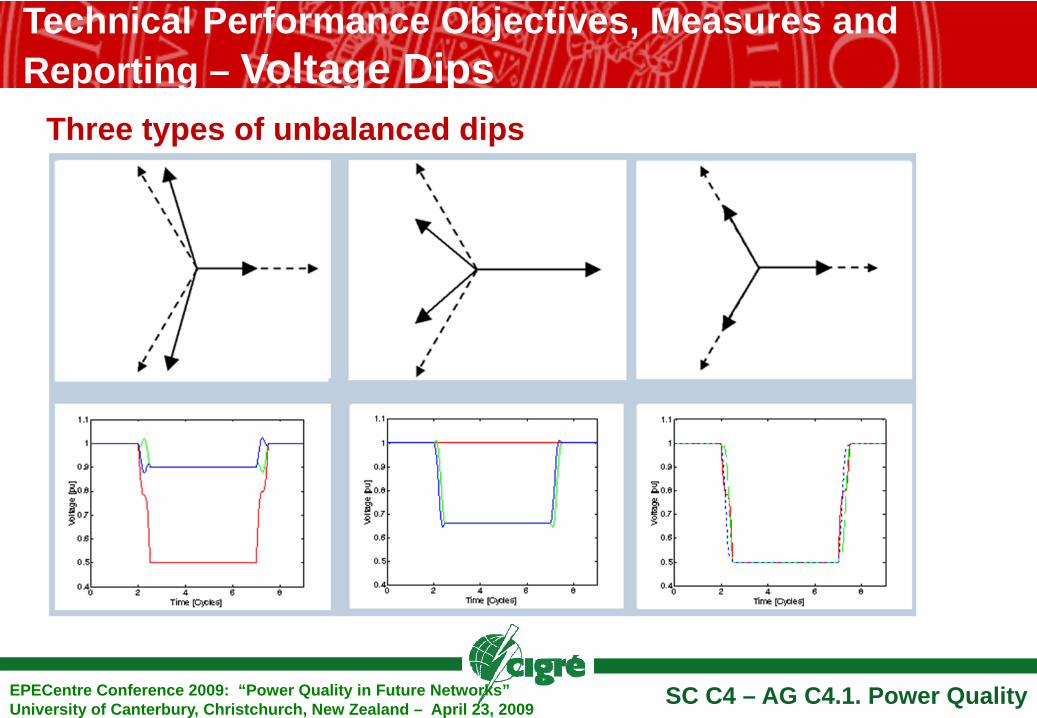
JWG C4.110 has been established to address ”Voltage Dip Immunity of Equipment Used in Installations”IEC 61000-4-30 provides for a simple description of a three-phase voltage dip (i.e. magnitude and duration only). An important contribution of the JWG is the more detailed description of individual voltage dips. A suite of additional parameters are introduced, including a dip type to quantify the unbalance during a dip.
This does not imply that all these parameters should become part of performance indices for systems and sites – but, given the significantly different impacts on equipment, unbalance properties of a dip should be included in both characterization and compliance testing of end-use equipment.
Technical Performance Objectives, Measures and Reporting – Voltage Dips
SC C4 – AG C4.1. Power QualityEPECentre Conference 2009: “Power Quality in Future Networks” University of Canterbury, Christchurch, New Zealand – April 23, 2009
Three types of unbalanced dips
SC C4 – AG C4.1. Power QualityEPECentre Conference 2009: “Power Quality in Future Networks” University of Canterbury, Christchurch, New Zealand – April 23, 2009
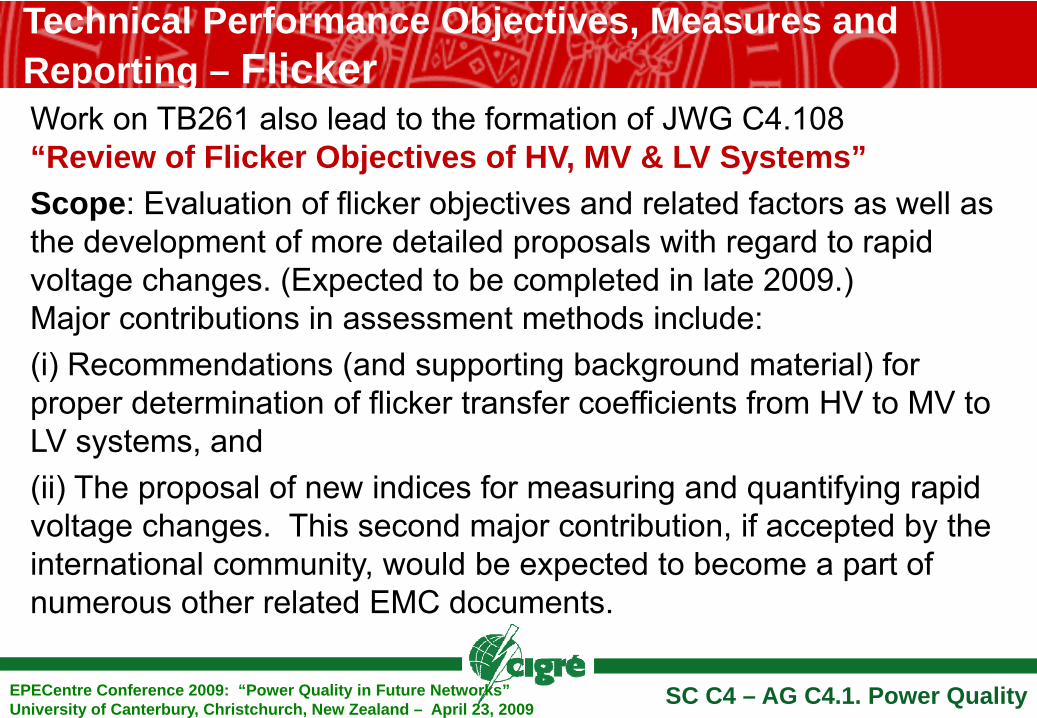
Technical Performance Objectives, Measures and Reporting – FlickerWork on TB261 also lead to the formation of JWG C4.108“Review of Flicker Objectives of HV, MV & LV Systems” Scope: Evaluation of flicker objectives and related factors as well as the development of more detailed proposals with regard to rapid voltage changes. (Expected to be completed in late 2009.) Major contributions in assessment methods include: (i) Recommendations (and supporting background material) for proper determination of flicker transfer coefficients from HV to MV to LV systems, and (ii) The proposal of new indices for measuring and quantifying rapid voltage changes. This second major contribution, if accepted by the international community, would be expected to become a part of numerous other related EMC documents.
SC C4 – AG C4.1. Power QualityEPECentre Conference 2009: “Power Quality in Future Networks” University of Canterbury, Christchurch, New Zealand – April 23, 2009
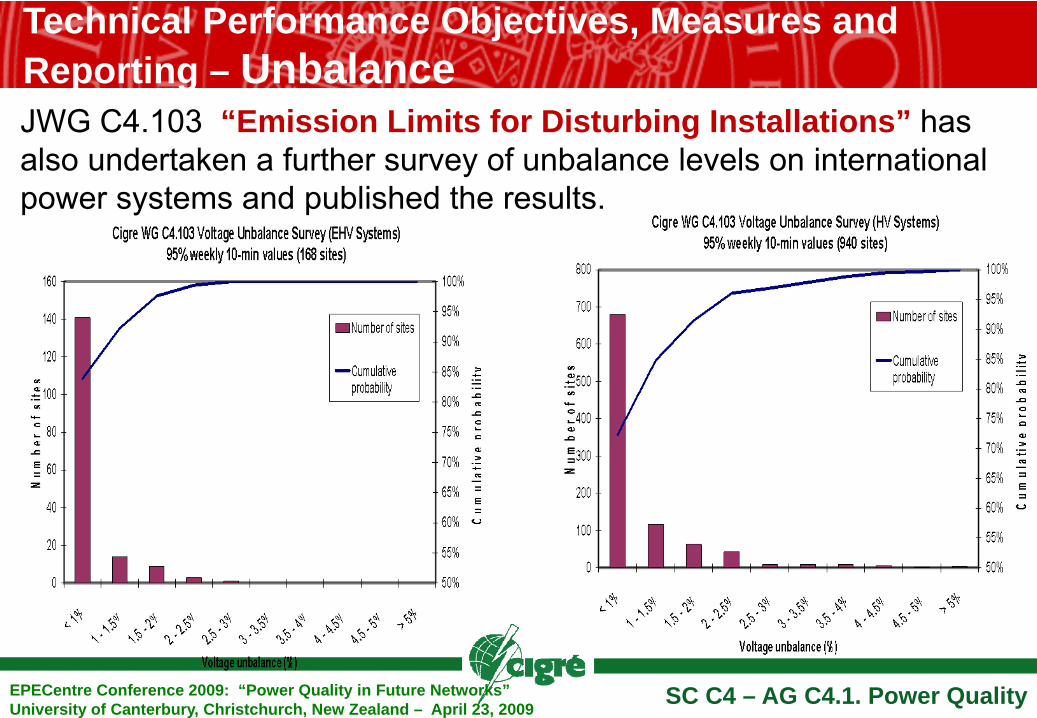
Technical Performance Objectives, Measures and Reporting – UnbalanceJWG C4.103 “Emission Limits for Disturbing Installations” has also undertaken a further survey of unbalance levels on international power systems and published the results.
SC C4 – AG C4.1. Power QualityEPECentre Conference 2009: “Power Quality in Future Networks” University of Canterbury, Christchurch, New Zealand – April 23, 2009
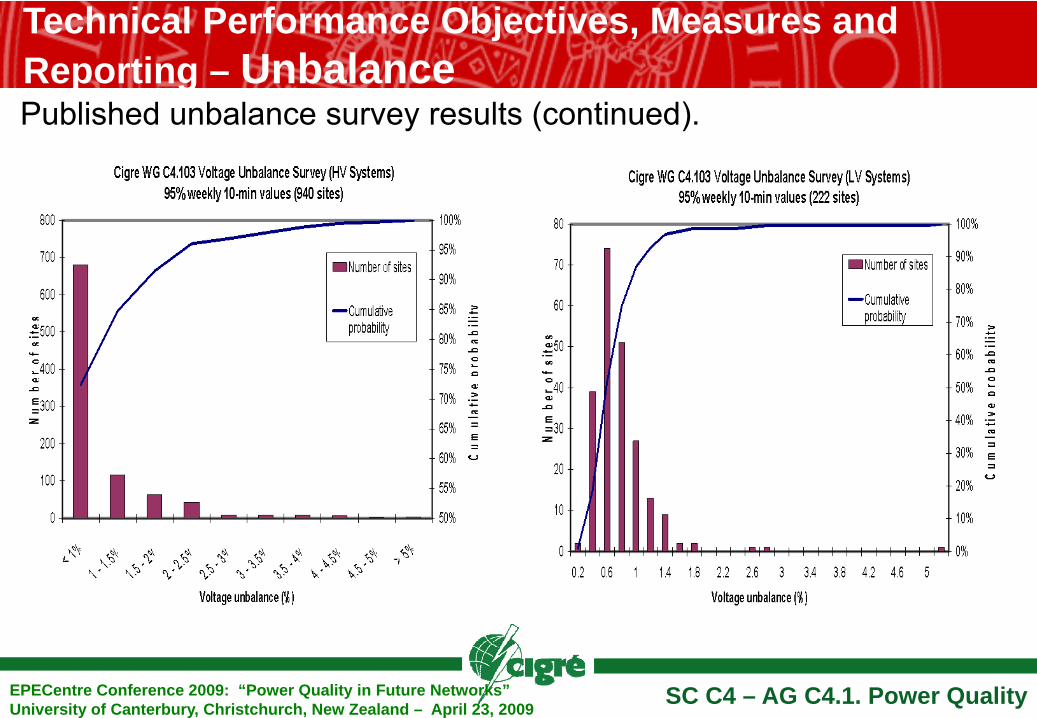
Technical Performance Objectives, Measures and Reporting – UnbalancePublished unbalance survey results (continued).
Outline of presentation1. Introduction2. Technical Performance Objectives, Measures and
Reporting – Voltage Dips, Flicker and Unbalance
3. Power Quality Contracting and Emission Assessment – Harmonics, Flicker and Unbalance
4. Voltage Dip Management – Correlating lightning with voltage dips and faults in power distribution networks
5. Economics6. Future Networks7. Conclusions
SC C4 – AG C4.1. Power QualityEPECentre Conference 2009: “Power Quality in Future Networks” University of Canterbury, Christchurch, New Zealand – April 23, 2009
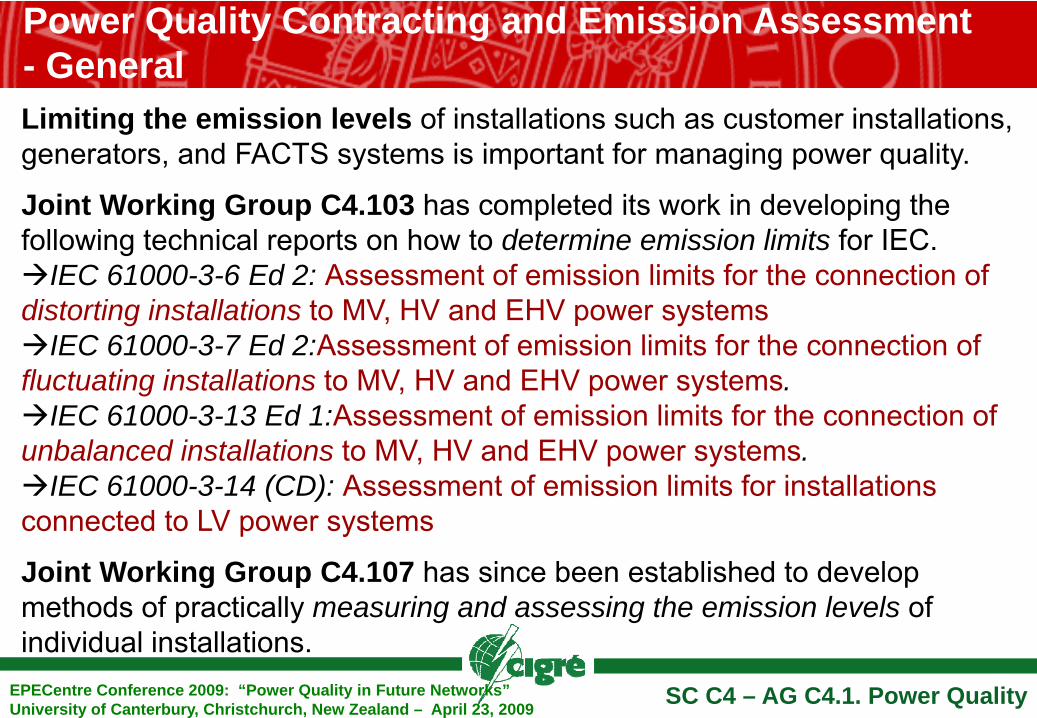
Power Quality Contracting and Emission Assessment- General
SC C4 – AG C4.1. Power QualityEPECentre Conference 2009: “Power Quality in Future Networks” University of Canterbury, Christchurch, New Zealand – April 23, 2009
Limiting the emission levels of installations such as customer installations, generators, and FACTS systems is important for managing power quality.
Joint Working Group C4.103 has completed its work in developing the following technical reports on how to determine emission limits for IEC.
IEC 61000-3-6 Ed 2: Assessment of emission limits for the connection of distorting installations to MV, HV and EHV power systems
IEC 61000-3-7 Ed 2:Assessment of emission limits for the connection of fluctuating installations to MV, HV and EHV power systems.
IEC 61000-3-13 Ed 1:Assessment of emission limits for the connection of unbalanced installations to MV, HV and EHV power systems.
IEC 61000-3-14 (CD): Assessment of emission limits for installations connected to LV power systems
Joint Working Group C4.107 has since been established to develop methods of practically measuring and assessing the emission levels of individual installations.
SC C4 – AG C4.1. Power QualityEPECentre Conference 2009: “Power Quality in Future Networks” University of Canterbury, Christchurch, New Zealand – April 23, 2009
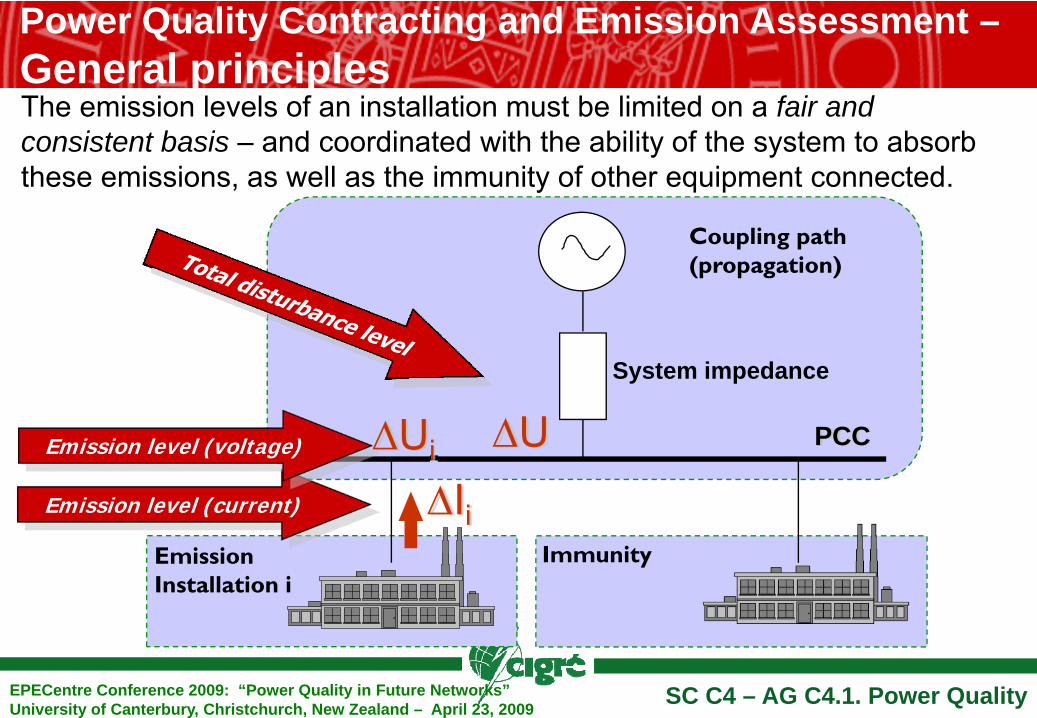
Power Quality Contracting and Emission Assessment –General principlesThe emission levels of an installation must be limited on a fair and consistent basis – and coordinated with the ability of the system to absorb these emissions, as well as the immunity of other equipment connected.
PCC
System impedance
ΔIi
ΔU
Emission Installation i
Immunity
Coupling path(propagation)
Emission level (current)
ΔUi Emission level (voltage)
SC C4 – AG C4.1. Power QualityEPECentre Conference 2009: “Power Quality in Future Networks” University of Canterbury, Christchurch, New Zealand – April 23, 2009
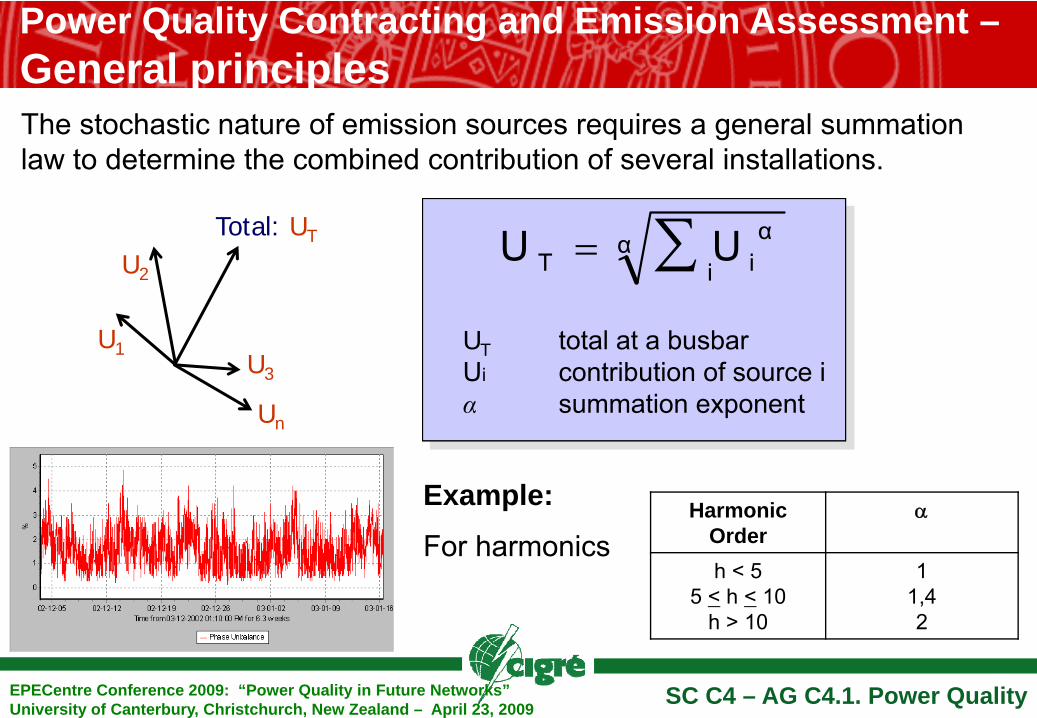
Power Quality Contracting and Emission Assessment –General principlesThe stochastic nature of emission sources requires a general summation law to determine the combined contribution of several installations.
Total: UT
UT total at a busbarUi contribution of source iα summation exponent
U3
αi
αiT UU ∑=
Un
U1
U2
Harmonic Order
α
h < 55 < h < 10
h > 10
11,42
Example:
For harmonics
SC C4 – AG C4.1. Power QualityEPECentre Conference 2009: “Power Quality in Future Networks” University of Canterbury, Christchurch, New Zealand – April 23, 2009
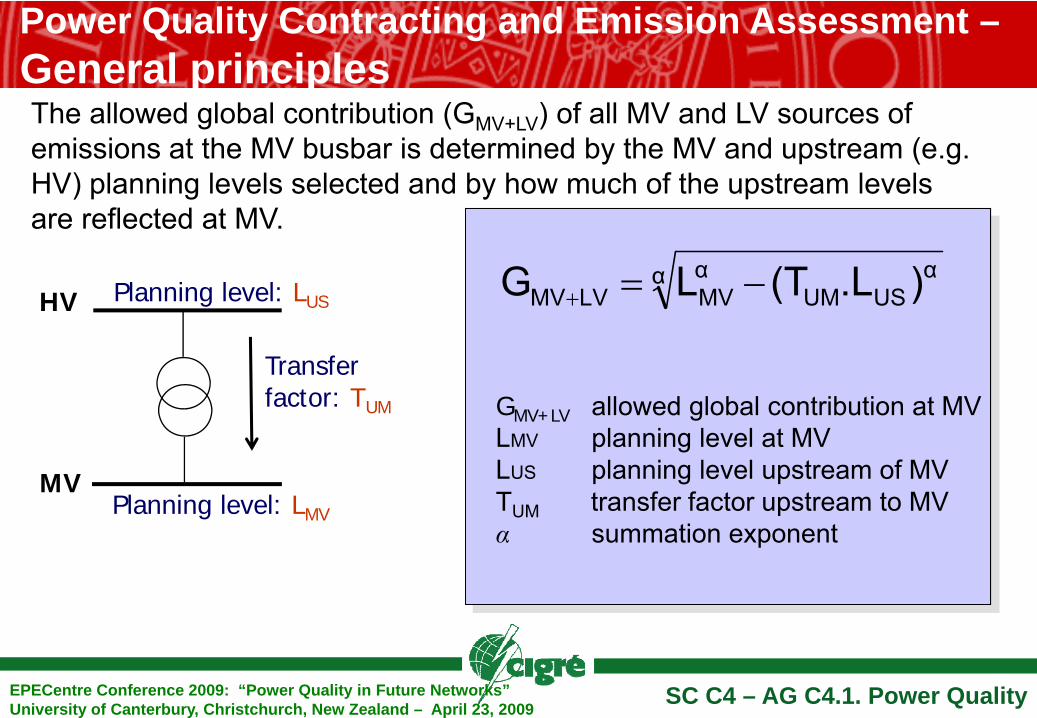
Power Quality Contracting and Emission Assessment –General principlesThe allowed global contribution (GMV+LV) of all MV and LV sources of emissions at the MV busbar is determined by the MV and upstream (e.g. HV) planning levels selected and by how much of the upstream levels are reflected at MV.
GMV+LV allowed global contribution at MVLMV planning level at MVLUS planning level upstream of MVTUM transfer factor upstream to MV α summation exponent
α αUSUM
αMVLVMV ).L(TLG −=+Planning level: LUS
Planning level: LMV
HV
MV
Transfer factor: TUM
SC C4 – AG C4.1. Power QualityEPECentre Conference 2009: “Power Quality in Future Networks” University of Canterbury, Christchurch, New Zealand – April 23, 2009
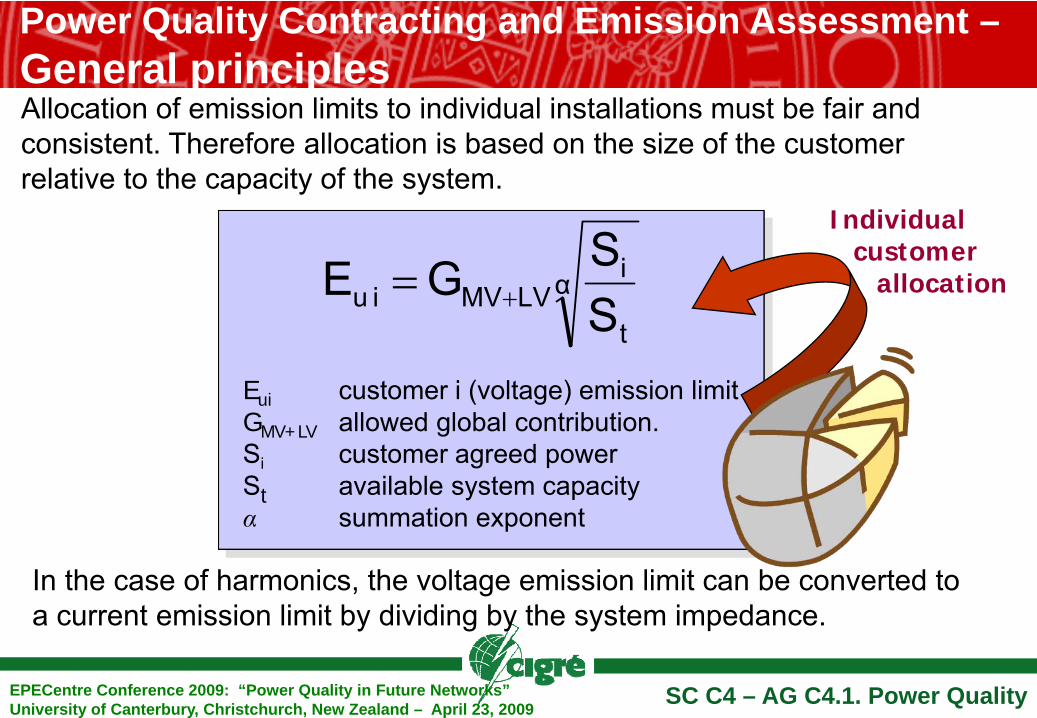
Power Quality Contracting and Emission Assessment –General principlesAllocation of emission limits to individual installations must be fair and consistent. Therefore allocation is based on the size of the customer relative to the capacity of the system.
α
t
iLVMViu S
SGE +=Individual
customerallocation
Eui customer i (voltage) emission limitGMV+LV allowed global contribution.Si customer agreed power St available system capacity α summation exponent
In the case of harmonics, the voltage emission limit can be converted to a current emission limit by dividing by the system impedance.
SC C4 – AG C4.1. Power QualityEPECentre Conference 2009: “Power Quality in Future Networks” University of Canterbury, Christchurch, New Zealand – April 23, 2009
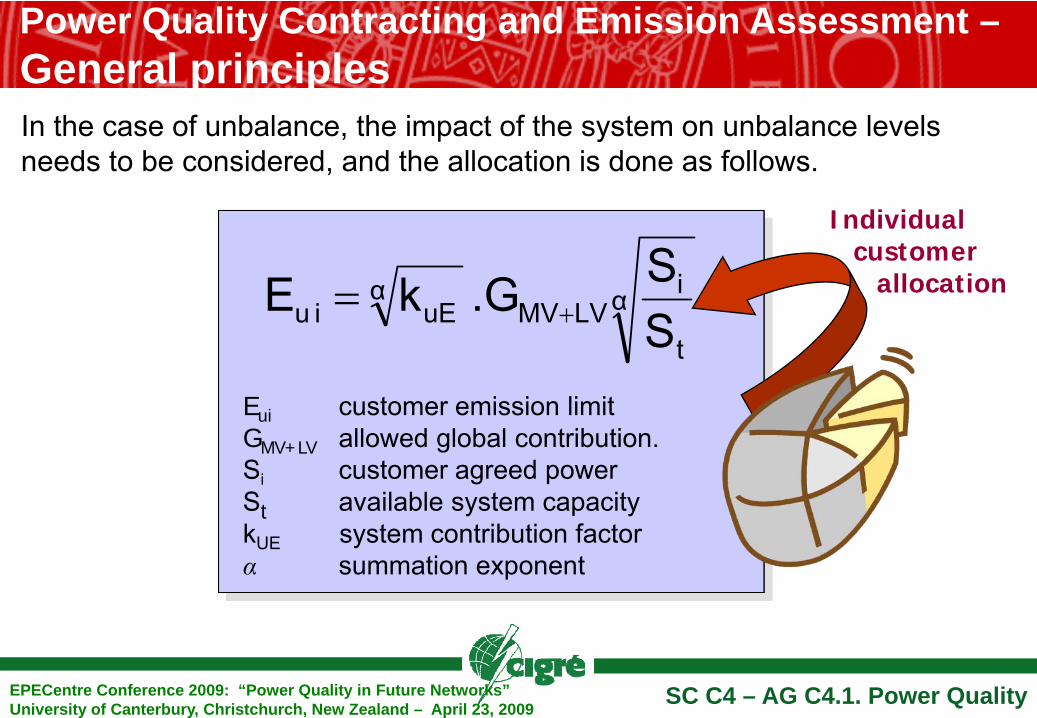
Power Quality Contracting and Emission Assessment –General principlesIn the case of unbalance, the impact of the system on unbalance levels needs to be considered, and the allocation is done as follows.
Individual customer
allocation
Eui customer emission limitGMV+LV allowed global contribution.Si customer agreed power St available system capacity kUE system contribution factorα summation exponent
α
t
iLVMV
αuEiu S
S.GkE +=
SC C4 – AG C4.1. Power QualityEPECentre Conference 2009: “Power Quality in Future Networks” University of Canterbury, Christchurch, New Zealand – April 23, 2009
Power Quality Contracting and Emission Assessment –General principlesSince the completion of the work of JWG C4.103, some significant work has been undertaken (University of Wollongong) on how to better estimate the transfer factor (TUM) and the system contribution factor (KUE). It is likely that this work will be included in future revisions of the IEC technical reports on flicker and unbalance.
Work in C4 is currently focusing on the practical measurement of emission levels for individual installations. This is the subject of JWG C4.107. Harmonics, unbalance, and flicker are being addressed. (see next slides)
SC C4 – AG C4.1. Power QualityEPECentre Conference 2009: “Power Quality in Future Networks” University of Canterbury, Christchurch, New Zealand – April 23, 2009
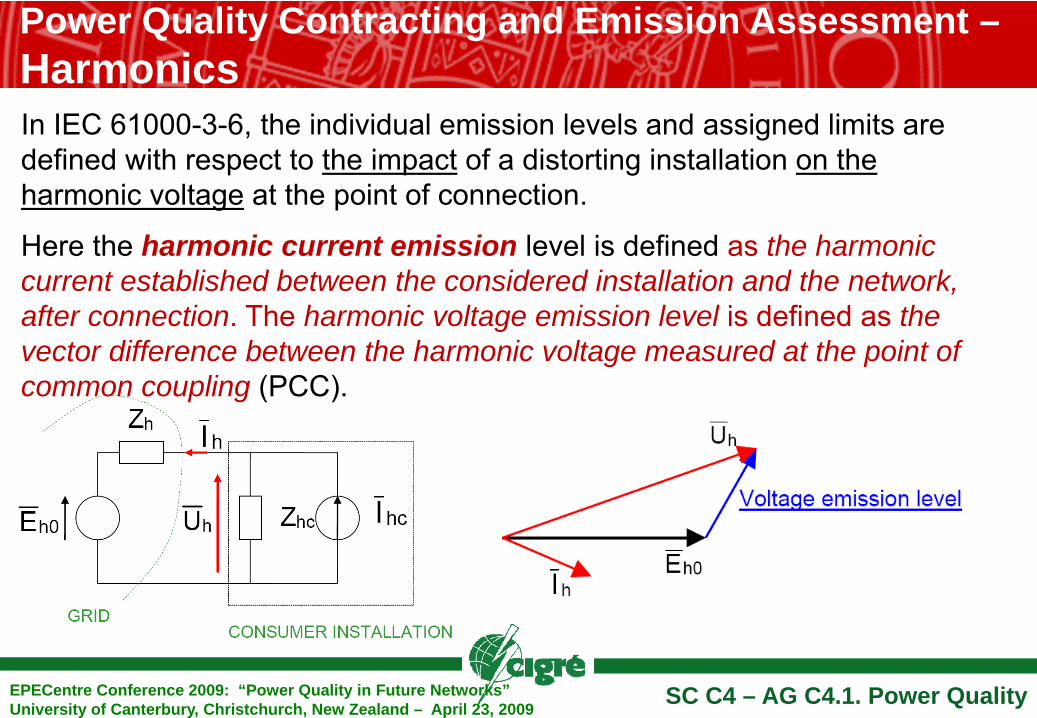
Power Quality Contracting and Emission Assessment –HarmonicsIn IEC 61000-3-6, the individual emission levels and assigned limits are defined with respect to the impact of a distorting installation on the harmonic voltage at the point of connection.
Here the harmonic current emission level is defined as the harmonic current established between the considered installation and the network, after connection. The harmonic voltage emission level is defined as the vector difference between the harmonic voltage measured at the point of common coupling (PCC).
SC C4 – AG C4.1. Power QualityEPECentre Conference 2009: “Power Quality in Future Networks” University of Canterbury, Christchurch, New Zealand – April 23, 2009
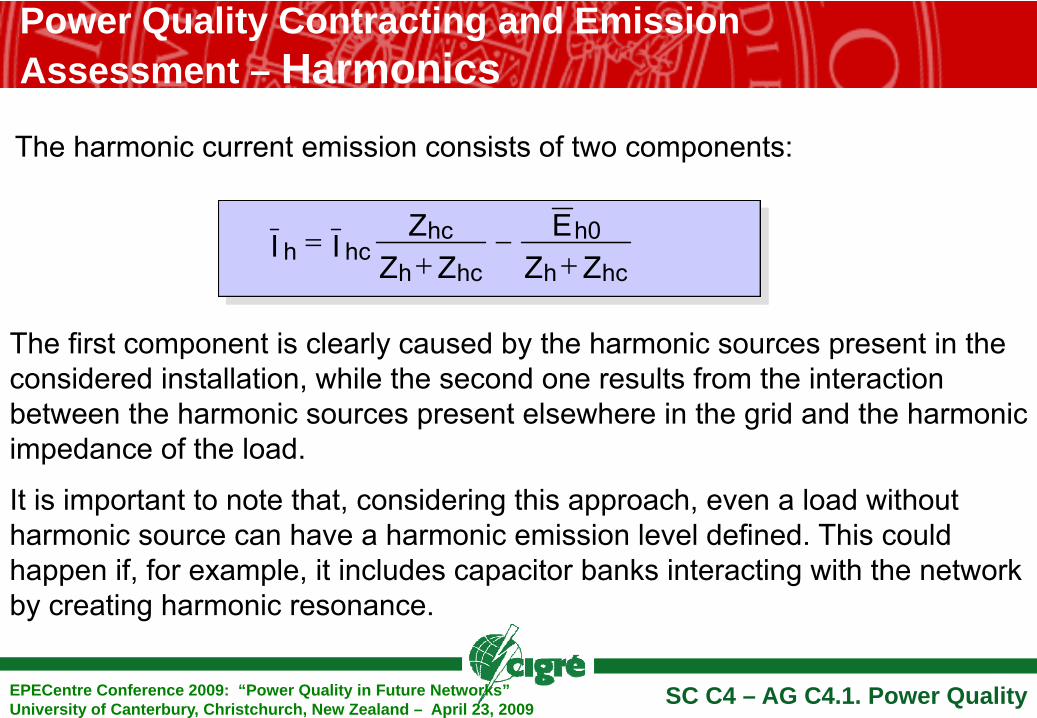
Power Quality Contracting and Emission Assessment – HarmonicsThe harmonic current emission consists of two components:
ZZE
ZZZ
IIhch
0h
hch
hchch +
−+
=
The first component is clearly caused by the harmonic sources present in the considered installation, while the second one results from the interaction between the harmonic sources present elsewhere in the grid and the harmonic impedance of the load.
It is important to note that, considering this approach, even a load without harmonic source can have a harmonic emission level defined. This could happen if, for example, it includes capacitor banks interacting with the network by creating harmonic resonance.
SC C4 – AG C4.1. Power QualityEPECentre Conference 2009: “Power Quality in Future Networks” University of Canterbury, Christchurch, New Zealand – April 23, 2009
Power Quality Contracting and Emission Assessment – Harmonics
IEC 61000-3-6 harmonic emission is taken into consideration if and only if the resulting Uh has a greater amplitude than the background Eh0.
Only in this case, the emission levels (current or voltage) have to be compared with the assigned limits. This comparison is made through a statistical assessment procedure.
The IEC technical reports suggest that the emission levels should be measured for a sufficient long period of time (typically one week) and that statistical indices must be used (e.g. 95th percentile of the 10-minutes r.m.s. values) for comparison with the authorised limits.
This statement practically excludes “one-shot” evaluations (i.e. sequence measurements with the consumer’s installation respectively switched off and on).
SC C4 – AG C4.1. Power QualityEPECentre Conference 2009: “Power Quality in Future Networks” University of Canterbury, Christchurch, New Zealand – April 23, 2009
Power Quality Contracting and Emission Assessment – HarmonicsCIGRE WG C4.109 “Emission Assessment Techniques”
the two approaches were advisable, depending on the phase angles are measured and/or sufficiently precisely known or not. If phase angles are measured, the harmonic vector method would be recommended.
Alternately a more simple approach should be considered, based only on the measurement of the harmonic current Ih .
In both cases it must be emphasized that the IEC technical reports require statistical assessment. Statistical analysis should therefore be performed with and without the considered installation in operation.
The comparison of the relevant indices must establish if there is an increase of the global harmonic level or not. An emission must be determined only in the first case, i.e. in case of increase of the total level, when the considered installation is in operation.

SC C4 – AG C4.1. Power QualityEPECentre Conference 2009: “Power Quality in Future Networks” University of Canterbury, Christchurch, New Zealand – April 23, 2009
Power Quality Contracting and Emission Assessment – Harmonics
The grid harmonic impedance Zh appears to be a key parameter in the quantification process of the harmonic voltage emission.
Several options exist for the practical processing of the measurement data:
(i) using the actual measured value of this impedance (with the difficulty of doing it on-line);
(ii) using an agreed “contractual” value (either calculated or measured as a one-shot).
SC C4 – AG C4.1. Power QualityEPECentre Conference 2009: “Power Quality in Future Networks” University of Canterbury, Christchurch, New Zealand – April 23, 2009
Power Quality Contracting and Emission Assessment –FlickerThe technical report IEC 61000-3-7 which outlines the principles to assess emission limits for the connection of fluctuating loads to the public network power system, gives the following definition of the flicker emission level: “The emission level from an installation into the power system is the magnitude of flicker which the considered installation gives rise at the point of evaluation (POE).
The emission level is required to be less than the emission limit assessed according to the relevant sections in this document”.
As far as flicker is concerned, emission level must then be interpreted as the level resulting from the considered fluctuating load alone, without any interaction with the other disturbing loads present elsewhere in the grid.
The WG identified two families of assessment methods.
SC C4 – AG C4.1. Power QualityEPECentre Conference 2009: “Power Quality in Future Networks” University of Canterbury, Christchurch, New Zealand – April 23, 2009
Power Quality Contracting and Emission Assessment –Flicker
If the flicker level is continuously recorded at the POE for a sufficient long period of time, together with the power consumption of the different consumers, a clear distinction can be made between situations with 0, 1 or more disturbing loads in operation.
For each of the possible combinations, all the Pst results are put together and statistics (such as Pst 95% or Pst 99%) are calculated. Selecting the Pst values according to the energy demand record of the different fluctuating loads seems to be an efficient method to assess the contribution from each individual one.
SC C4 – AG C4.1. Power QualityEPECentre Conference 2009: “Power Quality in Future Networks” University of Canterbury, Christchurch, New Zealand – April 23, 2009
Power Quality Contracting and Emission Assessment –FlickerA drawback is that considerable time is often necessary before getting reliable results. The measurement period leading to the equivalent of one-week results (± 1000 Pst values) may in fact be very long.
Another disadvantage of these kind of methods - linked to the rather long measurement period - is the risk of changes in network topology, possibly leading to significantly different short-circuit levels. The obtained individual Psti values are then no longer related to a constant short-circuit capacity.
However, should a reliable value of the short-circuit level be known for each data, the results could be re-processed in order to be related to a fixed reference short-circuit capacity (e.g. the contractual value).
SC C4 – AG C4.1. Power QualityEPECentre Conference 2009: “Power Quality in Future Networks” University of Canterbury, Christchurch, New Zealand – April 23, 2009
Power Quality Contracting and Emission Assessment –Flicker
On the other hand, direct on-line assessment methods have the advantage of not requiring a longer measurement time than strictly required (typically one week).
Moreover, they are insensitive to network fluctuations or topology changes.
The price to pay is that more than one simple flicker measurement is needed: at least two voltages, or one voltage and one current, or even complementary signals need to be measured.
The data processing is not common and usually not provided in commercially available flickermeters.
Three of these methods have been investigated by the WG: the Difference Method, the Load Current approach and an alternative to this one, provided by determining the consumer’s contribution to flicker level by means of RMS power measurements (P and Q every cycle or half cycle values).
SC C4 – AG C4.1. Power QualityEPECentre Conference 2009: “Power Quality in Future Networks” University of Canterbury, Christchurch, New Zealand – April 23, 2009
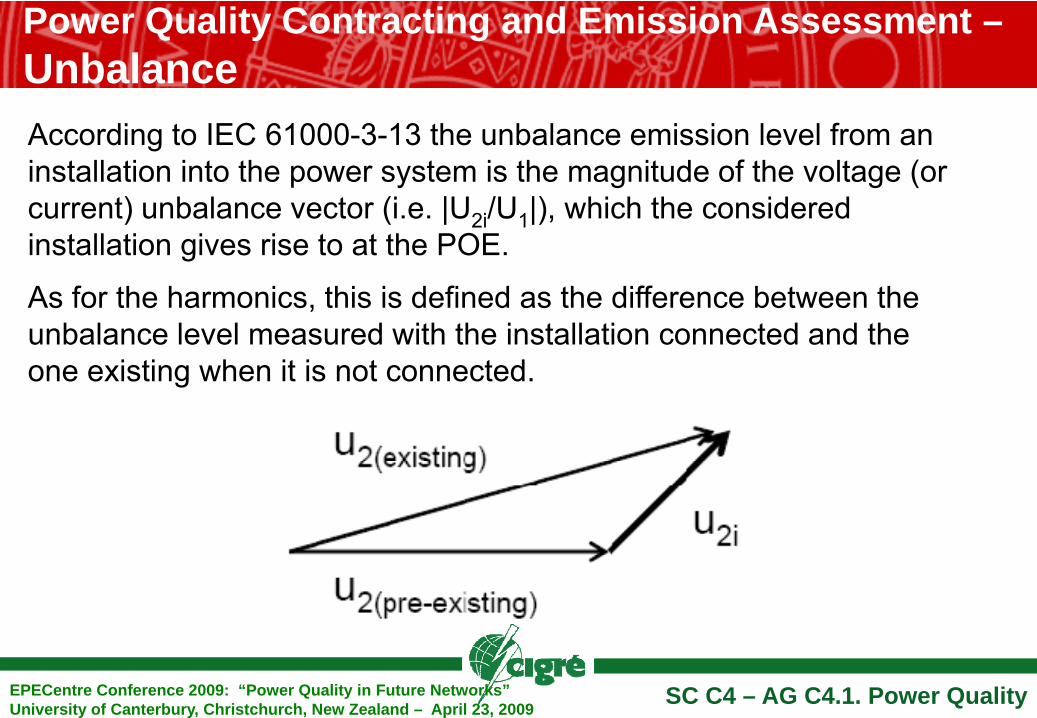
Power Quality Contracting and Emission Assessment –UnbalanceAccording to IEC 61000-3-13 the unbalance emission level from an installation into the power system is the magnitude of the voltage (or current) unbalance vector (i.e. |U2i/U1|), which the considered installation gives rise to at the POE.
As for the harmonics, this is defined as the difference between the unbalance level measured with the installation connected and the one existing when it is not connected.
SC C4 – AG C4.1. Power QualityEPECentre Conference 2009: “Power Quality in Future Networks” University of Canterbury, Christchurch, New Zealand – April 23, 2009
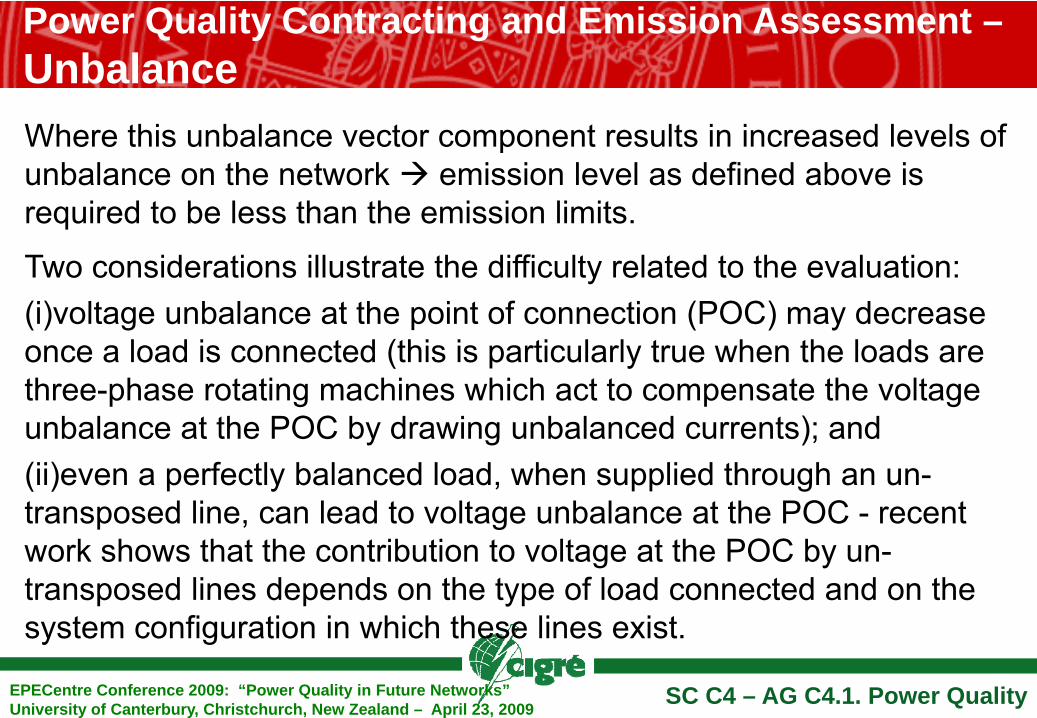
Power Quality Contracting and Emission Assessment –UnbalanceWhere this unbalance vector component results in increased levels of unbalance on the network emission level as defined above is required to be less than the emission limits.
Two considerations illustrate the difficulty related to the evaluation: (i)voltage unbalance at the point of connection (POC) may decrease once a load is connected (this is particularly true when the loads are three-phase rotating machines which act to compensate the voltage unbalance at the POC by drawing unbalanced currents); and (ii)even a perfectly balanced load, when supplied through an un-transposed line, can lead to voltage unbalance at the POC - recent work shows that the contribution to voltage at the POC by un-transposed lines depends on the type of load connected and on the system configuration in which these lines exist.
Outline of presentation1. Introduction2. Technical Performance Objectives, Measures and
Reporting – Voltage Dips, Flicker and Unbalance
3. Power Quality Contracting and Emission Assessment – Harmonics, Flicker and Unbalance
4. Voltage Dip Management – Correlating lightning with voltage dips and faults in power distribution networks
5. Economics6. Future Networks7. Conclusions
SC C4 – AG C4.1. Power QualityEPECentre Conference 2009: “Power Quality in Future Networks” University of Canterbury, Christchurch, New Zealand – April 23, 2009

Process immunity requirement
Supply performance
Process performance requirement
Process immunity time
Equipment performance requirement
Equipment selection or selection of other mitigation methods
Voltage Dip management
SC C4 – AG C4.1. Power QualityEPECentre Conference 2009: “Power Quality in Future Networks” University of Canterbury, Christchurch, New Zealand – April 23, 2009
Considering dip immunity in the design of industrial installations
Voltage Dip management
SC C4 – AG C4.1. Power QualityEPECentre Conference 2009: “Power Quality in Future Networks” University of Canterbury, Christchurch, New Zealand – April 23, 2009
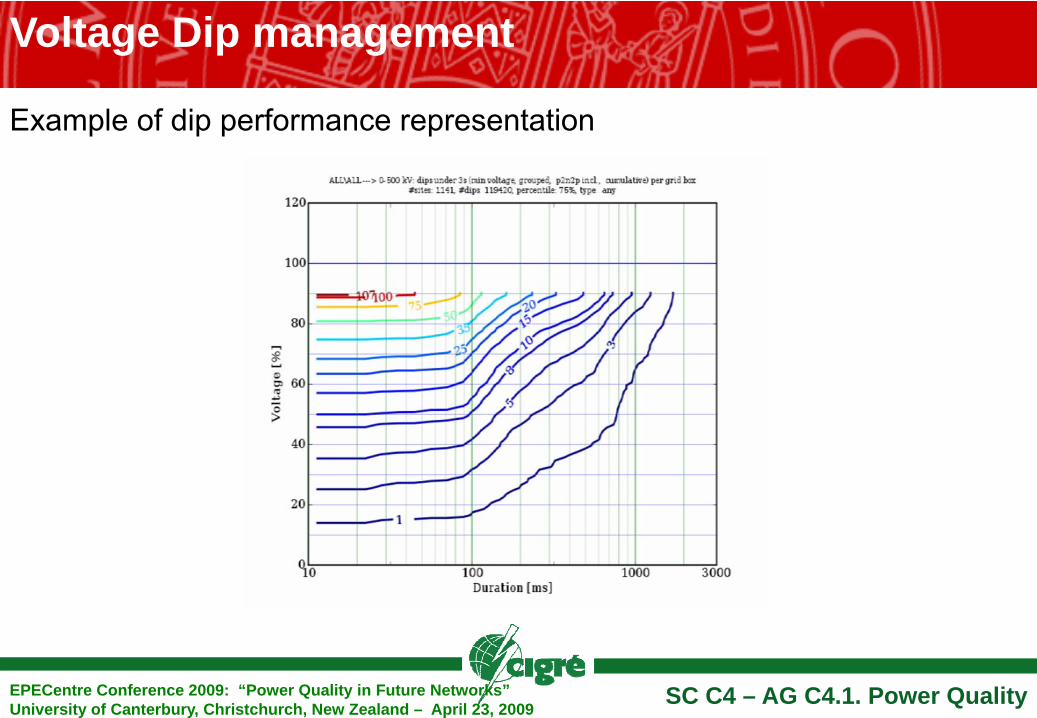
Example of dip performance representation
SC C4 – AG C4.1. Power Quality
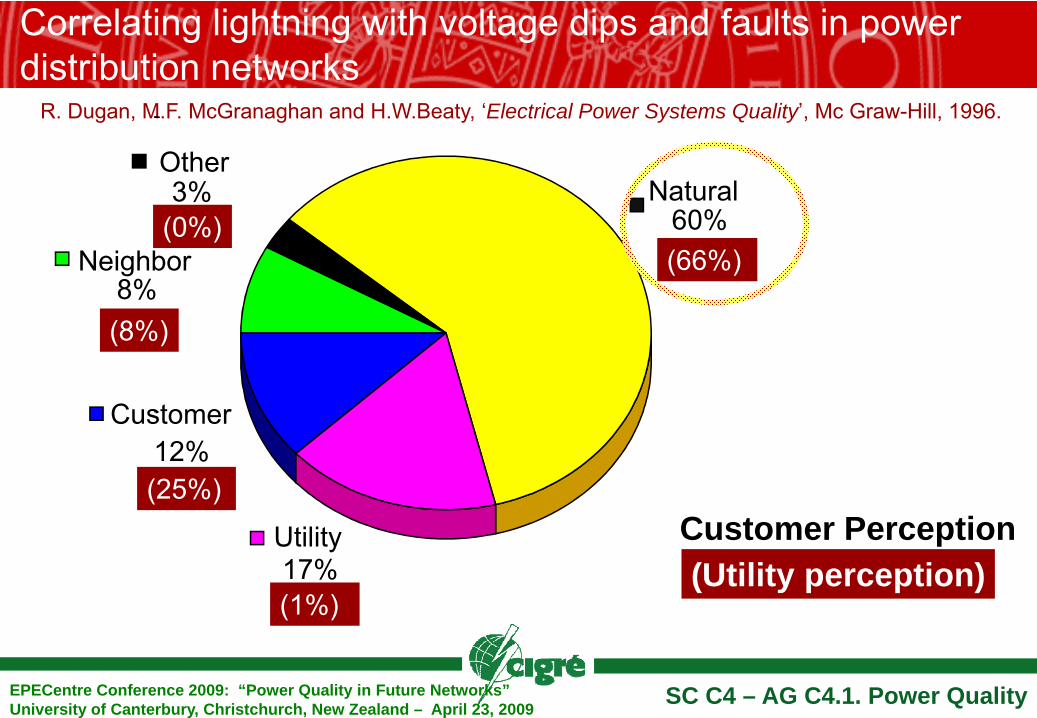
Natural60%
Utility 17%
Customer 12%
Neighbor8%
Other3%
R. Dugan, M.F. McGranaghan and H.W.Beaty, ‘Electrical Power Systems Quality’, Mc Graw-Hill, 1996.
(Utility perception)(1%)
(66%)
(25%)
(8%)
(0%)
Customer Perception
Correlating lightning with voltage dips and faults in power distribution networks
EPECentre Conference 2009: “Power Quality in Future Networks” University of Canterbury, Christchurch, New Zealand – April 23, 2009
SC C4 – AG C4.1. Power Quality
Correlating lightning with voltage dips and faults in power distribution networks
EPECentre Conference 2009: “Power Quality in Future Networks” University of Canterbury, Christchurch, New Zealand – April 23, 2009
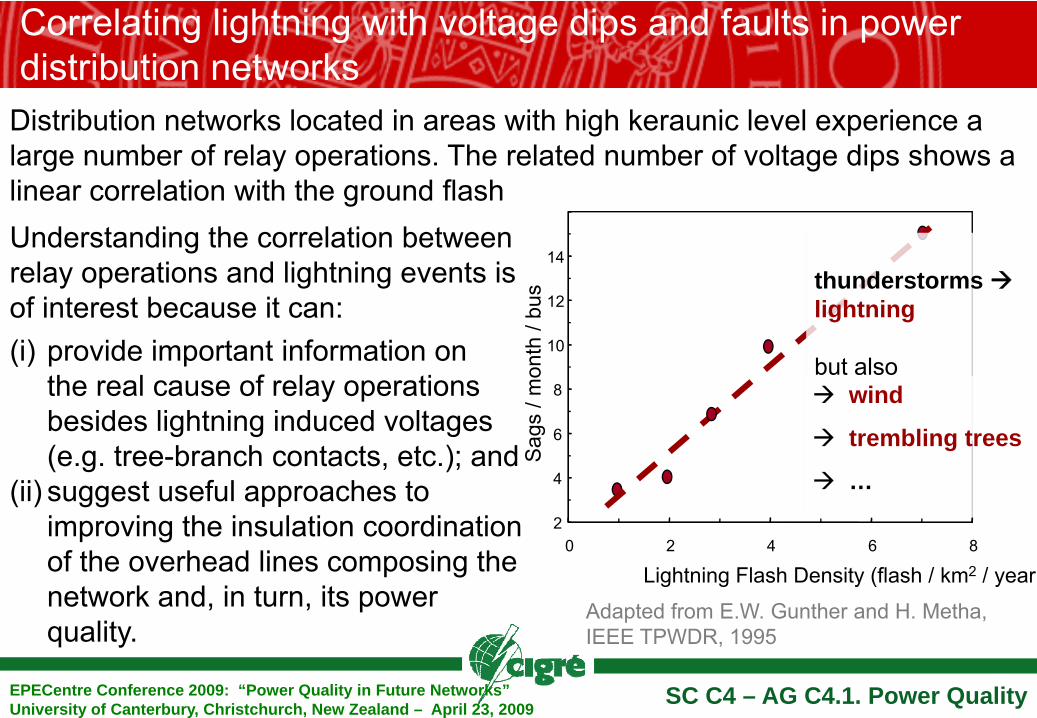
Distribution networks located in areas with high keraunic level experience a large number of relay operations. The related number of voltage dips shows a linear correlation with the ground flashUnderstanding the correlation between relay operations and lightning events is of interest because it can: (i) provide important information on
the real cause of relay operations besides lightning induced voltages (e.g. tree-branch contacts, etc.); and
(ii) suggest useful approaches to improving the insulation coordination of the overhead lines composing the network and, in turn, its power quality.
2
4
6
8
10
12
14
0 2 4 6 8
Lightning Flash Density (flash / km2 / year)
Sag
s / m
onth
/ bu
s thunderstormslightning
but also wind
trembling trees
…
Adapted from E.W. Gunther and H. Metha, IEEE TPWDR, 1995
Correlating lightning with voltage dips and faults in power distribution networks
SC C4 – AG C4.1. Power QualityEPECentre Conference 2009: “Power Quality in Future Networks” University of Canterbury, Christchurch, New Zealand – April 23, 2009
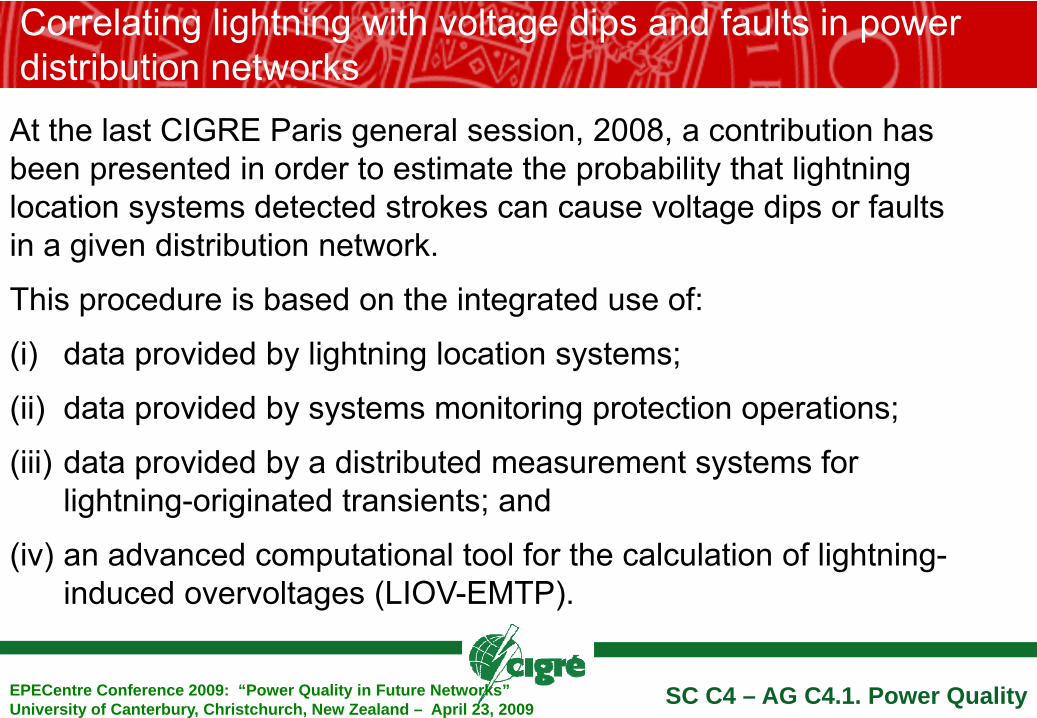
At the last CIGRE Paris general session, 2008, a contribution has been presented in order to estimate the probability that lightning location systems detected strokes can cause voltage dips or faults in a given distribution network.
This procedure is based on the integrated use of:
(i) data provided by lightning location systems;
(ii) data provided by systems monitoring protection operations;
(iii) data provided by a distributed measurement systems for lightning-originated transients; and
(iv) an advanced computational tool for the calculation of lightning-induced overvoltages (LIOV-EMTP).
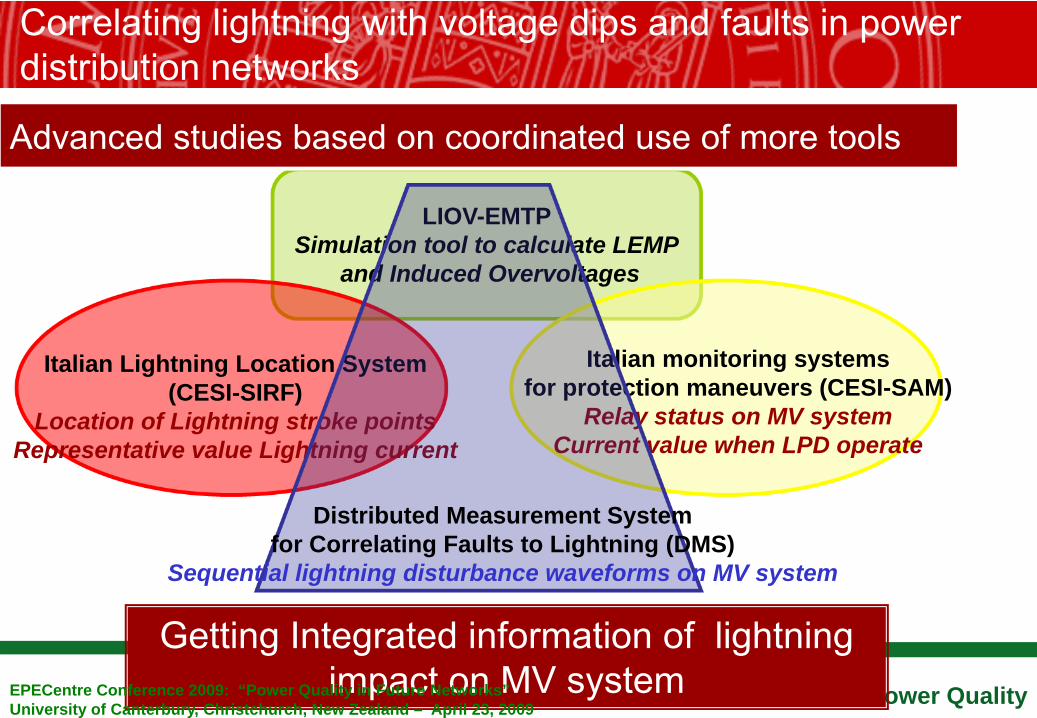
Correlating lightning with voltage dips and faults in power distribution networks
SC C4 – AG C4.1. Power Quality
LIOV-EMTPSimulation tool to calculate LEMP
and Induced Overvoltages
Italian Lightning Location System (CESI-SIRF)
Location of Lightning stroke pointsRepresentative value Lightning current
Italian monitoring systems for protection maneuvers (CESI-SAM)
Relay status on MV systemCurrent value when LPD operate
Distributed Measurement System for Correlating Faults to Lightning (DMS)
Sequential lightning disturbance waveforms on MV system
Getting Integrated information of lightning impact on MV system
Advanced studies based on coordinated use of more tools
EPECentre Conference 2009: “Power Quality in Future Networks” University of Canterbury, Christchurch, New Zealand – April 23, 2009
Correlating lightning with voltage dips and faults in power distribution networks
SC C4 – AG C4.1. Power Quality
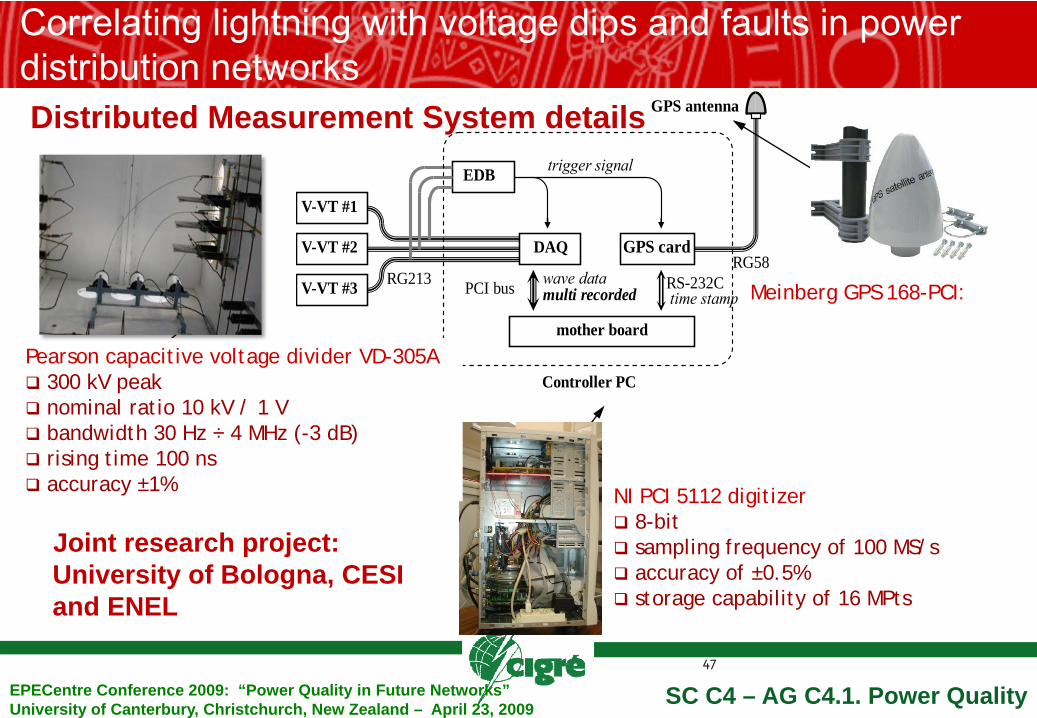
NI PCI 5112 digitizer8-bitsampling frequency of 100 MS/saccuracy of ±0.5%storage capability of 16 MPts
V-VT #1
V-VT #2
V-VT #3
EDB
Controller PC
RG213 wave data multi recorded
trigger signal
time stamp
GPS cardDAQ
PCI bus RS-232C
mother board
GPS antenna
RG58
47
Meinberg GPS 168-PCI:accuracy of ±250 ns
Pearson capacitive voltage divider VD-305A:300 kV peaknominal ratio 10 kV / 1 Vbandwidth 30 Hz ÷ 4 MHz (-3 dB)rising time 100 nsaccuracy ±1%
Distributed Measurement System details
EPECentre Conference 2009: “Power Quality in Future Networks” University of Canterbury, Christchurch, New Zealand – April 23, 2009
Joint research project: University of Bologna, CESI and ENEL
Correlating lightning with voltage dips and faults in power distribution networks
SC C4 – AG C4.1. Power Quality
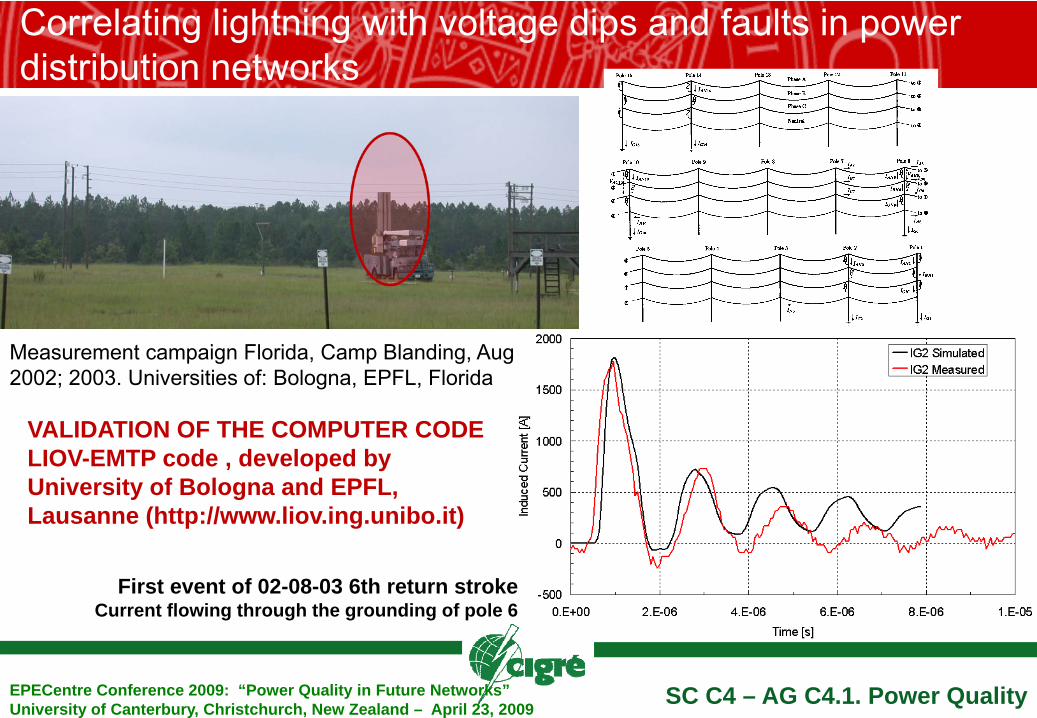
First event of 02-08-03 6th return strokeCurrent flowing through the grounding of pole 6
Measurement campaign Florida, Camp Blanding, Aug 2002; 2003. Universities of: Bologna, EPFL, Florida
VALIDATION OF THE COMPUTER CODE LIOV-EMTP code , developed by University of Bologna and EPFL, Lausanne (http://www.liov.ing.unibo.it)
EPECentre Conference 2009: “Power Quality in Future Networks” University of Canterbury, Christchurch, New Zealand – April 23, 2009
SC C4 – AG C4.1. Power QualityEPECentre Conference 2009: “Power Quality in Future Networks” University of Canterbury, Christchurch, New Zealand – April 23, 2009
Correlating lightning with voltage dips and faults in power distribution networksThe stroke location and the lightning current amplitude along with their uncertainty are inputs to the LIOV-EMTP program, which by means of appropriate integration of a Monte Carlo routine, provides the cumulative distribution of lightning-overvoltage amplitudes.
The problem is approached from a statistical perspective, because data from lightning location systems relevant to stroke locations and lightning current amplitudes are given with their error probability.
The procedure has been applied to collected data over a year by: (i) the monitoring system of protection manoeuvres (henceforth called CESI-SAM – ‘Sistema Acquisizione Manovre’) located at the substation “Ponterosso” (nearby San Vito al Tagliamento, North-Italy) and (b) the data provided by the Italian lightning location system, SIRF – ‘Sistema Italiano Rilevamento Fulmini’, within the 144 km2 area around the part of distribution network of interest. Both data are GPS synchronised.
SC C4 – AG C4.1. Power Quality
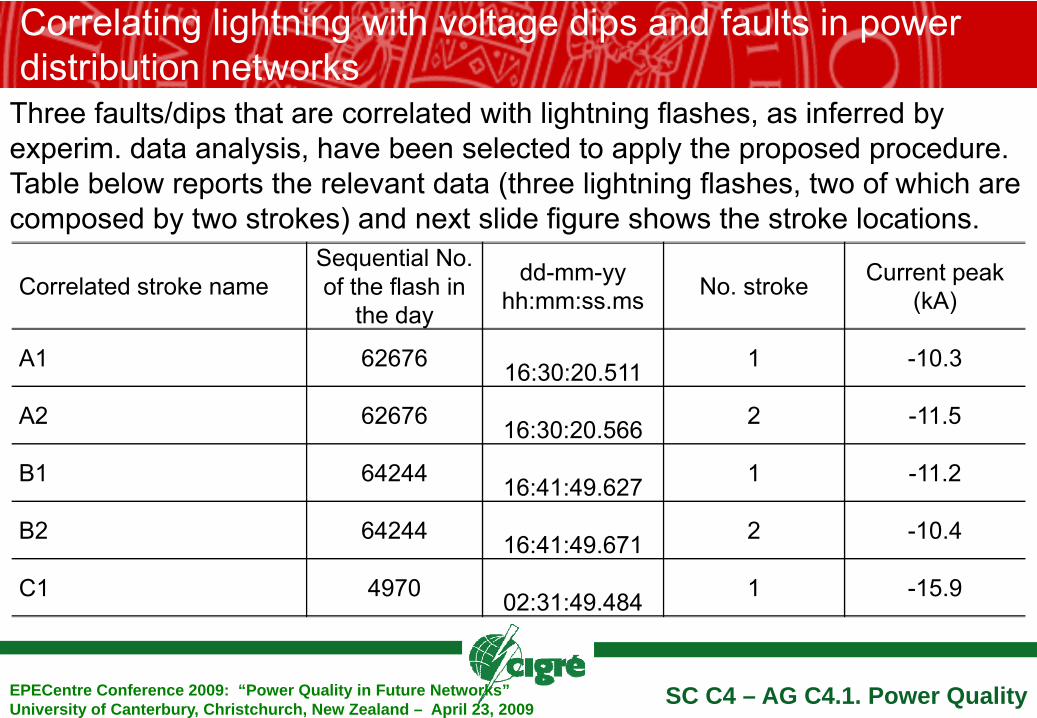
Correlated stroke nameSequential No. of the flash in
the day
dd-mm-yy hh:mm:ss.ms No. stroke Current peak
(kA)
A1 62676 16:30:20.511 1 -10.3
A2 62676 16:30:20.566 2 -11.5
B1 64244 16:41:49.627 1 -11.2
B2 64244 16:41:49.671 2 -10.4
C1 4970 02:31:49.484 1 -15.9
Correlating lightning with voltage dips and faults in power distribution networks
EPECentre Conference 2009: “Power Quality in Future Networks” University of Canterbury, Christchurch, New Zealand – April 23, 2009
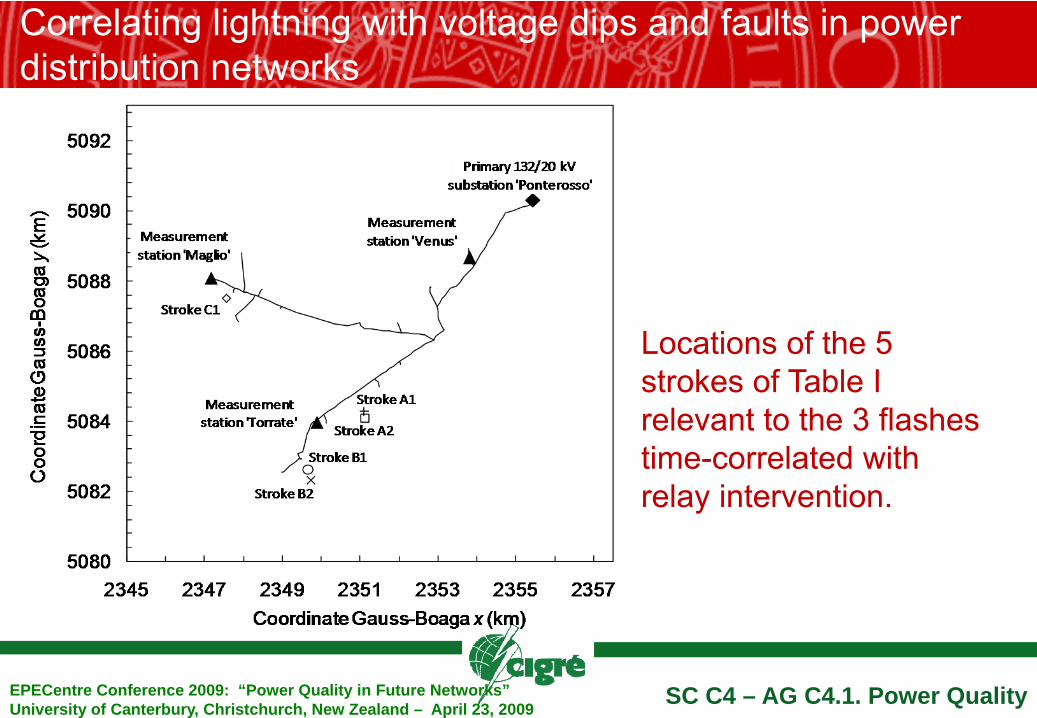
Three faults/dips that are correlated with lightning flashes, as inferred by experim. data analysis, have been selected to apply the proposed procedure. Table below reports the relevant data (three lightning flashes, two of which are composed by two strokes) and next slide figure shows the stroke locations.
SC C4 – AG C4.1. Power Quality
Correlating lightning with voltage dips and faults in power distribution networks
Locations of the 5 strokes of Table I relevant to the 3 flashes time-correlated with relay intervention.
EPECentre Conference 2009: “Power Quality in Future Networks” University of Canterbury, Christchurch, New Zealand – April 23, 2009
SC C4 – AG C4.1. Power QualityEPECentre Conference 2009: “Power Quality in Future Networks” University of Canterbury, Christchurch, New Zealand – April 23, 2009
Correlating lightning with voltage dips and faults in power distribution networks
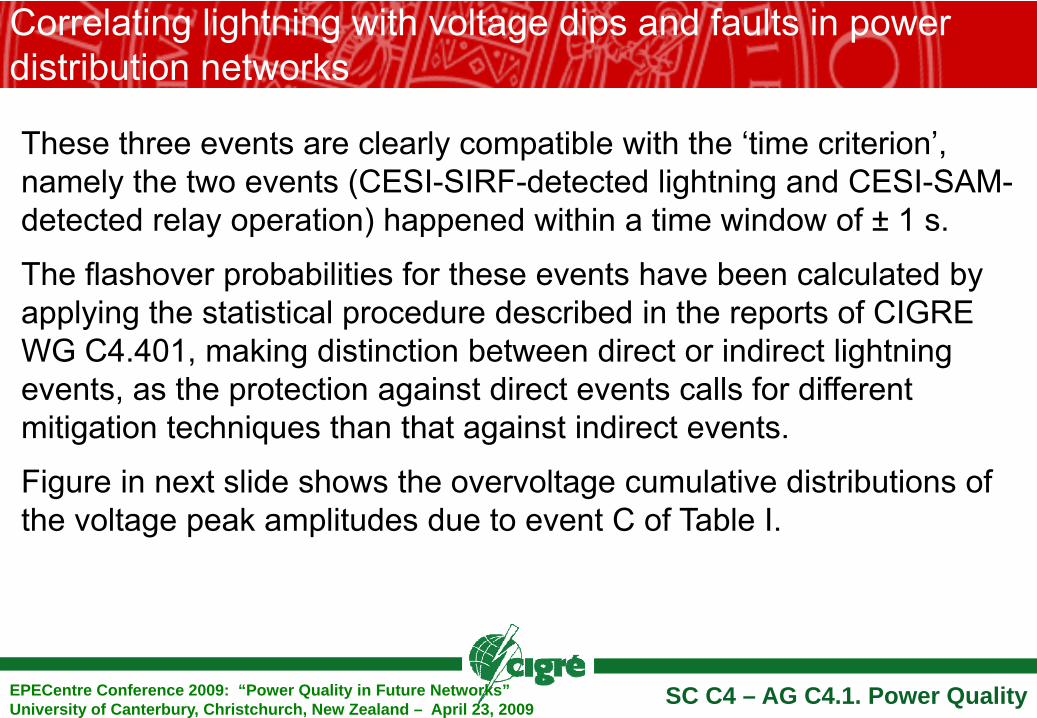
These three events are clearly compatible with the ‘time criterion’, namely the two events (CESI-SIRF-detected lightning and CESI-SAM-detected relay operation) happened within a time window of ± 1 s.
The flashover probabilities for these events have been calculated by applying the statistical procedure described in the reports of CIGRE WG C4.401, making distinction between direct or indirect lightning events, as the protection against direct events calls for different mitigation techniques than that against indirect events.
Figure in next slide shows the overvoltage cumulative distributions of the voltage peak amplitudes due to event C of Table I.
SC C4 – AG C4.1. Power Quality
Correlating lightning with voltage dips and faults in power distribution networks
0.001
0.01
0.1
1
0 50 100 150 200
Prob
abilit
y of
eve
nts
havi
ng a
mpl
itude
larg
er
than
abs
ciss
a
Voltage (kV)
Indirect events onlyDirect and indirect events
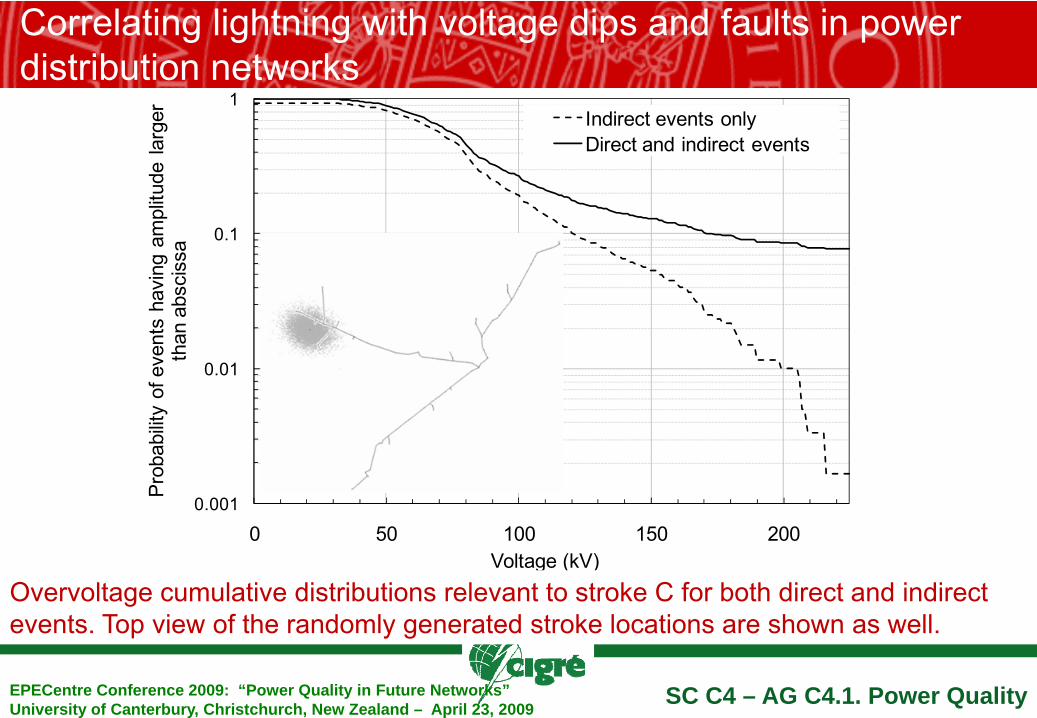
Overvoltage cumulative distributions relevant to stroke C for both direct and indirect events. Top view of the randomly generated stroke locations are shown as well.
EPECentre Conference 2009: “Power Quality in Future Networks” University of Canterbury, Christchurch, New Zealand – April 23, 2009
Outline of presentation1. Introduction2. Technical Performance Objectives, Measures and
Reporting – Voltage Dips, Flicker and Unbalance
3. Power Quality Contracting and Emission Assessment – Harmonics, Flicker and Unbalance
4. Voltage Dip Management – Correlating lightning with voltage dips and faults in power distribution networks
5. Economics6. Future Networks7. Conclusions
SC C4 – AG C4.1. Power QualityEPECentre Conference 2009: “Power Quality in Future Networks” University of Canterbury, Christchurch, New Zealand – April 23, 2009
SC C4 – AG C4.1. Power QualityEPECentre Conference 2009: “Power Quality in Future Networks” University of Canterbury, Christchurch, New Zealand – April 23, 2009
Economics
JWG C4.107 ” Economic Framework for Voltage Quality” has been tasked to develop a framework for the economics of power quality.
The JWG aims in 2009 to produce a report that summarizes available information about cost-benefit analysis of power quality - proposing a framework on how to assess: (i) costs; (ii) the economic impact of mitigation, and (iii) the economic impact of immunity.
Outline of presentation1. Introduction2. Technical Performance Objectives, Measures and
Reporting – Voltage Dips, Flicker and Unbalance
3. Power Quality Contracting and Emission Assessment – Harmonics, Flicker and Unbalance
4. Voltage Dip Management – Correlating lightning with voltage dips and faults in power distribution networks
5. Economics6. Future Networks7. Conclusions
SC C4 – AG C4.1. Power QualityEPECentre Conference 2009: “Power Quality in Future Networks” University of Canterbury, Christchurch, New Zealand – April 23, 2009
SC C4 – AG C4.1. Power QualityEPECentre Conference 2009: “Power Quality in Future Networks” University of Canterbury, Christchurch, New Zealand – April 23, 2009
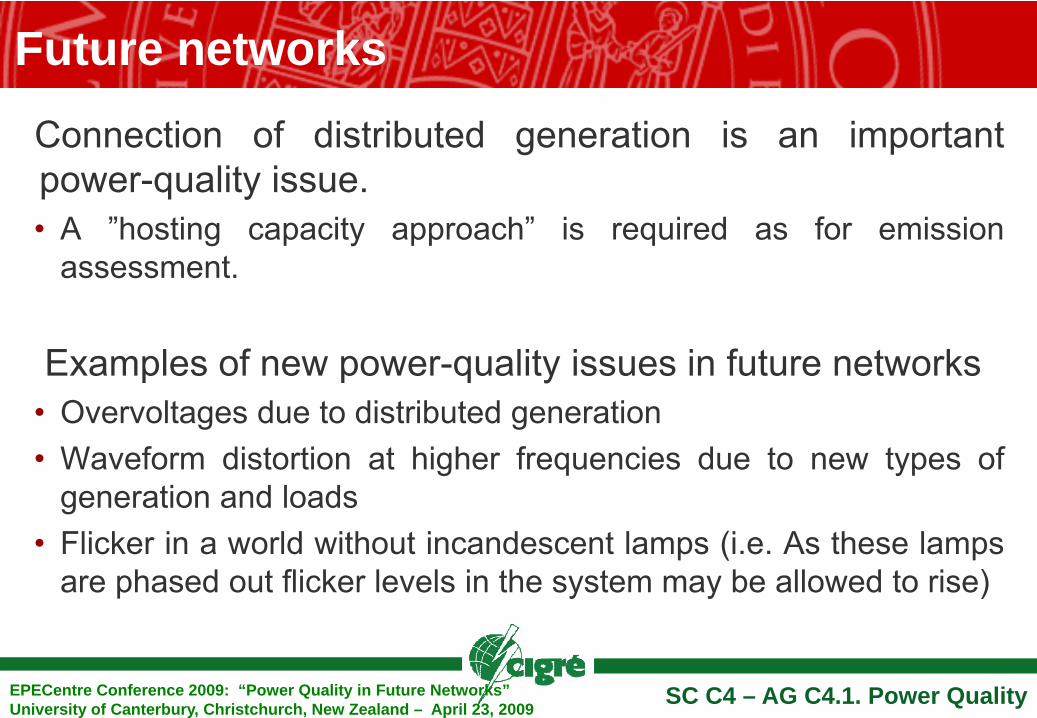
Future networksConnection of distributed generation is an importantpower-quality issue.• A ”hosting capacity approach” is required as for emission
assessment.
Examples of new power-quality issues in future networks• Overvoltages due to distributed generation• Waveform distortion at higher frequencies due to new types of
generation and loads• Flicker in a world without incandescent lamps (i.e. As these lamps
are phased out flicker levels in the system may be allowed to rise)

Outline of presentation1. Introduction2. Technical Performance Objectives, Measures and
Reporting – Voltage Dips, Flicker and Unbalance
3. Power Quality Contracting and Emission Assessment – Harmonics, Flicker and Unbalance
4. Voltage Dip Management – Correlating lightning with voltage dips and faults in power distribution networks
5. Economics6. Future Networks7. Conclusions
SC C4 – AG C4.1. Power QualityEPECentre Conference 2009: “Power Quality in Future Networks” University of Canterbury, Christchurch, New Zealand – April 23, 2009
SC C4 – AG C4.1. Power QualityEPECentre Conference 2009: “Power Quality in Future Networks” University of Canterbury, Christchurch, New Zealand – April 23, 2009
ConclusionsStudy Committee C4 (System Technical Performance) is currently addressing a wide variety of power quality aspects. In so doing, some significant progress is being made in establishing a common international view on how to address these various aspects.
This work will continue to support initiatives related to:
• International standardization,
• The regulation of power quality by Regulators; and importantly,
• Enhancing the compatibility between power systems and the equipment and processes operated by installations connected to these systems.
Given the changing nature of future networks, some significant work still needs to be undertaken in the future.
SC C4 – AG C4.1. Power QualityEPECentre Conference 2009: “Power Quality in Future Networks” University of Canterbury, Christchurch, New Zealand – April 23, 2009
Final remark
Those interested in further information or in contributing to the working group activities of SC C4 are encouraged to contact the
authors of this paper.