Listeria monocytogenes InlP interacts with afadin and facilitates basement membrane crossing

Development/Plasticity/Repair
Afadin, A Ras/Rap Effector That Controls CadherinFunction, Promotes Spine and Excitatory Synapse Densityin the Hippocampus
Gerard M. J. Beaudoin III,1 Claude M. Schofield,2* Tulip Nuwal,3* Keling Zang,1 Erik M. Ullian,1,2† Bo Huang,3†
and Louis F. Reichardt1,4
Departments of 1Physiology, 2Opthamology, 3Pharmaceutical Chemistry, and 4Biochemistry and Biophysics, University of California, San Francisco, SanFrancisco, California 94158
Many molecules regulate synaptogenesis, but intracellular signaling pathways required for their functions are poorly understood. Afadinis a Rap-regulated, actin-binding protein that promotes cadherin complex assembly as well as binding many other cell adhesion mole-cules and receptors. To examine its role in mediating synaptogenesis, we deleted afadin (mllt1), using a conditional allele, in postmitotichippocampal neurons. Consistent with its role in promoting cadherin recruitment, afadin deletion resulted in 70% fewer and less intenseN-cadherin puncta with similar reductions of �-catenin and �N-catenin puncta densities and 35% reduction in EphB2 puncta density. Itsabsence also resulted in 40% decreases in spine and excitatory synapse densities in the stratum radiatum of CA1, as determined bymorphology, apposition of presynaptic and postsynaptic markers, and synaptic transmission. The remaining synapses appeared tofunction normally. Thus, afadin is a key intracellular signaling molecule for cadherin recruitment and is necessary for spine and synapseformation in vivo.
IntroductionSynapses are formed at contacts between neurons as a result ofintercellular interactions that result in stepwise assembly of syn-aptic constituents (Waites et al., 2005; Jin and Garner, 2008).Adhesive interactions are early key events in synaptogenesis andappear to be required for synapse formation. Consistent withthis, expression of several different cell adhesion molecules inheterologous cells can induce presynaptic or postsynaptic devel-opment in apposed neurons. Probably because of redundancy,however, in vertebrates genetic deletion of single adhesion mol-ecules appear to have comparatively minor effects on synapsenumber in vivo.
Cadherins are a family of adhesion molecules that regulatemany steps in neural development, including neurogenesis, neu-ronal migration, and spine and synapse formation (Takeichi,
2007). In Drosophila, absence of N-cadherin prevents normalsynapse formation between photoreceptor axons and their tar-gets (Clandinin and Feldheim, 2009). Probably because verte-brate neurons express multiple cadherins, the absence of singlecadherins does not have dramatic effects on synapse formation(Takeichi, 2007).
In epithelial cells, cadherin localization and activation arestrongly promoted by a family of Ig superfamily proteins namednectins (Takai et al., 2008). The nectins associate with the cad-herin complex through the adaptor protein afadin, which bindsnectins and two cadherin-associated proteins, p120 – catenin and�-catenin. Afadin provides an essential link between nectins andthe cadherin complex and promotes cadherin clustering and ac-tivity, thereby regulating adherens junction formation and stabil-ity. Both in vitro and in vivo observations indicate that absence ofafadin impairs cadherin functions (Takai et al., 2008). Impor-tantly, the PDZ domain of afadin binds several EphB receptorsand neurexins, which each promote synapse formation in vitro(Hock et al., 1998; Buchert et al., 1999; Dalva et al., 2007). Thus,afadin may promote synapse formation through promoting as-sociation of cadherins with several proteins implicated in synapseformation.
Conventional afadin mutants die at E10 with deficits in epi-thelial cell adhesion and polarity (Ikeda et al., 1999; Zhadanov etal., 1999). Thus, we generated a conditional allele of afadin tocharacterize its roles in the nervous system. By limiting deletionof afadin to excitatory neurons, we were able to characterize thefunction of this gene in neuronal differentiation. Results demon-strate that the absence of afadin results in a striking reduction inexcitatory synaptic density without obvious effects on the mor-
Received Sept. 7, 2011; revised Oct. 16, 2011; accepted Oct. 19, 2011.Author contributions: G.M.J.B., T.N., E.M.U., B.H., and L.F.R. designed research; G.M.J.B., C.M.S., T.N., and K.Z.
performed research; G.M.J.B., C.M.S., T.N., E.M.U., B.H., and L.F.R. analyzed data; G.M.J.B., B.H., and L.F.R. wrote thepaper.
This work was supported by That Man May See (E.M.U.), National Institutes of Health Grant F32-MH079661(G.M.J.B.), the University of California, San Francisco Program for Breakthrough Biomedical Research, Searle Schol-arship, and Packard Fellowship (B.H.), and the Simons Foundation (E.M.U., L.F.R.). We thank the Reichardt labora-tory members for discussions, J. A. Mercer, M. Wheelock, and K. A. Nave for reagents, and the Developmental StudiesHybridoma Bank for NCAT2 and E7 hybridomas.
The authors declare no competing financial interests.*C.M.S. and T.N. contributed equally to this work.†E.M.U. and B.H. contributed equally to this work.Correspondence should be addressed to Louis F. Reichardt, Department of Physiology, University of California,
San Francisco, San Francisco, CA 94158. E-mail: [email protected]. M. J. Beaudoin’s present address: Neurosciences Institute, University of Texas, San Antonio, TX 78249.DOI:10.1523/JNEUROSCI.4565-11.2012
Copyright © 2012 the authors 0270-6474/12/320099-12$15.00/0
The Journal of Neuroscience, January 4, 2012 • 32(1):99 –110 • 99

phology or function of the remaining synapses in CA1. Absenceof afadin reduces the density and intensity of cadherin- andcatenin-containing puncta without reducing overall cadherin orcatenin levels. Additionally, loss of afadin caused a reduction inEphB2 puncta density consistent with the loss of synapses. Thus,afadin is a key regulator of excitatory synapse number in vivo andmay control synapse density, in part, through regulating cadherinlocalization.
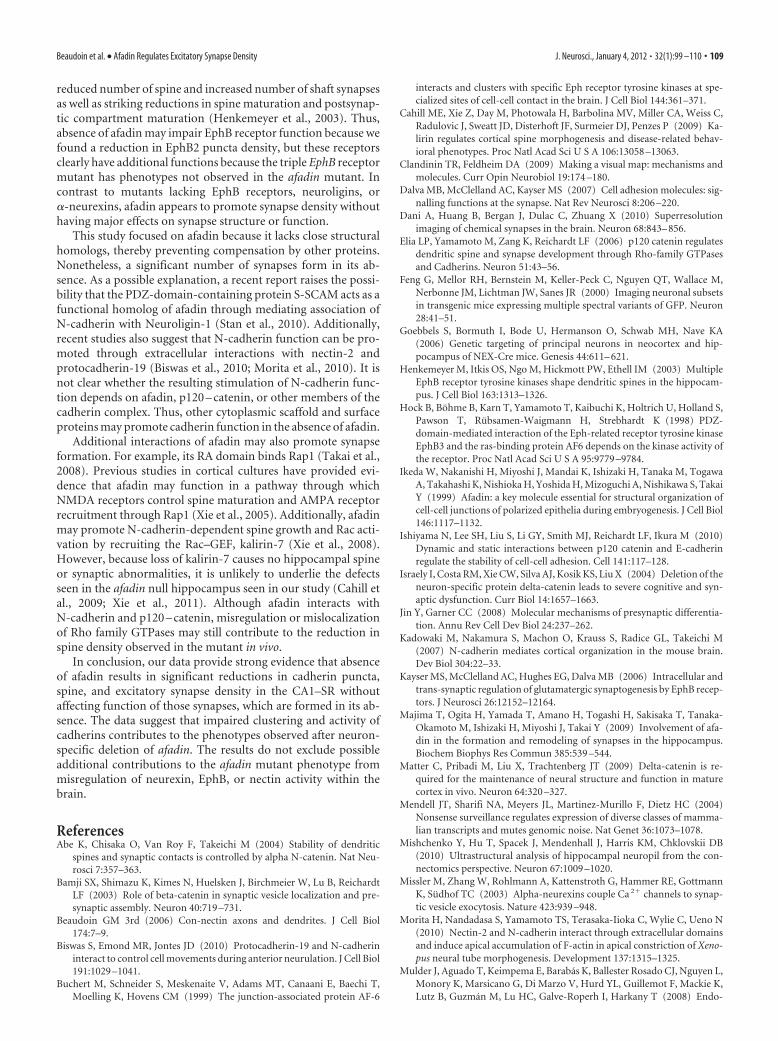
Materials and MethodsGeneration of Nex– cre; afadin floxed mice. A 13.5 kb HindIII fragmentwas retrieved from an SVJ129 bacterial artificial chromosome by gaprepair of pCRII–topo vector containing two 500 bp fragments homolo-gous to the 5� and 3� ends of the retrieved fragment. The 5� loxP site anda HindIII site was incorporated upstream of exon two by PCR and clonedupstream of an enhanced flippase recombinase (flpE) site flanked phos-phoglycerate-kinase–Neomycin (PGK–Neo) with a 3� loxP site (Fig. 1).The 5� homology arm was cloned as a XmnI–EcoRI fragment upstreamof the lone 5� loxP site. The 3� homology arm was cloned as an XbaI–ApaIfragment next to a PGK– diphtheria toxin A (dtA) expression cassette.The 5� homology arm, floxed exon 2, and PGK–Neo cassette was clonedinto the vector containing the 3� homology arm and PGK– dtA cassetteby selecting for ampicillin and kanamycin resistance. The resulting plas-mid was linearized upstream of the 5� homology arm and electroporated
into the feederless mouse embryonic stem cell line, E14. After severaldays, transfected cells were selected by treatment with G418. Isolatedcolonies were selected, expanded, and screened by Southern blottingHindIII-digested genomic DNA. Two clones were expanded and re-screened before injection into C57BL/6J. Both ES cell lines were incor-porated in the germ line and produced fertile, chimeric males. Southernblotting HindIII-digested genomic DNA was used to confirm homolo-gous recombination of the afadin locus in mice. Genotyping of the Neoline used a 5� primer specific to the wild-type (WT) locus (primer 1,5�-CCT TGG GAA CAA CAG GAC ACC-3�), a 5� primer that anneals inthe Neo cassette (primer 3, 5�-TTG CGG AAC CCT TCG AAG TTC-3�),and a common 3� primer that anneals in the WT locus (primer 2, 5�-TCAGTA CAG GGG AAC ACC AGG G-3�). Primers 1 and 2 detect the WTallele and produce a 188 bp band by PCR. Primers 2 and 3 detect thetargeted locus and produce a 296 bp fragment by PCR. To generate theflox allele, the Neo mice were crossed to �-actin–flp recombinase mice toremove the Neo cassette (Rodríguez et al., 2000). Genotyping for the floxallele used primers 1 and 2, which anneal in the WT genomic DNA but whichnow produces a 315 bp band by PCR. Loss of the Neo expression cassette wasconfirmed by PCR, by showing a lack of product with primers 2 and 3 and aband of the correct size with primers 1 and 2. Nex–cre; afadinF/F mutantswere generated by mating with Nex–cre mice (Goebbels et al., 2006).
Western blotting. Hippocampi were dissected, placed in microcentri-fuge tubes, frozen in a dry ice and ethanol slurry, and stored at �80°C
Figure 1. Creation of a conditional null allele of afadin (mllt-4 ). A, Schematics from top to bottom of the WT allele, Targeting construct, Neo allele, and flox allele. The WT allele is a schematic ofthe WT afadin (mllt-4 ) genomic allele depicting exons 2–5 and important restriction enzyme recognition sites. The targeting construct shows the location of the inserted loxP sites (gray triangles),flpE sites (white triangles), PGK–Neo, and PGK– dtA. The Neo allele depicts the afadin locus after homologous recombination with the targeting construct. The locations of the loxP and Flp sites andPGK–Neo cassette are shown. The flox allele depicts the afadin locus after Flp recombinase-mediated excision of the PGK–Neo cassette. The location of the 5�and 3�probes used for Southern blottingand the primers used for PCR genotyping are depicted on all relevant alleles. H3, HindIII; Xm, XmnI; RI, EcoRI; Xh, XhoI; A, ApaI. B, Southern blots using the 5� and 3� probes demonstrate homologousrecombination of the targeting construct into the genome. HindIII digestion of the WT allele (�) results in a 13.5 kb fragment recognized by either the 5� or 3� probes, whereas the Neo allele (N)digested with HindIII results in a 4.5 kb fragment recognized by the 5� probe and a 8 kb fragment by the 3� probe. C, PCR-based genotyping of the Neo allele (N, 296 bp) compared with the WT allele(�, 188 bp), using primers 1, 2, and 3. D, PCR-based genotyping of the flox allele (F, 315 bp) compared with the WT allele (�, 188 bp), using only primers 1 and 2. E, Western blot quantificationof l/s-afadin protein expression in WT and homozygous Neo mice (Neo/Neo) demonstrated no significant change in Neo allele homozygotes normalized to total protein expression. Error bars depictSD; n � 3 littermate controls and mutants.
100 • J. Neurosci., January 4, 2012 • 32(1):99 –110 Beaudoin et al. • Afadin Regulates Excitatory Synapse Density

until later use. Frozen tissue was homogenized with an Ultra-Turrax T25disperser (IKA Works) in a modified RIPA buffer [150 mM sodium chlo-ride, 50 mM Tris, pH 7.5, 10% glycerol, 0.1% SDS, 0.5% sodium deoxy-cholate, 1% Triton X-100, 1 mM EDTA, and 1 mM EGTA with additionon the day of use: 1 mM sodium orthovanadate, 10 mM sodium fluoride,and Complete Protease Inhibitor Cocktail (Roche Applied Science) andaddition of 1 mM PMSF just before homogenization]. The tissue was fullysolubilized because centrifuging for 15 min at 15,000 rpm yielded novisible pellet. Protein concentration was quantified by use of a proteinassay kit (MicroBCA protein assay kit; Pierce) following the instructionsof the manufacturer. A total of 22.5 �g of each protein lysate was frac-tionated by SDS-PAGE and transferred to nitrocellulose membrane. Themembrane was stained for total protein using SyPro Ruby protein blotstain (Lonza Rockland) according to a manufacturer-provided protocoland imaged using a fluorescent imager (FLA-2000; Fujifilm). The follow-ing primary antibodies were used: mouse anti-AF6 (anti-afadin) (1:500;BD Biosciences Transduction Laboratories), rabbit anti-pan-Cadherin(1:1000; Sigma), mouse anti-N-Cadherin (1:100; 13A9 cell supernatantkindly provided by Margaret Wheelock), mouse anti-�-catenin (1:1000;Zymed Laboratories), mouse anti-p120 (1:4000; BD Biosciences Trans-duction Laboratories), rat anti-�N-catenin (1:1000; DevelopmentalStudies Hybridoma Bank), mouse anti-�-tubulin (mABE7) (1:1000;Developmental Studies Hybridoma Bank), goat anti-nectin-1 (1:1000;Santa Cruz Biotechnology), rabbit anti-nectin-3 (1:300; Santa Cruz Bio-technology), and rabbit anti-EphB2 (1:100; Dr. Iryna Ethell, Universityof California, Riverside, Riverside, CA). Species-specific secondary anti-bodies tagged with alkaline phosphatase (Jackson ImmunoResearch)were used to detect primary antibodies. The blots were developed withECF (Invitrogen) according to the guidelines of the manufacturer andimaged with a fluorescent imager (FLA-2000; Fujifilm). For Westernblotting EphB2, a horseradish-peroxidase-linked anti-rabbit secondarywas used with ECL (GE Healthcare) and exposed to film. The film wasscanned and analyzed. All quantifications were done in ImageGuage (Fu-jifilm), and analysis was done with Microsoft Excel.
Fluorescence and immunofluorescence. Animals were perfused intracar-dially in succession with PBS and 4% paraformaldehyde in PBS. Thedissected brains were postfixed for 2 h and for immunofluorescenceprocedures cryopreserved in a series of 10%, 20%, and 30% sucrose inPBS. The brains were trimmed for coronal sectioning, mixed with OCTcompound (TissueTek) for several hours to overnight, and frozen on dryice. Brains were cut into 20 �m sections with a cryostat (Jung Frigocut2800N; Leica Microsystems), collected serially onto glass slides, andstored at �80°C. A selection of slides from each brain was Nissl stainedwith cresyl violet to match slides between animals along the rostrocaudalaxis of the hippocampus. Blocking buffer (5% normal donkey or goatserum, 0.2% Triton X-100 in PBS) was used throughout the stainingprocedure. The following primary antibodies were applied overnight:rabbit anti-l/s-afadin (1:1000; Sigma), goat anti-N-cadherin (1:100;Santa Cruz Biotechnology), mouse anti-�-catenin (1:1000; Zymed Lab-oratories), rat anti-�N-catenin (1:100; Developmental Studies Hybrid-oma Bank), rabbit anti-nectin-1 (1:100; Santa Cruz Biotechnology), goatanti-nectin-3 (1:100; Santa Cruz Biotechnology), or rabbit anti-EphB2(1:100; Dr. Iryna Ethell). Sections were washed in blocking buffer,stained with secondary antibodies made in donkey or goat (Invitrogen),again washed in blocking buffer, and then stained with Sytox Blue (1:1000; Invitrogen) in PBS for 15 min. All images were taken with anLSM-Pascal (Carl Zeiss) using a 40� Plan-Apochromat, 63� Plan-Apochromat, or a 100� Plan-Apochromat objective. Image analysis andquantification were performed in NIH ImageJ, with results prepared inMicrosoft Excel, and figures were assembled in Adobe Photoshop(Abode Systems). Puncta analysis was based on finding local maxima,using the “Find Maxima…” function, rather than setting an absolutethreshold, thereby allowing for comparison of integrated density. Specif-ically, we used the “Maxima Within Tolerance” setting with the samenoise level, chosen to prevent fusing multiple puncta together, applied toall images. Finally, this thresholded image was used to mask the originalimage, and this masked image was analyzed with the “Analyze Parti-cles…” function by setting a threshold of 1. For images with significantpuncta density, we set a threshold at the average peak fluorescence value,
with the same setting used for all images, and used the “Find Maxima…”function with “Segmented Particles” setting above the threshold.
Details of the Scholl analysis are listed below (see Golgi staining). Fordendritic branching analysis, a Nex– cre; afadinF/F mouse was crossed to aThy1–YFP line H; afadinF/F mouse to produce mutants and controlscarrying the Thy–YFP transgene (Feng et al., 2000). Pyramidal cells of thehippocampus usually extend an apical branch through the stratum ra-diatum (SR) bifurcating once before reaching the stratum lacunosum-moleculare (SLM). Semaphorin 3A was shown to regulate dendriticbranching through examination of this bifurcation of the apical branch,using the marker line Thy1–YFP (Schlomann et al., 2009). Animals wereperfused as listed above, but after postfixing, the brains were transferredto PBS with 0.02% sodium azide and stored in the dark at 4°C untilsectioned. The brains were sectioned sagittally at 150 �m with a vi-bratome (VT-1000; Leica Microsystems). A few medial sections weredehydrated in a series of increasing ethanol concentration (50, 70, 95,100, and100%) and cleared with dropwise addition of methylsalicylateuntil the ethanol evaporated. The endogenous GFP fluorescence in thesections was imaged through the full thickness of the tissue with an LSMPascal using a 40� Plan-Apochromat objective. Using NIH ImageJ, theposition of the first branch point of the apical dendrite within the SR wasmeasured relative to the thickness of the SR at that point. To aid inidentification of this branch point in the z-stack, the z-stack was depthcoded by color and then maximally z-projected for either the entire stackor several sections of the stack at a time. The results were averaged andcompared using Microsoft Excel.
For stochastic optical reconstruction microscopy (STORM), sectionswere subjected to heat-induced antigen retrieval: 10 min in pH 6.25, 10mM sodium citrate at 90 –94°C. Sections were blocked and incubatedovernight with mouse anti-bassoon (1:200; Assay Designs), rabbit anti-glutamate receptor 1 (1:200; Millipore Bioscience Research Reagents),and rabbit anti-glutamate receptor 2 (1:200; Millipore Bioscience Re-search Reagents) in 3% BSA and 0.1% Triton X-100 in PBS. Sectionswere washed and incubated in donkey anti-mouse dual labeled withAlexa Fluor 405 and Alexa Fluor 647 and donkey anti-rabbit dual-labeledwith Cy3 and Alexa Fluor 647 (unlabeled secondary antibody from Jack-son ImmunoResearch).
STORM image acquisition and analysis. All sections were mounted inbuffer containing PBS, 1 M mercaptoethylamine, pH 8.5, 50% glucose inMilliQ water and oxygen scavenging solution (10 mg of glucose oxidase,25 �l of catalase in 100 �l of PBS) in the ratio of 80:10:10:1. STORMsetup and image acquisition were similar to previous descriptions (Daniet al., 2010), but only two-dimensional imaging was performed. Briefly,images were acquired using a STORM microscope built from a NikonEclipse Ti-E inverted microscope with a perfect-focusing system. Themicroscope was fitted with two activation lasers (405 nm, Stradus 405,Vortran; 561 nm, Sapphire 561-200-CW, Coherent) and one imaginglaser (642 nm, Stradus 642; Vortran). The laser beams were aligned, andthe expanded, collimated beams were focused at the back focal planeof the 100� Plan Apo VC NA 1.4 objective (Nikon). A quad-passdichroic (ZT405/488/561/640RPC; Chroma Technology) and a band-pass filter (ET705/70m; Chroma Technology) separated the emissionfrom excitation light. Images were recorded with an EMCCD camera(Ixon DU897E-CS0-BV; Andor).
The region of interest was identified by observing the slide at lowmagnification (using a 10� objective) and under dark-field mode. Two-color STORM data were acquired after switching to 100� objective andthen performing imaging at 60 Hz with one frame of illumination withactivation lasers (405 nm for Alexa Fluor 405– 647 or 561 nm for Cy3–Alexa Fluor 647) alternating with three frames of illumination with im-aging laser (642 nm) (Dani et al., 2010). The focus on the slide wasdetermined, and the out-of-focus signal was reduced by illuminatingwith imaging laser (642 nm) and deactivating the fluorophores in thesamples above and below the focal plane. STORM movie of 40,000 –50,000 frames was acquired at constant powers for activation (1–5 �W)and imaging laser (30 mW).
STORM analysis was performed using custom software. Two-colorimaging, correction to the sample drift in the lateral direction during acqui-sition, and subtraction of the crosstalk between the two imaging channels
Beaudoin et al. • Afadin Regulates Excitatory Synapse Density J. Neurosci., January 4, 2012 • 32(1):99 –110 • 101

were done using algorithms described previously(Dani et al., 2010). The high-resolution imageswere exported as pictures with 50-nm-sized pix-els by counting the number of localization pointsin each pixel and were further analyzed by acustom-written macro in NIH ImageJ, entitled“Synaptic Co-Localization-STORM.” The macroidentifies and analyzes synapses by finding ap-posing presynaptic and postsynaptic puncta ofsufficient size and signal intensity, automati-cally and objectively processing all images withthe same settings. The macro is to be submittedto the NIH ImageJ website simultaneously withpublication.
Golgi staining. Golgi staining was performedusing a rapid Golgi-Cox kit (FD Neurotech-nologies) on freshly dissected brain trimmed toinclude only the forebrain. The protocol wasfollowed in detail, although the following spe-cifics are lacking from the protocol. The tissuewas incubated in solution AB for 2 weeks. Thetissue was embedded in Tissue Freezing Me-dium (Triangle Biomedical Sciences) and fro-zen in a bath of dry ice and isopentane. Thetissue was sectioned into 100 �m sections in acryostat at �22°C. The sections were dried for3– 4 d after sectioning. The sections were pro-tected from light during all stages of the proce-dure. For counting spines, the sections wereimaged with a Carl Zeiss Axiovert 200M using a63� LCI Plan-Neofluar objective in glycerolmode, using a 1.6� optovar, and images werecollected as a z-stack using Slidebook software(Intelligent Imaging Innovations). For in-creased resolution, images were collected us-ing a Nikon E600 with a 60� Plan-Apo water-immersion objective by aCarl Zeiss AxioCam HRc and Axiovision software.
For Scholl analysis, the full thickness of the Golgi-stained section wasimaged by confocal reflectance using an LSM Pascal with a 20� Plan-NeoFluar objective. In brief, the confocal was set to illuminate the sectionwith the 458 nm laser line, which gives the best z-resolution, and tocollect the same wavelength. The resulting z-stack was analyzed in Imaris(Bitplane) to trace apical dendrites of individual pyramidal neurons andto compute the Scholl analysis in three dimensions. Microsoft Excel wasused for collating and analyzing the results.
Electron microscopy. Mice were perfused transcardially with 0.9% so-dium chloride, followed by fixative (2.5% glutaraldehyde and 1% para-formaldehyde in 0.1 M cacodylate buffer, pH 7.4). Brains were postfixedovernight and cut into thick 100 �m sections with a vibratome. Sectionswere trimmed to include CA1, CA3, and the dentate gyrus to allow foridentification of a similar region in the electron microscope. The sectionswere dehydrated, fixed in osmium tetroxide, and embedded in Epon-Araldite. Semithin sections were cut and stained with toluidine blue toensure proper orientation of the tissue block. Ultrathin sections were cutand stained with lead citrate and uranyl acetate. Sections were imagedand photographed using the electron microscope core in the Universityof California, San Francisco Department of Anatomy. Specifically, im-ages were taken at random within CA1–SR dorsal to the dentate gyrus,approximately two times the thickness of the stratum pyramidal (SP)from the SP. Eight films, corresponding to 512 �m 2, were scanned andfurther analyzed in NIH ImageJ. Specifically, synapses were identified byapposition of a postsynaptic density (PSD) and a presynaptic boutonwith at least four synaptic vesicles. At least 110 synapses were identified ineach animal. Shaft synapses were distinguished by the presence of micro-tubules and as appearing on a large-diameter fiber. The PSD was directlymeasured on all identified synapses. The bouton was outlined and mea-sured as the region of the enlarged axon with synaptic vesicles and cyto-plasmic material with limited microtubules. Bouton analysis was done
using the synapses from four micrographs and at least 50 synapses peranimal.
Electrophysiology. Transverse hippocampal slices were prepared fromcontrol and mutant littermate mice of either sex, 5–7 weeks of age. Ani-mals were anesthetized with isoflurane, and the whole brain was removedand transferred into ice-cold cutting solution containing the following(in mM): 75 sucrose, 87 NaCl, 25 glucose, 25 NaHCO3, 2.5 KCl, 1.25NaH2PO4, 7 MgCl2, and 0.5 CaCl2 (equilibrated with 95% O2/5% CO2).The brain was glued onto the stage of a vibratome slicer, and 450 �mslices were cut and then allowed to recover for at least 1 h at 34°C in anincubation chamber with artificial CSF (ACSF) containing the following(in mM): 125 NaCl, 25 NaHCO3, 2.5 KCl, 1.25 NaH2PO4, 1 MgCl2, 2CaCl2, and 25 glucose (equilibrated with 95% O2/5% CO2). Recordingswere performed in a submerged bath recording chamber continuouslysuperfused with ACSF at a flow rate of 2 ml/min at 32–34°C using aMultiClamp 700A amplifier (Molecular Devices) and pClamp acquisi-tion software. Field EPSPs (fEPSPs) were evoked with a bipolar platinumstimulating electrode (FHC) placed to stimulate Schaffer collateral affer-ents and were detected using glass electrodes filled with 2 M NaCl placedin the CA1 SR �50 –100 �m away from the stimulation site. fEPSPs wereevoked with electrical pulses of duration 100 �s and amplitude 15–70 �Adelivered at intersweep intervals of 0.067 Hz. Data were acquired at 10kHz using pClamp 10.2 (Molecular Devices), filtered at 2 kHz, and ana-lyzed using Clampfit software (Molecular Devices).
ResultsConditional loss of afadin in hippocampal pyramidal neuronsTo address the role of afadin in neuronal morphogenesis andsynaptogenesis, we generated a conditional allele of afadin(mllt-4) in which loxP sites surround exon 2 (Fig. 1A,B). Cre-mediated deletion of exon 2 results in a frame shift and prematurestop codon within exon 3 that should result in mRNA destabili-zation (Mendell et al., 2004). Additionally, exon 2 encodes part of
Figure 2. Afadin expression is reduced in the hippocampus after Nex– cre-mediated deletion. A, Western blots for afadin incontrol (Con) and mutant (Mut) hippocampal lysates demonstrate a significant loss of both the long and short afadin isoforms.Molecular weights are listed in kilodaltons. B, Quantification of afadin protein blots in mutant (Mut) versus control (Con). Individualblots were normalized to total protein. Error bars depict SEM; *p � 0.0001; n � 6. C, D, Decreased afadin expression in mutant (D)versus control (C) demonstrated by immunocytochemical visualization of l/s-afadin (red) and nuclei (blue) in CA1–SR and CA1–SP.Scale bar, 25 �m.
102 • J. Neurosci., January 4, 2012 • 32(1):99 –110 Beaudoin et al. • Afadin Regulates Excitatory Synapse Density

Figure 3. Loss of afadin results in reduced N-cadherin puncta density without a change in total expression of cadherin, catenins, nectins, or EphB2. A, B, Visualization of N-cadherin in control (A)and mutant (B). C–E, Significant reduction in N-cadherin puncta density (C) and integrated density (F ) in mutant (M) versus control (C). No significant difference was detected in puncta size, asdetermined by average area (D). In C–E, *p � 0.005, n � 3 littermate controls and mutants. F, G, Visualization of �-catenin in control (F ) and mutant (G). H–J, Significant reduction in �-cateninpuncta density (H ), puncta area (I ), and integrated density (J ) in mutant (M) versus control (C). In H–J, *p � 0.02. K, L, Visualization of �N-catenin in control (K ) and mutant (L). M–O, Significantreduction in �N-catenin puncta density (M ) in mutant (M) versus control (C). No significant differences were detected in puncta size (N ) or integrated density (O). In M, *p � 0.05. In H–J and M–O,n � 4 littermate controls and mutants. P, Protein blot analyses of cadherin and catenin expression in hippocampal lysates from control (C) and mutant (M) demonstrated no significant changes.Shown are representative lanes from blots using anti-pan-cadherin (Pan-Cad), anti-N-cadherin (N-Cad), anti-�N-catenin (�N-Cat), anti-�-catenin (�-Cat), and anti-p120 – catenin. Q, Quantifi-cation of blots for cadherin and catenin protein expression in mutant versus control. Blots were normalized to total protein. n � 4 controls, 5 mutants. Scale bars, 20 �m. Error bars depict SEM.
Beaudoin et al. • Afadin Regulates Excitatory Synapse Density J. Neurosci., January 4, 2012 • 32(1):99 –110 • 103

the first Ras association domain, essentialfor afadin function, that is present in allknown afadin isoforms (Takai et al.,2008). Both the Neo and flox allele ho-mozygotes were viable and did not detect-ably reduce afadin expression (Fig. 1E anddata not shown). The flox allele of afadinwas used for additional studies (Fig. 1A).
For this study, the afadin flox allele wascrossed with the forebrain-specific Nex–cre knock-in (Goebbels et al., 2006). Thiscre line promotes efficient recombinationin excitatory postmitotic neurons and inter-mediate neural progenitors in the cortexand hippocampus but not neural epithelialcells or astroglia (Wu et al., 2005; Goebbelset al., 2006; Mulder et al., 2008). Because ofthe heterogeneity of synapses in the cortex,we focused on the hippocampus, examiningthe synapses formed by CA3 pyramidal cellsonto CA1–SR. Western blot analysis ofadult hippocampal extracts demonstrated afourfold reduction in afadin in the mutant(Fig. 2A,B). The remaining expressionlikely reflects afadin expression in glia, in-hibitory neurons, and endothelia. By im-munofluorescence, we observed substantialloss of afadin expression in the mutantCA1–SR, with some expression remainingin the SP (Fig. 2C,D).
Loss of afadin impairs N-cadherin,�-catenin, and �N-catenin clusteringTo determine whether absence of afadinresults in impaired cadherin localizationwithin the CA1 hippocampus, we examinedN-cadherin localization by immunofluores-cence in control and mutant (Fig. 3A,B)sections. Quantification of N-cadherinpuncta density indicated that the mutantcontained only 30% of the puncta presentin the control (Fig. 3C). Although the re-maining mutant puncta appeared normalin area (Fig. 3D), the average total fluores-cence intensity within each puncta wasreduced by 30% in the mutant (Fig. 3E).To determine whether the reductions inN-cadherin puncta density were accompa-nied by similar reductions in the densities ofcadherin-associated proteins, we also ex-amined and quantified the densities of�-catenin and �N-catenin puncta. Results,presented in Figure 3F–O, show that ab-sence of afadin resulted in loss of approxi-mately two-thirds of the �-catenin puncta
Figure 4. Loss of afadin results in reduced EphB2 puncta density without a change in nectin-1 or nectin-3 puncta density or totalexpression of nectins and EphB2. A–C, Visualization of nectin-1 in control (A) and mutant (B) demonstrated no significant reduc-tion in puncta density (C) in mutant (M) versus control (C). D–F, Visualization of nectin-3 in control (D) and mutant (E) demon-strated no significant reduction in puncta density (F ) in mutant (M) versus control (C). G–I, Visualization of EphB2 in control (G)and mutant (H ) demonstrated a significant (*p � 0.05) reduction in puncta density (I ) in mutant (M) versus control (C). In C, F,and I, n � 4 littermate controls and mutants. J, Blot analyses in hippocampal lysates from control (C) and mutant (M) demon-strated no significant changes in nectin-1, nectin-3, or EphB2 expression levels. Shown are representative lanes from blots for
4
nectin-1, nectin-3, and EphB2. K, Quantification of blots fornectin-1, nectin-3, and EphB2 in mutant versus control. Blots werenormalized to �-tubulin or total protein expression. For nectin-1and nectin-3, n � 4 controls, 5 mutants; for EphB2, n � 6 con-trols, 5 mutants. Scale bars, 20 �m. Error bars depict SEM.
104 • J. Neurosci., January 4, 2012 • 32(1):99 –110 Beaudoin et al. • Afadin Regulates Excitatory Synapse Density

and 60% of the �N-catenin puncta. Because one potential explana-tion for these data would be reduced expression of these proteins, wealso determined whether cadherin and catenin protein levels werealtered in the mutant by protein blot (Fig. 3P). Results indicate thatabsence of afadin did not alter the total expression levels ofN-cadherin, total cadherins, �N-catenin, �-catenin, or p120–catenin (Fig. 3Q). Thus, absence of afadin results in reduced cluster-ing of N-cadherin, �-catenin, and �N-catenin without affectingcadherin and catenin levels. The most likely explanation of theseobservations is that absence of afadin impairs formation of cadherinclusters that in turn results in reduced clustering of cytoplasmiccadherin-associated proteins.
Afadin is known to bind through its PDZ domain several cellsurface receptors, including nectins and Eph receptors (Buchertet al., 1999; Takahashi et al., 1999), and nectins acting throughafadin have been shown to strongly promote cadherin clusteringand activation (Takai et al., 2008). Interestingly, when we exam-ined the effects of the absence of afadin on localization of nectin-1or nectin-3, we observed little change in clustering of either pro-tein (Fig. 4A–F), consistent with the likelihood that the nectinsfunction upstream of afadin in controlling clustering of cad-herins and catenins. In contrast, we did observe a significantreduction of 35% in EphB receptor puncta density (Fig. 4G–I).Additionally, we tested the expression level of nectin-1, nectin-3,and EphB2 in hippocampal lysates of controls and mutants (Fig.4 J). We observed that absence of afadin did not alter total expres-sion levels of any of these three proteins (Fig. 4K).
Altered lamination but normal dendritic development inmutant CA1Cadherins regulate cell sorting and migration (Takeichi, 2007,2011). Additionally, loss of �N-catenin results in mislocalization
and dispersion of CA1 and CA3 pyrami-dal cells (Park et al., 2002). Although hip-pocampal lamination was not perturbed(data not shown), a small number of CA1pyramidal cell bodies were mislocalized tothe stratum oriens (SO) (10%) or SR (5%)in the mutant compared with virtually nomislocalization in controls (Fig. 5). None-theless, dendrite development appearedcomparatively normal. We observed nodifference in the location of the first api-cal branch of pyramidal cells in the mu-tant (Fig. 6 A–C). Using Scholl analysis,we found no difference in the dendriticlength or pattern of branching withinthe SR (Fig. 6 D). In addition, we foundno obvious change in the dendriticbranching patterns of the misplaced py-ramidal cells. In summary, despite pre-vious in vitro studies suggesting roles forthe catenins and N-cadherin in regulat-ing dendritic growth, dendrites appearcomparatively normal in the afadin mu-tant (Takeichi, 2007).
Spine density is reduced in afadinmutant hippocampusBecause most excitatory synapses are lo-calized on spines, synapse number canbe altered as a result of changes in spinenumber, as is observed in compound
EphB null mice (Kayser et al., 2006). Additionally, cadherins andcatenins have been implicated in spine morphogenesis in vivo andin vitro (Takeichi, 2007). To examine the role of afadin in regu-lating spine formation by CA1 pyramidal neurons, we used Golgianalysis to visualize and quantify their dendritic spines in theCA1–SR of controls and mutants (Fig. 7A,B). Interestingly, theafadin null pyramidal neurons exhibited a 43% decrease in spinedensity (Fig. 7C). The reduced density of spines may be a conse-quence of the 70% reduction in cadherin puncta density, becausesubstantial previous work in vitro has implicated cadherins, espe-cially N-cadherin, in spine formation and stability (Takeichi,2007).
Ultrastructural analysis of excitatory synapses in the SR of theafadin mutantTo determine whether the absence of afadin results in reducedsynapse density, we quantified CA1–SR synapse density byEM. Synapses were identified as having a presynaptic densityplus synaptic vesicles juxtaposed to a PSD (Fig. 8 A–D). Fewinhibitory synapses, identified by PSD appearance, were ob-served. We observed a 31% lower density of excitatory syn-apses in the mutant (22.9 � 2.7/100 �m 2) versus control(33.3 � 3.5/100 �m 2) (Fig. 8 E). We also observed a 30%increase in average presynaptic terminal area in the mutantcompared with control (Fig. 8 F), consistent with synaptophy-sin puncta area quantification by immunofluorescence (datanot shown). We detected no increase in the number of splitPSDs (Fig. 8G) or changes in PSD length in the mutant (Fig.8 H), suggesting that postsynaptic structure is normal in themutant. In summary, the 43% reduction in spine density cor-related well with a similar reduction of 31% in the density ofexcitatory synapses in the afadin mutant.
Figure 5. Localization of hippocampal CA1 pyramidal cells after Nex– cre-mediated deletion of afadin. A, B, Loss of afadinresults in mislocalization of �15% of cre-expressing neurons. In the control (A, afadinF/�; Nex– cre), these neurons are exclusivelylocalized to the SP. In the mutant (B, afadinF/F; Nex– cre), 15% are found in the adjacent SO and SR layers. Neurons were identifiedby expression of cre recombinase. Scale bar, 50 �m. C, Quantification of the percentage of Cre-expressing cells in the SO and SP incontrols (white bars) and mutants (black bars). Error bars depict SD. *p � 0.05, n � 3 littermate controls and mutants.
Beaudoin et al. • Afadin Regulates Excitatory Synapse Density J. Neurosci., January 4, 2012 • 32(1):99 –110 • 105

Loss of afadin results in reductions inpresynaptic and postsynapticprotein colocalizationTo further address the role of afadin inregulating synaptic structure, we initiallyquantified the densities of puncta fromsynapse-associated proteins, synaptophy-sin, bassoon, and glutamate receptors, byimmunofluorescence and confocal imag-ing (data not shown). Surprisingly, we didnot observe a puncta density reduction inthe mutant, most likely because of thelimited spatial resolution of confocal mi-croscopy. To extend this analysis, we usedsubdiffraction limit imaging by STORMto determine synapse density, definingsynapses as apposed clusters of presynap-tic bassoon and postsynaptic AMPA glutamate receptors(GluR1/2) (Dani et al., 2010). Consistent with 3D-reconstructiveEM, control mice had an average of 2.4 synapses/�m 3 (Mish-chenko et al., 2010). In contrast, mutants had a 35% reduction insynapse density (Fig. 9A–D). Intriguingly, although mutants hada 35% reduction in the density of bassoon puncta, there was nosignificant reduction in the density of AMPA glutamate receptor1/2 puncta (Fig. 9E–H). Consistent with data presented abovesuggesting that the remaining synapses are normal, the averagesize and intensity of bassoon puncta were not altered in the mu-tant (Fig. 9 I, J), nor was the average amount of AMPA glutamatereceptor 1/2 at synapses changed (Fig. 9L).
Reduced synaptic transmission in afadinmutant hippocampusTo determine whether the absence of afadin from CA3 and CA1neurons resulted in synaptic transmission deficits, we examinedthe fEPSP responses. CA1–SR basal synaptic transmission wasassessed by stimulating Schaffer collateral afferents with increas-ing intensity and measuring the rise slope of the fEPSP in control(Fig. 10A) and mutant (Fig. 10B). The input– output linear fit ofthe fiber volley amplitude to the fEPSP rise slope demonstrated anearly twofold decrease in synaptic strength in afadin mutants(Fig. 10C,D). Although consistent with the loss of synapsesshown by EM and STORM, reduced Schaffer collateral innerva-tion of CA1 could also explain this observation. To determinethis, we plotted the evoked fiber volley amplitude as a function ofstimulus intensity (Fig. 10E) and found no difference, indicatingthat mutants have normal numbers of Schaffer collateral axonsthat innervate CA1.
We further characterized synaptic transmission using a seriesof evoked stimulus protocols. To check for changes in presynap-tic release probability by the afadin-deficient CA3 presynapticneurons, we measured the paired-pulse ratio at varying stimulusintervals (Fig. 10F) (Zucker, 1989). We found no change inpaired-pulse facilitation at any interval (Fig. 10G), suggestingthat the probability of release is normal in the afadin mutant. Todetermine whether absence of afadin affects the size of the readilyreleasable pool (RRP), consequences of repetitive high-frequencystimulation (Fig. 10H), capable of exhausting the RRP withoutallowing for replenishment from the reserve pool, was assessed.The ratio of the size of the 40th fEPSP to the first fEPSP wasunchanged between genotypes, indicating that absence of afadindoes not affect the size of the RRP. Last, we examined the conse-quences of repetitive low-frequency stimulation to determinewhether the absence of afadin results in changes in the reservepool. Likewise, this parameter was unchanged (Fig. 10 I). Thus,we found no changes in the responses of the mutant CA3 presyn-aptic neurons, indicating that absence of afadin does not perturbpresynaptic function. In summary, the electrophysiology datashow reduced excitatory synaptic transmission in afadin mu-tants. These results indicate that the density of synapses formedby CA3 axons on CA1 dendrites is reduced in the mutant, aconclusion completely consistent with the lower synaptic densitydetermined by EM and STORM.
DiscussionBy specifically deleting afadin in hippocampal excitatory neuronsbefore synapse formation, we were able to examine the role of thisscaffold protein in regulating neuronal differentiation in thepresence of normal glia and other cells. Much of the differentia-
Figure 6. Analysis of dendritic branching in the Nex– cre; afadin mutant. A, B, The location of the bifurcation of the apical dendrite (arrowhead) of Thy1–YFP–H-labeled, CA1 pyramidal cells wasanalyzed in control (A) and Nex– cre mutant (B) relative to the thickness of the SR. The image stack was pseudocolored by depth before performing a maximal z-projection. Scale bar, 50 �m. C,Average position of the first bifurcation of the apical dendrite relative to the thickness of the SR demonstrated no significant difference between control (C) and mutant (M). Error bars depict SD. n �60 neurons analyzed from 3 mice. D, Scholl analysis revealed no difference in complexity of the dendritic tree between control and mutant mice. Error bars depict SEM. n � 6 neurons from 3littermate controls and mutants.
Figure 7. Reduced spine density on pyramidal cell dendrites in CA1 SR in the afadin mutant. A, B, Representative Golgi-stainedimages of spine densities in mutant (B) and control (A). Scale bar, 10 �m. C, Quantification of spine densities in control (Con) andmutant (Mut). Error bars depict SD. *p � 0.05, n � 3.
106 • J. Neurosci., January 4, 2012 • 32(1):99 –110 Beaudoin et al. • Afadin Regulates Excitatory Synapse Density

tion of mutant hippocampal CA1 pyramidal neurons proceededcomparatively normally. A few neuronal cell bodies were mislo-calized, but most were localized appropriately in the SP. Simi-larly, dendrite growth and branching appeared comparativelynormal in the mutant neurons. Three significant phenotypeswere observed in the mutant neurons. Spine formation was im-paired because only 60% the normal density was observed in themutant CA1–SR. A similar reduction in density of excitatory syn-apses in the SR was also observed. Finally, the mutants exhibiteda dramatic loss of 70% of the N-cadherin puncta and similar
reductions in the densities of �-cateninand �N-catenin puncta with no changesin total expression of either N-cadherin orthese catenins, documenting the role ofafadin in cadherin recruitment. It seemslikely that many of the residual cadherinand catenin puncta are expressed in cellsnot targeted by Nex– cre. Notably, thesesynaptic deficits appear much more dra-matic than that observed after targeteddeletion of N-cadherin (Kadowaki et al.,2007). Those authors observed the con-tinued presence of �-catenin at synapses,indicating that other classical cadherinsremained at these synapses. Previous workhas suggested that afadin promotes therecruitment and activation of all of theclassical cadherins (Takai et al., 2008). In-terestingly, we did not observe effects of afa-din deletion on the density or properties ofnectin-1 and nectin-3 puncta or on total ex-pression levels of either nectin, consistentwith the possibility that these proteins func-tion upstream of afadin in controlling cad-herin and catenin localization and function.In contrast, absence of afadin does result inmislocalization of nectins in the dentategyrus and intestinal epithelium (Majima etal., 2009; Tanaka-Okamoto et al., 2011).The reason for this discrepancy is not clearbut suggests that there are cell-type-specificmechanisms that control localization of thenectins, possibly involving other scaffoldproteins, such as synaptic scaffolding mole-cule (S-SCAM) (Yamada et al., 2003). Over-all, our data is consistent with the possibilitythat afadin promotes synapse formation/maintenance through recruitment of cad-herins and catenins but does notsignificantly perturb presynaptic or post-synaptic function.
In synaptic structure analyses, bothlight-level immunofluorescence (data notshown) and EM analysis detected a smallbut significant increase in the size of pre-synaptic nerve terminals in mutant com-pared with control CA3 neurons. Analysesof presynaptic function—probability ofrelease and sizes of the RRPs and reservevesicle pools—indicates that the mutantCA3 presynaptic nerve terminals func-tioned normally. Additionally, absence ofafadin did not affect the average amount
of bassoon associated with each synapse as determined bySTORM. Similarly, postsynaptic morphology as assessed by ap-pearance and length of the PSD appeared normal as assessed byEM and AMPA receptor GluR1/2 content at these synapses wasnormal as assessed by STORM. Quantification of CA3 fiber volleyamplitude indicated that normal numbers of mutant CA3 pyra-midal cell axons invaded the CA1–SR. Postsynaptic responseswere reduced by approximately the same percentage as the reduc-tions in synapse density quantified by EM and STORM. Mutantsynapses had similar number of glutamate receptors juxtaposed
Figure 8. Reduced synapse density in CA1–SR in the afadin mutant. A–D, Images of synapses in control (A, C) and mutant (B,D). Scale bars: A, C, 1 �m; B, D, 0.25 �m. E–H, Significant reduction in synapse density (E) in mutant (M) versus control (C). Inaddition, presynaptic bouton area (F) is significantly increased in mutant (M) versus control (C). No significant differences betweencontrol and mutant were seen in the density of split PSDs (G) or average length of the PSD (H). Error bars depict SD. *p �0.05, n � 3.
Figure 9. STORM demonstrates loss of synapses in mutants. A, B, Original high-resolution STORM image from a control (A) andmutant (B) showing puncta of bassoon (purple) and glutamate receptor 1/2 (green). Scale bar, 1 �m. C, D, STORM image from acontrol (C) and mutant (D) masked to show only the apposed bassoon and AMPA glutamate receptor 1/2 puncta. E–H, Averagepuncta density is significantly reduced in mutants (M) versus controls (C) for all bassoon puncta (E), bassoon puncta apposed to aglutamate receptor puncta (F), and glutamate receptor puncta apposed to a bassoon puncta (G). There was not a statisticallysignificant reduction in total AMPA glutamate receptor (GluR1/2) puncta (H) ( p � 0.19). n � 6 control, 7 mutant. Error bars areSEM. *p � 0.005. I–K, Unlike puncta density, controls and mutants had changes �5% in average synaptic bassoon size (I),average synaptic bassoon intensity (J), average number of glutamate receptor puncta per bassoon punctum (K), and average totalglutamate receptor integrated density per bassoon punctum (L). n 8500 puncta per genotype. Error bars are SEM.
Beaudoin et al. • Afadin Regulates Excitatory Synapse Density J. Neurosci., January 4, 2012 • 32(1):99 –110 • 107

to bassoon. Perhaps the increase in bouton size is an indirectresult of fewer synapses and/or spines. Together, these analysesindicate that the synapses formed in the absence of afadin func-tion normally.
These findings contrast with previous mouse genetic modelsfor cadherin complex function, but comparisons are complicatedby the presence of several functional homologs for the cadherinsand catenins. Animals lacking N-cadherin clearly form CNS syn-apses in vitro, but synaptic density has not been quantified in thismutant in vivo and other cadherins almost certainly remain atthese synapses (Kadowaki et al., 2007). Similarly, absence of �N-catenin does not prevent synapse formation in vivo, although,similar to cadherin inhibition, this results in spine and synapseinstability in culture (Park et al., 2002; Togashi et al., 2002; Abe etal., 2004). Absence of �-catenin results in a small increase in CA1synapse density with a small but significant deficit in the synapticvesicle reserve pool (Bamji et al., 2003). Possible compensation ofthe �N-catenin and �-catenin mutants by other �-catenin familymembers and the �-catenin homolog plakoglobin were not ex-amined in these studies. Mice with a targeted deletion of p120 –catenin had reduced numbers of dendritic spines and synapses inCA1–SR and a reduction in N-cadherin expression (Elia et al.,
2006; Takeichi, 2007). In vitro analysis suggested that the loss ofspines in this mutant is attributable to misregulation of Rac andRho, whereas normal maturation of spines does require interac-tions of cadherins with p120 – catenin (Elia et al., 2006; Ishiyamaet al., 2010). In contrast, deletion of the p120 – catenin homolog�-catenin results in deficits in synaptic transmission and plastic-ity without detectable alterations of synapse density (Israely et al.,2004). Importantly, absence of this gene also results in prematureloss of synaptic transmission, synapses, spines, and dendritesin the adult cortex (Matter et al., 2009). Considering thesephenotypes, that of the p120 – catenin mutant appears mostsimilar to that of the afadin mutant, consistent with the role ofp120 – catenin in mediating an interaction between afadin andcadherins.
Through its PDZ domain, afadin also binds at least three otherfamilies of cell surface receptors: the nectins, EphB receptors, andneurexins (Beaudoin, 2006). Interestingly, mice with triple mu-tants of neuroligin or �-neurexin have profoundly impaired syn-aptic transmission with only small alterations in numbers ofinhibitory and excitatory synapses (Missler et al., 2003; Varo-queaux et al., 2006). In contrast, the triple EphB1/B2/B3 null miceexhibit an �50% decrease in the density of spines in CA1 with a
Figure 10. Reduced excitatory synaptic transmission in the mutant hippocampus. Recordings of fEPSPs in CA1 from control (A) and mutant (B) mice. Traces of field potential responses toincreasing evoked stimulus intensity by 5 �A every three sweeps; range, 20 –50 �A. C, The linear fit of the fEPSP rise slope (millivolts per milliseconds) to fiber volley amplitude (millivolts) plotdemonstrates reduced synaptic strength in mutant mice; the data in the histogram plot in D is the average across multiple animals (n�5) and shows that synaptic strength in mutant animals (slope,1.0 � 0.1) is significantly reduced compared with control (slope, 1.8 � 0.2). E, Fiber volley amplitudes evoked by a range of stimulus intensities were not different between control and mutant.Paired-pulse responses of fEPSPs (F, G) in control and mutant were measured at intervals of 10, 25, 50, 75, 100, 200, and 400 ms and were not statistically different. H, Examples of traces of fEPSPresponses to 40 stimuli pulses delivered at 100 Hz. I, Summary histogram of fEPSP responses to 40 stimuli pulses delivered at 10 or 100 Hz. The ratios of the fEPSP rise slope of the 40th pulse to thefirst pulse were not significantly different between control and mutant at either frequency.
108 • J. Neurosci., January 4, 2012 • 32(1):99 –110 Beaudoin et al. • Afadin Regulates Excitatory Synapse Density
reduced number of spine and increased number of shaft synapsesas well as striking reductions in spine maturation and postsynap-tic compartment maturation (Henkemeyer et al., 2003). Thus,absence of afadin may impair EphB receptor function because wefound a reduction in EphB2 puncta density, but these receptorsclearly have additional functions because the triple EphB receptormutant has phenotypes not observed in the afadin mutant. Incontrast to mutants lacking EphB receptors, neuroligins, or�-neurexins, afadin appears to promote synapse density withouthaving major effects on synapse structure or function.
This study focused on afadin because it lacks close structuralhomologs, thereby preventing compensation by other proteins.Nonetheless, a significant number of synapses form in its ab-sence. As a possible explanation, a recent report raises the possi-bility that the PDZ-domain-containing protein S-SCAM acts as afunctional homolog of afadin through mediating association ofN-cadherin with Neuroligin-1 (Stan et al., 2010). Additionally,recent studies also suggest that N-cadherin function can be pro-moted through extracellular interactions with nectin-2 andprotocadherin-19 (Biswas et al., 2010; Morita et al., 2010). It isnot clear whether the resulting stimulation of N-cadherin func-tion depends on afadin, p120 – catenin, or other members of thecadherin complex. Thus, other cytoplasmic scaffold and surfaceproteins may promote cadherin function in the absence of afadin.
Additional interactions of afadin may also promote synapseformation. For example, its RA domain binds Rap1 (Takai et al.,2008). Previous studies in cortical cultures have provided evi-dence that afadin may function in a pathway through whichNMDA receptors control spine maturation and AMPA receptorrecruitment through Rap1 (Xie et al., 2005). Additionally, afadinmay promote N-cadherin-dependent spine growth and Rac acti-vation by recruiting the Rac–GEF, kalirin-7 (Xie et al., 2008).However, because loss of kalirin-7 causes no hippocampal spineor synaptic abnormalities, it is unlikely to underlie the defectsseen in the afadin null hippocampus seen in our study (Cahill etal., 2009; Xie et al., 2011). Although afadin interacts withN-cadherin and p120 – catenin, misregulation or mislocalizationof Rho family GTPases may still contribute to the reduction inspine density observed in the mutant in vivo.
In conclusion, our data provide strong evidence that absenceof afadin results in significant reductions in cadherin puncta,spine, and excitatory synapse density in the CA1–SR withoutaffecting function of those synapses, which are formed in its ab-sence. The data suggest that impaired clustering and activity ofcadherins contributes to the phenotypes observed after neuron-specific deletion of afadin. The results do not exclude possibleadditional contributions to the afadin mutant phenotype frommisregulation of neurexin, EphB, or nectin activity within thebrain.
ReferencesAbe K, Chisaka O, Van Roy F, Takeichi M (2004) Stability of dendritic
spines and synaptic contacts is controlled by alpha N-catenin. Nat Neu-rosci 7:357–363.
Bamji SX, Shimazu K, Kimes N, Huelsken J, Birchmeier W, Lu B, ReichardtLF (2003) Role of beta-catenin in synaptic vesicle localization and pre-synaptic assembly. Neuron 40:719 –731.
Beaudoin GM 3rd (2006) Con-nectin axons and dendrites. J Cell Biol174:7–9.
Biswas S, Emond MR, Jontes JD (2010) Protocadherin-19 and N-cadherininteract to control cell movements during anterior neurulation. J Cell Biol191:1029 –1041.
Buchert M, Schneider S, Meskenaite V, Adams MT, Canaani E, Baechi T,Moelling K, Hovens CM (1999) The junction-associated protein AF-6
interacts and clusters with specific Eph receptor tyrosine kinases at spe-cialized sites of cell-cell contact in the brain. J Cell Biol 144:361–371.
Cahill ME, Xie Z, Day M, Photowala H, Barbolina MV, Miller CA, Weiss C,Radulovic J, Sweatt JD, Disterhoft JF, Surmeier DJ, Penzes P (2009) Ka-lirin regulates cortical spine morphogenesis and disease-related behav-ioral phenotypes. Proc Natl Acad Sci U S A 106:13058 –13063.
Clandinin TR, Feldheim DA (2009) Making a visual map: mechanisms andmolecules. Curr Opin Neurobiol 19:174 –180.
Dalva MB, McClelland AC, Kayser MS (2007) Cell adhesion molecules: sig-nalling functions at the synapse. Nat Rev Neurosci 8:206 –220.
Dani A, Huang B, Bergan J, Dulac C, Zhuang X (2010) Superresolutionimaging of chemical synapses in the brain. Neuron 68:843– 856.
Elia LP, Yamamoto M, Zang K, Reichardt LF (2006) p120 catenin regulatesdendritic spine and synapse development through Rho-family GTPasesand Cadherins. Neuron 51:43–56.
Feng G, Mellor RH, Bernstein M, Keller-Peck C, Nguyen QT, Wallace M,Nerbonne JM, Lichtman JW, Sanes JR (2000) Imaging neuronal subsetsin transgenic mice expressing multiple spectral variants of GFP. Neuron28:41–51.
Goebbels S, Bormuth I, Bode U, Hermanson O, Schwab MH, Nave KA(2006) Genetic targeting of principal neurons in neocortex and hip-pocampus of NEX-Cre mice. Genesis 44:611– 621.
Henkemeyer M, Itkis OS, Ngo M, Hickmott PW, Ethell IM (2003) MultipleEphB receptor tyrosine kinases shape dendritic spines in the hippocam-pus. J Cell Biol 163:1313–1326.
Hock B, Bohme B, Karn T, Yamamoto T, Kaibuchi K, Holtrich U, Holland S,Pawson T, Rubsamen-Waigmann H, Strebhardt K (1998) PDZ-domain-mediated interaction of the Eph-related receptor tyrosine kinaseEphB3 and the ras-binding protein AF6 depends on the kinase activity ofthe receptor. Proc Natl Acad Sci U S A 95:9779 –9784.
Ikeda W, Nakanishi H, Miyoshi J, Mandai K, Ishizaki H, Tanaka M, TogawaA, Takahashi K, Nishioka H, Yoshida H, Mizoguchi A, Nishikawa S, TakaiY (1999) Afadin: a key molecule essential for structural organization ofcell-cell junctions of polarized epithelia during embryogenesis. J Cell Biol146:1117–1132.
Ishiyama N, Lee SH, Liu S, Li GY, Smith MJ, Reichardt LF, Ikura M (2010)Dynamic and static interactions between p120 catenin and E-cadherinregulate the stability of cell-cell adhesion. Cell 141:117–128.
Israely I, Costa RM, Xie CW, Silva AJ, Kosik KS, Liu X (2004) Deletion of theneuron-specific protein delta-catenin leads to severe cognitive and syn-aptic dysfunction. Curr Biol 14:1657–1663.
Jin Y, Garner CC (2008) Molecular mechanisms of presynaptic differentia-tion. Annu Rev Cell Dev Biol 24:237–262.
Kadowaki M, Nakamura S, Machon O, Krauss S, Radice GL, Takeichi M(2007) N-cadherin mediates cortical organization in the mouse brain.Dev Biol 304:22–33.
Kayser MS, McClelland AC, Hughes EG, Dalva MB (2006) Intracellular andtrans-synaptic regulation of glutamatergic synaptogenesis by EphB recep-tors. J Neurosci 26:12152–12164.
Majima T, Ogita H, Yamada T, Amano H, Togashi H, Sakisaka T, Tanaka-Okamoto M, Ishizaki H, Miyoshi J, Takai Y (2009) Involvement of afa-din in the formation and remodeling of synapses in the hippocampus.Biochem Biophys Res Commun 385:539 –544.
Matter C, Pribadi M, Liu X, Trachtenberg JT (2009) Delta-catenin is re-quired for the maintenance of neural structure and function in maturecortex in vivo. Neuron 64:320 –327.
Mendell JT, Sharifi NA, Meyers JL, Martinez-Murillo F, Dietz HC (2004)Nonsense surveillance regulates expression of diverse classes of mamma-lian transcripts and mutes genomic noise. Nat Genet 36:1073–1078.
Mishchenko Y, Hu T, Spacek J, Mendenhall J, Harris KM, Chklovskii DB(2010) Ultrastructural analysis of hippocampal neuropil from the con-nectomics perspective. Neuron 67:1009 –1020.
Missler M, Zhang W, Rohlmann A, Kattenstroth G, Hammer RE, GottmannK, Sudhof TC (2003) Alpha-neurexins couple Ca 2� channels to synap-tic vesicle exocytosis. Nature 423:939 –948.
Morita H, Nandadasa S, Yamamoto TS, Terasaka-Iioka C, Wylie C, Ueno N(2010) Nectin-2 and N-cadherin interact through extracellular domainsand induce apical accumulation of F-actin in apical constriction of Xeno-pus neural tube morphogenesis. Development 137:1315–1325.
Mulder J, Aguado T, Keimpema E, Barabas K, Ballester Rosado CJ, Nguyen L,Monory K, Marsicano G, Di Marzo V, Hurd YL, Guillemot F, Mackie K,Lutz B, Guzman M, Lu HC, Galve-Roperh I, Harkany T (2008) Endo-
Beaudoin et al. • Afadin Regulates Excitatory Synapse Density J. Neurosci., January 4, 2012 • 32(1):99 –110 • 109

cannabinoid signaling controls pyramidal cell specification and long-range axon patterning. Proc Natl Acad Sci U S A 105:8760 – 8765.
Park C, Falls W, Finger JH, Longo-Guess CM, Ackerman SL (2002) De-letion in Catna2, encoding alpha N-catenin, causes cerebellar andhippocampal lamination defects and impaired startle modulation. NatGenet 31:279 –284.
Rodríguez CI, Buchholz F, Galloway J, Sequerra R, Kasper J, Ayala R, StewartAF, Dymecki SM (2000) High-efficiency deleter mice show that FLPe isan alternative to Cre-loxP. Nat Genet 25:139 –140.
Schlomann U, Schwamborn JC, Muller M, Fassler R, Puschel AW (2009)The stimulation of dendrite growth by Sema3A requires integrin engage-ment and focal adhesion kinase. J Cell Sci 122:2034 –2042.
Stan A, Pielarski KN, Brigadski T, Wittenmayer N, Fedorchenko O, Gohla A,Lessmann V, Dresbach T, Gottmann K (2010) Essential cooperation ofN-cadherin and neuroligin-1 in the transsynaptic control of vesicle accu-mulation. Proc Natl Acad Sci U S A 107:11116 –11121.
Takahashi K, Nakanishi H, Miyahara M, Mandai K, Satoh K, Satoh A, Nish-ioka H, Aoki J, Nomoto A, Mizoguchi A, Takai Y (1999) Nectin/PRR: animmunoglobulin-like cell adhesion molecule recruited to cadherin-basedadherens junctions through interaction with Afadin, a PDZ domain-containing protein. J Cell Biol 145:539 –549.
Takai Y, Ikeda W, Ogita H, Rikitake Y (2008) The immunoglobulin-like celladhesion molecule nectin and its associated protein afadin. Annu Rev CellDev Biol 24:309 –342.
Takeichi M (2007) The cadherin superfamily in neuronal connections andinteractions. Nat Rev Neurosci 8:11–20.
Takeichi M (2011) Self-organization of animal tissues: cadherin-mediatedprocesses. Dev Cell 21:24 –26.
Tanaka-Okamoto M, Hori K, Ishizaki H, Itoh Y, Onishi S, Yonemura S, TakaiY, Miyoshi J (2011) Involvement of afadin in barrier function and ho-meostasis of mouse intestinal epithelia. J Cell Sci 124:2231–2240.
Togashi H, Abe K, Mizoguchi A, Takaoka K, Chisaka O, Takeichi M (2002)Cadherin regulates dendritic spine morphogenesis. Neuron 35:77– 89.
Varoqueaux F, Aramuni G, Rawson RL, Mohrmann R, Missler M, GottmannK, Zhang W, Sudhof TC, Brose N (2006) Neuroligins determine synapsematuration and function. Neuron 51:741–754.
Waites CL, Craig AM, Garner CC (2005) Mechanisms of vertebrate synap-togenesis. Annu Rev Neurosci 28:251–274.
Wu SX, Goebbels S, Nakamura K, Nakamura K, Kometani K, Minato N,Kaneko T, Nave KA, Tamamaki N (2005) Pyramidal neurons of uppercortical layers generated by NEX-positive progenitor cells in the subven-tricular zone. Proc Natl Acad Sci U S A 102:17172–17177.
Xie Z, Huganir RL, Penzes P (2005) Activity-dependent dendritic spinestructural plasticity is regulated by small GTPase Rap1 and its target AF-6.Neuron 48:605– 618.
Xie Z, Photowala H, Cahill ME, Srivastava DP, Woolfrey KM, Shum CY,Huganir RL, Penzes P (2008) Coordination of synaptic adhesionwith dendritic spine remodeling by AF-6 and kalirin-7. J Neurosci28:6079 – 6091.
Xie Z, Cahill ME, Radulovic J, Wang J, Campbell SL, Miller CA, Sweatt JD,Penzes P (2011) Hippocampal phenotypes in kalirin-deficient mice.Mol Cell Neurosci 46:45–54.
Yamada A, Irie K, Deguchi-Tawarada M, Ohtsuka T, Takai Y (2003) Nectin-dependent localization of synaptic scaffolding molecule (S-SCAM) at thepuncta adherentia junctions formed between the mossy fibre terminalsand the dendrites of pyramidal cells in the CA3 area of the mouse hip-pocampus. Genes Cells 8:985–994.
Zhadanov AB, Provance DW Jr, Speer CA, Coffin JD, Goss D, Blixt JA, Reich-ert CM, Mercer JA (1999) Absence of the tight junctional protein AF-6disrupts epithelial cell-cell junctions and cell polarity during mouse de-velopment. Curr Biol 9:880 – 888.
Zucker RS (1989) Short-term synaptic plasticity. Annu Rev Neurosci 12:13–31.
110 • J. Neurosci., January 4, 2012 • 32(1):99 –110 Beaudoin et al. • Afadin Regulates Excitatory Synapse Density