Dental developmental stage affects the treatment outcome ...

Developmental Stage Specificity and the Role ofMitochondrial Metabolism in the Response ofArabidopsis Leaves to Prolonged MildOsmotic Stress1[C][W][OA]
Aleksandra Skirycz, Stefanie De Bodt, Toshihiro Obata, Inge De Clercq, Hannes Claeys, Riet De Rycke,Megan Andriankaja, Olivier Van Aken2, Frank Van Breusegem, Alisdair R. Fernie, and Dirk Inze*
Department of Plant Biotechnology and Genetics, Ghent University, B–9052 Ghent, Belgium (A.S., S.D.B.,I.D.C., H.C., R.D.R., M.A., O.V.A., F.V.B., D.I.); Department of Plant Systems Biology, Flanders Institute forBiotechnology, B–9052 Ghent, Belgium (A.S., S.D.B., I.D.C., H.C., M.A., O.V.A., F.V.B., D.I.); and Max-PlanckInstitute for Molecular Plant Physiology, D–14476 Potsdam-Golm, Germany (T.O., A.R.F.)
When subjected to stress, plants reprogram their growth by largely unknown mechanisms. To provide insights into thisprocess, the growth of Arabidopsis (Arabidopsis thaliana) leaves that develop under mild osmotic stress was studied. Earlyduring leaf development, cell number and size were reduced by stress, but growth was remarkably adaptable, as division andexpansion rates were identical to controls within a few days of leaf initiation. To investigate the molecular basis of the observedadaptability, leaves with only proliferating, exclusively expanding, and mature cells were analyzed by transcriptomicsand targeted metabolomics. The stress response measured in growing and mature leaves was largely distinct; severalhundred transcripts and multiple metabolites responded exclusively in the proliferating and/or expanding leaves. Only a fewgenes were differentially expressed across the three stages. Data analysis showed that proliferation and expansion wereregulated by common regulatory circuits, involving ethylene and gibberellins but not abscisic acid. The role of ethylene wassupported by the analysis of ethylene-insensitive mutants. Exclusively in proliferating cells, stress induced genes of the so-called “mitochondrial dysfunction regulon,” comprising alternative oxidase. Up-regulation for eight of these genes wasconfirmed with promoter:b-glucuronidase reporter lines. Furthermore, mitochondria of stress-treated dividing cells weremorphologically distinct from control ones, and growth of plants overexpressing the alternative oxidase gene was moretolerant to osmotic and drought stresses. Taken together, our data underline the value of analyzing stress responses indevelopment and demonstrate the importance of mitochondrial respiration for sustaining cell proliferation under osmoticstress conditions.
Drought stress causes reduced plant growth and,consequently, often dramatic decreases in crop yield(Boyer, 1982). With the rapidly growing world popu-lation, environmental deterioration, and the increasingneed for bioenergy crops, sufficient food has to beproduced on less arable land while fresh water re-sources becomemore restricted. Therefore, sustainableand equitable global food, feed, and bioenergy secu-rity relies on the development of high-yielding cropplants that can resist adverse environmental condi-tions. For these reasons, understanding the mecha-nisms underlying plant adaptation to stress is not onlyof primary scientific, but also of socioeconomic, im-portance.
Plants have evolved numerous adaptation re-sponses to minimize the harmful effects of droughtstress, summarized in the avoidance/tolerance model(for review, see Verslues et al., 2006). To avoid dehy-dration, mechanisms that help to balance water uptakeand loss, such as stomatal closure and accumulation ofcompatible solutes (e.g. Pro and raffinose), are acti-vated. These changes consequently result in reduced
1 This work was supported by Ghent University (BijzonderOnderzoeksfonds Methusalem project grant no. BOF08/01M00408and Geconcerteerde Onderzoeksacties grant no. 12051403), by theInteruniversity Attraction Poles Program (grant no. VI/33), initiatedby the Belgian State Science Policy Office, by the Institute for thePromotion of Innovation by Science and Technology in Flanders(predoctoral fellowships to I.D.C. and O.V.A.), and by the ResearchFoundation-Flanders (postdoctoral fellowship to S.D.B.).
2 Present address: Australian Research Council Centre of Excel-lence in Plant Energy Biology, University of Western Australia,Crawley, Western Australia 6009, Australia.
* Corresponding author; e-mail [email protected] author responsible for distribution of materials integral to the
findings presented in this article in accordance with the policydescribed in the Instructions for Authors (www.plantphysiol.org) is:Dirk Inze ([email protected]).
[C] Some figures in this article are displayed in color online but inblack and white in the print edition.
[W] The online version of this article contains Web-only data.[OA] Open Access articles can be viewed online without a sub-
scription.www.plantphysiol.org/cgi/doi/10.1104/pp.109.148965
226 Plant Physiology�, January 2010, Vol. 152, pp. 226–244, www.plantphysiol.org � 2009 American Society of Plant Biologists

transpiration and a lower water potential, respectively.Additionally, tolerance mechanisms are triggered toprotect cells against damage; for instance, protectiveproteins are synthesized, such as dehydrins and late-embryogenesis abundant (LEA) proteins, to restrictdamage to other proteins and cellular membranes,while production of antioxidants reduces the levels ofharmful reactive oxygen species (ROS). Long-termwater stress can be accompanied by changes, such ascuticle thickening, changing root architecture, or thehardening of cell walls. Until now, most of thesedrought responses have been studied only in maturetissues and under rather extreme stress conditions. Incontrast, drought-associated growth restriction hasreceived little interest, initially being considered as asecondary effect of stress related to the reduced pho-tosynthetic activity and stomatal closure. However,after the onset of stress, growth rates have been shownto decrease rapidly, independently of photosynthesis(referred to as “short-term adjustment”), followed bygrowth recovery and adaptation to the new condition(referred to as “long-term adaptation”; Burssens et al.,2000; Veselov et al., 2002; West et al., 2004; Fricke et al.,2006). Therefore, although it is now accepted thatplants actively reduce their growth as part of the stressresponse, the underlying mechanisms are still onlypoorly understood. These growth changes allowplants to save and redistribute resources that canbecome limited; for example, smaller leaves lose lesswater due to a reduced transpiration area, whiledifferential growth recovery leads to beneficiallyhigher root-to-shoot ratios (Hsiao and Xu, 2000).In Arabidopsis (Arabidopsis thaliana), leaf primordia
emerge as rod-like structures (20–40 mm in size) on theflank of the vegetative shoot apical meristem (SAM).Abaxial and adaxial domains become specified in thisprimordium and begin to form the flat lamina vialateral and distal cell proliferation. Final leaf shape isachieved during the following developmental phase,in which organ growth and histogenesis are typifiedby extensive cell expansion. The cell expansion phaseis initiated at the distal tip, proceeds gradually in adistal-proximal manner (Donnelly et al., 1999), andcoincides with the onset of postmitotic endoredupli-cation and the sink-to-source transition. By targetingthe right age, one can harvest leaves that are entirelyproliferating, expanding, or mature (Beemster et al.,2005).The main aim of this study was to provide insight
into how both proliferating and expanding leaves ofArabidopsis adapt to prolonged mild osmotic stresswhen compared with mature leaves. Therefore, arelatively mild stress assay was developed, and onlyleaves with proliferating, expanding, or mature cellswere microdissected before expression and metaboliteprofiling. This experimental setup differed from pub-lished drought gene expression studies, in whichmature leaves or complete plant shoots were sub-mitted to relatively severe drought treatments withcomplete growth arrest or even plant death as a result
(Seki et al., 2002; Catala et al., 2007; Kilian et al., 2007;Bouchabke-Coussa et al., 2008; Giraud et al., 2008;Matsui et al., 2008; Perera et al., 2008; Weston et al.,2008; Zhang et al., 2008; Zeller et al., 2009). Stage-specific sampling together with detailed growth anal-ysis provided candidate biological processes, genes,and metabolites that supported growth under stress-limiting conditions. These data are discussed in thecontext of current models of plant performance underwater-limiting conditions.
RESULTS
Development of a Mild Osmotic Stress Assay
To decipher the mechanisms by which water deficitaffects plant growth, an experimental setup was de-veloped that reproducibly reduced leaf size by 50%(Fig. 1, A–C). The best results were obtained with alow concentration (25 mM) of mannitol that decreasesthe water potential of the growth medium and, con-sequently, water uptake of the exposed roots. As analternative to mannitol, the high-Mr osmoticum poly-ethylene glycol (PEG) 3500 was also tested; however,in this instance, the observed growth reduction washighly variable. Even when grown on the same plate,some plants developed very severe phenotypes whileothers appeared unaffected (Supplemental Fig. S1),complicating further analysis and data interpretation.Therefore, mannitol was used for the detailed profilinganalysis and PEGwas used to confirm selected results.More specifically, Arabidopsis seedlings were germi-nated and grown on medium with or without manni-tol up to 22 d after stratification (DAS; Fig. 1A). Incontrast to the responses reported for higher concen-trations of mannitol (usually 100–300 mM), no changesin seed germination, frequency of leaf initiation (datanot shown), or leaf morphology (curling and narrow-ing) were observed (Fig. 1, A and B). Importantly, alsothe operating efficiency of PSII did not change whenmeasured with nondestructive imaging at 15 and 22DAS, reflecting the mild character of the applied stress(Fig. 1, D and E).
Leaf Growth Adapts to the Osmotic Stress
To identify the mechanisms underlying the 50%reduction of the final leaf size when grown underosmotic stress, the third leaf that initiates and subse-quently develops under stress conditions (Fig. 1C) wasused for further analysis. As the final leaf size dependson the developmental window and rates of cell divi-sion and expansion (Beemster et al., 2005), these pa-rameters were assessed by kinematic analysis (DeVeylder et al., 2001). This analysis provides informa-tion on cell area, cell number, number of guard cells,and cell division and expansion rates throughout leafdevelopment (Fig. 2). To obtain these data, leaves wereharvested daily from the early meristematic stage (9DAS and approximately 0.1 mm2 in size) to maturity
Development Mediates Leaf Stress Response
Plant Physiol. Vol. 152, 2010 227

(22 DAS). Leaf primordia younger than 9 DAS weretoo small to dissect. At 9 DAS, growth of leaf 3 wasdriven exclusively by cell division, as demonstrated byexpression of the B-type cyclin CYCB1;2 in the wholeleaf primordia (Fig. 3B).
Cellular measurements demonstrated that both re-duction in cell number and size contributed equally tothe reduced area of mature leaves grown on mannitol(Fig. 2, A–C). Already at the first measurements at 9DAS, both leaf size and cell number had significantlydecreased, while cell size was not affected by thetreatment (Fig. 2, A–C). Intriguingly, neither cell divi-sion rates nor the developmental cell proliferationwindow was reduced (Fig. 2E); on the contrary, divi-sion rates were approximately 10% higher between 12and 16 DAS, partially compensating for the initialreduction in cell number (Fig. 2E; Supplemental Fig.S2). As the frequency of leaf initiation was also un-changed, the observed reduction in cell number had toarise very early, during the first few days after leafinitiation, thus escaping analysis. Cell differentiationwas unaffected, starting from day 10 both undernormal and stress conditions. Cell expansion rateswere initially reduced in stressed leaves but reachedcontrol levels at day 15 and exceeded them betweendays 18 and 20, partially compensating the initial
reduction in cell size (Fig. 2, C and F; SupplementalFig. S2). Leaf growth rates gradually decreased, andleaf 3 approached maturity by day 22 (Fig. 2D). Asalterations in cell area can be associated with changesin endoreduplication (Inze and De Veylder, 2006), theploidy distribution was determined, but no significantdifferences were measured either in onset or in level ofendoreduplication (Supplemental Fig. S3). Similar tomannitol, PEG also influenced both cell number andsize, contributing to the reduced leaf area; however, theeffects were predominantly on cell number, while cellsizewas reduced onlymarginally (Supplemental Fig. S4).
Cell drawings revealed further differences betweencontrol and mannitol-stressed leaves. The shape of theepidermal cells was clearly affected: cells were notonly smaller but also less lobed (Fig. 2H), relating to anapproximately 15% decrease in cell perimeter whencalculated per cell area (Fig. 2I). Moreover, althoughthe first stomata appeared simultaneously in both con-trol and stressed leaves, their number had decreasedwhen calculated per total cell numbers (stomatal index[SI]; Fig. 2G). The maximum SI reduction was calcu-lated at 13 DAS (more than 65%), but the differencediminished to 23% at 22 DAS (Supplemental Fig. S2).In contrast to the SI, trichome density increased inmannitol-grown plants when calculated per leaf area.
Figure 1. Mannitol setup. A, Plants at 22 DAS grownin the absence (left) or presence (right) of 25 mM
mannitol. B, Leaf series (third leaf encircled). C, Leafarea calculation. The arrow marks leaf 3 used infurther analysis. D, Measurement of operating effi-ciency of PSII. E, Images of the effective PSII quantumyield (left, 0 mM; right, 25 mM).
Skirycz et al.
228 Plant Physiol. Vol. 152, 2010

Changes in SI and trichome density could be mea-sured for PEG-grown plants as well (SupplementalFig. S4).
Experimental Setup
To obtain molecular insight into growth adaptationto osmotic stress, samples of exclusively proliferatingleaf primordia (P) and expanding (E) and mature (M)leaves were subjected to whole-genome transcriptprofiling (Fig. 3A). Additionally, the aerial parts ofwhole seedlings at stage 1.03 (Boyes et al., 2001) wereincluded and compared with the leaf samples. Tocomplement the transcript data, metabolites weremeasured in 1.03 seedlings and E and M leaf samples.The small size of the P leaves prompted the develop-ment of a microdissection method with RNAlater (see“Materials and Methods”) that made the samplesunsuitable for metabolite measurements. At the timeof harvest, growth rates of control and stressed plantswere identical, allowing us to study growth adaptation
to drought rather than growth inhibition. Statisticalanalysis was used to identify significant changes withrespect to developmental stage (P, E, and M [“signif-icant leaf stage effect”]; Supplemental Table S1) andtreatment (with and without 25 mM mannitol [“signif-icant osmotic stress effect”]; Supplemental Tables S2–S5). Differential transcripts were investigated withMapMan for pathway visualization (Thimm et al.,2004) and PageMan to calculate functional overrepre-sentation of MapMan categories (Usadel et al., 2006;Fig. 4; Supplemental Fig. S5). Data were also comparedwith selected publicly available microarray experi-ments, mainly fromAtGenExpress (see “Materials andMethods”; Supplemental Table S3).
Transcript and Metabolite Changes during NormalLeaf Development
To establish a baseline of changes associated withnormal leaf development, transcripts and metabo-lites with significant leaf stage effects were identified
Figure 2. Kinematic analysis of leaf 3 dissected fromplants grown with or without 25 mM mannitol from 9to 22 DAS. A, Leaf area. B, Cell number. C, Cell size.D, Relative leaf growth rate (RLGR). E, Relative celldivision rate. F, Relative cell expansion rate. G, SI. H,Example of cell drawings of epidermal cells. I, Cellperimeter per cell area (perimeter/area) from epider-mal cells. Data are means 6 SE of three independentexperiments. Leaves 8 to 10 were used to measureleaf area. Cellular data are from four leaves in eachexperiment.
Development Mediates Leaf Stress Response
Plant Physiol. Vol. 152, 2010 229

(0–0 mM), providing details on proliferating-to-expanding (P/E) and expanding-to-mature (E/M) stagetransitions. In total, 2,800 transcripts could be assignedto eight expression clusters with 2-fold expression andglobal test (,0.05) cutoffs between any of the twostages, and the abundance of 12 metabolites variedbetween E and M leaves (Supplemental Fig. S5; Sup-plemental Tables S1 and S4). As expected, the tran-scriptome of P leaves (group 1 in Supplemental Fig.S5) was enriched for categories linked to mitotic cellcycle and cell division; E leaves were characterized byhigh expression of cell wall-related genes (group 2),while senescence markers (e.g. SEN1 and NAC92)appeared exclusively in M leaves. The expression ofgenes associated with the mitotic cell cycle, such asB-type cyclins and kinesins, was reduced sharply at theP/E transition (group 1), whereas transcripts related toDNA and protein synthesis decreased gradually acrossthe three developmental stages (group 7). Transcriptsrelated to photosynthesis, primary and secondary me-tabolism, light signaling, transport, and auxin andredox regulation increased at the P/E transition andremained high in M leaves (group 4). Exit from expan-sion into maturity resulted in further changes: on theone hand, transcripts associated with cell wall and fattyacid metabolism (group 6), a number of amino acids(e.g. Gln and Asn), and organic acids (such as citricacid) decreased; on the other hand, abiotic stress-relatedpathways, such as genes encoding enzymes from raf-finose metabolism, peaked in the M leaves (Supple-mental Fig. S5). In summary, these data demonstrateextensive differences, consistent with known processes,between the three developmental stages, confirmingthe growth analysis and verifying the sample selectionand harvesting protocols.
Adaptation to Osmotic Stress Depends on the Leaf
Developmental Stage
Mild osmotic stress (25 mM mannitol) resulted inalterations in the levels of several hundred transcripts.In total, 399, 741, and 614 transcripts were up-regulatedand 97, 632, and 374 transcripts were down-regulated inP, E, and M leaves, respectively (Fig. 4A; SupplementalTable S2). Based on the Venn diagram, we delineatedlists of genes with altered expression levels due toosmotic stress in one or more developmental stages,revealing hundreds of transcripts affected by mannitolexclusively in one leaf stage and only very few genesthat were differentially expressed across the threestages. Overall, the stress response in P and E leaveswas more similar, while in fully grown M leaves it wasmost distinct, especially when compared with P leaves(Fig. 4B). Similarly, metabolite analysis of E and Mleaves revealed distinct metabolite profiles (Fig. 5;Supplemental Table S4). Expression of 24 genes thatwere differentially up- or down-regulated by osmoticstress in one or more of the leaf stages and belonged todifferent functional categories was checked with quan-titative reverse transcription (qRT)-PCR (SupplementalFig. S6). The majority of the changes could be validatedin independent mannitol and PEG experiments.
Seedling Samples Are Most Similar to the E Leaves
To learn howmany stress-regulated genes andmetab-olites would have been detected with whole seedlings,osmotic stress effects on transcriptome andmetabolomeof three leaf stages were compared with seedling shootsat stage 1.03. For the seedling, 244 up-regulated and 59down-regulated genes and four up-regulated and 12down-regulated metabolites were detected, altogetherconsiderably fewer than for any of the leaf developmen-tal stages (Supplemental Table S2). Overall, the changeswere most consistent with those of growing and partic-ularly E leaves; more than 80% of the changes were alsomeasured in the E samples (Supplemental Fig. S7).Importantly, almost none of the transcripts that changedexclusively in thePorMstagewere found in the seedlingsamples. In summary, utilizing whole shoots substan-tially diluted information and stressed the value ofsampling leaves at different developmental stages.
M Leaves Are Characterized by Classical Drought
Response While Biotic Stress Genes Are Up-Regulated inthe Growing Leaves
In addition to the dissection of responsive genesthrough the overrepresentation analysis of MapManfunctional categories, we investigated whether thesegenes were affected in other microarray experiments(see “Materials and Methods”). Comparison with thepublicly available stress expression data revealed sig-nificant overlap, irrespective of the leaf stage (Supple-mental Table S3). However, only M and, to a lesserextent, E leaves showed the classical water stressresponse as determined in previous whole-plant stud-
Figure 3. Experimental setup. A, Schematic representation of Arabi-dopsis leaf development. P cells, red; E cells, green; and M cells, white.The scale bar only applies to the leaves, not to the representation of theSAM. Leaf 3 initiates at approximately 5 DAS; all cells proliferate at 9DAS, expand exclusively around 15 DAS, and approach maturity at 22DAS, both under control and stress conditions. Samples for profilinganalysis were dissected at 9, 15, and 22 DAS. B, GUS activity stainingof leaf 3 from CYCB1;2-GUS plants at 9 DAS grown without or with 25mM mannitol. The expression of CYCB1;2 is closely related to celldivision activity.
Skirycz et al.
230 Plant Physiol. Vol. 152, 2010

ies. Expression of abiotic stress markers (e.g. RD29B,RD29A, RD22, and ATHVA22E), LEA genes (e.g.COR15 and ERD10), and genes involved in fatty acidbiosynthesis (e.g. CER1 and KCS1) and lipid transfer,important for cuticle thickening, was induced (Fig.4C; Table I; Supplemental Tables S2 and S3). The role ofabscisic acid (ABA) during abiotic stress is welldocumented, and comparison with ABA additiondata revealed a significant overlap for both E and Mleaves (Supplemental Table S3), and expression of
genes encoding the ABA biosynthetic enzymes,AAO1 and AAO2, was also induced (Table I). Pro, atypical drought-induced metabolite, its precursor Gln,and other metabolites classically associated withdrought stress, erythritol and putrescine, accumulatedexclusively in M leaves (Supplemental Fig. S5; Sup-plemental Table S4). Moreover, induced expression ofCHS, FLS, and PAP1 genes suggested a possible accu-mulation of flavonol compounds, again specifically inthe M leaves (Table I; Supplemental Table S2).
Figure 4. Functional analysis of tran-scripts that are significantly affected byosmotic stress. A, Venn diagram group-ing of genes differentially regulated byosmotic stress in P, E, and M leaves(global test; P , 0.05). B, Log2 foldchanges (25–0 mM) for all analyzedgenes (.20,000) used to constructscatter plots. Note the similarity be-tween responses of P and E leaves andalmost no overlap between P and Mstages. C, Functional analysis withMapMan categories and the PageManoverrepresentation tool. Significantlyenriched or depleted functional groupsare represented in blue or red, respec-tively. CHO, Carbohydrate; DUF, do-main of unknown function.
Development Mediates Leaf Stress Response
Plant Physiol. Vol. 152, 2010 231
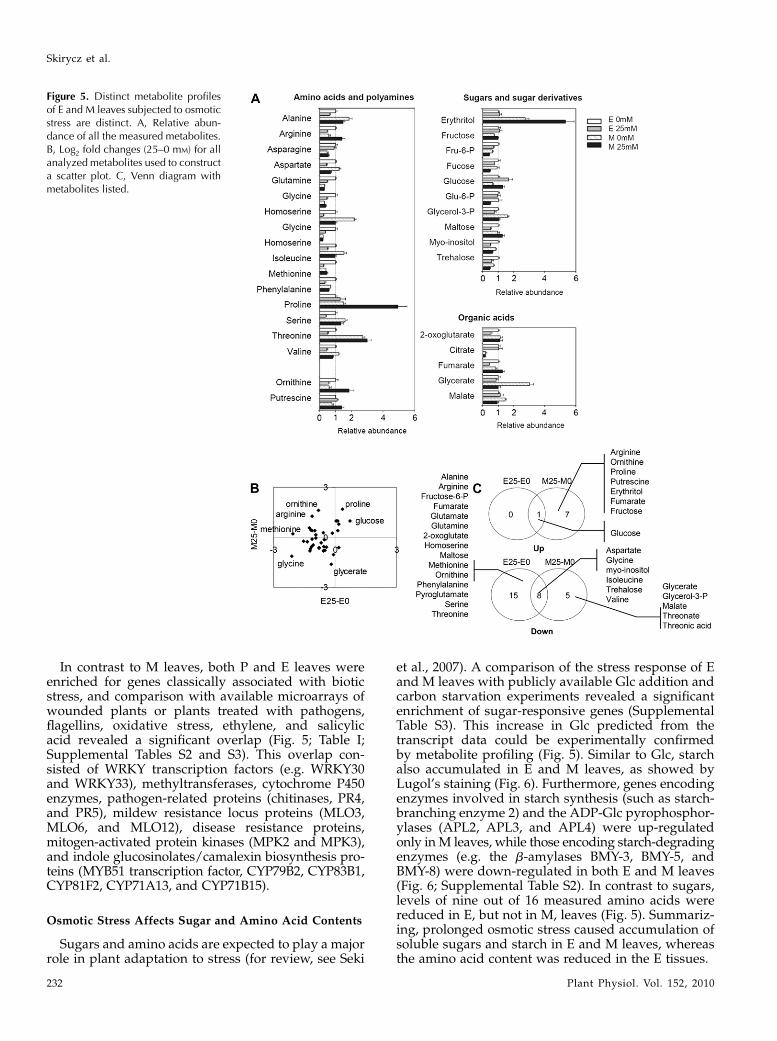
In contrast to M leaves, both P and E leaves wereenriched for genes classically associated with bioticstress, and comparison with available microarrays ofwounded plants or plants treated with pathogens,flagellins, oxidative stress, ethylene, and salicylicacid revealed a significant overlap (Fig. 5; Table I;Supplemental Tables S2 and S3). This overlap con-sisted of WRKY transcription factors (e.g. WRKY30and WRKY33), methyltransferases, cytochrome P450enzymes, pathogen-related proteins (chitinases, PR4,and PR5), mildew resistance locus proteins (MLO3,MLO6, and MLO12), disease resistance proteins,mitogen-activated protein kinases (MPK2 and MPK3),and indole glucosinolates/camalexin biosynthesis pro-teins (MYB51 transcription factor, CYP79B2, CYP83B1,CYP81F2, CYP71A13, and CYP71B15).
Osmotic Stress Affects Sugar and Amino Acid Contents
Sugars and amino acids are expected to play a majorrole in plant adaptation to stress (for review, see Seki
et al., 2007). A comparison of the stress response of Eand M leaves with publicly available Glc addition andcarbon starvation experiments revealed a significantenrichment of sugar-responsive genes (SupplementalTable S3). This increase in Glc predicted from thetranscript data could be experimentally confirmedby metabolite profiling (Fig. 5). Similar to Glc, starchalso accumulated in E and M leaves, as showed byLugol’s staining (Fig. 6). Furthermore, genes encodingenzymes involved in starch synthesis (such as starch-branching enzyme 2) and the ADP-Glc pyrophosphor-ylases (APL2, APL3, and APL4) were up-regulatedonly inM leaves, while those encoding starch-degradingenzymes (e.g. the b-amylases BMY-3, BMY-5, andBMY-8) were down-regulated in both E and M leaves(Fig. 6; Supplemental Table S2). In contrast to sugars,levels of nine out of 16 measured amino acids werereduced in E, but not in M, leaves (Fig. 5). Summariz-ing, prolonged osmotic stress caused accumulation ofsoluble sugars and starch in E and M leaves, whereasthe amino acid content was reduced in the E tissues.
Figure 5. Distinct metabolite profilesof E and M leaves subjected to osmoticstress are distinct. A, Relative abun-dance of all the measured metabolites.B, Log2 fold changes (25–0 mM) for allanalyzed metabolites used to constructa scatter plot. C, Venn diagram withmetabolites listed.
Skirycz et al.
232 Plant Physiol. Vol. 152, 2010

Osmotic Stress and Hormonal Cross Talk in theGrowing Leaves
As hormonal cross talk plays an essential role forboth growth and environmental responses, transcrip-tome data were compared with available hormoneaddition experiments (Goda et al., 2008). This com-parison revealed that ethylene-responsive genes wereenriched among the transcripts affected in P and Eleaves (Supplemental Table S3). Osmotic stress signif-icantly enhanced the expression of genes encodingethylene signaling components, such as ethylene re-
ceptors (ESR1 and ESR2) and ethylene response factors(ERF2, ERF4, and ERF5; Fig. 7A; Supplemental TableS2). Consistent with the expression data, the growth ofethylene-insensitive mutants was more sensitive to25 mM mannitol, and mutants developed severe phe-notypes characterized by growth arrest and curled,pale leaves. As anticipated, the ein2.5 plants, for whichthe ethylene insensitivity was the strongest, alsoresponded most clearly to the mannitol treatment(Fig. 7, B and C). Moreover, we found a possibleinvolvement of gibberellin (GA) signaling in growth
Table I. List of selected key genes involved in the biological processes affected by osmotic stress
Expression changes are presented as log2. Significance (global test; P , 0.05) is indicated in boldface.DELLA targets identified by Navarro et al. (2008) are marked with X.
Locus Name Log2 P25-0 Log2 E25-0 Log2 M25-0 DELLA
Abiotic stress markersAT5G52300 RD29B 20.19 0.31 1.61AT5G52310 RD29A 20.59 1.52 1.40AT2G42540 COR15A 20.13 0.88 1.12AT5G25610 RD22 0.71 1.38 1.09AT2G42530 COR15B 20.09 1.25 1.03AT1G20450 ERD10 20.22 1.25 0.99AT2G17840 ERD7 20.09 0.36 0.94AT1G01470 LEA14 20.24 0.59 0.83AT2G30870 ERD13 0.71 1.20 0.79AT4G19120 ERD3 20.25 0.12 0.52
Fatty acids/cuticleAT1G01120 KCS1 0.41 0.03 0.59AT2G38530 LTP2 0.83 6.09 1.12AT2G38540 LTP1 0.06 0.61 0.49AT1G02205 CER1 20.07 20.09 1.01AT1G68530 CUTICULAR 1 0.27 0.61 0.46AT1G67730 GLOSSY8 0.07 0.44 0.45
ABA synthesisAT5G20960 AAO1 0.50 1.21 0.79AT3G43600 AAO2 0.07 0.77 0.55
FlavonoidsAT5G13930 CHS 20.36 20.02 1.16AT5G08640 FLS 20.46 20.31 0.87AT1G56650 PAP1 TF 20.01 0.73 0.84
Biotic stress markersAT2G39200 ATMLO12 0.93 3.08 0.40AT3G45290 ATMLO3 1.55 1.54 0.29AT1G61560 ATMLO6 0.56 0.82 0.00AT2G44490 PEN2 1.60 1.01 20.04 XAT4G01700 Chitinase 2.26 1.94 20.11 XAT1G33590 Disease resistance 1.30 0.93 0.51 XAT3G45640 MPK3 0.62 0.97 0.05 XAT1G59580 MPK2 0.42 0.47 0.26AT1G75040 PR-5 2.19 3.65 0.47AT4G23810 WRKY53 1.34 1.52 0.04AT2G38470 WRKY33 1.08 2.75 0.00 XAT2G23320 WRKY15 0.76 0.59 0.17 X
Indole glucosinolates/camalexinAT5G57220 CYP81F2 1.82 3.80 0.04AT2G30770 CYP71A13 2.42 2.65 0.37AT4G39950 CYP79B2 1.61 2.14 0.91AT2G22330 CYP79B3 0.19 1.28 0.84AT4G31500 CYP83B1 0.24 0.89 0.39AT1G18570 MYB51 0.99 1.68 0.22 X
Development Mediates Leaf Stress Response
Plant Physiol. Vol. 152, 2010 233

adaptation, as predicted targets of the DELLA tran-scription factors were very significantly enriched inthe P and E samples (Table I; Supplemental Table S3).In contrast, auxin-responsive genes were specificallydown-regulated in E leaves (e.g. SHY1, SHY2, BDL,and PIN1); accordingly, the response of P and E leavesshared a significant similarity with the transcriptionalresponse to chemical treatments employing auxininhibitors (2,3,5-triiodobenzoic acid and 2,4,6-trichlo-rophenoxyacetic acid; Fig. 7A; Supplemental Table S3).
Cell Wall Metabolism Is Affected in the E Leaves
To explain the reduced growth of mannitol-treatedseedlings, genes involved in cell division and cellexpansion are among the prime suspects. Osmoticstress resulted in the differential expression of manycell wall-related genes, of which the majority were inthe E leaves (Fig. 8A; Supplemental Table S2). Overall,genes related to cell wall synthesis (cell wall precur-sors and cellulose synthesis) and those encodingarabinogalactan proteins were down-regulated, whilegenes involved in conferring cell wall extensibility(xyloglucan transferases and expansins) and cell walldegradation were evenly distributed among up- anddown-regulated transcripts. Interestingly, expressionwas induced for three pectin methyl esterase genesthat can mediate changes in cell wall pH. Additionally,considering the proposed role of superoxide in affect-ing cell wall extensibility, we utilized nitroblue tetra-zolium (NBT) staining to investigate superoxideaccumulation in the growing and M leaves. Thisanalysis revealed that superoxide levels increasedexclusively in mannitol-grown E leaves (Fig. 8B),while no accumulation could be detected in P or Mleaves. No significant differences were found in tran-scripts of either the core cell cycle (Vandepoele et al.,2002) or associated with cell division (Menges et al.,2003), consistent with identical cell proliferation ratesat the time P samples were taken.
Alternative Respiration Is of Key Importance for
Cell Division
Of the interesting transcripts induced by mannitolexclusively in the P leaves was the gene encoding analternative oxidase (AOX1a) that plays a major role inthe alternative respiratory pathway in Arabidopsismitochondria (Giraud et al., 2008, 2009; Ho et al., 2008).AOX1a was strongly coexpressed with a number ofgenes referred to as “mitochondrial dysfunction reg-ulon” (Van Aken et al., 2007), containing other mito-chondrial genes (mitochondrial small heat shockprotein HSP23.5, AAA-type ATPase BCS1, NADHdehydrogenase NDB4, and unknown proteins targetedto the mitochondria), MATE transporters, glutathioneS-transferases, transcription factors, cytochrome P450,and steroid sulfotransferase. Sixteen out of these 25genes were also up-regulated by mannitol, of which 13responded only in the P leaves (Fig. 9A). To confirmthese changes and to provide further spatial resolu-tion, promoter:GUS reporter lines were constructedfor eight of the 13 overlapping mitochondrial dysfunc-tion regulon genes (see “Materials andMethods”). Theobtained GUS staining agreed very well with themicroarray data, confirming induction for seven outof eight genes in the P or P and E leaves (Fig. 9, A andB; Supplemental Fig. S8). At the spatial level, GUSinduction was not just observed in fully P leaves butalso in leaves that were partially P (i.e. that hadalready started to differentiate at their tip; Fig. 9B;Supplemental Fig. S8). Moreover, this analysis allowedthe response of other leaves to be studied. Inductionwas not restricted to leaf 3 but could be observed inyoung leaves throughout plant development. To in-vestigate whether changes in the expression of genesfrom the mitochondrial dysfunction regulon trans-lated into a cellular phenotype, mitochondria of SAMand P leaves were examined by transmission electronmicroscopy (Fig. 9, C and D). A significant differencein the SAM sections of the mannitol-grown seedlings
Figure 6. Increased starch levels inmannitol-grown plants. A, MapManrepresentation of starch metabolism.Red and blue, Down-regulated and up-regulated genes, respectively; E25-E0and M25-M0, E and M leaves (25–0mM), respectively. B, Lugol’s staining of15-DAS plants harvested 8 h into theday. Note intense blue staining of themannitol-grown seedling.
Skirycz et al.
234 Plant Physiol. Vol. 152, 2010

was the presence of large mitochondria. In addition, inboth SAM and leaf sections, mitochondria wererounder, which could be expressed as increased circu-larity index.The proposed role of AOX is to prevent overreduc-
tion of the mitochondrial electron transport chain(mETC) under stress conditions and, therefore, theformation of ROS. Accordingly, superoxide levelswere comparable in control and stressed P leavesvisualized with NBT staining (Fig. 8B). Another pro-posed role of alternative respiration is to enable ATP
production directly from the glycolysis and to supportgrowth under conditions in which the mETC is in-hibited, such as drought stress. To determine whetherAOX plays a role in growth adaptation, the growth ofAOX1a-overexpressing plants (AOX-OE) was mea-sured with or without mannitol. Leaf areas wererecorded daily between 9 and 23 DAS, and theobtained data were used to calculate the percentageof reduction of leaf area caused by stress. Early on andunder optimal conditions, the leaf area of AOX-OEplants was reduced by approximately 20%, but it
Figure 7. Importance of ethylene signaling for stresstolerance of growing leaves. A, Expression changesfor the selected genes involved in ethylene, GA, andauxin signaling and metabolism. Boldface indicatessignificance (global test; P , 0.05). B, Analysis ofethylene-insensitive mutants. Plants that developed asevere phenotype (curled pale leaves, growth arrest)were scored and used to calculate percentage of the“healthy”-looking seedlings. Stars indicate signifi-cance (t test; P , 0.05). Data are means 6 SE ofmultiple plates. C, Wild-type and ein2.5 plantsgrown on medium without or with 25 mM mannitol.[See online article for color version of this figure.]
Figure 8. Cell wall-related genes and superoxidelevels affected by osmotic stress in the E leaves. A,Expression changes for the selected genes involved incell wall metabolism. Boldface indicates significance(global test; P , 0.05). B, Superoxide levels visual-ized in leaf 3 from 9- and 15-DAS plants grownwithout (left) or with (right) mannitol stained withNBT. [See online article for color version of thisfigure.]
Development Mediates Leaf Stress Response
Plant Physiol. Vol. 152, 2010 235

caught up with control plants by 19 DAS (Fig. 9E). Atthe same time, the leaf area measured for plants grownon mannitol was the same or even larger for AOX-OEplants, which translated into a lower percentage ofreduction, on average by approximately 7% to 8%(Fig. 9F). To investigate whether the enhanced growthof AOX-OE plants under osmotic stress would trans-late into better performance under drought, an in soildrought assay was developed. Water-saturated soilwas used to germinate seeds, allowed to dry until itreached a relative water content (RWC) of 68% (con-trol conditions), 60% (mild drought), or 55% (severe
drought), and afterward RWCwas kept constant (Fig.10A). Similar to the in vitro AOX-OE plants, plantswere smaller under normal conditions, but we mea-sured no differences in daily changes in soil waterstatus between wild-type and AOX-OE plants (Fig.10B). Importantly, relative growth rates of wild-typeand AOX-OE plants measured under control condi-tions were not significantly different, indicating thatthe observed size reduction arose during early seed-ling establishment. Mild and severe drought resultedin decreased growth rates; as a consequence, the finalsize of the wild-type rosettes was reduced by 16% and
Figure 9. Importance of alternative respiration in P leaves. A, Log2 fold change of genes from the mitochondrial dysfunctionregulon in long-term mannitol experiments measured in P, E, and M leaves. Arrows indicate genes used for promoter:GUSanalysis; green, orange, and red arrows indicate expression validated by GUS staining, in one of two GUS lines, and notvalidated, respectively. B, Photographs of 15-DAS plants of two promoter:GUS lines. The arrows mark young, P leaves (noteinduction of both genes). The red dots indicate the third E leaf (note induction of At4g37370 gene only). Photographs of the thirdleaf from the 9-DAS At4g37370:GUS line showed a strong induction. C, Transmission electron micrographs of control andmannitol-grown plants (P leaf 3 and SAM)were used to calculate area and circularity of the mitochondria. Data are means6 SE of40 to 60 mitochondria. D, Transmission electron micrographs of SAM from control and mannitol-grown seedlings. Arrows pointto mitochondria clusters. E and F, Leaf area measured for leaf 3 dissected from control (Col-0) and AOX1a-OE plants grownwithout or with 25 mM mannitol from 9 DAS until 22 DAS. Obtained data were used to calculate percentage reduction undercontrol conditions (AOX-OE, 0 mM; Col-0, 0 mM; E) and stress conditions (25 mM/0 mM; F). Data are means 6 SE of eight to 10leaves.
Skirycz et al.
236 Plant Physiol. Vol. 152, 2010

27% (at 20 DAS), respectively (Fig. 10, C and D). Likeosmotic stress, this reduction was lower for the twoindependent AOX-OE lines due to higher growthrates (Fig. 10, C and E). In addition to overexpressors,also aox1a knockout plants were included in theexperiment. These plants were 15% larger undernormal conditions but had no growth phenotypeunder drought stress (Fig. 10B), possibly due to theredundancy with other AOX genes. In conclusion,our data indicate that changes in mitochondrial me-tabolism support cell proliferation under stress con-ditions.
DISCUSSION
Phenotypic Plasticity of Arabidopsis Leaves toWater-Limiting Conditions
Phenotypic plasticity allows a plant to manage itsresources under changing environmental conditions.Reduction of the final leaf size is an important adap-tive response tomany abiotic and biotic stresses. Stablesoil water deficits affect both the final cell number andthe size of Arabidopsis leaves; however, it is stillunclear how these changes arise (Aguirrezabal et al.,2006). Here, we provide insight into the kinetics of leafgrowth under steady and relatively mild osmoticstress that, similar to drought, reduces both cell num-
ber and size. Reduction of cell number was shown tooccur during very early leaf development. From ap-proximately 4 d after leaf initiation (9 DAS) onward,cell division rates were indistinguishable or evenslightly higher in stressed plants than in control plants.It is plausible that stress affects the duration of the firstfew divisions in the emerging leaves and/or fewercells are recruited from the meristem into the leafprimordia. The latter would imply regulation of theleaf size at the SAM level, which, to our knowledge,has not been described previously. On the contrary, theSAM size has previously been associated with numberrather than with size of initiated leaves (Clark et al.,1993; Mauseth, 2004; Boucheron et al., 2005). Similar tocell number, cell size was also reduced by stress earlyin leaf development, with expansion rates that werelower during the first few days after cell differentiationand became indistinguishable or higher in stressedversus control plants from 15 DAS onward. Thesehigher cell division and expansion rates measured lateduring the proliferation and expansion stages, respec-tively, marginally compensated the initial reduction incell number and size. This observation is in agreementwith previous studies demonstrating compensationoccurring in Arabidopsis leaves subjected to drought(Aguirrezabal et al., 2006; Pereyra-Irujo et al., 2008).Stress not only affected final leaf size but also the SI,resulting in decreased stomatal density, which can beinterpreted as an adaptation to minimize water loss.
Figure 10. Less reduced growth of theAOX-OE plants during soil drought. A, RWC determined throughout the experiment (6–20DAS) based on pot weight taken before watering. Stress treatment started at 13 DAS (arrow) when control plants were firstwatered to RWC of 68%. Black and gray lines, Col-0 and AOX-OE plants, respectively. B, Percentage reduction of AOX-OE andaox1a rosette area compared with wild-type (Col-0) plants measured under control conditions (RWC 68%). C, Percentagereduction of Col-0 and AOX-OE rosette area under mild (RWC 60%) and severe (RWC 55%) drought compared with controlconditions from 13 to 20 DAS (duration of stress treatment). D, Relative growth rates (RLGR) of Col-0 under control and droughtconditions. Note reduction of RLGR associated with stress onset (arrow). E, RLGR of Col-0 and AOX-OE plants under control anddrought conditions. Arrows indicate start of stress treatment. Note the less reduced RLGR measured for AOX-OE plants (crosses).Data are means6 SE from eight to 10 plants for each genotype and treatment. AOXOE_X3 and AOXOE_XXL are two independentAOX1a-overexpressing lines, while aox1a stands for the AOX1a knockout mutant.
Development Mediates Leaf Stress Response
Plant Physiol. Vol. 152, 2010 237

Similar observations had been made previously forbirch (Betula pendula; Paakkonen et al., 1998) and senna(Cassia angustifolia; Ratnayaka and Kincaid, 2005).While the number of stomata decreased, trichomedensity increased. Trichomes are known to positivelyaffect the water economy in leaves, primarily throughthe increased reflection of solar radiation and reduc-tion of leaf temperature and, hence, transpiration rate.Accordingly, trichome density has proved to be animportant adaptive trait to drought stress (Gianoli andGonzalez-Teuber, 2005). It would be interesting toinvestigate how mild drought stress affects the signal-ing networks involved in stomata and trichome de-velopment. In conclusion, leaf growth rate can verywell adapt to stress conditions, and the initial reduc-tion of cell proliferation and cell expansion can beconsidered as an important adaptive response to gen-erate smaller organs. Importantly, the obtained growthdata provided a basis for sample selection for furtherprofiling analysis. As growth rates of stressed andcontrol plants were identical at the time of sampling,growth adaptation rather than growth repression wasclearly under investigation.
Response of Arabidopsis Leaves to Osmotic StressDepends on the Developmental Stage
Developmental input into the stress response ofgrowing and M leaves is the major contribution of thiswork and allowed the identification of candidate pro-cesses involved in growth adaptation to stress. Al-though it could be anticipated that the response toosmotic stress would differ between leaves at differentdevelopmental stages, the extent of these differenceswas greater than expected. Only 20 genes, mainlygeneral stress markers such as CYP79B2 and chitinase(At2g43570), were up-regulated by osmotic stress at allthree leaf stages, while hundreds of transcripts and anumber of metabolites changed exclusively at one leafstage. Importantly, osmotic stress response of P and Eleaves shared high overlap, pointing to commonmechanisms that allow growth adaptation to stress inaddition to stage-specific processes. A much smaller,but significant, overlap was also measured betweenstress response of E and M leaves, both at the tran-script and metabolite levels, most probably illustratingtheir photosynthetic status. Virtually no overlap wasdetected between P and M leaves. Additionally, theobtained results strongly argue that by zooming in onselected developmental stages, a serious dilution ofinformation is avoided and that even a relatively mildstress results in hundreds of transcript and multiplemetabolite changes that would not be identified usingwhole-seedling data. Finally, our work demonstratedthat young Arabidopsis seedlings are most similar tothe E leaves. In conclusion, similar to the transcrip-tional responses to high salinity of specific root celltypes (Dinneny et al., 2008), this work argues for theimportance of spatial and developmental resolution to
fully understand different aspects of stress tolerance ofmulticellular organisms.
Classical Stress Response Dominates in M Leaves
Published profiling experiments, performed mainlyon M leaves (Bouchabke-Coussa et al., 2008; Giraudet al., 2008; Perera et al., 2008; Zhang et al., 2008) orcomplete plant shoots (Seki et al., 2002; Catala et al.,2007; Kilian et al., 2007; Matsui et al., 2008; Westonet al., 2008; Zeller et al., 2009) and under relativelysevere drought or osmotic conditions (Seki et al., 2002;Catala et al., 2007; Matsui et al., 2008; Urano et al.,2009), have led to the identification of a set of tran-scriptional and metabolic responses associated withdrought stress. Also in our experiments, M leavesshowed the classical drought stress response, validat-ing the treatment (for an overview, see Fig. 11), but theresponse was much less pronounced in E leaves andonly marginal in P leaves. Accumulation of LEAproteins, Pro, and flavonoids in the M leaves couldbe related to their role in protecting the photosyntheticand enzymatic machinery of source leaves againstoxidative damage that would be less important in E,but particularly in P, leaves (Havaux and Kloppstech,2001; Mowla et al., 2006; Verslues et al., 2006, andrefs. within). Accordingly, diaminobenzidine and NBTstaining revealed no differences in either hydrogenperoxide or superoxide levels in M leaves or in theoperating efficiency of PSII. In fact, both starch andreducing sugars (Glc and Fru) accumulated in both E
Figure 11. Schematic representation of processes, genes, and metab-olites (boldface) affected by stress (25–0 mM). PMEs, Pectin methylesterases; TFs, transcription factors. Dark gray (red online), light gray(green online), and white represent P, E, and M cells, respectively. [Seeonline article for color version of this figure.]
Skirycz et al.
238 Plant Physiol. Vol. 152, 2010

and M leaves, indicating carbon abundance. Glc couldcontribute to a decrease in cell water potential and hasbeen observed to increase in Arabidopsis and in grape-vine (Vitis vinifera) subjected to long-term drought(Rizhsky et al., 2004; Cramer et al., 2007). The role ofstarch is less clear and is possibly the indirect effect ofGlc accumulation. In addition, production of waxesand cuticle thickening, as circumstantially suggestedby the microarray data, would further prevent waterloss from the leaf surface (Samuels et al., 2008). Inconclusion, M and, to a lesser extent, E leaves tolerateosmotic stress by exploiting classical drought responses,validating the osmotic stress assay as a good proxy fordrought stress.
DELLA and Ethylene Cross Talk in Growth Regulation ofP and E Leaves
Only a few genes and metabolites have been shownto be involved in the regulation of leaf growth underadverse environmental conditions (Granier and Tardieu,2009). Among these, a prominent role belongs to theDELLA transcription factors. Different abiotic andbiotic stresses affect GA levels, stabilizing DELLA,which in turn restrict plant growth and activate toler-ance mechanisms, possibly by modulating ROS me-tabolism (Achard et al., 2006, 2008; Navarro et al.,2008). Microarray analysis revealed a clear involve-ment of DELLA and ethylene-responsive genes in theadaptation of the P and E leaf tissues to mild osmoticstress. Ethylene, which accumulates under stress, hasimportantly been shown to cross talk with DELLAfactors, promoting their stabilization in both GA-dependent and -independent manners (for review,see Yoo et al., 2009). Thus, ethylene and GA seeminglyplay a major role in regulating both cell proliferationand expansion under stress conditions, whereas ABAis mainly important in the M tissues. Further supportof this finding was provided by the proposal thatethylene is a primary drought signal for growingleaves while ABA is a primary drought signal for theM leaves of tomato (Solanum lycopersicum; Sobeih et al.,2004). The importance of ethylene signaling could befurther validated with ethylene-insensitive mutantsthat were much more sensitive to mild osmotic stress.The strength of the phenotype corresponded verywell with the degree of ethylene insensitivity. Whileein2.5 plants were characterized by almost completegrowth arrest, the performance of the weak ethylene-insensitive mutant eil1 was comparable with that ofwild-type plants. Activation of the ethylene signalingcould also explain the up-regulation of at least aproportion of genes classically associated with bioticstress measured in the growing leaves, and these willbe interesting targets to study their role in osmoticstress tolerance. Extensive overlap between abioticand biotic signaling has been reported previously, soit is not surprising that genes classically associatedwith biotic stresses could also play an importantrole under abiotic conditions (Narusaka et al., 2004;
Kankainen et al., 2006; for review, see Fujita et al., 2006;Walley et al., 2007). Good examples are the diseaseresistance regulator OCP3, PR-3, and GmERF3, re-cently shown to confer tolerance not only to biotic butalso to abiotic agents, including drought, salt, andosmotic stress (Seo et al., 2008; Ramırez et al., 2009;Zhang et al., 2009). In summary, although ABA, eth-ylene, and DELLA proteins have been implicated instress tolerance previously, the temporal context showsthat they are developmentally separated. Additionally,our work presents a number of candidate genes clas-sically associated with biotic stress, such as WRKY(WRKY53, WRKY15, and WRKY33) and ERF (ERF5and ERF2) transcription factors, to test their functionin stress tolerance and growth adaptation to osmoticstress. Interestingly, WRKY15 and WRKY33 were alsoamong the DELLA target genes (Navarro et al., 2008).
Cell Wall Loosening Drives Cell Expansion at the LowerTurgor Pressure
Water loss changes turgor pressure and, thus, directlyaffects cell expansion. Previous work, done primarilyon maize (Zea mays) roots, has demonstrated that cellwall loosening facilitates growth at low turgor pres-sures. Abundance and activity of cell wall-looseningenzymes (expansins and xyloglucan endotransgluco-sylase/hydrolases [XTHs]), pH, ROS accumulation,and cellulose production have been proposed to beinvolved in the increasing cell wall extensibility (Wuand Cosgrove, 2000; Sharp et al., 2004; Zhu et al., 2007;Moore et al., 2008). We provide evidence for similarmechanisms acting in E leaves of Arabidopsis sub-jected to osmotic stress. Superoxide levels were exclu-sively elevated in the E leaves, consistent with earlierfindings showing that the generation of hydroxylradicals from superoxide and hydrogen peroxideplays a direct role in cell wall loosening via polysac-charide cleavage under both favorable and droughtstress conditions (Liszkay et al., 2003; Zhu et al., 2007).The expression of a number of genes involved in theregulation of cell wall extensibility was up-regulated(for review, see Moore et al., 2008), encoding expansinsand XTHs including EXP10 and XTH19 (Cho andCosgrove, 2000; Vissenberg et al., 2005; Osato et al.,2006). Wall-loosening activity of expansins has beenlinked to acidic growth (Cosgrove, 2000), and micro-array data revealed up-regulation of three genes en-coding pectin methyl esterase (AT4G02330, AT2G26440,and AT4G33220) that can reduce the cell wall pH byconverting methoxyl groups of pectins to carboxylgroups accompanied by proton release (Wen et al.,1999). Finally, expression of cellulose synthesis geneswas reduced, which might result in further cell wallweakening. Decrease of cellulose content was observedin tobacco (Nicotiana tabacum) cell cultures treated withhigh concentration of PEG, which had been proposed todivert carbon from cell walls into compatible solutesynthesis, contributing to the osmotic adjustment (Irakiet al., 1989). In conclusion, these data emphasize the
Development Mediates Leaf Stress Response
Plant Physiol. Vol. 152, 2010 239

importance of the cell wall for growth adaptation ofArabidopsis leaves subjected to long-term osmoticstress and identify a number of candidate genes in-volved in cell wall loosening, such as XTH19 and threepectin methyl esterases.
Alternative Respiration Is Essential in the P Leaves
The mitochondrial dysfunction regulon comprises25 genes that are tightly coexpressed under a numberof stress treatments that affect the mitochondrial elec-tron transport chain and up-regulated in the trans-genic lines overexpressing mitochondria-associatedprohibitin genes (Van Aken et al., 2007). Althoughthe exact role of the mitochondrial dysfunction regu-lon is still a subject of debate, proteins encoded by theregulon are probably involved in the maintenance ofmitochondrial function and morphology. One of theregulon genes encodes an alternative oxidase thatshortcuts the mETC by transferring electrons directlyto oxygen, providing plants with an alternative elec-tron transport pathway. As alternative respirationlimits oxidative phosphorylation and ATP production,it is mainly employed under stress conditions thatnegatively affect components of the mETC and ATPsynthase complex, thereby preventing ROS formation(Sweetlove et al., 2002; Umbach et al., 2005; Rhoadset al., 2006; Giraud et al., 2008; Ho et al., 2008).Moreover, together with cytosolic or mitochondrialNADH dehydrogenase, AOX provides a path to recy-cle cytosolic NAD+-supporting glycolysis and ATPsynthesis, via substrate phosphorylation, or to recycleNAD+ required for the tricarboxylic acid cycle and,hence, nucleotide and amino acid synthesis, respec-tively (for review, see Fernie et al., 2004). As energy,nucleotides, and amino acids are indispensable for celldivision and ROS can cause serious damage to repli-cating DNA, alternative respiration would certainly beof central importance for growth maintenance in the Pleaves. In accordance, expression of AOX1a, NDB4,and other genes of the mitochondrial dysfunctionregulon was induced in the P, but not the E or M,leaves. Moreover, larger and rounder mitochondriafound in the actively P cells of the SAM providefurther evidence to link the mitochondrial dysfunctionregulon with the maintenance of cell division ratesunder stress conditions. Promoter:GUS lines con-firmed the induction of genes of the mitochondrialdysfunction regulon in young P and differentiatingleaves throughout plant growth. As anticipated,growth of AOX-OE plants was less reduced by mildosmotic stress very early during leaf development,indicating that cell proliferation was responsible forthe observed phenotype. Importantly, better growthperformance was also measured under controlleddrought treatment in soil, providing evidence thatosmotic stress can be used as a good proxy fordrought. Importantly, we measured no differences indaily changes in soil water status between wild-typeand AOX-OE plants, indicating that all plants experi-
enced the same control and stress conditions, so theobserved growth improvement could not be solelyattributed to smaller AOX-OE rosette size. Smaller andlarger rosettes of AOX-OE and aox1a plants, respec-tively, further indicate that mETC is a preferableenergy source under favorable conditions and alter-native oxidation under stress conditions. Interestingly,enhanced growth was also observed for AOX-OEunder cold, although the cellular basis of this findingwas not investigated (Fiorani et al., 2005), and theaox1a mutant was much more sensitive to combineddrought and light stress (Giraud et al., 2008). Inconclusion, profiling data followed by targeted anal-ysis of the transgenic plants proved that alternativerespiration supports cell proliferation under stressconditions. Importantly, these results also indicate aprominent role for the other mitochondrial dysfunc-tion regulon genes that will be further studied inrelation to growth and stress regulation.
CONCLUSION
This study demonstrates that, rather than being asecondary effect of compromised photosynthesis andcarbon limitation, reduction of leaf growth is an im-portant adaptive response to osmotic stress. Molecularprofiling of actively growing and M leaves offereddevelopmental resolution to stress responses, allowingthe distinction of biological processes important for Mand/or growing leaves. By zooming in on selecteddevelopmental stages, a serious dilution of informa-tion was avoided, revealing new insights and demon-strating that many changes measured in whole plantsare in fact developmentally separated. The obtaineddata indicate that both cell proliferation and expansionare regulated by common regulatory cascades involv-ing ethylene and GAs but not ABA signaling, whiledownstream effector genes are stage specific. Amongthese are enzymes supporting cell expansion underlow turgor pressure and mitochondrial genes crucialfor maintaining cell proliferation. To validate profilingdata, the latter were confirmed with transgenic linesoverexpressing the AOX1a gene in both osmotic anddrought stress assays. Notably, data mining identifiedcandidate genes that would be interesting in relationto growth and stress regulation, such as those from themitochondrial dysfunction regulon and those encod-ing WRKYand ERF transcription factors. In summary,this work significantly contributes to the understand-ing of growth and stress physiology by providing adevelopmental input into stress responses and dem-onstrating the importance of mitochondrial metabo-lism in the P leaves.
MATERIALS AND METHODS
Plant Growth
Seedlings of Arabidopsis (Arabidopsis thaliana ecotype Columbia-0 [Col-0])
were grown in vitro in half-strength Murashige and Skoog (1962) medium
Skirycz et al.
240 Plant Physiol. Vol. 152, 2010

supplemented with 1% Suc under a 16-h-day (110 mmolm22 s21) and 8-h-night
regime. Before autoclaving, 25 mM mannitol (Sigma) was added to the agar
medium, while PEG-infused plates were prepared according to van der Weele
et al. (2000) with 10 mM overlay of PEG 3500 (Sigma).
Growth Analysis
Leaf 3 was harvested daily from 9 to 22 DAS from eight to 10 plants in three
independent experiments. After clearing with 70% ethanol, leaves were
mounted in lactic acid on microscope slides. Epidermal cells (40–100 cells)
were drawn for four leaves with a DMLB microscope (Leica) fitted with a
drawing tubus and a differential interference contrast objective, while leaves
were photographed under a binocular. Photographs of leaves and drawings
were used to measure the leaf area and the cell size, respectively, with the
ImageJ software. Leaf area and cell size were subsequently used to calculate
cell numbers. The SI is the percentage of stomatas per all cells. Means of leaf
area, cell size, and cell number were transformed logarithmically and locally
fitted to a quadratic function of which the first derivative was taken as the
relative growth rate (De Veylder et al., 2001). Mean values of the three
biological experiments were used for statistical analysis.
Drought Assay
Water deficit was imposed by controlling and stabilizing the soil water
status during the development of soil-grown plants. Plants were germinated
in cylindrical polypropylene pots (200 mL, diameter 53 mm, height 88 mm;
VWR International) with side cuts for faster desiccation and filled with water-
saturated soil. The soil was allowed to dry until it reached RWCs of 68%, 60%,
and 55% and subsequently watered daily to maintain a constant water status
based on the pot weight. RWC was defined as the ratio of percentage water to
dry soil, which in this case was always 306 0.5 g (RWC =mass of water/mass
of water + mass of dry soil). Photographs were taken daily and used to extract
total rosette areas, from which relative growth rates were subsequently
calculated ([ln rosette area day 2 2 ln rosette area day 1]/time). Plants were
grown under 110 to 120 mmol m22 s21 light and an 8-h-night regime. A
detailed description of the drought assays will be published elsewhere.
Sampling for Profiling Analysis
Leaf 3 was harvested from plants at 9, 15, and 22 DAS, while seedlings
reached stage 1.03 (third leaf, 1 mm in size) around 11 DAS. All samples were
from three independent experiments and from multiple plates within the
experiment. Complete harvest was done in growth chambers starting at 2 h
into the day and took less than 15 min. As leaf initiation and developmental
timing were not affected, samples were harvested simultaneously from both
control and mannitol-treated plants. Because of their small size, leaves from
plants at 9 DAS were dissected under a binocular microscope. Briefly, whole
seedlings were harvested in an excess of RNAlater solution (Ambion) and,
after overnight in 4�C, dissected on the cooling plate using the binocular
microscope with precision microscissors. Dissected leaves were transferred to
a new tube, frozen in liquid nitrogen, and ground with a Retsch machine and
3-mmmetal balls. Microarray analysis, qRT-PCR confirmation, andmetabolite
measurements were carried out on material harvested from separate exper-
iments.
RNA Extraction
RNA was extracted with Trizol according to the manufacturer’s protocol
(Invitrogen) and 4 mg of glycogen as carrier during the precipitation step.
RNA samples were subjected to DNA digestion (Roche) and subsequently to
the RNeasy clean-up kit (Qiagen).
ATH1 Expression Profiling and Data Analysis
RNA samples (three biological replicates for each treatment and stage)
were hybridized to single Affymetrix ATH1 genome arrays at the Flanders
Institute for Biotechnology Microarray Facility in Leuven, Belgium. Expres-
sion data were processed with Robust Multichip Average background cor-
rection, normalization, summarization, and BioConductor (Irizarry et al.,
2003a, 2003b; Gentleman et al., 2004). An alternative cdf (tinesath1cdf) was
used, in which each probe is uniquely assigned to one transcript (Casneuf
et al., 2007; http://www.bioconductor.org/packages/release/data/experiment/
html/tinesath1cdf.html). BioConductor package Limma was used to identify
differentially expressed genes (Smyth, 2004). A factorial design (mannitol
treatment 25–0 mM and developmental stage P-E-M) was applied to analyze
the data. For comparisons of interest, moderated t statistics with the eBayes
method were used, and P values were corrected for multiple testing (for each
contrast separately using topTable; Hochberg and Benjamini, 1990). In addi-
tion, we applied a more stringent correction for multiple testing across genes
and across contrasts with decideTest (global; Supplemental Tables S1 and S2).
Importantly, lists of significant genes obtained with both methods were very
similar, leading to identical conclusions. Besides the moderated t statistics for
each pairwise contrast, we calculated global F statistics to identify the genes
that were affected in at least one contrast (Supplemental Tables S1 and S2).
Two-fold changes in expression (only for 0–0 mM comparisons) and decideTest
(global) cutoffs of less than 0.05 were used to delineate gene lists of interest.
Further subsets of these differentially expressed gene lists were identified and
subjected to overrepresentation analysis.
Comparison with Publicly Available Microarray Data
Selected public microarray data were grouped according to experiment
type (e.g. abiotic stress and hormone treatment; Supplemental Table S3).
Groups of experiments were Robust Multichip Average processed and
subjected to Limma analysis, as described above. Sets of responsive genes
were delineated always with a 2-fold expression change and false discovery
rate-corrected P value cutoffs of less than 0.05. Although these cutoffs were
chosen somewhat arbitrarily, we assessed the robustness of the results by
testing more and less stringent cutoffs. All tests gave very similar results (data
not shown). The lists of responsive genes were comparedwith those identified
in our microarray experiment to identify global trends in the functional
repertoire of the affected genes that were used as hints to explore the results in
more detail. Overrepresentation was tested by means of Fisher exact tests
followed by Bonferroni P value correction.
Metabolite Analysis
Metabolite data were obtained from nine samples harvested from three
independent experiments. The relative levels of metabolites were determined
with an established gas chromatography-time-of-flight-mass spectrometry pro-
tocol exactly as described by Lisec et al. (2006). Chromatograms andmass spectra
were evaluated by Chroma TOF 1.6 (Leco) and TagFinder 4.0 (Luedemann et al.,
2008). The amount of metabolites was analyzed as relative metabolite abundance
calculated by normalization of the signal intensity to that of [13C]sorbitol, which
was added as an internal standard, and fresh weight.
qRT-PCR
For cDNA synthesis, 100 ng to 2 mg of RNAwas used with the SuperScript
Reverse III reagent (Invitrogen) according to the manufacturer’s instructions.
Primers were designed with the QuantPrime (Arvidsson et al., 2008) Web site
(Supplemental Table S5). qRT-PCR was done on a LightCycler 480 (Roche
Diagnostics) on 384-well plates with LightCycler 480 SYBR Green I Master
(Roche) according to the manufacturer’s recommendations. Melting curves
were analyzed to check primer specificity. Normalization was done against
the average of housekeeping genes UBQ10, GAPDH, and CBP20: DCt = Ct
(gene) – Ct (mean [housekeeping genes]) and DDCt = DCt(control) 2 DCt
(mannitol or PEG). DCt values for the three biological replicates were used for
statistical analysis. Ct refers to the number of cycles at which SYBR Green
fluorescence reaches an arbitrary value during the exponential phase of the
cDNA amplification.
Lugol’s, NBT, and GUS Staining
Multiple plants at 15 and 22 DAS were cleared in 70% ethanol, stained for
20 min with an excess of Lugol’s solution (Sigma), and subsequently washed
with water. Multiple leaves from three independent experiments were stained
for 1 h with 0.1% NBT (Sigma) solution in complete darkness and, subse-
quently, cleared in 80% boiling ethanol.
Whole plantlets were harvested after 9, 15, and 22 d and incubated in 90%
acetone (4�C) for 30 min, washed in 100 mM Tris-HCl/50 mM NaCl (pH 7.0),
and subsequently incubated in 5-bromo-4-chloro-3-indolyl-b-glucuronide
Development Mediates Leaf Stress Response
Plant Physiol. Vol. 152, 2010 241

(X-gluc) buffer (100 mM Tris-HCl/50 mM NaCl buffer [pH 7.0], 2 mM K3[Fe
(CN)6], and 4 mM X-gluc) at 37�C for 2.5 h. Seedlings were washed in 100 mM
Tris-HCl/50 mM NaCl (pH 7.0) and cleared overnight in 90% lactic acid.
Samples were photographed under a differential interference contrast micro-
scope (Leica).
Transmission Electron Microscopy
Young leaves and SAM of 9-DAS seedlings were excised, immersed in a
fixative solution of 2% paraformaldehyde and 2.5% glutaraldehyde, and
postfixed in 1% OsO4 with 1.5% K3Fe(CN)6 in 0.1 M Na-cacodylate buffer (pH
7.2) for 1 h under vacuum infiltration at room temperature and 4 h of rotation
at room temperature, followed by overnight fixation at 4�C. After washing
three times for 20 min with the buffer, samples were dehydrated through a
graded ethanol series, including a bulk staining with 2% uranyl acetate at the
50% ethanol step, followed by embedding in Spurr’s resin. Ultrathin sections
of a gold interference color were cut with an ultramicrotome (Leica EM UC6),
poststained with uranyl acetate and lead citrate (Leica EMAC20), collected on
formvar-coated copper slot grids, and viewed with a transmission electron
microscope (1010; JEOL).
Transgenic Lines and Mutants
Seeds of AOX-OE lines were kindly provided by Prof. James E. Siedow
(Duke University; Fiorani et al., 2005). CYCB1;2:DB-GUS lines were a kind gift
of Dr. Peter Doerner (University of Edinburgh). For generation of promoter:
GFP-GUS lines, genomic DNA was isolated from Arabidopsis (Col-0) with
DNeasy plant kits (Qiagen) according to the manufacturer’s instructions. The
1,500-bp genomic regions (or the intergenic region in the case of nearby coding
sequences) upstream of the specific start codon were amplified by PCR with
the Platinum Taq High Fidelity DNA polymerase (Invitrogen) and the
forward and reverse primers (Supplemental Table S5). The PCR products
were cloned into pDONR221 and cloned by recombination to pBGWFS7,
generating a transcriptional GFP-GUS fusion. The constructs were trans-
formed into Arabidopsis Col-0 by Agrobacterium tumefaciens-mediated floral
dipping. Transformants with the bar resistance gene were selected by spraying
with 40 mg L21 Pestanal (glufosinate ammonium; Sigma-Aldrich). Transform-
ants with a single insertion locus, and subsequently homozygous lines, were
selected by segregation analysis on Murashige and Skoog medium containing
5 mg L21 glufosinate ammonium. All analyses were performed with non-
segregating homozygous T3 transgenic lines. Ethylene-insensitive and aox1a
mutants were obtained from the Arabidopsis Seed Stock Center (ein2.5
[N8844], ein3.1 [N8052], eil1 [655070], etr1.3 [N3070], ein4 [N8053], and aox1a
[N584897]).
Operating Efficiency of PSII
Operating efficiency of PSII was measured using the IMAGING-PAM
Chlorophyll Fluorometer (Heinz Walz) in three independent experiments.
Microarray data from this article were deposited in the Gene Expression
Omnibus database (GSE16474).
Supplemental Data
The following materials are available in the online version of this article.
Supplemental Figure S1. Variable phenotypes of PEG-grown plants.
Supplemental Figure S2. Percentage reduction of cell number, size, and SI
measured for leaf 3 dissected from plants grown without or with 25 mM
mannitol.
Supplemental Figure S3. Leaf ploidy is not affected by mannitol.
Supplemental Figure S4. Cellular analysis of PEG-grown plants.
Supplemental Figure S5. Classification of transcripts differentially ex-
pressed during leaf development (0–0 mM).
Supplemental Figure S6. Validation of microarray data by qRT-PCR.
Supplemental Figure S7. Overlap between osmotic stress and leaf profil-
ing data.
Supplemental Figure S8. Validation of microarray data with promoter:
GUS lines of the genes from the mitochondrial dysfunction regulon.
Supplemental Table S1. Genes differentially regulated during develop-
ment.
Supplemental Table S2. Expression data for the mannitol treatment.
Supplemental Table S3. Comparison with publicly available expression
data sets.
Supplemental Table S4. Gas chromatography-mass spectrometry metab-
olite data.
Supplemental Table S5. List of primers used in qRT-PCR experiments and
cloning of promoter:GUS lines.
ACKNOWLEDGMENTS
We thank Dr. Nathalie Gonzalez, Dr. Korneel Vandenbroucke, and Prof.
Gerrit Beemster for useful discussion, Katrien Maleux for technical assis-
tance, Bjorn De Meyer and Stijn Dhondt for help in establishing the drought
assay, and Dr. Martine De Cock for help in preparing the manuscript.
Received October 7, 2009; accepted November 6, 2009; published November
11, 2009.
LITERATURE CITED
Achard P, Cheng H, De Grauwe L, Decat J, Schoutteten H, Moritz T, Van
Der Straeten D, Peng J, Harberd NP (2006) Integration of plant
responses to environmentally activated phytohormonal signals. Science
311: 91–94
Achard P, Renou J-P, Berthome R, Harberd NP, Genschik P (2008) Plant
DELLAs restrain growth and promote survival of adversity by reducing
the levels of reactive oxygen species. Curr Biol 18: 656–660
Aguirrezabal L, Bouchier-Combaud S, Radziejwoski A, Dauzat M,
Cookson SJ, Granier C (2006) Plasticity to soil water deficit in Arabi-
dopsis thaliana: dissection of leaf development into underlying growth
dynamic and cellular variables reveals invisible phenotypes. Plant Cell
Environ 29: 2216–2227
Arvidsson S, Kwasniewski M, Riano-Pachon DM, Mueller-Roeber B
(2008) QuantPrime—a flexible tool for reliable high-throughput primer
design for quantitative PCR. BMC Bioinformatics 9: 465
Beemster GTS, De Veylder L, Vercruysse S, West G, Rombaut D, Van
Hummelen P, Galichet A, Gruissem W, Inze D, Vuylsteke M (2005)
Genome-wide analysis of gene expression profiles associated with cell
cycle transitions in growing organs of Arabidopsis. Plant Physiol 138:
734–743
Bouchabke-Coussa O, Quashie M-L, Seoane-Redondo J, Fortabat M-N,
Gery C, Yu A, Linderme D, Trouverie J, Granier F, Teoule E, et al (2008)
ESKIMO1 is a key gene involved in water economy as well as cold
acclimation and salt tolerance. BMC Plant Biol 8: 125
Boucheron E, Healy JHS, Bajon C, Sauvanet A, Rembur J, Noin M, Sekine
M, Riou Khamlichi C, Murray JAH, Van Onckelen H, et al (2005)
Ectopic expression of Arabidopsis CYCD2 and CYCD3 in tobacco has
distinct effects on the structural organization of the shoot apical mer-
istem. J Exp Bot 56: 123–134
Boyer JS (1982) Plant productivity and environment. Science 218: 443–448
Boyes DC, Zayed AM, Ascenzi R, McCaskill AJ, Hoffman NE, Davis KR,
Gorlach J (2001) Growth stage-based phenotypic analysis of Arabidopsis:
a model for high throughput functional genomics in plants. Plant Cell
13: 1499–1510
Burssens S, Himanen K, van de Cotte B, Beeckman T, Van Montagu M,
Inze D, Verbruggen N (2000) Expression of cell cycle regulatory genes
and morphological alterations in response to salt stress in Arabidopsis
thaliana. Planta 211: 632–640
Casneuf T, Van de Peer Y, Huber W (2007) In situ analysis of cross-
hybridisation on microarrays and the inference of expression correla-
tion. BMC Bioinformatics 8: 461
Catala R, Ouyang J, Abreu IA, Hu Y, Seo H, Zhang X, Chua N-H (2007)
Skirycz et al.
242 Plant Physiol. Vol. 152, 2010

The Arabidopsis E3 SUMO ligase SIZ1 regulates plant growth and
drought responses. Plant Cell 19: 2952–2966
Cho H-T, Cosgrove DJ (2000) Altered expression of expansin modulates
leaf growth and pedicel abscission in Arabidopsis thaliana. Proc Natl
Acad Sci USA 97: 9783–9788
Clark SE, Running MP, Meyerowitz EM (1993) CLAVATA1, a regulator of
meristem and flower development in Arabidopsis. Development 119:
397–418
Cosgrove DJ (2000) Loosening of plant cell walls by expansins. Nature 407:
321–326
Cramer GR, Ergul A, Grimplet J, Tillett RL, Tattersall EAR, BohlmanMC,
Vincent D, Sonderegger J, Evans J, Osborne C, et al (2007) Water and
salinity stress in grapevines: early and late changes in transcript and
metabolite profiles. Funct Integr Genomics 7: 111–134
De Veylder L, Beeckman T, Beemster GTS, Krols L, Terras F, Landrieu I,
Van Der Schueren E, Maes S, Naudts M, Inze D (2001) Functional
analysis of cyclin-dependent kinase inhibitors of Arabidopsis. Plant Cell
13: 1653–1667
Dinneny JR, Long TA, Wang JY, Jung JW, Mace D, Pointer S, Barron C,
Brady SM, Schiefelbein J, Benfey PN (2008) Cell identity mediates the
response of Arabidopsis roots to abiotic stress. Science 320: 942–945
Donnelly PM, Bonetta D, Tsukaya H, Dengler RE, Dengler NG (1999) Cell
cycling and cell enlargement in developing leaves of Arabidopsis. Dev
Biol 215: 407–419
Fernie AR, Carrari F, Sweetlove LJ (2004) Respiratory metabolism: glycol-
ysis, the TCA cycle and mitochondrial electron transport. Curr Opin
Plant Biol 7: 254–261
Fiorani F, Umbach AL, Siedow JN (2005) The alternative oxidase of plant
mitochondria is involved in the acclimation of shoot growth at low
temperature: a study of Arabidopsis AOX1a transgenic plants. Plant
Physiol 139: 1795–1805
Fricke W, Akhiyarova G, Wei W, Alexandersson E, Miller A, Kjellbom
PO, Richardson A, Wojciechowski T, Schreiber L, Veselov D, et al
(2006) The short-term growth response to salt of the developing barley
leaf. J Exp Bot 57: 1079–1095
Fujita M, Fujita Y, Noutoshi Y, Takahashi F, Narusaka Y, Yamaguchi-
Shinozaki K, Shinozaki K (2006) Crosstalk between abiotic and biotic
stress responses: a current view from the points of convergence in the
stress signaling networks. Curr Opin Plant Biol 9: 436–442
Gentleman RC, Carey VJ, Bates DM, Bolstad B, Dettling M, Dudoit S,
Ellis B, Gautier L, Ge Y, Gentry J, et al (2004) Bioconductor: open
software development for computational biology and bioinformatics.
Genome Biol 5: R80
Gianoli E, Gonzalez-Teuber M (2005) Environmental heterogeneity and
population differentiation in plasticity to drought in Convolvulus chi-
lensis (Convolvulaceae). Evol Ecol 19: 603–613
Giraud E, Ho LHM, Clifton R, Carroll A, Estavillo G, Tan YF, Howell KA,
Ivanova A, Pogson BJ, Millar AH, et al (2008) The absence of ALTER-
NATIVE OXIDASE1a in Arabidopsis results in acute sensitivity to
combined light and drought stress. Plant Physiol 147: 595–610
Giraud E, Van Aken O, Ho LHM, Whelan J (2009) The transcription factor
ABI4 is a regulator of mitochondrial retrograde expression of ALTER-
NATIVE OXIDASE1a. Plant Physiol 150: 1286–1296
Goda H, Sasaki E, Akiyama K, Maruyama-Nakashita A, Nakabayashi K,
Li W, Ogawa M, Yamauchi Y, Preston J, Aoki K, et al (2008) The
AtGenExpress hormone and chemical treatment data set: experimental
design, data evaluation, model data analysis and data access. Plant J 55:
526–542
Granier C, Tardieu F (2009) Multi-scale phenotyping of leaf expansion in
response to environmental changes: the whole is more than the sum of
parts. Plant Cell Environ 32: 1175–1184
Havaux M, Kloppstech K (2001) The protective functions of carotenoid and
flavonoid pigments against excess visible radiation at chilling temper-
ature investigated in Arabidopsis npq and tt mutants. Planta 213: 953–966
Ho LHM, Giraud E, Uggalla V, Lister R, Clifton R, Glen A, Thirkettle-
Watts D, Van Aken O, Whelan J (2008) Identification of regulatory
pathways controlling gene expression of stress-responsive mitochon-
drial proteins in Arabidopsis. Plant Physiol 147: 1858–1873
Hochberg Y, Benjamini Y (1990) More powerful procedures for multiple
significance testing. Stat Med 9: 811–818
Hsiao TC, Xu L-K (2000) Sensitivity of growth of roots versus leaves to
water stress: biophysical analysis and relation to water transport. J Exp
Bot 51: 1595–1616
Inze D, De Veylder L (2006) Cell cycle regulation in plant development.
Annu Rev Genet 40: 77–105
Iraki NM, Singh N, Bressan RA, Carpita NC (1989) Cell walls of tobacco
cells and changes in composition associated with reduced growth upon
adaptation to water and saline stress. Plant Physiol 91: 48–53
Irizarry RA, Bolstad BM, Collin F, Cope LM, Hobbs B, Speed TP (2003a)
Summaries of Affymetrix GeneChip probe level data. Nucleic Acids Res
31: e15
Irizarry RA, Hobbs B, Collin F, Beazer-Barclay YD, Antonellis KJ, Scherf
U, Speed TP (2003b) Exploration, normalization, and summaries of high
density oligonucleotide array probe level data. Biostatistics 4: 249–264
Kankainen M, Brader G, Toronen P, Palva ET, Holm L (2006) Identifying
functional gene sets from hierarchically clustered expression data: map
of abiotic stress regulated genes in Arabidopsis thaliana. Nucleic Acids
Res 34: e124
Kilian J, Whitehead D, Horak J, Wanke D, Weinl S, Batistic O, D’Angelo
C, Bornberg-Bauer E, Kudla J, Harter K (2007) The AtGenExpress
global stress expression data set: protocols, evaluation and model data
analysis of UV-B light, drought and cold stress responses. Plant J 50:
347–363
Lisec J, Schauer N, Kopka J, Willmitzer L, Fernie AR (2006) Gas chroma-
tography mass spectrometry-based metabolite profiling in plants. Nat
Protoc 1: 387–396
Liszkay A, Kenk B, Schopfer P (2003) Evidence for the involvement of cell
wall peroxidase in the generation of hydroxyl radicals mediating
extension growth. Planta 217: 658–667
Luedemann A, Strassburg K, Erban A, Kopka J (2008) TagFinder for the
quantitative analysis of gas chromatography-mass spectrometry (GC-
MS)-based metabolite profiling experiments. Bioinformatics 24: 732–737
Matsui A, Ishida J, Morosawa T, Mochizuki Y, Kaminuma E, Endo TA,
Okamoto M, Nambara E, Nakajima M, Kawashima M, et al (2008)
Arabidopsis transcriptome analysis under drought, cold, high-salinity
and ABA treatment conditions using a tiling array. Plant Cell Physiol 49:
1135–1149
Mauseth JD (2004) Giant shoot apical meristems in cacti have ordinary leaf
primordia but altered phyllotaxy and shoot diameter. Ann Bot (Lond)
94: 145–153
Menges M, Hennig L, Gruissem W, Murray JAH (2003) Genome-wide
gene expression in an Arabidopsis cell suspension. Plant Mol Biol 53:
423–442
Moore JP, Vicre-Gibouin M, Farrant JM, Driouich A (2008) Adaptations of
higher plant cell walls to water loss: drought vs desiccation. Physiol
Plant 134: 237–245
Mowla SB, Cuypers A, Driscoll SP, Kiddle G, Thomson J, Foyer CH,
Theodoulou FL (2006) Yeast complementation reveals a role for an
Arabidopsis thaliana late embryogenesis abundant (LEA)-like protein in
oxidative stress tolerance. Plant J 48: 743–756
Murashige T, Skoog F (1962) A revised medium for rapid growth and
bioassays with tobacco tissue cultures. Physiol Plant 15: 473–497
Narusaka M, Narusaka Y, Seki M, Ishida J, Nakashima M, Enju A,
Sakurai T, Satou M, Shinozaki K (2004) Crosstalk in the responses to
biotic and abiotic stresses in Arabidopsis. Plant Cell Physiol (Suppl)
45: S188
Navarro L, Bari R, Achard P, Lison P, Nemri A, Harberd NP, Jones JDG
(2008) DELLAs control plant immune responses by modulating the
balance of jasmonic acid and salicylic acid signaling. Curr Biol 18:
650–655
Osato Y, Yokoyama R, Nishitani K (2006) A principal role for AtXTH18 in
Arabidopsis thaliana root growth: a functional analysis using RNAi
plants. J Plant Res 119: 153–162
Paakkonen E, Vahala J, Pohjolai M, Holopainen T, Karenlampi L (1998)
Physiological, stomatal and ultrastructural ozone responses in birch
(Betula pendula Roth.) are modified by water stress. Plant Cell Environ
21: 671–684
Perera IY, Hung C-Y, Moore CD, Stevenson-Paulik J, Boss WF (2008)
Transgenic Arabidopsis plants expressing the type 1 inositol 5-phospha-
tase exhibit increased drought tolerance and altered abscisic acid
signaling. Plant Cell 20: 2876–2893
Pereyra-Irujo GA, Velazquez L, Lechner L, Aguirrezabal LAN (2008)
Genetic variability for leaf growth rate and duration under water deficit
in sunflower: analysis of responses at cell, organ, and plant level. J Exp
Bot 59: 2221–2232
Ramırez V, Coego A, Lopez A, Agorio A, Flors V, Vera P (2009) Drought
Development Mediates Leaf Stress Response
Plant Physiol. Vol. 152, 2010 243

tolerance in Arabidopsis is controlled by the OCP3 disease resistance
regulator. Plant J 58: 578–591
Ratnayaka HH, Kincaid D (2005) Gas exchange and leaf ultrastructure of
tinnevelly senna, Cassia angustifolia, under drought and nitrogen stress.
Crop Sci 45: 840–847
Rhoads DM, Umbach AL, Subbaiah CC, Siedow JN (2006) Mitochondrial
reactive oxygen species: contribution to oxidative stress and interorga-
nellar signaling. Plant Physiol 141: 357–366
Rizhsky L, Liang H, Shuman J, Shulaev V, Davletova S, Mittler R (2004)
When defense pathways collide: the response of Arabidopsis to a
combination of drought and heat stress. Plant Physiol 134: 1683–1696
Samuels L, Kunst L, Jetter R (2008) Sealing plant surfaces: cuticular wax
formation by epidermal cells. Annu Rev Plant Biol 59: 683–707
Seki M, Narusaka M, Junko I, Nanjo T, Fujita M, Youko O, Kamiya A,
Nakajima M, Enju A, Dakurai T, et al (2002) Monitoring the expression
profiles of 7000 Arabidopsis genes under drought, cold and high salinity
stresses using a full-length cDNA microarray. Plant J 31: 279–292
Seki M, Umezawa T, Urano K, Shinozaki K (2007) Regulatory metabolic
networks in drought stress responses. Curr Opin Plant Biol 10: 296–302
Seo PJ, Lee AK, Xiang F, Park CM (2008) Molecular and functional
profiling of Arabidopsis pathogenesis-related genes: insights into their
roles in salt response of seed germination. Plant Cell Physiol 49: 334–344
Sharp RE, Poroyko V, Hejlek LG, Spollen WG, Springer GK, Bohnert HJ,
Nguyen HT (2004) Root growth maintenance during water deficits:
physiology to functional genomics. J Exp Bot 55: 2343–2351
Smyth GK (2004) Linear models and empirical Bayes methods for assess-
ing differential expression in microarray experiments. Stat Appl Genet
Mol Biol 3: Article 3
Sobeih WY, Dodd IC, Bacon MA, Grierson D, Davies WJ (2004) Long-
distance signals regulating stomatal conductance and leaf growth in
tomato (Lycopersicon esculentum) plants subjected to partial root-zone
drying. J Exp Bot 55: 2353–2363
Sweetlove LJ, Heazlewood JL, Herald V, Holtzapffel R, Day DA, Leaver
CJ, Millar AH (2002) The impact of oxidative stress on Arabidopsis
mitochondria. Plant J 32: 891–904
Thimm O, Blasing O, Gibon Y, Nagel A, Meyer S, Kruger P, Selbig J,
Muller LA, Rhee SY, Stitt M (2004) MAPMAN: a user-driven tool to
display genomics data sets onto diagrams of metabolic pathways and
other biological processes. Plant J 37: 914–939
Umbach AL, Fiorani F, Siedow JN (2005) Characterization of transformed
Arabidopsis with altered alternative oxidase levels and analysis of
effects on reactive oxygen species in tissue. Plant Physiol 139: 1806–1820
Urano K, Maruyama K, Ogata Y, Morishita Y, Takeda M, Sakurai N,
Suzuki H, Saito K, Shibata D, Kobayashi M, et al (2009) Characteri-
zation of the ABA-regulated global responses to dehydration in Arabi-
dopsis by metabolomics. Plant J 57: 1065–1078
Usadel B, Nagel A, Steinhauser D, Gibon Y, Blasing OE, Redestig H,
Sreenivasulu N, Krall L, Hannah MA, Poree F, et al (2006) PageMan: an
interactive ontology tool to generate, display, and annotate overview
graphs for profiling experiments. BMC Bioinformatics 7: 535
Van Aken O, Pecenkova T, van de Cotte B, De Rycke R, Eeckhout D,
Fromm H, De Jaeger G, Witters E, Beemster GTS, Inze D, et al (2007)
Mitochondrial type-I prohibitins of Arabidopsis thaliana are required for
supporting proficient meristem development. Plant J 52: 850–864
Vandepoele K, Raes J, De Veylder L, Rouze P, Rombauts S, Inze D (2002)
Genome-wide analysis of core cell cycle genes in Arabidopsis. Plant Cell
14: 903–916
van der Weele CM, Spollen WG, Sharp RE, Baskin TI (2000) Growth of
Arabidopsis thaliana seedlings under water deficit studied by control of
water potential in nutrient-agar media. J Exp Bot 51: 1555–1562
Verslues PE, Agarwal M, Katiyar-Agarwal S, Zhu J, Zhu J-K (2006)
Methods and concepts in quantifying resistance to drought, salt and
freezing, abiotic stresses that affect plant water status. Plant J 45:
523–539
Veselov DS, Mustafina AR, Sabirjanova IB, Akhiyarova GR, Dedov AV,
Veselov SU, Kudoyarova GR (2002) Effect of PEG-treatment on the leaf
growth response and auxin content in shoots of wheat seedlings. Plant
Growth Regul 38: 191–194
Vissenberg K, Oyama M, Osato Y, Yokoyama R, Verbelen J-P, Nishitani K
(2005) Differential expression of AtXTH17, AtXTH19 and AtXTH20
genes in Arabidopsis roots: physiological roles in specification in cell wall
construction. Plant Cell Physiol 46: 192–200
Walley JW, Coughlan S, Hudson ME, Covington MF, Kaspi R, Banu G,
Harmer SL, Dehesh K (2007) Mechanical stress induces biotic and
abiotic stress responses via a novel cis-element. PLoS Genet 3: e172
Wen F, Zhu Y, Hawes MC (1999) Effect of pectin methylesterase gene
expression on pea root development. Plant Cell 11: 1129–1140
West G, Inze D, Beemster GTS (2004) Cell cycle modulation in the
response of the primary root of Arabidopsis to salt stress. Plant Physiol
135: 1050–1058
Weston DJ, Gunter LE, Rogers A, Wullschleger SD (2008) Connecting
genes, coexpression modules, and molecular signatures to environmen-
tal stress phenotypes in plants. BMC Syst Biol 2: 16
Wu Y, Cosgrove DJ (2000) Adaptation of roots to low water potentials by
changes in cell wall extensibility and cell wall proteins. J Exp Bot 51:
1543–1553
Yoo S-D, Cho Y, Sheen J (2009) Emerging connections in the ethylene
signaling network. Trends Plant Sci 14: 270–279
Zeller G, Henz SR, Widmer CK, Sachsenberg T, Ratsch G, Weigel D,
Laubinger S (2009) Stress-induced changes in the Arabidopsis thaliana
transcriptome analyzed using whole-genome tiling arrays. Plant J 58:
1068–1082
Zhang G, Chen M, Li L, Xu Z, Chen X, Guo J, Ma Y (2009) Overexpression
of the soybean GmERF3 gene, an AP2/ERF type transcription factor for
increased tolerances to salt, drought, and diseases in transgenic tobacco.
J Exp Bot 60: 3781–3796
Zhang Y, Xu W, Li Z, Deng XW, Wu W, Xue Y (2008) F-box protein DOR
functions as a novel inhibitory factor for abscisic acid-induced stomatal
closure under drought stress in Arabidopsis. Plant Physiol 148:
2121–2133
Zhu J, Alvarez S, Marsh EL, LeNoble ME, Cho I-J, Sivaguru M, Chen S,
Nguyen HT, Wu Y, Schachtman DP, et al (2007) Cell wall proteome in
the maize primary root elongation zone. II. Region-specific changes in
water soluble and lightly ionically bound proteins under water deficit.
Plant Physiol 145: 1533–1548
Skirycz et al.
244 Plant Physiol. Vol. 152, 2010