Development Practices for Municipal Pavement...
20
1 Development Practices for Municipal Pavement Management Systems Application Mehran Kafi Farashah, MASc., EIT, University of Waterloo Dr. Susan L. Tighe, PhD, PEng, University of Waterloo Paper prepared for presentation at the Asset Management: Reinventing Organizations for the Next 100 Years Session of the 2014 Conference of the Transportation Association of Canada Montreal, Quebec Authors gratefully appreciate the financial support of the City of Markham for the successful completion of this work.
Transcript of Development Practices for Municipal Pavement...
1
Development Practices for Municipal Pavement Management Systems
Application
Mehran Kafi Farashah, MASc., EIT, University of Waterloo
Dr. Susan L. Tighe, PhD, PEng, University of Waterloo
Paper prepared for presentation at the
Asset Management: Reinventing Organizations for the Next 100 Years Session
of the 2014 Conference of the
Transportation Association of Canada
Montreal, Quebec
Authors gratefully appreciate the financial support of the City of Markham for the successful
completion of this work.

2
Abstract
Pavement Management Systems (PMS) are widely used by transportation agencies to maintain
safe, durable and economic road networks. There are many PMS software packages that have
been developed over the past decades for provincial/state road agencies. However, sometimes
due to lack of budget and experience, adopting the existing PMS for a road agency is not cost
effective. Thus, it is important to introduce a simple, effective, and affordable PMS for a local
agency and municipality.
This research is carried out in partnership between the City of Markham and the Centre for
Pavement and Transportation Technology (CPATT) located at the University of Waterloo. For
the purpose of developing a PMS for local agencies, an extensive literature review on PMS
components was carried out, with emphasizing data inventory, data collection, and performance
evaluation. In addition, the literature review also concentrated on the overall pavement condition
assessment. In July 2011, a study on “Evaluation of Pavement Distress Measurement Survey”
was conducted as a part of this research and was distributed to cities and municipalities across
Canada. The study focused on the current state-of-the-practice in pavement distress and
condition evaluation methods used by local agencies to compare the results from the literature
review. The components of the proposed PMS framework are also developed based on the
literature review with some modifications and technical requirements. The City of Markham is
selected as a case study, since it represents a local agency and provides all the data, to illustrate
the validation of the proposed PMS framework.
1.0 Introduction
1.1 Background
Pavement Management Systems (PMS) are widely used by transportation agencies to maintain
safe, durable and economic road networks [1]. PMS prioritize the maintenance and rehabilitation
of pavement sections by evaluating pavement performance at the network level [2]. There are
many PMS software packages that have been developed over the past decades for
provincial/state road agencies. However, sometimes due to lack of budget and experience,
adopting the existing PMS for a road agency is not cost effective. Thus, it is important to
introduce a simple, effective, and affordable PMS for a local agency and municipality.
1.2 Research Scope and Objectives
This research is carried out in partnership between the City of Markham and the Centre for
Pavement and Transportation Technology (CPATT) located at the University of Waterloo.
The main objectives of the research project include defining:
the inventory data required for the local agencies;
the pavement performance data that should be collected during the condition survey by
local agencies;
the density levels and severity levels that should be used in assessment of pavement
condition;
the key steps required to implement a PMS.

3
In short, the research methodology includes development of a framework that can be utilized by
the City of Markham and/or other cities and municipalities as a guideline for developing their
own simple PMS.
2.0 Research Methodology
Inventory data, pavement condition assessment, establishing criteria, prediction models for
pavement performance deterioration, rehabilitation and maintenance strategies, priority
programming of rehabilitation and maintenance, economic evaluation of alternative pavement
design strategies, and program implementation are the necessary components of a pavement
management system. However, for the local agencies that have lower budget than the
provincial/state agencies implementing such PMS is not cost effective
The intention of the proposed research methodology is to introduce a simple, effective, and
affordable PMS for local road agencies. One of the main areas included in this research
methodology is to discuss collection of pavement for local agencies. Thus, in 2011 the survey
“Evaluation of Pavement Distress Measurement Survey” was developed and distributed to cities
and municipalities across Canada to study the current state-of-the-practice in pavement distress
and condition evaluations.
Figure 1 represents the research methodology framework which consists of six main steps:
referencing method, data inventory, evaluate current road network status, predict models for
pavement performance deterioration, economic evaluation of rehabilitation and maintenance
alternatives, and priority programming of rehabilitation and maintenance alternatives. The step
related to evaluating current road network status contains three subsections, initially, it is
essential for local agencies to evaluate the overall pavement condition of each road section. Then
the local agencies should evaluate the overall road network condition and finally in the third
subsection the local agency should divide the road network into homogeneous sections for
analysis.

4
Evaluation of Pavement Condition
Referencing Method for Pavement Sections
Historical Data
-Construction History
-Rehab/Maintenance History
Geometric Data
-Road classification
-Section length, width,
location, number of lanes,
grade of section
Performance Data
-Surface Distress
-Roughness
-Pavement Strength
Cost Data
-New Construction
-Rehabilitation/Maintenance
Environmental Data
-Weather condition
-Drainage condition \
Evaluate Overall Pavement Condition of Road Sections
-Characterize pavement distress using three severity levels and (Quantity/Area) % as density levels
-Evaluate Pavement Condition of each road section: - Existing pavement indices
- Engineering judgment and experience
- Combination of Engineering judgment and Analytical Hierarchy Process (AHP)
Divide Roads into Homogeneous Sections
-Divide sections based on: - Road classification (Local, Collector, Arterial, etc.)
- Treatment type (Microsurfacing, Cold in place, etc.)
- Traffic history (AADT, ESALs)
- Soil type
- Drainage condition
Evaluate Current Overall Road Network Condition
-Divide overall pavement condition into rational intervals ranging from 0 to 100. Where 0 represents
the worst condition and 100 represents the excellent condition
-Finding percentage of every condition categories
Data inventory
Traffic and Load Data
-AADT, ESALs, % Truck,
traffic growth
Prediction Models for Pavement Performance Deterioration -Markovian Model
Economic Evaluation of Rahab/Maintenance Alternatives
- Present Worth of Cost, Equivalent Uniform Annual Cost , Net Present
Worth
- Net Present Worth
Priority Programming of Rahab/Maintenance Alternatives -Ranking Method: benefit-to-cost ratio (B/C)
-Optimization: Evolver software
Figure 1: Research Methodology Framework

5
2.1 Referencing Method
The first step is to develop a method of referencing for pavement sections. The basic method for
referencing pavement sections includes node-link, branch-sectioning, route-km post, and
Geographic Information Systems (GIS). GIS is one of the referencing methods that have the
capability of defining pavement sections by integrating data (condition, history, etc…), and
generating maps for pavement management reports. Most agencies in Canada including the
Ministry of Transportation of Ontario and Alberta Transportation are implementing GIS [1].
Moreover, at the municipal level, agencies such as Calgary, Edmonton, and Montreal, etc. are
rapidly implementing GIS for their road network [1],[3].Thus, GIS is set as the best practice for
referencing pavement sections.
2.2 Data Inventory
The next step involved obtaining various types of inventory data such as performance data,
historic data, policy data, geometric data, environment, traffic and load data, and cost related
data. Due to the limited budget, cities and municipalities cannot afford to obtain and collect all
the necessary data; however, the following data is the key to obtaining an efficient and effective
pavement management system.
2.2.1 Historical Data
Historical data can be categorized as to construction-related (the year and type of the initial
construction), and treatment-related (any rehabilitation or maintenance treatment and the year at
which these treatments are applied after the initial construction).
2.2.2 Traffic and Load Data
The proper use and collection of traffic and load data, such as Average Annual Daily Traffic
(AADT), percent trucks, traffic growth, and annual Equivalent Single Axle Loads (ESALs), are
highly important in a PMS.
2.2.3 Performance Data
Performance data is also necessary and should be obtained by the local agencies for the
pavement management system. The performance data is collected, depending on the agency’s
available budget, usually every two to five years for the road network using manual, semi-
automated tools, automated tools, or two or more of the three. The survey can be conducted on
every 30 m, 50 m, 100 m, etc. intervals. Many provincial/states agencies collect one or more of
the surface distress, friction, roughness, and structural adequacy as their performance data. Local
agencies; on the other hand, due to different traffic volume, budget limit, speed limit, and user
expectation, should collect fewer and specific types of pavement performance data. Thus, a
survey was developed in 2011 and distributed to cities and municipalities across Canada to study
the current state-of-the-practice in pavement distress and condition evaluations. A total of nine
surveys were completed including seven cities (Edmonton, Hamilton, Moncton, Saskatoon,
Victoria, Calgary, and Niagara Region) and two consultants (Golder Associates Ltd. and Applied
Research Associates (ARA))..
6
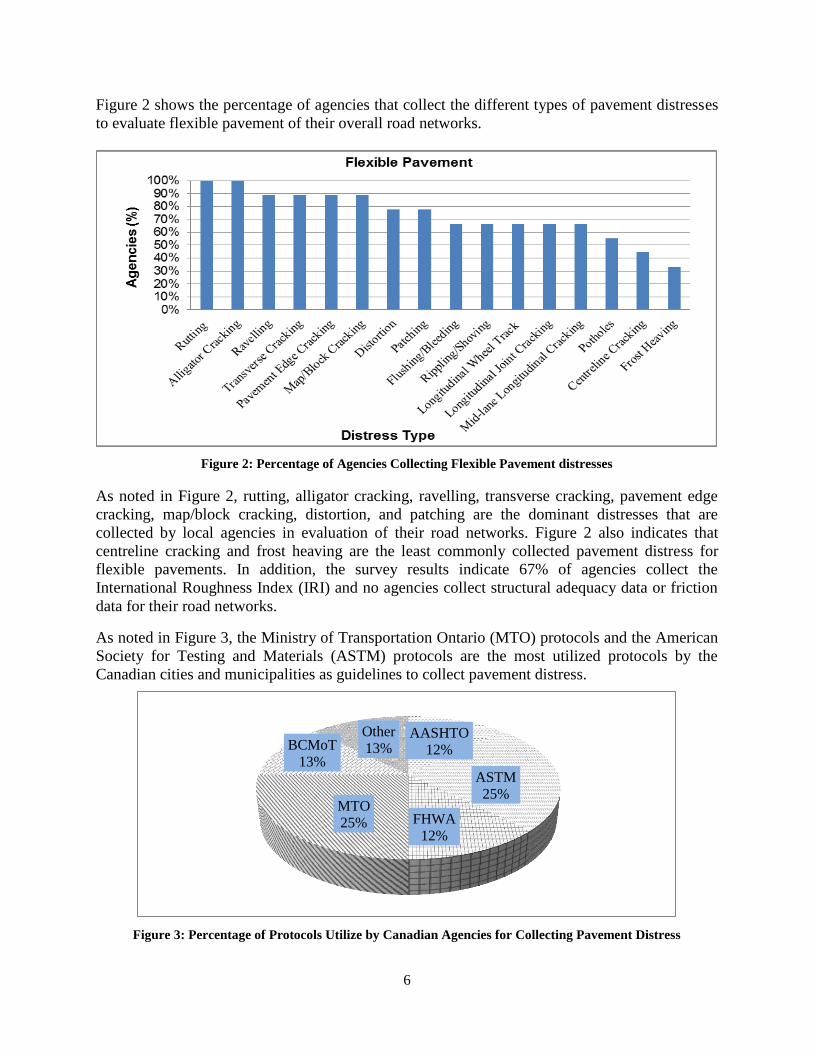
Figure 2 shows the percentage of agencies that collect the different types of pavement distresses
to evaluate flexible pavement of their overall road networks.
Figure 2: Percentage of Agencies Collecting Flexible Pavement distresses
As noted in Figure 2, rutting, alligator cracking, ravelling, transverse cracking, pavement edge
cracking, map/block cracking, distortion, and patching are the dominant distresses that are
collected by local agencies in evaluation of their road networks. Figure 2 also indicates that
centreline cracking and frost heaving are the least commonly collected pavement distress for
flexible pavements. In addition, the survey results indicate 67% of agencies collect the
International Roughness Index (IRI) and no agencies collect structural adequacy data or friction
data for their road networks.
As noted in Figure 3, the Ministry of Transportation Ontario (MTO) protocols and the American
Society for Testing and Materials (ASTM) protocols are the most utilized protocols by the
Canadian cities and municipalities as guidelines to collect pavement distress.
Figure 3: Percentage of Protocols Utilize by Canadian Agencies for Collecting Pavement Distress
AASHTO
12%
ASTM
25%
FHWA
12%
MTO
25%
BCMoT
13%
Other
13%

7
Table 1 illustrates the number of agencies that use different severity levels and density levels to
characterize each type of collected data for the flexible pavement.
Table 1: Number of agencies that Use Different Severity Levels and Density Levels for Flexible Pavement
It can be concluded from Table 1 that most agencies use three severity levels and percentage of
the affected area as the density levels (area of each distress over the area of inspected pavement
section) to identify the pavement distress.
2.2.4 Geometric Data
The local agency should also obtain geometric data. The geometric data defines the physical
characteristics and features of the pavement sections such as location, length, width, number of
lanes, shoulder type and width, classification (local, collector, arterial, etc.) and, grade of the
section [4]
2.2.5 Environmental Data
The environmental conditions such as maximum and minimum temperatures, freeze thaw cycles,
precipitation, and drainage conditions have an important impact on the pavement deterioration
rate, and the associated selection of proper rehabilitation and maintenance alternatives by local
agencies. Thus, this data should also be included.
Data Type Three Severity Level Five Severity Level Three Density Level Five Density Level Quantity/Area Others
Ravelling 3 3 0 2 4
Flushing/Bleeding 2 2 0 2 2
Rippling/Shoving 2 2 0 2 2
Rutting 4 2 0 2 3 % Length
Distortion 3 2 0 2 3
Longitudinal Wheel Track Cracking 3 2 0 2 2 Length
Longitudinal Joint Cracking 3 0 0 1 2 Length
Alligator Cracking 5 2 0 2 4AREA LINEAR SPACING
AREA LINEAR
Meander and mid-lane Longitudinal
Cracking4 1 0 2 2 Length
Transverse Cracking 4 2 0 2 2AREA LINEAR SPACING
AREA LINEAR, Length
Centreline Cracking 2 1 0 2 1
Pavement Edge Cracking 4 2 0 2 2AREA LINEAR SPACING
AREA LINEAR, %Length
Map/Block Cracking 4 2 0 2 3AREA LINEAR SPACING
AREA LINEAR
Patching 3 2 0 2 3
Potholes 2 2 0 2 0 Count
Frost Heaving 0 0 0 0 0
Excessive Crown 2 0 0 0 0 % length
Coarse Aggregate Loss 1 0 0 0 1
Structural Integrity 1 0 0 0 1
Drainage 1 0 0 0 1
Severity Levels (# of agencies) Density Levels (# of agencies)

8
2.2.6 Cost Data
The cost of new construction, maintenance and rehabilitation should also be maintained since it
is useful for the economic analysis, prioritization, and project selection process.
2.3 Evaluation of Pavement Condition
The first step in evaluating the current road network status is to quantify the overall pavement
condition for each pavement section. Agencies, after identifying the pavement distress and
evaluating each distress condition based on its severity levels and density levels, could calculate
the overall pavement condition of each road by the three different methods. The first method is
to adapt the current well developed pavement indices such as MTO index (PCIMTO). The second
method is to use the engineering judgement and experience. The third method, which is the
emphasis of this research, is to use both the engineering judgement and the Analytical Hierarchy
Process (AHP) to assign weights for each pavement performance data. AHP is a theory of
relative measurements of intangible criteria [5]. AHP is based on eigenvector methods that are
usually applied to establish the relative weights for different criteria [5]. The AHP determines the
weights for each criterion indirectly by relative importance score between criteria [5]. The final
weighting is then normalized by the maximum eigenvalue for the matrix to minimize the impact
of inconsistencies in the ratios. The method is illustrated in the following steps [6].
Let C = { , , , …, } be the (n) pavement performance data identified to be assigned
weights.
Let A = (aij) be a square matrix where aij presents the relative importance between pairs (Ci,Cj) as
shown in the following matrix: A= [
]
where:
aij =
, for all i,j = 1,2,3,…. n (Equation 1)
The term aij assumes a value of relative importance between Ci and Cj in a scale from 1-9 as
shown in Table 2.
The matrix A should be filled based on the engineering judgment and experience.
Table 2: Comparison Scale [5]
Intensity of importance Definition
1 Equal importance
3 Moderately more important
5 Strongly more important
7 Very strongly more important
9 Extremely more important
2,4,6,8 Intermediate values between adjacent scale values

9
Let w = ∑ {w1, w2, w3…wn}=1 be the weights for each pavement performance data. The weight
can be obtained as follow:
=
∑
∑
for i,k = 1,2,…..n (Equation 2)
The eigenvalue ( ) is obtained as follows:
The sum of the resultant vector of (A*w/w) divided by number of pavement performance data
(n) where: w = Weight vector.
The Consistency Index (C.I.) = –
(Equation 3)
The Consistency Ratio (C.R.) =
(Equation 4)
where:
Random Index (R.I.) is a constant that depends on the pavement performance data (n) as shown
in Table 3 In addition, a consistency ratio less than 0.1 indicates consistent pairwise comparison.
Table 3: Random Index [5]
n = 2 n = 3 n = 4 n = 5 n = 6 n = 7 n = 8 n = 9 n = 10
R.I = 0.00 R.I = 0.59 R.I = 0.90 R.I = 1.12 R.I = 1.24 R.I = 1.32 R.I = 1.41 R.I = 1.45 R.I = 1.49
After determining weights for each pavement performance data, the overall pavement condition
(OPC) is calculated by:
OPC = ∑ ) (Equation 5)
where,
OPC = Overall Pavement Condition;
Ci = Pavement performance data;
Wi = Calculated weight associated to each pavement performance data.
The next step after calculating the overall pavement condition for each section is to find the
current overall road network condition by finding the percentage of different OPC categories.
Table 4 is an example of OPC categories.
Table 4: Example of OPC Categories
OPC (Overall Pavement Condition) Classification Condition
OPC (100-85) Excellent
OPC (85-70) Very Good
OPC (70-55) Good
OPC (55-40) Fair
OPC (40-0) Poor

10
To have a better understanding of current road network condition, each class of road (local,
collector, arterial, etc.) should be examined separately by dividing each road class into
homogenous sections. Each road class should further divide into subsections based on the
common rehabilitation/maintenance type, same range of traffic volume and ESALs, same soil
type, and drainage condition for the analysis purposes.
2.4 Prediction Models for Pavement Performance Deterioration
Transportation agencies should use a deterioration model to predict the future condition of a
pavement so that proper rehabilitation/preservation decisions can be made. Markovian models
are the most common stochastic techniques and have been widely used due to their less need for
data [7]. This research used the Markovian model to predict pavement performance deterioration
for all the road classes based on the specific treatment type.
The first step for the Markov chain model involved constructing a Transition Probability Matrix
(TPM) which predicts change over a period of time. TPM is a matrix of order (n x n), where n is
the number of possible condition states. TPM shows the probability of going from one candidate
stage to another over a period of time as shown in Figure 4. For example, there is a 35%
probability of staying in condition state 2 after one year of service and a 65% probability of
moving from state 2 to state 3.
Figure 4: Transition Probability Matrix [7]
Where represents the probability of deterioration from state i to state j over a specific time
period called the transition period t.
To estimate the future-state vector [ ], the initial probabilty vector , the state of new asset
at t = 0, is multiplied by the TPM matrix [7].
State: 0 = best, 1, 2,………n=worst
= [1, 0, 0………0] at t=0
Therefore, can be calculated as [7]:
(Equation 6)

11
Figure 5 shows a sample transition probability matrix with state transition matrix.
Figure 5: TPM and State Transition Matrix
2.5 Economic Evaluation of Rehabilitation and Maintenance Alternatives
The economic evaluation is commonly used in the selection of maintenance and rehabilitation
strategies for the pavement segments. The present worth (PW), net present worth (NPW), and the
equivalent uniform annual cost (EUAC) are the common methods that are being used by
agencies to properly evaluate competing alternatives [1]. The PW represents the equivalent
dollars at the beginning of the analysis period [1],[8].
PW = C * [ 1 / ( 1 + iDiscount) ]n
(Equation 7)
where:
PW = Present Worth ($);
C = Future Cost ($);
iDiscount = Discount rate (e.g. 4% = 0.04);
n = Period in years between future expenditure and present.

12
The NPW represents the total dollars that needed for the analysis period.
NPW = IC * ∑ M&Rj * [1/(1 + iDiscount)])
nj - SV * [1/ (1 + iDiscount) ]
AP (Equation 8)
where:
NPW = Net Present Worth ($);
IC = Initial Cost ($);
K = Number of future maintenance, preservation and rehabilitation activities;
M&Rj = Cost of jth
future maintenance, preservation and rehabilitation activity ($);
iDiscount = Discount rate;
nj = Number of years from the present of the jth
future maintenance, preservation or
rehabilitation treatment
SV = Salvage Value ($)
AP = Number of years in analysis period
The EUAC presents the dollars needed for every year to pay for the project [1].
EUAC = NPW * [ (iDiscount * (1 + iDiscount)AP
) / ((1 + iDiscount)
AP - 1)
]
(Equation 9)
where:
EUAC = Equivalent Uniform Annual Cost ($);
NPW = Net Present Worth ($);
iDiscount = Discount rate;
AP = Number of years in analysis period
2.6 Priority Programing of Rehabilitation and Maintenance Alternatives
Local agencies should prioritize the road sections need and select the appropriate rehabilitation
and maintenance alternatives using either the ranking method or optimization method. Road
sections are prioritized in the ranking method based on the descending order of the benefit-to-
cost ratio (B/C). The drawback with the ranking method is that it fails to consider alternative
funding levels [9]. The other approach to prioritizing the road sections is optimization.
Optimization is the most complex method of priority programming. The optimization method
can give the optimal solution based on various objective functions (e.g.. maximize pavement
condition, minimum budget, etc.) while considering various constraints. Since the optimization
method is very complex to develop, the local agencies could use the already developed
optimization software such as Evolver [10] to prioritize their road network level.

13
3.0 Case Study
The analysis is based on the data which are provided by the City of Markham engineering staff.
3.1 Referencing Method
The City of Markham uses a Geographic Information System (GIS) as a referencing method to
represent the pavement sections. The GIS is used to generate maps for the road network in terms
of pavement condition and road classification.
3.2 Data Inventory
There are five sets of data provided by the City of Markham. The first set of data is composed of
the surface distress condition survey that was collected in 2008 and 2011 for the roads in the City
of Markham. This data includes the road section unique ID, surface distress (patching, rutting,
mapping, longitudinal cracking, alligator cracking, edge cracking, and transverse cracking) and
roughness (IRI) condition for every 30m section of the road segment and the length of each
segment and the total length of the segment. Sections at the end of the segments may be less than
30m. The second set of data includes the rehabilitation/maintenance history that includes, road
segment ID, treatment strategy type, year of treatment and street name. The third set of data
contains the AADT data that includes road segment ID, the AADT history for some of the road,
the year that the AADT was collected, and the name of the road. The fourth set of data road
includes the road segment ID, rehabilitation/maintenance year, road installation year, road
classification, road length and width, and number of lanes. The fifth set is the ArcGIS file that
only the road segment ID and the corresponded road speed limit is used.
3.3 Evaluate Current Road Network Status
To evaluate the current road network status the overall condition of each road is determined
using the existing method that the City of Markham is adopted. This method is based on the
engineering judgment and experience. In addition, the roads’ conditions are also calculated using
the MTO’s condition index and the AHP method. The City of Markham uses an overall
pavement performance index called the Overall Condition Index (OCI) which is a function of
Surface Condition Index (SCI) and Roughness Condition Index (RCI) to evaluate the road
condition.
The OCI for each section is calculated by taking the minimum value among the collected surface
distress multiply by 0.8 plus the roughness for each section multiply by 0.2.
OCISection = (Min ∑ + RCI*0.2 (Equation 10)
where:
OCISection = Overall Condition Index of each section, ranging from 0 to100;
i = Surface Distress (Alligator cracking, edge cracking, transverse cracking,
patching, rutting, longitudinal cracking, and mapping);
RCI = Roughness Condition Index.
The Overall Condition Index (OCI) of each road is calculated as follow:
OCI = ∑ ∑
(Equation 11)

14
Where:
i = Number of road segment with the same Unit ID1 and Unit ID2;
OCI = Overall Condition Index for each road segment, ranging from 0 to100;
Length = Inspected length for each road segment.
The OCI for the roads, as it is mentioned earlier, is also calculated based on the AHP method.
Table 5 represents the AHP table that was provided to the City of Markham for incorporating
their engineering judgment and experience in the AHP method. This is necessary to identify the
relative importance factor of each of the collected pavement performance data as compared to
the other factors. The response from the various City of Markham engineering staff is shown in
Table 6. This is then used to determine weights for each pavement performance data.
Table 5: AHP Table Provided to the City of Markham
Table 6: Response from the City of Markham
Table 7 shows the calculations that are required for evaluating the pavement performance
weights and verifying the consistency in the data pair-wise comparison.
Edge Cracking Transverse Cracking Longitudinal Cracking Alligator Cracking Map Cracking Patching Roughness Rutting
Edge Cracking 1.00
Transverse Cracking 1.00
Longitudinal Cracking 1.00
Alligator Cracking 1.00
Map Cracking 1.00
Patching 1.00
Roughness 1.00
Rutting 1.00

15
Table 7: AHP Process to Calculate Weights for All the Pavement Performance Data
The Consistency Index (C.I.) is calculated based on Equation 3. Since there are 8 pavement
performance data the C.I = ((Sum (C.I) /8) – 8) / (8 – 1) = (79.87/8 – 8) / 7 = 0.28.The Random
Index (R.I) based on Table 3 is 1.41. The Consistency Ratio (C.R) based on Equation 4 is
calculated to be 0.2. Table 8 shows the weighting factors that are obtained for each pavement
performance data using the AHP method.
Table 8: Weighting Factors for Pavement Performance Data Using AHP Method
In addition to the AHP method and the City of Markham existing method, the MTO’s pavement
condition index was used as a third method to calculate the OCI for the road network. Based on
Table 9, it can be concluded that the results from the AHP method is very close to the City of
Markham method.
Table 9: Comparing Different Methods
Methods Mean Variance Standard Deviation
City of Markham 83.1 93.2 9.6
AHP 83.1 88.9 9.4
MTO 79.1 88.4 9.4

16
3.3.1 Current Pavement Condition for Each Road Classification
After calculating the OCI for each road, the next step involved dividing the roads into
homogenous sections based on the road classification, treatment type, and AADT. After
analyzing all the available data, a total of 643 road segments were utilized to analyze the
network. The 643 road segments are classified according to the road classification and treatment
type as summarized in Table 10.
Table 10: Distribution of Road Classification and Treatment Type
Treatment Type
Road
Classification
Shave and
Pave
Expanded
Asphalt
Cold in
Place
Recycling
Micro-
surfacing
Chip
Seal
Fog
Seal Total
Laneway
17
17
Local 197 90 4 13 2 21 327
Collector 49 56
19
124
Minor Arterial 20 49 14 39
122
Major Arterial 6 16
31
53
Total 272 211 18 102 19 21 643
In the case of available AADT information, roads were further classified based on the AADT.
Figures 5 shows the OCI plotted against the age of the pavement with the specific AADT range
for the local road classification corresponding to the shave and pave treatment.
Figure 0: Local Roads with Shave and Pave Treatment for Different AADT
0
10
20
30
40
50
60
70
80
90
100
0 1 2 3 4 5 6 7 8 9 10 11 12 13 14 15
OC
I
Pavement Age (Year)
AADT (0-500)
AADT (500-1000)
AADT (1000-1500)
AADT (1500-2000)
AADT (2000-2500)

17
3.4 Prediction Model for Pavement Performance Deterioration
After calculating the OCI for each road section the Markov model is used to predict the
pavement performance deterioration for various road classifications corresponding to each
treatment strategy for the road network. The performance models were developed for a 20 year
period and considered an OCI of 50 as the minimum accepted service life for the roads. Figure 6
illustrates the pavement performance prediction models using the Markov chain methods for the
three different methods for the local roads with the microsurfacing treatment. The pavement
performance prediction models are drawn up to the minimum acceptable service life which is 50.
Figure 6: Pavement Performance Prediction Model for Local Roads with the Microsurfacing Treatment
3.5 Economic Evaluation of Rehabilitation and Maintenance Alternatives
The present worth (PW) was used for the case study to evaluate the cost for each rehabilitation
and maintenance alternative. To use the PW formula, the analysis period was considered to be
five years with the discount rate of 4% (0.04). The future cost (C) for each treatment type was
calculated by multiplying the length and width of each road by the unit costs of selected
alternative.
3.6 Priority Programing of Rehabilitation and Maintenance Alternatives
The City of Markham’s main objective for selecting road and treatment type is to maintain the
OCI of 50 or higher for each road within the five year period. The ranking method and
optimization method were used for this case study to prioritize the road sections need. The
budget limit for each year for the next five years was considered to be $5,100,000 / year.
0
10
20
30
40
50
60
70
80
90
100
0 1 2 3 4 5 6 7 8 9 10 11 12 13 14 15 16 17 18 19 20
OC
I
Pavement Age (Year)
Local Roads - Microsurfacing - All Methods
Markham MethodMTO MethodAHP Method

18
3.6.1 Do Nothing Option
The do nothing option is carried out as part of this analysis to evaluate the condition of the road
network over the next five years if there is no treatment. To determine the condition of each road
over the next five years, the equation obtained from each Markov model was used.
3.6.2 Simple Ranking Method
The simple ranking method was the first method used to prioritize the road sections needs and
used to select the appropriate rehabilitation and maintenance alternatives for this case study. The
road network was ranked based on the Benefit Cost ratio (B/C) where benefit is the sum of the
average condition of each road for the next five years after applying any treatment and the cost is
the PW value of each treatment in the first year. A budget limit of $5.1 million per year within a
five year period was enforced. The road network was then ranked based on the descending order
of the B/C ratio.
3.6.3 Optimization Method
The Evolver software (Evolver 2012) is employed for optimization purposes. Table 11 shows the
two objective functions and the constraints which were used for the optimization method.
Table 11: Objective Functions and Constraints for Optimization Method
Objective Functions Constraints
Minimize the total cost within a five year
period
Minimum acceptable level of an OCI=50 for each section
of the road network within a five year period
Maximize the average road network
condition within a five year period
Budget limit of $5.1 million per year within a five year
period
3.6.3.1 Results Comparison from Priority program
Tables 12 and 13 show the cost and condition obtained using the simple ranking method and
optimization method for the road network within a five year period, respectively.
Table 12: Road Network Cost Comparison for all Options
Scenario Year 2012 Year 2013 Year 2014 Year 2015 Year 2016 Total Cost
Maximize Average
Condition$5,096,338.46 $5,098,631.32 $5,098,317.10 $5,045,781.13 $5,079,865.31 $25,418,933.32
Minimize Total Cost $10,205,389.49 $6,680,036.52 $5,575,354.35 $3,194,177.59 $5,267,622.47 $30,922,580.42
Simple Ranking $5,059,888.58 $5,077,115.38 $5,013,868.34 $5,027,725.74 $5,064,846.34 $25,243,444.39

19
Table 13: Road Network Condition Comparison for all Options
Based on the results from Tables 12 and 13, even though the minimum cost scenario provided
the best average road network condition within a five year period, it does not satisfy the budget
limit and it is over by 30,922,580.42 – (5*5,100,000) = $5,422,580.42. Thus, the minimize total
cost scenario should be eliminated for further analysis. Figure 7 shows the percentage of sections
of the road network that are below the minimum acceptable level (OCI = 50) within a period of
five years. Based on the results from Figure 7, it can be concluded that maximizing the average
condition scenario provides a lower percentage of sections with the OCI below 50.
Figure 7: Percentage of Roads with OCI < 50 Using Simple Ranking and Evolver
Therefore, it can be concluded that the optimization method provides the ability to produce better
results than the simple ranking method.
Conclusions
The City of Markham’s overall road network condition was calculated based on the three
methods, engineering judgement and experience, a combination of AHP method and engineering
judgement and experience, and the existing well developed pavement indices. After calculating
the OCI, roads were divided into homogenous sections based on the road classification,
treatment type, and AADT for analysis. Markov modeling was used to develop a prediction
model for the pavement performance deterioration. The PW value was used for the economic
evaluation and the discount rate was considered to be 4%. The simple ranking and Evolver
software were used for the prioritization purpose. After comparing the results from the simple
ranking and the optimization method, it can be concluded that the optimization method provides
Scenario Year 2012 Year 2013 Year 2014 Year 2015 Year 2016 Average Condition
Maximize Average
Condition84 83 82 81 83 83
Minimize Total Cost 87 87 88 87 88 88
Simple Ranking 84 84 84 85 85 84

20
the ability to produce better results than the simple ranking method. The overall results from the
case study indicated that the steps and requirements which are explained in the research
methodology are appropriate for implementation in a local agency.
Future Work
Further studies are required to be conducted to explain how local agencies should consider,
identify, and incorporate the distresses associated particularly to the utility cuts such as manholes,
catchbasins, and valve boxes, curb and gutter, and rail road crossing on the pavement while
collecting performance data.
Further studies need to be done to compare different optimization software in terms of advantages
and disadvantages, pricing, and the inputs required from a local agency to be able to adapt the
software.
References
[1] Transportation Association of Canada., (2012). Pavement Design and Management Guide,
Transportation Association of Canada, Ottawa.
[2] Reza, F., K. Boriboonsomsin, and S. Bazlamit., (2006). Development of a Pavement Quality Index
for the State of Ohio. 85th Annual Meeting of the Transportation Research Board , Washington D.C.
[3] Transportation Association of Canada., (1997). Geometric Design Guide for Canadian Roads, Transportation Association of Canada, Ottawa.
[4] Haas, R., W. R. Hudson, and J. P. Zaniewski., (1994). Modern Pavement Management, Krieger Publishing, Malamar, Fla.
[5] Saaty, T. L., (1980). Analytic Hierarchy Process. McGraw-Hill, New York, NY.
[6] Alyami, Z., M. K. Farashah, and S. L. Tighe., (2012). Selection of Automated Data Collection
Technologies using Multi Criteria Decision Making Approach for Pavement Management Systems, 91
st Annual Meeting of the Transportation Research Board , Paper No.12-2878, Washington, D.C.
[7] Elhakeem, A. and T, Hegazy., (2005). Improving Deterioration Modeling using Optimized Transition
Probability Matrices for Markov Chains. 84th Annual Meeting of the Transportation Research Board
, Paper No.12-2878, Washington, D.C.
[8] Rahman, S. and DJ Vanier., (2004). Life Cycle Cost Analysis as a Decision Support Tool for Managing Municipal Infrastructure. National Research Council Canada (NRCC), NRCC-46774.
[9] Hegazy, T., (2010). CIV.E 720 Infrastructure Management Course Note, University of Waterloo, Waterloo, Ontario, Canada, 2010.
[10] Evolver, (2012). Palisade Corporation, URL: http://www.palisade.com/evolver/, Accessed: February 20, 2014.