Development of the Selection Procedure of an Insulating ... · Development of the Selection...
107
Development of the Selection Procedure of an Insulating Foam for Its Application in Gas Insulated Transmission Lines, Demonstrated Using Syntactic Foam by Harshada Ganesh Pendse A Thesis Presented in Partial Fulfillment of the Requirements for the Degree Master of Science Approved October 2014 by the Graduate Supervisory Committee: George Karady, Chair Keith Holbert Raja Ayyanar ARIZONA STATE UNIVERSITY December 2014
Transcript of Development of the Selection Procedure of an Insulating ... · Development of the Selection...

Development of the Selection Procedure of an Insulating Foam for Its Application
in Gas Insulated Transmission Lines, Demonstrated Using Syntactic Foam
by
Harshada Ganesh Pendse
A Thesis Presented in Partial Fulfillment
of the Requirements for the Degree
Master of Science
Approved October 2014 by the
Graduate Supervisory Committee:
George Karady, Chair
Keith Holbert
Raja Ayyanar
ARIZONA STATE UNIVERSITY
December 2014

i
ABSTRACT
Due to increasing integration of renewable resources in the power grid, an
efficient high power transmission system is needed in the near future to transfer
energy from remote locations to the load centers. Gas Insulated Transmission
Line (GIL) is a specialized high power transmission system, designed by Sie-
mens, for applications requiring direct burial or vertical installation of the trans-
mission line. GIL uses SF6 as an insulating medium. Due to unavoidable gas lea-
kages and high global warming potential of SF6, there is a need to replace this in-
sulating gas by some other possible alternative. Insulating foam materials are cha-
racterized by excellent dielectric properties as well as their reduced weight. These
materials can find their application in GIL as high voltage insulators. Syntactic
foam is a polymer based insulating foam. It consists of a large number of micro-
spheres embedded in a polymer matrix.
The work in this thesis deals with the development of the selection proce-
dure for an insulating foam for its application in GIL. All the steps in the process
are demonstrated considering syntactic foam as an insulator. As the first step of
the procedure, a small representative model of the insulating foam is built in
COMSOL Multiphysics software with the help of AutoCAD and Excel VBA to ana-
lyze electric field distribution for the application of GIL. The effect of the pres-
ence of metal particles on the electric field distribution is also observed. The AC
voltage withstand test is performed on the insulating foam samples according to
the IEEE standards. The effect of the insulating foam on electrical parameters as

ii
well as transmission characteristics of the line is analyzed as the last part of the
thesis. The results from all the simulations and AC voltage withstand test are ob-
served to predict the suitability of the syntactic foam as an insulator in GIL.

iii
ACKNOWLEDGEMENT
I would like to express my gratitude towards Dr. George Karady for pro-
viding me the opportunity to work on this project. This has been a great learning
experience for me. I want to thank him for all the valuable support and guidance
he offered for this project. I would like to thank my committee members, Dr.
Keith Holbert and Dr. Raja Ayyanar, for their time and valuable feedback.
Also, I am grateful to Dr. Hermann Koch for providing me the opportunity
to work with Siemens AG, Germany and taking out the time to guide me through-
out the project. I would also like to thank Mr. Michael Tenzer, Siemens for all the
technical support and some important inputs towards the research. I am thankful
to Jiajun Liu for helping me with the basic modeling in finite element method.
Lastly, I want to thank my friends for their help and encouragement. Also,
I am grateful to my family for their unconditional love and enormous support
throughout my educational process.

iv
TABLE OF CONTENTS
Page
LIST OF FIGURES...............................................................................................vii
LIST OF TABLES...................................................................................................x
CHAPTER
1. A BACKGROUND ON GAS INSULATED TRANSMISSION LINES (GIL)
AND SYNTACTIC FOAM ............................................................................ 1
1.1 Background of Gas Insulated Transmission Lines ................................. 1
1.2 Motivation for the Research .................................................................. 7
1.3 Literature Review .................................................................................. 9
1.4 Objective and Scope of Research ........................................................ 17
1.5 Thesis Outline ..................................................................................... 19
2. DEVELOPMENT OF THE SYNTACTIC FOAM MODEL FOR ELECTRIC
FIELD SIMULATION STUDIES ................................................................ 20
2.1 Introduction to the COMSOL Multiphysics Software ........................... 20
2.2 Basic Syntactic Foam Structure ........................................................... 21
2.3 Calculation of the Electrode Potential for the Syntactic Foam Model .. 29
2.4 The Cubical Model of Syntactic Foam with Side 250 μm .................... 32
2.5 Approximation of the Microspheres .................................................... 34
2.6 The Larger Cubical Model of Size 1 mm ............................................. 38
2.7 Impact of Impurities on Electric Field Distribution of Syntactic Foam. 41
3. EXPERIMENTAL IDENTIFICATION OF ELECTRICAL BREAKDOWN
STRENGTH OF SYNTACTIC FOAM......................................................... 54

v
CHAPTER Page
3. 1 AC Voltage Withstand Test ................................................................. 54
3. 2 Test Procedure .................................................................................... 55
3. 3 Description of the Test ........................................................................ 56
3. 4 Results and Discussions ...................................................................... 59
4. ELECTRICAL PARAMETERS AND LINE CHARACTERISTICS OF
FOAM INSULATED TRANSMISSION LINES (FIL) ................................ 64
4.1 Basic Constructional Details of Syntactic Foam Insulated Transmission
Line........................................................................................................64
4.2 Calculation of Electrical Parameters .................................................... 66
4.3 Distributed Parameters Model of Transmission Line ........................... 68
4.4 AC Power Flow for the Two Bus System with a Distributed Parameter
Model of Transmission Line ................................................................ 70
4.5 The Power-Voltage Curve for the Transmission Line .......................... 73
5. CONCLUSIONS AND FUTURE WORK .................................................... 78
5.1 General Conclusions ........................................................................... 78
5.2 Future Work ........................................................................................ 83
REFERENCES .................................................................................................. 85
APPENDIX
A. SPECIFICATIONS OF GIL, OVERHEAD LINE AND XLPE
TRANSMISSION CABLE, ALL OPERATING AT 400 kV FOR
COMPARISON OF THE ELECTRICAL PARAMETERS .......................... 88
B. EXCEL VBA CODE USED FOR THE SYNTACTIC FOAM MODEL ...... 90

vi
Page
C. EXCEL DATA ANALYSIS FOR ELECTRIC FIELD DISTRIBUTION ..... 93

vii
LIST OF FIGURES
Figure Page
1.1 Construction of Gas Insulated Transmission Line......................................... 2
1.2 The Flat Formation of Phase Distribution of GIL ......................................... 6
1.3 The SEM Picture of Epoxy-Resin Matrix, Glass Microsphere Based
Syntactic Foam ......................................................................................... 10
1.4 Rise of the Partial Discharge Activity ....................................................... 16
2.1 Flowchart for the Program for Determining Coordinates of the Spheres ..... 25
2.2 Electric Field Distribution of 400 kV GIL .................................................. 30
2.3 Electric Potential Distribution of 400 kV GIL ............................................ 31
2.4 The Section of the Syntactic Foam Modeled .............................................. 31
2.5 The Meshed Cubical Model of Syntactic Foam of Side 250 μm ................. 33
2.6 The Electric Field Distribution for the y-z Planar Surface at x = 100 μm .... 33
2.7 Electric Field Distribution of the y-z Plane at x= 100 μm for the
Approximated Model ................................................................................ 36
2.8 Comparison of the Electric Field Stress of the Original and Approximated
Models Along the Direction of Electric Field and Perpendicular to It. ....... 37
2.9 Meshed Cubical Model of Side 1 mm ....................................................... 38
2.10 The Electric Field Distribution of the y-z Plane at x= 500 μm .................... 39
2.11 The Positional Heating of the Syntactic Foam ........................................... 42
2.12 The Model of the Syntactic Foam With Metal Particle Placed Vertically at
the Center of the Cubical Section of Side 2 mm. ...................................... 44

viii
Figure Page
2.13 The Electric Field Distribution Along the Plane Passing Through the Center
of the Metal Particle Placed Vertically in the Cubical Section of 2 mm .... 44
2.14 The Model of the Syntactic Foam With Metal Particle Placed Horizontally
at the Center of the Cubical Section of Side 2 mm. ................................... 46
2.15 The Electric Field Distribution Along the Plane Passing Through the Center
of the Metal Particle Placed Horizontally in the Cubical Section of Side 2
mm ......................................................................................................... 47
2.16 The Model of the Syntactic Foam With Metal Particle Placed Along the
Diagonal of the Cubical Section of Side 2 mm. ........................................ 48
2.17 The Electric Field Distribution Along the Plane Passing Through the Center
of the Metal Particle Placed Horizontally in the Cubical Section of Side 2
mm. ......................................................................................................... 49
3.1 The Electrode Configuration for the AC Voltage Withstand Test .............. 57
3.2 The Test Setup for AC Voltage Withstand Test ......................................... 58
3.3 The Connection Diagram of the Dielectric Breakdown Test ...................... 59
3.4 The Effect Varying Sample Thicknesses on Breakdown Strength of
Syntactic Foam ....................................................................................... 63
4.1 Schematic Diagram of Long Line.................................................................68
4.2 Power Transfer in Simple Two Bus AC System ........................................ 70
4.3 Power-Voltage Characteristics with a Constant Power Factor Load of 0.8,
Lagging for 400 kV. .................................................................................. 75
4.4 Power-Voltage Curve for Varying Power Factors for 400 kV, 200 km ....... 76

ix
Figure Page
4.5 Power-Voltage Curve for Varying Power Factors for 400 kV, 300 km ........ 76

x
LIST OF TABLES
Table Page
1.1 Comparison of Electrical Parameters of GIL, OHL and XLPE Cable
Operating at 400 kV ...................................................................................... 3
1.2 Comparison of RMS Values of Magnetic Flux Density for GIL, Overhead
Line and XLPE Cable at 1 m Above Ground Level ....................................... 6
1.3 GIL Installations Across the World ............................................................... 7
2.1 Relative Electric Permittivity of the Constituent Elements .......................... 27
2.2 400 kV GIL Dimensional Parameters .......................................................... 29
3.1 Breakdown Voltage Stress for the Syntactic Foam Sample with Thickness 3
mm ............................................................................................................ 60
3.2 Breakdown Voltage Stress for the Syntactic Foam Sample with Thickness 3.5
mm ............................................................................................................ 60
3.3 Breakdown Voltage Stress for the Syntactic Foam Sample with Thickness 4
mm ............................................................................................................ 61
4.1 Typical Dimensional Data of 400 kV FIL .................................................... 65
4.2 The Calculated Values of Inductance, Capacitance and Resistances. ............ 67
1
CHAPTER 1.
A BACKGROUND ON GAS INSULATED TRANSMISSION LINES (GIL)
AND SYNTACTIC FOAM
1.1 Background of Gas Insulated Transmission Lines
The inclusion of increasing number of renewable resources in the existing
power system will result in some basic changes in power transmission system in
the near future. These renewable generators are generally located far away from
the metropolitan areas. The energy is then transferred from these remote locations
to the load centers through high power transmission systems. Such high power
transmission systems have already been installed in developing countries like
China and India to transfer several giga watts of energy over a long distance of
1000 km or more. These long transmission lines require very high towers (typical-
ly 70-80 m) and a large number of conductor bundles [2]. This type of assembly is
difficult to construct for every geographical location. The Gas Insulated Trans-
mission Lines (GIL), developed by Siemens AG, can be proven as one of the
possible alternatives to deal with the above mentioned problem.
Gas Insulated Transmission Lines (GIL) technology is mainly used for
high power transmission for special applications requiring direct burying or ver-
tical installation. GIL is an optimized adaptation of the Gas Insulated Switchgear
(GIS) technology for long distance applications. The conductor in GIL is placed
inside the earthed outer conducting enclosure and the space between the two is
filled with the insulation gas under pressure. Support insulators are used to main-

2
tain the position of the conductor. The sliding contacts are provided to help in
case of thermal expansion. Thermal, mechanical and dielectric factors are general-
ly considered for dimensioning of GIL [1-2]. GIL is divided into small gas com-
partments throughout its length. It mainly uses SF6 or a mixture of SF6 and N2 un-
der high pressure for electrical insulation [3]. The constructional features of GIL
can be seen from the Figure 1.1. The figure is used with the permission of ©Sie-
mens AG.
Figure 1.1 Construction of Gas Insulated Transmission Line [2]
The advantages of GIL are as follows:
Low losses because of the larger cross section of conductors
Low dielectric losses
Ratings of 2000 A for single circuit and directly buried applications
Horizontal, vertical or slanted installation possible in above ground,
tunnel, directly buried or submarine environment

3
Immune to weather conditions: ice, snow, wind, pollution
No visual impact, no audible noise
Low electromagnetic interference.
For a single phase GIL with enclosures solidly bonded at each end, there
exists a series inductance and capacitance to earth for each phase. Coupling be-
tween the phases can be neglected considering the screening effect of the enclo-
sures of the GIL assembly. The enclosure and conductor of GIL are designed to
have large cross section. Because of this, the series resistance per phase is gener-
ally low for GIL. The value of shunt conductance per phase too, is insignificant.
For 50 Hz, the values of electrical parameters of GIL at 400 kV, 2000 MVA are
given in Table 1.1. Along with this, these values are compared with that of over-
head lines (OHL) and XLPE cables (2 per phase), both operating at 400 kV with
thermal rating of 2000 MVA [5].
Table 1.1 Comparison of Electrical Parameters of GIL, OHL and XLPE Cable
Operating at 400 kV
GIL OHL XLPE cable
(2 per phase)
Current rating (A) 3000 3000 3000
Transmissible Power (MVA) 2078 2000 2000
Dielectric losses (W/m) - 2.4 15.0
AC resistance (μΩ/m) 6.7 20 6.0
Inductance (nH/m) 162 892 189
Capacitance (pF/m) 68.6 13 426

4
Similar transmission capacities as stated in Table 1.1, may also be ob-
tained from some other geometrical configurations. Thus, all the figures
represented in the Table 1.1 are for indication purpose [5]. The specifications of
the overhead line, GIL and the transmission cable are specified in Appendix A.
From Table 1.1, it can be observed that the inductance of GIL is less than
that of the overhead transmission line almost by the factor of 5.5. In a meshed
system, GIL can be used in parallel with a regular overhead transmission line to
share the total power transferred. In general, the power flow across two buses is
given by the equation,
SinX
VP
2
(1.1)
Where, V is the magnitude of the voltage, δ is the phase angle between the send-
ing and the receiving end voltage and X is the reactance of the transmission line.
The resistance value is assumed to be very small for the derivation of the above
formula. Because of the lower inductance, GIL when constructed in parallel with
an overhead line carries a greater share of transmitted power. When a GIL with
reactance XGIL, is constructed in parallel with a transmission line with reac-
tance OHLX , the resultant inductance will be GILOHL
GILOHLEq
XX
XXX
and the total power
transferred is sin2
EqX
VP . Now, the total power carried by the GIL in the above
mentioned scenario will be given by,
GILOHL
OHL
XX
X
P
P
1 (1.2)

5
Thus, by substituting OHLX =5.5 GILX in Equation (1.2), it can be concluded that the
GIL carries almost 85% of the total power when constructed in parallel with the
overhead line [5].
When the line loading of GIL is exceeded than the natural loading of the
line, the voltage at the receiving end starts decreasing. The capacitor charging cur-
rent of the line may reduce the actual useful power transmitted across the line
within thermal limits. This can be improved using reactive power compensation.
In GIL, the reactive compensation is not needed till the length of 100 km [5].
Steady state stability is mainly related to the ability of the system to return
back to its original operating condition following a small disturbance such as load
variation or switching operation. Steady state stability of the system is mainly af-
fected by the control system of the network and thus, GIL has negligible effect on
it. The transient stability of the system increases with the decrease in inductance
of the transmission line [5]. Thus, inclusion of GIL increases transient stability of
the system due to smaller value of inductance.
Electromagnetic field of GIL
To protect general public and the person working on the maintenance of a
transmission line, there are some international guidelines on electromagnetic field
limitations. As seen from Figure 1.1, the construction of GIL is such that the
Aluminum enclosure is grounded. Because of the solidly grounded enclosure sys-
tem, inverse current gets induced in the low impedance enclosure, thereby reduc-
ing the total electromagnetic interference. This screening remains effective in case
of transient conditions too.

6
When GIL has a single phase enclosed design and the enclosures are solid-
ly bonded at each end, the circulating currents in the enclosure will try to reduce
the external magnetic field of the GIL. However, the magnetic field is not com-
pletely nullified as a result of the spatial disposition of the three phases in the sys-
tem. This is represented in Figure 1.2. The comparison between RMS values of
magnetic flux density, at 1 m above the ground level, for a GIL, a transmission
cable and an overhead line is given in the Table 1.2. All the values are calculated
for the transmitted power of 2000 MW. All the lines are 400 kV lines and with
3000 A current carrying capacity [5].
Figure 1.2 The Flat Formation of Phase Distribution of GIL
Table 1.2 Comparison of RMS Values of Magnetic Flux Density for GIL, Over-
head Line and XLPE Cable at 1 m Above Ground Level
B (μT) Distance from the central axis (m)
0 10 20 30
Overhead line 42.0 36.5 21.0 10.8
GIL Flat formation 5 0.25 0 0
XLPE cable 1 per phase
Flat formation
109 11 2.9 1.3
XLPE cable 2 per phase
Flat formation
13.2 0.74 0.19 0.08

7
The first GIL operating at 400 kV was installed in Schluchsee, Germany
in 1975 for a hydropower pumping storage plant. The longest GIL till date is in-
stalled at PP9 in Saudi Arabia in 2004 which is 17 km long line connecting 8
blocks of power plant to a substation operating at 400 kV. Another GIL installa-
tion in Japan connects Tokai Substation to the Shin-Nagoya Power substation
through a tunnel based installation of 9.9 km [2]. Table 1.3 summarizes some of
the other worldwide installations of GIL [2].
Table 1.3 GIL Installations Across the World [2]
Place Operating voltage Place Operating voltage
Joshua Falls, USA 145 kV Bowmanville, Cana-
da
550 kV
Palexpo, Switzerland 220 kV Baxter Wilson Pow-
er Plant
550 kV
Sai Noi, Thailand 550 kV Hams Hall, UK 420 kV
Xiluodu, China 550 kV Cairo North, Egypt 245 kV
1.2 Motivation for the Research
GIL primarily uses SF6 or a mixture of SF6 and N2 at high pressure as an
insulator, filled in between the conductor and the enclosure. Small sections of
Aluminum enclosure and conductor are welded together on the site location to
build a long length GIL. SF6 is then filled in the gap at the pressure of 8 bars.
When the line length increases, gas leakages through the enclosure system be-
comes unavoidable. When GIL is used over longer lengths, maintaining gas pres-
sure becomes very important for reliable operation. This requires additional care
and safety units to restrict gas leakages throughout the length of the GIL. In addi-

8
tion to that due to high global warming potential of SF6, it has been listed as a
greenhouse gas in Kyoto Protocol in 1997. SF6 is about 23000 times more harm-
ful than CO2. The survey of the present situation of environmental implications
caused by SF6 is given in the paper by WG 23-02 [24]. The clearance from the au-
thorities and governments for the projects dealing with SF6 has become increa-
singly difficult over the years due to the restrictions on the use of SF6. Therefore,
different attempts are being made to replace SF6 by some other insulating materi-
al.
One option to deal with this problem is to replace SF6 by some other insu-
lating gas such as N2, CO2 or air, at a very high pressure to maintain sufficient di-
electric strength for the reliable operation of the transmission line. But the gas
leakages throughout the length of the line will affect the gas pressure and thus
leading to unreliable operation of the transmission system. Liquid insulating ma-
terials too, will face the same leakage problem. Moreover, the weight of the as-
sembly will increase as a result of the high density of the liquid insulators. Anoth-
er option is to use solid insulating material to fill up the gap in between the enclo-
sure and the conductor. In general, polymer based solid insulators possess very
high value of relative permittivity which increases capacitance and dielectric
losses in the transmission line. The behavior of the line insulated with the solid
insulation will be very similar to transmission cables.
The other feasible alternative to this solution is to use an insulating foam
material for this particular application of high voltage transmission line. The rela-
tive permittivity of the foam insulating materials is comparatively lower than that

9
of the solid insulating materials. This makes it different than the regular transmis-
sion cables. The foam insulating material is characterized by reduced weight and
compact design. Polyurethane foam is a foam insulating material which is widely
used in low voltage applications [10]. The open cell structure of the voids in Po-
lyurethane foam affects its long term performance as an insulator. Syntactic foam
is a new type of insulating material consisting of hollow microspheres embedded
inside the polymer matrix. The special characteristic of this foam is the closed cell
structure. The properties such as high dielectric strength, low density and good
mechanical strength make this foam a potential alternative for the replacement of
SF6 from GIL. Syntactic foam is already in use for the cable termination units of
the high voltage transmission cables as an insulator [7]. Therefore, this type of in-
sulating foam can be a possible solution for the application of GIL which will
solve the problem of gas leakage as well as won't increase capacitance of the line
when compared to the transmission cables.
1.3 Literature Review
Syntactic foam consists of a polymer matrix (called binder) and a number
of hollow microspheres mixed with the binder. Inclusion of hollow microspheres
makes the material lightweight, at the same time keeping the specific strength
high [9]. According to the American Society for Testing and Materials (ASTM),
syntactic foam is a material consisting of hollow sphere fillers in a resin matrix
[8]. The density of the syntactic foam goes down to 0.65 g/cm3 which helps in at-
taining a compact and lightweight design [11].

10
The microstructure of the syntactic foam can be observed with the help of
a scanning electron microscope (SEM) picture as shown in Figure 1.3. Scanning
electron microscope is generally used for the resolution in the range of nanome-
ters. Being a non-conductive material, the syntactic foam sample is coated with
carbon before observation with SEM in order to avoid charging of the sample by
electron beam during microscopy. The foam in the picture consists of glass mi-
crospheres with diameter in the range of 20-120 μm. The spherical microspheres
and polymer matrix can be clearly observed from the Figure 1.3.
Figure 1.3 The SEM Picture of Epoxy-Resin Matrix, Glass Microsphere Based
Syntactic Foam
In general, the spherical microspheres have diameters in between 1-50 μm,
wall thickness between 1-4 μm, bulk density 70-500 kg/m3 and apparent density
50-500 kg/m3 [12]. In some cases, hollow macro spheres (diameter 1-100 mm)
are also used as a filler material.

11
The syntactic foam can be widely differentiated in two basic types, two-
phase syntactic foams and three-phase syntactic foams. If the microspheres are
closely packed in the matrix material, the foam is two-phase syntactic foam. Dur-
ing the process of manufacturing of the syntactic foam, air gets trapped inside the
matrix material. Sometimes the resin can't penetrate through the cluster of micro-
spheres leading to air entrapments. This type of syntactic foam is classified as a
three-phase syntactic foam. Two-phase syntactic foams exhibit good mechanical
properties but the dielectric constant and loss coefficient of the three phase syn-
tactic foam are lower than the two phase syntactic foam. The moisture absorption
is higher in case of three-phase syntactic foam because of the presence of open
source voids [13].
The usual polymer foam consists of randomly distributed air voids with
different shapes and sizes scattered all around the foam. These voids are visible to
the naked eye. Unlike this, air remains trapped inside the glass walls of hollow
microspheres in case of syntactic foam. The uniform shape of the hollow micro-
spheres gives the foam a homogenous structure. The porosity of the foam is in the
microscopic range. Apart from that, syntactic foam possesses many advantages
over the conventional polymer foam such as reduced weight, excellent mechani-
cal strength, and reduced cost, good impact behavior and damage tolerance [14].
The excellent mechanical properties of the syntactic foam are contributed by the
resistivity of the microspheres to the compressive forces [15]. The compressive
properties of the foam depend on the characteristics of the microspheres used. On
the other hand, the tensile properties of the foam are influenced by the matrix ma-

12
terial used [18]. The presence of air voids during production of the foam can alter
the properties of the foam depending on the shape and size of the voids.
Syntactic foam exhibits a closed cell structure making it hydrophobic and
reducing the chances of moisture absorption. The total moisture absorption in syn-
tactic foam mainly depends on the resin-microsphere interface and concentration
or size of the microspheres. For the microsphere concentration of 67% or less by
volume, the water absorption is insignificant and is independent of the density of
the microspheres [16]. The absorption increases rapidly with the increase in pres-
ence of cavities. This property of the syntactic foam makes it a potential insulator
for outdoor applications. The impact of water absorption on dielectric properties
of the syntactic foam was studied by keeping the foam samples immersed in deio-
nized water at 50⁰C for 50 hours [17]. Four different types of filler microspheres
were used for the test. The microspheres were manufactured with various combi-
nations of untreated or silane-coated glass surfaces, different alkali ion concentra-
tion in the glass walls and diameters ranging between 40 μm to 60 μm. It was ob-
served that for the foam samples with untreated microspheres the increase in
weight was more than 2.5% while for the silane-coated microsphere samples, the
increase in weight was less than 2% of the original value. The silane-coating pro-
vides a chemical bonding between the epoxy resin matrix and the microspheres.
This reduces the water ingress. The dielectric properties such as permittivity and
loss factor of the foam increase for the samples with untreated microspheres and
with high alkali ion concentration. With the low concentration of the alkali ions

13
used, the washout rate also reduces. Thus, syntactic foam with rightly chosen mi-
crospheres can be used for the submarine applications too.
The ageing behavior of the syntactic foam due of the effect of temperature
and humidity is observed in [19]. The hydrothermal ageing of epoxy based syn-
tactic foam with polymeric microspheres was observed by climatic chamber and
pressure cooker storage method. The characteristics like breakdown strength and
dielectric constant were observed throughout the ageing process. It was observed
that the water intake is higher in case of pressure cooker method than the climatic
chamber method due to higher temperature. Addition of silica particles to the ma-
trix material decreases the residual water in the foam. The dielectric constant of
the foam increases with the ageing time. The breakdown strength decreases over
the period of time due to hydrothermal ageing. The overall study shows good hy-
drothermal behavior of the syntactic foam in terms of water intake and its effect
on dielectric constant. Thus, it can be easily used for the outdoor applications.
The syntactic foam, in general, is characterized by a low dielectric con-
stant. By using appropriate inorganic microsphere configurations, the loss tangent
factor of the syntactic foam can be reduced. Thus, dielectric losses can be reduced
by using appropriate syntactic foam. The effect on the value of permittivity of the
syntactic foam because of the elastomeric or silane coating on the microspheres is
observed in [20]. The permittivity of the foam is measured by dielectric spectro-
graph for the frequencies from 10-1
to 107 Hz. It was observed that for the fre-
quencies greater than 1 Hz, the elastomeric or silane coating doesn't have any ef-
fect on the permittivity of the foam. At lower frequencies, the complex permittivi-

14
ty reduces because of the nanometer coatings of the microspheres. The effect of
varying humidity on the syntactic foam samples with 50% volume concentration
of microspheres and with diameter 65 μm is studied in [11]. Three foam samples,
one stored at 80% humidity at 80⁰C, one stored at ambient temperature and the
other stored at 80⁰C in dry condition were tested by dielectric spectrography. It
was observed that the relative permittivity and loss factor remain unaffected by
the humid conditions.
High strength, thermal and environmental stability, low shrinkage and
high water resistance are few of the properties that make epoxy based syntactic
foam superior over other matrices. The effect of varying degree of volume frac-
tion of microspheres on tensile strength of syntactic foam is observed in [14]. The
microspheres used are of the same sizes but of different densities from 220, 320,
380, 480 kg/m3. It was observed that the tensile strength of syntactic foam with all
the types of microspheres showed decreasing tensile strength when volume per-
centage was increased from 30 to 60%. It was observed that the specific strength
of the low density microspheres almost remains unaffected by the degree of vo-
lume fraction.
Moreover, the thermal expansion coefficient of the epoxy based syntactic
foam is lower than the plain epoxy. This coefficient further reduces with the in-
crease in microsphere concentration. For any particular percentage of the micro-
spheres, this coefficient remains constant for the temperature rise till almost

15
370oC. Thus, even for the higher working temperatures, the probability of genera-
tion of air voids because of thermal expansion is very low.
Syntactic foam can be used as a replacement to the conventional dielectric
insulators because of its lightweight structure, low material cost and good elec-
trical insulation properties. The variation in size and concentration as well as dif-
ferent material for microspheres or the polymer matrix helps in getting desired in-
sulation and mechanical properties according to the required application. It is im-
portant to study the performance of the syntactic foam under long term electric
stress before its probable use as a dielectric insulator. The long term stability of
the foam with polymer coated microspheres is investigated in [11]. The syntactic
foam with 40% concentration of the microspheres with diameter 40 μm doesn't
undergo electrical breakdown for the electric stress of 20 kV/mm and 25 kV/mm
for the time duration of 1000 hours. The dielectric strength increases as compared
to the foam with microspheres of diameter 95 μm, as a result of reduced dis-
charges inside smaller microspheres. The long term stability of the foam is greatly
affected if the electric stress for the analysis or the size and concentration of the
microspheres is increased. The breakdown strength of the foam can be improved
by addition of silica particle to the matrix material.
The partial discharge activity of the syntactic foam material has been stu-
died under non-uniform and uniform field studies in [21] and [22]. The sample
used for the experimental study was of 2 mm thickness, made up of epoxy resin
matrix with 40% concentration of microspheres. When a high voltage is applied
to the foam, the partial discharge activity starts from the amplitude of few pico-

16
farads coulombs at the voltage of 27 kV. The amplitude then remains unaffected
as the voltage magnitude is increased till a sudden rise in the discharge activity is
observed. After a certain voltage this "step" activity recurs with lesser time inter-
val and breakdown through the foam takes place.
Figure 1.4 Rise of the Partial Discharge Activity [21]
Under uniform field stress, the partial discharge starts at 30 kV at about 10
pC and it remains constant over increasing voltage magnitude till 36 kV. The in-
tensity of partial discharges increases to a very high value at 52 kV. The partial
discharges initiates in inhomogeneous fields inside the foam like air voids or cavi-
ties inside the microspheres. These discharges are inhibited by some local limita-
tions as a result of which the amplitude remains constant. When a syntactic foam
sample is observed by scanning electron microscope after the partial discharge
test, the material doesn't show any signs of deterioration. The field stress increas-
es as soon as breached between two dielectrics occur and breakdown takes place.
Thus, under uniform field stress, the breakdown does not occur because of the

17
erosion of the material. It occurs because of the dielectric breakdown of the ma-
trix material.
1.4 Objective and Scope of Research
It can be seen from the literature review that there has been a lot of inves-
tigation related to the dielectric properties of various types of insulating foams de-
scribing different aspects such as long term stability, effect of humidity or tem-
perature on dielectric permittivity and partial discharge behavior in uniform and
non-uniform field stress. But there is no guideline about the selection procedure
of insulator foam for the special application related to the high voltage transmis-
sion line. The primary objective of the thesis is to establish the first step of this
guideline by developing a computer based model of the insulating foam to ana-
lyze electric field distribution for the application of transmission line. In addition
to this, a study of dielectric breakdown properties and effect of the insulator on
transmission characteristics of the transmission line are the secondary objectives
of the thesis. Since syntactic foam can be a probable alternative as explained ear-
lier, all the steps of the selection procedure are demonstrated with syntactic foam
as an example. The suitability of the syntactic foam for the application of GIL is
also evaluated.
As the primary objective of the thesis, a small model of the insulating
foam is developed in COMSOL Multiphysics software for an epoxy based syntac-
tic foam consisting of glass microspheres with 40% concentration by volume and
with random radii ranging from 30-60 μm. The randomness in the structure was

18
introduced with the help of the Microsoft Excel VBA coding. Various approxima-
tions were made while modeling the foam given the intricate structure of syntactic
foam. The base electric field is assumed to be the maximum field that exists in-
side the Gas Insulated Transmission Line operating at 400 kV for considering
pessimistic scenarios for the simulations. The variation of the maximum and the
minimum value of the calculated electric field with respect to the base electric
field are analyzed and probability of breakdown through the foam is evaluated
with the help of the numerical analysis of the results. Also, effect of metal impuri-
ties on the electric field distribution is also analyzed.
After modeling the foam using COMSOL Multiphysics, AC voltage with-
stand tests are conducted on syntactic foam samples in the practical environment.
The epoxy-based syntactic foam with the same configuration as that of the one
considered for the computer model is used for carrying out the test. The test sam-
ple thicknesses are taken as 3 mm, 3.5 mm and 4 mm. The test is conducted ac-
cording to the IEEE standard for high voltage testing. The foam samples are im-
mersed in the transformer oil at the time of breakdown voltage test. The effect of
sample thickness on breakdown voltage of the syntactic foam is also studied.
As the last part of the thesis, the effect of the insulating foam on the elec-
trical parameters of the line is studied. The detailed constructional features of
Foam Insulated Transmission Line (FIL) operating at 400 kV are described first.
The inductance, capacitance and resistance are calculated for the designed FIL.
The transmission line is modeled with the help of the distributed parameters mod-
el. The power voltage characteristics are plotted for the simplified two bus system

19
connected with FIL to get the load characteristics of the line. The maximum pow-
er that can be transferred with FIL is calculated keeping in mind the voltage oper-
ating limits. The no-load characteristics are also plotted to observe the Ferranti ef-
fect.
1.5 Thesis Outline
Chapter 1 provides the background of the Gas Insulated Transmission Line, moti-
vation for the research, the literature review of the syntactic foam and the objec-
tive of the thesis.
Chapter 2 deals with the primary objective of the thesis i.e. computer simulation
model of syntactic foam in COMSOL Multiphysics. The functionality of the soft-
ware, different steps involved in building the simulation model, the analysis of the
results is explained in this chapter.
Chapter 3 deals with explanation of the test procedure and results for the high vol-
tage breakdown test for the syntactic foam samples.
Chapter 4 deals with the calculation of electrical parameters such as resistance,
inductance and capacitance of the transmission line. The maximum power that
can be transferred through the line under voltage stability conditions is estimated
in the chapter.
Chapter 5 includes all the important conclusions from the study and it refers to the
other steps that can be considered for the selection process.

20
CHAPTER 2.
DEVELOPMENT OF THE SYNTACTIC FOAM MODEL FOR ELECTRIC
FIELD SIMULATION STUDIES
As the first step of the selection procedure of insulating foam for its appli-
cation in Gas Insulated Transmission Lines, the electric field distribution is ana-
lyzed for the estimated base electric field stress. Thus, to study electric field dis-
tribution through the insulating foam, a small representative model is designed in
COMSOL Multiphysics software based on finite element analysis (FEM) method.
For syntactic foam, the main constituent dielectric components are air, epoxy re-
sin and glass. The composite nature of the dielectric leads to an uneven electric
field distribution even with the application of uniform electric field. The follow-
ing chapter describes the steps involved in building an insulating foam model by
modeling syntactic foam. For the model developed, the results of the field distri-
bution are analyzed to discuss suitability of syntactic foam as an insulator. The ef-
fect of the presence of a metal particle in the dielectric medium is also evaluated
as a part of the study.
2.1 Introduction to the COMSOL Multiphysics Software
COMSOL Multiphysics software helps in modeling and solving engineer-
ing and scientific problems through its user controlled environment. For solving
the equations involved in the model, finite element method (FEM) is used with
the help of variety of numerical solvers available with the software. All the steps
involved in building insulating foam model, such as geometry, materials, mesh,

21
solver settings are recorded with the help of sequences. Partial differential equa-
tions (PDE) forms the basis of all the scientific and engineering studies involved
in COMSOL Multiphysics software [23]. The electric, magnetic and electromag-
netic fields can be simulated for static and low frequency applications by solving
differential forms of Maxwell's equations for the initial and boundary conditions.
The equations are solved using the finite element method with numerically stable
edge element discretization. The results are represented by the electric and mag-
netic fields plots in the graphics window. The current and voltages can also be
plotted with the help of user defined settings. The output can be analyzed in two
dimensional or three dimensional environments [24].
The work flow in the module is described by the following steps: defini-
tion of geometry, selection of materials, definition of boundary conditions, defini-
tion of finite mesh elements, selection of solver and visualization of results. These
steps are accessed through the desktop guided user interface [23]. The Electrostat-
ic interface from the AC/DC module is selected for the following simulation of
syntactic foam. Frequency domain analysis at 60 Hz frequency is used to get the
electric field distribution for the AC voltage applied.
2.2 Basic Syntactic Foam Structure
The syntactic foam generally consists of glass microspheres with diame-
ters in the range of 60-120 µm. The microspheres are scattered randomly inside
the epoxy resin matrix. The wall thicknesses of these microspheres lie between 1-

22
5 µm. The development of the syntactic foam model for studying electric field
distribution consists of three main parts,
1. Development of the Microsoft Excel Visual Basic program to generate
random coordinates for microspheres
2. Constructing intricate geometrical components of the syntactic foam
system in AutoCAD
3. Solving the model in COMSOL Multiphysics to plot electric field dis-
tribution and voltage profiles.
1. Development of the Microsoft Excel Visual Basic Code
To make the model as realistic as possible, there has to be randomness in
the composition of the component elements. This randomness is introduced in the
model with the help of Microsoft Excel Visual Basics (VBA) macros. The VBA
program gives random coordinates of the microspheres inside the specified shape
of the foam model. As syntactic foam is manufactured by mechanically mixing
glass microspheres with the resin material, the locations of microspheres are gen-
erated such that no two microspheres intersect with each other. The microspheres
are allowed to form a cluster by touching each other, considering the practical
possibility of the case. According to the general size of the microspheres, each
microsphere is given a random radius between 30 to 60 µm for the simulation
purpose. The wall thickness of the microspheres is maintained at 1 µm. The filling
degree of the foam plays a crucial role in determining mechanical and electrical
properties of the microspheres. Here, the filling degree is maintained in between

23
35-40% of the matrix volume. The flowchart of the program is described in the
Figure 2.1.

24

25
Figure 2.1 Flowchart for the Program for Determining Coordinates of the Spheres

26
2. The geometrical model construction in AutoCAD
The main challenge about the development of a model for syntactic foam
is the large number of elements involved in the geometry of the structure. These
large number of microspheres with diameters in micrometers and 1 µm wall
thicknesses are impossible to construct manually, even for a cubical model as
small as 250 µm. Because of this limitation to construct all the microspheres at
the same time, specialized CAD software, AutoCAD 2014 is used for construction
of this complicated geometry.
AutoCAD is equipped with a feature which enables it to read commands
from the script file and to generate geometrical figures in the work-plane. With
the output coordinates and radii of the microspheres calculated by the Excel VBA
code, the script file can be generated for AutoCAD, with the command SPHERE.
With the help of the other script file with same center coordinates, another range
of concentric spheres can be generated for the simulation of glass walls. After
creating the entire geometry in AutoCAD, it can be exported in as an '.iges' file
which can be directly imported in COMSOL Multiphysics through the CAD Input
Module.
3. Solution for the electric field distribution in COMSOL Multiphysics
The solution of the electric field distribution problem for the considered
syntactic foam model can be found with the help of COMSOL Multiphysics. After
the model is imported through CAD Input Module, the material properties are as-

27
signed to the various elements in the model. The important property with respect
to the electric field distribution is the relative permittivity of the material with re-
spect to air. Since the analysis is done at the supply frequency of 60 Hz, electric
permittivity is kept constant with respect to the change in frequency. The various
materials and their dielectric permittivity considered for the model is given in Ta-
ble 2.1.
Table 2.1 Relative Electric Permittivity of the Constituent Elements
Material Relative permittivity
Aluminum electrodes 1
Epoxy resin matrix 3.5
Glass walls of microspheres 5
Air inside the microspheres 1
After assigning the material properties, the physics settings are finalized
for the model. The solution is obtained with the help of finite element analysis.
Finite element analysis method is used in a wide variety of engineering problems
such as solid mechanics, dynamics, heat problems, fluids and electrostatic prob-
lems. Finite element analysis cuts a structure into several elements (pieces of the
structure). This process results in a set of simultaneous algebraic equations. The
behavior of electric field is based on the nature of electrodes (uniform and non-
uniform). Finite element method uses the concept of piece-wise polynomial inter-
polation. By connecting the elements together, the electric field quantity becomes
interpolated over the entire structure in piece-wise fashion. In this method, inde-
terminate structures are solved [27].

28
In electrostatics, Maxwell’s equations and constitutive equation reduce to
the following form,
0 E (2.1)
D (2.2)
ED (2.3)
Where, E is the electric field intensity, D is the electric displacement, ρ is
the space charge density, ε is the dielectric permittivity of the material. Based on
Eq. (2.1), electric field intensity is introduced by the negative gradient of the elec-
tric scalar potential, V, in following form
VE
Substituting equations (2.2) and (2.3) in (2.1) Poisson's scalar equation is
obtained as
VV r0
Where, ε0 is the permittivity of free space and εr = εr (E, x, y, z) is the rela-
tive permittivity. If the permittivity εr is constant such as in the isotropic dielec-
trics,
V
For space charge free (ρ = 0) fields, field is expressed by Laplace’s equa-
tion as V = 0. In this study, solution of the problem is obtained from solution of
Laplace’s equation in rectangular coordinates.

29
z
V
y
V
x
VV
2
2
2
2
2
22
V= Breakdown voltage on the upper electrode,
V = 0 Volt (ground) on the lower electrode,
∂V/∂n = 0 on all other outer boundaries and on the symmetry axis.
After setting up the physics conditions for the module, meshing is done to
solve the above equations at those many points in the geometry. Once meshing is
done AC analysis is done by adding frequency domain study to the model and
solving the system for 60 Hz frequency.
2.3 Calculation of the Electrode Potential for the Syntactic Foam Model
For a 400 kV standard GIL, standard dimensions of the enclosure and
conductor are given in Table 2.2 [2].
Table 2.2 400 kV GIL Dimensional Parameters
Operating Voltage Level (kV) 400
Conductor Outer Diameter (mm) 180
Conductor thickness (mm) 10
Enclosure Inner Diameter (mm) 500
Enclosure thickness (mm) 10
Since it is very difficult to build the syntactic foam structure for the entire
volume enclosed by the 400 kV GIL, some smaller models are built in COMSOL
to study electric field distribution. Now, the GIL consists of two concentric metal-

30
lic cylinders insulated with the insulating gas, SF6. When the support insulators
are neglected for the simplified case, the electric field distribution is coaxial. It is
very high in the vicinity of the conductor and then the value decreases in radially
outward direction towards the enclosure. Figure 2.2 and Figure 2.3 show the plots
for electric field intensity (V/m) and electric potential (V) simulation of simplified
GIL model in COMSOL. The maximum electric field was calculated to be 4.39
kV/mm.
Figure 2.2 Electric Field Distribution of 400 kV GIL

31
Figure 2.3 Electric Potential Distribution of 400 kV GIL
Figure 2.4 The Section of the Syntactic Foam Modeled
For the smaller scale model of the syntactic foam, a cubical/ rectangular
section is modeled in between two parallel plate electrodes. In case of a parallel
plate electrode configuration, the electric field generated in between the two elec-
trodes is uniform. Thus, the base value of the field for these models is always

32
maintained equal to the maximum value of the coaxial field of the simplified GIL
model i.e. 4.39 kV/mm. The idea of simulating a smaller section of syntactic foam
in the transmission line is made clear with Figure 2.4. The relationship between
applied voltage and the magnitude of the electric field intensity in case of parallel
plate electrodes is given by,
d
VE (2.4)
Where, V is the voltage applied to the high voltage electrode when the
other electrode is grounded and d is the distance between the electrodes. Thus, the
voltage applied to the Aluminum electrode for the simulation purpose is calcu-
lated using Equation (2.4).
2.4 The Cubical Model of Syntactic Foam with Side 250 μm
As a first step to analyze electric field distribution for the syntactic foam, a
cubical model is built in COMSOL Multiphysics. The side of the cubical section is
designed to be 250 µm. The voltage of 1598 V is applied to the Al electrode to
keep the base voltage stress at 4.39 kV/mm. The conditions are assumed to be
ideal with no contaminating particles and absence of air bubbles. The model is
represented in Figure 2.5. The maximum value of field stress observed inside the
cubical section is 6.35 kV/mm. This value is almost 2 times the value of break-
down strength of air. For understanding the overall behavior of the electric field
distribution for syntactic foam, the distribution for the y-z planar surface at x=100
µm is plotted and is shown in Figure 2.6.

33
Figure 2.5 The Meshed Cubical Model of Syntactic Foam of Side 250 μm
Figure 2.6 The Electric Field Distribution for the y-z Planar Surface at x = 100 μm
34
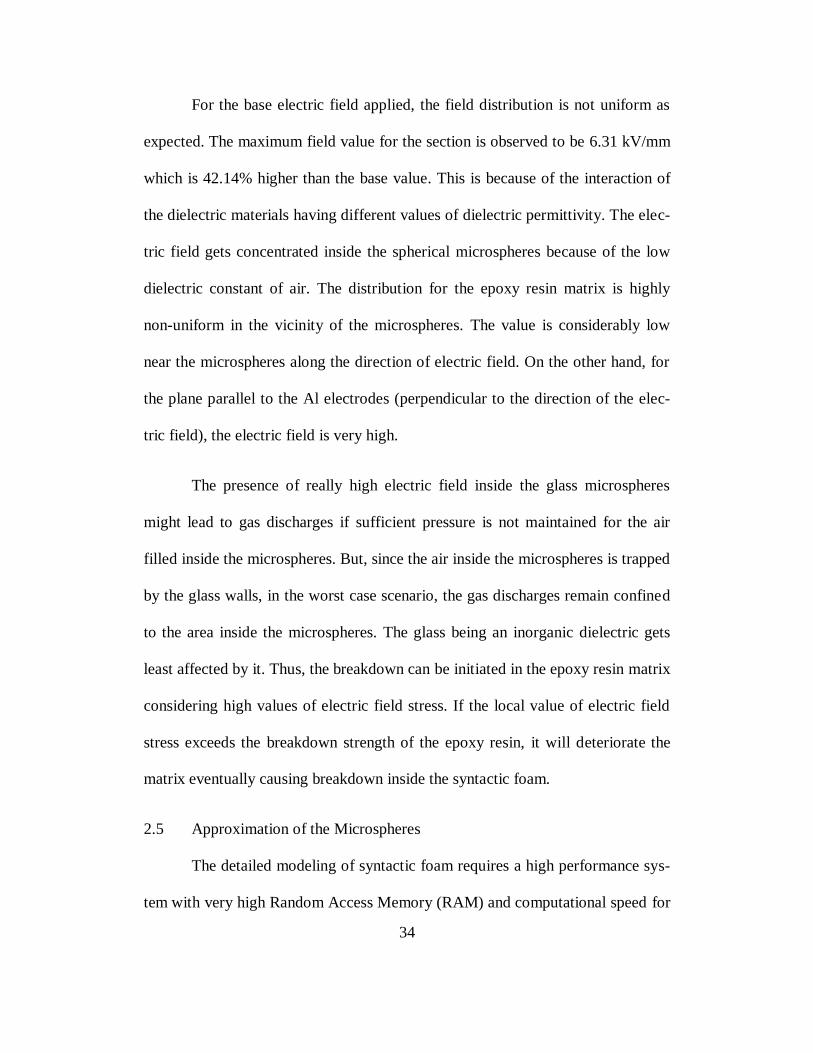
For the base electric field applied, the field distribution is not uniform as
expected. The maximum field value for the section is observed to be 6.31 kV/mm
which is 42.14% higher than the base value. This is because of the interaction of
the dielectric materials having different values of dielectric permittivity. The elec-
tric field gets concentrated inside the spherical microspheres because of the low
dielectric constant of air. The distribution for the epoxy resin matrix is highly
non-uniform in the vicinity of the microspheres. The value is considerably low
near the microspheres along the direction of electric field. On the other hand, for
the plane parallel to the Al electrodes (perpendicular to the direction of the elec-
tric field), the electric field is very high.
The presence of really high electric field inside the glass microspheres
might lead to gas discharges if sufficient pressure is not maintained for the air
filled inside the microspheres. But, since the air inside the microspheres is trapped
by the glass walls, in the worst case scenario, the gas discharges remain confined
to the area inside the microspheres. The glass being an inorganic dielectric gets
least affected by it. Thus, the breakdown can be initiated in the epoxy resin matrix
considering high values of electric field stress. If the local value of electric field
stress exceeds the breakdown strength of the epoxy resin, it will deteriorate the
matrix eventually causing breakdown inside the syntactic foam.
2.5 Approximation of the Microspheres
The detailed modeling of syntactic foam requires a high performance sys-
tem with very high Random Access Memory (RAM) and computational speed for

35
computing field distribution by COMSOL Multiphysics due to its intricate struc-
ture at the microscopic level. The availability of such a system for the simulation
purpose is not always possible due to high costs involved. Therefore, in order to
make a large scale model, some simplifications are necessary such that the new
field distribution is as same as the original one.
The geometrical construction of foam involves construction of two con-
centric spheres for the hollow part and the glass walls. Simplification can be done
by modeling the microspheres by a single sphere with dielectric constant 1.57.
The value of the dielectric constant is obtained by trial and error method such that
the new model’s field distribution pattern in almost similar to the original model
and the variations in electric field stress values are within the acceptable limits.
This new idea is implemented on a smaller 250 µm model with same coordinates
and same radii of the microspheres as were considered for the previous model.
The distribution pattern is observed by analyzing and comparing various planar
surfaces of the two models. The electric field distribution for the y-z plane at x =
100 µm (same as the one described in Figure 2.6) with the new model is shown in
Figure 2.7.

36
Figure 2.7 Electric Field Distribution of the y-z Plane at x= 100 μm for the Ap-
proximated Model
Along with this, data is extracted for the magnitude of calculated electric
field along the direction of applied field, from the upper electrode to the lower
electrode, for various x, y coordinates for both the original and approximated
models. This data is then analyzed in Microsoft Excel for better comparison of the
two models. The analysis is also done for the planar surfaces parallel to the elec-
trodes (perpendicular to the applied field). The graphs comparing field intensities
of the two models are shown in Figure 2.8.

37
Figure 2.8 Comparison of the Electric Field Stress of the Original and Approx-
imated Models Along the Direction of Electric Field and Perpendicular to It.
It can be clearly observed from all the graphs that electric field distribution
of the approximated model closely follows the distribution observed in original
model of syntactic foam. The field value changes at the microsphere-resin inter-
face and inside the microsphere. The value observed at the interface is higher than
the actual field. Therefore, the new model gives pessimistic results which won’t

38
be harmful for further analysis. The value observed inside the microspheres is 2.5
to 5% lower than the actual value which is within acceptable range. As stated ear-
lier, the stress on the epoxy resin and the microsphere-resin interface is more im-
portant to predict the suitability of syntactic foam. Thus, the model can be used
for further analysis of the foam.
2.6 The Larger Cubical Model of Size 1 mm
With the help of the approximations stated above, a larger cubical model
is built with side measurement of 1 mm. The size of the microspheres is allowed
to vary from 30 µm to 60 µm in radius. The voltage applied to the electrode is
calculated such that the base electric stress remains 4.39 kV/mm. The meshed
cubical model is shown in Figure 2.9 and the effective electric field distribution
for the y-z plane at x = 500 μm is shown in Figure 2.10.
Figure 2.9 Meshed Cubical Model of Side 1 mm

39
Figure 2.10 The Electric Field Distribution of the y-z Plane at x= 500 μm
The pattern of electric field distribution was observed to be similar to that
of the model discussed in the previous section. The electric field gets concentrated
inside the microspheres and near the vicinity of the microspheres, in perpendicu-
lar direction to the electric field applied. After observing field distribution for dif-
ferent cases for the cubical model developed and analyzing the data in Excel, it
was observed that the average percent of increase in the magnitude of electric
field than the base value is 45.1% for all the cases considered. This value is 2.12
times higher than the breakdown strength of air.

40
The breakdown strength of pure epoxy resin is around 16 kV/mm, which
is 5.33 times as that of air [28]. From all the simulations performed for the ideal
case scenario of syntactic foam, it can be observed that the electric field concen-
tration inside the epoxy resin matrix ranges between 5-5.5 kV/mm. The field
needed for the breakdown of epoxy resin is almost 3 times of the magnitude of the
field observed in the simulations. Also, the air filled inside the microspheres at
high pressure, restricts the gas discharges inside the microspheres. Thus, it can be
concluded from the developed computer analysis of syntactic foam, that syntactic
foam is suitable insulating foam for the application of transmission lines with the
safety factor of more than 3.
Thus, the basic methodology that should be used for the construction of
insulating foam model for application in transmission line is explained above.
This is done with the help of the developed syntactic foam model. Ability to
change parameters used in the above model makes it generic. For example, for the
other type of syntactic foams, with different matrix material or different type of
microspheres, the relative permittivity assigned to the components in the COM-
SOL Multiphysics-Materials section can be varied before plotting electric field
distribution. Also, for the general insulating foams, the Excel VBA program can be
modified to incorporate other shapes and sizes of the filler material by varying
range of the random radii generated or removing the condition of separated mi-
crospheres. Therefore, along with syntactic foam, other types of insulating foams
can be also be modeled with the same method by incorporating some minor mod-

41
ifications in the modeling technique. This will be useful in order to verify first
step of the foam selection method for a transmission line.
But, under practical circumstances, many factors like air voids, presence
of impurities come in the picture. The effect of these impurities on the electric
field distribution is studied in the following section.
2.7 Impact of Impurities on Electric Field Distribution of Syntactic Foam
Presence of metal particles in the foam
For Gas Insulated Lines, assembly of the component elements takes place
on the on-site location by joining all the factory built units within a mobile clean
room [5]. For GIL, the welding procedures taking place on-site, might lead to
formation of small metal particles. These metal particles might result in a conti-
nuous PD in case of floating components when these particles are discharged pe-
riodically [25]. In case of GIL, if these particles are in the region of low electric
field, which are expected to be near the enclosure surface, the electric field is not
appreciably affected.
In case of syntactic foam insulated lines too, the assembly of the factory
built parts has to be done on the on-site location. Syntactic foam is generally pre-
pared with the help of thermosetting resins according to US patent 4595623 [26].
The mixture can be heated to make the thermosetting plastic to flow. The mixture
can then be cooled down to get the solidified syntactic foam. The small pieces of
enclosure and conductor can be brought on the site location with solidified syntac-

42
tic foam in the gap. The two sections of the line can be welded together and foam
from the two sections can be fused together by positional heating to connect them.
This is shown in Figure 2.11. The presence of metal particle in case of syntactic
foam can be more harmful than in case of GIL. This will have an effect on the
long term performance of the syntactic foam as an insulator. The presence of such
metal particles will result in local concentration in the electric field and this leads
to partial discharges which will eventually form electrical trees and thus reducing
life of the dielectric [27]. The critical size of these metal particles ranges between
2-10 mm. Generally the particles are of the shape of metal flakes [27].
Figure 2.11 The Positional Heating of the Syntactic Foam
The effect on the electric field distribution because of the presence of met-
al particles is analyzed by modeling a cubical section of syntactic foam of side 2
mm in between two Aluminum electrodes. The cylindrical metal particles with
length 1.5 mm and 2 mm and radius varying between 40 to 50 μm are simulated
inside the cubical section. The base electric field for the model is maintained at

43
4.39 kV/mm, which is the maximum field stress observed in 400 kV GIL model.
The voltage applied to the high voltage electrode, V, is determined by the formula,
d
VE
Where, E is the base electric field and d is the distance between the electrodes.
The electric field is calculated by assigning floating potential to the cylindrical
metal particle in COMSOL Multiphysics. The increase in the value of the electric
field stress is studied with respect to the deviation from the base electric field ap-
plied. Three cases are simulated for the metal particle along vertical, horizontal
direction and along the diagonal of the cubical section.
Vertical position of metal particle
Figure 2.12 shows the cross sectional view of model of syntactic foam
with metal particle placed vertically in the middle of the cubical section. The ra-
dius of the particle is varied from 40 μm to 50 μm and the effect on the electric
field distribution is observed. The electrodes are placed along the x-y plane of the
Figure 2.12 and thus, the direction of the base electric field is along z direction.
Figure 2.13 shows electric field distribution along the plane passing through cen-
ter of the cylinder of diameter 100 μm.

44
Figure 2.12 The Model of the Syntactic Foam With Metal Particle Placed Verti-
cally at the Center of the Cubical Section of Side 2 mm
Figure 2.13 The Electric Field Distribution Along the Plane Passing Through the
Center of the Metal Particle Placed Vertically in the Cubical Section of 2 mm

45
The electric field gets concentrated near the top and the bottom edges of
the metal particle due to its sharpness. The magnitude of the maximum field is 87
kV/mm which is 19.8 times the base electric field applied for a particle of 50 μm
radius. For various points in the x-y plane, data points for the calculated electric
field are collected along the vertical line, in the direction of the electric field
(from upper electrode to the lower electrode), and are analyzed in Excel. It is ob-
served that the field magnitude is almost 18 times the original electric field for the
50 μm model and 11.5 times the original electric field for the 40 μm model at the
edge of the metal particle. On the other hand, the maximum electric field decreas-
es to 2.2 times the original field magnitude for the 50 μm case and 2 times the
original field in case of 40 μm case at the distance of 150 μm from the center of
the base of the metal particle in x-y plane. The Excel datasheet is attached in Ap-
pendix C.
Thus, when a metal particle is placed perpendicular to the electrodes or in
the direction of the electric field, the field distribution will lead to partial dis-
charges in the epoxy resin matrix. This behavior is due to the fact that electric
field intensity magnitude at the top and bottom edges of the metal particle, at the
base value of 4.39 kV/mm, being 5 times higher than the breakdown strength of
epoxy resin. Also, this magnitude of electric field increment varies greatly with
the diameter of the metal particle.

46
Horizontal position of the metal particle
Figure 2.14 shows the cross sectional view of the syntactic foam model
with metal particle placed horizontally (parallel to the electrodes) inside the cubi-
cal section of side 2 mm. The electrodes are placed in the x-y plane of the Figure
2.14 and thus, the direction of the base electric field is along z direction. The size
of the metal particle is varied between 40 μm and 50 μm by radius. The curving
radius is kept at 10 μm at the edges of the cylinder.
Figure 2.14 The Model of the Syntactic Foam With Metal Particle Placed Hori-
zontally at the Center of the Cubical Section of Side 2 mm
47
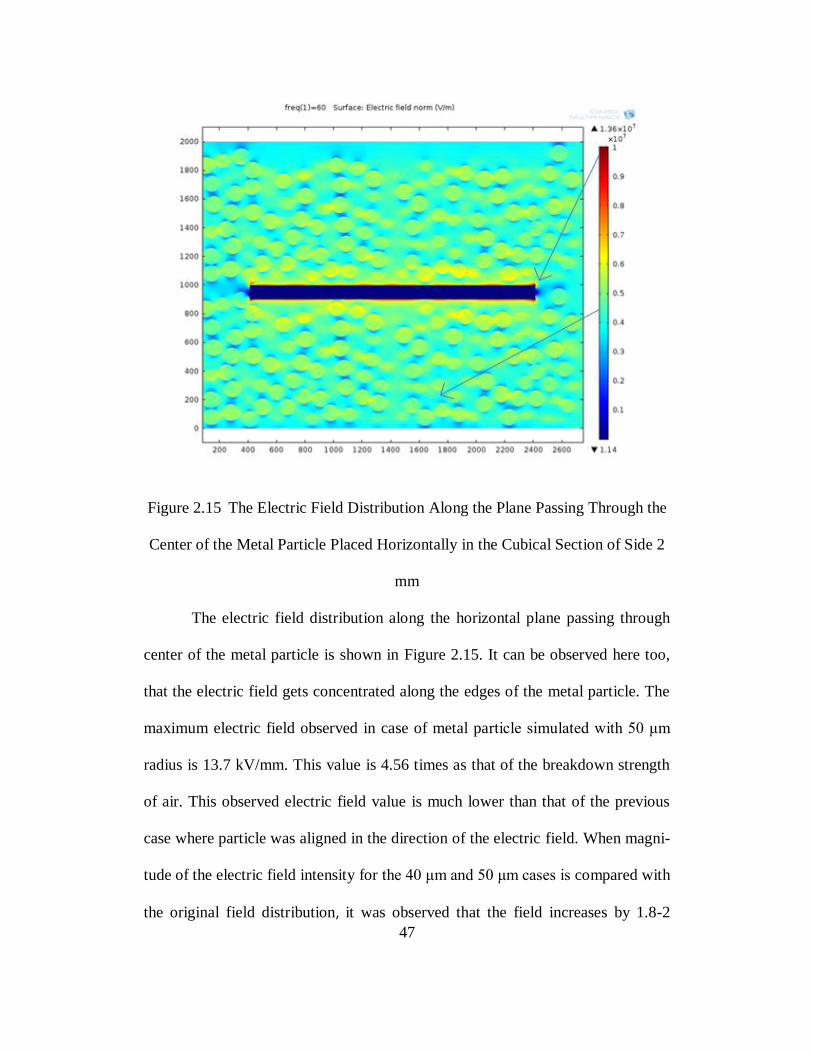
Figure 2.15 The Electric Field Distribution Along the Plane Passing Through the
Center of the Metal Particle Placed Horizontally in the Cubical Section of Side 2
mm
The electric field distribution along the horizontal plane passing through
center of the metal particle is shown in Figure 2.15. It can be observed here too,
that the electric field gets concentrated along the edges of the metal particle. The
maximum electric field observed in case of metal particle simulated with 50 μm
radius is 13.7 kV/mm. This value is 4.56 times as that of the breakdown strength
of air. This observed electric field value is much lower than that of the previous
case where particle was aligned in the direction of the electric field. When magni-
tude of the electric field intensity for the 40 μm and 50 μm cases is compared with
the original field distribution, it was observed that the field increases by 1.8-2

48
times the original field near the edge of the metal particle for both the cases. Since
this value of field concentration is less than that of the breakdown strength of
epoxy resin matrix, any partial discharge activity is avoided inside the epoxy resin
matrix. Also, this increase is not appreciably affected by the size of the metal par-
ticle. Thus, this position of the metal particle will not affect the long term break-
down characteristics of the syntactic foam.
Particle placed along the diagonal of the cubical section
Figure 2.16 shows the cross sectional view of the syntactic foam model
with the metal particle placed along the diagonal of the cubical section. The elec-
trodes are placed in the x-y plane of the Figure 2.16 and thus, the direction of the
base electric field is along z direction. The particle has radius of 50 μm and the
length of the particle is 2 mm.
Figure 2.16 The Model of the Syntactic Foam With Metal Particle Placed Along
the Diagonal of the Cubical Section of Side 2 mm

49
Figure 2.17 The Electric Field Distribution Along the Plane Passing Through the
Center of the Metal Particle Placed Horizontally in the Cubical Section of Side 2
mm
The electric field distribution along the diagonal plane is shown in Figure
2.17. The maximum electric field observed in the above case is 61 kV/mm. This
value is almost 12 times higher than the original field near the edge of the metal
particle, when metal particle of 50 μm radius is included in the model. The data
points for the calculated electric field intensity along vertical lines (from upper
electrode to the lower electrode), for different points in the x-y plane are collected
and analyzed in Excel. It is observed that the field value reduces to 2-2.5 times the
original value when moved towards the center of the particle from the flat ends.

50
Thus, for this position of the metal particle, the foam will have some partial dis-
charges in the vicinity of the metal particle near the flat edges of the simulated cy-
lindrical particle.
Therefore, the position of the metal particle with respect to the direction of
electric field is very important in determining the effect of metal particle on the
performance of the syntactic foam. When the particle is along the direction of
electric field, the effect is the worst. These high values of electric field will cause
partial discharge in the epoxy resin matrix and this will lead to breakdown
through the resin matrix due to deterioration of the dielectric as observed in the
first case and third case. Also, the highest magnitude of electric field is observed
near the edge of the cylindrical metal particle in all the three cases. If the edges
are smoother than the cases considered, the effect on the field magnitude will be
reduced.
It is important to consider that for all the simulations performed for the
presence of metal particles, the base electric field is maintained at 4.39 kV/mm.
This value is the maximum value of the electric field observed in 400 kV GIL as
seen from Figure 2.1. Thus, these simulations capture the most pessimistic scena-
rio of having metal particle in the region of the transmission line with maximum
field. The effect of the metal particle will be less damaging in any other area of
the transmission line.

51
Thus, this chapter describes the first step of the insulating foam selection
procedure for application in transmission lines. As a part of the first step, a com-
plete model of the transmission line is developed in COMSOL Multiphysics. The
electric field distribution in the 400 kV GIL is observed to be coaxial, with maxi-
mum field magnitude concentrated near the conductor of the GIL assembly. The
magnitude of the maximum field is 4.39 kV/mm which is 1.46 times that of the
breakdown strength of air. This maximum value of electric field is considered to
be the base value for further analysis of insulating foam. For all the simulation
models, the voltage applied to the high voltage electrode, V, is calculated by using
the relation,d
VE where E is the base electric field and d is the distance between
the electrodes.
For simplification of the modeling technique and due to the limitations
about the technical specifications of the computer system, the microspheres inside
the foam are modeled with a uniform material with relative permittivity 1.57 to
combine the effect of glass walls and the air inside the microsphere. The electric
field distribution obtained by this method is found to be very similar to the origi-
nal distribution with offset magnitude of less than 5%. For the developed 1 mm
cubical section of the syntactic foam, the electric field magnitude deviates from
the base electric field by 40-45% for different test models analyzed. The field
magnitude required for breakdown through epoxy resin matrix is almost 3 times
the maximum magnitude of the field observed in the simulation. Thus, the calcu-
lated field concentration in the epoxy resin matrix is not sufficient to cause elec-

52
tric breakdown through the foam. Thus, syntactic foam, in the pure form, can be
used an insulator for transmission lines with a safety factor of 3.
The methodology developed for modeling syntactic foam in the above sec-
tion can be used for modeling other types of insulating foams too, for application
in transmission lines. The model developed for syntactic foam is a generalized
model. For modeling some other type of insulating foam with different material,
the relative permittivity value for the component elements can be changed to take
into account effect of altered material components. The size of the generated mi-
crospheres can be varied by changing the range of radii that the Excel VBA pro-
gram uses to generate a random number. Moreover, the condition of separated
microspheres can be removed for the foams other than syntactic foam to accom-
modate various shapes and sizes of the voids.
The on-site welding procedures may lead to formation of metal particles in
form of metal flakes with size varying between 2-10 mm during the assembly of
different sections of the transmission lines. Thus, as a part of the analysis of the
computer based model of the insulating foam, the effect of metal particles on elec-
tric field distribution is also observed. For this purpose, a cylindrical metal par-
ticle with length 1.5-2 mm is modeled inside a cubical section of the insulating
foam, which is syntactic foam in this case, of length of the side being 2 mm. It
was observed that for the base electric field of 4.39 kV/mm, the electric field dis-
tribution is greatly affected by the position of the metal particle. The effect is
most damaging for the case with particle positioned in direction of the applied

53
field (along z direction). The field goes as high as 19 times the base electric field
near the top and bottom edges of the particle. This field, which is almost 5 times
the breakdown strength of epoxy, will lead to partial discharges inside the epoxy
matrix, thus affecting the long term performance of the system. On the other hand,
when a particle is placed perpendicular to the direction of the applied field (in x-y
plane), the effect is not damaging as the concentrated field is just 2 times the base
electric field and is less than the breakdown strength of epoxy resin. Thus, exis-
tence of the metal particle inside syntactic foam model can be dangerous in some
cases.
All the simulations are performed with the pessimistic scenario based on
application of base electric field, which is the maximum field that exists in 400
kV GIL as explained in section 2.3. The alignment of metal particle along the di-
rection of electric field near the conductor surface has very less probability. But,
for a safer operation of the transmission line, these particles should be removed
before building the assembly of the line. For this purpose, while joining the two
sections together, conductors should be welded first. Then the particles near the
conductor region should be removed. After that the thermosetting matrix of syn-
tactic foam should be heated and then the enclosures should be welded. This pro-
cedure will make sure that there are no particles near the conductor region. The
effect of metal particles on insulating foams other than syntactic foam can be veri-
fied with the same model, but by changing few parameters as explained earlier.

54
CHAPTER 3.
EXPERIMENTAL IDENTIFICATION OF ELECTRICAL BREAKDOWN
STRENGTH OF SYNTACTIC FOAM
The first step of the selection procedure of insulating foam for application
of transmission lines is explained in chapter 2. This step is related to the devel-
opment of a computer based model of the insulating foam and analysis of electric
field distribution for possible breakdown. As the second step of the procedure, it
is very important to conduct a study of the dielectric insulator's behavior under
power frequency AC voltage and lightning impulse voltage in practical environ-
ment. Also, the study of the effect of partial discharges is necessary. This chapter
concentrates on the explanation of the test procedure and setup that is used to car-
ry out AC voltage withstand test on the insulating foam considered. This is ex-
plained with syntactic foam samples similar to the chapter 2. As the second part
of the chapter, the results from breakdown tests are analyzed and discussed.
3. 1 AC Voltage Withstand Test
The loss of dielectric property of the solid insulating material as a result
of electric field greater than a certain magnitude is called dielectric breakdown.
This critical magnitude of electric field is called as breakdown strength of the sol-
id insulating material [28]. Breakdown voltage gives the maximum value of vol-
tage that the material will be able to withstand.

55
Dielectric strength of the solid dielectric materials depends on many fac-
tors such as electrode configuration, thickness of the insulating material, electrode
material, air voids or other defects in the material and temperature and humidity at
the time of experiment. The breakdown occurs in the area where electric field gets
concentrated. These weak spots in the insulating material generally decide the
breakdown strength of the solid material.
3. 2 Test Procedure
AC withstand voltage is the prospective value of AC voltage that the ma-
terial will be able to withstand under specified experimental conditions. This test
voltage can either be a peak voltage or a RMS value of the AC voltage according
to the IEEE standard for high voltage testing. The RMS value of the voltage can
be obtained by dividing its peak value by square root of two [28]. In general, for
testing purpose, the frequency of the applied voltage lies between 45-60 Hz [29].
This frequency can be altered for the apparatus-specific tests. The positive and
negative half cycles of the applied voltage should ideally be equal, with peak to
RMS value within 5% of square root of two. The wave shape can be varied
from pure sinusoidal to some other type of wave shape for the special cases in-
volving test objects with non-linear impedance. The test voltage should be meas-
ured for the withstand test with the uncertainty of less than 3% of the peak or
RMS value [30].
The voltage shall be applied to the test object starting at a value sufficient-
ly low to prevent any effect of over-voltages due to switching transients. The vol-

56
tage should be raised with a rate such that the accurate reading of the measure-
ment instrument can be recorded and the test object is not subjected to the pro-
longed stress at the test voltage. This is achieved by keeping the rate of rise at 2%
of the test voltage per second after 75% of the estimated final test voltage. The
test is generally carried out over the period of 60 seconds. The test voltage is gen-
erally maintained for the test duration and then reduced. The abrupt removal of
test voltage might result in switching transients which may affect the breakdown
voltage value. The errors caused due to corona and stray capacitance can be re-
duced by using suitably dimensioned electrodes and guard circuits [30].
3. 3 Description of the Test
As discussed above, the electrical breakdown voltage test is carried out on
syntactic foam samples to determine breakdown strength of the foam. For the test,
the samples manufactured by Engineered Syntactic Foam, Boston, USA are used.
The samples are made up of epoxy-based syntactic foam with glass microspheres
with diameters in the range of 60-120 μm. The total volume occupied by the mi-
crospheres is 40% of the matrix volume for all the samples under consideration.
The impact of the variation in sample thickness on dielectric breakdown strength
of the foam is observed for the samples with thicknesses 3, 3.5 and 4 mm. Tests
were performed at the room temperature.
The test was performed by immersing syntactic foam samples in transfor-
mer oil filled vessel to prevent partial discharges and corona through air during
the test procedure as seen from the Figure 3.1. Before starting the test, the tenden-

57
cy of the test sample to absorb the oil is tested, since absorption of insulating oil
can alter the breakdown strength of the sample. For this, each sample is kept im-
mersed in transformer oil for 24 hours period. The recorded weight of the sample
changed from 17.2 grams to 17.6 grams after oil immersion (average). The neg-
ligible change in weight of the sample before and after oil immersion indicated
that oil does not penetrate through the epoxy based syntactic foam samples and
the dielectric strength will not be appreciably affected by the test procedure.
Figure 3.1 The Electrode Configuration for the AC Voltage Withstand Test
The test is performed according to the IEEE standard 4-1995. The test is
performed at 60 Hz power frequency. The voltage applied to the sample is in-
creased at an estimated rate of 0.8 kV/sec to permit accurate readings till the
breakdown occurs. The breakdown strength is calculated by dividing the break-
down voltage with the thickness of the sample. Electrodes are designed according
to the ATSM standards, with one cylindrical electrode with size 51 mm in diame-

58
ter, 25 mm thick with edges rounded to 6.4 mm radius. The other electrode is
plate shaped. Both the electrodes are made up of stainless steel.
The tests are conducted in High Voltage Laboratory on the fifth floor of
ERC. The test voltage is applied with the help of an AC transformer with rating
120 V/100 kV, 5 kVA. The breakdown voltage is measured with the help of po-
tential transformer by connecting a voltmeter on the secondary side of the voltage
transformer. The measured voltage is multiplied with the accurate turns ratio to
get the voltage on the primary side of the transformer. The calculated voltage on
the primary side is then divided by the thickness of the sample to get the break-
down voltage of the syntactic foam sample. The test setup can be seen from Fig-
ure 3.2. The connection diagram can be seen from Figure 3.3.
Figure 3.2 The Test Setup for AC Voltage Withstand Test

59
Figure 3.3 The Connection Diagram of the Dielectric Breakdown Test
The high voltage is applied to the upper cylindrical electrode. The lower
plate-shaped electrode is grounded as seen from Figure 3.3. The test is performed
by varying the electrode locations at six different positions for single test sample.
The gap of 1-2 minutes is maintained in between two readings and oil is stirred
after every experiment to make sure that the readings are not affected by the by
products of oil degradation. The electrodes are cleaned after every six readings.
The experiment is repeated for all the six samples of varying thicknesses.
3. 4 Results and Discussions
In order to calculate the electrical breakdown strengths of syntactic foam,
experiments are performed in High Voltage Lab at Arizona State University. The
AC voltage withstand tests are performed on readily manufactured epoxy based
syntactic foam samples with 40% concentration of glass microspheres. The results
of the breakdown test on the syntactic foam samples with thicknesses 3 mm, 3.5
mm and 4 mm are listed in Table 3.1, Table 3.2 and Table 3.3 respectively.

60
Table 3.1 Breakdown Voltage Stress for the Syntactic Foam Sample with Thick-
ness 3 mm
Sample 1
Voltage on Sec-
ondary side of PT
Primary vol-
tage
Breakdown
Strength
Average breakdown
strength
Standard
deviation
78.6 V 47.16 kV 15.72 kV/mm
15.71 kV/mm
0.199
77.8 V 46.86 kV 15.62 kV/mm
80.2 V 48.122 kV 16.04 kV/mm
79.1 V 47.46 kV 15.82 kV/mm
76.6 V 46.14 kV 15.38 kV/mm
78.5 V 47.1 kV 15.7 kV/mm
Sample 2
Voltage on Sec-
ondary side of PT
Primary vol-
tage
Breakdown
Strength
Average breakdown
strength
Standard
deviation
79.2 V 47.52 kV 15.84 kV/mm
15.29 kV/mm
0.3850
77.2 V 46.32 kV 15.44 kV/mm
78.4 V 47.04 kV 15.68 kV/mm
74.2 V 44.52 kV 14.84 kV/mm
75.1 V 45.06 kV 15.02 kV/mm
74.6 V 44.76 kV 14.92 kV/mm
Table 3.2 Breakdown Voltage Stress for the Syntactic Foam Sample with Thick-
ness 3.5 mm
Sample 1
Voltage on Sec-
ondary side of PT
Primary vol-
tage
Breakdown
Strength
Average breakdown
strength
Standard
deviation
83.6 V 50.16 kV 14.33 kV/mm
13.81 kV/mm
0.498
77.2 V 46.32 kV 13.23 kV/mm
77.1 V 46.26 kV 13.21 kV/mm
84.3 V 50.38 kV 14.45 kV/mm
82.1 V 49.26 kV 14.07 kV/mm
79.3 V 47.58 kV 13.59 kV/mm

61
Sample 2
Voltage on Sec-
ondary side of PT
Primary vol-
tage
Breakdown
Strength
Average breakdown
strength
Standard
deviation
78.4 V 47.04 kV 13.44 kV/mm
13.25 kV/mm
0.140
77.6 V 46.56 kV 13.30 kV/mm
76.2 V 45.72 kV 13.06 kV/mm
77.5 V 46.5 kV 13.28 kV/mm
78.1 V 46.86 kV 13.38 kV/mm
76.4 V 45.84 kV 13.09 kV/mm
Table 3.3 Breakdown Voltage Stress for the Syntactic Foam Sample with Thick-
ness 4 mm
Sample 1
Voltage on Sec-
ondary side of PT
Primary vol-
tage
Breakdown
Strength
Average breakdown
strength
Standard
deviation
88.2 V 52.92 kV 13.23 kV/mm
13.00 kV/mm
0.205
87.4 V 52.44 kV 13.11 kV/mm
85.2 V 51.12 kV 12.78 kV/mm
86.6 V 51.96 kV 12.99 kV/mm
88.1 V 52.86 kV 13.21 kV/mm
84.6 V 50.76 kV 12.69 kV/mm
Sample 2
Voltage on Sec-
ondary side of PT
Primary vol-
tage
Breakdown
Strength
Average breakdown
strength
Standard
deviation
90.6 V 54.36 kV 13.59 kV/mm
13.27 kV/mm
0.169
87.5 V 52.50 kV 13.12 kV/mm
88.2 V 52.92 kV 13.23 kV/mm
87.3 V 52.38 kV 13.09 kV/mm
89.2 V 53.52 kV 13.38 kV/mm
88.3 V 52.98 kV 13.24 kV/mm
It can be observed from the results that the average breakdown strength of
the syntactic foam samples is 15.5 1.08 kV/mm for 3 mm samples, 13.53 0.95

62
kV/mm for 3.5 mm samples and 13.14 0.45 kV/mm for 4 mm samples. When
these values are compared with the breakdown strength of air which is 3 kV/mm,
the breakdown strengths are approximately 5.15, 4.51 and 4.38 times higher for 3
mm, 3.5 mm and 4 mm samples respectively. The slight variation of the dielectric
strengths in case of samples with equal thicknesses is supported by the fact that
the microspheres are randomly distributed in the foam samples. The samples used
for the tests are derived from different batches of syntactic foam manufactured by
the supplier. Thus, the weak points causing electrical breakdown can be varied in
case of two samples with equal thicknesses.
Figure 3.4 shows the relationship between sample thickness and the
breakdown strength of the syntactic foam. It can be observed that the dielectric
strength of the foam samples reduces with the increase in thickness of the foam
samples. The exponential nature of the curve specifies that the breakdown
strength almost remains constant after the sample thickness greater than 4 mm.

63
Figure 3.4 The Effect Varying Sample Thicknesses on Breakdown Strength of
Syntactic Foam
Thus, it can be observed from the tests that the breakdown strength of the
syntactic foam samples, for the given test conditions, remains constant at 13
kV/mm. Since the source voltage is limited to 100 kV in the High Voltage Labor-
atory, samples with higher thicknesses are not considered for the breakdown test.
However, while completing the second step of the foam selection procedure for
transmission lines, AC voltage withstand tests should be performed on the sam-
ples with higher thickness as a part of the practical studies for better understand-
ing of the dielectric properties of the insulating foam.

64
CHAPTER 4.
ELECTRICAL PARAMETERS AND LINE CHARACTERISTICS OF A FOAM
INSULATED TRANSMISSION LINE (FIL)
The first two steps of the selection procedure of insulating foam for the
application of transmission lines, involving computer simulation model and prac-
tical testing of dielectric properties of the foam are explained in chapter 2 and 3
respectively. Another important aspect of the evaluation of suitability of any insu-
lating foam in high voltage transmission lines is to analyze its effect on the trans-
mission characteristics of the line. This study is demonstrated with syntactic foam
as an example. The first part is carried out by calculating electrical parameters
such as inductance, capacitance and resistance for the line. The line is then mod-
eled with equivalent П model for distributed parameters. The maximum power
transfer capacity of this new line with syntactic foam as an insulator is calculated
by plotting power-voltage curves for the simple two bus system with a single
load, a single transmission line and a single generator, by keeping the voltage at
the receiving end within acceptable limits.
4.1 Basic Constructional Details of Syntactic Foam Insulated Transmission Line
The assembly of the proposed Foam Insulated Transmission Line (FIL) is
similar to that of the Gas Insulated Transmission Line (GIL). It consists of an
Aluminum conductor enclosed within an Aluminum enclosure. The two cylinders
are insulated from each other with the help of syntactic foam. The dimensions of
the enclosure and conductor are selected such that the use of the dielectric materi-

65
al is optimal. In general, for coaxial systems, this optimization is achieved when
the ratio of
2
3lnr
ris maintained at 1, where r2 is the outer radius of the conductor
and r3 is the inner radius of the enclosure [35]. The enclosure of the transmission
line is solidly grounded. The thickness of the enclosure and conductor can be cus-
tomized based on the current carrying capacity requirement of the application.
The general construction of the FIL is represented in Figure 4.1.
Figure 4.1 Basic Construction of FIL
For calculation of electrical parameters of the line, the voltage level of FIL
is considered to be 400 kV. The dimensions of the enclosure and conductor are
given in Table 4.1.
Table 4.1 Typical Dimensional Data of 400 kV FIL
Operating Voltage Level (kV) 400
Conductor Outer Diameter (mm) 180
Conductor thickness (mm) 10
Enclosure Inner Diameter (mm) 500
Enclosure thickness (mm) 10

66
4.2 Calculation of Electrical Parameters
It is necessary to calculate electrical parameters such as inductance, capa-
citance and resistance to study transmission characteristics of FIL. As the con-
structional features of FIL are similar to GIL, the formulation used for the calcula-
tion of electrical parameters for GIL is also applicable to Foam Insulated Trans-
mission Line, with dimensions as mentioned in Table 4.1.
The inductance of the line is the addition of the self inductance of the con-
ductor, the inductance of the enclosure and the inductance in between the conduc-
tor and the enclosure [31]. Considering r1 as the inner radius of the conductor, r2
as the outer radius of the conductor, r3 as the inner radius of the enclosure and r4
as the outer radius of the enclosure, the inductance of the conductor can be given
by [31],
GMR
rLC
20 ln2
(5.1)
Where, μ0 is the dielectric permeability of the air. The geometric mean radius
(GMR) of the conductor is given by,
2
1
2
2
2
2
2
1
1
2
22
1
2
2
4
12
4
3lnlnln
rr
rr
r
r
rr
rrGMR
The inductance of the insulated gap between the enclosure and the conduc-
tor is given by,
2
30 ln2 r
rLS
(5.2)
The inductance of the enclosure is given by,

67
4
3ln
1
2
2
3
2
4
3
4
2
3
2
4
4
4
2
3
2
4
0 rr
r
r
rr
r
rrLe
(5.3)
The capacitance of the line is derived from the expression for coaxial
cables similar to GIL [31].
2
3
0
ln
2
r
rC r (5.4)
Where, ε0 is the dielectric permittivity of the free space, εr is the relative
permittivity of the dielectric medium. The relative permittivity of the epoxy resin
based syntactic foam is 2.3 at 40% concentration of the hollow glass microspheres
[32]. The resistance of the line is calculated using resistivity of the pure aluminum
which is 2.68*10 (-8)
Ω-m at 200C [33]. Total resistance is obtained by adding the
resistance of the enclosure and conductor. The calculated resistance, inductance
and capacitance are as shown in the Table 4.2.
Table 4.2 The Calculated Values of Inductance, Capacitance and Resistances
Voltage Level Inductance (mH/km) Capacitance (μF/km) Resistance (mΩ/km)
400 kV 0.2113 0.125 6.7149
These values are less than that of overhead lines and underground XLPE
cables as given in Table 4.2. The appreciable increase in the value of capacitance
of the FIL is because of the presence of solid dielectric with higher εr instead of
SF6 with εr equal to unity.

68
4.3 Distributed Parameters Model of Transmission Line
In general for the transmission lines with length greater than 250 km, the
parameters are not lumped together, but are considered distributed for the line
model. Due to the high value of capacitance involved, transmission cables too, are
represented by distributed parameters model for the length more than a few km.
Figure 4.1 Schematic Diagram of Long Line
Figure 4.1 shows single phase and neutral return of the transmission line.
It represents an elemental section of the line with length dx units, which is as-
sumed to be at a distance x units from the receiving end of the line with series im-
pedance z∙dx and shunt admittance y∙dx. For the above model, the voltage Vx at
can be represented by
xx
x eCeCV 21 (5.5a)
x
C
x
C
x eZ
Ce
Z
CI 21 (5.5b)
Where jjBGjXR is the propagation constant,
CCC jXR
jBG
jXRZ
is the characteristic impedance of the line,

69
IZVC C2
11 ,
IZVC C2
12 ,
R, X, G and B are resistance, reactance, conductance and shunt susceptance of the
line per unit length respectively,
V, I are the receiving end voltage and current [33].
Thus, Vx can be written as
x
C
x
Cx eIZVeIZVV 2
1
2
1 (5.6a)
x
C
x
C
x eIZ
VeI
Z
VI
2
1
2
1 (5.6b)
Or
xxCxx
x eeIZ
eeV
V 22
(5.7a)
xxxx
C
x eeI
eeZ
VI
22 (5.7b)
This can be represented as,
I
V
xxZ
xZx
I
V
C
C
x
x
coshsinh1
sinhcosh
(5.8)
In vector form, where the bar at the top of the variable represents a phasor quanti-
ty and a variable without a bar represents the magnitude of the vector, the voltage
at any point at a distance x units from the receiving end is given by,
xIZxVV Cx sinhcosh (5.9)

70
4.4 AC Power Flow for the Two Bus System with a Distributed Parameter
Model of Transmission Line
For a simple two bus model with an AC source feeding an AC load with
real power P and reactive power Q through a series impedance of R+jX as seen
from the Figure 4.2 , the AC power flow has fairly direct analytical solution [34].
This is explained as follows. If V is the magnitude of the load voltage for the
above mentioned case, the solution can be obtained by solving the quadratic equa-
tion,
02 2222224 QPXRVVXQRPV S (5.10)
Figure 4.2 Power Transfer in Simple Two Bus AC System
The Equation (10) can be represented in terms of as the ratio ofSV
V, which is the
ratio of magnitude of receiving end voltage to the sending end voltage. After
normalizing the above equation by 2
SV
Rr and
2
SV
Xx , Equation (10) becomes,
012 222224 QPxrxQrP (5.11)
In general for the above equation, SV and V are represented in kV, P is represented
in MW, Q is represented in MVAr and r and x are represented in 'inverse MVA'.
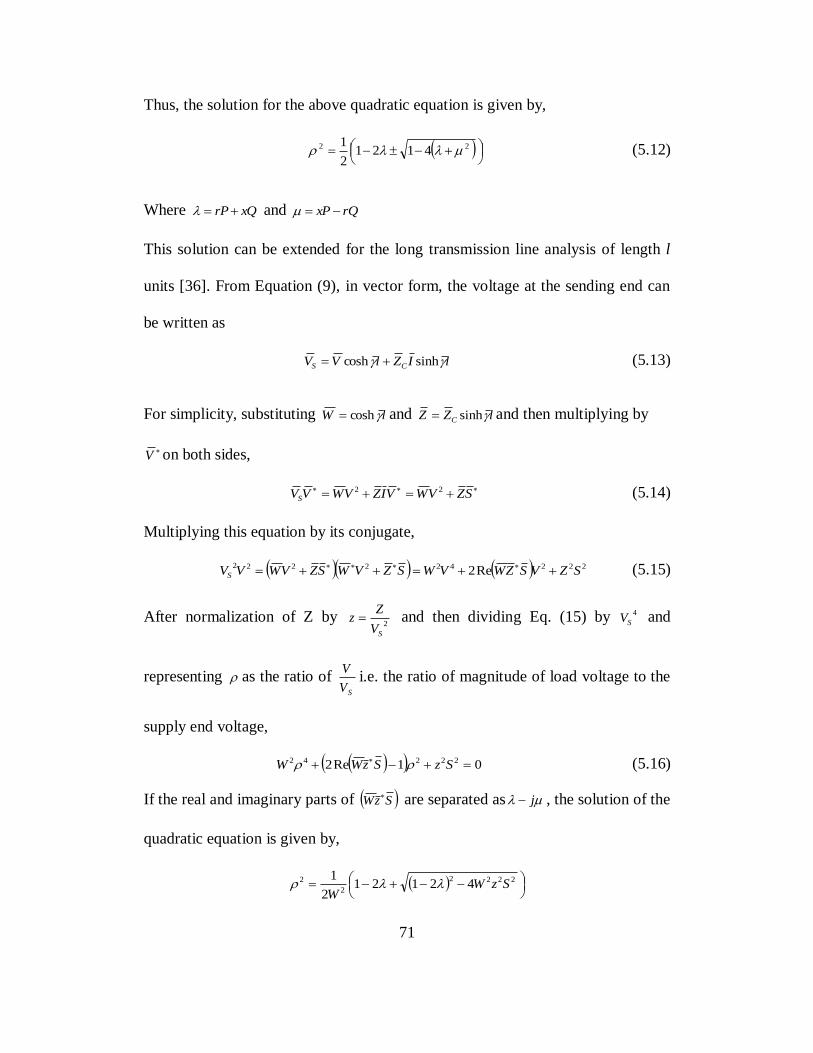
71
Thus, the solution for the above quadratic equation is given by,
22 4121
2
1 (5.12)
Where xQrP and rQxP
This solution can be extended for the long transmission line analysis of length l
units [36]. From Equation (9), in vector form, the voltage at the sending end can
be written as
lIZlVV CS sinhcosh (5.13)
For simplicity, substituting lW cosh and lZZ C sinh and then multiplying by
V on both sides,
SZVWVIZVWVVS
22 (5.14)
Multiplying this equation by its conjugate,
222422222Re2 SZVSZWVWSZVWSZVWVVS (5.15)
After normalization of Z by 2
SV
Zz and then dividing Eq. (15) by 4
SV and
representing as the ratio of SV
Vi.e. the ratio of magnitude of load voltage to the
supply end voltage,
01Re2 22242 SzSzWW (5.16)
If the real and imaginary parts of SzW are separated as j , the solution of the
quadratic equation is given by,
2222
2
2 421212
1SzW
W

72
222
2444121
2
1
W
2
24121
2
1
W (5.17)
Now, 2
2cos2coshcossinh 222 ll
llW
(5.18)
llV
ZzW
S
C coshsinh2
ljljXRV
CC
S
2sin2sinh2
12
222
2sinh2sin
2
2sin2sinh
S
CC
S
CC
V
lXlRj
V
lXlR
jxr (5.19)
Multiplying by S ,
QrPxjQxPrjQPjxrSzWj (5.20)
Thus, the solution for the quadratic equation can be obtained from
22 41212
1
a (5.21)
Where, 2
2
2sin2sinh
S
CC
V
lXlRr
22
2sinh2sin
S
CC
V
lXlRx
2
2cos2cosh lla
In case of a long transmission line, the additional term at the starta2
1, captures
the Ferranti effect when the line is lightly loaded. For the short lines, the values
for l and l are quite low giving similar results as that of the lumped parameter
model.

73
4.5 The Power-Voltage Curve for the Transmission Line
The voltages at all the buses in the system should be maintained within
prescribed limits under normal operating conditions for maintaining voltage sta-
bility in the system. To study voltage stability, the relationship between the
transmitted power (P) and the voltage at the bus (V) should be observed during
steady state analysis. For any PQ bus in the system, the PV curve gives the de-
pendence of the bus voltage magnitude on the active power load when increased
from zero to the maximum possible value. It is observed that the voltage at the
load bus reduces when power transfer is increased. But after a critical point of
power transfer, the voltage collapses. This maximum value of the power that can
be transferred is known as 'maximum loadability' of the line. For practical purpos-
es, only the power transfer till this maximum limit gives a stable operating point.
PV curve helps in determining the voltage stability margin i.e. how far the operat-
ing point can be shifted before the voltage collapses. The standard voltage limit
for stable operation is maintained at 5% of the deviation from the operating val-
ue.
The system under consideration is the simple two bus system with one ge-
nerator and one load bus which is connected with the help of the transmission line
which uses syntactic foam as an insulator. The power-voltage curves for the sys-
tem are plotted with the help of Equation (5.21).

74
1. No-load characteristics
The capacitance of the Foam Insulated Lines plays an important role in de-
termining the no-load characteristics. When lightly loaded, the capacitance of the
line might lead to over-voltage at the receiving end due to the Ferranti effect. The
characteristics are plotted for 200 km and 300 km using distributed parameters for
long line. The plot in Figure 4.3 clearly indicates 9% increase in voltage at the re-
ceiving end for the line of length 200 km. On the other hand, the voltage increases
by about 20% if the line length is increased to 300 km. Therefore, additional
compensation is needed if Foam Insulated Lines are used for lengths greater than
75 km.
2. Effect of varying line length with a constant power factor load
As the application of this syntactic foam insulated line is for transmission,
the power-voltage characteristics for the load with constant power factor of 0.8 pf
lagging can be observed in Figure 4.3. It is observed that the line loadability limit
reduces with the increase in line length. At 5% dip in the operating voltage, the
power that can be transferred through the line is 1323 MW for a 200 km long line
and 1400 MW for the 300 km long line when just the voltage stability conditions
are under consideration. This higher value of power transferred for longer line is
the result of effective higher capacitance of the line.

75
Figure 4.3 Power-Voltage Characteristics with a Constant Power Factor Load of
0.8, Lagging for 400 kV
3. Effect of loads with varying power factors at a constant line length
The power factor of the load connected at the receiving end of the line
plays an important role in determining the maximum power transfer capacity.
This is studied from the power-voltage curves by varying power factor of the load
at receiving end bus from 0.8 lagging to 0.8 leading. The transferred power at the
point where the voltage drops to 95% of its sending end value is determined from
the graphs. It is observed that for the leading power factor loads the power trans-
fer capacity is higher than that of the lagging power factor loads. But, this condi-
tion might lead to undesirable overvoltage in the lightly loaded conditions. Figure
4.4 and 4.5 shows the power voltage curves for a 200 km and 300 km long lines.
For the voltage stability limit considered, the maximum load that the system will
be able to take at unity power factor is 3760 MW and 3500 MW for 200 and 300
km lines resp. The transfer capacity reduces from this value to 35.18% for a 200

76
km line and 40% for a 300 km line when load power factor is varied from unity pf
to 0.8 lagging.
Figure 4.4 Power-Voltage Curve for Varying Power Factors for 400 kV, 200 km
Figure 4.5 Power-Voltage Curve for Varying Power Factors for 400 kV, 300 km
Thus, due to comparatively higher value of capacitance involved, reactive
power compensation is required under light load conditions when syntactic foam

77
is used as an insulator for the transmission line. Under various load conditions
too, the power transfer capacity of the line can be increased with the help of
appropriate reactive power compensation by the voltage at the receiving end
within 5% of that of the sending end voltage. The maximum value allowable
power transferred under different conditions can get reduced by the thermal
limitations of the transmission system. Thus, in addition to the voltage stability
condition, the thermal limitation should also be taken under consideration for
calculation of allowable current carrying capacity of the line.

78
CHAPTER 5.
CONCLUSIONS AND FUTURE WORK
5.1 General Conclusions
Because of the possibility of gas leakages in the long length Gas Insulated
Transmission Lines (GIL) and proven high global warming potential of SF6 gas,
there is a need for a replacement of the insulator in GIL. Insulating foam forms a
good alternative option as a SF6 replacement, given its relatively low dielectric
constant as compared to the solid insulators as well as its reduced weight. Syntac-
tic foam is a type of insulation foam with high weight to strength ratio and good
insulation properties at high voltage.
The work presented in this thesis describes the first few steps of the selec-
tion process of insulation foam for the application in GIL. As the first step of the
selection process, a methodology for the development of the computer based insu-
lation foam model in COMSOL Multiphysics is explained to analyze electric field
distribution through the foam for the application of transmission line. This is done
by developing a model of syntactic foam and simultaneously evaluating suitability
of syntactic foam as an insulator in GIL. The developed model also uses inputs
from softwares like AutoCAD and Microsoft Excel VBA.
As the second step of the selection process, the procedure for the AC vol-
tage withstand test for the samples of insulation foam is explained. These tests are
performed on syntactic foam samples with varying thicknesses. The dielectric
strength of the syntactic foam is calculated. After evaluation of dielectric proper-

79
ties, the steps to study the impact of the new insulation foam on electrical parame-
ters of the transmission lines is described in the fourth chapter.
Some of the important conclusions from the studies are as follows:
The basic model for a 400 kV GIL is developed in COMSOL Multiphysics and
electric field distribution is calculated from the model. It is observed that the
electric field distribution in GIL is coaxial and the maximum magnitude of
electric field appears near the conductor. The value of this field is 4.39
kV/mm which is 1.46 times the breakdown strength of air. For further analysis
of the insulation foam models, this value of field is taken as a base value.
Due to intricate structure of the insulating foam, instead of building large
models of the foam insulated transmission lines, smaller sections of the insu-
lating foam are built in COMSOL Multiphysics software in between two Alu-
minum electrodes. The voltage applied to the high voltage electrode, V, for the
simulation purpose is calculated by using formula,
d
VE
Where, E is the base electric field and d is the distance between the electrodes.
The syntactic foam mainly consists of hollow glass microspheres embedded
inside the epoxy resin matrix. Due to complexity of the geometry and high
costs involved in the required technical specifications of the computer sys-
tems, the foam is modeled with an approximation of modeling glass micro-
sphere with a material with relative permittivity of 1.57. This value of relative
permittivity is obtained by trial and error method. The maximum value of the

80
electric field inside the microspheres for the approximated model is observed
to be 6.3 kV/mm. When this value is compared with the original model, the
magnitude variation is found to be less than 5% of the original value. Thus,
this approximation is considered valid for further analysis of the syntactic
foam.
With the approximation stated above, a cubical section of syntactic foam with
side 1 mm is modeled with microspheres with radii ranging between 30-60
μm. It is observed that the electric field gets concentrated inside the micro-
spheres and along the perpendicular direction to the applied field in the vicini-
ty of the microspheres. For the base electric field of 4.39 kV/mm, the highest
magnitude of the field observed is 6.37 kV/mm. This value is 42-45% higher
than the base value for various models designed. This value is 2.12 times
higher than the breakdown strength of air.
The high pressure air inside the microspheres does not allow discharges inside
the microspheres. Also, the breakdown strength of pure epoxy resin is 16
kV/mm, which is 5.33 times as that of air. The calculated maximum stress in-
side the epoxy matrix of syntactic foam is 5-5.5 kV/mm. Thus, under ideal
circumstances, syntactic foam can be used as an insulator in GIL with the
safety factor of 3.
This method of modeling syntactic foam can also be used to model other types
of insulating foams too. The other material components can be modeled by as-
signing different relative permittivity values in the Materials section of COM-

81
SOL. The input range of the sphere radii in Excel program can be changed to
vary microsphere size. Also, for all the insulating foams other than syntactic
foam, the condition of separated microspheres can be removed from the Excel
program.
The on-site welding procedure of the enclosure and conductor assembly may
lead to formation of metal particles of size 1.5-10 mm in length and in the
shape of metal flakes. The effect of presence of metal particle on electric field
distribution is observed by simulating a cylindrical metal particle with length
1.5 mm or 2 mm, and with radii 40-50 μm. The base electric field for the si-
mulation is maintained at 4.39 kV/mm as explained earlier. The damage done
by the metal particle highly depends on the orientation of the metal particle
with respect to the electric field applied. When the metal particle is along the
direction of the applied field, the field concentration near the flat edges of the
cylinder shoots up to 18-19 times the field observed in the original model
without metal particle. Since this field is almost 5 times higher than the break-
down strength of the epoxy resin, partial discharge activity will start. When
the metal particle is aligned perpendicular to the applied field, the field con-
centration drops to 2-2.5 times the original field magnitude without the metal
particle, thus not causing any discharges.
Therefore, though very unlikely, the presence of metal particles in the syntac-
tic foam can be hazardous for the long life of the insulator and thus, question-
ing the suitability of the syntactic foam as an insulator particular situation.

82
Thus, these metal particles should be removed from the assembly of Foam In-
sulated Transmission Lines. One of the solutions for this problem is welding
the conductor before positional heating of syntactic foam matrix or welding of
the enclosure. Thus, the removal of metal particles in the vicinity of the con-
ductor is possible.
The same method of analysis of metal particles can be used for other type of
insulating foams too, by making appropriate changes in properties of material
components and the shapes or sizes of the filler material.
When syntactic foam samples with 40% concentration of glass microspheres
are tested for AC breakdown strength according to the IEEE high voltage test
standard 1995, it was found that the breakdown strength reduces with the in-
creasing thickness of the test samples. The calculated dielectric strength of the
syntactic foam is 13 kV/mm. The thickness of the foam samples is limited to 4
mm given the limitation of 100 kV test voltage. In actual practice, the test
should be performed on the samples with higher thicknesses.
The inductance, capacitance and resistance of the transmission line insulated
with syntactic foam are calculated as a third part of the process. The capacit-
ance of the line is appreciably increased to 125 nF/km. This brings down the
critical length for reactive compensation to 75 km. For the simplified two bus
system considered, the no load voltage increases by 9% for a 200 km line and
by 20% for a 300 km line. The maximum power transfer capacity of the line is

83
1323 MW for 200 km line and 1400 MW for 300 km line when power factor
at the receiving end is 0.8 lagging.
5.2 Future Work
The work done in the thesis explains a few steps related to the selection
process of insulating foam as an insulator for Gas Insulated Transmission Line
(GIL). All the steps in the process are explained considering syntactic foam as an
insulator. The suitability of syntactic foam for its application in GIL is also eva-
luated. But, there are some more points that can be taken into consideration for
improvements in the procedure already developed as well as for the extension of
the selection procedure to study other aspects of transmission line insulated with
insulating foam material.
For the computer based syntactic foam model, all the glass microspheres were
approximated by a uniform material with dielectric constant 1.57, in order to
keep the required computer specifications low. With the higher technical spe-
cifications of the computer system, the study can be made more detailed and
exact electric field distribution under all the considered conditions can be plot-
ted and studied. Also, instead of developing a smaller cubical model of syn-
tactic foam, a complete coaxial structure can be built in COMSOL similar to
the original GIL model.
The study of effect of impurities on electric field distribution in the syntactic
foam can be extended from metal particles to air voids and dust particles. Al-

84
so, for metal particles, the length and diameter can be varied and its effect can
be analyzed.
Instead of using foam samples of thickness ranging between 3 mm to 4 mm,
samples with higher thicknesses can be used to carry out AC voltage with-
stand test. Also, the study can be extended for various tests like partial dis-
charge test and impulse voltage breakdown tests under varying temperature
and humidity conditions.
The current carrying capacity of the line can be estimated with the help of the
development of the thermal model for the system. If the line current carrying
limit is thermally limited, then the calculated power transfer capacity of the
line can be modified accordingly.
85
REFERENCES
[1] T. Hillers, "Gas Insulated Transmission Lines (GIL): ready for the real
world," Power Engineering Society Winter Meeting, 2000.
[2] H. Koch, Gas Insulated Transmission Lines (GIL), Willey, September 2011.
[3] G. Schoeffner, R. Graf, "Suitability of N2-SF6 gas mixtures for the applica-
tion at Gas Insulated Transmission Lines," IEEE Power Tech Conference,
2003.
[4] H. Koch, "Basic information on Gas Insulated Transmission Lines (GIL),"
IEEE Power and Energy Society General Meeting- Conversion and Delivery
of Electrical Energy in the 21st Century, 2008.
[5] CIGRE, "Gas Insulated Transmission Lines (GIL)", CIGRE Working Group
23/21/33-15, Final Brochure, 2007.
[6] H. Meinecke, "Dimensioning criteria and test results for a polymer enclosed
Gas Insulated Line", Report 21/23/33-01, CIGRE Session 2000.
[7] M. Kessler, A. Schnettler, “Investigation of electrical properties of elastic
syntactic foam,” International Synposium of Electrical Insulation, 2008.
[8] N Gupta, Kishore, E. Woldesenbet, S. Sankaran, Journal of material
science, 36, 18, 4485, 2001.
[9] A. R. Luxmoore, M. F. Yeo, D. R. J. Owen, Composites, 7, 2, 110, 1976.
[10] M. Argin, G. G. Karady, "Characterization of polyurethane foam dielectric
strength", IEEE Transactions on Dielectric and Electrical Insulation, Vol.
15, No. 2, 2008.
[11] C. Roggendorf, A. Schnettler, "Investigation of long term stability under AC
voltage stress of syntactic foam", Annual Report Conference on Electric In-
sulation Dielectric Phenomena, 2012.
[12] F. A. Shutov, "Handbook of polymeric foams and foam technology”, Ed. D.
Klempner, K.C.Frisch and Hanser Publishers, New York, USA, p.355,
1991.
[13] A. Calahorra, O. Gara, S. Kenig, Journal of cellular plastics, 23, 4, 383,
1980.

86
[14] B. John, C. P. R. Nair, Update on syntactic foam, iSmithers: Shropshire,
UK, 2010.
[15] N. Gupta, E. Woldesenbet, "Journal of composite materials", 39, 24, 2197,
2005.
[16] E.C. Hobaica, S.D. Cook, Journal of cellular plastics, 4, 4, 143, 1968.
[17] A. Strauchs, A. Mashkin, et. al., "The impact of water absorption on the di-
electric properties of syntactic foam", International Conference on Solid Di-
electrics, 2010.
[18] P. Bunn, J.T. Mottram, Composites, 24, 7, 765, 1993.
[19] C. Roggendorf, A. Schnettler, "Accelerated hydrothermal ageing of epoxy
resin based syntactic foams with polymeric microspheres", IEEE Transac-
tions on Dielectrics and Electrical Insulation, Vol. 19, No.3, June 2012.
[20] T. Andritsch, A. Lunding, et. al., "Permittivity in epoxy based syntactic
foam nanocomposites", Annual Report Conference on Electric Insulation
Dielectric Phenomena, 2008.
[21] A. Troeger, H. Negle, et.al. , "Investigation on treeing behavior and break-
down mechanisms in syntactic foam", XVth International Symposium on
High Voltage Engineering, Ljubljana, 2007.
[22] A. Strauchs, A. Mashkin, A. Schnettler, "Investigations on partial discharge
behavior of syntactic foam under uniform field stress", Annual Report Con-
ference on Electric Insulation Dielectric Phenomena, 2010.
[23] "COMSOL Multiphysics reference manual version 4.4", COMSOL Multi-
physics Inc., November 2013.
[24] "Introduction to the AC/DC module", Version 4.4, COMSOL Multiphysics
Inc., November 2013.
[25] CIGRE, "Long term performance of SF6 insulated systems", CIGRE Work-
ing Group 15-301, Session Report, 2012.
[26] P. S. Du. Pont, J. E. Freeman, R. E. Ritter, A. Wittmann, "Hughes aircraft
company", Assignee, US 4, 595, 623.
[27] L. Caliap, O. Lesaint, A. Denat, "Influence of a metallic particle at a met-
al/insulator/gas triple junction in air and SF6 ", IEEE conference on Elec-
trical Insulation and Dielectric Phenomena, 2009.

87
[28] L. I. Berger, Dielectric strength of insulating materials, CRC Handbook of
Chemistry and Physics, 2003.
[29] H. M. Ryan, High voltage engineering and testing, England: Peter Pere-
grines Ltd., 1994.
[30] IEEE Standard Techniques for High-voltage Testing, IEEE STD 4-1995.
[31] A. Miyazaki, N. Takinami, S. Kobayashi, T. Yamauchi, "Line constant
measurements and loading current test in long-distance 275 kV GIL," IEEE
Transactions on Power Delivery, Vol. 16, No. 2, April 2001.
[32] T. Andritsch, A. Lunding, P.H.F. Morshuis, H. Negle, J. Smit, “Permittivity
in epoxy based syntactic foam nanocomposites,” Conference on Electrical
Insulation Dielectric Phenomena, 2008.
[33] D. P. Kothari, I. J. Nagrath, Modern Power System Analysis, Tata McGraw
Hill Education Private Limited, New Delhi, Third Edition, 2003.
[34] A. Morton, A guide to steady state voltage stability analysis, Econnect,
November 2007.

88
APPENDIX A
SPECIFICATIONS OF GIL, OVERHEAD LINE AND XLPE TRANSMISSION
CABLE, ALL OPERATING AT 400 kV FOR COMPARISON OF THE
ELECTRICAL PARAMETERS

89
Table 1.1 compares electrical parameters of the Gas Insulated Transmis-
sion Line, the overhead line and the transmission cable all operating at 400 kV
with the rating of 2000 MVA. The details about the specifications of the overhead
line and the transmission cable used for the comparison are given in the following
section.
The values given for GIL correspond to a directly buried, single-phase
GIL with conductor diameter 280 mm and enclosure inner diameter 630 mm. The
enclosures are assumed to be solidly grounded. The depth of laying is 1050 mm
and axial spacing between phases 1300 mm. The soil conditions are an ambient
temperature of 15°C and a thermal resistivity of 1.2 KmW-1
. The continuous
thermal rating is determined by the maximum soil temperature, which is limited
to 60°C [5].
The overhead line characteristics correspond to a 420 kV French line with
3 x 570 mm2 phase and two earth wires. The cable solution proposed for achiev-
ing the 3000 A rating, uses two cables per phase with conductor section of 2000
mm2 inter axial distance of the two trefoils is 1800 mm. The soil conditions are an
ambient temperature of 15°C soil thermal resistivity of 1.2 KmW-1 and a depth of
laying to the top of the cables of 1050 mm. The rating was achieved using stan-
dard practice of IEC 60287 where the conductor temperature was 90°C and ther-
mally stabilized backfill was used.

90
APPENDIX B
EXCEL VBA CODE USED FOR THE SYNTACTIC FOAM MODEL

91
Module 1
Sub Test1()
'5000 different numbers are generated in order to get 8
numbers which will be able to fit the criterion. These num-
bers are generated via random umber generator of Excel.
These numbers are stored in different columns. 1: x coordi-
nate 2: y coordinate 3: z coordinate 4: magnitude of the
vector
For k = 1 To 30000
m = Int((3000 - 0 + 1) * Rnd + 0)
n = Int((500 - 0 + 1) * Rnd + 0)
l = Int((3000 - 0 + 1) * Rnd + 0)
'o = Int((60 - 35 + 1) * Rnd + 35)
Cells(k, 1) = m
Cells(k, 2) = n
Cells(k, 3) = l
Cells(k, 4) = Sqr(Cells(k, 1) ^ 2 + Cells(k, 2) ^ 2 +
Cells(k, 3) ^ 2)
Cells(k, 5) = 60
Next k
End Sub
'After calculating the coordinates for these numbers, they
are sorted manually using Excel commands for sheet 1 by in-
creasing order of the magnitudes of the vectors just to get
optimal outcome. These different set of ordered coordinates
is used for the further analysis.
Module 2
Sub Test1()
s = 1
For j = 1 To 20000
If j = 1 Then
Cells(s, 7) = Cells(j, 1)
Cells(s, 8) = Cells(j, 2)
Cells(s, 9) = Cells(j, 3)
Cells(s, 10) = Cells(j, 5)
s = s + 1
Else
t = 0
For p = 1 To s - 1
If Sqr((Cells(p, 7) - Cells(j, 1)) ^ 2 +
(Cells(p, 8) - Cells(j, 2)) ^ 2 + (Cells(p,
9) - Cells(j, 3)) ^ 2) > (Cells(p, 10) +
Cells(j, 5)) _
And (Abs(Cells(j, 1) - 500) > Cells(j, 5)) _
And (Abs(Cells(j, 1)) > Cells(j, 5)) _

92
And (Abs(Cells(j, 2) - 500) > Cells(j, 5)) _
And (Abs(Cells(j, 2)) > Cells(j, 5)) _
And (Abs(Cells(j, 3) - 500) > Cells(j, 5)) _
And (Abs(Cells(j, 3)) > Cells(j, 5)) Then
t = t + 1
End If
Next p
If t = s - 1 Then
Cells(s, 7) = Cells(j, 1)
Cells(s, 8) = Cells(j, 2)
Cells(s, 9) = Cells(j, 3)
Cells(s, 10) = Cells(j, 5)
s = s + 1
End If
End If
Next j
End Sub
Module 3
Sub Test1()
For i = 1 To 48
Cells(i, 12) = 4 / 3 * 3.14 * Cells(i, 10) ^ 3
Next i
For i = 1 To 48
If i = 1 Then
Cells(1, 13) = Cells(i, 12)
Else
Cells(1, 13) = Cells(1, 13) + Cells(i, 12)
If Cells(1, 13) > 37500000 Then
Cells(2, 13) = i
Exit For
End If
End If
Next i
End Sub

93
APPENDIX C
EXCEL DATA ANALYSIS FOR ELECTRIC FIELD DISTRIBUTION

94
The various models of syntactic foam are developed in COMSOL Multi-
physics as a part of analysis of the electric field distribution. The effect of having
metal particles inside the foam model is further analyzed in Microsoft Excel, by
collecting data points for the calculated field values along the vertical lines from
upper electrode to the lower electrode and then plotting it in Excel for metal par-
ticles of radius 40 μm to 50 μm.
When the metal particle is placed along the direction of applied
For the vertical line passing through the edge of the metal particle
Figure C1. The Comparison of the Electric Field Distrbution Along a Straight
Line In the z Direction With x= 900 μm and y= 950μm for the 2 mm Cubical
Model Developed
For the vertical line passing at a distnace of 150 μm from the center of
the metal particle.

95
Figure C2. The Comparison of the Electric Field Distrbution Along a Straight
Line In the z Direction With x= 1100 μm and y= 1100 μm for the 2 mm Cube
When the metal particle is placed along the diagonal of the cubical section
modeled
For the vertical line passing through the edge of the metal particle
Figure C3. The Comparison of the Electric Field Distrbution Along a Straight
Line in the z Direction With x= 750 μm and y= 750 μm for the 2 mm Cube

96
For the vertical line passing thought the central part of the cylindrical
particle
Figure C4. The Comparison of the Electric Field Distrbution Along a Straight
Line in the z Direction With x= 1300 μm and y= 1300 μm for the 2 mm Cubical
Model