Development of the A-6/Circulation Control Wing Flight ...
155
001 DEVELOPMENT OF THE A-6/CIRCULATION CONTROL WING FLIGHT DEMONSTRATOR CONFIGURATION by 1 Robert J. Englar -- APPROVED FOR PUBLIC RELEASE: i.... DISTRIBUTION UNLIMITED DTNSR DC/ASED-79/01 January 1979 S.- 80 2 iil •:4
Transcript of Development of the A-6/Circulation Control Wing Flight ...

001
DEVELOPMENT OF THE A-6/CIRCULATION CONTROL WING
FLIGHT DEMONSTRATOR CONFIGURATION
by 1
Robert J. Englar
-- APPROVED FOR PUBLIC RELEASE:i.... DISTRIBUTION UNLIMITED
DTNSR DC/ASED-79/01
January 1979
S.- 80 2
iil •:4

UNCLASSIFIED-ECUAITY CLASSIFICATION OF THIS PAGE (When Data Entered)
READ INSTRUCTIONSIRORNREPORT DOCUMENTATION PAGE BEFORE COMPLETING FORM
-,REOT U 2. GOVT ACCESSION NO. 3.EIPIENT'S CATALOG NUMdER/'( DTNSRDC/ASED-7/
~IIZ~ '~"'~ - ~- S * RIOD COVERED
"CULOT-6/CRCTON CONTROL VING 4Fial" FLIGHT DEMONSTRATOR CONFIGURATIONo . Sev ]5 -u 8
S. PERFORMING ORO. REPORT ER
7. AUTHOR(e) S. CONTRACT OR GRANT NUMBER(#)
1 Robert J. Enga
9. PERFORMING ORGANIZATION NAME AND ADDRESS 10. PROGRAM ELEMENT, PROJECT, TASKAREA A WORK UNIT NUMBERS
David W. Taylor Naval Ship R&D CenterARA OKNINUESAviation & Surface Effects Department T sk Are ZF 422I2A01Bethesda, Maryland 20084 Work UnitI. CONTROLLING OFFICE NAME AND ADOFR;ES ' R PO D •REPORT DA I )• /V 1,--Naval Material CommandJaur1S": -MAT 08T 23 13, , • /• -/ ,,. NUMBE R OF PAGES
Washington, D.C. 20360 148Is. MONITORING AGENCY NAME & ADDRESS(IIdiffeent from C lntrogld Oflice) IS. SECURITY CLASS. (of this $*port)
UNCLASSIFIED•. .- 13 IS.. DECLASSIFICATION/DOWNGRADING
. -SCHEDULE
16. DISTRIBUTION STATEMENT (of thin Report)
APPROVED FOR PUBLIC RELEASE: DISTRIBUTION UNLIMITED m' .
17. DISTRIBUTION STATEMENT (of the abottact entered In Block 20, if different from Report) L
Ie. SUPPLEMENTARY NOTES it..b~bi34I C do
19. KEY WORDS (Conlinue on roveres side it neceseary and Identify by block number)
STOL Aircraft A-6 AircraftHigh Lift Systems Tangential BlowingCirculation Control Flight Demonstrator Aircraft
Boundary Layer Control
20. ABSTRACT (Continue on reverse aide It necoeeormyd Identify by block number)Wind tunnel investigatio s were conducted cn a 1/8.5-scale model of the
A-6/Circulation Control Wingflight demonstiator aircraft in order to confirmthe high lift capability of the concept, to improve lifting and controlsurfaces and to provide supporting data to assure safety of flight andadequate handling of the full-scale aircraft. The best configurationdeveloped during these investigations produced a 2.2-fold increase i9CLma
DD I 1473 A A�- ni A�X�(•(Continued 9ff reverse side)
D JAN 7 1473 EDITION OF I NOV 68 IS OBSOLETE UNCLASSIFIEDSECURITY CLASSIFICATION OF THIS PAGE (fhen Date Ifotefio
_ _ _ _ _ _ _ _ _ __ _ _ _ _ _ _ _ ._---._f

UNCLASSIFIED d 5 . rr,1x39CURITy CLASSIFICATION OF THIS PAGE (WMan Dat Ent~ereq
(Block 20 continued)
-o .over the conventional A-6A high lift configuration. This CCW configurationwas compromised to simplify teased aircraft modifications, reduceconstruction costs, and provye a larger range of parameters obtainableduring flight testing3,yet n the final configuration, still provide.dtrimmed aerodynamic <double that of the stand.rd A-6A. Additionalstudies included: Reynolds number and slot height variations, operation inground effect, stall and stall hysteresis, effect of lifting surfaceimperfection, additional drag generators, flow field at the tail surface, andlongitudinal stability levels with aft c.g. shift. Data f.-ora the presentstudies should provide an adequate base upon which to construct the full-scaleflight demonstrator and predict its STOL performance and longitudinalflying qualities.
h-.-W
UNCLASSIFIEDSECURITY CLASSIFICATION OF THIS PAOE(Uhen Date Bntirod)

'U TABLE OF CONTENTS
LIST OF FIGURES ............... ................ ivILIST OF TBS. .. .E ....... ......... v
NOTATION ........................................................... ix
-*ABSTRACT ................................................ 1
ADMINISTRATIVE INFORMATION ........................... 1
INTRODUCTION ....................................................... 1
TWO-DIMENSIONAL AIRFOIL INVESTIGATIONS ............................. 3
THREE-DIMENSIONAL MODEL, EXPERIMENTAL APPARATUS AND PROCEDURE ....... 5
RESULTS AND DISCUSSION..............................................7
LIFTING SURFACE IMPROVEMENT AND ADDITIONAL MODIFICATIONS ......... 7Additional Modifications .................................. 8Slot Height Variation ...... ......................... 10Reynolds Number Effects...................................... 12Coanda Surface Imperfections ................................. 13Final Lifting Surface Configuration .......................... 14
HORIZONTAL STABILIZER DEVELOPMENT ................................ 14SWing Downwash and Dynamic Pressure at the Tail ................ 15
Phase I Horizontal Stabilizer Development ................... . 17Aft Center-of-Gravity Movement ...................... 18
- Phase II Horizontal Stabilizer Modifications.............. 19• Phase III Horizontal Stabilizer Modifications................ 20Phase IV Horizontal Stabilizer Modifications.................. 21Final H3rizontal Tail Configuration ........................... 21
STRIMMED AERODYNAMIC DATA ......................................... 22
GROUND EFFECT................................................. 25
DRAG GENERATION ............................ 26
POST STALL AND STALL HYSTERESIS S.. ........ 28
SPLITTER FLAP ...... ............................ 29
LATERAL AND DIRECTIONAL CHARACTERISTICS .......................... 30
CONCLUSIONS AND RECOMMENDATIONS ..................................... 30

Page
REFERENCES .......................................................... 33
APPENDIX - MODEL, EXPERIMENTAL APPARATUS, AND TECHNIQUE ............. 35
LIST OF FIGURES
1 - Basic Circulation Control Aerodynamics and Parameters .......... 51
2 - Three-View of the A-6A Aircraft ................................ 52
3 - Proposed Circulation Control Wing Configurations ............... 53
4 - NACA 64A008.4/CCW Two-Dimensional Airfoil Geometryand Parameters ................................................. 54
5 - NACA 64A008.4/CCW Airfoil Static Pressure Distributionat a = 6 Degrees ............................................ 55geo
6 - Two-Dimensional Lift Characteristics of the NACA64A008.4/CCW Airfoil ........................................... 56
7 - 1/8.5-Scale A-6/CCW Model Modifications ........................ 57
8 - 1/8.5-Scale Model Installed in 8- by 10-Foot NorthSubsonic Tunnel, Phase I ....................................... 58
9 - Trailing Edge Modification, and Cotton Tuft ShowingJet Turning (Wind Off) ........................................ 58
10 - A-6A/CCW Lifting Surface Improvement, Tail Off,C = 0.263 ..................................................... 59
11 - Details of Wing Flow Fences .................................... 60
12 - A-6/CCW Tail-Off Aerodynamic Characteristics, Phase I .......... 62
13 - Phase II Lifting Surface Modifications ......................... 63 -.
14 - Slat Leading Edge Radius Increase .............................. 64
15 - Effect of Increase in Wing Slat Leading Edge Radius ............ 65
16 - Conversion to Phase III Lifting Surface Configuration .......... 66
17- Phase III Final Wing Configuration AerodynamicCharacteristics, Tail-Off ..................................... 67
iv

Page18 -Comparison of Tail-Off CL and Stall Angle for
Various Configurations ........................ 68
19 - Lift Augmentation as a Function of Momentum Coefficlant ........ 69
20 - Phase V Modification to the Wing Trailing Edge ................. 70
21 - A-6/CCW Phase II Left Wing Slot Height Expansion ............... 71
22 - Momentum Coefficient as a Function of Slot Height,Pressure Ratio, and Dynamic Pressure ........................... 72
23 - Effect of Slot Height Variation on Lift Coefficient(Phase I) ...................................................... 73
24 - Effect of Slot Height Variation as a Function ofC V /2Vo (Phase I) ........................................... 74
25 - Effect of Variation in Dynamic Pressure and C (Phase I) ....... 75
26 - Effect of Reynolds Number Variation at Constant Momentum• Coefficient and Velocity Ratio ................................ 76
27 - Momentum Coefficient as a Function of Dynamic Pressure
and Pressure Ratio (Phase I) ................................... 77
28 - Effect of Slat Step Fairing and Transition Strips ............... 78
29 - Effect of Coanda Surface Imperfections (Phase I) ............... 79
30 Tufts Showing Downwash Angle in Vicinity of HorizontalSTail, a = 12 deg, q = 25 psf .................................. 80
gLI* 31 - Measured Downwash Angle at Horizontal Tail Quarter ChordsIl (Phase I) .............. ..................................... 81
32 - Tail Dynamic Pressure Measurement (Phase I).....................84
33 - Horizontal Tail Configurations (Phase I) ....................... 85
34 - Effect of Various Tail Configurations on Pitching Moment(Phase I, C = 0.10) ........................................... 88
S35 -Effect of Various Tail Configurations on Pitching Moment(Phase I, C = 0 . .............2............................. 89
36 - Tail-Off Pitching Moment for the A-6/CCW Phase IL Configuration of Figure 12, but with X = 0.35c ............... 90
Scg
'N. v

Page
37 - Effect of Aft Center-of-Gravity Shift (Configuration 63,Phase I) ....................................................... 91
38 - Horizontal Stabilizer Configurations (Phase II) ................ 92
39 - Horizontal Tail Development, C 0.10 (Phase II) .............. 93
40 - Horizontal Tail Development, C = 0.30 (Phase II) .............. 94
41 -Horizontal Tail Development (Phase III) ........................ 95
42 - Horizontal Stabilizer Configurations (Phase III)................96
43 - Horizontal Stabilizer Configurations (Phase IV) ................ 99
L4 - Horizorta] Tail Development, C = 0 (Phase IV) ................. 100
45 - Effect of Center-of-Gravity Location on UnblownLongitudinal Stability ......................................... 101
46 - Trimmed C0 and Required Tail Incidence for OptimumPhase I Co~nT guration .......................................... 102
47 - Trimmed Aerodynamic Data for the Final Phase IIConfiguration .................................................. 103
48 -Lift and Drag Coefficient Variation with Blowing(Phase II) ..................................................... 104
49 - Tail Incidence Required to Trim Final Phase IIConfiguration ....... . ....................................... 105
50 - Aerodynamic Data for Final Phase III Configuration ............. 106
51 - Tail Incidence Required to Trim Final Phasv IIIConfiguration ............ ........ ............................ 108
52 - Trim Lift-to-Drag Ratio for the Final Phase IIIConfiguration .......................... 109
53 - Effect of Tail Incidence on the Phase !V ConfiguratLor, T"C 00 ........................... ...... 110
54 - Effect of Tail Incidence on Final Phase IV ConfigurationDrag Polars .. . . . . . .4. .. . . . . . . . . . . .. ill
55 - Trimmed Lift and Drag Data for Final Phase iVConfiguration ............. ... ............... ............... 112
vi

Page
56 - Tail Incidence Required to Trim Final Phase IVA. Configuration .................................................. 113
57 - Lift-to-Drag Ratio for the Final Phase IV Configuration,Unblown .................................................... 114
58 - Effect of GAC-6RA Tail Deflection on Final Phase VFlight Demonstrator Configuration .............................. 115
59 - Trimmed Aerodynamic Data for Phase V A-6/CCW FlightDemonstrator Configuration ..................................... 117
60 - Tail Incidence Required to Trim Phase V FlightDemonstrator Configuration ..................................... 118
61 - Trim Lift-to-Drag Ratio for the.Phase V Flight
Demonstrator Configuration ..................................... 119
62 - Ground Plane Installation in Phase II......................... 120
63 - Tuft Photographs of Flow Over Ground Plane in Phase II ......... 121
64 - Trimmed Aerodynamic Data for Final Phase II Configurationin Ground Effect ............................................... 123
65 - Ground Effect on Trimmed Maximum Lift for the FinalPhase II Configuration ........................................ 125
66 - Ground Effect on Trimmed Lift for Final Phase IIConfiguration ................................................. 126
.L. 67 - Ground Effect on Pitching Moment for Final Phase IIConfiguration ............................................... 127
68 - Drag Generated by Final Phase I Configuration .................. 128
69 - Effects of Landing Gear, Pylons, Stores, and Wing TipSpeed Brakes on Lift (Phase I) ................................. 131
70 -Effects of Fuselage Speed Brakes on Pitching Moments(Phase II) ..................................................... 132
71 - Post-Stail and Stall Hysteresis Effects on Lift(Phase III) ................................................. 133
72 - Post-Stall and Stall Hysteresis Effects on Drag andP itch, C, 0.10 (Phase III) ...................................
vii

Page
73 - Post-Stall and Stall Hysteresis Effects on Drag andPitch, C = 0.30 (Phase III) ................................... 135
74 - Effect of Trailing Edge Splitter Flap on the FinalPhase IV CCW Configuration (Yaw Jets Removed) .................. 136
75 - Comparison of the CCW and Splitter Flap Phase VConfigurations ................................................. 137
A.1 -1/8.5-Scale A-6/CCW Model in Phase I Configuration ............ 138
A.2 - 1/8.5-Scale A-6/CCW Model in Phase III Configuration .......... 140
A.3 - A-6/CCW Test Setup and Instrumentation ........................ 143
A.4 - Static Calibration of Slot Height as a Function ofDuct Pressure (Phase I) ....................................... 144
A.5 - Coanda Nozzle Efficiency (Phase I) ............................ 145
A.6 - Measured and Isentropic Weight Flow as Functions ofSlot Height and Pressure Ratio ................................ 146
LIST OF TABLES
1 - Geoemtric Characteristics of the Grumman A-6A ................... 40
2 - Phase I Test Program Summary .................................... 43
3 - Phase II Test Program Summary ................................... 46
4 - Phase III Test Program Summary .................................. 475m.5 - Phase IV Test Program Summary ................................... 48
6 - Phase V Test Program Summary.............................................. 49
7 - 1/8.5-Scale A-6/CCW Model Trailing Edge Parameters,Blowing Off ............................................... 50
viiiI .. : : . ..

I fi
NOTATION
Aj Jet slot -oa
B.L. Butt line, spanwise distance from aircraft centerline
b Wing span
b' Spanwise distance along slot from end
"b Horizontal tail spanT
C, c Wing chord length
CD, Cd Aircraft or section drag coefficient
CDE Aircraft equivalent drag coefficient, CD + C
CL, C, Aircraft or section lift coefficient
C, C Aircraft or section pitching-moment coefficient;x x x subscript indicates moment center in fraction of MAC
C Slot nozzle coefficient, mes/m
noz mescalcC Pressure coefficient, (P-P )/q
CR Chord at wing or tail root
CTCT Horizontal stabilizer chord and MAC
CTE Chord of horizontal stabilizer extended trailing edge
CTIP Chord at wing or tail tip
C Jet momentum coefficient
Wing mean aerodynamic chord (MAC)
F.S. Fuselage station, horizontal distance aft of aircraftnose
h Jet slot height
hAy Jet slot height at mid-slot
h Distance of aircraft center of gravity above groundg when a = 0 deg
i i Horizontal stabilizer incidenceS1j s

L/D Aircraft lift-to-drag ratio
X. Horizontal distance from wing to horizontal stabilizer0.25 MAC points
2. Horizoncal distance from wing to vertical stabilizer0.25 MAC points
m Jet mass efflax
P Static pressure
Pd$ P D Plenum (duct) total pressure
PD Total pressure at middle of left wing plenum2
P' Freestream static pressure
q Freestream dynamic pressure
qT Dynamic pressure at the horizontal tail (stabilizer)
q u Tunnel uncorrected dynamic pressure
R, r Leading or trailing edge radius
R Universal gas constant
R Reynolds number based on MACRe
SS Wing planform area
Td Plenum (duct) total temperature
T. Jet static temperature
V. Isentropic jet velocity
VS, VSTALL Aircraft stall velocity
Freestream velocity
W.L. Waterline station
W.S. Wing station, distance from aircraft centerline
w Jet slot weight flow
x Longitudinal distance from leading edge or nose
x

(!
Sx Center-of-gravity distance aft of leading edge
cg
y Spanwise distance from aircraft centerline
S• Corrected angle of attack
, g GEO Geometric uncorrected angle of attack
a STALL Stall angle of attack
Angle of attack at the horizontal tail (stabilizer)
Angle of sideslip
Y Ratio of specific heats
6f, 6 Flap deflection angle
S6 rud Rudder deflection angle~ruI
s SLAT Slat deflection angle
Spoiler (flaperon) deflection angle
ITE Deflection angle of horizontal stabilizer trailingedge extension
Downwash angle or tunnel blockage correction factor
P Jet or freestream density
Angle of yaw
Subscripts
av Average value
calc Calculated isentropic value
max Maximum value
meas Measured value
nom Nominal value
TRIM Trimmed value, CM 0
xi

ABSTRACT
Wind tunnel investigations were conducted on a 1/8.5-
scale model of the A-6/Circulation Control Wing flightdemonstrator aircraft in order to confirm the high liftcapability of the concept, to improve lifting and con'trolsurfaces and to provide supporting data to assure safetyof flight and adequate handling of the full-scale airciaft.The best configuration developed during these investigationsproduced a 2.2-fold increase in CLmax over the conventional
A-6A high lift configuration. This Circulation Control Wingconfiguration was compromised to simplify testbed aircraftmodifications, reduce construction costs, and provide alarger range of parameters obtainable during flight testing,yet in the final configuration, still provided trimmedaerodynamic Cma double that of the standard A-6A. Additional
studies included: Reynolds number and slot height variations,operation in ground effect, stall and stall hysteresis, effectof lifting surface imperfection, additional drag generators,flow field at the tail surface, and longitudinal stabilitylevels with aft center-of-gravity shift. Data from the presentstudies should provide an adequate base upon which to constructthe full-scale flight demonstrator and predict its STOL perform-ance and longitudinal flying qualities.
ADMINISTRATIVE INFORMATION
The work represented by the studies reported herein was funded by the
Naval Material Command (MAT 08T23) under ProgramTEle ent 62241N, Task Areas20Z, WF41.421.091, ZF41.400.0O0lIan ZF4 . nd David W. Taylor
WF "
Naval Ship Research and Development Center (DTNSR ork Units 1660-600,1,1660-601, and 1660-605. The two-dimensional wind tunnel investigations
were conducted during September and November of 1975. The A-6/Circulation
Control Wing investigations were conducted in five phases: Phase I -
December 1975 through February 1976; Phase II - March through April 1976;
Phase III - December 1976 through February 1977; Phase IV- June through
July 1977; Phase V - June through July 1978.
INTRODUCTION
In response to the current interest in Short Takeoff and Landing (STOL)
and Vertical/Short Takeoff and Landing (V/STOL) aerodynamics, a number of
powered lift concepts are undergoing development in the aerospace community
• 1

in an attempt to derive maximum lifting benefits from various combinations
of advanced lifting surfaces augmented by engine bleed or thrust. Many of
these concepts are quite complex; and while they might be successfully
integrated into such aircraft as advanced STOL transports, they are often
not compatible with high performance fighter and attack configurations.
A more feasible concept for these aircraft is a high lift system which can
be simply incorporated into conventional wing trailing edge structure and
powered by bleed air from existing turbine engines without major modifica-
tions or relocation. Technology developed at DTNSRDC since 1968 has led
to the Circulation Control Wing (CCW), a STOL high lift concept offering
this potential.1 5
The basic aerodynamics of the circulation control concept involve the
adherence of a thin tangentially ejected jet sheet to the rounded trailing
edge of an otherwise conventional airfoil. This phenomenon, frequently
identified as the Coanda effect, is produced by a balance of centrifugal
force and reduced static pressure in the jet sheet, shown schematically in
Figure 1. Lift augmentation due to boundary layer control occurs at lowerblowing coefficients (C); ACL/C can be as high as 70 for C of 0.05
or less. However, high lift capability is achieved due to supercirculation,
where control of the airfoil stagnation points by the jet sheet produces
lift coefficients considerably higher than those predicted by potential
flow. Due to the lack of a sharp trailing edge and the associated Kutta
condition, this circulation control is achieved at lower momentum coeffi-
cients than the somewhat similar tangentially blown flap (see References 3
and 6 for comparison). Although the CCW does not generate the same ultra-
high lift coefficient as those concepts which employ large vertical thrust
components (such as jet flaps, upper surface blowing, and externally blown
flaps), the concept is promising for high performance fighter and attack °
aircraft where available C may be low and where engine placement on or
below the wing is not practical.
Based on the potential of the Circulation Control Wing and the more
than doubling of C produced by the CCW on a three-dimensional aircraft
*A complete listing of references is given on page 33.
_2

configuration during earlier investigations, 2 ' 5 a flight test program is
being undertaken to demonstrate the STOL performance of the concept on a
full-scale testbed aircraft.. The Grumman A-6A (Figure 2 and Table .1) was
chosen as the flight demonstrator because of the excellent aerodynamic
configuration, relative simplicity of trailing edge modifications, availa-
bility of a test aircraft, twin engines with additional bleed ports
available, and predicted STOL performance gains with CCW. Goals of the
program are (1) to demonstrate maximum obtainable lift augmentation from
the CCW powered by bleed air, (2) to evaluate stability, control, and
handling characteristics in the STOL regime, and (3) to develop the
technology to the point of reducing the risk of application to future STOL
configurations. The present wind tunnel investigations were undertaken to
develop the lifting surface and to provide the supporting trim, stability,
control, and handling data to assure safety in flight of the A-6/CCW flight
demonstrator.
TWO-DIMENSIONAL AIRFOIL INVESTIGATIONS
A two-dimensional (2-D) model of the A-6 wing-fold-line airfoil section
(NACA 64A008.4 Modified) was constructed for wind tunnel investigation toj ioptimize both leading and trailing edge parameters for maximum lift
augmentation prior to modification of a three-dimensional model. In order
-1 to convert the sharp trailing edge of the cruise airfoil into the rounded
trailing edge, a number of configurations were considered, as shown in
Figure 3. The extended configuration appeared least complicated in terms
of a bolt-on, fixed deployment modification for the demonstrator aircraft.
In addition, the extended configuration displayed a slight chord increase
when deflected rather than the chord loss of the rotating flap configura-
tion. The 25.025-in. airfoil section shown in Figure 4 was constructed4 Twith a 3-ft span and installed in a 3- x 8-ft two-dimensional test section
inserted in the DTNSRDC 8- x 10-Foot South Subsonic Wind Tunnel. Trailing
edge slot-height-to-chord and radius-to-chord ratios shown in the figure
are based on values found to be quite effective on similar airfoils.I-5Lift and pitching moment were determined by static pressure integration at
•i' the model centerline; drag was measured by wake rake one chord length
i3

downstream of the trailing edge. Data were nondimensionalized in the 2-D
investigations by the undeflected cruise chord C, corresponding to the
undeflected planform areas S in the three-dimensional investigations. Two-
dimensionalty was controlled by tangential blowing from the tunnel walls
using test techniques very similar to those employed in References 4 and 7.
However, incidence shown in the present two-dimensional data has not yet
been corrected for the induced downwash due to slight three-dimensionality,
as discussed in Reference 7. The effective incidence, therefore, should be
reduced by approximately the increments shown in Figure 24 of Reference 4.
Variations in slat gap, slat angle, jet slot height, trailing edge shape,
airfoil incidence, and momentum coefficient were conducted to determine
leading and trailing edge parameters required for maximum lift augmentation.
A characteristic "saddle-back" pressure distribution is shown in
Figure 5 for geometric incidence of 6 deg. The very high suction peak down-
stream of the slot is typical of the CCW airfoil, and the high section C2results from the supercirculation induced by blowing. Figure 6 presents
lift as a function of blowing and geometric incidence for the airfoil at a
velocity of approximately 155 to 160 ft/sec (q = 30 psf) and Reynolds Number
of 1.9 x 10 . A lift coefficient of almost 6.5 was achieved by the airfoil
with 37.5-deg slat deflection, but was limited at higher incidences due to
upper surface flow separations on both the slat and main airfoil. This
was corrected on the main airfoil by the addition of the small radius (seeFigure 4) to the lower surface of the airfoil so that the sharp corner just
aft of the slat gap was eliminated. Separation on the slat was controlledsomewhat by additional deflection, but net lift was not greatly improved due
to the reduction in the vertical force component on the slat as it was
tilted forward. An increase in slat leading edge radius should eliminate
the flow separation. Note that the lift performance of the A-6/CCW airfcil
(only 8.4 percent thick) is very similar to the 64A-212/CCW airfoil in
Reference 4 as long as flow separation does not occur. High lift generation
appears to be more a matter of leading edge flow control under this high
supercirculation than basic airfoil characteristics aft of the leading edge.
The above results were sufficiently high to warrant modification of a
three-dimensional model with the trailing edge parameters of the two-
dimensional model and provisions for additional leading edge investigations.
4-

A V
THREE-DIMENSIONAL MODEL, EXPERIMENTAL APPARATUS, AND PROCEDURE
A l/8.5-scale model of the A-6A, as tested in Reference 8, was borrowed
from Grumman Aerospace Corporation and the wing waa modified to resemble
the two-dimehsional CCW aection. The airfoil sections varied from NACA
64A009 MOD at Wing Station (WS) 33.0 (approximately the wing-body juncture),
to NACA 64A005.9 MOD at the wing t:ip. The original semi-Fowler flap was
replaced with the rounded CCW trailing edge, which covered the same span as
the flap--from WS 55.5 to WS 270.0. Figure 7 shows the basic model layout,
including some additonal modifications made to the wing leading edge and
horizontal stabilizer in later portions of the program. Yeometric charac-
T teristics of the full-scale A-6A are given in Table 1. A detailed
description of the model design rationale, modification, test procedure,
and data reduction is provided in the Appendix.
The model was mounted on a single point strut at Fuselage Station 260.4
(0.253c) on the centerline of the 8- x 10-Foot North Subsonic Wind Tunnel.
Figure 8 shows this installation, the air supply lines, engine inlet and
exhaust fairings, the standard horizontal stabilizer, and some long tufts
used for preliminary flow visualization. Additional trailing edge detail,inboard and outboard flow fences, and cotton tufts showing the turning ofthe jet sheet are shown in Figure 9. A turning angle of more than 180 deg
from the slot was achieved, and sufficient energy remained in the jet soIi !that it carried forward on the lower surface to the slat gap, turned thecorner there, and exited onto the upper surface of the wing. Although this
photo is taken without tunnel freestream velocity, the capability of the
jet to influence wing circulation is apparent.
Over 760 hours of wind tunnel investigations were conducted in five
phases to confirm the CCW potential on the A-6 and to provide a data base
for the flight test. The basic objectives of each phase are listed below,
with detailed test programs provided as Tables 2, 3, 4, 5, and 6.
PHASE I
* Lifting surface development; Reynolds number and slot height
.2 variation; and tail-off lift, drag, and pitch data.
* Horizontal tail improvement for longitudinal trim; trimmed forcedata.
ii, 5

* Effects of landing gear, pylons, external fuel tanks, wing tip
drag brakes.
• Lateral directional characteristics including spoiler and rudder
power at zero sideslip, and sideslip effects.
PFASE II
* Wing and horizontal stabilizer simplification to reduce modification
cost; tail-off and trim data for simplified configuration." Effects of fuselage drag brake deflection.
e Operation in ground effect.
* Spoiler and rudder power at sideslip angle.
PHASE III
a Further wing simplification and horizontal tail development toyield final flight test wing configuration and associated tail-off
and trim data.
o Extended a range (to post-stall); stall hysteresis.o Rudder and spoiler deflection through post-stall incidence.
PHASE IV
o Further development of horizontal stabilizer for blowing-off flight
test configuration; trim force data.
e Rudder power at high stabilizer deflections.o Fairing for air supply ducting.
PHASE V
o Conversion to final wing configuration as necessitated by financial
and construction limitations.
9 Additional lateral and directional data for final flight testconfiguration.
e Effect of short chord splitter flap to reduce drag for takeoff
configuration.
(1) simplify or reduce the cost of modifications on the flight demonstrator
aircraft, (2) improve performance or obtain additional stability and controldata, and (3) add to data pertaining to aircraft safety of flight. Thewhole series of tests will provide the data base upon which aircraft flight
clearance will depend.
6

RESULTS AND DISCUSSION
LIFTING SURFACE IMPROVEMENT AND ADDITIONAL MODIFICATIONS
The initial wing configuration maintained essentially the same trail-
ing edge parameters as the 2-D section shown in Figure 4. Actual slot
height and trai.,ing edge radius varied along the span so that the ratios
h/r and r/c remained constant across the tapered planform at 0.03086 and
0.03623, respectively. This produced an average slot height and radius
midway between wing stations 55.5 and 270.0 of h 0.0156 in. and r =av av0.5047 in. at c = 13.930 in. This configuration was expected to provide• av
strong lift augmentation, with some improvement needed in the leading edge
parameters to increase performance at higher incidence. Results of varia-
tions in the leading edge characteristics are seen in Figure 10 for a sample
C 1of 0.263. A serious separation problem produced stall between 4 and
6-deg angle of attack and was not affected by variation in slat angle, gap,
or leading edge radius (Configurations 3, 4, 7, 8 and 11). Tuft studies
showed a strong vortex originated at the glove located at the wing-body
4• juncture (Figure 7) and produced strong flow separations both aft of the
glove and at the outboard edge of the slat. Removal of a sharp leading
edge strake which existed on the glove produced a significant improvement
(Configuration 13), and additional rounding, deflection or addition of a
Kruger flap to the glove (Configurations 14, 20, 28, and 39) showed
continued elimination of separation and vorticity. Removal of conventional
flow fences and the addition of those fences shown in Figure 9 also aided
by controlling spanwise flow; see Figure 11 for fence details. Including
these fences and some variation in slat gap, Figure 10 shows increases in
Cimax from 3.1 to 4.6 and astall from 4 to 20 deg obtained solely by
improving the leading edge and glove geometry. Figure 12 shows the tail-off
lift, drag, and pitching moment coefficients for the best of the above
configurations (Configuration 39) as functions of blowing and incidence,
along with a comparison with the standard A-6A, tested tail-off in its
landing configuration (30-deg flap and 25-deg slat deflections) . With
this blown wing configuration, CL., can be increased by a factor of 2.2
at C = 0.30. Analysis of the bleed airflow available from the A-6's
7

J-52-P-8B engines indicates that C greater than 0.30 will not be available
on the full-scale flight demonstrator aircraft. For this reason, C 0.30
is considered an upper limit on momentum coefficient for the remainder of
these studies.
Additional Modifications
Although Configuration 39 was the optimum of the initial investigation,
during considerations of full-scale aircraft modification a number of
changes were deemed necessary in the lifting surface design in order to
(1) reduce modification cost, (2) simplify the configuration, (3) further
increase lifting performance, and (4) conform to existing wing structures
and predicted mass flows. At the initiation of the Phase II investigation,
the following changes were made to the slat, fences, and blowing slot of
the final Phase I configuration:
9 Slat angle was reduced from 37.5 to 25 deg; the 0.02c gap was
retained.
* Slot length was shortened from 25.59 to 25.24 in. as outboard
termination was moved from WS 270.0 to WS 267.0 to avoid fuel dump
nozzle.
o Outboard flow fence was moved inboard from WS 270.0 to WS 267.0.
* Flap track louvers were added to wing upper surface at 0.83c to
duplicate the actual aircraft.
* Slot height for both the Phase I and II configurations was reduced
from the Configuration 39 value h/r = 0.0309 (h av= 0.0156 in.)
to h/r = 0.0231 (h = 0.0117 in.) to accommodate expected full-av
scale mass flows and pressures on the test aircraft.
The results of these changes are seen in Figure 13, where the primary
difference is an increase in CLmax of 0.2 to 0.3 for the blown cases. The
shortened slot span and inboard fence movement should have produced a
de:reased blown aspect ratio, which in conjunction with the flow disturb-
ances produced upstream of the slot by the track louvers should have
reduced lifting capability at constant C . The net increases then must be
attributed to the increased vertical force component produced on the slat
at the reduced deflection. Maintenance of flow attachment is due to the
increase in slat leading edge radius, Figure 14, as verified in Figure 15.
8[i

This rounde& leading edge was also present on the slat for Configuration 39
and the final Phase I configuration in Figure 13. Thus, the 25-deg slat
deflection which exists on the actual aircraft can adequately prevent flow
separation at kaigher incidence and blowing as long as the increased leading
edge radius is retained.
In Phase III, two additional simplifications to the lifting surface
were made. The inboard flow fence at WS 55.5 was removed as were the gap
radius and ramp on the main airfoil just aft of the slat gap; see Figure 4.
As Figure 16 shows, removal of the inboard fence reduces CLmax by about
0.25 or less, while removal of the gap radius and ramp restores a portion
of this but produces up to a 2-deg loss in stall angle. Tail-off lift,
drag, and pitching moment coefficients are presented in Figure 17, and when
compared in Figure 18 to the Phase I optimum configuration show the effects
of configuration compromise due primarily to goals of simplification and
cost reduction. For momentum coefficients greater than 0.075, the Phase III
loss in increases with C , to a maximum loss of 0.47 at C, = 0.30,
since the simplifications made are most detrimental at higher blowing.
However, for C < 0.075, the latter configuration shows increases of up to
0.1 in C x and up to 3 deg in stall angle over the Phase I configuration
as blowing decreases. This trend is further revealed in Figure 19 where
lift augmentation is compared at zero incidence. In either case, increases
in C x by a factor of 2 or more over the standard A-6A in landing config-
' uration are generated.
Note that Figures 12 and 17 are not exactly comparable in that the
engine inlet and exhaust fairing plugs of Phase I were removed for Phases
II, III, IV, and V. Furthermore, Figures 12, 13 and 16 are not directly
comparable due to differences in horizontal stabilizers, as shown in the
section Horizontal Stabilizer Development.
Phase IV involved no changes in the wing; however, during construction
of the actual flight test aircraft, a number of additional changes were
necessitated due to structural or construction limitations. These changes
were investigated in Phase V and include the following:
. Add small heat shield at inboard slot end (WS 56.09) to protect
fuselage skin from jet sheet temperatures.
1.9

e Shorten slot to 24.986 in. and ,ove outboard slot end and fence in
to WS 265.5.
* Add support structure to base of outboard fence.
e Modify wing plenums by reducing nozzle entrance angle and installing
screws nearer to slot.
• Add wing pylons at the wing fold r-tation,WS 144.
* Add external crossover bleed air ducts to fuselage and wing.
• Add air conditioner inlet scoop on right wing Kruger flap upper
surface.
e Reduce slot height to h/r = 0.01406 or h = 0.0071 in.av
e Add yaw-control jet thrusters at WS 259.25 (unblown initially).
Details of the modified plenum and nozzle plus the yaw-control jets are
shown in Figure 20. (The splitter flap shown was tested in a later portion
of this investigation and is discussed on page 29.) The tail-off maximum
lift coefficients and stall angles are compared to the Phase I and TII
configurations in Figure 18. Whereas the maximum lift coefficients show
negligible variation from those of the final Phase III tail-off configura-
tion, the combined effect of wing pylons and air conditioning inlet scoop
produced a small reduction in stall angle (1.2 deg at most).
Slot Height Variation
Actual slot height on the flight test configuration will be a function
of the available mass flow, pressure, and temperature delivered to the wing
plenum from engine bleed, and as these were undetermined at the time,
variation in the slot height was investigated. These effects have been
investigated on similar circulation control airfoils, and for a constant
momentum coefficient and airfoil incidence, a reduction in slot height
produces an increase in lift due to the increased energy and turning of the
jet.4,9,10 However, limits were found where, depending on the model and
blowing rates, too small a slot height could reduce the lift at constant
C and incidence.
In Phase I of the present tests, 3 slot heights were investigated.
Table 7 lists these slot heights and the resulting trailing edge parameters.The slot height values are nominal for the no-blowing case. Figure 21 shows 1
that for the h/r 0.023143 (h = 0.0117 in.) data of Phase II, slot height
10

I
• i '
expansion under pressure ratios up to 4.4 prodiced ais much as a 75-percent
increase in average slot height over the nominal value. This increase is
due to the thin upper surface slot lip (see Figure 4) required to allow
smooth undisturbed flow from the airfoil upper surface into the jet region
and by the placement of the support screws well ahead of the slot to
prevent flow distortion in the jet throat. Figure 22 presents momentum
coefficients obtained for the three slot heights of the Phase I investiga-
tions as a function of pressure ratio. Slot expansion under pressure is
similar to Figure 21, with the exception of a somewhat higher expansion
rate for the smallest slot, h = 0.0078 in. Figure 23 presents variationsav
in lift coefficient with slot height at a constant geometric incidence of
4 deg. As seen in previous investigations, at constant low values of C
the smaller slot heights are slightly more effective due to additional
energy in the jet; but at higher values of C , crossovers occur in the
curves and the small slot heights prove less effective. The net difference
in lift coefficient between the smallest and largest slot height is never
more than 0.1. Although the effect thus appears minor, it is perhaps more
meaningful to compare the data at constant values of kinetic energy in the
jet, or power required to produce that energy:
K.E. 1/2 2! m~j
AKE AmV. 2
Power = 1 2At 1/
At j
or non-dimensionalized
S.2Power mV= _ V.
qSVO, 2qSVo 2VC
Then, as Figure 24 shows, for constant values of this parameter, increased
slot height produces slightly greater C over the entire range of jet
velocity. Again, the difference between largest and smallest slot heights
I L _i__ _

is minimal, but the trend is toward reduced lift with smaller slot heights.
It is therefore advisable to adopt the lower limit on h/c of 0.0005, as
discussed in Reference 4.
Reynolds Number Effects
While the majority of the present investigations were run at a free-
stream dynamic pressure of 25 psf and Reynolds number (based on • = 1.282 ft)
of 1.2 x 10⁶, the effect of varying Reynolds number was desired in order to
allow data extrapolation to the full-scale flight demonstrator. The area
of primary interest is, of course, CLmax; however, as discussed in
Reference 2, setting an incidence near the unknown stall incidence while
retaining constant C over a range of dynamic pressures can produce effec-
tive corrected incidence beyond stall due to tunnel interference effects
(see the Appendix). Thus, a lower angle of incidence was used to conduct
the study. Figure 25 shows effects of varying dynamic pressure from 5 to
30 psf (Re from 0.54 to 1.30 x 10⁶) at 4-deg geometric incidence. For
C < 0.18, an increase in dynamic pressure at constant momentum coefficient1--
produces increased CL; but for C > 0.18, the crossplotted data of Figure
26 show a slight reduction in CL at increased R e. This apparent abnormality
is explained by the fact that the effect of Reynolds number alone cannot be
distinguished from the effects of increasing the pressure ratio (or jet
velocity) to maintain constant C at increased q. Figure 25 shows that a'P
constant pressure ratio of 1.5 can vary C from 0.279 to 0.047 for q ranging
from 5 to 30 psf. Figure 27 shows C as a function of q and pressure ratio.
Apparently, increase in pressure ratio can produce a knee in the C - CL 'P
curve beyond which lift augmentation is somewhat reduced. For the present
configuration, that point for each curve of Figure 25 is denoted on both
Figures 26 and 27, the locus of points appears to fall in a pressure ratio
band between 2.4 and 2.6, and coincides with the dropoff in CL with increased
q at higher C in Figure 26. These lift losses are small, 0.10 or less in
C for C < 0.30, the range of interest for the flight demonstrator, butL P
they may reconfirm the data of Figure 24 which tends to favor a larger slot
and reduced pressure ratio over the entire C range of interest.
Whereas the Reynolds number effect is not resolved by the above data,
Figure 28 presents the effects of boundary layer transition devices and

1 Limplies the effects of higher Reynolds number. The wing of the A-6 has a
forward-facing step at the 15-percent chord location into which the trailing
edge of the slat retracts at zero deflection. For data through Configura-
tion 38, this step was faired over; however, on Configuration 39 it was
unfaired and returned to its production shape. The result was a slight
decrease in CL at constant a, but a slight increase in C x, characteristic
of the usual expected increase with Reynolds number. For Configuration 40,
saw-toothed leading edge transition strips of tape were placed at the 5-
percent chord location on the slat, glove, and vertical tail, and around
* the fuselage circumference at Fuselage Station 120 (14.1 in. from the nose
of the model). The results were the reverse of before--an increase in CL
at constant a but a slight reduction in CLmax and astall" The strips
apparently did little to induce transition and were thus removed; the slat
step was left unfaired as on the actual aircraft.
Coanda Surface Imperfections
From a design and operational standpoint, it was desirable to investi-
gate the effects of imperfections in the Coanda surface downstream of the
slot. To represent a poorly constructed Coanda surface with a protruding
surface producing a forward facing step in the jet, a piece of 0.012-in.
thick tape was applied across the entire span of the right wing blown
J section, with the step located 90 deg downstream of the slot (see Figure
I 29). This imperfection resulted in serious degradation of the jet effective-
ness, causing a 22-percent reduction in lift at C, = 0.30 in Figure 29.
I Continuation of this imperfection to include the left blown surface as well
"could produce as much as twice that loss; any forward facing protrusion
I- should thus be avoided in construction. Figure 29 also shows the effect of
holes in the Coanda surface, representing possible darage due to enemy
weapons. To model this, wax which covered attachment screws in The rignt
f Coanda surface was removed in the pattern shown in Figure 29, representing
a porosity (hole area/surface area) of 0.0068. The total lift loss, should
both wings receive this amount of damage, was 8 percent at C = 0.30.
Should protruding metal result from weapon impact, larger lift loss would
ii be expected. Figure 29 also shows additional data on the effect of removing
13

the slat gap radius on the main airfoil and supplies supporting data for
the effects previously w" in in Figure 16.
Final Lifting Surface Configuration
The final lifting surface, modified as necessary to reduce cost,
increase simplicity, or conform to existing structures and conditions, is
summarized in model scale:
Coanda trailing edge: r/c = 0.03623, r = 0.5084 in., C = 14.033 in.av av
h/r = 0.01406, h/c = 0.00051, h = 0.0071 in.av
slot from WS 56.1 to 265.5, 24.99 in. length
Slat: 25-deg deflection, 0.02C gap, increased L.E. radius
Glove: Kruger leading edge, with air conditioner inlet scoop on right
side
Fences: set 2F (outboard fence at WS 265.5, inboard heat shield fence
at WS 56.1; conventional fences removed)
Slat gap radius: removed
Wing pylons: at W.S. 144.0Wing plenum: modified as shown in Figure 20
Yaw control thrusters: at WS 259.25 (,inblown)
Slat step: unfaired
Flap louvers: in place ahead of slot
HORIZONTAL STABILIZER DEVELOPMENT
The rather large nose-down pitching momenti associated with blown
systems of this type are evident in Figures 12 and 17 and, when compared to
the conventional A-6, suggest that the existing all-moving horizontal
stabilizer will probably be insufficient to assure longitudinal trim. An
attempt to improve its trim capabilities was undertaken in Phase I after
development of the lifting surface, and was continued in Phases II, III and
IV of the investigations. The following sections detail changes in tail
configuration and characteristics of the flow field in which the tail must
operate.
14

Wing Downwash and Dynamic Pressure at the Tail
The large streamlive curvature produced by the blown wing was expected
to generate large downwash angles in the tailplane vicinity, which would
result in some loss of dynamic pressure at the tail. To investigate the
downwash, the horizontal tail was removed and three thin wires with cotton
tufts attached were strung from tunnel floor to ceiling with the tufts at
the horizontal tail quarter-chord location (when a = i = 0 deg) at threes
spanwise positions:
y,in. y/0.5bT £, in. C in.
y/0110.22
2.92 0.200 33.03 10.22
6.27 0.429 34.94 8.68 (tail MAC)
14.62 1.000 39.75 4.68 (tip)
where t.= longitudinal distance from 0.253 -6 of the wing to the respective
tail quarter chord. The tail root chord at the fuselage centerline (y=0)
is 11.69 in. and the tail quarter-chord line intersects the fuselage at
y = 1.85 in. or y/0.5b = 0.127. Photographs were taken of these tufts atT
q = 15 psf over a range of fuselage incidence and momentum coefficient.
Figure 30 shows several sample photos, where the most forward appearing
wire is at the y/0.5b = 0.200 spanwise station and the most aft atT
y/O.5bT = 1.000. The white stripe on the fuselage represents the horizontalStail chord location; the two parallel lines on the fin are located at 0.5CTand 1.0 -T above the chord plane. The shorter stripes perpendicular to
the chord line represent the tail quarter-chord positions at the three
spanwise locations. The angles between the tufts and the tail chord line
at these positions are the local tail angles of attack aT and were measured
directly from the photos. The fuselage incidence a (corrected for tunnel
induced effects as discussed in the Appendix) was obtained from recorded
data and the local downwash calculated as the difference:
15

where wing incidence relative to fuselage is i = 0 deg. These data forw
the three spanwise positions are shown in Figure 31, which shows curves
faired through data obtained independently from the photos by two investi-
gators. Large downwash angles at the tip are evident, and local values of
de/dc approach 1.0 with increasing C . However, data at the tail MAC show
reduced local downwash and dE/da decreasing with increased C. The 0.200station shows increased downwash relative to the MAC location. These data
show that the tail span is immersed in a largely varying downwash field due
to the vorticity from both a very strong outboard (wing tip) vortex and an
inboard vortex at the wing-body juncture. Attempts to derive an effective
downwash for the entire tail from existing data, tail-on and tail-off,
yielded values similar to those measured at the tail MAC but were based on
several unsubstantiated assumptions (such as qT/q = 0.95). An attempt to
evaluate the dynamic pressure at the tail plane was undertaken by installa-
tion of a pitot-static probe at the tail MAC spanwise location (y/0.5b =
0.429) with its measuring station approximately 0.16 ET ahead of where the
tail leading edge would normally be. The probe was later mounted on the
antenna pod near the top of the vertical fin (1.03 _T above the first
location on the chord line) with the measuring station at about midchord of
the fin and lateral location at y/O.SbT = 0.335. Figure 32 shows these
results, where a loss in dynamic pressure of up to 45 percent of the free-stream value is seen. At the antenna pod location, losses of only 10 percent
or less are observed, confirming the fact shown by the tuft pictures that
there is little flow deflection or dynamic pressure loss at this high
position. Considering that the pitot-static probe may be somewhat inaccurate
in the high angularity of the downwash field, these results, nevertheless,
indicate that the tail will be operating in a flow field adverse to the
generation of the large moment needed for longitudinal trim. Whereasrelocation of the horizontal tail on the top of the vertical fin appeared
an obvious and effective solution, the cost of doing so on the flight
demonstrator was prohibitive. As an alternative, an investigation to improve
the existing all-moving stabilizer was undertaken.
16

Phase I Horizontal Stabilizer Development
In this segment of the investigation, the main objective was to first
determine the performance of the existing stabilizer, and if inadequate,
to determine what modification could be made to provide trim over a range
of C up to 0.30, and tail incidence from -24 deg (LE down) to +10 deg. The
nominal and actual measured values of stabilizer incidence relative to the
fuselage reference line are as follows:
nominal is, deg measured is, deg
+10 10.18
+ 7 7.20
+ 3 2.82
0 - 0.18
- 5 - 5.10
-10 - 9.97
-15 -15.37
-18 -18.13
-24 -23.95
Table 2 lists the various configurations tested during Phase I of rhe
investigation, most of which are shown in Figure 33. Whereas the range of
C and stabilizer incidence varied, a comparison of configurations is made
here for C. = 0.10 and 0.20 at i = -18 deg (Figures 34 and 35). Theconventional horizontal tail airfoil sections vary from NACA 64AO07Mod at
the tip to 64AO09Mod at the root, the modification consisting of a slight
leading edge inverted droop and an enlarged leading edge radius. Even
though these modifications should prove favorable, this tail (Configuration
46) is stalled over most of the aircraft incidence range in Figure 34 and
cannot provide the nose-up pitch to return CM0 .253 to zero for trim. An
attempt to reduce the leading edge stall by use of an inverted leading edge
slat deflected -27 deg (Configuration 50) helped little, as shown in
Figure 35. However, when combined with a 20-percent tail chord extension
deflected upwards -20 deg (denoted Flap 1, Configuration 51), considerable
4 •pitch improvement resulted. Realigning the slat trailing edge relative to
17

the airfoil leading edge and deflecting the slat to -33 deg (Configuration
52) produced additional moment and reduced the stall somewhat at lower C
Additional chord extention or upward deflection (Configurations 61, 62, and
63) produced more than enough pitch to trim the aircraft up to CL 3.42 at
C =0.20.
Additional improvements in reducing tail stall were obtained by
reducing the inboard wing vortex by either removing the inboard wing fence
(Configuration 54) or by removing the engine inlet and exhaust plugs so that
flow through the engines could exit into and dissipate the vortex (Configu-
ration 55). Also, a fairing blending the outboard end of the tail slat into
the tip cap provided an effective droop (Configuration 58) and stall
alleviation. Changes which proved detrimental-included fences on the tail
(Configuration 56) and a spanwise extension of the tail (Configuration 64,
which put more tail surface into the tip vortex). An attempt was made to
add additional mass flow into the inboard vortex by simulating the jet
exhaust with a 5/8 in. O.D. tube mounted inside the flow-through engine
channels. Located upstream of the exit, the tube entrained air through the
engine inlet; but due to the tube's small size, the 90-psig supply pressure
was reduced to approximately 1.75 psig maximum pressure at the jet exhaust
exit with a very nonuniform pressure distribution across this exit.
Providing a measured thrust coefficient of less than 0.03, the test was not
very representative of full scale, and the effects (Configuration 65) were
somewhat detrimental in Figures 34 and 35, probably due to the poor exhaust
characteristics. Thus, at the end of Phase I, the tail which most appeared
to provide sufficient trim capability with a minimum of leading edge stall
was Configuration 63, the inverted camber airfoil with a -33 deg slat
deflection, a -25 deg deflection of a 0.40c tail chord extension, and a tip -T
droop and fairing; see Figure 33.
Aft Center-of-Gravity MovementAdditional data taken for the Configuration 63 horizontal stabilizer
showed that the nose-down moment associated with C > 0.22 could not be
trimmed near Cmax with the existing maximum stabilizer deflection of
-24 deg. Furthermore, attempts at obtaining additional tail download by Tgreater deflection of the extended tail chord (such as Configuration 62 in
18

Figure 34) produced larger regions of leading edge stall due to increased
circulation around the tail. To reduce the untrimmed moment, the aircraft
center of gravity was shifted aft to the 0.35c point. Figure 36 shows the
destabilizing effect on the tail-off data of Figure 12; but as Figure 37
shows, the increased tail size aptly counteracts this tendency. The aft
cg. position provides additional nose-up moment that allows trimmed CLmax
of 4.3 at C = 0.30 and is = -19 deg (see section on trimmed data, p. 22).
The stability level is reduced from that at the 0.2537 c.g. location, but
as Figure 37 shows, it is still considerably greater at 0.35- than the
standard A-6A high lift configuration with xcg = 0.253E. The one exception
is for C, = 0, where the aft c.g. position is slightly less stable than the
conventional A-6 (dC /dC = -0.102 compared to -0.111). However, the aftM Lposition appears quite satisfactory for all values of C including 0, and
will thus serve as the reference location for the remainder of these
investigations.
Phase II Horizontal Stabilizer Modifications
Although the final tail configuration of Phase I appeared aerodynamic-
ally adequate, the structural aspects posed some problems. The 0. 4 0cT flat
plate flap attached at 25 deg deflection to the sharp trailing edge of the
conventional tail presented the problems of large moments and loads at the
thin attachment point, as well as an unsupported lengthy flat plate, which
would probably bend and possibly vibrate. To reduce these problems, the
various configurations of Figure 38 were investigated to find a more
suitable structural shape which would provide aerodynamic characteristics
similar to Configuration 63. For all configurations, the -33 deg slat
deflection and tip droop and fairing were retained. Figures 39 and 40
present the moment data for those configurations tested, where Configuration
68 is the reference shape from Phase I (Configuration 63), deflected to
i = -15 deg. Initially, a shortening of Flap 4 to 0.20c (Flap 5) reduceds Tthe download on the tail to the point of not being able to trim at C, = 0.30.
A configuration suggested by Grumman involved removal of the existing 0. 2 0cT
honeycomb trailing edge structure from the conventional tail, insertion of
2 a cambered section, and reattachment of the trailing edge at a -25 deg
deflection, providing a highly cambered and thicker trailing edge structure.
19
____ ____ ____ ___ ____ ____ _ S

I
These shapes are called GAC-l, -2, and -3, and provide an effective chord
increase of either 0.lOc or 0. 2 7 4 cT, the lengths of the trailing edgeT T
extensions when projected onto the original chordline. The GAC-l shape
provided somewhat more download than Flap 5, but the increased flap length
of GAC-2, and -3 provided ample trim up to and including C, = 0.30. The
effect of increasing the leading edge radius on the main tail airfoil (not
the slat) is shown by comparing Configurations 104 and 105 as well as
Configurations 119 and 120. In both casea, the increased radius reduces
tail stall. Also, note that Configurations 101 through 120 employed the
fuselage drag brakes deflected to 60 deg (see Drag Generation, p. 26)
which produced a flow field modification sufficient to cause large regions
of tail stall, especially at higher C . Retracting the drag brakes reduces
or eliminates this stall (Configurations 68 and 121).
Phase III Horizontal Stabilizer Modifications
After a complete range of momentum coefficients and tail settings had
been investigated for the GAC-3 tail, it became apparent that two rather
serious problems existed with that configuration, as shown in Figure 41.
With CP = 0, the cambered tail provided so much download and nose-up pitch
that the aircraft could not be trimmed with its maximum upper deflection of
B +3 deg (later found to be limited to only +1.5 deg on the flight demonstra-tor). Also, at the large downwash angles associated with high blowing, the
Scirculation around the tail at is = -24 deg further reduced tail stall
angles such that the tail was stalled over more than 90 percent of the air-
craft incidence range. The tail was over-designed, and the Phase III effort
was undertaken to reduce the effective camber and the associated leading
edge stall. Figure 42 presents the configurations investigated. A 40-
percent chord trailing edge extension deflected -10 deg (EC-40-10-D) was
found to trim CLmax = 4.0 at C = 0.30, while still trimming CL > 0.44 at
C =0 with maximum upward deflection of +3 deg. Variations were made in
the leading edge slat angle (reduced angle of -27 deg being denoted RA),
in sealing the slat gap (denoted -SS), and in converting the slat to a
drooped leading edge with increased radius (denoted -D). The drooped
configuration was felt to be the simplest to construct, and thus became
the final configuration, as pictured in Figure 42. Note that the
20

stabilizer tip fairing and droop, as well as the increased leading edge
radius on the stabilizer main airfoil, were removed from all the configura-
tions of Phase III.
Phase IV Horizontal Stabilizer Modifications
Phase IV was undertaken to develop the final Phase III tail into a more
structurally-feasible configuration with better performance in the unblown
flight mode. Figure 43 presents the trailing edge configuration suggested
by Grumman to replace the flat plate deflected trailing edge of Configura-
tion EC-40-10-D. The fairing between the airfoil surface at x = 0.556cT
and the trailing edge of the flat plate has been sized to produce slightly
less effective camber (and thus the ability to trim at lower C ) than
EC-40-10-D. This configuration, GAC-6, has a reduced trailing edge mean
line deflection of -6.25 deg but an increased effective chord length of
0.630c As Figure 44 shows, this allows trim down to C = 0.2. (Trim atT* L
this low CL is necessary for unblown climb and descent to and from flight
test altitude because available maximum stabilizer incidence on the test
aircraft is +1.5 deg, and because power effects are believed to require
additional positive tail deflection to trim.) Tuft studies of flow overthis tail at is =+3 deg and C,= 0 showed regions of separation and
unsteadiness behind the leading edge of the inverted droop. These were
reduced or eliminated by reducing the droop angle to approximately -25 deg,
Configuration GAC-6RA. This was then accepted as the final tail configura-
tion for the flight demonstrator. The slightly reduced longitudinal
stability (d CL = -0.028 at x = 0.35c compared to -0.044 for theconventional tail on the standard A-6A approach configuration at x -cg0.2537 and is = +3 deg) can be increased to -0.050 by forward movement of
the c.g. location to 0.32r (Figure 45). A forward c.g. shift will occur in
flight as the landing gear is retracted and as fuel transfer is performed.
Figure 45 also indicates the neutral point location for i = +3 deg to beS
around x 0.387u.cg
Final Horizontal Tail Configuration
Based on the capability to trim both the high lift blown case and
reduced lift unblown case, the GAC-6RA horizontal stabilizer was chosen for
J H i21

use on the flight demonstrator. Constructed on the existing A-6A all-moving
stabilizer rotating at the existing torque-tube location, this tail has
the leading and trailing edge modifications shown in Figure 43. No addi-
tional outboard tip droop or fairing has been added. The existing incidence
range (-24 deg < i < +1.5 deg) will be used unless additional analyses of
power effects or required maneuver margin indicate the need for re-indexing
to provide more leading-edge-up throw. To aid in proper position of the
c.g. during flight tests, gear should probably remain down (aft c.g.) during
higher blowing runs and retracted during unblown runs.
TRIMMED AERODYNAMIC DATA
As the above tail development phases were being conducted, the tail
developed in each phase was tested over a range of tail incidence and
momentum coefficient to determine its trim capabilities. In most cases,
these runs exposed the limitations of each tail. Such was especially the
case in Phase I, where the optimum lifting surface exhibited large nose-
down pitch. The trim capability of the final tail configuration (Slat 2,
Flap 4) of Phase I is shown in Figure 46 for the two c.g. positions tested.
For the forward c.g. location, trimmed CLmax was limited to 3.68 as the
tail lower incidence limit of -24 deg was reached. At the aft location,
C 4.28 could be trimmed at the C limit of 0.30, but CLmax < 2.25Lmax 1' ma(and reduced CL at lower a and C ) was unobtainable as the positive tail
incidence limit of 1.5 deg was encountered. In addition, for CL < Cmax,
a number of problems were related to tail stall at lower aircraft incidence
and higher C . In general, a less than operational set of trim data could
be found in Phase I, even though quite promising trimmed values of CLmax .
were attained.
The trimmed lift and drag coefficients obtained with the GAC-3 tail
of Phase II are shown in Figure 47 and compared with the conventional A-6A
in the trimmed approach configuration. Greater than 110-percent improvement
in CLmax is achieved at C. = 0.30. Figure 48 shows variation in trimmed
lift and drag with C . From the data of Figure 49, it is seen that the
large camber of the tail requires positive tail settings greater than the
+1.5-deg upper limit in order to trim C of less than approximately 2.7 toL
2.9. This proves to be a problem for the low and no blowing cases and, as
22
El

shown in Figures 47 to 49, makes a large region of the trimmed data
unobtainable with this tail incidence range on the flight demonstrator.
Re-indexing of the horizontal tail to allow a higher upper limit is apossible solution, but would probably produce flow separation from the tail
leading edge at such high local incidence. The alternative of further tail
modification to somewhat reduce available download was thus chosen.
Figures 47 and 48 point out some benefits discussed in Reference 11for this type of blown high lift system. The blown drag polars, composed
primarily of induced drag, are substantially higher than that of theconventional A-6. This will offset engine thrust, allow equilibriumapproach at higher power settings, bleed rate and descent angles, andreduce engine spin-up time in the event of a wave-off. Unlike many blown
high lift systems, very little jet thrust recovery results. Thus, Li,#speed, steep glide slope approaches are possible. As Figure 48 indicates,maximum lift augmentation occurs at C values of 0.15 or less, which are
within the limits that should be obtainable from bleed of many existing
turbine engines. The system thus appears feasible for a number of existingaircraft without large powerplant modifications. Also, lift achieved from
blowing rather than high aircraft incidence should offer considerable
improvement in pilot visibility on approach.
In Phase III, thorough ranges of C and is values were run to determinetrim characteristics of the sealed slat tail (EC-40-10-SS); however, aspreviously discussed, the drooped leading edge configuration (EC-40-10-D)
was chosen as the final configuration. The drooped tail gives slightly
more download than the sealed slat (see Figure 41), but the characteristics
are otherwise quite similar. For this configuration, the trimmed lift anddrag are presented in Figure 50 (in comparison to the standard A-6A data 8' 1 2)
and tail incidence required to trim in Figure 51. Whereas the drooped tail
results in very slight losses in trimmed CLmax relative to the GAC-3 tailof Figure 47 (losses of 0.09, 0.07, and 0.14 for C = 0, 0.10, and 0.30,respectively), almost the entire range of C and a in Figure 50 can be
trimmed within the existing stabilizer travel range, and an increase of104 percent in trimmed CLma over the standard A-6A is still obtained.
LmxFigure 30 also indicates representative approach conditions, where the
more conventional multiples of Vstall are shown in comparison to a criterion
23K

suggested by Grumman for STOL approach: a a=ta - 10 deg. This provides
an allowance for 10 deg of gust upwash, yet does not penalize the high C
cases by taking a fixed percentage of Ca. Figure 52 presents trimmed
lift-to-drag ratio in comparison to that of the standard A-6A, in both
clean and approach configurations. Also shown is an equivalent lift-to-drag
ratio where the equivalent drag (CDe = CD + C ) attempts to account for the
momentum expended to obtain the lift, but makes no assumption on internal
pressure losses, nozzle efficiencies, etc. These lift-to-drag ratios are -
seen to decrease with increased blowing and at higher lift coefficients.
The Phase IV data was run only for the C, = 0 case since the primary
objective of this phase was to develop the tail for unblown flights.
Figure 44 compared at i = +3 deg the pitch characteristics of the threeS
configurations tested; Figure 53 compares lift and pitch for those configu-
rations at various tail settings and C = 0, and Figure 54 presents the
unblown drag polars for this final Phase IV configuration. The trimmed
lift and drag data are presented as Figure 55 where the blown values are
adjusted from the EC-40-10-D tail data of Figure 50. The difference between
the two tail configurations occurs in the stabilizer setting required to
trim, Figure 56 compared to Figure 51. For the GAC-6RA tail at C, , =.
the 1.5-deg stabilizer upward travel limit only allows trim for CL greater
than 0.58 (which can be reduced to 0.38 if the c.g. is moved forward to0.32-). This 0.58 minimum trimmed C value results in an increase of 33.2
Lknots in equilibrium trimmed speed obtainable in the unblown flight testconfiguration weighing 34,000 lb and flying at sea level, in comparison
to the 147.7 knot speed due to the EC-40-10-D minimum CL of 0.87. The L/D
of the unblown configuration is plotted in Figure 57, where the conversions
to full scale and gear retracted provide an improved aerodynamic efficiency.Since the flight demonstrator will have its high lift devices locked in the
deployed position, C = 0 becomes the minimum drag case and corresponds to
the configuration for climb to and descent from test altitude as well as
cross-country ferry. The maximum CL trimmed with -24-deg tail incidencewas reduced slightly from 3.96 for the EC-40-10-D tail to 3.89 for the
GAC-6RA configuration, resulting in an increase in minimum obtainable stallspeed of only 0.62 knots at sea level for a 34,000-lb aircraft. The net
effects of the GAC-6RA tail are thus an expanded flight envelope and a
24 1

configuration which is structurally more feasible. In addition, flow
separation at the leading edge at positive i has been eliminated.5
In Phase V, the GAC-6RA tail was retained, but a number of changes to
the wing were made as discussed earlier to convert the model to the actual
flight demonstrator being construceted by the contractor. Figure 58 shows
the effect of horizontal tail deflection on lift, drag, and pitch; these
curves are used to establish the trim lift and drag data of Figure 59 and
the tail incidence required to trim in Figure 60. Apparently, the reduced
blowing span has increased the effective downwash at the tail, because a
comparison of Figures 60 and 56 ishow the same trimmed lift in Phase V
achieved with 1 to 2 degrees less3 negative tail incidence. Due to this,
the horizontal stabilizer (already completed by the contractor) could not
trim CL < 0.82 with blowing off, and thus the incidence had to be readjusted
on the flight demonstrator to a new range, -21.5 deg < i < +4 deg. However,this produces no change in the trimmed maximum CL = 3.89 for Phase IV and
allows trimmed minimum CL down to 0.28 at C = 0 (corresponding to a maximum
trimmed speed of 260.3 knots for a 34,000-lb aircraft at sea level).Trimmed lift-to-drag ratios are presented in Figure 61. Thus the final
flight test configuration can achieve trimmed CL from 0.28 to 3.89 and
exhibits a slightly expanded flight envelope over the Phase IV model.
GROUND EFFECT
The flight test goal of demonstrating STOL operations with the testbed
'V aircraft required that a knowledge of its behavior in ground effect be
available. To accomplish this, the fixed ground plane shown in Figure 62
was installed at various heights below the model in Phase II, with the gear
down and the GAC-3 horizontal stabilizer installed. The test technique and
tunnel corrections employed are discussed in the Appendix. A collection of
data for powered lift aircraft operating in ground effect is presented inReference 13. As also reported by Stevens and Wingrove, 14 ground effect may
be adverse at high incidence and CL; however, favorable effects frequently
occur at the more moderate lift and incidence values that are characteristic
of actual takeoff and landing. The adverse conditions are primarily associ-
ated with jet impingement and stagnation on the ground at low heights, thust •reducing available lift and stall angles. This effect is visably displayed
25

in the tuft photographs of Figure 63, where for C = 0.21 the tufts below
and ahead of the wing are seen to be deflecting forward. Figure 64 presents
trimmed lift and drag data for three ground board heights and the out-of-ground-effect data, where the height h is that of the c.g. above the ground
gat zero aircraft incidence, nondimensionalized by E = 15.388 in. The reduc-
tion in stall angle and CLmax at low height and higher C P is evident; this
dependence on height above the ground plane is plotted in Figure 65 for CLmax,
In this figure, a limit labeled "Turner's Criterion" has been imposed. As
developed by Turner, 15 this criterion defines the combinations of height
above ground and lift below which the fixed ground plane technique generates
data inaccuracies due to interaction between the model flow field and the
boundary layer on the ground board. Thus, the actual losses in CLmax at
higher C are probably not as severe as the data predict. However, as Figure
66 shows, favorable ground effect occurs at lower incidence. Excluding the
data on the limiting criterion line, Figure 66 implies that for almost all
values of C tested at 12-deg incidence or less, the lift in ground effect
is greaiter than that in free air (h /- = -). If the operational limit on
incidence of astall -10 deg is imposed, the flight test aircraft should
never experience an adverse lift loss due to close ground proximity.
The ground effects on drag and pitch should also be considered. As
the drag polars of Figure 64 show, operation at a given lift and CB produces
reduced drag closer to the ground for incidence of astall -10 deg or- less.
This should produce a favorable effect during STOL takeoff. Figure 67
implies that for constant C , approach to the ground results in increased --
nose-down pitching moment for either a constant lift coeffizient or constant o
incidence. This is probably the result of reduced downwash angles producing
less tail download to counteract the pitch, or increased nose-down T itch due
to jet impingement on the ground. The result is a requirement for greater
leading-edge-down stabilizer settings to trim the aircraft near the ground.
DRAG GENERATION
As the data show (for example, Figures 47, 50 and 55), the primary
drag contribution of the CCW high lift system is induced drag due to lift,with negligible reduction in drag due to the resultant thrust component 7-
from the wing jet sheet. Increased blowing produces increased drag, quite
26
: '-

Ii
unlike blown flaps, jet flaps, or upper surface blowing. However, because
descents down steep glide slopes are desirable for STOL approaches and
because higher engine thrust levels are required to produce the bleed air
to power the wing, generation of additional drag may be desirable for
equilibrium STOL flight paths. In Phase I, investigations of additional
drag sources were thus conducted, using the wing of Configuration 39 and
the horizontal tail employing Slat 2, Flap 4, and the faired, drooped tip.
Drag increments due to landing gear, wing store pylons, wing stores (four
300-gallon fuel tanks) and wing tip drag brakes are shown in Figure 68a
for C, = 0. Only the landing gear and the 60-deg drag brakes produce
increments in CDmin of greater than 0.01. Similar trends are seen in
Figures 68b and 68c for C = 0.10 and 0.20. Figure 69 shows the effects
on lift. With blowing applied, both 20-and 60-deg drag brake deflections
produced early stall and a strong buffet; whereas drag was greatest with
these devices at low aircraft incidence, they produced lower CLmax and
thus reduced corresponding drag because of interference with the lifting
surface and tip loading. In equilibrium flight with blowing at high angle
of attack, drag brake deflection would produce stall, lift loss, drag reduc-
tion and resultant aircraft acceleration. At C = 0.20 and presumably
greater, the store pylons and fuel tanks also produced a decrease in stall
angle and some loss in lift and drag. The greatest stall angle, CLmax, and
drag could be obtained by using no drag producing devices other than the
landing gear.
Earlier versions of the A-6A employed fuselage speed brakes which
deflected outward from the fuselage just aft of the engine tailpipes and
thus acted as thrust deflectors. In Phase II, these speed brakes were
deflected 60 deg on the model to determine their aerodynamic effectiveness
as drag devices (the unpowered model does not allow their effects on thrust
to be evaluated). The effect of thie fuselage speed brakes was found to be
very similar to that of the wing tip speed brakes: by interfering with
the inboard wing loading, they produced lower stall incidence and reduced
CLmax, but produced higher drag at incidences below stall. However, a more
severe problem is shown in Figure 70. By protruding into the strong vortex
generated at the wing-fuselage junction, they apparently altered the down-
wash field so that stall of tne horizontal tail occurred over a wider range
27

of aircraft incidence. Thus, fuselage speed brakes were categorized as
unacceptable for use on the flight demonstrator.
POST-STALL AND STALL HYSTERESISTuft studies showed the stall to be from the wing trailing edge,
spreading inward from the fence at the outboard slot end. The unblown wing
tip outboard of this fence was found to stall at aircraft incidence as low
as 3 deg due to the large upwash created by the vortex at that locatio; and
it was because of this stalled region that the fence was a necessity. With
the tufts removed in Phase III, the model was pitched well beyond stall and
then returned to low incidence for several values of C . Figure 71 shows
the results for two blowing rates. The data are pitch-pause static force
data and thus do not include any dynamic components of stall. Due to the
very strong entrainment effect of the jet, the flow reattached itself to
the trailing edge at exactly the same angle of attack at which it had
separated. There was negligible stall hysteresis, as shown by the flagged
symbols and dashed curves, which indicate decreasing incidence returning
from approximately 27.5 deg. In addition, regardless of blowing rate, all
post-stall curves converged on a point (CL , 2.0 at a = 28 deg).
Drag and pitching moment curves of Figures 72 and 73 show additional
post-stall trends. Unlike conventional stalls where flow separation leads
to increased drag, stall of the CCW configuration leads to the reverse
because the jet entrainment prevents large areas of flow separation; induced
drag is thus quite predominant over separation drag. Lift loss beyond
stall thus results in a corresponding drag reduction. For an aircraft which
has approached the stall at equilibrium thrust, velocity, and C levels,
exceeding the stall angle will result in reduced drag and thus an excess ofthrust which will accelerate the vehicle. Increased velocity will result
in reduced C and assist in recovery from the stall. Note also that there ois negligible hysteresis in the drag polars as angle of attack is reduced.
For C = 0.30, higher incidence beyond stall produces less drag than low
incidence prior to stall. Pitching moment exhibits a post-stall trend
towards nose-up values, but this eventually reverses itself at higher inci-
dence until, for C = 0.30, the pitch eventually decays to zero. As theaircraft accelerates after stall, reduced results in reduced moment to
28
SJ.

trim once the prestall portion of the curve is reached (for examles, see
Figures 12, 17, and 58), and thus the stall recovery should be less
difficult.
SPLITTER FLAP
While the high induced drag levels associated with the CCW rounded
trailing edge are quite beneficial in steep STOL landing approaches, on
takeoff they may degrade aircraft acceleration and short takeoff potential
in spite of the high lift availability. Optimum takeoff techniques have
not yet been determined, but initial analysis indicates this problem my be
overcome by not turning on the blowing until near the takeoff speed
corresponding to the high blown lift obtainable with CCW. As an alternative,
a splitter flap attached to the rounded trailing edge was proposed in an
attempt to reduce drag by increasing the thrust recovery during takeoff.
Figure 20 shows this configuration as applied to and tested on the Phase V
model. The 45-deg flap deflection relative to the chordline was found to
be most effective for this type of blown application.16 The flap length is
0.0726C, equal to the trailing edge diameter, so that an operational device
could be retracted along a radius of, and stored within, the rounded
trailing edge. The dummy yaw jets were removed, and as, Table 6 shows, the
configuration employed the final Phase V flight demonstrator wing, fuselage,
and tail. Figure 74 presents lift, drag, and pitching moment coefficients
for the splitter flap tested with three horizontal tail settings and three
blowing rates. In Figure 75, comparison of tnese data to the final Phase V,
CCW configuration (from Figure 58) indicates an increase in unblown lift
due to the cambering effect of the splitter plate, but a reduction in total
lift for C = 0.10 and 0.30 since the splitter plate limits aft stagnation
point movement to 135 deg from the slot. As blowing is applied, the lift
improvements due to CCW become evident: COW at C = 0.05 achieves the same
1 lift as the splitter flap at C, = 0.10,and CCW at C = 0.10 achieves the
same lift as the splitter flap at C = 0.30, The drag data imply that at
fixed C Pand a the splitter flap has considerably lower drag levels than
CCW for C greater than 0. This drag reduction is not totally due to
splitter flap thrust recovery, because the comparisons are at unequal liftI - •values and induced drag due to lift is the predominant drag component. At
29_

constant values of CL (as denoted on the drag curves) the splitter dragreduction Is not as significant. For example, CL = 3.0 can be obtained by Kthe splitter flap at C = 0.30, a = 16.1 deg, and CD = 0.503, or by the CCW
D;
at C of only 0.10, a 13.2 deg, and CD = 0.838. Whervs the 40-percent
reduction in drag due to the splitter flap appears large, it requires three
times the momentum coefficient, which will result in considerable thrust
loss due to bleed and thus offset the drag reduction. It is thus not clear- Icut which system is to be preferred for takeoff. Up to CL = 3.0, the
splitter flap results in reduced drag at higher required mass flow, while
lift coefficients above 3.25 are unobtainable by the splitter flap. It
does appear that considerable reductions in drag (and recovery of thrust
loss due to bleed) may be obtained by operating the CCW at lower C and
higher a to achieve a desired CL for takeoff.
LATERAL AND DIRECTIONAL CHARACTERISTICS
A significant amount of data was generated to verify the lateral and
directional stability and control as well as handling qualities. The
specifics cf the investigations conducted are listed in Tables 2 through 6,
and a brief discussion and some data are presented in Reference 11.
CONCLUSIONS AND RECOMMENDATIONS j
Wind tunnel investigations were conducted on a 1/8.5-scale model of
the A-6/Circulatior. Control Wing flight demonstration aircraft in order to
confirm the high lift capability of the concept, to improve the lifting and
control surfaces of the testbed aircraft, and to provide supporting data to
assure safety of flight and adequate handling of this aircraft. Results
of this effort have provided the following conclusions: T* Two-dimensional data yielded section lift coefficients as high as
6.5, while the three-dimensional data showed that the best CC wing
configuration examined could multiply C by a factor of 2.2 compared to T
that of the conventional A-6A high lift configuration.
* Wing and horizontal stabilizer configurations were developed to I •simplify the actual aircraft modifications, reduce costs, increase the range
of parameters obtainable in the trimmed full scale flight envelope, and pro-
vide adequate aircraft handling. Whereas this reduced the maximum trimmed
30
aerodynamic lift coefficient from 4.1 to 3.9, it provided a greatly expanded
flight envelope that otherwise could not have been obtained.
e Aft c.g. shift to 0.35C to allow trim over this expanded envelope
resulted in greater longitudinal stability than the conventional aircraft
with c.g. at 0.253c.
9 Effects of Reynolds number and slot height variations were
investigated to aid performance predictions for the full-scale aircraft,
and the effects of imperfections in the rounded trailing edge were studied.
* Model operation in ground effect showed that for the anticipatedrange of C and aircraft approach incidence less than astall - 10 deg, lift
in ground effect was al'ays greater than in free air; just the opposite was
true for drag.
* In general, because of the predominance of lift-induced drag, drag
generating devices such as wing tip and fuselage drag brakes proved detri-
mental and unnecessary for STOL operations because of their interference
with the wing flow field.
* Post-stall and stall hysteresis investigations revealed virtually
no hysteresis effects as a result of the very strong flow entrainment
properties of the CCW trailing edge.
* A blown splitter flap showed significant reductions in drag under
certain conditions and could be a beneficial configuration for thrust
recovery during short takeoffs.
The following recommendations are suggested by the above investigations:
* Aircraft flight and control characteristics should be input to a
flight simulator to be flown by project test pilots before aircraft first
flight.
* A smaller, more efficient horizontal stabilizer, perhaps employing
leading edge or spanwise blowing, should be developed before consideration
of the CCW on an operational aircraft. Canards might also be considered as
trim devices to reduce nose-down pitch.
a Optimizations of short takeoff configuration ard piloting to'hnique
should be undertaken.
S31;L

In general, the presented results confirm the high lift capability of
the Circulation Control Wing concept, and should provide a very adequate
data base upon which to construct and fly the A-6 demonstrator aircraft.
32
I?
I
1 32

S'REFERENCES
1. Stone, M.B. and R.J. Englar, "Circulation Control - A Bibliographyof NSRDC Research and Selected Outside References," NSRDC Report 4108, AD775-284 (Jan 1974).
2. Englar, Robert J., "Subsonic Wind Tunnel Investigation of the HighLift Capability of a Circulation Control Wing on a 1/5-Scale T-2C AircraftModel," NSRDC Report ASED-299, AD 781-856 (May 1973).
3. Englar, Robert J., "Investigation Into and Application of theHigh Velocity Circulation Control Wall Jet for High Lift and Drag Generationon STOL Aircraft," AIAA Paper 74-502 presented at the AIAA Seventh Fluidand Plasma Dynamics Conference, Palo Alto, California (17-19 Jun 1974).
4. Englar, Robert J., "Subsonic Two-Dimensional Wind Tunnel Investiga-tions of the High Lift Capability of Circulation Control Wing Sections,"DTNSRDC Report ASED-274 (Apr 1975).
5. Englar, Robert J., "Circulation Control for High Lift and DragGeneration on STOL Aircraft," AIAA Journal of Aircraft, Vol. 12, No. 5,pp. 457-463 (May 1975).
6. Riebe, J.M., "A Correlation of Two-Demensional Data on LiftCoefficient Available with Blowing-, Suction-, Slotted-, and Plain-FlapHigh Lift Devices," NACA RM L55D29a (Oct 1955).
7. Englar, R.J. and R.M. Williams, "Test Techniques for High Lift
Two-Dimensional Airfoils with Boundary Layer and Circulation Control forApplication to Rotary Wing Aircraft," Canadian Aeronautics and Space Journal,Vol. 19, pp. 93-108 (Mar 1973).
8. Giangrande, G., "Application of the Calderon Flap to a Carrier-Based Jet Aircraft," Grumman Aircraft Engineering Corporation ReportFSR-427-1 (Apr 1968).
9. Englar, Robert J., "Experimental Investigation of the High VelocityCoanda Wall Jet Applied to Bluff Trailing Edge Circulation Control Airfoils,"NSRDC Report ASED-308, AD 771-690 (Jun 1973). Also published as M.S.Thesis, University of Maryland, Department of Aerospace Engineering(Jun 1973), and as DTNSRDC Report 4708 AD-A-019-417 (Sep 1975).
10. Englar, Robert J., "Two-Dimensional Subsonic Wind Tunnel Tests ona Cambered 30-Percent-Thick Circulation Control Airfoil," NSRD]' ReportASED-201, AD 913-411L (May 1972).
11. Englar, R.J., L.A. Trobaugh, and R.A. Hemmerly, "STOL Potential ofthe Circulation Control Wing for High-Performance Aircraft," AIAA Journalof Aircraft, Vol. 15, No. 3, pp. 175-181 (Mar 1978).
Si33

12. Ettinger, John, "A-6E Basic Aerodynamic Data Required forSubstantiation of the 1971 Standard Aerodynamics Characteristics Charts andthe 1971 NATOPS Flight Manual," Grumman Aircraft Engineering CorporationReport XA128-105-26 (Apr 1971).
13. Campbell, J.P., J.L. Hassell, and J.L. Thomas, "Recent Research onPowered-Lift STOL Ground Effects," AIAA Paper 77-574, li "A Collection ofTechnical Papers," AIAA/NASA Ames V/STOL Conference, Palo Aito, CA, pp.47-56 (Jun 1977).
14. Stevens, V.C. and R.C. Wingrove, "STOL Ground Effects Determinedfrom Flight Data," AIAA Paper 77-576 presented at AIAA/NASA Ames V/STOLConference, Palo Alto, CA (Jun 1977).
15. Turner, Thomas R., "A Moving Belt Ground Plane for Wind TunnelGround Simulation and Results for Two Jet-Flap Configurations," NASA TND-4228 (1967).
16. Stevenson, J.A. et al., "Wind-Tunnel Study of a Circulation-Controlled Elliptical Airfoil," AIM Journal of Aircraft, Vol. 14, No. 9,pp. 881-886 (Sep 1977).
A
tt
34
------ ---- [-
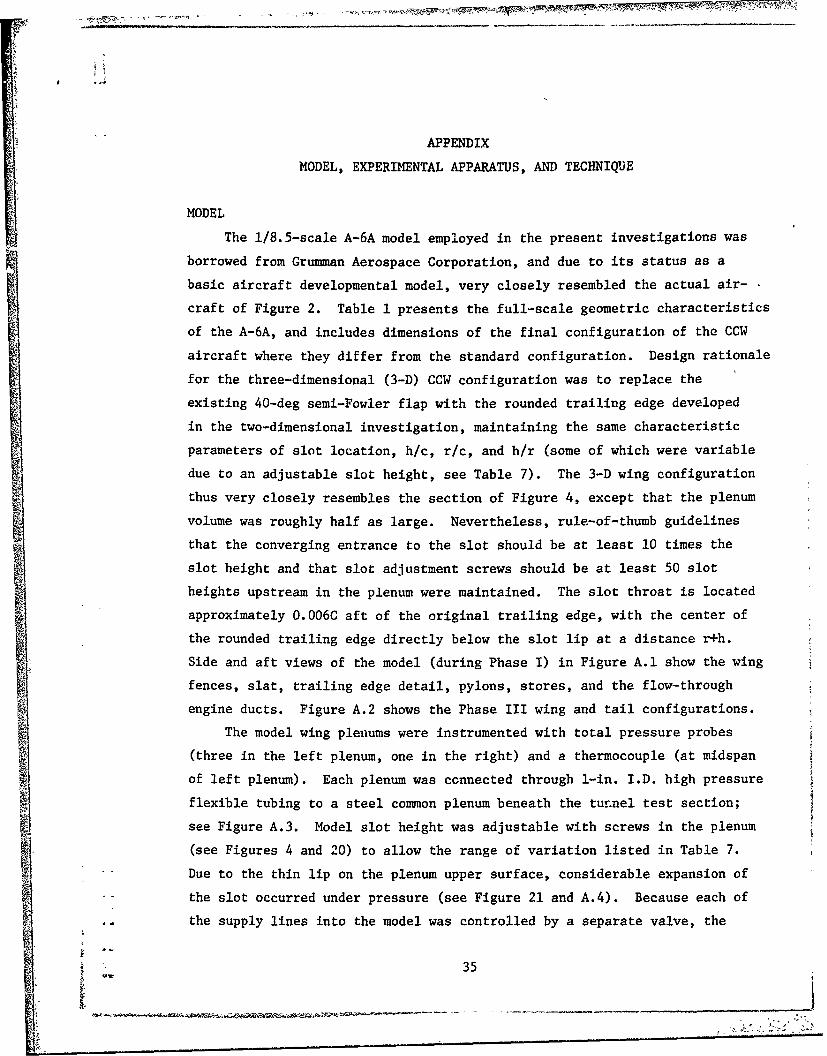
APPENDIX
MODEL, EXPERIMENTAL APPARATUS, AND TECHNIQUE
MODEL
The 1/8.5-scale A-6A model employed in the present investigations was
borrowed from Grumman Aerospace Corporation, and due to its status as a
basic aircraft developmental model, very closely resembled the actual air-
craft of Figure 2. Table 1 presents the full-scale geometric characteristics
of the A-6A, and includes dimensions of the final configuration of the CCW
aircraft where they differ from the standard configuration. Design rationale
for the three-dimensional (3-D) CCW configuration was to replace the
existing 40-deg semi-Fowler flap with the rounded trailing edge developed
in the two-dimensional investigation, maintaining the same characteristic
parameters of slot location, h/c, r/c, and h/r (some of which were variable
due to an adjustable slot height, see Table 7). The 3-D wing configuration
thus very closely resembles the section of Figure 4, except that the plenum
volume was roughly half as large. Nevertheless, rule-of-thumb guidelines
that the converging entrance to the slot should be at least 10 times the
slot height and that slot adjustment screws should be at least 50 slot
heights upstream in the plenum were maintained. The slot throat is located
approximately 0.006C aft of the original trailing edge, with the center of
the rounded trailing edge directly below the slot lip at a distance r+h.Side and aft views of the model (during Phase I) in Figure A.1 show the wing
fences, slat, trailing edge detail, pylons, stores, and the flow-through
engine ducts. Figure A.2 shows the Phase III wing and tail configurations.
The model wing plenums were instrumented with total pressure probes
(three in the left plenum, one in the right) and a thermocouple (at midspan
of left plenum). Each plenum was connected through 1-in. I.D. high pressure
flexible tubing to a steel common plenum beneath the tunnel test section;
see Figure A.3. Model slot height was adjustable with screws in the plenum
(see Figures 4 and 20) to allow the range of variation listed in Table 7.
S-Due to the thin lip on the plenum upper surface, considerable expansion of
- - the slot occurred under pressure (see Figure 21 and A.4). Because each of
the supply lines into the model was controlled by a separate valve, the
35 ________________________________

flows into the plenums were independently adjustable to assure balanced
lift between the wings and to later test the roll control capability of
differential blowing.
TEST APPARATUS AND TECHNIQUE IThe three-dimensional investigation was conducted in the DTNSRDC
8- x 10-Foot North Subsonic Tunnel (Figure A.3). The model was mounted on
a main strut and a pitch strut, as shown in Figures 8, 9, A.2 and A.3, with
the 6.24-ft wing span located horizontally in the 10 ft width of the tunnel.
Air was supplied through 1.5-in. I.D. flexible tubing which connected to
the steel common plenum, then through the two separate 1.0-in. I.D. lines
into the model wing plenums. Mass flow into the model was measured by a
venturimeter located in the supply line; the system was capable of a maximum
of 2 lb/sec flow.Six-component data from the balance frame were recorded by strain gage
flexures located on Toledo mechanical balances attached to the frame. The
strain gage signals were fed into and processed by a Beckman 210 high-speed
data system, which digitized and recorded them on magnetic tape for later
reduction on an XDS-930 digital computer. For each data point, the Beckman
system recorded all data 10 times over a 5-sec interval (to denote any
unsteadiness), and then took the average of those. Data from the Toledo
scales were automatically recorded for each data point and were punched on
paper tape as a check on the electrical data system.
The jet momentum (blowing) coefficient was calculated as:
;V.c11 = -- -..
s qS
where the mass flux (m) was recorded by the venturimeter and the jet velocity
was calculated assuming an isentropic expansion from wing plenum total
conditions to freestream static conditions:
S!P\ 11/2
V a . R M 2 RT j
36
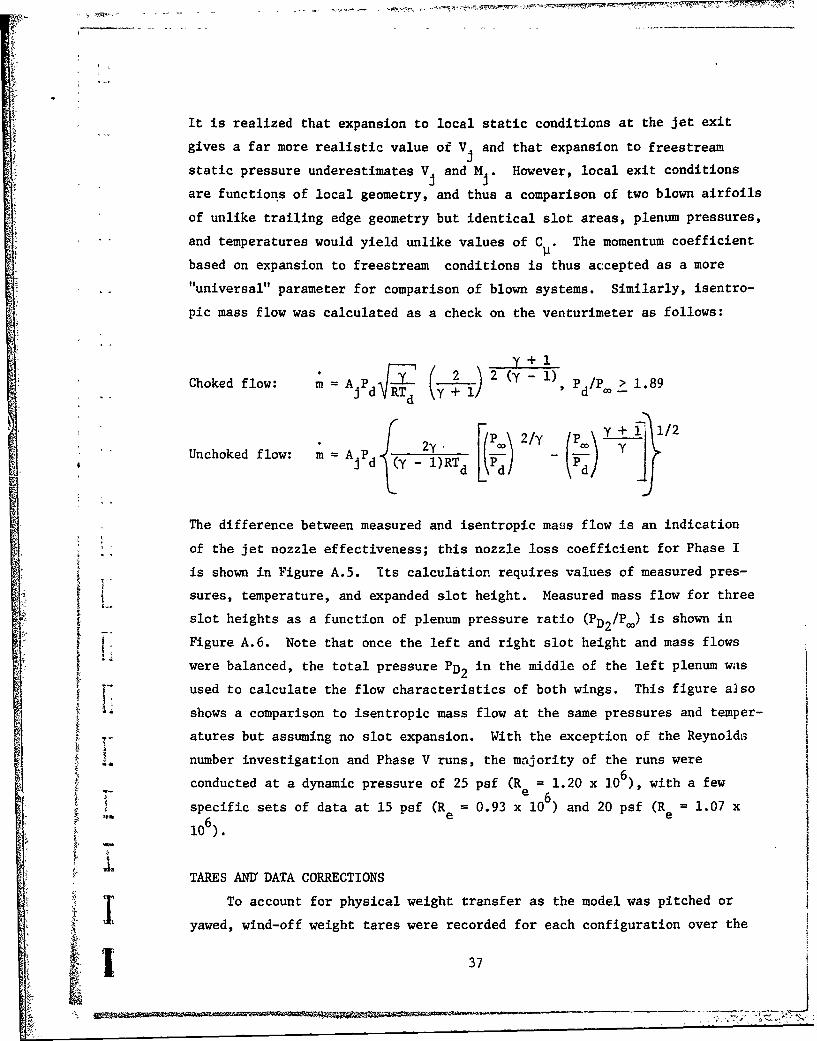
It is realized that expansion to local static conditions at the jet exit
gives a far more realistic value of V and that expansion to freestream
static pressure underestimates V and Mi. However, local exit conditions
are functions of local geometry, and thus a comparison of two blown airfoils
of unlike trailing edge geometry but identical slot areas, plenum pressures,
and temperatures would yield unlike values of C The momentum coefficient
based on expansion to freestream conditions is thus accepted as a more
"universal" parameter for comparison of blown systems. Similarly, isentro-
pic mass flow was calculated as a check on the venturimeter as follows:
+ 1Choked flow: m = AjPd R(Td y--) 2 - i Pd/P > 1.89
~~/ m" 11 () -i 2
Unchoked flow: m A P F 2y.2/y - -
j d TY - 1)RTd LkPdI
The difference between measured and isentropic mass flow is an indication
of the jet nozzle effectiveness; this nozzle loss coefficient for Phase I
is shown in Figure A.5. its calculation requires values of measured pres-
f sures, temperature, and expanded slot height. Measured mass flow for three
slot heights as a function of plenum pressure ratio (PD2 /Po) is shown in
Figure A.6. Note that once the left and right slot height and mass flows
were balanced, the total pressure PD2 in the middle of the left plenum was
used to calculate the flow characteristics of both wings. This figure also
shows a comparison to isentropic mass flow at the same pressures and temper-
atures but assuming no slot expansion. With the exception of the Reynolds,
number investigation and Phase V runs, the majority of the runs were6
conducted at a dynamic pressure of 25 psf (R 1.20 x 10 ), with a few
specific sets of data at 15 psf (R = 0.93 x 10) and 20 psf (R = 1.07 x6ee
10).
TARES AND DATA CORRECTIONS
jT To account for physical weight transfer as the model was pitched or
yawed, wind-off weight tares were recorded for each configuration over the
37

expected angle of attack and angle of yaw ranges. These values were
subtracted from the wind-on pitch and roll data. To account for any addi-
tional effect on the balance frame due to pressure in the air supply lines,
a series of pressure tares was also run. The temflex supply hoses were
plugged at the wing plenum juncture, a range of pressures covering the
desired C range was then run, and the results on the balance were recorded
and correlated with static pressure measured in the supply line just below
the balance frame. These data were then subtracted from the wind-on data
based on the supply line static pressure recorded with the wing plenums
unplugged. Additional corrections were made to drag coefficient to subtract
out the drag component of the two air supply hoses attached to the model,
and corrections to pitch and drag coefficients accounted for interference
effects from the model mounting strut and shield.
Solid blockage corrections to dynamic pressure were calculated as
q = q (1 + 2c)
where 6 = 0.00390 was based on blocked area due to fuselage, wings, mounting
strut, and wind shield. Uncorrected dynamic pressure (qu) was measured by
calibrated piezometer ring differential read on a +1.0 psid transducer.
The following tunnel boundary corrections were added to a, CD, and C:
Aa = 0.6415 CL, deg
AC = 0.0112 CL2
ACM = 0.01107 CL
where the moment correction was applied only when the horizontal tail was
installed.
GROUND EFFECT TEST TECHNIQUE
A ground board 194.5 in. in length was installed in the 10-ft-wide
test section, with its leading edge 103 in. (6.7c) ahead of the strut
38
1~ ~ ~ ~ ~~~----- -----------____ --- -----

H;centerline and its trailing edge 91.5 in. (5.9c) dovmstream of the
centerline. At 0 deg incidence, the model c.g. was located 47.561 in. above
the tunnel floor; thus three ground plane locations were tested:
hg, in. at = 0 deg h/c
12.811 0.833 (see Figures
62 and 63)
25.311 1.645
47.561 3.091
The first position (0.833) was sufficiently close to the model that
the nose gear impacted with the groundboard at a < -2.4 deg and the main gear
made contract at a > 18 deg for model rotation about the 0.253- strut attach-
ment point. Thus, only incidence between those limits was evaluated for
that groundboard height. For hg /- = 3.091 the groundboard was removed from
the tunnel, and the tunnel floor became the effective groundplane simply
by removing the tunnel boundary corrections to a, CD, and CM from the
7' corrected free-air data. With the other two groundboard locations, the
method of determining dynamic pressure had to be modified, since the tunnel
was thus divided into two unlike channels, and the piezometer ring shown
in Figure A.3 was no longer adequate. A pitot-static probe was mounted
with its measuring station 65.25 in. upstream of the mounting strut,
12 in. down from the ceiling, and 12 in. out from the left wall. Before
insl:ling the groundboard, this probe had been calibrated against the
blockage corrected dynamic pressure obtained from the piezometer ring as
described. Then, with the groundplane installed, corrected dynamic pressure
above the groundboard was obtained from the probe and the relationship
qr= qp /03959 and was used to reduce the data obtainen to the
coefficients of Figures 64 through 67.
39

SL f
TABLE 1 - GEOMETRIC CHARACTERISTICS OF THE GRUMMAN A-6A
(full-scale dimensions; model scale 1/8.5)
Wing
Area, excluding fillets 528.9 ft 2
Span 53.0 ft
Aspect ratio 5.31
Taper ratio 0.312
Sweep at 0.25c 25.0 deg
Fillet leading edge sweep 55.0 deg
Chords: root (W.S. 0.0) 182.6 in.
M.A.C. (W.S. 131.55) 130.8 in.
wing fold (W.S. 144) 125.9 in.
tip (W.S. 318.0) 57.0 in.
Airfoil sections:
root (W.S. 0.0 to 33.0) NACA 64A009 MOD
wing fold (W.S. 144.0) NACA 64A008.4 MOD
tip (W.S. 318) NACA 64A005.9 MOD
Incidence 0 deg
Dihedral (outboard of W.S. 65.0) -1 deg
Location of 0.25. F.S. 264.0, W.L. 90.5
Flaperon total area (0.12c length) 41.0 ft 2
Leading edge slat area (0.15c length) 49.8 ft 2
Flaps Conventional #2CW Phase V
Type 0.30c Semi-Fowler CCW
tTotal area 104.0 ft 2 12.6 ft 2
Inboard chord (stream wise) 48.2 in. (W.S. 55.5) 5.82 in. W.S. (56.1) POutboard chord (stream wise) 22.9 in. (W.S. 270) 2.83 in. (W.S. 265.5)
Span (each wing) 214.5 in. 209.4 in.
40

TABLE 1 (Continued)
Horizontal Stabilizer Conventional CCW Phase V2 2Area 117.0 ft 184.4 ft
Span 20.38 ft 20.38 ft
Aspect ratio 3.55 2.25
Taper ratio 0.404 0.404
Sweep at 0.25c 30 deg 30.9 deg
Chords: root (B.L. 0.0) 98,5 ir. 154.8 in.
M.A.C. 73.89 in. (B.L. 51.0) 115.21 in. (B.L. 52.4)
tip (B.L. 122.25) 39.8 in. 62.6 in.
Airfoil seccion root NACA 64A009 MOD GAC-6RA
tip NACA 64A007 MOD GAC-6RA
Dihedral 0 deg 0 deg
Incidence 0 deg 0 deg
kH (distance wing -E/4 to tail 7/4) 300.51 in. 294.59 in.
Pivot point (W.S. 553.5), % root chord 47.9 41.9
Vertical Tail
Area 79.25 ft 2
Rudder area 16.32 ft 2
Fin area 62.93 ft~
Height (from fuselage ref. line,
W.L. 100) 123.5 in.
Aspect ratio 0.962
Taper ratio 0.307
Sweep at quarter chord 28.0 deg
Chords: root (NACA 64A008.1 MOD) 164.74 in.
M.A.C. (W.L. 162.97) 117.73 in.
tip (NACA 64A006.5 MOD) 50.51 in.
, V (distance from wing E/4 to tail -E/4) 297.2 in.
•i 41
V. . . .

TABLE 1 (Continued)
Control Surface Deflections, Approach Configuration
Flaps 30 deg Takeoff, 40 deg Landing
Horizontal Stabilizer, Conventional A-6A +1.5 deg Up, -24 deg Down
CCW Phase V +4 d'g Up, -21.5 deg Down
L.E. slat (streamwise plane) 25 deg
Rudder +35 deg
Flaperon (spoiler) 0 to +51 deg Up2Wing tip speed brnkes (24.25 ft total area) 120 deg included angle
Fuselage
Maximtun length 655 in.
Maximum frontal area 49.75 ft 2
Wetted area 848.0 ft 2
:Maximum width 73.1 in.
42

wl 40 rz0 ý. f.4
00 (6J *C.. -CC U C
CL 1
00
006ClCC 0 .4 .*4 N
-3 .44
a 0 0V
14 43

IT] 1 0cO
w 4. 4.1 W 3:5 c c 4 w. 0 410 414
I 'a a NI
0 to- 0 -0
0 41 .4 4 .4 .4 4.0 I
.0 C.).
4) 004 1.11 fn1 -I- -+ I
I-000CA 114 (1 ~ - 4
r4 .5 0 ~ .4 '
Xw ca c rz01.0
to 1 4 . 0 .. 0 . 0 0 . 1
0. 041.41.0~1 04 41 1 1i
-44 1 1 100 to4.
1 10co1I Go0 o. .,I ; 00
0
0 0 0 4' m , 14c o a, 0 e
000
C4
600
.l 0

c, r u0 a
a4 an 0 GI a w ) 00)c 0 V) N .41.4 OdJ.W.14.1 0 w 4 -041
.-4 m 10w0 P,~
011: 0 03 04
,.4' a ON ý ' ''-4 04c U
cc0 0)0
lu10
91 -a 00 0
0I
0 09
A 14 .
0 ~ 0. ~ ' ca
0~ 04
100
1~4 V 44 1
00
.11 - - 1 4 -0 -1 1 In11 4I
oo coC J
0 0.1 "
45

0 0
cn A w44 -0 .44 V)) '0 9: 93co "G 0 V) 4 4 4 4$
04 000 0 0
'0 0 .0 go En. W4 'a'- 0, - -
a . . v 14" AA~ 44.4 44 -44D:3 0 It 14 0J. 44 444 W g $ 4W41
Cn -4 P4k L*a -9Qt 41
-l-5 ae.
I 4 1
'A IQ,~ 4
0.
4. - o
.4 L. 444 44400
to4 -2 -a
44 4 to4 f0 0-4 4-en 4 m I I
.4C! L)T -4It -rq40a t n Wc
.; 0.40 f 4
444
44
f. .4 .L
o- bo 01m7
IN M4 Go m a%Do m N N0 T c
CO .4 M
.4r
en enRn1 141 444 IT444044 11 1? 'T)
446

0 -
64
0" 0 064 0
0.0
00
41-4
0.. .
.40 0 a
I-. .
-a1 '..a
-4.4
041
0410*.t t.
00
ý-4
47to- p T0
cl q**~~ -4

P4 A.44-4 . u w.4
Z) 0).
4)3 ý4 Wý 0 ý0 11 01
4)~ 0 6 co-.. N44, l-a, 0 0 m -4 4w 4) -0 4.-4 .4.40'.44
4 3 W1 0'4.l)) 14
a.ý co04E-4' 4) 14
'.4 ~ . 4) l . 4 4l '
60
01 1
.4) '.0.4 0 z.14)4 0 000
m 4.
C4CC4 -. T
cc
cn uC CD.44
4)' -0. 0 OU
144 IT IT
ca 4) 6(4 4
.0 U. +
0)) 0U o U) U
140 4-)1
's.
to. 0 ) C-4
14 + + +Go)0
co U.. m )
"144)C 0
0
1 4Os 04 - - 0 4 4C
V., C4 C4 Ill N
-'48

4. 4
0~1 14' 1 40WCu4 If 4
41 415.. 96 P. Q41 41 4.
'.4 n 4. 5.. ~ 0. 41 0 41 v1U1..0 0 0 V, 012 3. -a r. 'A6 . 0
a4.4'1 Uu0 040 "0 41 wU 4. r. 4 4n4
44 4 1" $-4J4 414) 4 40 w 0.4. 9N 440 '21 .440 a. >r'>. .. 1 0 m24 34-41W
0U'41 U a04.00.0 O4 D. . 4.~ Cl a. 4 pPo41. tN d 4.1 Os~ 41 4.4.41 64 4.1 '. -44 41)
U) 44.4 12 0 .4 I 4 U 1 14 0 4 .0 4 ) 14 k.-441 W t-2 4 4 41 -. 4 4 . " 14 .2 14 .w-4 41' 41 0 o14o 4;1'2 4. '4 -04 > 404. w 1- 1 .4 4)1,4 0,4 -0 .fl 'U0 ' 0 40 '4 40 4
41 a
4 41.4' 4 4- 4 .
"w 44 0 0s0 P.
10
cc 4. 4104.4.0
0 '..44''4.4
4.4, 0
C, W_ 0 0 0 0 0 0 0 8
003 0
too 0 - -T 0 0
$42
44 "4 A ol )6 c 4 0 0I5 0 o
'0ý 0 4 '0201 0, C; 0 C C c
'0 40 0KC0 0 0
0 0 00 0 .
'I"
'04
4241 414
4140
,4" 30I A 4 1 1 I . I 1 .1- Al 11,10 .0 40 40 40
449

TABLE 7 - 1/8.5-SCALE A-6/CCW MODEL TRAILING
EDGE PARAMETERS, BLOWING OFF
Phase W S c,in. r,in. h,in. h/r r/c h/c
I 55.5 18.886 .6842 .0211 .030857 .036229 .001118
1270.0 8.973 .3251 .0100
I 162.75 13.930 .5047 .0156 .030857 .001113(Avg.)
I 55.5 18.886 .6842 .0106 .015429 .000559(Runs312,313)
270.0 8.973 .3251 .0050 4I 162.75 13.930 .5047 .0078 .015429 .000559
(Runs (Avg.)312,313)
I 55.5 18.886 .6842 .0158 .023143 .000838(Run 311)
270.0 8.973 .3251 .0075
I 162.75 13.930 .5047 .0117(Run 311) (Avg.)
II, III, 55.5 18.886 .6842 .0158IV
267.0 9.112 .3301 .0076
II, III 161.3 13.999 .5072 .0117 .023143 .000838IV (Avg.)
V56.09 18.885 .6842 .0096 .014060 .000509
265.50 9.181 .3326 .0047
V 160.80 14.033 .5084 .0071 .01410E .036229 .000509(Avg.)
slot length for phase I (W S 55.5 to 270.0) = 25.59 in. per wing
slot length for Phases II, III, IV (WS 55.5 to 267.0) = 25.24 in. per wing
slot length for Phase V (W S 56.1 to 265.5) = 24.99 in. per wing
slot sweep angle = 9.6 deg
S50

h
Vi' M, TANGENTIAL BLOWING OVER
ROUNDED TRAILING EDGEPLENUM
Pd PRESSURE-CENTRIFUGAL FORCEBALANCE:I;. 4P pV?
R A'a ~ r
3 AP
AIRFOIL PROFILE
RESULTS OF PAST NSRDC TESTS1. Cq > 6.5 FOR CM < 0.25
2. ACq/C = 703. LIFT INDEPENDENT OF INCIDENCE JET SHEET
RiL!• i". = /BLC r (EBOUNDARY LAYER CONTROL)
S' " MOMENTUM COEFFICIENT, C/u
Cli qS,•i LFigure 1 - Basic Circulation Control
Aerodynamics and Parameters
51

AREA: 528.9 SOL FT. IExcI. Fillets)
TIP: NACA64AOD59 MOD,FOLD: NACA 64A008,4 MOD.WING STA. 33: NACA 64AOOQ MOD.
DESCRIPTIVEEC ARRNGEEN 0: 5 1031
Figure 2 Three '-Ve of thLED A6 irrf
(fomIAVL Q-1OA65
52 -7"

tf
CONVENTIONAL
CRUISE
TANGENTIAL BLOWING S ADED
DIAPHRAGM SWIVEL NOZZLE
AIR SUPPLY TAKE OFFAND LANDING
BLOWN FLAP/
PLENUMCYLINDRICAL INFLATABLE SURFACE
COANDASURFACE INFLATABLE TRAILING EDGE
COANDATRAILING EDGE
180 DEGREE FLAP ROTATIONTO EXPOSE ROUNDEDTRAILING EDGE
UCRUISE
PLENUMTAKE OFF
AND LANDING
~~ JET SHEET
-- • 1,• EXTENDED
] PLENUMCIRCULATION CONTROL
TRAILING EDGE
EXTENDED TRAILING EDGE
Figure 3 -Proposed Circulation Control"Wing Configurations
• •t.53
1:

Lnf
iri
oco
,I- pi-I"0
o--J
- 0w
U".D -4
0. CO P4Co
0 j U .I,..
• 0~ 0.-
<a)
C))
0 $
C) -
I,-I
CD-- In
I4--
U, ""
1 I\ I
(:f4
0 '0
I _ _ _ _ _ _w 4 1

7' II 'g I t I 'I1' I
-28C/• = 0.324, CR = 6.33
C.. -Cd =0.09 1 C =-1.568
"-24z SLAT L.E. COORDS. = (-0.0854, -0.1171)} AT 8 37.50
U- -20 GAP =0.04 CSLAw
0 T.E.S-16 0 UPPER SURFACE
ALOWER SURFACELU C =UNDEFLECTED ORIGNIAL CHORD
0 -12
-4
0 0
0 0.15 0 0.2 0.4 0.6 0.8 1.0
CHORDWISE STATION, x!C
Figure 5 - NACA 64A008.4/CCW Airfoil StaticPressure Distribution at aeo 6 Degrees•; • •-geo
55

7
6600
6 5
0 300
C.)
*5z
ILI
LU
0 3
U..
N0 0.05 0.10 0.15 0.20 0.25 0.30 0.35M O M N T M O E F I I E T
Figure 6 - Two-Dimnznsional Lift Characteristics ofthe NACA 64AO008.4/CCW Airfoil
56

WING TIP DRAG BRAKES
/ ENCES AT ENDS OF FLAP SPAN(W.S. 55 & 267)
FLAPERON
GLOVE STAKE SO
REMOVED AND KRUGERFLAP ADDED 1
A A
W.S. 292, -t
COANDA SURFACE NETECABR&SLT
TRAILING EDGE
SECTION A-A SECTION B-B
~'°• "SLAT L.E. RADIUS INCREASE
Figure 7 - 1/8.5-Scale A-6/CGWModel Modifications
- C57

SFigure 8 - /8.5-Scale Model Installed in 8- by 10-FootNorth Subsonic Tunnel, Phase I
:1-1X
I!
II
I
° I
3 Figure 9 - Trailing Edge Modification, and Cotton-TuftShowing Jet Turning (Wind Off)
S• 58

C.) Xl
C) 0
liii
- - c.-'4-'tT.0 0 -- 0--
CA.
o-0 >0 L 000 U. Cc%
a0 0f~ -j
- ~ ~ 0 cl1c- oc -u\0 -U
z r40cc LU 4-)
0 Il IT I~
4 6
-j 4
59~

Figure 11 - Details of Wing Flow Fences
FENCES INBOARD OUTBOARD
STANDARD A-6A FENCECONVENTIONALFENCES
W.S. 104 W.S. 250
FENCE SET 1W S. 2 0- •
W.S. 55 W.S. 27
INCREASED LENGTH
SET 2 SAME AS SET 1, W.S. 55 _
INCREASED HEIGHT
SET 2A SAME AS SET 1, W.S. 55 W.S. 27
W.S. 270NOTE: LEADING EDGE DEVICES AND DEFLECTIONS NOT SHOWN
Figure lla - Conventional Fences and Sets 1 through 2A
60
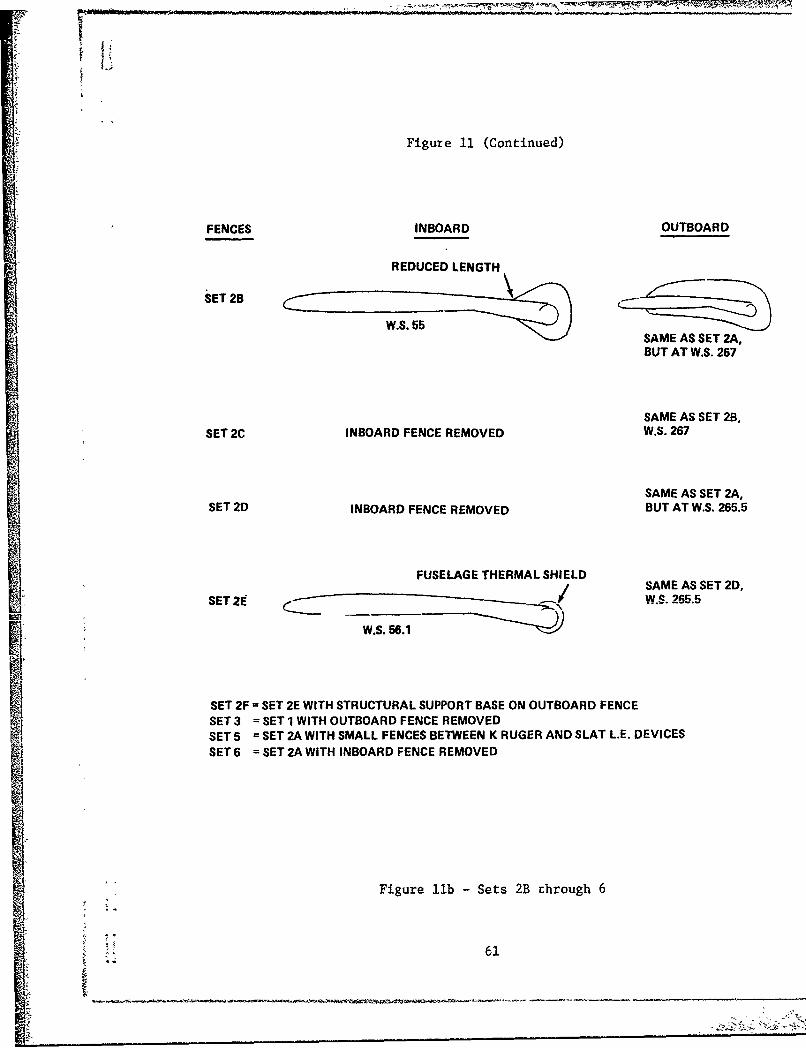
Sii
Figure 11 (Continued)
FENCES INBOARD OUTBOARD
REDUCED LENGTHET 2B •. •
W.S. 55SAME AS SET 2A,BUT AT W.S. 267
SAME AS SET 2B,SET 2C INBOARD FENCE REMOVED W.S. 267
SAME AS SET 2A,SET 2D INBOARD FENCE REMOVED BUT AT W.S. 265.5
FUSELAGE THERMAL SHIELD#/ SAME AS SET 2D,
SET 21E fW.S. 265.5
-W.S. 56.1
SET 2F = SET 2E WITH STRUCTURAL SUPPORT BASE ON OUTBOARD FENCESET 3 = SET 1 WITH OUTBOARD FENCE REMOVEDSET 5 = SET 2A WITH SMALL FENCES BETWEEN K RUGER AND SLAT L.E. DEVICESSET 6 = SET 2A WITH INBOARD FENCE REMOVED
Figure lib Sets 2B "hrough 6
61

i* na U. * 0!
C.,ai C,
it N3E
jL L)C2 I -
116
a, a
q a
SinIn p
WI.
CD W
a -j
0
C, m
:WI 4 -4cC (
a4 XIC cjl I ccI10 II SI C
I ac
to 1IM I T .3'-CYw
I I I60
C4~~~ a- 0Qc
62

4.4" "C;, 0.30
4.0 0.30 0.20
3.6 0.20
3.2
012.8 0.10
I2A
0 A-6/CCW PHASE II. MODIFIED WING CONFIGURATION
" 8SLAT " 25 , 0.02C GAP, INCREASED SLAT L.E. RADIUS
C FENCES MOVED INBOARD TO WS 267.CL 2.0- ,RESULTING SHORTENED SLOT
SS" FLAP TRACK LOUVERS* REDUCED SLOT HEIGHT * hAV = 0.012 IN. 0
•/ 0 TAIL ON (is . -100, 0.40"T FLAP) U
1.6 - 0 MAIN AIRFOIL RADIUS, SLAT STEP EXPOSED 0, NO ENGINE PLUGS %000
1.2 - 0 GEAR DOWN1.2- -4
0.8j
PHASE II
RUN ClOA4 0 335 0.0 -
03 337 0.10
&l 338 0.200. 389 0.30
FINAL PH. I CONFIG., WITH hAy = 0.012 IN.
(RUNS 320-323)I1 .4 I I I
-4 0 4 8 12 16 20 24
a, DEG.
Figure 13 -Phase II Lifting Surface Modifications
63

- 21f ý-WING CHORDPLANE
0.813 IN. DIA. CIRCLETANGENT AT THIS POINTr/c = 0.0227rc-17.870 IN. INBOARD SLAT STATION, W.S. 78
STREAMWISE PROFILE
_ _ _ - _ _-I 6SLAT =25
0.375 IN. DIA. CIRCLE TANGENT - GAT THIS POINTr/c = 0.0236 OUTBOARD SLAT STATION, W.S. 292
c =7.964 IN. STREAMWISE PROFILE
DIMENSIONS ARE 1/8.5-SCALE
Figure 14 - Slat Leading Edge Radius Increase
64

4.0
_ rCm 0.20
3.5
3.0 S3.0 -- Cm 0.10-
2.5
2.0
• • 1.5U
. 01.o- P AOEN
RUN STAT L. E. RADIUS
CENVENSTIOAL
S<> 220,! 0.5 V 218/ INCREASED
T+ (•SLAT =37.50, 020 GAP
ShAV =0.016 IN.
S~FENCE SET 2A
GEAR UPS.;- is = .10°
i •" -0.5--0 .5I I I 1 I
-4 0 4 8 12 16 20 24
a, DEG
I Figure 15 - Effect of Increase in WingSlat Leading Edge Radius
65____________ I~~z~~

4.0-
'II
3.6 ': *T
3.2-
2.8-
2.4 /Cm = 0.30
2.0
Cm =0.201~CL
1.6 CURVE RUN C__
------.- A ' 556 0.10. PHASE i, FINAL WING_.i 4, A, 0 557 0:20 CONFIG, SLOTS
-0.100 A' 554 0.30 EQUAL'IED1.2 0 C 560 0.10 W.S. 55 FE:".LCE
| > 561 0.20 REMOVED/ ~~0,.,, 30
B & 562 0.30
08 ..... C 0 563 0.20 WING SLAT GL-..I C 0 564 0.A RADIUS REMOVED
~ 565GAC-3 TAIL,.i -=-10°
GEAR DOWN'
0.
-4 0 4 8 12 16 20 24
Figure 16 - Conversion to Phase III Lifting
Surface Configui otion
66

oAd S
C! CR C4 N q It q CR N4 Q It 0m m2 C4~ N N i
0
2 m V to50
.;in 00c0N U -
400In-
C5 N
wa $4
II
V~ ~~~ 0s C; '
*~~' d)V ~ ' C N N, e% 14

14.8
4,4 "- III .
4.4-
3.6 H
2.8-RUNS
O-- O 8-93 PHASE I, OPTIMUM WING
2.4 0-----0 567-576 PHASE III, FINAL WING
'----- 835-842 PHASE V, FINAL FLIGHT DEMONSTRATOR WINGSREF. 8 STANDARD A-6A, FLAP =3 0 , SLAT =250
2.0 STANDARD A4A
Z*V 0.06 o.,o 0.15 0.20 0.2,5 0.30 0.35
0.Ob 0.10 0.15 0.20 0.25 0.30 0.35
22MCQj 21
20;
Figure 18 - Comparison of Tail-Off Cmax and
Stall Angle for Various Configurations
68

I I I I45
40
HORIZONTALCURVE PHASE TAIL TRIMMED
A I OFF NO
35 - a IIIC I GAC.3 YESD EC-40-10-DE EC40-10-SS
30
25-
iACL
20 -\\
I\
5
0 1 I I I I
0 0.05 0.10 0.15 0.20 0.25 0.30 0.35
-- CM
SjI Figure 19 - Lift Augmentation as a Function ofMomentum Coefficient
IC _ __ _ _ _ _69

C. C.
I- 'a
w
-H
mD I- Q L ------ -
0 0
0 0>wUr
-J CL
00
LU bo
(U -jL
Z 0 E-I-'L
- (i LlJ. u
UA
w~ 0./C2'~ 0
~.J~0 0.CL CO 0
C.) > -
C,, ~ FiT1 I 70

w
0W wca 0
I- w
to -. Co (z
w liii
N -
ca SO90 9S'M'C!N3 LOIS U&IVOGNI
Lo 4-4
t.~ c4 0 4% edr
i%
44
0- -HC0 -
%0 0wellj C
71o'Im$1 ___________.

IN.,
0.40 I
h [ .0078 IN.0.35 .01 N
.0156 IN. .0117 IN.
q 20 plf
"0.30q 25 psf
0.25
C L
0.20 F
0.15 j
0.10 PHASt RUN q, psf hAy, IN. P., psia
0 I 306 20 .0156 14.5770 I 311 20 .0117 14.597& I 312 20 .0078 14.612
0.05 0 III 567- 25 .0117 14.390576
•g 4 DEG.
1.0 1.5 2.0 2.5 3.0 3.5 4.0 4.5 "'
PRESSURE RATIO, PD2/Poo
Figure 22 - Momentum Coefficient as a Function ofSlot Height, Pressure Ratio, and •
Dynamic Pressure
72

0
IM 0
00
> II+ ~00
~~~ 0J00 0
24 -H00
o ~o
PI-1
AN 0'
03
r4IP
1 0s
Lq IR q Lq 0
73

0£
R
0 0n
0 a 0UX
0 0
N 8 41-
04-4
4-1 0
~44 -H
L- 0
rxj
Ui Lq
74 [

~Ln
(0 N-N NM C
Lnr~)0 (
MC 0 L 0 C>
0.
Co 0
cc . (a X.
g0 010
Z E
.U .
tH0
0.0
U) rJ4
7
0
anLO
80
-J
75

VIr 4.5
KNEE 'N CL C.~ CURVES
4.0 1000
:CM3.5
x02
3.0~.2 V 1 V =1
2.51
2.0 0.05 0)**-
1.50
1.01
0.500
766
1.5

0.45
q 5 psf 10 15
q 20
0.40
0.35 --
q =25.1
0.30 1
0.25 - 0.1
Cu
0.20
CL 3.5
0.15
S- 3.0
0.10 CONFIG 38, , 40 ,hAv= 0.0156 IN.0.10 RUN q,psf Re/lO 6
,•"2.5 0 74 5.0 0.536
' 76 10.0 0.762
4< 77 15.0 0.931
•t 0.05 V2.0 I 78 20.0 1.0700 73 25.1 1.203
"1.5 0 79 30.1 1.300
X = KNEE IN CL .-C• CURVES~~ I
1.0 1.5 2.0 2.5 3.0 3.5 4.0
PRESSURE RATIO, Pd/PO
Figure 27 - Momentum Coefficient as a Functionof Dynamic Pressure andPressure Ratio (Phase I)
5 77
.. • £U

4.8
STEPFAIRING
4.6 TRANSITION STRIP &A&
0.05C4.4
4.2 -
4.0
4.p
CL 3.8 -
3.6
3.4 -q2 s 03.4 -i ~Re = 1.20 x16•
HORIZONTAL TAIL OFF
3.2 "
TRANSITION
RUN CONFIG. C; SLAT STEP STRIPS
3.0- 72 38 .2649 FAIRED OFF--- " 81 39 .M647 UNFAIRED 'i,
--- 0 83 40 .2649 ON
E4 G4 8 12 16 20 24c DEG.,-
Figure 28 - Effect of Slat Step Fairing -f
and Transition Strips
78
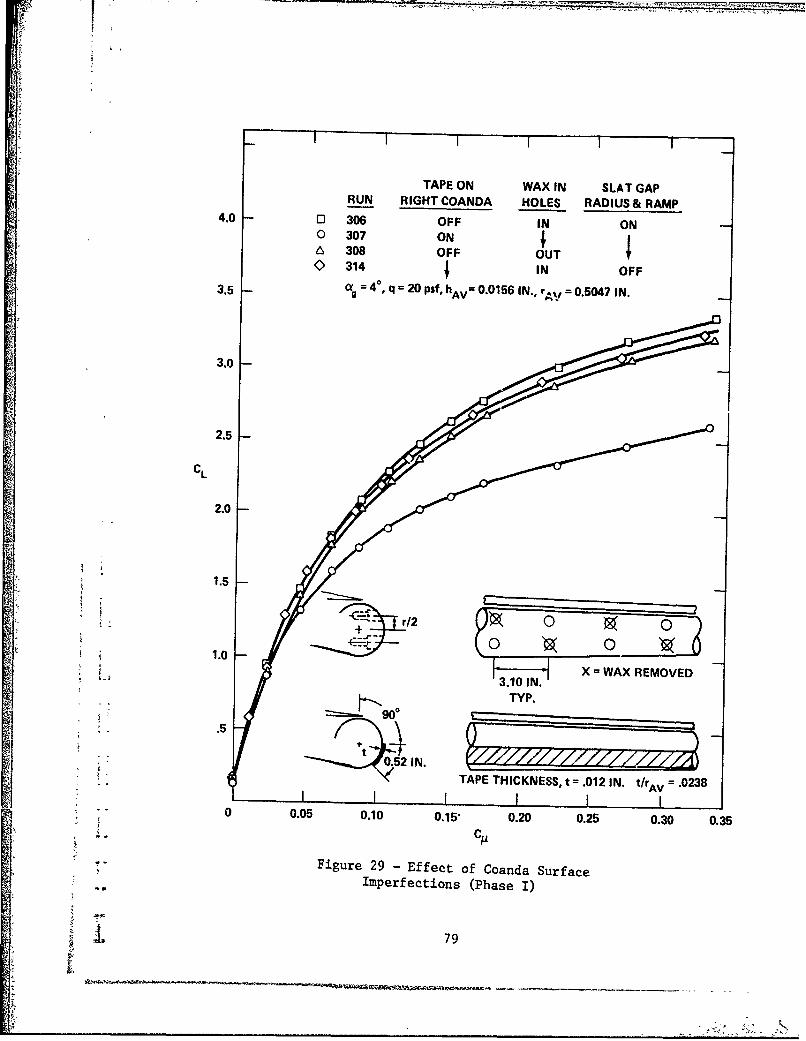
tL
TAPE ON WAX IN SLAT GAPRUN RIGHT COANDA HOLES RADIUS& RAMP
4.0 -0 306 OFF IN ON0 307 ONt6 308 OFF OUT "
0 314 1IN OFF3.5 - 014, q =20 Psf, h~v 0.0156 IN., m ~~0.5047 IN.
3.0
2.5
CL
2.0
1.5
+ r20 01.0
- ~X WAX REMOVEDL 3.10 I N.TYP.
0.52 IN.TAPE THICKNESS, t =.012 IN. t/A =.0238
0.20 025 0.300.05 0.10 0.15, 0.0 02503 0.35
Figure 29 -Effect of Coanda SurfaceImperfections (Phase I)
79

IAI
C/= 0, a =-12.80, CL 1.18 C= 0.05, a 13.6°, CL = 2.53
IUo
C/ = 0.15, a 14.4', CL = 3.74 C, = 0.20, a 14.6', CL = 4.07
Figure 30 - Tufts Showing Downwash Angle in Vicinity ofS~Horizontal Tail, a = 12 deg, q = 25 psf
g
1, 80
• I-

Figure 31 - Mfeasured Downwash Angle atHorizontal Tail Quarter Chords
(Phase I)40
C =0.30
35-
30 1-
2535 --
30 0 .71
25 - OlO OU
wU
a
o20 O 0.0Z
158DATA QUESTIONABLEI ~ABOVE TICK MARKS0.
410 -d
0.05 0.5525
5 0.10 0.64640.15 0.7625
RUNS 98.105 0.20 0.8044PTS 1089 -4-1143 0.30 0.9669
0-05 10 15 20
ct, DEG
Figure 31a -Tail Tip, y/0.5 bT 1.00
81

Figure 31 (Continued)
25
20
W15
C,20.2
C,,,
ad
0.100 0.72680.05 0.6551
52.05 0.10 0.6061
0.20 0.45420.30 0.0556
c- cz a
-50510 15 20aDEG
4Figure 31b -Tail MAC, y/015 bT 0.429 ;T82

Figure 31 (Continued)
30
25
0.20 C A 0.30
20
5-5
0.05
0
4 0 4 8 12 16 20
cO DEG.
Figure 31c - y/0.5 bT = 0.200
j •T 83
..twAý•

L-
1.0I
_ ATOP. VERTICAL.
0.9 .- X-.20 TAIL
0.5-bT 0.429
0.8 -,
qT/qoo 0.7 - TAILCHORDPLANE
LOCATION0.6 - 0.20 y
0.10 • -0335
0.5 -q 25 psf
Re 1,13 x 10⁶
RUNS 295-300
0.4 I I I I I-4 0 4 8 12 16 20 24
c, DEG
Figure 32 - Tail Dynamic PressureMeasurement (Phase I)
C 84

Figurre 33 - orizontal Tail Configurations(Phase I)
CT- - - CON VENTIONAL
-2 7" FLAP 1
T.E. TOO LOW
*330 LAT2INCREASED L.E. RADIUS& RAMP __
Nil'
jT.E. ALIGNED, FLAP CE 8TEDEG.
0.2TGAP- - -
3 O*2OCT -3
14 O.4OCT. -2
I k- ~ ~ FINAL PHASE I HORIZONTALSTABILIZER (SLAT 2, FLAP 4,
STIP FAIRING & DROOP)
Figure 33a -Airfoil Sections
85

Figure 33 (Continued)
COW STABILIZERJ - - - ORIGINAL A-GA STABILIZER 520
. ROOT
(PITCH AXIS) " " -- 1560N• 0 - F.S. m5 t C31170IN
TIP FAIRING& DROOP
580
4600
TIP
- -•_ -•'""/ 0 620,
F LAP 464u
I wT0.5 1437 IN.-
I! 6*
Figure 33b - Planform
/1 87

WLAJq
LU-J
Co 0
0~~c -- U'
0
00 ~0X
'4-1 0
co 0tnU
cw cWa
24 2 If) r4A- I0o to 2 ;
ta212 88

50
C.)o
$0
It) C14
'4-4CY r. 1
0
IL Ci
29
0 A(00
z 41
C.,L
89u

4.8 1
4.4
4.0
3.6
3.2
C1 =0.30
2.8 0.25
0.20
2.4
0.15C.
2.0 RUNS 85-93
0.10
1.6 II 0.075
• 1.2
1.20.050
0.8
/ 0.025
0.4 /.000 /SST'ANDARD A-6A, APPROACH CONFIG. (REF. 8)
0__
+0.2 0 -0.2 .0.4 -0.6 -0.8 -1.0 -1.2 -1.4t ~CM.C0.36e•
Figure 36 - Tail-Off Pitching Moment for theA-6/CCW Phase I Configuration of Figure 12,
but with X = 0.35Ccg
90

J4.0 !
--- Xcg- 0.253 c(FLAGGED SYMBOL) Xcg - 0.35F Xcg - 0.253 F
3.0
,.o /2.5 A
CL2.0
1.0 i
STANDARD A-6ACo = a APPROACH CONFIG.,=
.18
0.5 -- (REF. 8)
II
0 - PHASE I, is -180 dCm/dCLRUN CA ______
-- -- =.253C Xc;T=.35C!
0 p 202 0 -.199 -.102 I|A A 186 .10 -.332 -.235
.05 O3 188 .20 -.365 -.255-1 REF. 8 - -.111
1.0 0.8 0.6 0.4 0.2 -0 0.2 -0.4
CM
I Figure 37 - Effect of Aft Center-of-GravityShift (Configuration 63, Phase I)
91

ovIUii
v Lo
cy C9 )
U- to
00
CA ) ." j
C44
00
920
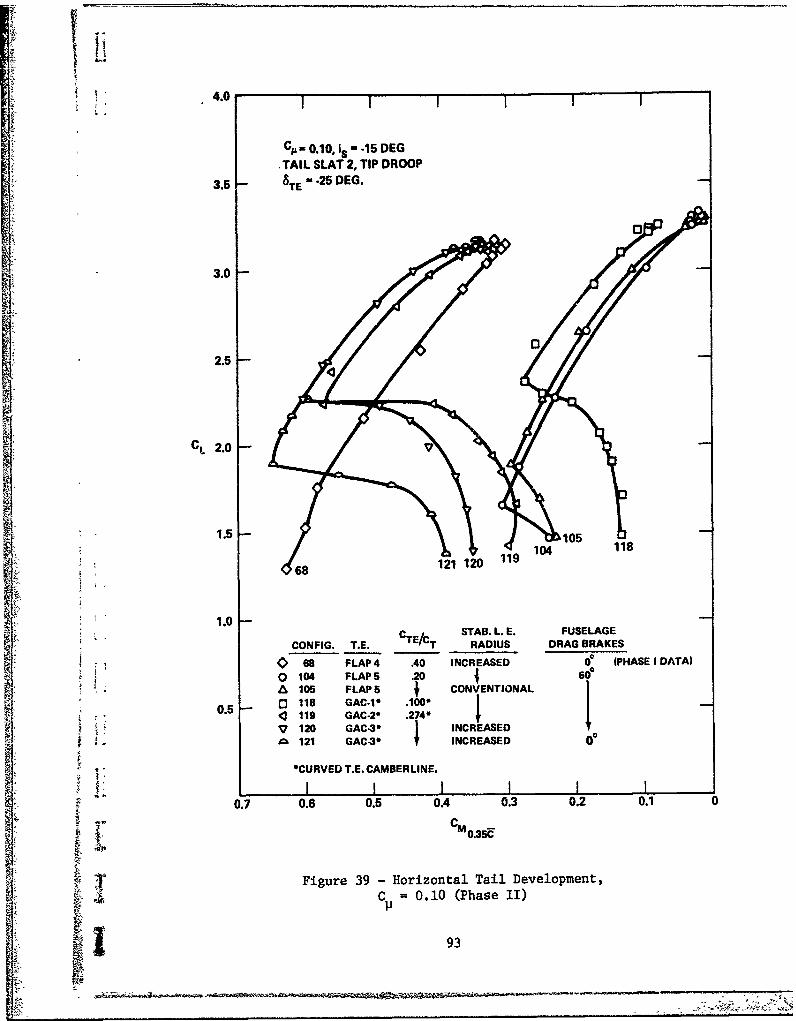
4.0
C. 0.10, is -15 DEG
TAIL SLAT 2, TIP DROOP3.5 -25DEG.
TE
3.0
2.5
1.5S68 ~ ~~121 120191018
1.0STAB. L. E. FUSELAGECONFIG. T.E. TECT RADIUS DRAG BRAKES
S68 FLAP4 AD INCREASED 0 (PHASE I DATA)
O 104 FLAPS .20 60A 105 FLAPS5 CONVENTIONAL LC] 118 GAC.I* .14;< 119 GAC-2* .274"17i 120 GAC-3* I INCREASED
S•' 121 GAC-30 • INCREASED 60
" • " *CURVED T.E. CAMBERLINE.
0.7 0.6 0.5 0.4 0.3 0.2 0.1 0S"• ~CMo 5
Figure 39 - Horizontal Tail Development,C = 0.10 (Phase II)
yk'.'93

4.
UC- 0.30, is =-15 DEG.TAIL SLAT 2, TIP DROOP
STE -25 DEG. 0 .31
4.0
3.5
Vb
3.0
104L1 2.5 i~121 1 9 105 118
2.0-
STAB. L. E. FUSELAGECONFIG. CTEICT RADIUS DRAG BRAKES
01.5 104 FLAP5 .20 INCREASED 600 }
A 105 CONVENTIONAL C3 118 GAC-I* .100' I4 119 GAC-2* .274* tV 120 GAC-3* INCREASEDa11 t t121
1.0 -
* CURVED T.E. CAMBERLINE;
0.3 0.2 0.1 0 -0.1 -0.2 -0.3 -0.4
CMM0.35CU
Figure 40 - Horizontal Tail Development,
C 0.30 (Phase II)
94

•: , 4.5H
4.0-
C1, 0.30is
S • • iis ,,24 DEG
3.5-
RUN NO.
3.0- CU ,, 0 CA --0.30STA IL is "M+3 ° is n,2,
O GAC-3 (PH 11) 473 460
0 EC.20 583 6052.5 0 EC-20-SS - 616
- . EC-40 637 636(3 EC.40-RA 643 648V EC40.RA.10 651 650A EC40.10 657 656C3 EC40-10-SS 659 6620 EC-40-10-D 732 737
2.0-
i. ~1.5--
cms 0.0s =+3 DEG
1.0-
0.5-
0.5 0.4 0.3 0.2 0.1. 0 -0.1 -0.2 -0.3 -0.4
• Figure 41 -Horizontal Tail Development
(Phase III)95

0
00
w* ~01
LU
w
U;
00
4 100
0 4.
0-
0 u0
4 o4
In U)j
-I I - I - (E
0- 0U 0000
0 od
c; 0 CO)
O) uu ) 4) 4006UC.
In~
CV) U U U IL
960I

-Ar
41 0I
U 00
-2Z4
4 34
4.1 H 97

i
Oa
L) 4-4
00
00
U N
wo
000
99
w ci

r ~2.00C = , s=+3 DEG
RUN TAILA 757 EC-40-10-DI 1.8 - 765 GAC60 768 GAC6RA
1.6
1.2--
0.6-
1.4-
0
1o.2I II
CM O.35CM
CL
0.8 dM 0P.0.028
0.6
0.4
0.2
0
-0.2 -II0.10 0.05 0 -0.05 -0.10 .0.15
C0 .35 1E.
Figure 44 H Forizontal Tail Development,f = 0 (Phase IV)
100

SI i I I,
2.0 -5 0 %" . TALLi: ! is =4.00
1.5 PHASE IVC =0GAC-6RA TAIL
Xc- 0.32F
1.0
N lrN
dCM/dCL. .. 050
0.5
CM0.32F"
0
CL 0 +30 +70
2.0 is= .W
%TALL
H 1.5
Xcg 0.38C
1.0 -
" 0.5
I , I0.6 0.4 0.2 0 -0.2 -0.4 .0.6
CM o .38FFigure 45 - Effect of Center-of-Gravity
Location on Unblown Longitudinal
Stability101
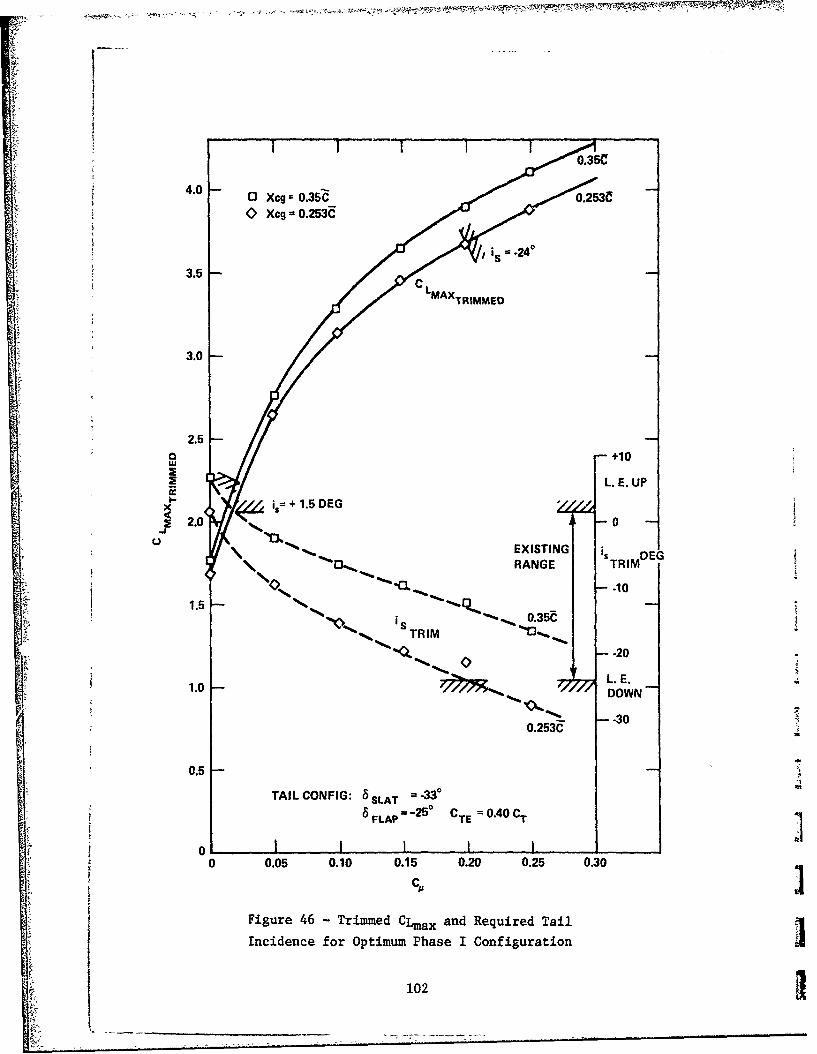
S~~~~4.0 - x=o. .•,2c
II
4. 0 Xcg 0.35C 023
0 Xcg 0.253C
Sis .240
3.5IC CMATRIMMED
3.0 -
2.5w +10wL. E. UP
Sx is= + 1.5 DEGI, 2.0 N0EXISTING is DEGRANGE TRIM
._10
S TRIM -0.35C
-20
L. E.DOWN
0.253C -30
So~.5-
TAIL CONFIG: 5SLAT = 33°
6 FLAP -250 CTE =0"40 CT
0 0.05 0.10 0.15 0.20 0.25 0.30
CM 3Figure 46 - Trimmed CLmax and Required Tail
Incidence for Optimum Phase I Configuration
102

x ND<,t
ID .
N 4
C4J r(R -R 4t q• R N
N 0 H -b(~2 NN 0 -
C. C. , .
0$14
i 103
4'4
1-CO-I N-1 0 Z f
a 1:
a N cj - H
103
Ilk
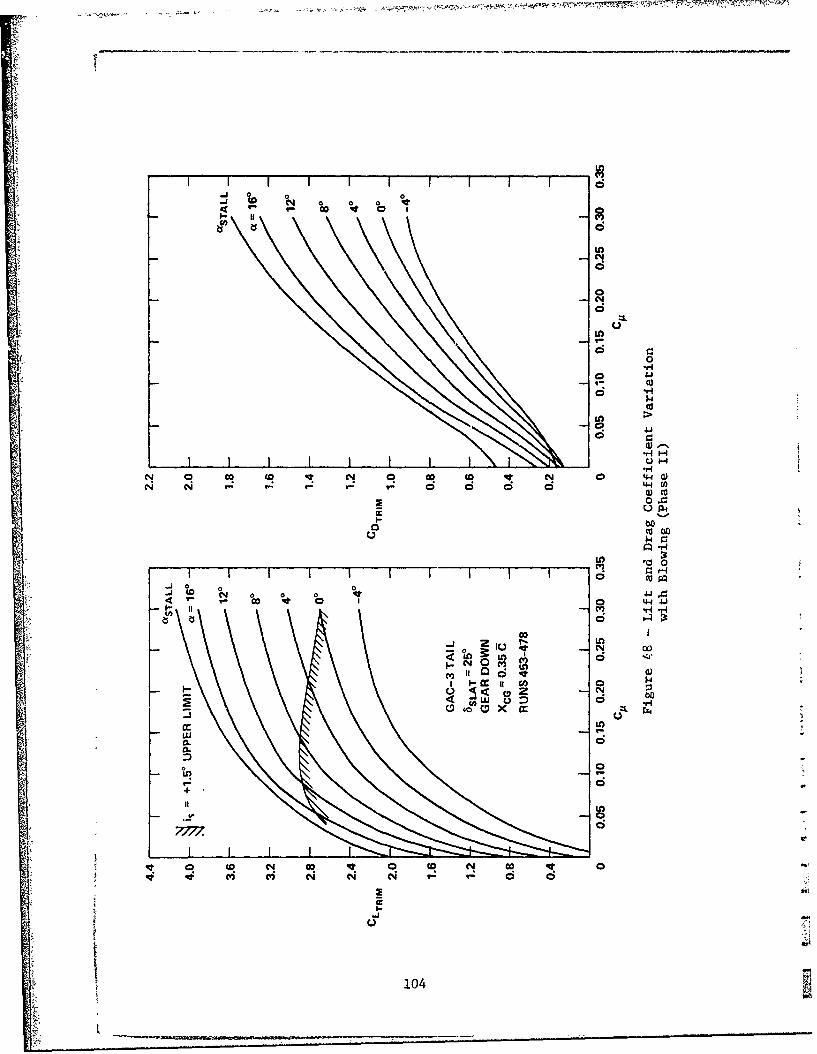
0
d,
0
4941
0) -*
N~~~~~c 0 D0N 0
$4 00
J o 0
0- IT 4 0 1
coo
N0 0 m4
Z 00
LUU
0104

0.0 GAC-3TAIL C$1RUNS 453.478 0 04.0 X q 0.3o 5V0 o0
.4~ac~SALL0 0.050.20 STALL 0.10
N 0.20
3.6 <4 0.30
.. • 0.10' I3.2i" is= +1"5e
UPPER LIMIT ON PRODUCTION A-6A• [ 0.05
2.8
2.4
E 2.0TALLI -+-
1.6
1.2
if 0.8
!• 0.4
L. E. DOWN L.E. UP of= 4
-0.4 II I-16 -12 .3 .4 0 4 8 12 16
STABILIZER SETTING, is, DEG
Figure 49 - Tail Incidence Reauired to TrimFinal Phase II Configuration
3 105

.00 0N
~~~"u 0~'iI
W aU\ \ -,
\ \-\ \ C0C
0* cs4L4 44
4j .1
cJ. -- aJm gLq C fi! i 0L -H
oH r44-
>I C)0C.
"0 u
0T -- 0 op'
Co) 4 0~0\.C
C60 - L
-(La
<- - U
N.e:4 .0. -
-e&
4-6.a
0
Ig Cr
106p

L Figure 50 (Continued) 5o 00. +30
4.0 - RUN NO.
is.*§ PEG o Cp .30
0 +7 751+3 702 734
3.5 -- 0 0 748 750--5 745 747
A -10 752 765(q - 15) CM =0.30O -15 742 744
3.0 - <o .18 738 741V 7.24 735 737
q = 25 psf
X5g - 0.35Ci2.5
CL 2.0 - 0° +3
is -240
1.5 --
S~CA =0
1.0
S0.5
0
..5I I ,IIIII .1.0 0.8 0.6 OA 0.2 0 -0.2 -04 -0.6 -0.8 .1.0
CM ,35E
Figure 50b - Pitching Moment at Xcg 0.35
S~107
1 ~ . - ~ f ~ w o ~ _ _ _ _ _ _ _ _ _ _ _ _ _ _ _ _ _

Xcg 0.35V, EC - 40 - 10 - D TAIL, GEAR DOWN (RUNS 732 - 752)S~4.5 L
STANDARD A6A TAIL INCIDENCE RANGE, FLAPS DOWN KN
4.0 30
3.5 L.
3.0
C= 0.10 H
2.5
C -LTRIM
2.0
1.5j
% C = 0.0 -
1.0 %
STANDARD A-6A Bf 300 %
Xcg 0.253C, CONVENTIONAL TAIL
(REF, 8)
L. E. DOWN L. E. UP0 I I I I I I
-28 -24 -20 -16 -12 -8 4 0 4 jSTABILIZER SETTING, is, DEG.
Figure 51 - Tail Incidence Required to Trim ]Final Phase III Configuration
108

4 .5 1 1 1 1 1 1 1
Xcgu 0.35E, EC -40 -10- D TAIL, GEAR DOWN (RUNS 732 -752)
Cm 30.30 0 m APPROACH CONDITION, a STALL - 1 0 04.0 I | ~ - -L/De WHERE CD = CD +
II .... L/D FOR STANDARD A-6A
I
3.5
3.0
2.5 % IS• '0.20•
2.0 I
0.10
1.5 C- =0.
"/0.05J A. -6A CLEAN (6 f=8
S =0°)
1GEAR UP
11.0
m U
A.6A 8 0 000[10.5 100, 4w
0 1 2 3 4 5 6 7 8 9 104 TRIM LIU
j Figure 52 -Trim Lift-Ta-Drag Ratio for the
Final Phase III Configuration
1 109

0I
5' -o
N-0
0 -
t N n 0 0n010 ir
N N
too
co w
N aLnD 0I
110- J4

Z44
H4)00
0$4
0)4-H
4-4~
0) L
co
C> 00
LO cougiWq Y 0 CI

cc 4
9-
S 00
00
ai 0
W \4
p a%U.U
iLi
a c
0
to o o 444i 0 N 1J
4-4 UwillV4
>
-. 4 4% Ic 0~ td
CC 0 x rda MM o
0 C)w x
Z LL 0 .4
ulu
00w 0 ,.> '-4cc
co.-'4!
112
N_____________
4W4-

i I t
STANDARD A4A TAIL INCIDENCE RANGE,FLAPS DOWN
4.0/0 GAC-6RA TAIL,
GEAR DOWN, Xcg = 0.35T (EXCEPT AS NOTED)RUNS 768-776
CM 0.303.5 - • .
3.0
C4 0.10
2.5
I,-
2.0 -0.35a 0.38F-
Xc9 0.32 "
i! t •;A-6A, 8f =360S1.0 -- CONVENTIONAL TAIL
i Xcg = 0.253F
Figure inal P InCi ne qur ICtio T
Final Phase IV Configuration

0 .
z <V I V.
In 0
44~4 C: I
411
0 441 0
4 1u 41 wI
00 0. 0 C.
L14
coo
cr.4
1140

+ a+00
0 0v
0 C
0) 0 0
q tan
I.0 -H
5-+ +0 0
c< H $.O . 0
I C;
0 44
4-4 _ _4_
4-4n
400
0) 0n C,~4$

C4l
(0
00 u
00IVn
00UH
a. in U? U! 0q
N 0 ,c
Cý x
+In0 r
r11

UL
Ita
I-r
0U
j 4
00
-n 0 0LC-1 N YYIUI C4
0
V~~1 00~J~.I1 - 0O
ur 0
1.04
ro4o
.L fn
If~~c _ _ _ _ _ _ _ _ _ _ _ __N
I I I I 117

F
SI ! I i I I 1. I ,
STANDARD A-6A TAIL INCIDENCE RANGE 1 4.
-240 A-6/CCW FLIGHT DEMO. RANGE
"4.0-C/MAX TRIM
Xcg 0.35Z"•"-21.5 GAC-6RA TAIL
3.5- -21.50 GEAR DOWN
(FROM RUNS 843-876)-
3.0 --
C= 0.30
A,.r
2.5 0.202.5--
-II2.0-
0.10
1.5- C =0
% 0.05
1.0- -
STANDARD A-6A .I=300 Xc =0.253E'
"FLAP05(REF. 8) %0. o~ - ,%
0 ! I I I I II.
-28 -24 -2 -16 -12 -8 -4 0 4 8is, DEG
Figure 60 - Tail Incidence Required to Trim
Phase V Flight Demonstrator Configuration 1
'118

( ~ Xcg 0.35 EGAC-6 RA TAIL
4.0 CM = 0.3 GEAR DOWN
"ICM =0.2 L/D
3.5
j 0.1
'I• I3.0--
005
2.0 % M1.5 --
A-6A CLEAN(f = 0)IA I f• ( I / GEAR UP
• Xcg = 0.253 F
1.0
0 0.5 -,
-S -;-#,
0 0 2 3 4 5 6 7 8 9 10
X1, TRIM L/D
Figure 61 - Trim Lift-to-Drag Ratio for the
-- Phase V Flight Demonstrator Configuration
*11

Phs II
12

I
,• " .C; = 0 CL =1.36 CD =0.173
'iI
I
I I
I C, =0.21 CL = 3.23 CD =0.988
.- is =-100
]; %a 130
c = 15.388 IN.
I' Figure 63 - Tuft Photographs of
Flow Over Ground Plane in
Phase II
]ii 121
I-

8 C 8 C4o C
d
8 NN
-H 0 0)M
p.14
0- to 0 i e C
E- MX
V q
q 0 0
14 N I
ItILrj 123
_ _ __

C(
0 ON
4~0"u
4a 00
co,
N
00 8
444vii C II
CID-
A co
00
1.4 94C
1241

I
I ' I I I I I . .
GAC-3 TAIL, GEAR DOWN, Xcg 0.35Z_,4.5 DRAG BRAKES RETRACTED, • , 15.38B in.
og= c.g. HEIGHT ABOVE GROUNDPLANEh AT ag 00,
S0.30
•i4.0- 20 5
,2.50.20
• 3.5
;i3.0
• 2.5 -
2.0 -0 0.0/
L AT ce 180 (MAIN GEAR IMPACT AThg/-: 0.833)I 1.5
i!--
C!,
0 2 3 4 5 6 # o
f hg/a
Figure 65 - Ground Effect on Trimmed MaximumLift for the Final Phase II Configuration
125- Jý

4A E 1.8 nxg031
GAC-3 TAIL, GEAR~ oOWN, 538i.,Xg .5
4.0 0
v 0.320
0 0.210
cc
0.105
2.8.0 0 - - - - -0-O0.320
2A
2. -- 0-- ----- -.00.105
1.6 0-- 0-------- .//--0 0.053
1.2
0.83 1.4
012 4' 6
ligure 66 - Groufld Ef fect on TrimmaedLffo
1ia phase 11 Configuxrationl
- --------

i+• i .0,I 4.0 1.645hg/.00 3.091
+ •t a=120
3.5- GAC-3 TAIL, is -- 50
GEAR DOWN , 3Xu 0.35F 0.833C= 0.2 1 -
3.0-
-
'Joi! 00
2.5 /
2.0
00 3.091CL o- 1.645
1.50.833
,1.0 C=0.0 012°
C h0•.h RUN
0.5 QI 3.91 465A1.645 -
0 0.833 5330 0.21 00 4680_ _ _1_ 3.091 468A
0 1.645 509A3 0.833 536
4 .0.5
1.0 0.8 0.6 0.4 .0.2 0 -0.2 -0.4 -0.6C
+. CM0.35d
Figure 67 - Ground Effect on Pitching Momentfor Final Phase II Configuration
127

Figure 68 - Drag Generated by FinalPhase I Configuration
4.0 I I
is -10 TPAIL: SLAT 2, FLAP 4, TIP DROOP & FAIRING
3.5 - WING TIPRUN GEAR PYLONS STORES DRAG BRAKES COMMENTS
a 216 UP OFF OFF 0° PH. I FINAL WING AND TAIL0'3 DOWN I GEAR DOWN0237 ON PYLON DRAGN• 241 4 FUEL TANKS STORE DRAG
3.0 A 245 OFF OFF 60* DRAG BRAKES
-II--STANDARD AC2A, TRIM DATA, t f 30',Os 260, GEAR DOWN, REF 12 (.0163 ADDED TO C1TO CONVERT TO MODEL SCALE). NO PYLONS, STORES OR DRAG BRAKES.
2.0
CL •-"< "
0.510 -
-0.5
128
F
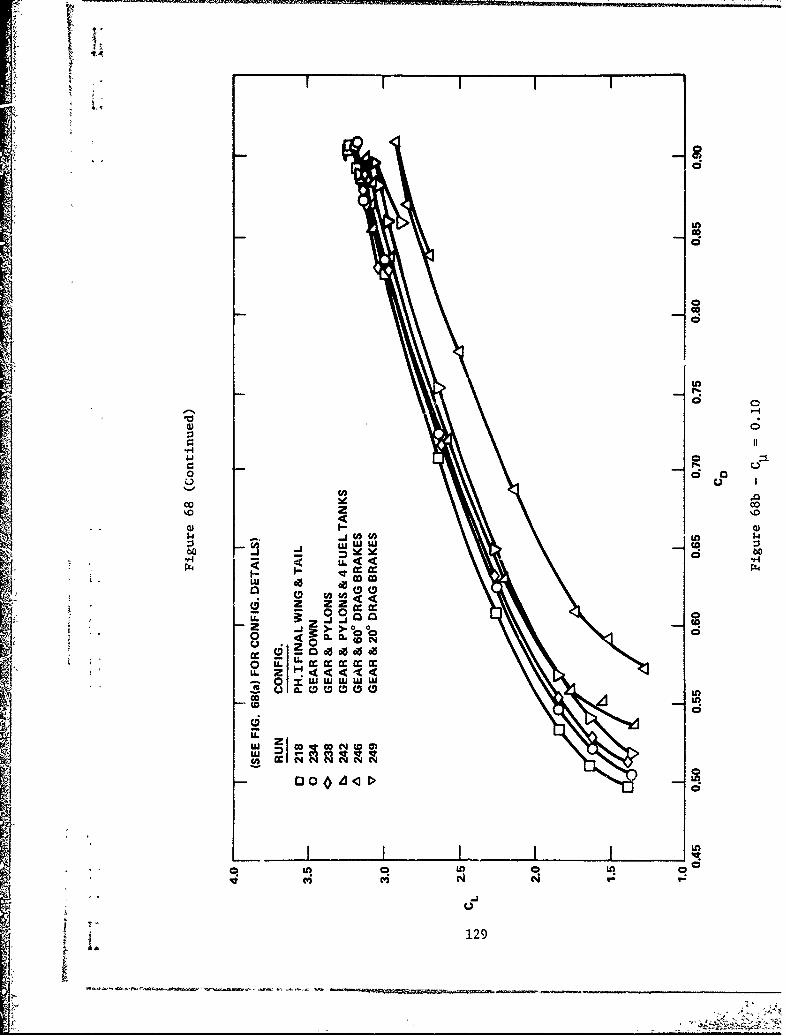
A
I 4)Uj LU Ldo44 I*wccP
L~ incacoc
0' 0
u I L00C DI
LLX- Z~* 00 00~ IN I

C') (D
!o oo
OCLO000
8 0 0
21 1 ..C.)o%.m
ri 0 4 C
... iNU C IY' N
JU I'~ CJN-
lg::
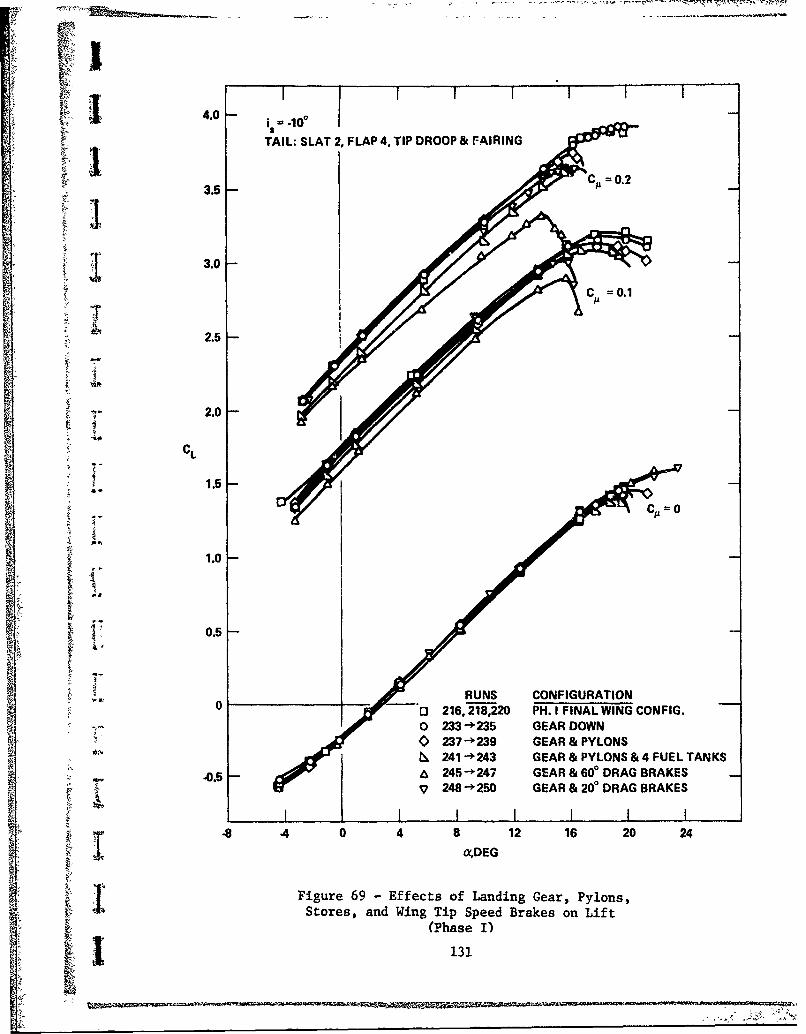
4.0 i
TAIL; SLAT 2, FLAP 4, TIP DROOP& FAIRING
3.5II
2.02.5
S~2.0
CL
,X 1.0
S10.5
_____._RUNS CONFIGURATION0 .. 216,218,220 PH. I FINAL WING CONFIG.
0 233-+235 GEAR DOWN0 237--239 GEAR &PYLONS
O b, 241 243 GEAR & PYLONS & 4 FUEL TANKS.0.5 245-247 GEAR & 600 DRAG BRAKES
S248-+250 GEAR & 200 DRAG BRAKES
SIItI I I I.8 .4 0 4 8 12 16 20 24
aDEG
Figure 69 - Effects of Landing Gear, Pylons,
-. Stores, and Wing Tip Speed Brakes on Lift(Phase I)
131

4.5
GAC-3 TAIL, i =-15", GEAR DOWN
4.0
3.5 0
3.0
CL %
2.5 9'
Cj= 0.30
2.0 0.20
1.5 /TAILSTALLED 0.10
1.0 BRAKES 600 BRAKE
RETRACTED DEFLECTION
RUN CM RUNo 453 0.10 C> 450
0.5 6454 0.20 V 451o 455 0.30 < 452
SI I I ______
1.0 0.8 0.6 0.4 0.2 0 -0.2 -0.4
CMo.35E
Figure 70 - Effects of Fuselage Speed Brakeson Pitching Moment (Phase II)
132

4.
CL
2.5
2.0
DECREASING of= FLAGGED1.5 DATA AND DASHED CURVES
-40-1 0-D TA=IL O.10% XCg 0.35Eq =l5 psf
1.0I0 4 8 12 16 20 24 28
ao, DEG
Figure 71 - Post-Stall and Stall HysteresisEffects on Lift (Phase III)
1• F 133

u..
> I Ic0*
In w
0 C
H 44
to 41 HC~cn
It cc W
x l0 DII I I 1-I p. -
0C P.4) 0 .
1) CSI
00 N
v7UJO
L r
NN
LC
134 f

4.5
DECREASING c= FLAGGED Ot 19.60 oi 19.60DATA AND DASHED CURVES 169
4.0 -MO.3 U CD
~940 20.40
3.5/21.10 21.10
3.0 /a= 1.80 i - 1.80
CL 21.80 a,0 0 2 a=O0
2.5 2
EC-40-10--D TAIL
2.0 - a= 27.30 "t = 27.30 Xg= 0.35Fis =_. _10°
q = 15 psf
1.5 I I I I0.8 1.0 1.2 1.4 1.6 1.8
:• ! ~~~1.0 ,, !,,
0.4 0.2 0 -0.2 -0.4 -0.6! CM0.35 7C
iii
Figure 73 - Post-Stall and Stall HysteresisEffects on Drag and Pitch,
1C 0.30 (Phase III)
135

OM0
0
0007 00
tit 0*
c. Y
0 In 0 Q 0 I C i 0U
0 Ln N0
d 0
ZNmf 0 w ;j
m je Ntu40+ -W 410r
0~ 94H >
-J
UC~0 H -96
Zco
0 ! U) q U)Cd N C?0U)r4 .
9 C~ ~ 4 -136

j 4r I* I I
00
tt-t~ In
CA LfC
aca
44R co t C
~ lII
"0
N~ LL -0
0
4N M
C) *0 >0Q
e' 'o.a
nL L n -
113

2 4-4
r- r-
0 0
F-4
r-4
c-l
0C0)
olow
VI
138

'TI
Vm
1 43
i13

-H
PU Q
I- +10
Uc
*P.,
- IH
-140

'S.
I;b I4IZ4 A
II'S
*>�* I* -
I:5C)
C-� .I-J C
- C2 0
C-,'U4
Cl .0
Cl
-4 ,
A'A I -""->--- C)- C
'-I'-4
4
II
'S ¶
-is
'C
4 C4
-544
.4
7 -� ;241:�*�4C
-t II 141
� 'K'54

I.Lui 0
j0
z ca -J
w
OLu wA
I.->
In ICLd
CL wI-.
awI
x 4--
cnZu
cc. 4I
0 r.00143

hnom = .0156 in.
0.022
he = .0078 in.
(RUN 312)
0.020hnom = .0117 in.
0 (RUN 311)
0.018 -0
0.016
I 0.014
00
0.012
0.010
0.008
0.006 --
I I .0 10 20 30 40 50
Pd2(psig)
• •'22
Figure A.4 Static Calibration of Slot Heightas a Function of Duet Pressure (Phase I)
144

_ _ _ _ _ _ _ _ _ _ _ _ _ C
'U.
-;(LL, >
caa4 U C) a.
OZ NU
0
0)
8Z
X j
w anu. z-.r
w
44
I0N
145

S-i ~ i I i ' I f ! i I I I I i II ' I I I ! I I I I
PHASE 1, =40
RUN hAv,(in.) P-- (psia) Td (0F)1A[ 306 .0156 14.577 74.0
0 311 .0117 14,597 70.0k 312 .0078 14.612 72.0 0.0078
1.2-hAV 0.0156 0.0117
4 Measured p0.0156SIsentragic calculation, assuming no slot expansion
1.0 --
U 0.0117
S0.8 -
0. 0.0078
0 A00*~
0.2.0-
09
1.0 1.5 2.0 2.5 3.0 3.5 4.0PD2 /P-o
Figure A.6 - Measured and Isentropic Weight Flow asFunctions of Slot Height and Pressure Ratio
146L_
-I
I
II
I DTNSRDC ISSUES THREE TYPES OF REPORTS
1. DTNSRDC REPORTS, A FORMAL SERIES. CONTAIN INFORMATION OF PERMANENT TECH-NICAL VALUE. THEY CP, RRY A CONSECUTIVE NUMERICAL IDENTIFICATION REGARDLESS OF
THEIR CLASSIFICATION OR THE ORIGINATING DEPARTMENT.2. DEPARTMENTAL REPORTS, A SEMIFORMAL SERIES, CONTAIN INFORMATION OF A PRELIM-
INARY, TEMPORARY, OP PROPRIETARY NATURE OR OF LIMITED INTERE-ST OR SIGNIFICANCE.J THEY CARRY A DEPARTMENTAL ALPHANUMERICAL iDENTIFtCATION.
3. TECHNICAL MEMORANDA, AN INFORMAL SERIES, CONTAIN TECHNICAL DOCUMAENTATIONOF LIMITED USE AND INTEREST. THEY ARE PRIMARILY WORKING PAPERS INTENDED FOR IN-TERNAL USE. THEY CARRY AN IDENTIFYING NUMBER WHICH INDICATES THEIR TYPE AND THENUMERICAL CODE OF THE CRIGINATING DEPARTMENT. AN'Y DISTRIBUTION OUTSIDE DTNSRDC;UST BE APPROVED BY THE HEAD OF THE ORIGINATING DEPARTMENT ON A CASE-BY-CAS-,• 9ASIS.
I
gIII