Development of techniques for the quantification of DNA from...
124
TECHNISCHE UNIVERSITÄT MÜNCHEN Lehrstuhl für Allgemeine Lebensmitteltechnologie Development of techniques for the quantification of DNA from genetically modified organisms in processed foods Francisco Xavier Moreano Guerra Vollständiger Abdruck der von der Fakultät Wissenschaftszentrum Weihenstephan für Ernährung, Landnutzung und Umwelt der Technischen Universität München zur Erlangung des akademischen Grades eines Doktors der Naturwissenschaften (Dr. rer. nat) genehmigten Dissertation. Vorsitzender: Univ.- Prof. Dr. G. Cerny Prüfer der Dissertation: 1. Univ.- Prof. Dr. K.-H. Engel 2. Priv.- Doz. Dr. M. L. Niessen Die Dissertation wurde am 25.11.2004 bei der Technischen Universität München eingereicht und durch die Fakultät Wissenschaftszentrum Weihenstephan für Ernährung, Landnutzung und Umwelt am 25.01.2005 angenommen.
Transcript of Development of techniques for the quantification of DNA from...

TECHNISCHE UNIVERSITÄT MÜNCHEN
Lehrstuhl für Allgemeine Lebensmitteltechnologie
Development of techniques for the quantification of DNA from
genetically modified organisms in processed foods
Francisco Xavier Moreano Guerra
Vollständiger Abdruck der von der Fakultät Wissenschaftszentrum Weihenstephan
für Ernährung, Landnutzung und Umwelt der Technischen Universität München
zur Erlangung des akademischen Grades eines
Doktors der Naturwissenschaften
(Dr. rer. nat)
genehmigten Dissertation.
Vorsitzender: Univ.- Prof. Dr. G. Cerny
Prüfer der Dissertation: 1. Univ.- Prof. Dr. K.-H. Engel
2. Priv.- Doz. Dr. M. L. Niessen
Die Dissertation wurde am 25.11.2004 bei der Technischen Universität München
eingereicht und durch die Fakultät Wissenschaftszentrum Weihenstephan für
Ernährung, Landnutzung und Umwelt am 25.01.2005 angenommen.

Acknowledgements
I would like to thank Prof. Dr. K.-H. Engel for many years of confidence in my person and in
my research. His valuable guidance and his reliability as my mentor made possible the
completion of this work.
I would also like to thank Dr. U. Busch at the Bavarian Health and Food Safety Authority for
providing the technical facilities needed for the performance of most of the experimental
research. Additional and special thanks to Ms. B. Mühlbauer, Ms. I. Schneider and
Ms. C. Holzapfel for their helping hands and their active support in the lab.
Also special thanks to my colleagues at the Chair of General Food Technology and partner
institutes. Andreas Miller, Alexandra Ehlert, Thomas Frenzl, Iulia Poplacean, Marta Dregus,
Hans-Georg Schmarr, Gerhard Gerstner, Andreas Roß, Christine Hupfer, Willibald Kamm, Ron
Baudler, Carsten Lück, Ludwig Adam, Ingrid Sperti, Gabrielle Taubert your daily support and
your friendship have helped me through the years.

A mi amor, Ivana Moreano,
a mi adorada familia
y en recuerdos de mi querido Papún…

Table of contents I
1. INTRODUCTION AND OBJECTIVES 1
2. BACKGROUND 3
2.1. BIOTECHNOLOGY-DERIVED CROPS 3
2.1.1. Agronomic traits 4 2.1.2. Quality traits 5
2.2. LEGISLATION REGARDING THE USE OF GMO AND GMO-DERIVED PRODUCTS IN FOOD AND FEED
IN THE EUROPEAN UNION (EU) 8
2.2.1. Traceability 8 2.2.2. Labeling 9 2.2.3. Surveillance 11
2.3. METHODS FOR DETECTION OF GM CROPS IN FOODS 12
2.3.1. Protein-based methods 12 2.3.2. DNA-based methods 13 2.3.2.1. Detection of DNA sequences via PCR 13 2.3.2.2. Competitive PCR 16 2.3.2.3. Real-time PCR 18
t
2.3.2.4. Limitations of the relative quantification of GMO contents 21
2.4. CHALLENGES SPECIFIC TO GMO-ANALYSIS IN COMPOSED AND PROCESSED FOODS 23
2.4.1. Food composition 24 2.4.2. Degradation of analytes 24 2.4.2.1. Pro eins 25 2.4.2.2. DNA 26 2.4.3. Limits of detection and quantification 31
3. MATERIALS AND METHODS 33
3.1. MATERIALS 33
3.1.1. Reference materials 33 3.1.2. Transgenic maize Bt-176 and conventional material 33 3.1.3. Transgenic maize MON810 and conventional material 33 3.1.4. Bakery mixes 33 3.1.5. Competitors, primers and probes 34 3.1.5.1. Competitive PCR 34 3.1.5.2. Real-time PCR 35

Table of contents II
3.1.5.3. Ligation-dependent amplification 38
3.2. METHODS 39
3.2.1. DNA extraction 39 3.2.1.1. CTAB method 39 3.2.1.2. Wizard method 39 3.2.2. Electrophoresis 40 3.2.3. Photometric DNA analysis 40 3.2.4. Design of primer and probes 40 3.2.5. Quantitative competitive PCR 41 3.2.5.1. Standard DNA mixtures with defined GMO contents 41 3.2.5.2. Heat-treated DNA standards 41
t
r
r
3.2.5.3. Heat- reated flour samples 41 3.2.5.4. Competitive PCR 41 3.2.6. Quantitative real-time PCR 42 3.2.6.1. Preparation and characterization of milling products from maize 42 3.2.6.2. P eparation of milling fractions with defined GMO proportions 42 3.2.6.3. P ocess of ethanol production from maize 43 3.2.6.4. Real-time PCR 44 3.2.7. Ligation-dependent amplification 46 3.2.8. Fragment length analysis 46 3.2.9. Sequencing 47
4. RESULTS AND DISCUSSION 48
4.1. RELATIVE QUANTIFICATION OF GMO CONTENT VIA DOUBLE-COMPETITIVE PCR 48
4.1.1. Introduction 48 4.1.2. Preparation of a calibration curve on the basis of DNA standards 49 4.1.3. Quantification of Bt-Maize proportions 51 4.1.3.1. Heat- reated DNA mixtures 51 t
t4.1.3.2. Heat- reated maize flour 53 4.1.3.3. Bakery mixes 54 4.1.4. Summary 56
4.2. INFLUENCE OF PARTICLE SIZES ON THE DETERMINATION OF GMO CONTENTS 58
4.2.1. Introduction 58 4.2.2. Preparation and characterization of milling fractions 59 4.2.3. Influence of particle sizes on the efficiency of DNA extraction 61 4.2.4. Relative quantification of GMO in mixtures of different milling products 62

Table of contents III
4.2.5. Summary 66
4.3. INFLUENCE OF DNA DEGRADATION ON THE RELATIVE QUANTIFICATION OF GMO 68
4.3.1. Introduction 68 4.3.2. Thermally induced degradation of DNA in maize milling products with different
particle size distributions 70 4.3.2.1. Recovery of target sequences at different degrees of DNA degradation 70 4.3.2.2. Effects of length differences between recombinant and reference target sequences
on relative quantification results 74
t
4.3.3. Degradation of DNA within the process of ethanol production from maize 78 4.3.3.1. Quantification of GMO proportions at differen stages of DNA degradation 80 4.3.3.2. Redesign of a quantitative real-time PCR method for the determination of GMO
contents in highly processed samples 82 4.3.4. Summary 84
4.4. SIMULTANEOUS DETECTION AND RELATIVE QUANTIFICATION OF GMO BY
LIGATION-DEPENDENT PROBE AMPLIFICATION 87
4.4.1. Introduction 87 4.4.2. Design of an LPA-system for the detection of reference genes and event-specific
regions in the genomes of maize MON810 and Roundup Ready soya 90 4.4.3. Assessment of target specificity and sensitivity 92 4.4.4. Construction of calibration curves for quantitative analysis 95 4.4.5. Summary 97
5. SUMMARY 99
6. ZUSAMMENFASSUNG 102
7. REFERENCES 106

1 Introduction and objectives 1
1. Introduction and objectives
Advantages and potential risks arising from the application of genetic engineering in
agriculture and for the production of foods and feeds have been discussed controversially.
This applies especially for Europe, where the skepticism towards this new technology has
been the strongest. Public pressure and concerns regarding the suitability of initial strategies
for the assessment of long-term adverse effects on human and animal health, as well as on
the environment resulted 1999 in a de facto moratorium of the authorization of further GMO
and GMO-derived products [1]. A revocation of this measure was linked to the development
of more rigorous and transparent regulatory frameworks [2].
As regards the use of GMO or GMO-derived material for the production of foods and feeds,
this objective has been accomplished by the recent enforcement of Regulations
(EC) No 1829/2003 and (EC) No 1830/2003 [3, 4]. Genetically engineered foods have been
removed from the scope of the “Novel Foods Regulation” and its amendments [5-8]. The
novel legislative package has introduced harmonized provisions for the risk assessment and
authorization of GMO and GMO-derived products, as well as for their traceability, labeling
and post-marketing surveillance.
Although labeling requirements are foreseen to be independent from the detectability of
recombinant DNA or proteins, a threshold strategy will kept being followed for consideration
of adventitious contaminations with GMO material. This is supposed to provide industry with
concise criteria for the declaration of products and will ensure the availability of adequate
information required by consumers to make use of their freedom of choice.
The availability of appropriate analytical methods for the detection of GMO is a matter of
crucial importance; not only for governmental laboratories responsible for the performance
of surveillance testing, but also for the private sector. In the latter, methods of detection
might be taken by operators as a supporting measure of quality assurance (e.g. in addition
to traceability documentation), or might even build the core business of companies
specialized in the implementation and monitoring of segregation and/or identity preservation
systems. This broad field of applications has been the background for tremendous research
activities for the development and validation of qualitative and quantitative methods suitable
for the detection of GMO in raw materials and processed products [9-12].
It has been acknowledged that the most appropriate strategy for GMO-analysis is given by
the detection of the recombinant DNA itself, whereas in some cases, recombinant proteins
may represent alternative analytical targets for the detection of genetic modifications in

1 Introduction and objectives 2
agricultural commodities. Assays for the detection of GMO within the food and feed chain
must cope with a number of challenges, which are linked either to the background of the
genetic modification of the GMO and the genetic composition of the sample material [12,
13], or to adverse effects of technological parameters and manufacturing practices on the
availability of target compounds [11]. Among the latter, limitations are set by the complexity
of food composition and by the degradation/elimination of analytes during manufacturing
processes.
Within this context, the objective of the following studies was to assess critical factors (i.e.
technological steps and practices used in the industrial production of foods and feeds) that
might influence the results of quantitative GMO analyses. Research should be performed
under application of established technologies for the quantitative detection of DNA, such as
competitive PCR and real-time PCR. Special focus should be given to effects related to the
distribution of particle sizes in composed foods and to the degradation of DNA in the course
of food processing.
Experiments to study the determination of GMO contents in composed foods should be
performed using diverse formulations, containing milling fractions of maize with different
particle size distributions (from coarse grits down to fine flours). Such formulations are
widely used in industrial applications, e.g. in bakery mixes, to regulate important functional
and sensory characteristics of the products.
Studies of the influence of DNA degradation on the determination of GMO contents should
be performed in samples taken from different stages of processing; i.e. during model heat-
treatment experiments, or in the course of a more complex, lab-scaled process of ethanol
production from maize. Taking into account that manufacturing steps can range from simple
mechanical procedures (e.g. separation of milling fractions) to complex sequences of
chemical reactions, it is very likely that DNA molecules embedded in the matrices of different
ingredients might not be equally accessible to analysis or might have been subject to
significant degradation.
Additionally, alternative strategies for the qualitative and quantitative detection of GMO in
composed and processed food products should be developed. Of special interest was the
development of modular systems that might contribute to overcome analytical challenges
related to the steadily increasing number of GMO that need to be detected.

2.1 Biotechnology-derived crops 3
2. Background
2.1. Biotechnology-derived crops
Recombinant DNA technology has allowed the targeted modification of the genetic
composition of crops resulting in organisms with novel traits, as well as in agricultural
products with enhanced properties. The potential of genetic engineering has been exploited
extensively within the past decade. A wide variety of plants are genetically modified; more
than 150 different transformation events have been authorized worldwide by competent
governmental authorities [14]. The estimated global acreage under cultivation of transgenic
crops has increased from 1.7 million ha in 1996 to 67.7 million ha in 2003, representing at
least for the past seven years, an unbroken annual growing rate of over 10% [15].
Genetically modified varieties with the greatest importance for agricultural farming are
currently soya, followed by maize, cotton and canola. As regards the significance of
recombinant traits, most of the commercially grown GMO show tolerance against specific
herbicides (73%), followed by insect-resistant crops (18%) and by plants with stacked genes
exhibiting both traits (8%).
Genetically engineered food and feed-grade varieties being currently cultivated at
commercial scale belong to a first generation of GM-crops; being primarily conceived to show
enhanced agronomic properties in terms of herbicide tolerance and/or insect resistance. The
introduction of these traits has resulted in a restrained use of herbicides and insecticides,
simplifying agricultural practice and reducing the costs for the production of agricultural
commodities [16].
The initially rather limited spectrum of biotechnological applications was expanded by the
development of subsequent GM-crop generations showing further valuable agronomic traits.
Basically, such modifications aim at the improvement of the agricultural productivity, either
by generating organisms resistant to adverse environmental conditions or by preventing crop
losses owing to pests and diseases. Subsequent genetic engineering applications have been
additionally focused on the enhancement of a wide variety of quality traits in agricultural
products and derivatives thereof. In regard to the expected benefits, novel applications can
be categorized in several groups including a) the improvement of important sensory
properties and the prolongation of shelf-life of perishable products, b) the enhancement of
content, composition or bioavailability of macro- and micronutrients, increasing the
nutritional value of staple foods, c) the enrichment of health-relevant endogenous

2.1 Biotechnology-derived crops 4
compounds with functional characteristics and d) the development of industrial foods
showing enhanced processing properties and modified structure or composition.
In contrast to the first generations of GM-crops conceived for the expression of single
recombinant genes, latest developments have been increasingly linked to the modulation of
existing, or the engineering of new metabolic pathways. This has resulted in a growing
pressure to acquire detailed knowledge on the function of (and interactions between)
biosynthetic and metabolic networks.
2.1.1. Agronomic traits
The best-known examples of herbicide-tolerance are Roundup Ready™ soya, maize, cotton
and canola. The active agent in the broad-spectrum herbicide Roundup® inhibits the plant 5-
enolpyruvylshikimate-3-phosphate synthase (EPSPS), which plays a crucial role in the
production of essential aromatic amino acids and other aromatic compounds. Herbicide
tolerance was achieved by the expression of a microbial CP4-EPSPS from Agrobacterium
tumefaciens, which shows low affinity to the active agent glyphosate [17]. Crops tolerant to
glufosinate ammonium, the active compound in phosphinothricin herbicides (BASTA
®, Rely®,
Finale®, and Liberty®) were generated by the expression of the phosphinothricin-N-
acetyltransferase (PAT) from Streptomyces viridochromogenes. This enzyme catalyzes the
acetylation of phosphinothricin, detoxifying it into an inactive compound [17].
Even in industrialized countries a major percentage of crop harvests are lost to pests and
diseases. Within this context, transgenic crops have played an important role delivering new
strategies for the management of pest and disease control measures. The best-known
example for the control of insect pests by means of genetic engineering is represented by
the expression of genes encoding for insecticidal δ-endotoxins from Bacillus thuringiensis. Bt-
toxins have been shown to act highly specific on a wide range of target organisms and have
acquired a long history of use as biopesticides [18]. A number of genes encoding for δ-
endotoxins have been successfully introduced into the genomes of maize, potato, tomato
and cotton delivering crops respectively resistant to corn borers (Busseola fusca, Chilo
partellus and Ostrinia nubilalis), corn root worm (Coleopteran, Diabrotica sp.), potato beetles
(Leptinotarsa decemlineata), tomato fruitworm (Helicoverpa zea) and cotton bollworm
(Helicoperva armigera). Further approaches to confer insect resistance to important crops
are based on the expression of lectins and proteinase or α-amylase inhibitors.
Crops resistant to viral diseases have been primarily generated by the introduction of genes
coding for viral coat proteins. The constitutive expression of such proteins disrupts the

2.1 Biotechnology-derived crops 5
progress of viral infections or the development of illness symptoms. Such modifications have
been described for potato, squash and papaya [17]. Another strategy of pathogen-derived
viral resistance is given by the expression of RNA-dependant RNA polymerase (replicase)
genes, which are believed to act via post-transcriptional gene silencing. This strategy has
been followed to obtain potatoes resistant to leafroll virus, barley yellow dwarf virus-resistant
oats, cucumber mosaic virus-resistant tomatoes, tungro spherical virus-resistant rice and
streak mosaic virus-resistant wheat [19]. Further genetic modifications have been performed
to confer crops with resistance against other forms of biotic stress, i.e. diseases owing to
fungal, bacterial or nematode infections [16].
Genetic engineering has been applied to generate crops showing tolerance to the most
important form of abiotic stress which is dehydration. This kind of stress is linked to drought,
salinity, and cold which induce similar reactions at cellular level [19]. Strategies to confer
crops with tolerance against abiotic stress are based on the modification (transfer or
overexpression) of genes that respond directly to particular environmental stimuli, or that
regulate the expression of stress genes and signal transduction. These include genes that
lead to the accumulation of osmolytes, synthesis of late-embryogenesis-abundant (LEA)
proteins and expression of detoxifying (antioxidative) enzymes [20]. Some of these
approaches have been performed in food relevant organisms such as rice.
The stress-induced expression of regulatory genes was shown to increase tolerance against
drought, salinity and freezing [21]. This was recently proven suitable to increase stress
tolerance in transgenic wheat [22].
Tolerance towards low iron availability in alkaline soils has been achieved in GM-rice by
increasing the production of compounds (siderophores) necessary to bind insoluble Fe(III)
[23].
2.1.2. Quality traits
Important sensory properties of agricultural products have been improved by means of
genetic engineering. One of the earliest approaches, which yielded the first genetically
modified food available to consumers, was directed to delay the softening of tomatoes [17].
This was achieved by inserting an additional copy of the polygalacturonase-encoding gene in
anti-sense orientation in order to reduce expression levels of the enzyme and thus to reduce
pectin degradation. Efforts to generate fruits and vegetables with delayed ripening or
senescence-retarded leafs are either based on the reduction of ethylene levels or on the
sustained biosynthesis of endogenous cytokinin [24, 25].

2.1 Biotechnology-derived crops 6
Further modifications of sensory properties targeted by means of genetic engineering include
the enhancement of flavor, texture and viscosity [26].
Various studies have described the application of genetic engineering to modify the content,
composition or bioavailability of macro- and micronutrients in food-grade crops. The
carbohydrate metabolism was modified to achieve an accumulation of fructanes [27, 28] or
to obtain starches with enhanced functional properties [28, 29].
Especially in staple foods such as rice and potato, an improvement of protein quality is of
interest. This was achieved for rice and potatoes, e.g. by the expression of the seed storage
protein β-phaseolin of the common bean (Phaseolus vulgaris) [30] or the seed albumin from
Amaranthus hypochondriacus [31], respectively.
Approaches for the modification of the fatty acid biosynthesis have been recently reviewed
by Drexler et al. [32]. Among other purposes, these modifications aim at the modulation of
chain lengths and the degree of saturation of fatty acids, as well as the production of oils
containing a particular fatty acid in high proportions, such as high-stearate oil, high-oleic oil
or the accumulation of very long-chain polyunsaturated fatty acids.
The fortification of staple foods with micronutrients is a key issue for the improvement of the
health status of certain population groups. The accumulation of β-carotene in transgenic rice
(referred to as “golden rice”) [33], and the accumulation of iron in GM rice [34], represent
excellent examples for the use of genetic engineering as a powerful tool to enhance the
nutritional value of staple foods. Indirect strategies to enhance the nutritional value of foods
are given either by the targeted reduction of antinutritive compounds, or by the
accumulation of compounds which promote absorption and utilization of nutrients. For
instance, improved iron bioavailability in rice was achieved by the expression of heat-stable
phytase [35, 36]. This enzyme breaks down phytic acid, which acts as a major inhibitor of
iron absorption. A similar effect was achieved by the overexpression of cysteine-rich
proteins, since cysteine peptides are seen as a major enhancer of iron absorption [35, 36].
The enrichment of physiologically active components in agricultural products (i.e. functional
compounds with positive effects on human health) represents a wide research field for
metabolic engineering. In this context, the targeted accumulation of compounds such as
phytosterols and flavonoids represent important efforts, aiming at the production of healthier
foods [37-39].
As regards industrial foods, modulation of the processing properties of wheat flours was
achieved by the modification of the expression patterns of high molecular-weight glutenin
protein genes. It was shown that the bread-making properties were influenced by the quality

2.1 Biotechnology-derived crops 7
and quantity of the expressed genes [40]. A similar strategy was followed to modify the
processing properties of durum wheat for the production of bread and pasta [41].
Barley of improved malting properties was generated by the expression of a fungal 1,4-β-
glucanase showing stability against thermal stress [42]. The recombinant enzyme allowed a
more extensive hydrolysis of β-glucan, resulting in reduced wort viscosity and diminished
amounts of glucan precipitate.

2.2 Legislation regarding the use of GMO and GMO-derived products in food and feed in the European Union (EU) 8
2.2. Legislation regarding the use of GMO and GMO-derived products in food
and feed in the European Union (EU)
Regulatory frameworks in regarding the use of GMO and GMO-derived ingredients for the
production of foods have been established in most developed and in several developing
countries. Regulatory guidelines have been elaborated by international bodies, such as the
Organization for Economic Co-operation and Development (OECD) and the World Health
Organization (WHO) in collaboration with the UN Food and Agriculture Organization (FAO).
In the EU, principles for the authorization, traceability, labeling and surveillance of the use of
GMO-derived products in the food and feed chain have recently been harmonized and
defined in a new legislative package [3, 4]. This provides a common regulatory basis for
foods and feeds consisting of or containing products from genetically engineered organisms,
removing GM-foods from the scope of the “Novel Foods Regulation” and its numerous
amendments [5-8]. Further objectives of the new regulations have been a) to revise and
modify risk assessment and authorization procedures of GMO-derived products destined for
food and feed production, b) to establish a European system for the traceability of GMO-
derived products, allowing the extension of labeling provisions to products where a detection
of GMO-derived material (recombinant DNA or proteins) is no longer achievable, c) to
introduce labeling of GM-feed products, and d) to establish a European Network of GMO
Laboratories that will support the duties of the Community Reference Laboratory, regarding
the development and validation of detection methods, and the performance of surveillance
testing.
In this context, the availability of validated analytical methods for the qualitative and
quantitative detection of GMO in raw materials and processed products is required to support
the monitoring of commodity flow along the traceability system and to allow the control of
compliance with labeling provisions by surveillance testing of products along the food and
feed chain.
2.2.1. Traceability
The establishment of a traceability system as defined in Regulation (EC) No 1830/2003 will
allow the documentation and the monitoring of the flow of GMO and GMO-derived products
at all stages along the food and feed chain. The system will build the basis to enable a
targeted monitoring of potential adverse effects of the introduction of GM-commodities and
derived products on human and animal health, and on the environment. Thus, if unforeseen

2.2 Legislation regarding the use of GMO and GMO-derived products in food and feed in the European Union (EU) 9
risks should be identified, the system will permit a coordinated withdrawal of the products
from the market. As required by Regulation (EC) No 1829/2003, documentation will facilitate
the labeling of the application of genetic engineering for the production of foods and feeds
irrespective of the detectability of recombinant DNA or proteins. This will ensure the
availability of adequate information required by operators and consumers to make use of
their freedom of choice. It has been further acknowledged that in the context of a post-
marketing surveillance program, a reliable identification of adverse effects in relation to the
consumption of a particular GMO-derived product will be only achievable in the case of
product labeling [43].
The implementation of a traceability system will require suppliers to establish adequate
segregation and/or identity preservation procedures to differentiate between genetically
engineered and conventional products [12]. At this level, discrimination of commodities will
permit either the commercialization of certified non-GMO products in markets where their
acceptance is restricted, or in the future, the targeted marketing of GMO-derived products
showing high added values.
As specified in the regulatory provisions, traceability of GMO-derived products is based on
the transmission and holding of transaction information at each stage of their placing on the
market. In the case of products consisting of or containing GMO, information to be
transmitted by the supplier includes a unique code identifier for the respective
transformation event in accordance to Regulation (EC) No 65/2004 [44]. The transmission of
the unique code identifier is not mandatory for foods and feeds produced from GMO.
Operators must guarantee that transaction information is kept for a period of five years. This
includes information about the supplier from whom the products have been acquired and the
purchaser to whom products have been made available.
2.2.2. Labeling
Labeling of the application of genetic engineering for the production of foods and feeds
should enable the consumer to make an informed choice and ensure fairness of trade.
Additionally, labeling will serve as an essential tool in the context of post-marketing
surveillance programs, allowing the correlation of unpredictable adverse effects or alterations
in the nutritional status of the consumer with the consumption a particular GM product [43].
According to Regulation (EC) No 1830/2003, the basis for the labeling of foods and feeds
produced under application of GMO or GMO-derived material is build by data collected during
the implementation of traceability measures; i.e. the documentation of the flow of GM-

2.2 Legislation regarding the use of GMO and GMO-derived products in food and feed in the European Union (EU) 10
derived commodities along the supply chain. This novel strategy allows the extension of
labeling requirements to highly processed products (e.g. refined oils or modified starches),
regardless of the detectability of recombinant DNA or protein. This represents a major
modification of the policy being followed under the “Novel Foods Regulation” and its
numerous amendments, where labeling was triggered by the positive testing of products on
the presence of the respective analytes. A summary of the modifications in the labeling
requirements for GMO-derived products is listed in Table 1.
Table 1 Examples of labeling requirements for GMO-derived products according to the “Novel Foods Regulation” (and its amendments) and to the current Regulations (EC) No 1829/2003 and (EC) No 1830/2003 [45].
Category Product Labeling requirements Previous legislation Current legislation
GM plant chicory yes yes
GM seeds maize kernel, rapeseed yes yes
GM food maize, bean sprouts, tomato yes yes
maize flour (detectable) yes yes
oil refined from rape, maize, soy no yes Foods produced from GMO
glucose syrup from maize starch no yes
Foods from animals fed with GMO feed meat, eggs, milk no no
Foods produced with GMO-derived enzyme
cheese (chymosin), bread (amylolytic enzymes) no no
Food additives or flavorings from GMO lecithin (chocolate) no yes
GM feed maize no yes
Feeds produced from GMO maize gluten, soy grist no yes
Feed additives from GMO vitamin B2 no yes
It is acknowledged that even stringent segregation of crops cannot exclude adventitious
contaminations of agricultural commodities with traces of GMO-derived material. Therefore,
provided that operators have taken appropriate measures to avoid potential contaminations,
labeling is not required if food or feed products contain material derived from authorized
GMO in proportions not higher than 0.9% (considered individually for each ingredient). A
second threshold of 0.5% has been set for products containing material derived from non-

2.2 Legislation regarding the use of GMO and GMO-derived products in food and feed in the European Union (EU) 11
authorized GMO, which have been considered as safe by the European Food Safety Authority
(EFSA). This threshold is one of several transitional measures that will be valid for a period
of three years to ensure the practicability and feasibility of the new regulations. Detailed
rules regarding the implementation of these transitional measures have been provided in
Regulation (EC) No 641/2004 [46]. No levels of tolerance are specified for material derived
from further non-authorized GMO.
2.2.3. Surveillance
As specified in Regulation (EC) No 1830/2003, Member States are urged to ensure the
compliance with labeling requirements regarding the application of GMO and GMO-derived
material for the production of foods and feeds. Inspections and control measures may be
based either on the verification of documentation collected within the traceability system, or
on the surveillance testing of products by means of appropriate analysis methods.
In order to facilitate a coordinated analytical approach for surveillance testing, a Community
Reference Laboratory (CRL) and a supporting European Network of GMO Laboratories
(ENGL) have been designated in Regulation (EC) No 1829/2003. These institutions will be
responsible for the validation of sampling, identification and qualitative, as well as
quantitative detection methods that have been made available by the applicants in the
context of authorization procedures. Qualification of analytical methods for taking part in
validation studies provides that method development has been carried out under
consideration of official technical criteria. Respective technical provisions have been laid
down in Regulation (EC) No 641/2004 and by the ENGL [47].
Technical guidance regarding sampling procedures and the performance of surveillance
testing has been released by the European Commission in a draft paper, with the purpose to
harmonize analytical procedures and provide legal certainty for operators [48]. Here, it has
been stated that official controls may be performed at any stage within the supply,
production or distribution chain, whereas analyses should be performed exclusively by
laboratories accredited according to EN ISO/IEC 17025/2000.

2.3 Methods for detection of GM crops in foods 12
2.3. Methods for detection of GM crops in foods
2.3.1. Protein-based methods
For the detection of GMO in raw materials, various methods based on the recognition of
recombinant proteins have been developed. The most common test formats are sandwich
enzyme linked immunosorbent assays (ELISA) and sandwich-type immunochromatographic
(lateral flow) strip tests [49]. They are suitable for the detection of bivalent or polyvalent
antigens on the basis of a direct double antibody binding strategy (sandwich). The analyte is
trapped between a solid phase antibody and a labeled secondary antibody. Such methods
are available for the proteins expressed in the most important GMO, including insect-
resistant maize, potatoes, cotton or herbicide-resistant maize, potatoes, cotton, soybean and
canola [50-52].
The use of protein-based methods for the detection and quantification of GMO-derived
material in food and feed products is linked to a number of limitations, which strongly reduce
the field of application of such assays. The expression of recombinant proteins is dependant
on the developmental stage of an organism and mostly regulated by tissue-specific
promoters. Consequently, protein levels in unknown samples can be accurately quantified
only if corresponding reference material is available. For instance, different levels of
expression of the recombinant CryIA(b) protein were determined in tissue samples (roots,
leaves, kernels and pollen) of maize Bt-176 [17]. Amounts of recombinant protein could be
determined in green tissues and pollen. However, levels of expression in kernels were found
to be below the limits of quantification of the assay, yielding this analytical target unsuitable
for quantitative testing.
As regards processed products, the stability of recombinant CryIA(b) protein has been
studied during ensiling of Bt maize [53]. The disruption of the maize tissue, the lowering of
pH due to lactic acid fermentation and the action of plant and microbial proteases resulted in
a degradation of the recombinant protein during the ensiling process. After four months of
ensilage, no CryIA(b) protein could be detected by ELISA using immunoaffinity-purified
polyclonal rabbit and protein G-purified goat antibodies specific for the protein.
The importance of selecting appropriate antibody reagents for the detection of recombinant
proteins of different conformations in processed products was demonstrated using herbicide-
tolerant soybeans as example [49]. One ELISA was able to recognize the CP4 EPSPS protein
in soybeans and defatted soybean flakes but not in toasted soybean meal. Hence, a second

2.3 Methods for detection of GM crops in foods 13
test was necessary involving antibodies specifically reacting with the denatured protein as it
is present in the heat-treated material. The limitation of an immunoassay to detect either
native or denatured proteins represents a major drawback of protein-based methods for the
analysis of processed foods. As protein denaturation continuously advances in the course of
processing, the quantitative character of immunoassays would be lost unless innumerable
quantification standards were developed to properly describe the amounts of targeted
proteins at every processing stage.
As regards composed foods, it must be considered that immunoassays yet do not permit
taxon-related quantifications. Furthermore, they are not capable to discriminate between
similar recombinant proteins expressed by different transgenic crops. Quantitative analysis of
food samples, containing different ingredients from recombinant crops, would require the
development of event-specific assays allowing a differentiation of all recombinant proteins.
2.3.2. DNA-based methods
2.3.2.1. Detection of DNA sequences via PCR
The most appropriate methods for the detection of genetically engineered organisms target
at the detection of the recombinant DNA itself. Established assays for the detection of
specific DNA sequences are based on polymerase chain reaction (PCR) techniques. Principles
of this methodology have been described in detail [54]. Aspects essential for the PCR-based
detection of recombinant DNA in samples of composed and processed foods are outlined in
the following paragraphs.
Extraction of DNA and inhibition of PCR
DNA extraction protocols and commercially available kits currently used for routine analysis
have been designed to guarantee high DNA quality and an effective removal of inhibiting
compounds in processed foods or tissue samples [10, 55, 56]. The performance of several
widely applied DNA extraction methods as regards DNA quality and yield has been compared
[57, 58].
Extraction methods have been developed and/or modified in order to recover amplifyable
DNA from highly processed products. Strategies to facilitate the extraction of DNA from
products such as starch or lecithin have been reported [59, 60]. Commercially available kits
based on the use of DNA-binding resins deliver low DNA yields but high DNA quality allowing

2.3 Methods for detection of GM crops in foods 14
the detection of DNA sequences in even highly processed food additives such as lecithin
[57].
Foods are complex systems containing a broad range of compounds other than DNA, which
may inhibit PCR reactions and thus lead to false negative results. Inhibiting compounds may
be inherent in tissues of analytical samples e.g. polysaccharides, lipids and polyphenols, or
may be chemicals applied during DNA extraction [61-66]. The routine use of homologous or
heterologous internal positive controls in PCR reactions represents a simple but powerful tool
to overcome incertitudes as regards false negative results [67].
Sensitivity of PCR
The amplification efficiency in PCR is diminished by factors such as inhibiting agents, reagent
limitation and increasing viscosity of the mixture. In theory, qualitative PCR analysis may
detect even a single DNA sequence in a reaction vessel. Routine testing demonstrated
detection limits to range between one and ten copies of the targeted DNA fragment [68].
The sensitivity of PCR systems is method-specific and depends upon a number of factors,
including DNA quantity and quality, amplicon length, affinity of the primers to the targeted
sequence, presence of inhibiting compounds, composition of reaction mixes, number of PCR
cycles and even the position of the reaction vessel in the thermocycler. Therefore, it is
difficult to make a general statement on the sensitivity of PCR reactions; they have to be
validated on a case-by-case basis [69].
Speci icity of PCR f
f
DNA-based methods potentially offer various targets for the detection of GMO; e.g.
regulatory and marker gene sequences, the transgene itself, as well as overlapping and/or
border region sequences. The level of PCR specificity can thus be modulated depending upon
the position of the primer binding sites that have been chosen for the amplification of target
sequences. The immense flexibility given for the design of PCR assays allows a
categorization into screening, gene-, construct- and event-specific methods [12, 70].
Screening methods target at genetic elements commonly used for the transformation of
crops, such as the Cauliflower Mosaic Virus’ (CaMV) 35S promoter or the NOS terminator
originally from Agrobacterium tume aciens. Their detection strongly indicates the presence of
GMO-derived DNA in the sample. However, positive signals may also be generated as result
of contamination of analytical samples with bacteria or viruses, since these regulatory
elements represent more or less naturally occurring sequences [71, 72].
Gene-specific methods are used to amplify a fragment of the recombinant gene carried by
the GMO. They may provide information about the presence of recombinant DNA, but they

2.3 Methods for detection of GM crops in foods 15
cannot differentiate between transgenic organisms carrying similar constructs, such as in the
case of herbicide tolerant soybean, maize, canola and rice lines carrying a recombinant
phosphinothricin-N-acetyltransferase (pat) gene from Streptomyces viridochromogenes. As in
the case of screening methods, a certain risk of false positive results is still given at this level
of specificity.
In contrast, unambiguous results are obtained if the amplified regions cover overlapping
areas comprising regulatory sequences and the transgene, i.e. sequences that do not occur
naturally [73]. The successful use of this strategy has been demonstrated for the Flavr
Savr™ tomato, glyphosate resistant crops (Roundup Ready cotton and soybeans) and
several transgene maize lines [74-77]. Anyhow, attention has to be paid to the fact that
similar genetic constructs are present in different crops and that even the same plasmid can
be used for the generation of different transformation events. The latter applies for example
to for the transgenic maize lines MON809 and MON810.
The highest level of specificity is achieved when targets consist of sequences covering the
integration site between the plant’s genome and the transgene; this results in event-specific
methods suitable for the detection of single transgenic lines. At this level of specificity it is
possible to discriminate between authorized and non-authorized GMO containing similar
transgenic constructs. Event-specific methods have been described for the detection of Bt11,
MON810 maize and Roundup Ready soya [78-82].
Nonetheless, even event-specific methods reach their limitations when different GMO are
crossed (e.g. crossbreeding of an insect-resistant maize line with an herbicide-tolerant maize
line), as the resulting hybrids may contain both recombinant loci. This phenomenon is
referred to as “gene-stacking” and represents an unsolved analytical problem for the
identification and quantification of GMO in foods composed of different ingredients. A reliable
identification of stacked genes can be performed only in the case of analysis of material from
a single organism, as for instance by the testing of a single maize kernel [70].
Quantification of GMO contents
Standard PCR endpoint analysis as used for the qualitative detection of DNA sequences
cannot be applied for quantitative determinations due to the unsteadiness of the
amplification efficiency between different PCR reactions, as well as within the process of a
PCR reaction itself. Currently available approaches for the quantification of DNA sequences
are based either on competitive PCR or on real-time PCR technologies (see 2.3.2.2 and
2.3.2.3). Regardless of the technique used, quantification of GMO contents in composed and
processed products requires simultaneous assessment of the recombinant DNA and of a
species- or taxon-specific reference gene. Thus, absolute values determined for the

2.3 Methods for detection of GM crops in foods 16
recombinant DNA can be normalized with those determined for the reference gene. This
strategy permits the determination of ingredient-related GMO contents; these are required
for the control of compliance with actual regulatory frameworks. Relative quantification
copes with problems specific for the quantitative analysis of recombinant DNA in isolates of
composed and processed products, where the co-extraction of DNA from different sources is
unavoidable and a degradation of DNA may have occurred. This type of quantification is
considered to reflect the proportion of GMO during all stages of processing, as it is assumed
that the breakdown of recombinant and reference target sequences occurs simultaneously
[83].
2.3.2.2. Competitive PCR
Quantitative competitive PCR is based on the co-amplification of the target DNA sequence
and an exogenous standard (competitor) which is spiked to each sample at known
concentrations [84-88]. Both, target DNA and competitor, possess identical primer binding
sites and similar lengths as well as internal sequences. Throughout PCR amplification, target
and competitor sequences are exposed to identical reaction conditions and compete for the
same limiting reagents such as primers. Provided equivalent amplification kinetics for target
and competitor sequences, the ratio between molar amounts of both PCR products equals
the ratio between the amounts of target DNA and competitor in the reaction mix prior to
amplification. Quantification is most accurate at the point of equivalence, i.e. where the
molar ratio of target and internal standard sequences in the reaction mixture equals one.
As illustrated in Figure 1, sample analysis by means of competitive PCR requires the
preparation of several reaction mixtures, each containing a constant template DNA
concentration but increasing competitor concentrations to allow an accurate calculation of
the competitor amount at the point of equivalence. Ratios between signal intensities of
competitor and target amplicons, measured after gel electrophoresis, are plotted
logarithmically against competitor amounts initially used in the reaction mixture. The point of
equivalence is determined at the intersection of the linear regression curve with the abscissa
[89]. On this theoretical basis, several single- and double competitive PCR methods have
been developed for the quantification of DNA sequences occurring in transgenic crops
commonly used for the production of foods and food ingredients [82, 90-95].
However, competitive PCR is an extremely material-intensive and time-consuming technique.
This results from the necessity of several reaction mixes for the measurement of one point of
equivalence and from the visualization of PCR products via gel electrophoresis, in

2.3 Methods for detection of GM crops in foods 17
combination with complex gel documentation/evaluation. The technique involves a high risk
of cross contamination, as extensive handling with PCR products is required.
Concentration gradient
Template DNA
Competitor DNA
PCR
1 2 3 4 5 6
Point of equivalence
Target Competitor
y = 1,2677x - 3,2017R2 = 0,9944
-1,5
-1,0
-0,5
0,0
0,5
1,0
1,5 2,0 2,5 3,0 3,5
log (mCOMPETITOR)
log
(IC
OM
PETI
TOR/
I TA
RG
ET)
Figure 1 Quantification of DNA sequences via competitive PCR (cPCR). Reaction mixtures contain template DNA in a constant (unknown) concentration and competitor DNA covering a wide range of known dilutions. The point at which the molar ratio of target and internal standard sequences in the reaction mixture equals one is referred to as the point of equivalence. Ratios between signal intensities of competitor and target amplicons, measured after gel electrophoresis, are plotted logarithmically against competitor amounts initially used in the reaction mixture. The exact amount of competitor required at the point of equivalence is determined at the intersection of the linear regression curve with the abscissa. Relative quantification of GMO contents requires double-competitive PCR systems; one cPCR for the assessment of the recombinant DNA and another for the assessment of a species- or taxon-specific reference gene.

2.3 Methods for detection of GM crops in foods 18
2.3.2.3. Real-time PCR
Real-time PCR technology is based on the use of a thermal cycler with an integrated optical
unit, which allows the measurement of PCR product amounts at every stage of the reaction.
This is achieved by monitoring the increase of fluorescence caused by intercalation of DNA
binding dyes in the resulting PCR products, or by the hydrolysis of hybridization probes
labeled with a reporter and a quencher dye. The main disadvantage of using intercalating
dyes consists in the unavoidable detection of non-specific PCR products such as primer
dimers. Hybridization probes (e.g. TaqMan Probes) are synthetic oligonucleotides
complementary to the target DNA. The principle of their detection relies upon the release of
the reporter dye as hybridized probes are hydrolyzed by the 5’ → 3’ exonuclease activity of
Taq DNA polymerase. The increase of fluorescence emitted by the reporter dye is
proportional to the exponential amplification of target sequences. Other formats of
hybridization probes (e.g. LightCycler Probes, molecular beacons, etc.) do not require
hydrolysis to generate a signal and have also been used successfully in the quantification of
DNA sequences [62, 96, 97].
Since PCR kinetics can be described as a steady exponential process during the first stages
of amplification, the starting copy number of target sequences can be extrapolated on the
basis of a standard curve. As illustrated in Figure 2, the construction of standard curves
requires the analysis of external reference dilutions (quantification standards) with defined
concentrations of target sequences. The curve describes the correlation between starting
copy numbers of the quantification standards and the determined threshold cycles (Ct-
values) [98]. An accurate quantification is only granted when the amplification efficiency of
the quantification standards is equal to that of the target sequence within the genome of the
host organism. This requirement is fulfilled when standard curves generated from
quantification standards and dilutions of genomic DNA render similar slopes. Efficiencies can
be considered as equal if the difference between the slopes is smaller than 0.1.

2.3 Methods for detection of GM crops in foods 19
Quantification standardsUnknown
Amplification curves
Ct-value
Cycles
Fluo
resc
ence
Ct
valu
cop numbe
Standard Curv
Quantification standardsUnknown
Standard curve
cop numbeCopy number
C t-v
alue
s
t
Figure 2 Quantification of DNA sequences via real-time PCR. The analysis of external references (quantification standards) with defined concentrations of target sequences is required for the construction of a standard curve. The curve describes the correlation between starting copy numbers of the quantification standards and the respective threshold cycles (Ct-values), which are determined on the basis of the amplification plots. The starting copy number of target sequences in an unknown sample can be extrapolated on the basis of a standard curve. Relative quantification of GMO contents requires the assessment of the recombinant DNA and of a species- or taxon-specific reference gene.
Several methods for the production of absolute standards have been described, though
target sequences are usually cloned into a plasmid vector and used as template to generate
a standard curve [99-102]. Alternative methods suitable for the production of external
standards for purpose of quantitative GMO analysis have been described [103]. These avoid

2.3 Methods for detection of GM crops in foods 20
complex cloning steps and permit the generation of hybrid molecules containing both, a
fragment of the recombinant DNA as well as a target sequence specific for a reference gene.
To date, various methods for the quantification of GMO proportions in raw food materials
have been presented and validated in international interlaboratory trials [80, 81, 91, 104-
109]. Kits for the quantification of transgenic soy (Roundup Ready™) and maize
(Maximizer™ Bt176, Bt11, Liberty Link™ T25, Yield Guard™ MON810, Roundup Ready™ and
StarLink™) are commercially available.
The first real-time PCR method to be applied for the quantitative detection of a genetically
modified organism in foods was described by Wurz et al. [91]. The method was adapted to
detect a recombinant region in the genome of Roundup Ready soya and a plant-specific
sequence within the lectin (le1) gene. Special attention was paid to avoid significant
differences in amplicon lengths and to keep them as short as possible, meeting basic
prerequisites for its application on processed foods. The approach was subsequently tested
with certified reference materials containing 0.1%, 0.5% and 2% transgenic soya, yielding
results that were in good agreement with the expected data.
Approaches for the quantitative detection of Bt 176 “Maximizer” maize and Roundup Ready
soybean, targeting the cryIA(b) and the CP4 EPSPS transgenes, respectively, have also been
introduced [109]. Endogenous reference targets used were the maize specific zein (ze1) and
the soya specific lectin (le1) genes. For the first time, PCR conditions were optimized to allow
the quantification of transgenic and isogenic targets in one tube, thus eliminating variations
other than those inherent in the Ct measurements.
Pietsch and Waiblinger [106] described a real-time PCR method for the quantification of
genetically modified soybean using LightCycler technology. The developed primers anneal
specifically to the overlapping sequence between the Cauliflower Mosaic Virus 35S promoter
and the Petunia hybrida 5-enolpyruvylshikimate-3-phosphate synthase signal peptide. The
soybean specific lec in- gene was used as reference. The linearity of the system was shown
by using DNA dilutions from certified standard materials. The analysis of a soybean diet
sample was taken as an example for the application of this approach on processed foods.
This method was subsequently validated [107] yielding diminishing relative confidence
intervals at P = 95% from 37% to 9.3% with increasing transgenic contents in the reference
materials (0.1% RRS and 5% RRS, respectively).
t
Interlaboratory testing of commercially available kits for the quantification of Roundup Ready
soybean and Bt 176 maize has been performed [108].

2.3 Methods for detection of GM crops in foods 21
2.3.2.4. Limitations of the relative quantification of GMO con ents t
The accuracy of the relative quantification strategy, which is followed for the determination
of GMO contents in foods and feeds, is limited by factors linked to the background of the
process of genetic engineering and to consequences of subsequent conventional breeding
steps on the genetic composition of the genetically enhanced crops.
Up to now, genetic modification of authorized agricultural crops has been achieved by the
transformation of the nuclear genome of the host organisms. Depending on the strategy
used for the transformation one or more copies of the recombinant construct may be
integrated into the genome [19]. Assuming a single integration event, the initially
transformed plant would be hemizygous with respect to the recombinant gene, resulting in a
stable relation to the copy number of a species- or taxon-specific reference gene (e.g. 1:2 in
a diploid organism [12]). Further breeding steps required for the generation of commercial
GMO lines may considerably alter the genetic composition of the modified organism in terms
of zygosity and ploidy. The level of zygosity of the transformed plants can be altered (e.g. by
means of self-pollination) to obtain homozygous inbred lines. This represents the simplest
constellation for the relative quantification of recombinant sequences, since a 1:1 relation
between recombinant and reference genes would be achieved. However, the generation of
genetically enhanced commercial lines usually implies the crossing of the originally modified
plants with optimized conventional varieties. Taking into consideration that alterations in the
levels of ploidy of cultivated hybrids might have been induced by means of traditional
breeding techniques (such alterations aim at the enhancement of crop performance [110]),
such crossings may lead to a loss of the original relation between the copy numbers of
trangenes and reference genes. Additionally, unequal levels of ploidy can be found in
separate tissues of one organism, as in the case of the diploid embryo and the triploid
endosperm of maize kernels [111, 112]. Such a separation of tissues may be of relevance for
the production of certain food ingredients, e.g. oils and starches.
When designing assays for the relative quantification of GMO-derived material, additional
attention has to be paid to the selection of proper reference genes. On one hand, these must
have been proven to be unique to a single species, and on the other, to show stability in
terms of copy number per haploid genome and in terms of zygosity. However, evaluation of
taxa-specific reference genes in the context of the QPCRGMOFOOD program [113] has
shown that these criteria are not fulfilled by every candidate gene.

2.3 Methods for detection of GM crops in foods 22
In conclusion, relative quantification of recombinant DNA may be prone to major bias
depending on the comparability of the genetic composition (in terms of copy number,
zygosity and ploidy) of the material that is subject of analysis to that of the reference
material used for quantification.
Further complications for the quantitative analysis of GMO are expected to arise in the
context of alternative strategies for the genetic modification of agricultural crops (e.g.
genetic engineering of the plastid genome [114, 115]) and gene-stacking in hybrids resulting
from the crossing of two GM-lines [12]. The modification of the extranuclear genome in
transplastomic crops has resulted in a more efficient expression of recombinant genes, but
variations in the copy number of the integrated constructs (up to 10.000 per cell) may
require the development of further quantification strategies. As regards stacked events, it
must be considered that European legislation defines such organisms as new GM-lines. This
applies even in the case that parental GM-lines have been authorized. However, none of the
currently available analytical strategies is capable to distinguish organisms with stacked traits
from the parental GM-lines in samples of composed foods. A reliable identification of stacked
events can be performed only in the case of analysis of material from a single organism. But
this phenomenon represents also an unsolved issue in the quantitative assessment of GMO-
derived material, since the relative GMO content of one sample would be systematically
overestimated in the presence of DNA from stacked events.

2.4 Challenges specific to GMO-analysis in composed and processed foods 23
2.4. Challenges specific to GMO-analysis in composed and processed foods
Surveillance testing will play a crucial role in supporting the control of compliance with the
expanded labeling demands of the novel regulatory framework on the use of GMO in the
production of foods and feeds. However, approaches for the analysis of GMO must still cope
with a number of challenges, which are considered to critically influence the potential to
detect the application of genetic engineering within the food and feed chain.
In addition to analytical limitations related to the background of the genetic modification and
to the genetic composition of the respective GMO lines (see 2.3.1 and 2.3.2), further
restrictions are given by technological parameters of the industrial food and feed production.
In this context, limitations are set by the complexity of food composition and by the
degradation/elimination of analytes during manufacturing processes. Aspects of food
manufacturing which are considered to negatively affect all steps of GMO analysis [4],
including detection, identification and quantification of GMO-derived material in composed
and processed foods are outlined in Figure 3.
GM
O A
naly
sis
• detection • identification • quantification
e.g. emulsion e.g. baking product
raw material
processing
formulation
ingredients
e.g. milling fraction e.g. highly refined oil
degreeof treatment
product
processing
degreeof treatment
Figure 3 Challenges specific to GMO analysis in the course of food processing.

2.4 Challenges specific to GMO-analysis in composed and processed foods 24
2.4.1. Food composition
As illustrated in Figure 3, raw materials (e.g. maize kernels or soybeans) may be subject to a
spectrum of processes differing in nature and degree of treatment. They can range from
simple mechanical procedures (e.g. milling) to complex sequences of chemical reactions
(e.g. refinement of edible plant oils). Products obtained from these processes may be either
used as foods themselves or serve as ingredients for the production of composed foods.
Composed products consist consequently of a variety of ingredients of unequal properties,
resulting from diverse stages of manufacturing within the food chain.
This increases significantly the complexity of food products being subject to surveillance
testing, even if analyses are carried out on samples of untreated formulations. For instance,
bakery mixes containing milling fractions with different particle size distributions (e.g. maize
grits and flour) are widely used in industrial applications to regulate important functional and
sensory characteristics of the products. In this case, quantitative GMO analysis must take
into account that (a) milling processes may result in an accumulation/discrimination of kernel
tissues like pericarp, endosperm, embryo, showing differences in cell density (DNA content)
as well as in the level of ploidy (genetic composition) [112] and that (b) unequal efficiencies
in the extraction of DNA from fractions of different particle size distributions may contribute
to bias in the results of GMO analysis [58, 116]. These considerations are of crucial
importance not only for the analysis of samples of complex products, but also for the
production of certified reference materials with defined contents of GM-derived material,
which are to be used as standards for purposes of GMO quantification.
The level of complexity increases when formulations are subjected to further treatment, as it
is very likely that the target molecules will not show the same degree of degradation in each
ingredient. Considering that every ingredient possesses a characteristic matrix and
composition, it is very probable that analytes incorporated in different matrices will not be
equally accessible to analysis.
2.4.2. Degradation of analytes
Mechanical stress, heat treatment, pH variations, enzymatic activities and fermentations are
common parameters in food and feed processing, which may result in significant degradation
of proteins and nucleic acids. In food ingredients and in foods made thereof the presence of
analytes suitable for GMO detection will clearly depend on the degree of physical, enzymatic
and/or chemical treatment, which raw materials have been exposed to. In addition to

2.4 Challenges specific to GMO-analysis in composed and processed foods 25
degradation, intentional or unintentional removal of DNA or protein in the course of food
processing is of importance.
Processing of composed foods may additionally lead to chemical and structural changes and
interactions between ingredients used for food preparation, again resulting in increasing
analyte degradation. As illustrated in Figure 3, processes involved in the production of such
complex foods can be limited to rather simple steps (e.g. mixing). However, they may also
involve severe thermal treatments inducing chemical changes (e.g. baking). It is unclear
whether degradation will progress equally in every ingredient or if ingredient matrices may
have an effect on degradation rates.
Approaches for the analysis of GMO in foods must cope with the discussed challenges set by
the complexity of analyte degradation and the additional problems related to composed
foods. All steps of GMO analysis, i.e. detection, identification and quantification [117], are
influenced by these technological parameters.
2.4.2.1. Proteins
Denaturation of proteins is initiated by reversible or irreversible changes of the native
conformation (secondary, tertiary or quaternary structure). It can result from the breakage
of stabilizing disulfide bonds or hydrogen bonds, the neutralization of ionic groups or
hydrophilic/hydrophobic interactions. Denaturation may result from the application of shear
forces, it can be initiated by changes in temperature or pH, by enlargement of interface
areas or by addition of organic solvents, salts or detergents. Reversible denaturation
generally takes place when the unfolded molecule is stabilized by interactions with the
denaturing agent, e.g. an organic solvent. Removal of the denaturing agent consequently
allows the recovery of native protein configuration. Irreversible denaturation occurs when
unfolded proteins are stabilized by formation of intra- or intermolecular covalent bonds, e.g.
disulfide bonds between free thiol groups.
Food manufacturing, maturation or spoilage processes involve a number of enzymatic
reactions, which lead to major changes in the structural properties of proteins. In addition to
functional group transfer reactions and redox reactions, the proteases-catalyzed cleavage of
peptide bonds is to be seen as the most important reaction contributing to protein
degradation [118].
Hydrolytic fragmentation of proteins occurs in acidic milieus especially when combined with
heat-treatment. Food processing may induce further chemical modifications of native
proteins depending on the presence of available functional groups (intra- and intermolecular

2.4 Challenges specific to GMO-analysis in composed and processed foods 26
cross-linking via disulfide, isopeptide, ester bonds), on the food composition (presence of
reducing sugars or free oxygen) and on the applied process parameters (e.g. temperature,
pH value or high pressure).
Proteins possess linear and conformational epitopes that may be recognized by specific
antibodies. Immunoassays have been used to follow structural changes of proteins during
food processing as result of mechanical and thermal treatments in form of extrusion,
cooking, roasting or autoclaving [119-123].
2.4.2.2. DNA
Although DNA, as a macromolecule, exhibits relatively high chemical stability there is a broad
spectrum of chemical and enzymatic reactions that result in DNA modification and/or
degradation [124]. Food and feed manufacturing involving mechanical processes,
fermentation steps or thermal treatments, especially in combination with acidic conditions
may contribute to such reactions.
DNA fragmentation may be initiated by the application of shear forces [125]. Additionally,
the disruption of plant material results in destruction of cell compartments, thus bringing
formerly separated enzymes and substrates into contact. As a result, DNA extracted from
plant tissues is susceptible to digestion by endogenous nucleases [126]. DNA preparation
involves the use of proteases or strong protein denaturating agents to eliminate these
activities of nucleases and to allow the isolation of high molecular-weight DNA. If no
denaturants are used, DNA may be degraded to fragments of less than 500 bp within an
hour [127]. Such effects have been observed by following the fate of DNA during the
industrial extraction of sugar from sugar beets. When purified nucleic acid was added to raw
juice (one of the intermediate products) at 70°C, a rapid degradation of DNA was observed.
This indicated the presence of nucleases in the plant material [128].
Nucleic acids undergo spontaneous non-enzymatic hydrolysis in solution, RNA being more
vulnerable than DNA. Under low pH conditions, depurination of the N-glycosidic link between
purine bases and deoxyribose in the nucleic acid backbone is the first step in the degradation
of DNA followed by hydrolysis of adjacent 3’, 5-phosphodiester linkages at the depurinated
site. This acid catalyzed reaction results in measurable shortening of DNA strands and is
accelerated by simultaneous heat-treatment, resulting in a random cleavage of DNA
molecules [129, 130].

2.4 Challenges specific to GMO-analysis in composed and processed foods 27
Several studies have described the effects of food processing on the fragmentation of DNA.
For instances, the mean fragment length of DNA extracted from heat-treated pork was
reduced from 1.1 Kb to 0.3 Kb [131]. Similar effects were observed in DNA from processed
tomato products [132]. Kingombe et al. [133] demonstrated that proteins as well as DNA are
severely degraded during treatment of meat meal at 133°C for 20 min at 3 bar.
Ensiling is another example for a process creating a harsh environment for plant DNA via a
combination of reactions. Chopping of the plant tissue results in disruption of cell walls and
membranes, release of DNA and eventually in degradation by endogenous nucleases of the
plant and/or exogenous nucleases of the microflora. In addition, the lowering of the pH as a
result of lactic acid fermentation accelerates the degradation of DNA. These reactions were
reflected in different contents of DNA in extracts obtained from non-ensiled and ensiled Bt-
maize [134].
Effects on qualitative PCR
The effects of using highly fragmented DNA as a template for qualitative PCR have been
elucidated [135]. DNA fragmentation severely reduces the efficiency of PCR. In accordance
to these findings, the influence of the size of the targeted sequence on the detection of
insect-resistant Bt 176 maize in heat-treated products has been described [136]. The
probability to detect the GMO decreased rapidly in the course of heat treatment when
targeting the entire 1914 bp sequence of the synthetic cryIA(b)- gene. On the other hand, a
shorter target sequence (211 bp), covering part of the CDPK promotor and the cryIA(b)-
gene, was detectable even after heating for 105 min.
Other investigations addressed the effects of fermentation and/or thermal processes, such as
ensiling of transgenic maize or the distillation of ethanol from fermented transgenic invertase
potato (B33-INV) mashes, on the degradation of DNA and consequently on the traceability of
target sequences [134, 137]. The detectability of Bt-specific recombinant DNA in ensiled
maize material turned out to be dependent on the length of the genomic target region to be
amplified. By amplifying a Bt-maize specific DNA sequence of 211 bp, the genetic
modification was detected up to seven months after ensilage. On the other hand, detection
of the transgene via a 1914 bp amplicon was only possible for up to five days of ensilage.
A 190 bp sequence of the patatin gene and 839 bp sequence of the hygromicin
phosphotransferase gene were used as targets to follow the detection of DNA in the course
of the distillation process converting potatoes into ethanol [137]. Using the 190 bp amplicon,
potato DNA could be detected after all steps; positive results were obtained even in the
splent. The detection of the 839 bp sequence was limited by the distillation step, however.

2.4 Challenges specific to GMO-analysis in composed and processed foods 28
Klein et al. [128] followed the elimination of nucleic acids during the sugar manufacturing
process. Intermediates and end products were analyzed for the presence of DNA via PCR,
using the ADP-glucose pyrophosphorylase (AGPase) gene as a target for sugar beet DNA and
the genes for the beet necrotic yellow vein virus coat protein (cp21) and neomycin
phosphotransferase (aphA) as specific targets for the virus-resistant transgenic beet DNA.
Southern blot hybridization of the targeted sequences delivered positive signals in PCR
samples from raw juice only, but not in those from carbonatation sludge I, carbonatation
sludge II, thin juice, thick juice or white sugar from transgenic beets. These results pointed
to a severe degradation of nucleic acids already in the first steps of processing. This was
verified by adding pUC18 DNA to fresh raw juice samples and incubating the mixtures for
different periods of time. The resulting DNA degradation was ascribed to the enzymatic
activity of sugar beet endogenous nucleases. Further vanishing of DNA was explained by its
irreversible adsorption onto the sludge, precipitation, hydrolysis due to the high
temperatures in the carbonatation and evaporation steps and as result of the exclusion of
DNA in the crystallization step.
Hellebrand et al. [138] investigated the presence of rapeseed DNA in cold-pressed and
refined oils using a nested PCR system. Starting point was the assumption that the
thermostability of DNA under alkaline conditions should be sufficient to partially preserve
throughout processing and that filtration steps (as used in the oil industry) are not capable
of retaining DNA molecules. Amplifyable DNA could be isolated from cold pressed oil
samples. However, the PCR analysis of extracts from refined oil samples delivered non-
specific signals, which could not be unequivocally identified. Again the importance of
choosing short target fragments for a successful detection was emphasized.
The limits of the PCR-based detection of genetically modified soya in the course of bread
production were studied in different approaches showing a strong dependence of the
analytical success on the individual processing parameters. Straub et al. [139] employed an
official method according to § 35 of the German Food Law, which had been previously
validated in an interlaboratory study. It was demonstrated that high molecular-weight DNA
was only present in baking aids and flour samples, whereas DNA isolated from dough and
bread samples had been partially degraded and exhibited average fragment sizes < 500 bp
and < 300 bp, respectively. Although the content of genetically modified soya in the baking
aid was diluted to a proportion of 0.4% referring to the dry matter of the end product,
positive detection of the targeted sequences was achieved at every stage of processing.
Moser et al. [140] assessed how baking parameters of different bread and pastry formulas
affected DNA degradation and in consequence, the traceability of target sequences.
Genetically modified maize (used in whole grain bread and pastry formulas) and soybean

2.4 Challenges specific to GMO-analysis in composed and processed foods 29
(used in the toast bread formula) were added at concentrations of 0.5% and 0.3%,
respectively. The maize specific sequence of the invertase gene was successfully detected
even in the end products, whereas no positive results were obtained for the transgenic
target sequence at the final stage of processing of the whole grain bread and pastry
formulae. This indicated that the combination of either acidic milieus or mechanical stress in
extrusion stages with the exposure to thermal treatment, completely restrained the detection
of transgenic DNA at the given concentration. In contrast, transgenic and isogenic soya DNA
were detected at all manufacturing levels. Apparently, the diminished overall stress impact
during the production of toast bread did not result in a complete degradation of the targeted
sequences.
Straub et al. [141] investigated the effect of storage on the fate of DNA from recombinant
starter cultures in fermented, heat-treated sausages. Free recombinant DNA of the starter
culture obtained from the meat matrix was shown to represent only a minute part of the
total recombinant DNA content recovered after lytic treatment of the cell walls. Worst-case
studies showed that minute amounts of free recombinant DNA are protected by the meat
matrix against the activity of DNase and could be detected even after storage for over nine
weeks. The other portion of recombinant DNA remained entrapped in the killed cells being
even better protected against enzyme activity. Again, DNA deterioration was most clearly
observed when long (1322 bp) rather than short (166 bp) target sequences were chosen.
DNA degradation due to stress factors in the course of food processing has been the subject
of several studies examining the influence of fermentation, heating and other forms of
processing on the DNA-based detection of GMO. These approaches have shown the
suitability of PCR technology for detecting target DNA sequences from GMO or pathogenic
microorganisms even at advanced stages of processing [77, 132, 137, 142-144].
Nevertheless, the use of internal positive controls should be generally taken into
consideration to be able to rule out false negative results. Degradation of DNA in the course
of food processing has an adverse effect on the detection efficiency, especially when long
target sequences are to be detected. However, target sequences ≤ 100 bp have been shown
to withstand harsh manufacturing processes.
Effects on quantitative PCR
Despite the proven suitability of competitive or real-time PCR-based methods for their
application on certified reference materials, analysis of processed foods revealed that DNA
degradation affects the amount of amplifiable target sequences leading to diminished
recoveries of DNA amounts. Therefore, relative quantification systems were required,

2.4 Challenges specific to GMO-analysis in composed and processed foods 30
permitting the additional determination of the amounts of species-specific target sequences
to be used as endogenous references. This has allowed a normalization of results delivered
by the analysis of processed and/or composed foods [90]. Several species-specific genes
have been characterized and PCR systems for the quantification of the soy specific lectin
(le1) gene and the maize-specific invertase (ivr1) gene were developed [91, 95]. Additional
genes generally targeted as endogenous reference are the maize-specific zein (ze1), the high
mobility group (HMG) protein genes and the rape-specific acetyl-CoA carboxylase (BnAccg8)
gene [95, 146-149].
Detailed studies of the effect of DNA degradation in the course of heat treatment on the
quantification of transgenic maize via competitive PCR and the normalization of results using
an endogenous reference gene were performed by Hupfer et al. [95] and Moreano et al.
[145]. In unprocessed maize flour the quantification of a single target sequence could be
successfully used for the determination of transgenic maize proportions based on the parallel
analysis of certified standard flour mixtures. However, the determination of DNA
concentrations (via UV-absorption) in extracts of processed foods does not allow the
differentiation between amplifyable and degraded DNA, leading to severe discrepancies in
the results yielded by the single competitive quantification. This drawback was overcome by
the development of a complementary competitive PCR system designed for the quantification
of an endogenous reference gene. Heat treatment continuously degrades DNA resulting in a
strongly reduced average fragment length. In order to demonstrate that this process affects
the target sequence of Bt-maize to the same degree as any other region of the maize
genome of comparable length, aliquots of a DNA mixture (10% maize Bt-176) were heat-
treated at 95°C. A transgene specific as well as a reference target sequence were quantified
by means of competitive PCR. The almost parallel decrease of the recovery of both target
sequences forms the basis for dual competitive PCR. Thus, GMO proportions may be
calculated based on the ratio between the determined amounts of DNA sequences targeting
the transgene and the reference gene, delivering nearly constant values for the Bt-maize
proportions in the starting material and in the thermally treated samples. Quantification of
GMO proportions became consequently independent from (a) the presence of DNA other
than from maize and (b) the degradation of target sequences throughout processing, since
degradation of transgene and reference gene were shown to occur in a parallel manner.
Interlaboratory testing of assays for the quantification of Roundup Ready soybean and Bt-
176 maize via real-time PCR have been performed [108, 150]. These methods allow the
determination of GMO proportions in food samples, in the case of Roundup Ready soya
relying on the amplification of two 74 bp long fragments from the functional insert and from
the soybean-specific lectin (le1-) gene. In the case of Bt-176, a 129 bp long section of the

2.4 Challenges specific to GMO-analysis in composed and processed foods 31
cryIA(b)- gene and a 79 bp long sequence of the maize high mobility group protein (HMGa-)
gene are amplified. Although both approaches delivered accurate results when applied to
reference materials, several questions remained open as regards their suitability for the
analysis of processed samples. In these reports no plausible explanation was given regarding
the fact that only the Roundup Ready system yielded accurate results when analyzing
samples of textured vegetable proteins, whereas the analysis of heat-sterilized maize kernels
using the Bt-176 method resulted in a strong underestimation of the actual GMO
proportions.
2.4.3. Limits of detection and quantification
The formulation of different ingredients to composed foods and the degradation of DNA in
the course of processing have a direct influence on the limits of detection (LOD) and the
limits of quantification (LOQ). The absolute limit of detection represents the lowest number
of target sequences which can be reliably detected within a defined level of confidence.
Correspondingly, limits of quantification are defined as the lowest relative GMO contents that
can be determined when targeting at sequences specific for a recombinant organism, as well
as at a reference gene specific for the species or taxon.
Theoretically, LOD and LOQ can be determined for each assay starting from the amounts of
DNA used in one reaction (generally between 100 – 200 ng) and the genome size from the
organism subject of analysis [151]. For instance, PCR-based methods have been reported to
be capable to detect reliably one to ten copies of a target sequence in one reaction [68].
Thus, if 104 genome copies are applied in a quantitative assay, limits of quantification would
range between 0.01% and 0.1%. These values reflect the theoretically best case (when one
single target sequence is detected) and the worst case (when ten copies of the target
sequence are needed to yield a positive signal). The quantification limit using TaqMan
technology has been empirically set at ten copies of the targeted DNA sequence, considering
that it is practically impossible to obtain reproducible data in triplicates or quadruplicates at
lower copy levels. This means that if 104 copies of the plant genome were extracted from the
food sample, the relative quantification limit would not allow a differentiation between GMO
contents lower than 0.1% (10 molecules of GM DNA within 104 molecules of species DNA).
These values are only valid for reactions performed under optimal conditions i.e. using intact
DNA, which has been isolated from material derived from a single organism and may vary
considerably depending on the level of confidence used for the quantitative determination of
GMO contents [151].

2.4 Challenges specific to GMO-analysis in composed and processed foods 32
The performance of quantitative assays will be affected if isolates of food samples show (a)
diminished proportions of genome copies, e.g. due to the co-extraction of DNA from further
ingredients when analyzing composed foods, or (b) diminished proportions of amplifyable
target sequences, e.g. due to a fragmentation of DNA in the course of processing. Thus,
assuming the above-mentioned absolute limit of quantification of 10 target sequences,
relative GMO quantification starting from 103 genome copies would result in a shifted
performance that would not permit a differentiation between GMO contents lower than 1%
(10 molecules of GM DNA within 103 molecules of species DNA).
In consequence, several authors have proposed to report two sets of LOD/LOQ, one
describing the performance of the assays under optimal conditions, and one giving an
estimate of the true LOD/LOQ under consideration of the previously described effects [12,
152].

3.1 Materials 33
3. Materials and methods
3.1. Materials
3.1.1. Reference materials
Certified reference maize and soybean powders with defined proportions of GMO-derived
material are produced by the Institute for Reference Materials and Measurements (IRMM,
Geel, Belgium) and are distributed by Fluka Chemie AG (Buchs, Switzerland). The flour
mixtures contained respectively 0.1, 0.5, 1.0, 2.0 and 5.0% of transgenic material from the
maize lines MON810, Bt-176 or Roundup Ready soya. Each set of reference standards
included negative control samples containing no GMO-derived material.
3.1.2. Transgenic maize Bt-176 and conventional material
Seeds of genetically modified, insect-resistant Bt-maize (Event 176, breeding line: Navares)
and of the corresponding conventional maize (Antares) were provided by Bavarian Institute
for Animal Production (Bayerische Landesanstalt für Tierzucht, Grub, Germany).
3.1.3. Transgenic maize MON810 and conventional material
Seeds of genetically modified, insect-resistant Bt-maize (Event MON810, breeding line:
Novelis) and of the corresponding conventional maize (Nobilis) were provided by Bavarian
Institute for Animal Production (Bayerische Landesanstalt für Tierzucht, Grub, Germany).
3.1.4. Bakery mixes
Four bakery mixes consisting of sunflower kernels, rye whole-grain flour, wheat gluten,
wheat germs, potato flakes, maize flour, iodine salt, dried whole-grain rye sourdough, whey
derivatives, lecithin E322, ascorbic acid E300 and enzymes were provided by MeisterMarken
GmbH (Neu Ulm, Germany). The total maize content in all bakery mixes was 15% (w/w).
Within this maize-moiety, the proportions of material derived from Bt-maize were
respectively 0%, 6.25%, 12.5%, and 25%.

3.1 Materials 34
3.1.5. Competitors, primers and probes
3.1.5.1. Competitive PCR
Sequences of competitors and primer binding sites are illustrated in Figure 4. Internal DNA
standards pMA-St2 and pIVR-St used in the competitive assays for the quantification of
recombinant DNA from maize Bt-176 and the maize-specific invertase (ivr1) gene were
constructed on the basis of previously established PCR-systems for the detection of
genetically modified [77] and conventional maize [153].
(1) IVR1*: 225 bp CCGCTGTATC ACAAGGGCTG GTACCACCTC (2) pIVR: 225 bp CCGCTGTATC ACAAGGGCTG GTACCACCTC (3) pIVR-St: 204 bp CCGCTGTATC ACAAGGGCTG GTACC– – – – – TTCTACCAGT GGAACCCGGA CTCCGCGGTA TGGGGCAACA TCACCTGGGG TTCTACCAGT GGAACCCGGA CTCCGCGGTA TGGGGCAACA TCACCTGGGG – – – – – – – – – – – – – – – – CGGA CTCCGCGGTA TGGGGCAACA TCACCTGGGG CCACGCCGTC TCGCGCGACC TCCTCCACTG GCTGCACCTA CCGCTGGCCA CCACGCCGTC TCGCGCGACC TCCTCCACTG GCTGCACCTA CCGCTGGCCA CCACGCCGTC TCGCGCGACC TCCTCCACTG GCTGCACCTA CCGCTGGCCA TGGTGCCCGA TCACCCGTAC GACGCCAACG GCGTCTGGTC CGGGTCGGCG TGGTGCCCGA TCACCCGTAC GACGCCAACG GCGTCTGGTC CGGGTCGGCG TGGTGCCCGA TCACCCGTAC GACGCCAACG GCGTCTGGTC CGGGTCGGCG ACGCGCCTGC CCGACGGCCG GATCGTCATG CTCTACACGG GCTCCACGCGCCTGC CCGACGGCCG GATCGTCATG CTCTACACGACGCGCCTGC CCGANGGCCG GATCGTCATG CTCTACACGG GCTCC
(1) CDPK*/CRY**: 211 bp CTCTCGCCGT TCATGTCCGT GGCTGGCTGC (2) pCRY34: 212 bp CTCTCGCCGT TCATGTCCGT GGCTGGCTAC (3) pMA-St2: 187 bp CTCTCGCCGT TCATGTCCGT GGCTGGCTAC CCTCCGTGGG - AGCAGGCGG CCGCACTCGT TCCCCGCCGC AGCC– GATCC CCTCCGTGGG - AGCAGGCGG CCGCACTCGT TCCCCGCCGC AGCCGGATCC CCTCCGTGGG TA– – – – – – – – – – – – – – – – – – – – – – – – – – GC AGCCGGGTCC AACAATGGAC AACAACCCCA ACATCAACGA GTGCATCCCC TACAACTGCC AACAATGGAC AACAACCCCA ACATCAACGG GTGCATCCCC TACAACTGCC AACAATGGAC AACAACCCCA ACATCAACGG GTGCATCCCC TACAACTGCC TGAGCAACCC CGAGGTGGAG GTGCTGGGCG GCGAGCGCAT CGAGACCGGC TGAGCAACCC CGAGGTGGAG GTGCTGGGCG GCGAGCGCAT CGAGACCGGC TGAGCAACCC CGAGGTGGAG GTGCTGGGCG GCGAGCGCAT CGAGACCGGC TACACCCCCA TCGACATCAG CCTGAGCCTG ACCTACACCCCCA TCGACATCAG CCTGAGCCTG ACCTACACCCCCA TCGACATCAG CCTGAGCCTG ACC
Figure 4 Alignment of target sequence data obtained from (a) literature (*GenBank; **[154]), (b) plasmids containing original and (c) shortened competitor targets. The binding sites of primer pairs IVR1-F/-R and Cry03/04, respectively, are underlined. Mutations that emerged as a result of cloning are shown in bold capitals.

3.1 Materials 35
As described by Hupfer et al. 2000 [77], competitor plasmids were obtained after deletion of
internal segments of the maize specific and Bt-maize specific amplicons (primer pairs: IVR1-
F/R and Cry03/04, respectively) and following cloning of the shorted oligonucleotides into
pMOS blue vectors.
Primers listed in Table 2 were synthesized by MWG-Biotech (Ebersberg, Germany). Solutions
of pIVR-St and pMA-St2 in the range of 0.1 – 1000 fg/µL were prepared by diluting the
linearized and purified competitor plasmids with carrier DNA, in this case HindIII-digested λ-
DNA (10 ng/µL).
Table 2 Primer sequences for double-competitive PCR analysis.
Primer Sequence Amplicon length [bp]
Cry03 5´- CTC TCG CCG TTC ATG TCC GT - 3´ 212
Cry04 5´- GGT CAG GCT CAG GCT GAT GT - 3´
IVR1-F 5´- CCG CTG TAT CAC AAG GGC TGG TAC C - 3´ 226
IVR1-R 5´- GGA GCC CGT GTA GAG CAT GAC GAT C - 3´
3.1.5.2. Real-time PCR
Method A
The commercially available kit GMOQuant Maximizer™ Bt-176 Corn DNA Quantification
System was obtained from GeneScan Europe AG, Bremen, Germany. The kit includes two
ready-to-use master mixes designed for the detection of a fragment of the synthetic
cryIA(b)- gene encoding the δ-endotoxin of Bacillus thuringiensis in maize Bt-176, and a Zea
mays-specific reference sequence, a fragment of the high mobility group (HMGa) protein
genes. Amplicon lengths are 104 bp for the recombinant DNA, and 79 bp for the maize-
specific reference gene [155]. In addition to the FAM-labelled probes for the detection of the
target sequences, both master mixes also include a VIC-labelled internal positive control
system (IPC), allowing the discrimination between negative results and false negative
results, e.g. due to a possible inhibition of the chain reaction.
Primers and quantification standards were delivered by the producer, sequences are not
publicly available.

3.1 Materials 36
Method B
As described by Höhne et al. [104], this quantification assay is based on the detection of a
68 bp fragment of the 35S-CaMV promoter and an 84 bp fragment of the maize-specific zein
(Ze1-) gene. Reactions are carried out in a multiplex format using FAM-labelled and VIC-
labelled TaqMan probes. Primers and probes were synthesized by Applied Biosystems
(Cheshire, UK); sequences are listed in Table 3.
Table 3 Method B: Primers and probes for the relative quantification of 35S promoter DNA in a multiplex assay [104].
Primer / Probe Sequence Amplicon
length [bp]
35S-F 5´- GAC ATT GCG ATA AAG GAA AGG C - 3´ 68
35S-R 5´- GGG TCC ATC TTT GGG ACC A - 3´
35S-Probe 5´- FAM ATC GTT GAA GAT GCC TCT GCC GAC A TAMRA - 3´
Ze1-F 5´- CGT GTC CGT CCC TGA TGC - 3´ 84
Ze1-R 5´- AGG CGT CAT CAT CTG TGG C - 3´
Ze1-Probe 5´- VIC CAA CTG TTG GCC TTA CCG CTT CAG ACG TAMRA - 3´
Method C
This internationally validated assay [150] allows the relative quantification of DNA from
maize Bt-176. It is based on the detection of a 129 bp fragment of the recombinant
cryIA(b)- gene and a 79 bp fragment of the high mobility group (HMGa) protein genes.
Primers and probes were synthesized by TIB MOLBIOL (Berlin, Germany); sequences are
listed in Table 4.

3.1 Materials 37
Table 4 Method C: Primers and probes for the relative quantification of the recombinant cryIA(b)- gene from maize Bt-176 [150].
Primer / Probe Sequence Amplicon
length [bp]
CRY1-F 5´- CCC ATC GAC ATC AGC CTGAGC - 3´ 129
CRY1-R 5´- CAG GAA GGC GTC CCA CTG GC - 3´
CRY-Probe 5´- FAM ATG TCC ACC AGG CCC AGC ACG TAMRA - 3´
HMG-F 5´- TTG GAC TAG AAA TCT CGT GCT GA - 3´ 79
HMG-R 5´- GCT ACA TAG GGA GCC TTG TCC T - 3´
HMG-Probe 5´- FAM CAA TCC ACA CAA ACG CAC GCG TA TAMRA - 3´
Method C’
This method represents a modification of the Method C. It was designed to allow the relative
quantification of DNA from maize Bt-176, showing a minimized length difference between
the amplicons from recombinant and reference genes but targeting at the same sequences
and using the same TaqMan probes. Primers and probes, as well as technical assistance
were provided by TIB MOLBIOL (Berlin, Germany); sequences are listed in Table 5.
Table 5 Method C’: Primers (modified) and probes for the relative quantification of the recombinant cryIA(b)- gene from maize Bt-176.
Primer / Probe Sequence Amplicon
length [bp]
CRY2-F 5´- CCA GTT CCT GCT GAG CGA GTT C - 3´ 81
CRY2-R 5´- GGG CCG AAG ATG CCC CAG AT - 3´
CRY-Probe 5´- FAM ATG TCC ACC AGG CCC AGC ACG TAMRA - 3´
HMG-F 5´- TTG GAC TAG AAA TCT CGT GCT GA - 3´ 79
HMG-R 5´- GCT ACA TAG GGA GCC TTG TCC T - 3´
HMG-Probe 5´- FAM CAA TCC ACA CAA ACG CAC GCG TA TAMRA - 3´

3.1 Materials 38
3.1.5.3. Ligation-dependent amplification
Probes and primers for the detection of recombinant DNA (Maize MON810 and Roundup
Ready soya) and taxon-specific reference genes via ligation-dependent probe amplification
were synthesized from TIB MOLBIOL (Berlin); sequences are listed in Table 6.
Table 6 Probes and primers for the detection of recombinant DNA and taxon-specific reference genes in Maize MON810 and Roundup Ready soya via ligation-dependent amplification.
Target / GenBank accession nr Left probe / right probe Length
[nt]
Maize MON810 / AF434709
5´– CAG GCG GCG CAT TTT TAT TGC TAA TTC TTC TAT TTC TGA CTA ACG TTT AAC ATC CTT TGC CAT TGC - 3´ 66
P – 5´ – CCA GCT ATC TGT CAC TTT ATT GTG AAG ACT ACG GCA AAT GTC ATC GAC G - 3´ 49
Roundup Ready soya / AJ308514
5´ – CAG GCG GCG CAT TTT TAT TGC TCG CAA TGA TGG CAT TTG TAG GAG C - 3´ 46
P – 5´ – CAC CTT CCT TTT CCA TTT GGG TTC CCT TAA TTC TTC TAT TTC CTA CGG CAA ATG TCA TCG ACG - 3´ 63
Maize HMGa-gene / AJ131373
5´ – CAG GCG GCG CAT TTT TAT TGC TAA TTC TTC TAT TTC GTT TGT GTG GAT TGT AGG ACA AGG - 3´ 60
P – 5´ – CTC CCT ATG TAG CCA AGG CTA ACA CTA CGG CAA ATG TCA TCG ACG - 3´ 45
Soya Le1-gene / K00821
5´ – CAG GCG GCG CAT TTT TAT TGC TTC CTT CAA CTT CAC CTT CTA TGC CC - 3´ 47
P – 5´ – CTG ACA CAA AAA GGC TTG CAG ATG GTA ATT CTC TAC GGC AAA TGT CAT CGA CG - 3´ 53
Sanprime-F (unlabeled) 5´- CGT CGA TGA CAT TTG CCG TAG - 3´ 21
Sanprime-R (labeled) FAM – 5´-CAG GCG GCG CAT TTT TAT TGC - 3´ 21

3.2 Methods 39
3.2. Methods
3.2.1. DNA extraction
3.2.1.1. CTAB method
The CTAB extraction [156] was performed by adding 1000 µL extraction buffer
[cetyltrimethylammonium bromide (CTAB, ρ = 20 g/L), 1.4 M NaCl, 0.1 M Tris, 20 mM EDTA,
pH 8] to each sample (300 mg) and incubating the mixture at 65°C for 30 min. After
incubation, mixtures were centrifuged at 12.000 g for 10 min. The supernatant (500 µL) was
transferred to another tube and mixed with 200 µL chloroform for 30 sec. After 10 min
centrifugation, 400 µL of the aqueous phase were transferred to a new vessel, mixed with
800 µL precipitation buffer [CTAB ρ = 5 g/L, 40 mM NaCl], incubated for 1 hour at room
temperature and centrifuged at 12.000 g for 10 min. The buffer was subsequently discarded,
the precipitate was dissolved in 350 µL 1.2 M NaCl and mixed with 350 µL chloroform for 30
sec. After 10 min centrifugation, 300 µL of the aqueous phase were mixed with 180 µL 2-
propanol in a new vessel and centrifuged for 10 min. 2-Propanol was discarded and the DNA
pellet was mixed with 500 µL ethanol for 30 sec. Ethanol was subsequently discarded, the
pellet was dried at room temperature and finally dissolved in 100 µL TE-buffer [0.2 µM Tris-
EDTA].
3.2.1.2. Wizard method
The Wizard® extraction [157] was performed by adding 860 µL extraction buffer [10 mM
Tris-HCL, 150 mM NaCl, 2 mM EDTA, 1% (w/w) sodium dodecyl sulfate (SDS), pH 8.0], 100
µL guanidine chloride (5 M) and 40 µL proteinase K (20 mg/mL) to each sample (300 mg)
and incubating the mixture at 60°C for 3 hours. After incubation, mixtures were centrifuged
at 12.000 g for 10 min. The supernatant (500 µL) was transferred to another tube, mixed
with 5 µL RNase A (10 mg/mL) and incubated at 60°C for 5 min. The extracted DNA was
purified according to the isolation protocol [158], using Wizard® DNA binding resin
(Promega, Madison, USA)

3.2 Methods 40
3.2.2. Electrophoresis
DNA extracts were analyzed using 2% agarose gels (BMA Sea Kem LE Agarose, Rockland,
USA). PCR products were separated using 4% high resolution gels (BMA Nusieve 3:1
Agarose, Rockland, USA). DNA extracts or PCR products were mixed with loading buffer [TBE
buffer (45 mM Tris, 45 mM, boric acid, 1mM EDTA, pH 8.0), 40% (v/v) glycerin, 2.5 g/L
bromphenol blue sodium salt] in a proportion 5:1 and loaded into the ethidium bromide
stained gels. Electrophoresis was performed in TBE buffer at 130 mV until an appropriate
separation of the DNA extracts or PCR products was achieved. Gels were digitized using a
CCD camera-based documentation system GelDoc 1000 and the respective Multi Analyst
1.0.2 software (Bio Rad, München, Germany).
3.2.3. Photometric DNA analysis
DNA concentrations were determined spectrophotometrically at 260 nm using a UV/VIS
spectrometer (Kontron, Neufahrn, Germany). DNA purity was determined by measuring
additionally at 280 nm and calculating the ratios (260/280).
cDNA [ng/µL] = FDIL x CDNA x ∆ABS
FDIL = dilution factor CdsDNA = 50 (constant for double-stranded DNA) CdsDNA = 30 (constant for single-stranded DNA) ∆ABS = absorption against dest. H2O 0.1 ≤ ∆ABS ≤ 1.0
3.2.4. Design of primer and probes
Thermodynamic properties of primer and probes, as well as the likelihood of formation of
dimers and internal loops were assayed using a publicly available oligonucleotide properties
calculator (http://www.basic.nwu.edu/biotools/oligocalc.html) and the analysis software
Oligo 6.0 (Molecular Biology Insights Inc., Plymouth, USA).

3.2 Methods 41
3.2.5. Quantitative competitive PCR
3.2.5.1. Standard DNA mixtures with defined GMO contents
The calibration curve was generated on the basis of self-prepared external DNA standard
mixtures containing defined proportions of DNA from transgenic maize. The mixtures were
prepared by mixing DNA from maize Bt-176 (20 ng/µl) and DNA from conventional maize
(20 ng/µl) in proportions of 0.1%, 0.5%, 1%, 5%, 10% and 25%.
3.2.5.2. Heat-treated DNA standards
Aliquots of a standard mixture containing 10% DNA from maize Bt-176 were overlaid with
mineral oil (Sigma, Deisenhofen, Germany) and heat-treated in a thermocycler (Biometra
TRIO, Göttingen, Germany) at 95°C for 5, 10, 30, and 60 min.
3.2.5.3. Heat-treated flour samples
Polenta was prepared by boiling a mixture of ground maize kernels from maize Bt-176 and
conventional maize (1:10) at pH 6.3 according to [77]. Triplicate samples were taken from
the raw flour mixture after 15, 30 and 45 min boiling time. DNA of each sample was
extracted separately and subjected to competitive PCR analysis.
3.2.5.4. Competitive PCR
The determination of one point of equivalence (either for the cryIA(b)- or the ivr1- gene)
required the performance of six competitive reactions, each with a defined amount of
template DNA but increasing amounts of competitor DNA. For this purpose, template DNA
concentrations were adjusted to 20 ng/µL after extraction, and the linearized and purified
competitor plasmids (pIVR-St and pMA-St2) were diluted with HindIII-digested λ-DNA
(10 ng/µL) to obtain competitor solutions with concentrations in the range between 0.1 and
1000 fg/µL.
Competitive reactions were run in mixes (50 µL total volume) containing 5 µL 10x AmpliTaq
Gold reaction buffer (1.5 mM MgCl2) and 1 unit AmpliTaq Gold DNA polymerase (PE Applied
Biosystems, Weiterstadt, Germany), 0.2 mM of each deoxynucleotide triphosphate (PeqLab
Biotechnologie, Erlangen, Germany), 0.24 µM of each primer (MWG-Biotech, Ebersberg,
Germany), 5% DMSO (Merck, Darmstadt, Germany), sterile and pyrogen-free H2O
(Fresenius, Bad Homburg, Germany), as well as 100 ng template DNA and competitor DNA

3.2 Methods 42
(variable amounts). Additional control reactions were performed either by using exclusively
template DNA or competitor DNA (positive controls), or by omitting both (negative controls).
Reactions were run over 40 cycles in a conventional thermocycler (Biometra TRIO,
Göttingen, Germany), according to the following temperature programs: initial denaturation
(8 min at 95°C), cycle denaturation (30 s at 95°C), primer annealing (30 s at 63°C for
primers CRY03/04; 30 s at 68°C for primers IVR-F/R), elongation (30 s at 72°C) and final
elongation (10 min at 72°C).
After separation of PCR products via gel electrophoresis, band intensities of competitor and
target amplicons were determined using Multi Analyst 1.0.2 software (BioRad, Munich,
Germany); collected data were exported to a Microsoft Excel file. Ratios between signal
intensities of competitor and target amplicons were plotted logarithmically against
competitor amounts initially used in each reaction. Points of equivalence were determined at
the intersection of the linear regression curve with the abscissa.
3.2.6. Quantitative real-time PCR
3.2.6.1. Preparation and characterization of milling products from maize
Maize kernels (100 g batches) were ground for 30 sec in a laboratory blender. The resulting
material was fractionated using 1 mm, 0.8 mm, 0.4 mm and 0.1 mm standard sieves (DIN
4188, ISO 565 T1).
Particle size distributions of the obtained fractions were measured using a laser diffraction
system (Helos, Sympatec GmbH, Clausthal/Zellerfeld, Germany). Two dry dispersion
techniques were applied; a fall-shaft gravity disperser (GRAD S) was used for the 1 mm
(coarse grits), 0.8 mm (regular grits) and 0.4 mm (corn meal) fractions, and a shear-force,
jet nozzle disperser (RODOS) was used to measure the particle size distribution of the
0.1 mm (corn flour) fraction. Triplicate measurements were performed for each fraction.
I
3.2.6.2. Preparation of milling fractions with defined GMO proportions
Prior to the preparation of the sample mixtures, milling fractions were dried for 48 hours at
55°C to equalize moisture contents. Mixtures between milling products from conventional
and transgenic maize (coarse grits and flour) were prepared directly in 2 mL reaction
vessels. As described in Table 7, the proportion of 1% maize Bt-176 was obtained by using
four different mixing regimes. Four types of mixtures containing 1% (w/w) maize Bt-176,

3.2 Methods 43
were generated by adding 3 mg of either grits or flour from transgenic maize to 297 mg of
either grits or flour from conventional maize. Four samples of each mixture were used to test
the DNA extraction methodology.
Table 7 Composition of the sample mixtures
Maize Bt-176 Conventional maize Sample
Coarse grits [mg]
Flour [mg]
Coarse grits [mg]
Flour [mg]
Mix 1 3 - 297 -
Mix 2 - 3 - 297
Mix 3 - 3 297 - Mix 4 3 -
- 297
3.2.6.3. Process of e hanol production f om maize t r
The process of ethanol production was performed at laboratory scale in accordance to
technical parameters from the literature [159-162].
The process was carried out using a mixture of corn meal containing 10% of material
derived from maize Bt-176. This mixture was obtained after drying the starting fractions
separately to equalize moisture contents and mixing 5 g of conventional material with 45 g
of material derived from maize Bt-176. The initial mashing step was started by adding
250 mL H2O (50°C) and homogenizing the mixture with an ultraturrax for 2 min. The mixture
was kept at room temperature for 120 min. The mixture was homogenized for a second time
and the pH-value was adjusted to 6.0 with sulphuric acid (0.5 M). Liquefaction was
performed under moderate stirring (60 min at 90°C), application of 25 µL α-amylase
(Novozymes Thermamyl 120 L (120 U/mL); Bagsvaerd, Denmark) and three drops of anti-
foaming agent (Dow Corning DC 1510, Seneffe, Belgium). H2O losses were continuously
compensated during the process. Following liquefaction, the mixture was cooled down to
55°C at room temperature, and a pH-value of 5.5 was adjusted with sulphuric acid (0.5 M).
Saccharification was carried out under moderate stirring (30 min at 55°C) and application of
an enzyme mix (50 µL) containing amyloglucosidase, α-amylase and proteases (Novozymes
SAN Super 240 L (240 U/mL); Bagsvaerd, Denmark).
Prior to fermentation, 0.1 g distillers yeast (BEGEROW SIHA-Amyloferm (Saccharomyces
diastaticus); Langenlonsheim, Germany) were dissolved in 500 µL H2O and pre-incubated at
35°C for 15 min. The pre-incubated yeast was subsequently added to the saccharified

3.2 Methods 44
mixture at room temperature; anaerobic fermentation was carried out at 32°C for 68 hours.
The separation of ethanol from the fermented mash (50 mL) was performed in a standard
distillation apparatus under constant stirring.
Samples (triplicates) were taken following the stages of mashing, enzymatic liquefaction and
saccharification, yeast fermentation, and from the mash after distillation periods of 20 and
40 min. Prior to DNA extraction, samples were dried at 40°C for 68 hours in a convection
oven. The dried material was subsequently comminuted by hand using mortar and pestle.
3.2.6.4. Real-time PCR
Real-time PCR was performed using an Abi Prism® 7700 Sequence Detection System
(Applied Biosystems, Forster City, USA). Reactions were run over 45 cycles according to the
following temperature program: Uracil-N-Glycosylase (UNG) decontamination (2 min at
50°C), initial denaturation (10 min at 95°C), cycle denaturation (15 s at 95°C), primer
annealing, elongation and data collection (60 s at 60°C).
Collected data (Ct-values) were exported to a Microsoft Excel file for evaluation. Standard
curves were constructed by plotting the Ct-values determined for the quantification
standards against the logarithm of the respective amounts of target DNA. The amount of
target DNA in an unknown sample was extrapolated on the basis of the standard curve.
Relative quantification of GMO contents required the assessment of the recombinant DNA
and of a species-specific reference gene.
Additional positive and negative control reactions, as well as quantification controls using
DNA from reference materials (IRMM, Geel, Belgium) were performed.
Method A
Quantifications were carried out using a commercially available kit (GMOQuant Maximizer™
Bt-176 Corn DNA Quantification System, GeneScan Europe AG, Bremen, Germany) consisting
of two ready-to-use master mixes; one for the detection of the synthetic cryIA(b)- gene and
the other for the maize-specific (HMGa) gene. Reactions were performed according to the
instructions of the kit in mixes (50 µL total volume) containing 100 ng (5 µL) template DNA.
The kit included respective quantification standards for the generation of standard curves.
Method B
As described by Höhne et al. [104], this multiplex quantification assay is based on the
detection of the 35S-CaMV promoter and the maize-specific zein (Ze1-) gene.

3.2 Methods 45
Multiplex reactions were performed in mixes (50 µL total volume) containing 25 µL 2x
TaqMan Universal PCR Master Mix (Applied Biosystems, Forster City, USA), primer 35S-F and
35S-R (300 nM, each), primer Ze1-F and Ze1-R (30 nM, each), TaqMan probes 35S-Probe
and Ze1-Probe (100 nM, each) and 100 ng (5 µL) template DNA.
Standard curves were generated on the basis triplicate analysis of self-prepared
quantification standards. For the quantification of samples of thermally treated maize milling
products (see 4.3.2.2), quantification standards consisted of a dilution series of DNA
extracted from maize Bt-176 covering a concentration range between 50 and 0.05 ng/µL. For
the quantification of samples taken from the process of ethanol production (see 4.3.3.1),
quantification standards were prepared by mixing DNA from maize Bt-176 (100 ng/µL) with
DNA from conventional maize (100 ng/µL) in a proportion of 1:10 and diluting this mixture to
obtain solutions covering a DNA concentration range between 100 and 0.16 ng/µL.
Method C
Quantifications were carried out according to the official guidelines [150]. The preparation of
complex master mixes was simplified by the application of a ready-to-use commercial master
mix containing all necessary reagents.
Reactions were performed in mixes (50 µL total volume) containing 25 µL 2x TaqMan
Universal PCR Master Mix (Applied Biosystems, Forster City, USA), primers CRY1-F/R or
primers HMG-F/R (300 nM, each), TaqMan probes CRY-Probe or HMG-Probe (160 nM) and
100 ng (5 µL) template DNA.
Standard curves were generated on the basis of triplicate analysis of self-prepared
quantification standards. These were prepared by mixing DNA from maize Bt-176
(100 ng/µL) with DNA from conventional maize (100 ng/µL) in a proportion of 1:10 and
diluting this mixture to obtain solutions covering a DNA concentration range between 100
and 0.16 ng/µL.
Method C’
Reactions were performed in mixes (50 µL total volume) containing 25 µL 2x TaqMan
Universal PCR Master Mix (Applied Biosystems, Forster City, USA), primers CRY2-F/R or
primers HMG-F/R (300 nM, each), TaqMan probes CRY-Probe or HMG-Probe (160 nM) and
100 ng (5 µL) template DNA.
Standard curves were generated on the basis of triplicate analysis of self-prepared
quantification standards. These were prepared by mixing DNA from maize Bt-176
(100 ng/µL) with DNA from conventional maize (100 ng/µL) in a proportion of 1:10 and

3.2 Methods 46
diluting this mixture to obtain solutions covering a DNA concentration range between 100
and 0.16 ng/µL.
3.2.7. Ligation-dependent amplification
Hybridization and ligation of probes were performed in 500 µL PCR reaction vessels using a
thermocycler (Mastercycler Gradient, Eppendorf, Hamburg, Germany). Reaction mixes (5 µL
total volume) contained 1x Ampligase reaction buffer and 1 unit Ampligase (Epicentre,
Madison, USA), 10 fmol of each LPA probe specific for the detection of the recombinant DNA,
0.5 fmol of each LPA probe specific for the detection of the reference genes and 150 ng
sample DNA (either as 1:1 mixtures from maize and soya extracts or pure).
Initial DNA denaturation at 95°C for 3 min was followed by 20 denaturation and ligation
cycles at 95°C for 15 sec and 61°C for 5 min. After ligation, reaction mixes were heated for 5
min at 98°C to inactivate the enzyme and were stored at 4°C.
The reaction mix used for the amplification of ligation products (25 µL total volume)
contained 1x AmpliTaq Gold buffer, 0.75 units AmpliTaq Gold polymerase, 12.5 nmol MgCl2,
5 µmol of each dNTP (reagents acquired from Applied Biosystems, Weiterstadt, Germany),
2.5 pmol Sanprime-labeled, 5 pmol Sanprime-unlabeled and 1 µL template from the ligation
mix. Reactions were carried out using 500 µL PCR reaction vessels in a thermocycler (Primus
96 Plus, MWG Biotech AG, Ebersberg, Germany). DNA denaturation and polymerase
activation at 95°C for 8 min was followed by 45 amplification cycles at 95°C for 15 sec and
62 °C for 60 sec and a final step of 7 min at 72 °C. Reaction mixes were finally cooled down
to 4°C.
3.2.8. Fragment length analysis
Fragment length analysis was performed on an ABI PRISM® 310 Genetic Analyzer using
capillaries (47 cm) polymer (POP-4™ Performance Optimized Polymer) and further reagents
from Applied Biosystems (Forster City, USA). Amplification products were diluted 1:20 with
HPLC grade H2O. 1 µL of this dilution was mixed with 0.3 µL size standard (GeneScan®-500
[TAMRA]™) and 14.7 µL Hi-Di™ Formamide. Prior to analysis, DNA was denatured at 95°C
for 2 min and cooled down on ice. Electrokinetic injections were performed at 15 kV for 10
sec. Runs were carried out at 60°C and 15 kV.

3.2 Methods 47
3.2.9. Sequencing
Ligation products were generated and amplified separately prior to sequencing. Primers used
for sequencing were identical to those listed in Table 6 with exception that these were not
FAM-labeled. Amplified products were cleaned up using a PCR purification kit (QIAquick‚
Quiagen GmbH, Hilden, Germany) and used as template for the sequencing PCR. This
reaction was performed using a BigDye‚ Terminator v1.1 Cycle Sequencing Kit (Applied
Biosystems, Foster City, USA). One reaction mix (10 µL) contained 1 µL 5x buffer, 2 µL RR-
mix, 2.5 µL primer (10 pmol), 3.5 µL H2O and 1 µL template. Reaction conditions were as
follows: initial denaturation (1 min at 96°C), 25 cycle denaturation steps (10 sec at 96°C)
and primer annealing (5 sec at 62°C), and a final step (4 min at 60°C).
A purification of the PCR products was carried out following amplification. Therefore, PCR
products (10 µL) were mixed with 8 µL H20, 10 µL Na-Acetate (3M) and 250 µL EtOH
(100%) in a 1.5 mL reaction vessel and centrifuged at 15.000 rpm for 15 min. EtOH was
removed carefully without damaging the precipitated DNA pellet. The pellet was vortexed
with further 250 µL EtOH and centrifuged at 15.000 rpm for 5 min. After carefully removing
EtOH, the pellet was allowed to dry at 50°C for 1 hr. Finally, DNA was dissolved in 20 µL
H2O.
Sequencing was carried out in an ABI PRISM® 310 Genetic Analyzer (Applied Biosystems,
Forster City, USA) using 47 cm capillaries and POP-6™ Performance Optimized Polymer.
Electrokinetic injections were performed at 2 kV for 30 sec. Runs were carried out at 50°C
and 15 kV.
4.1 Relative quantification of GMO content via double-competitive PCR 48
4. Results and discussion
4.1. Relative quantification of GMO content via double-competitive PCR
4.1.1. Introduction
The application of competitive PCR for the (semi-) quantitative analysis of DNA from GMO in
food samples has been described by several authors [82, 89, 90-95]. Quantification of
recombinant DNA in unknown samples requires firstly the determination of points of
equivalence in isolates from reference materials with defined GMO contents. These data are
subsequently used to evaluate points of equivalence determined in DNA extracts from
unknown samples. An accurate quantification of GMO contents using assays based on a
single competitive PCR is thus feasible, provided that the concentrations of DNA in the
isolates from reference materials and samples have been adjusted to the same value prior to
analysis.
Such assays have delivered consistent performance when applied to samples showing a
similar constitution to that of the respective reference materials used for quantification. For
instance, isolates of commercially available reference materials consisting of flours with
defined GMO contents have been successfully used as external quantification standards for
the analysis of raw materials or lightly processed food samples. However, limitations of
single competitive PCR based assays were recognized, particularly when analyzing samples
of composed and/or highly processed foods [90, 165].
Errors in the quantification of GMO contents in composed foods emerge because the
compositions of their DNA isolates do not correspond to the compositions of the isolates
from commercially available reference standards, which are produced using flours of
individual organisms. In contrast, isolates from composed foods represent rather a mixture
of DNA from each food ingredient. Thus, an accurate determination of GMO contents in such
samples would either require the use of analogous reference materials, or detailed
knowledge about the respective food composition to allow a normalization of the obtained
results. In addition, analysis of processed foods is prone to substantial errors due to the
degradation of DNA during manufacturing processes. Breakdown of target sequences at high
stages of processing results in lower point of equivalence values. Consequently, this effect
diminishes the recovery of GMO contents [95] and cannot be compensated unless reference
material is available, which properly imitates the degree of degradation of the food sample.
The described limitations are related to the setup of the competitive PCR system and not to
the competitive PCR technology itself. The development of assays for the quantification of

4.1 Relative quantification of GMO content via double-competitive PCR 49
DNA sequences in foods must take into account that the determination of DNA
concentrations (via UV-absorption) in isolates of composed or processed foods does not
allow a differentiation between DNA from different organisms, nor a differentiation between
amplifyable and degraded DNA. This leads to severe discrepancies in the results of single-
competitive PCR based quantification. Considering the impossibility of creating adequate
reference materials for each food product available on the market, a double-competitive
analysis strategy has been proposed, which evidently possesses the potential to eliminate
such errors [90, 91, 95, 165, 166]. Two competitive PCR assays are run in parallel with the
aim to determine points of equivalence for transgenic and reference target sequences, the
latter being specific for the organism as such. This analytical strategy permits the
normalization of the points of equivalence determined for the recombinant DNA with the
values determined for the endogenous reference gene.
This chapter describes the development of a calibration curve, based on self-prepared
external DNA standards, to be used for the relative quantification of Bt-176 maize contents
in composed and/or thermally treated foods by means of double-competitive PCR (dcPCR).
The applied detection system consists of two separate competitive PCR assays designed
respectively for (a) the quantification of recombinant DNA targeting a 212 bp overlapping
sequence between the CDPK promoter and the synthetic cryIA(b)-gene and (b) the
quantification of a 225 bp fragment of the Zea maize-specific invertase (ivr1-) gene [95].
Self-prepared mixtures of DNA from transgenic and conventional maize, with GMO contents
of respectively 0.1%, 0.5%, 1%, 5%, 10% and 25%, were used as quantification standards.
Data obtained from the analysis of these standards were used to describe the correlation
between ratios of points of equivalence (transgene/reference gene) and the respective
proportion of recombinant DNA. This calibration curve was subsequently applied for the
relative quantification of DNA from maize Bt-176 in heat-treated DNA mixtures, heat-treated
maize flour mixtures and in industrial bakery mixes, where the maize material constituted
just one of several ingredients.
4.1.2. Preparation of a calibration curve on the basis of DNA standards
External standards used for the construction of the calibration curve were prepared with DNA
isolates from GM maize (Bt-176) and its conventional counterpart at an adjusted
concentration of 20 ng/µL. Isolates were subsequently mixed in different regimes to obtain
solutions of maize DNA with recombinant maize DNA proportions of respectively 0.1%,
0.5%, 1%, 5%, 10% and 25%.

4.1 Relative quantification of GMO content via double-competitive PCR 50
Each DNA standard was subjected to triplicate double-competitive PCR analysis, determining
the points of equivalence for the transgene (cryIA(b)-gene) and for the maize specific
reference gene (ivr1-gene). As illustrated in Figure 5, values of the normalized points of
equivalence were plotted against the proportion of recombinant maize DNA in the standard
mixtures, resulting in a curve with very good linearity (r > 0.99) in the regression analysis.
y = 0,0463xR2 = 0,996
0,0
0,5
1,0
1,5
0 5 10 15 20 25 30
Proportion of Bt-DNA [%]
Rat
io P
E CR
Y/P
E IV
R
Quantification standards
Figure 5 Calibration curve for the determination of Bt-176 maize proportions via dcPCR. Ratios between points of equivalence (PE) of transgenic and reference targets (cryIA(b)- and ivr1- genes, respectively) were plotted against the actual GMO proportion in the quantification standards. Standard deviations of the mean values were calculated using Gauss’ law for the propagation of random errors.
Data generated by the construction of the calibration curve delivered all necessary
parameters for the relative quantification of recombinant maize DNA contents according to
Equation 1.
(1) ),(% 1
IVR
CRY
PEPEmyxfBt ⋅== −
%Bt = Percentage of Bt-maize DNA within the total content of maize DNA PECRY = Mean point of equivalence for the recombinant cryIA(b)-gene
= Mean point of equivalence for the maize specific ivr1-gene PEIVR
m = Slope

4.1 Relative quantification of GMO content via double-competitive PCR 51
Since two independent measuring systems with own random errors are used for the
calculation of Bt-maize DNA contents (Equation. 1), it was important to illustrate to what
extent these errors will propagate into the final results. Limits of precision, calculated using
Gauss’ equation for the propagation of random errors (Equation 2), deliver a measure for the
quality of the determined points of calibration in Figure 5.
∆ f (x, y) =δ f (x,y)
δ x⎛ ⎝ ⎜ ⎞
⎠
2
∆x( )2 +δ f (x,y)
δ y⎛ ⎝ ⎜ ⎞
⎠
2
∆y( )2⎧ ⎨ ⎩
⎫ ⎬ ⎭
(2)
∆x, ∆y = Standard deviation of the mean
Analysis of the quantification standard containing 10% of DNA from maize Bt-176 delivered,
for instance, a mean PECRY/PEIVR value of 0.48 ± 0.08. On the basis of the data gained from
regression analysis, it was concluded that the calculated GMO content yielded by
quantification of this DNA standard should lie in the range between 8.6 and 12.2%.
These results demonstrate the feasibility of the construction of a calibration curve based on
self-prepared DNA standards for the relative quantification of GMO, despite of the complex
and time-consuming procedure. A more accurate illustration of deviation intervals, i.e. at
higher degrees of confidence, requires though the accomplishment of a higher number of
measurements.
4.1.3. Quantification of Bt-Maize proportions
4.1.3.1. Heat-treated DNA mixtures
The applicability of the developed standard curve to the dcPCR-based determination of GMO
proportions in samples showing a certain degree of DNA degradation was investigated by
analysis of untreated and thermally treated DNA mixtures. Separately prepared isolates from
maize Bt 176 and from its conventional counterpart were adjusted to a defined concentration
(20 ng/µL) with TBE buffer and combined 1:10 to simulate DNA extracted from samples
containing GMO material in a proportion of 10%. Aliquots of this mixture were overlaid with
mineral oil and heat-treated for 5, 10, 30 and 60 min at 95°C to induce a continuously
increasing degradation of DNA.

4.1 Relative quantification of GMO content via double-competitive PCR 52
The degree of DNA degradation was visualized by gel electrophoretic analysis of the
untreated and thermally treated aliquots. As shown in Figure 6, the average DNA fragment
length continuously decreased due to the induced thermal stress, resulting in barely visible
traces after thermal treatment for 60 min.
λ-DNA 0 min 5 min 10 min 30 min 60 min Ladder
Figure 6 Thermally induced degradation of DNA.
Results delivered by competitive PCR analysis reflected the observed degradation of the
template DNA in the course of thermal treatment. As illustrated in Table 8, amounts of target
DNA, determined at the points of equivalence for both target sequences, decreased steadily
resulting in recoveries of ~ 3.5% of the initial values after 60 min treatment. However,
double-competitive analysis yielded nearly constant ratios between points of equivalence
from transgenic and reference target sequences (PECRY/PEIVR) at all stages of heat-treatment.
This was ascribed to the similar degradation rates of the targeted sequences. Thus, a
calibration curve-based quantification of the mixtures was feasible, regardless of the degree
of degradation of the template DNA.

4.1 Relative quantification of GMO content via double-competitive PCR 53
Table 8 Quantification of recombinant DNA in mixtures of heat-treated isolates from conventional and Bt-176 maize (10%).
Heat treatment time [min]
PE cryIA(b) [fg]
PE ivr1 [fg] PECRY/PEIVR
Calculated Bt-maize proportion [%]
0 207.3 460.5 0.45 9.7 5 152.8 386.3 0.40 8.6
10 113.9 296.1 0.38 8.2 30 43.4 90.5 0.48 10.4 60 6.9 15.2 0.45 9.7
mean ± SD 0.432 ± 0.04 9.3 ± 0.8 PE = point of equivalence; means of duplicate dcPCR analysis
4.1.3.2. Heat-treated maize flour
The determination of GMO proportions in processed food samples was tested exemplarily by
analysis of heat-treated maize flour (polenta). In analogy to the model experiment using
mixtures of DNA isolates, the objective of this study was to trace DNA degradation along the
heating process and to demonstrate the suitability of this calibration curve-based dcPCR
system for the quantification of Bt-maize proportions, regardless of the extent of DNA
degradation. Polenta samples were prepared by boiling a mixture of ground kernels from
transgenic and conventional maize (10% Bt-176 maize) for 15 and 30 min.
As shown in Table 9, competitive PCR analysis of the isolates from untreated and thermally
treated flour mixtures yielded decreasing amounts of competitor DNA at points of
equivalence for both target sequences, thus, pointing to an ongoing breakdown of the
template DNA due to thermal stress.
Table 9 Quantification of DNA from maize Bt-176 in heat-treated maize flour mixtures with a transgenic maize proportion of 10%.
Heat treatment time [min]
PE cryIA(b) [fg]
PE ivr1 [fg] PECRY/PEIVR
Calculated Bt-maize proportion [%]
0 145.5 256.9 0.57 12.2 15 79.4 130.4 0.61 13.1 30 72.7 118.8 0.61 13.2
mean ± SD 0.60 ± 0.03 12.9 ± 0.5 PE = points of equivalence; means of triplicate dcPCR analysis

4.1 Relative quantification of GMO content via double-competitive PCR 54
Comparison of degradation rates, expressed as the heating time-dependent decrease of the
amounts of competitor DNA at points of equivalence, revealed strong differences to the
results obtained from the analysis of heat-treated DNA mixtures. For instance, degradation
of the transgenic target region within the first 30 min of processing occurred more than
twice as fast in mixtures of DNA isolates (5,4 fg/min) than in samples of heat-treated flours
(2,4 fg/min). This observation suggests that the constitution of the matrix in the flour
samples may play a protective role, reducing the effect of thermal stress on DNA
degradation. This assumption seems plausible as other kinds of matrix-dependent effects
have been described to influence the occurrence of DNA degradation [141, 163, 164].
Double-competitive PCR analysis yielded similar values for point of equivalence ratios
(PECRY/PEIVR), regardless of the extent of DNA degradation. Consequently, this resulted in a
nearly constant recovery of GMO contents even after 30 minutes boiling time. Calculated
GMO contents were found to lie slightly above the margin of error determined for the
respective quantification standard at 10% GMO (see 4.1.2). These levels of relative
deviations from the true values are inherent to dcPCR systems as it has been shown in
previous validation studies with certified reference materials as external quantification
standards [151, 166].
4.1.3.3. Bakery mixes
The applicability of the developed calibration curve to the dcPCR-based quantification of
transgenic maize contents in composed foods was assessed on the basis of industrial bakery
mixes. The overall maize content of the analyzed mixes constituted 15% of the total dry
matter. Within this moiety, the content of transgenic material in the different samples
comprised respectively 0%, 6.25% or 12.5%.
This study addressed concerns regarding negative side effects due to the complexity of the
sample composition, since the unavoidable co-extraction of DNA from ingredients derived
from organisms other than maize (sunflower, rye, wheat, potato) automatically reduces the
proportion of maize DNA available for amplification reactions. Furthermore, the presence of
certain ingredients known to promote an inhibition of PCR reactions, such as iodine salt,
whey derivatives, lecithin E322, ascorbic acid and enzymes, may alter the results of
quantitative analyses [66].
Bakery mixes were subjected to duplicate DNA extraction. Prior to dcPCR analysis, isolate
concentrations were adjusted to a defined value (20 ng/µL) to standardize the amount of
total DNA applied in each amplification reaction. As summarized in Table 10, the use of equal

4.1 Relative quantification of GMO content via double-competitive PCR 55
amounts of template DNA in all competitive amplification reactions yielded comparable points
of equivalence for the iv 1- gene. The points of equivalence determined for the reference
gene were highly reproducible among the separately performed DNA extractions and
remained unaffected by the GMO content of the different samples. This observation is in
agreement with the specified compositions of the bakery mixes, i.e. a constant total content
of maize-derived material in all samples.
r
Table 10 Quantification of DNA from transgenic maize (Bt-176) in industrial bakery mixes.
Actual Bt-maize proportion [%]
PE cryIA(b) [fg]
PE ivr1 [fg]
mean PECRY/PEIVR
Calculated Bt-maize proportion [%]
1st extract
2nd extract
1st extract
2nd extract
0 n.d. n.d. 5.5 5.4 - -
6.25 1.9 1.7 5.8 5.8 0.31 6.7
12.5 4.2 4.0 5.2 5.9 0.73 15.8
PE = point of equivalence; means of duplicate competitive PCR analysis n.d. = not detectable
Amounts of competitor DNA required at the points of equivalence for the synthetic cryIA(b)-
gene increased proportionally to the content of genetically modified material within the
maize moiety. As in the case of the reference gene, determined points of equivalence were
well reproducible among duplicate DNA extractions.
Ratios between the averaged points of equivalence from transgenic and reference target
sequences (PECRY/PEIVR) were evaluated according to the parameters delivered by the
calibration curve (see 4.1.2). The calculated contents of material derived from maize Bt-176
properly reflected the actual GMO proportions in the bakery mixes. The quantification results
were not affected either by the complex composition of the bakery mixes, or by the presence
of potential PCR inhibitors. The extent of the relative deviations from the true values, e.g.
~25% in the mix containing 12.5% GMO-derived material, was comparable to that delivered
by the analysis of the heat-treated maize flours. It must be taken into account that the
calculation of GMO contents in the bakery mixes was performed using data from single
dcPCR analysis of just two separate DNA isolates. Thus, although these data allowed a
simple estimation of the reproducibility and the suitability of the dcPCR system for the GMO
analysis in composed food samples, further data would be required for a reliable assessment
of the precision of the method.

4.1 Relative quantification of GMO content via double-competitive PCR 56
4.1.4. Summary
Self-prepared mixtures of DNA isolates from maize Bt-176 and from its conventional
counterpart were used as external standards to allow the relative quantification of
recombinant DNA in samples of processed and/or composed foods. The applied dcPCR
system allowed the determination of points of equivalence for the synthetic cryIA(b)- gene
and for the maize-specific ivr1- gene, which was taken as reference for normalization. Data
gained by the analysis of the external standards were used for the generation of a calibration
curve, which described the correlation between the normalized points of equivalence
(PEcryIA(b)/PEivr1) and the actual proportions of recombinant DNA in the quantification
standards.
This calibration curve-based system was subsequently applied for the determination of GMO
contents in samples showing a certain degree of DNA degradation. Two model experiments
were performed using (a) heat-treated mixtures of DNA isolates and (b) heat-treated
mixtures of maize flours (polenta), both with a content of GMO-derived material of 10%. In
either case, degradation of nucleic acids resulted in steadily decreasing amounts of
competitor DNA at the points of equivalence of the respective target sequences.
Nevertheless, normalization of points of equivalence from the transgenic target with the
values from the endogenous reference, and the additional application of the calibration curve
for the evaluation of the ratios (PEcryIA(b)/PEivr1), allowed a nearly constant recovery of GMO
contents regardless of the extent of DNA degradation.
The suitability of this system for the relative quantification of GMO contents in composed
foods was assessed by analysis of industrial bakery mixes. The aim of this study was to
elucidate whether the results of relative quantification could be negatively influenced by the
compositions of the samples. This assumption seemed plausible since the overall maize
content of the mixes constituted merely 15% of the total dry matter. Thus, the unavoidable
co-extraction of DNA from materials derived from organisms other than maize (sunflower,
rye, wheat, potato) automatically reduced the proportion of maize DNA available for
amplification reactions. In addition, quantification results could have been altered by the
presence of potential PCR inhibitors, such as iodine salt, whey derivatives, lecithin E322,
ascorbic acid and enzymes. Competitive PCR analysis yielded nearly constant values for
points of equivalence determined for the reference gene in all samples, whereas points of
equivalence determined for the transgenic target were proportional to the GMO content of
the samples. The evaluation of ratios between points of equivalence (PEcryIA(b)/PEivr1), using
the previously generated calibration curve, yielded results corresponding to the actual GMO
contents in the samples.

4.1 Relative quantification of GMO content via double-competitive PCR 57
Despite of these successful applications of double competitive PCR, the technique has to be
considered as extremely time-consuming and material-intensive for the quantification of
nucleic acids. These drawbacks strongly reduce the attractiveness of dcPCR-based methods
for the routine analysis of GMO in food products.

4.2 Influence of particle sizes on the determination of GMO contents 58
4.2. Influence of particle sizes on the determination of GMO contents
4.2.1. Introduction
GMO analysis in processed foods has been repeatedly shown to entail a number of
complications, which negatively affect the performance of detection methods. Previous
investigations regarding potential effects of food processing on the results of qualitative
and/or quantitative GMO analysis have been focused on the degradation of DNA during
manufacturing processes. It has been shown for instance, that analyte degradation in the
course of food processing will lower limits of detection (LOD), as well as limits of
quantification (LOQ) of DNA in PCR-based systems [68].
Effects of other commonly used technological processes of food manufacturing on the results
of quantitative analysis have been poorly assayed, although food processing does not only
comprise degradation of analytes due to external stress parameters. In fact, formulation of
different ingredients in combination with further processing represents an additional
challenge to GMO analysis. Composed foods consist of a variety of ingredients exhibiting
different properties resulting from diverse stages of manufacturing within the food chain.
Taking into account that manufacturing steps can range from simple mechanical procedures
(e.g. separation of milling fractions) to complex sequences of chemical reactions, it is very
likely that DNA molecules embedded in the matrices of the different ingredients will not be
equally accessible to analysis.
Experiments performed in the following study were designed to assess the influence of the
particle size compositions of maize milling products on the determination of GMO contents
via real-time PCR. Different milling fractions of maize - from coarse grits down to fine flours -
are usually applied for the industrial production of foods [167, 168]. Analogous fractions
were prepared at laboratory scale by grinding whole maize kernels and subsequently sieving
the material through standard sieves. The particle size distributions of the obtained fractions
were characterized using a laser diffraction system.
As an adequate preparation of DNA is one of the first prerequisites for a successful GMO
analysis in foods, two established DNA extraction methods [10] were used to assess the
correlation between median particle sizes of the milling fractions and the yield of DNA in the
isolates. In a second approach, a commercially available kit for the relative quantification of
DNA from maize Bt-176 via real-time PCR was applied for the determination of GMO contents
in mixtures of milling fractions. Formulations containing milling fractions with different
particle size distributions are widely used in industrial applications, e.g. in bakery mixes, to

4.2 Influence of particle sizes on the determination of GMO contents 59
regulate important functional and sensory characteristics of the products. Samples analyzed
in this experiment, each with a GMO content of 1%, were prepared by different
combinations of coarse grits and flour made from conventional and transgenic maize. The
aim of these experiments was to elucidate whether the composition of the samples could
have an influence on the results of relative quantification, and to estimate to what extent the
application of different DNA preparation protocols may interfere with the obtained results.
4.2.2. Preparation and characterization of milling fractions
Milling fractions of maize, e.g. corn flour, meal and grits, are commonly used in industrial
applications to prepare a wide range of products, such as snacks and bread mixes. An
accurate adjustment of particle size compositions in mixes of milling products is generally
obtained by recombining sieved fractions and is essential for the regulation of important
functional characteristics in the end-products [140, 168]. Sieves used for the separation of
the maize fractions in this experiment were chosen to approximately imitate particle size
ranges commonly used for industrial purposes [167]. The obtained fractions were
characterized using a laser diffraction system to acquire precise information about their
cumulative particle size distributions ( Figure 7). Median particle sizes (X50 values) specify the
particle size at which 50% of the total volume of all particles has been reached.

4.2 Influence of particle sizes on the determination of GMO contents 60
Corn Flour
0
20
40
60
80
100
0 100 200 300 400Particle Size [µm]
Q3
[%]
Cum
ulat
ive
Dis
tribu
tion
Q3 [
%]
X50 = 19,1 µm CI(P<0,05) = 1,6
D
Cornmeal
100
0
20
40
60
80
0 200 400 600 800 1000
Particle Size [µm]
Q3
[%]
tion C
Regular Corn Grits
0
20
40
60
80
100
0 500 1000 1500Particle Size [µm]
Q3
[%]
Cum
ulat
ive
Dis
tribu
tion
Q3 [
%]
X50 = 696,9 µm CI(P<0,05) = 40,9
B
Coarse Corn Grits
0
20
40
60
80
100
0 500 1000 1500 2000 2500Particle Size [µm]
Q3
[%]
Cum
ulat
ive
Dis
tribu
tion
Q3 [
%]
X50 = 1049,4 µm CI(P<0,05) = 16,3
A
Cum
ulat
ive
Dis
tribu
Q3 [
%]
X50 = 286,6 µm CI(P<0,05) = 53,4
Figure 7 Cumulative particle size distributions of the whole corn milling products manufactured at laboratory scale. (A) Coarse corn grits, (B) regular corn grits, (C) cornmeal and (D) corn flour. Mesh sizes of the standard sieves: 1 mm, 0.8 mm and 0.4 mm and 0.1 mm. X50 values = median particle sizes

4.2 Influence of particle sizes on the determination of GMO contents 61
Measurements indicated that the ranges of the distribution curves did not completely agree
with the expected values when looking at the sizes of the sieve meshes used. This effect
appears to be stronger for coarse products, where for instance approximately 50% of the
total particle volume of coarse corn grits consisted of particle sizes over 1 mm, although a 1
mm sieve was used as upper limit. Such shifts can be mainly explained by the irregularity of
the shapes of coarse particles (not perfectly spherical), which significantly influences the
determination of the respective equivalent diameters. Shifts at the lower particle size limits
may emerge due to non-sufficient sieving time.
4.2.3. Influence of particle sizes on the efficiency of DNA extraction
The extraction of DNA from the different milling fractions offered a first impression on the
effect of particle size distributions on the results of quantitative GMO analysis. DNA yields
from the different milling fractions were compared using two isolation methods; a
commercial extraction protocol based on DNA-binding silica columns (Wizard® method) and
the CTAB/Chloroform method. These methods were recently described as highly appropriate
for GMO analysis in foods [10] and have been used by governmental authorities in reference
analysis protocols [77-78].
Results listed in Table 11 indicate that in both cases DNA yields increased depending on the
degree of comminution of the respective fraction. Differences between DNA concentrations
in the isolates from coarse grits and fine flours were more pronounced when using the
CTAB/Chloroform method. The observed data are in agreement with findings of other
research groups [58, 116].
Table 11 DNA extraction from maize milling products with different particle size distributions
DNA concentration ** [ng/µl] Milling fraction Median particle size
X50 [µm] ± CI(95%) CTAB-extraction* Wizard-extraction*
Coarse grits 1049 ± 16 196 200
Regular grits 697 ± 41 173 236
Meal 287 ± 53 320 347
Flour 19 ± 2 527 359 * Starting from 300 mg per sample ** Means of duplicate measurements

4.2 Influence of particle sizes on the determination of GMO contents 62
It had to be proven that differences in the extraction yields from the various milling fractions
were not due to an accumulation/discrimination of kernel tissues during this particular
grinding and sieving process. A separation of embryo, endosperm and/or pericarp during the
production of milling fractions is plausible since these tissues show individual physical
properties. As cell density as well as the genomic distribution within these tissues may vary
significantly [112], such tissue separation would automatically lead to fractions of different
DNA contents. To verify the origin of the variation of DNA yields, the coarse grits fraction,
which had shown the lowest extraction efficiency, was ground and sieved once again to
obtain a product with particle sizes ≤ 100 µm. If the low DNA yield was to be ascribed to an
accumulation of tissue of low DNA content, then the isolation of DNA from re-ground coarse
grits should result in similarly low yields. However, DNA concentrations measured in the
isolates of re-ground material were as high as those found in the original flour fraction
(CTAB/Chloroform: 556 ng/µL, Wizard®: 380 ng/µL). Thus, it could be concluded that higher
DNA concentrations in the isolates from cornmeal and flour emerge as smaller particles offer
a larger exposure surface to extraction reagents allowing an enhanced extraction
performance.
The results yielded by this model experiment automatically led to the assumption that the
relative GMO quantification could be significantly distorted if the analyzed foods contained
fractions with different particle size distributions. Especially if the presence of GMO was
limited to one of two fractions, the proportions of DNA extracted from both fractions would
not reflect the actual proportions of GMO-derived material contained in the food sample.
4.2.4. Relative quantification of GMO in mixtures of different milling products
Mixtures of different milling fractions (coarse grits and flour) from either conventional or
transgenic corn were prepared to evaluate the influence of particle size compositions on the
results of relative quantification of recombinant DNA. As shown in Table 12, the proportion
of maize Bt-176 in the sample mixes was set to 1% (w/w) to assess the degree of the
potential effects at a level of practical interest for the surveillance of the GMO labeling in
foods and feeds.

4.2 Influence of particle sizes on the determination of GMO contents 63
Table 12 Composition of sample mixes with a Bt-maize content of 1%.
Bt -176 maize Conventional maize Sample
Coarse grits [mg]
Flour [mg]
Coarse grits
[mg] Flour [mg]
Mix 1 3 - 297 -
Mix 2 - 3 - 297 Mix 3 - 3 297 - Mix 4 3 -
- 297
To avoid sampling errors, especially due to homogeneity discrepancies, preparation of the
sample mixes was directly performed in the reaction vessels in which the subsequent
extraction of DNA was carried out. The concentrations of the DNA isolates were adjusted to
20 ng/µL to allow the use of equal amounts of template DNA in the amplification reactions.
The relative content of recombinant maize DNA in the extracts was determined using a
commercially available kit (GMOQuant Maximizer™ Bt-176 Corn, GeneScan Europe),
designed for the quantification of GMO via real-time PCR.
Figure 8 shows the amplification plots obtained after duplicate analysis of four independent
extracts from each mix. The amplification of the reference gene ( Figure 8a) exhibited nearly
constant Ct-values (~23 cycles) for all samples, due to the constant amounts of template
DNA used in each reaction. Amplification of the cryIA b)-gene ( Figure 8b and c) showed
though, how these C
(
t-values significantly varied depending on the composition of the each
sample. For instance, extracts from Mixes 1 and 4, containing transgenic maize in form of
grits, delivered higher Ct-values than Mixes 2 and 3, which contained transgenic maize in
form of flour. This correlates with the previously described effect of particle size distributions
on the effectiveness of DNA extraction, pointing to a higher DNA yield from the flour
fractions.

4.2 Influence of particle sizes on the determination of GMO contents 64
A
B
C
All mixes∅ Ct = 23,0
Mix 1∅ Ct = 29,2
Mix 3∅ Ct = 27,5
Mix 2∅ Ct = 28,6
Mix 4∅ Ct = 30,5
Figure 8 Amplification plots of the extracts from the Mixes 1 to 4 after solid phase DNA preparation (Wizard®). (A) HMG- reference gene; (B) and (C) CryIA(b)- gene. ∅ Ct = averaged threshold cycles
Mixes 1 and 4 also exhibited differences in Ct-values, although both contained homologous
transgenic fractions in form of coarse grits. According to the previously postulated link
between particle sizes and effectiveness of DNA extraction, both transgenic fractions must
have contributed equally to the DNA yield in the isolates. Thus, differences between Ct-
values determined for the transgenic target sequence are in this case explained by the

4.2 Influence of particle sizes on the determination of GMO contents 65
unequal DNA yields from the different conventional milling fractions used in these mixes; the
conventional flour fraction in Mix 4 delivers more DNA than the conventional coarse grits
fraction in Mix 1. Consequently, the overall DNA concentration in the isolate from Mix 4 was
higher than that of Mix 1. As DNA concentrations of all extracts were adjusted to 20 ng/µL
prior to analysis, the extract from Mix 4 had to be diluted stronger than that from Mix 1. This
resulted automatically in a stronger dilution of the recombinant DNA causing a shift into
higher Ct-values. Analogous reasoning can be used to explain differences between Ct-values
of Mixes 2 and 3, both containing transgenic maize in form of flour.
Phenomena observed during DNA amplification were clearly reflected in the results of
relative quantification of the transgenic target sequence, leading to distortions of the
estimated GMO contents in all mixes containing heterologous milling fractions. As illustrated
in Figure 9, an accurate quantification of the actual GMO proportions was only possible in the
isolates from Mixes 1 and 2 containing fractions with analogous particle size distributions.
Here, the estimation of GMO contents remained largely unaffected by the methodology of
DNA extraction.
In contrast, quantification of mixes containing coarse grits and flour (Mixes 3 and 4) resulted
either in a significant overestimation or in a underestimation of the actual GMO contents.
Distortions of quantification results were lower but still substantial if DNA was extracted
using the Wizard® extraction protocol rather than the CTAB/Chloroform method. This may be
ascribed to the diminished variation of the extraction efficiency, previously observed when
isolating DNA from flour and coarse grits, when using the Wizard® method ( Table 11).

4.2 Influence of particle sizes on the determination of GMO contents 66
0,9 1,0
2,6
0,30,0
1,0
2,0
3,0
4,0
5,0
6,0
Mix 1 Mix 2 Mix 3 Mix 4
Rec
over
y of
GM
O c
onte
nts
[%] B
0,2
4,3
1,40,8
0,0
1,0
2,0
3,0
4,0
5,0
6,0
Mix 1 Mix 2 Mix 3 Mix 4
R
AD
eter
min
ed G
MO
con
ten
t [%
] ec
over
y of
GM
O c
onte
nts
[%]
Det
erm
ined
GM
O c
onte
nt
[%]
actual GMO content
actual GMO content
Figure 9 Quantification results of the flour/grits mixtures after DNA extraction with (A) CTAB-method and (B) Wizard-method. (Means ± CI(P<0,05))
4.2.5. Summary
The influence of the particle size compositions of food products on the determination of GMO
contents via real-time PCR was assessed exemplarily by analysis of different milling fractions
from conventional and transgenic corn. Milling products analogous to those applied for
industrial purposes (coarse grits, regular grits, meal and flour) were prepared at laboratory
scale and characterized using a laser diffraction system. The application of two DNA isolation

4.2 Influence of particle sizes on the determination of GMO contents 67
protocols, which are widely used for GMO analysis in foods, revealed a strong correlation
between the degree of comminution of the milling fractions and the yield of DNA in the
isolates. Fine flours delivered higher DNA concentrations in the extracts than coarse grits due
to a larger exposure surface towards the extraction reagents.
Quantitative analyses were performed using a commercially available kit for the relative
quantification of DNA from maize Bt-176 via real-time PCR. The aim of these experiments
was to estimate the impact of the observed differences in DNA isolation efficiency on the
determination of GMO contents in foods consisting of mixtures from different milling
fractions. Samples were prepared by combining coarse grits and flours from conventional
and transgenic maize in different regimes. The obtained mixes contained a consistent
proportion of GMO-derived material of 1%. Results revealed that the accurate quantification
of the adjusted GMO content was only possible in mixes containing conventional and
transgenic material in form of analogous milling fractions. Mixtures between fractions of
different particle size distributions delivered significantly over- or underestimated GMO
contents, depending on the compositions of the samples. Thus, it was shown how common
technological parameters, such as the use of ingredients with different particle size
distributions may strongly affect the accuracy of GMO quantification. Distortions in the
results of relative quantification occurred irrespective of the DNA extraction methodology,
showing that concentration proportions of DNA extracted from the different constituents of a
complex food do not necessarily represent a truthful reflection of the mass proportions of the
food ingredients.

4.3 Influence of DNA degradation on the relative quantification of GMO 68
4.3. Influence of DNA degradation on the relative quantification of GMO
4.3.1. Introduction
Food manufacturing generally involves a number of processing steps, some of which take
place under harsh physico-chemical conditions thus affecting the integrity of genomic DNA in
tissues and/or matrices of individual food ingredients. As shown in previous studies,
degradation of DNA is primarily linked to processes carried out at low pH-values and
increases dramatically if these are performed in combination with thermal stress [124, 130,
164, 170]. Additionally, extensive DNA fragmentation has been observed as result of
enzymatic hydrolysis [126-128] (e.g. in fermentation processes [134]), and to a certain
extent during grinding and milling processes owing to shear forces and further mechanical
stress [125].
Effects of DNA degradation on the results of PCR-based detection systems have been
investigated by following diverse manufacturing practices. It was shown that the length of
target sequences represents a crucial factor in enabling or restraining the detectability of
DNA sequences [130, 134-139]. Qualitative assays demonstrated that longer target
sequences (> 300 bp) become increasingly sensitive to degradation under stress conditions,
thus leading to false negative results when analyzing samples of processed foods or feeds.
Subsequent quantitative competitive PCR approaches confirmed these conclusions, revealing
significant decreases in the recoveries of target sequences in the course of processing [95,
128]. Data gained in quantitative approaches consequently emphasized the importance of
using plant-specific reference genes, which allow the normalization of quantification results
and build the basis for the determination of ingredient-related GMO contents [90].
Based on these observations, degradation of DNA was estimated to have adverse effects on
the performance of quantitative assays, affecting limits of detection (LOD) as well as limits of
quantification (LOQ) [68]. The improved stability of shorter DNA sequences towards stress
conditions resulted in a commonly acknowledged approach to aim at target sequences
≤ 200 bp in qualitative and quantitative assays. These assays were thus generally considered
as appropriate for the analysis of processed products, as it was assumed that recombinant
and reference target sequences of about the same size will be equally degraded in the
course of processing [165].
Currently used methods for the relative quantification of recombinant DNA are based on the
widely established real-time PCR technology. Development and validation are generally
accomplished by analyzing certified reference materials (IRMM, Belgium), which represent

4.3 Influence of DNA degradation on the relative quantification of GMO 69
mixtures of flours containing defined proportions of GMO-derived material. Following
accuracy testing, quantitative assays have been directly applied to the analysis of processed
foods. However, experiments demonstrating that food processing (i.e. DNA degradation)
does not influence the trueness of relative GMO quantification have not been performed [78,
91, 104, 106, 109]. On the other hand, recently published studies have been focused on the
analysis of processed samples with known GMO proportions, but have not determined the
GMO proportions of the unprocessed counterparts [81, 105, 152]. This has left the
uncertainty whether the found discrepancies in quantification results were induced as
consequence of DNA degradation or if these are to be seen as inherent bias of the
quantification system. For instance, results of an international ring trial regarding the
validation of a method for the quantification of transgenic maize (line Bt176) allowed an
accurate quantification of GMO contents in unprocessed reference materials, but showed a
significant underestimation of GMO contents in heat-sterilized samples [108, 150]. The fact
that the transgenic-specific target sequence (129 bp) was longer than that used for the
detection of the reference gene (79 bp) permitted the assumption that such distortions in
the results of relative quantification could result from an unequal sensitivity of target
sequences towards processing parameters.
The objective of the following studies was to elucidate the influence of nucleic acid
degradation on the relative quantification of recombinant DNA in isolates from processed
products, applying assays based on real-time PCR technology.
In a first approach, milling fractions produced from genetically modified maize (Bt-176) were
thermally treated and analyzed using a commercially available quantification kit (Method A,
[155]) and an additional quantification method according to Höhne et al. (Method B, [104]).
Experiments were designed to assess whether minor differences in the lengths of the
targeted sequences of recombinant and reference genes occurring in these methods (∆lA = -
25 and ∆lB = +16 bp, related to the respective amplicon length of the reference gene) may
cause different stability towards thermal stress and consequently distortions in the results of
relative quantification. Different milling fractions (coarse grits and flour) were analyzed to
obtain information on the extent to which the rates of DNA degradation were influenced by
the matrix of the sample.
In a second approach, a mixture of maize grits with a defined content of GMO-derived
material (10%) was used in a lab-scaled process for the production of ethanol, simulating
practices and conditions commonly used in industrial operations. Experiments were designed
to follow the recovery of the actual GMO content along the stages of mashing, enzymatic
liquefaction and saccharification, mash fermentation and distillation. Sample analysis was

4.3 Influence of DNA degradation on the relative quantification of GMO 70
performed using the previously cited Method B (∆lB = +16 bp) and an additional assay
referred as Method C, which has been validated in an international ring trial (∆lC = -50 bp)
[150]. Data gained from the performance assessment of the applied methods for the relative
quantification of recombinant DNA in processed samples should be finally evaluated and
used to allow the improvement of the given assays, as well as the setting of criteria for
future method development.
4.3.2. Thermally induced degradation of DNA in maize milling products with
different particle size distributions
4.3.2.1. Recovery of target sequences at different degrees of DNA deg adation r
A degradation of DNA in coarse grits and in flour from maize Bt-176 was induced by heat-
treatment for 60 and 120 min at 100°C. The extractions of DNA from the treated products
and from the respective untreated control samples were performed simultaneously to
guarantee equal isolation and preparation conditions. As shown in Figure 10, electrophoretic
analysis of the DNA isolates pointed in both cases to a gradual breakdown of DNA in the
course of the heating process. The degradation of DNA in the coarse grits matrix seemed to
have reached a higher extent than that observed in the flour matrix.
100 bp Coarse corn gritsladder 0 min 60 min 120 min
100 bp Corn flour ladder 0 min 60 min 120 min
Figure 10 Degradation of DNA in coarse grits and flour samples induced through thermal treatment for 60 and 120 min at 100°C.

4.3 Influence of DNA degradation on the relative quantification of GMO 71
The influence of DNA degradation on the relative quantification of recombinant target
sequences was evaluated using a commercially available kit (Method A, [155]). The kit
consists of two separate quantitative detection systems, one for the transgenic construct and
the other for the maize-specific HMGa- gene, which is used as reference for normalization. In
both cases, detection relies on the use of FAM-labeled TaqMan probes. Standard curves, one
covering a range of high copy numbers for the reference gene (81920 - 160 copies) and the
other covering a range of low copy numbers for the transgene (5120 - 10 copies), were
generated using the enclosed external quantification standards. As the analyzed samples
consisted of 100% GMO-derived material, DNA concentrations of the isolates were adjusted
to 20 ng/µL for the analysis of the reference gene and were further diluted 1:100 for the
analysis of the transgene. This was necessary to allow the analysis of the samples using
standard curves covering different ranges of copy numbers. Adjustment of DNA
concentrations in the isolates permitted also the use of constant amounts of template DNA in
each amplification reaction, thus allowing a direct comparison of the Ct-values of the target
sequences at the different stages of treatment. For each heating stage three independent
DNA extracts were analyzed to allow the acquisition of representative results. Each reaction
was run in duplicate.
Figure 11 and Figure 12 illustrate the amplification plots of the target sequences prior and
after heat-treatment. The application of 100 ng template DNA in each amplification reaction
resulted in practically constant Ct-values for each target sequence within the respective
stages of treatment. Nevertheless, the comparison of the amplification plots from both target
sequences indicated a significant shift of the curves towards higher Ct-values after thermal
treatment. This effect was explained by the breakdown of DNA during heat-treatment, which
continuously reduced the proportion of amplifiable target sequences.

4.3 Influence of DNA degradation on the relative quantification of GMO 72
untreated grits∅ Ct = 22,42
treated grits ∅ Ct = 23,43
treated flour ∅ Ct = 23,08
untreated flour∅ Ct = 22,01
B
A
Figure 11 Amplification plots of a 79 bp fragment of the HMGa- gene in DNA from untreated and heat-treated milling products from maize Bt-176. (A) coarse grits and (B) flour. Method A [155]

4.3 Influence of DNA degradation on the relative quantification of GMO 73
untreated flour∅ Ct = 27,17 treated flour
∅ Ct = 29,01
treated grits ∅ Ct = 30,38
untreated grits∅ Ct = 27,35
B
A
Figure 12 Amplification plots of a 104 bp fragment of the cryIA(b)- gene in DNA from untreated and for heat-treated milling products from maize Bt-176. (A) coarse grits and (B) flour. Method A, [155]
Degradation rates of target sequences, expressed as the difference between mean Ct-values
(∆Ct) within 120 minutes of thermal treatment, evidenced a stronger fragmentation of the
target fragment used for the detection of the cryIA(b)- gene. This was observed regardless
of whether DNA was extracted from coarse grits or flour. For instance, the analysis of coarse
grits delivered a ∆Ct = 3.0 for the 104 bp long target sequence of the transgene, which was
significantly higher than the ∆Ct = 1.0 determined for the 79 bp long target sequence of the

4.3 Influence of DNA degradation on the relative quantification of GMO 74
reference gene. Degradation rates of the target sequences in the flour matrix were not as
pronounced as in the coarse grits matrix (∆Ct cryIA(b) = 1.8; ∆Ct HMGa = 1.0). This
confirmed the observations made in the electrophoretic analysis of the sample extracts,
which pointed to a reduced fragmentation of DNA in the flour fraction.
4.3.2.2. Effects o length differences between recombinant and reference
target sequences on relative quantification results
f
The increased sensitivity of the transgenic target towards stress conditions was ascribed to
the length difference between the amplified fragments, since the detection of the synthetic
cryIA(b)- gene was performed targeting at a longer DNA fragment than that used for the
detection of the maize-specific HMGa- gene (∆lA = -25 bp). As illustrated in Figure 13,
disproportional degradation rates between transgenic and reference target sequences led to
a continuously increasing distortion of relative quantification results, showing a significant
underestimation of GMO contents in the heat-treated samples. Distortions were more
pronounced in the samples of heat-treated coarse grits. This reflected the stronger
degradation of DNA in the coarse grits fraction that was observed in the electrophoretic
analysis, as well as in the respective amplification plots.

4.3 Influence of DNA degradation on the relative quantification of GMO 75
0
25
50
75
100
0 60 120Heat treatment [min]
Rec
over
y of
GM
O c
onte
nts
[%]
A
0
25
50
75
100
0 60 120Heat treatment [min]
Rec
over
y of
GM
O c
onte
nts
[%]
B
Figure 13 Effect of thermally induced DNA degradation on the recovery of GMO contents in (A) coarse grits and (B) flour samples. Quantification method: commercial kit [155]. Amplicon lengths: cryIA(b)- gene 104 bp; HMGa- gene 79 bp (∆lA = -25 bp)
In order to verify the postulated distortion of relative quantification results, as consequence
of disparities in the degradation rates of recombinant and reference target sequences, a
second real-time PCR assay was used to compare the recovery of GMO contents in the
previously analyzed samples. According to Höhne et al. (Method B, [104]), the assay was
designed for the detection of a 68 bp fragment of the 35S-CaMV promoter and an 84 bp
fragment of the maize-specific zein (Ze1-) gene. This represents a contrast to the previously
applied commercial kit, as in this case the targeted sequence for the reference gene is longer
than that for the transgene, showing a length difference ∆lB = +16 bp. Reactions are carried
out in a multiplex format using FAM-labelled and VIC-labelled TaqMan probes.

4.3 Influence of DNA degradation on the relative quantification of GMO 76
Standard curves were generated on the basis of triplicate analysis of self-prepared
quantification standards, consisting of a dilution series of DNA extracted from maize Bt-176.
As illustrated in Figure 14, the use of DNA standards covering a concentration range
between 50 and 0.05 ng/µL delivered curves of very good linearity and amplification
efficiency.
y = -3,3904x + 32,986R2 = 0,9955
0
10
20
30
40
-1,00 0,00 1,00 2,00 3,00
log DNA quantity
Ct v
alue
Std curve Zein
y = -3,3934x + 32,912R2 = 0,9979
0
10
20
30
40
-1,00 0,00 1,00 2,00 3,00
log DNA quantity
Ct v
alue
Std curve 35S CaMV
B
A
Figure 14 Standard curves used for the quantification of (A) the zein (Ze1-) gene and (B) the 35S CaMV promoter. Quantification method: Höhne et al. [104]
In this method, the use of a longer sequence for the detection of the reference gene
(∆lB = +16 bp) resulted in an increased sensitivity of this target towards stress conditions.
Thus, the application of this method for the analysis of the DNA isolates from heat-treated
samples resulted in an increasing overestimation of GMO contents, as illustrated in Figure
15. The degree of distortion of the relative quantification results was lower than that

4.3 Influence of DNA degradation on the relative quantification of GMO 77
observed in the previous method, due to the smaller absolute length difference between the
targeted sequences for the recombinant DNA and the transgene.
0
25
50
75
100
125
150
175
0 60 120
Rec
over
y of
GM
O c
onte
nts
[%]
Heat treatment [min]
A
0
25
50
75
100
125
150
175
0 60 120
Rec
over
y of
GM
O c
onte
nts
[%]
Heat treatment [min]
Rec
over
y of
GM
O c
onte
nts
[%] B
Figure 15 Effect of thermally induced DNA degradation on the recovery of GMO contents in (A) coarse grits and (B) flour samples. Quantification method: Höhne et al. [104]. Amplicon lengths: 35S CaMV promoter 68 bp; zein (Ze1-) gene 84 bp (∆l = +16 bp)
Again, distortions were more pronounced in the samples of heat-treated coarse grits. This
was in accordance with the stronger degradation of DNA in the coarse grits fraction, which
had been observed in previous analyses. These results showed how commonly used
technological processes, such as a thermal treatment, may lead to disproportional
degradation rates of recombinant and reference target sequences when aiming at fragments
of different lengths. This effect resulted in either an underestimation or an overestimation of
the actual GMO-contents in the processed samples.

4.3 Influence of DNA degradation on the relative quantification of GMO 78
4.3.3. Degradation of DNA within the process of ethanol production from maize
A further study on the consequences of nucleic acid degradation on the determination of
GMO contents via real-time PCR was performed analyzing samples from intermediate stages
of a lab-scaled process for the production from ethanol from maize. The interest in this
process arises since it comprises a series of stress conditions and technological operations,
which are of relevance for the industrial production of foods and feeds and may result in
severe fragmentation of DNA in raw materials (e.g. mechanical stress, enzymatic and
microbial fermentations and thermal treatments, partially taking place under acidic
conditions). Additionally, the main product of the distillery process (mash) is generally used
for feeding purposes, thus being a potential subject of surveillance testing in the context of
the current regulations regarding the use of GMO for the production of food and feed
products.
As illustrated in Figure 16, the process was started using a mixture of maize grits containing
10% of material derived from the transgenic line Bt-176. Samples were taken following the
stages of mashing, enzymatic liquefaction and saccharification, yeast fermentation, and from
the mash after distillation periods of 20 and 40 min.
α-Amylase 1 hr, 90°C, pH 6,0
Amyloglucosidase 30 min, 55°C, pH 5,5
Mashing
Liquefaction
Saccharification
Fermentation
Distillation
Mash Alcohol
Corn grits GMO content = 10%
20 min, 40 min pH 3,7
60 sec Ultraturrax 2 hr, 50°C
Yeast 68 hr, 32°C
mechanical stress
thermal treatment
acidification
enzymatic hydrolysis, acidification
thermal stress, acidic hydrolysis
Figure 16 Process of ethanol production from maize at laboratory-scale.

4.3 Influence of DNA degradation on the relative quantification of GMO 79
Electrophoretic analysis of sample isolates ( Figure 17) pointed to a continuously increasing
fragmentation of DNA molecules along the stages of processing. To a certain extent,
degradation was already visible after homogenization and mashing of the raw materials (line
3). This was mainly ascribed to the mechanical stress resulting from the use of an ultraturrax
to achieve a homogeneous mixture of the conventional and transgenic moieties. DNA of high
molecular weight remained though relatively stable until the step of liquefaction, where
thermal stress resulted in an extensive degradation (line 4). Acidification and enzymatic
hydrolysis during the process of fermentation (line 6) led to a further breakdown of DNA
molecules. The reappearance of high molecular weight DNA in the isolates of these samples
was caused by the co-extraction of distillers’ yeast DNA. However, the most extensive
degradation was observed during the distillation process. Thermal stress in combination with
the acidic conditions in the fermented mash led to a rapid fragmentation of DNA, yielding
fragments < 200 bp and < 100 bp after distillation periods of 20 and 40 min, respectively
(lines 7 and 8).
600 bp
100 bp
Figure 17 Degradation of DNA within the process of ethanol production from maize. Lines: 1 100 bp ladder; 2 raw material (corn grits); 3 mashing; 4 enzymatic liquefaction; 5 enzymatic saccharification; 6 fermentation; 7 distilled mash (20 min); 8 distilled mash (40 min).

4.3 Influence of DNA degradation on the relative quantification of GMO 80
4.3.3.1. Quantification of GMO proportions at dif erent stages of DNA
degradation
f
The content of GMO-derived material (10%) was followed via real-time PCR using (i)
Method B, which shows a length difference between the targeted sequences of
∆lB = +16 bp [104] and (ii) Method C, an internationally validated assay, showing a length
difference between the targeted sequences of ∆lC = -50 bp [150]. Length difference values
(∆l) are related to the length of the respective reference target.
DNA was isolated from three independently taken samples of each processing stage and
subjected to duplicate real-time PCR analysis. As illustrated in Figure 18, both methods
allowed an accurate quantification of the actual contents of GMO-derived material (10%) in
samples taken from the initial mashing of raw materials, where no substantial DNA
degradation was observed (see Figure 17). Accurate results were also achieved by analysis
of control samples, consisting of mixtures of raw materials with a GMO proportion of 10%,
which were prepared independently from the distillery process using an analytical balance.
Analysis of these control samples yielded recoveries of GMO contents of 11.1% ± 1.9 for
Method B and 9.7% ± 2.3 for Method C, demonstrating the performance of the assays.
However, the analysis of samples from further processing stages resulted in increasing
deviations of determined GMO contents. Method B showed significantly overestimated GMO
proportions in samples from fermented mash and from mash distilled for 20 min, pointing to
a favored degradation of the slightly longer reference target (∆lB = +16 bp). In contrast,
data yielded by the application of Method C resulted in a significant underestimation of GMO
proportions, emerging already at the stage of enzymatic liquefaction. This pointed to a much
higher sensitivity of the longer recombinant target sequence (∆lC = -50 bp) towards stress
conditions, which explained the early stage of distortion effects. GMO contents could not be
determined after distillation periods of 40 min (Method B) and 20 min (Method C), where Ct-
values of the targeted sequences laid beyond the range covered by the standard curves.

4.3 Influence of DNA degradation on the relative quantification of GMO 81
0
5
10
15
20
Mashing
Liquefac
tion
Sacch
arificati
on
Fermen
tation
Distille
d mas
h 20 m
in
Distille
d mas
h 40 m
in
Rec
over
y of
GM
O c
onte
nts
[%]
Method C
10. 1
5.96.0
1.4n.d. n.d
0
10
20
30
40
50
60
Mashing
Liquefac
tion
Sacch
arificati
on
Fermen
tation
Distille
d mas
h 20 m
in
Distille
d mas
h 40 m
in
Rec
over
y of
GM
O c
onte
nts
[%]
Method B
11. 1 12.513.4
22.6
43.5
n.d
actual GMO content
actual GMO content
Figure 18 Relative quantification of DNA from maize Bt-176 in samples from intermediate stages within the process of ethanol production. Unequal stabilities of the targeted fragments from recombinant and reference genes towards processing conditions resulted in significantly distorted recoveries of the actual proportion of GMO-derived material (10%). The favored degradation of the longer target sequence for the reference gene in Method B (∆lB = +16 bp, [104]) resulted in significantly overestimated GMO contents. The detection of a much longer target fragment for the transgene in Method C (∆lC = -50 bp, [150]) yielded strongly underestimated GMO contents already at early stages of processing. n.d. = not determinable, owing to Ct-values beyond the range of quantification
These results demonstrated that real-time PCR assays showing even slight differences in the
lengths of transgenic and reference target fragments are not suitable for the relative
quantification of recombinant DNA in isolates from processed samples.
This study explains the irregularities observed in the results of the international ring trial
regarding the validation of Method C [108, 150]. Here, the relative quantification of material

4.3 Influence of DNA degradation on the relative quantification of GMO 82
derived from maize Bt-176 in certified reference standards delivered accurate values, in
accordance to the precision of the real-time PCR technology. Analysis of heat-sterilized
samples yielded however strongly underestimated GMO proportions, achieving recoveries of
merely 40% of the actual values.
Consequently, future development of quantitative methods to be applied for the analysis of
products within the food chain must ensure that targeted DNA sequences, i.e. fragments
from recombinant and reference genes, will be simultaneously degraded in the course of
food manufacturing and processing. Validation of methods to be applied for these purposes
cannot be restricted to the assessment of trueness and precision in (unprocessed) certified
reference materials, since such performance parameters may not be unconditionally
transferable to results obtained from the analysis of processed samples. Validation
procedures must include experiments demonstrating that DNA degradation will not result in
an alteration of relative quantification results.
4.3.3.2. Redesign of a quantitative real-time PCR method for the determination
of GMO contents in highly processed samples
The implementation of conclusions made on the basis of previous results required real-time
PCR assays to be revised and modified with the purpose to enable an accurate determination
of GMO contents in samples of processed products. As proven in the latter studies, accurate
determination of GMO proportions in such samples was hampered when assays targeted at
recombinant and reference sequences of unequal lengths. For instance, unequal degradation
rates of DNA fragments targeted by Method C (∆lC = -50 bp) resulted in significantly
underestimated quantification results even at early stages of processing. Therefore, a
redesign of this method was carried out with the aim to amplify fragments showing the
lowest length difference possible.
As illustrated in Figure 19, primer binding sites CRY-F and CRY-R, used originally for the
detection of the transgene (129 bp), were abandoned and substituted by new binding sites,
lying closer to the hybridization site of the TaqMan probe. The use of the new primers (CRY-
F’ and CRY-R’) thus allowed the amplification of an internal fragment of the original target
sequence using the same TaqMan probe. This resulted in a much shorter amplicon (81 bp,
Method C’), consequently reducing the length difference between recombinant and reference
target sequences to ∆lC’ = -2 bp.

4.3 Influence of DNA degradation on the relative quantification of GMO 83
Modifications were visualized and verified by electrophoretic analysis of the PCR products,
using high resolution agarose gels. The length difference between the new amplicon of the
transgene (line 4, 81 bp) and that of the reference gene (line 2, 79 bp) was just slightly
distinguishable. No unspecific signals were yielded by the use of the new primers.
Method C (∆l = -50 bp) CRY probe CRY-F
CRY-R
1 2 3 4
129 bp
HMG-F HMG probe
HMG-R 79 bp
200 bp
Method C´ (∆l = -2 bp) 100 bpCRY-F´ CRY probe
CRY-R´ 81 bp
HMG-F HMG probe
HMG-R 79 bp
Figure 19 Modification of a real-time PCR assay to allow the relative quantification of recombinant DNA in samples of highly processed products. Left: The length difference between the amplicons from the cryIA(b)- and the HMGa- gene (Method C [150], ∆lC = -50 bp) was reduced by the design of new primers for the detection of the transgene. The new primers anneal respectively closer to the TaqMan probe, allowing the amplification of an internal fragment from the original target sequence (Method C’, ∆lC’ = -2 bp). Right: Electrophoretic analysis of the PCR products. Lane 1: 100 bp sizing ladder, Lane 2: HMGa- gene (79 bp), Lane 3: original amplicon of the cryIA(b)- gene (Method C, 129 bp), Lane 4: modified amplicon of the cryIA(b)- gene (Method C’, 81 bp).
This modified Method C’ was applied to the analysis of the DNA isolates from samples
collected at different stages of the process of ethanol production. As shown in Figure 20, the
minimized length difference between the target sequences for recombinant and reference
genes avoided successfully the appearance of distortion effects in the results of relative
quantification. Thus, a nearly constant recovery of the actual proportion of GMO-derived
material (10%) was assured even at high processing levels. The increased deviation of the
determined GMO content after a distillation period of 20 min must be ascribed to the
vanishing amounts of amplifyable DNA. GMO contents could not be determined after a

4.3 Influence of DNA degradation on the relative quantification of GMO 84
distillation period of 40 min, where Ct-values of the targeted sequences laid beyond the
range covered by the standard curves.
0
5
10
15
20
Mashing
Liquefac
tion
Sacch
arificati
on
Fermen
tation
Distille
d mas
h 20 m
in
Distille
d mas
h 40 m
in
Method C'
11. 210.1
11.5 10.7
n.d.
8.9
Rec
over
y of
GM
O c
onte
nts
[%]
Det
erm
ined
GM
O c
onte
nt
[%]
actual GMO content
Figure 20 Relative quantification of DNA from maize Bt-176 in samples from intermediate stages within the process of ethanol production. A nearly constant recovery of the actual proportion of GMO-derived material (10%) was assured even at high processing levels, by minimizing the length difference between the targeted fragments from recombinant and reference genes (Method C’, ∆lC’ = -2 bp). n.d. = not determinable, owing Ct-values beyond the range of quantification
4.3.4. Summary
The widely established real-time PCR technology was used to assess the effects of nucleic
acid degradation on the results of the relative quantification of recombinant DNA in samples
of processed products. Previous studies regarding the effects of technological processes on
the detectability of DNA via PCR had demonstrated that the lengths of the targeted
fragments represent a crucial factor in enabling or restraining DNA detection, i.e. longer
sequences being more susceptible to degradation if exposed to adverse conditions.
Experiments were thus conceived to elucidate whether minor differences in the lengths of
target sequences for recombinant and reference genes may cause stability disparities
towards processing conditions, leading consequently to a disproportional degradation of the
targeted fragments in the course of processing and to distortions in the results of relative
quantification.

4.3 Influence of DNA degradation on the relative quantification of GMO 85
In a first approach, coarse grits and flour from genetically modified maize (Bt-176) were
subjected to thermal treatment to induce an extensive degradation of DNA. This process was
followed applying two quantitative assays, showing differences between the lengths of the
recombinant and reference target sequences of ∆lA = -25 bp and ∆lB = +16 bp (values
related to the amplicon length of the reference gene). In both cases, the determined Ct-
values indicated a more extensive degradation of the longer target sequences within the
heating process. Disproportional degradation rates of reference and transgenic targets led in
both methods to significant distortions in the results of relative quantification. Data obtained
by the application of Method A reflected the favored degradation of the longer target
sequence used for the detection of the transgene. This resulted in underestimated recoveries
of GMO contents in the samples of heat-treated products. In contrast, data yielded by the
application of Method B resulted in increasingly overestimated recoveries of GMO contents,
reflecting the favored degradation of the longer target sequence used in this case for the
detection of the reference gene. These effects applied to the analysis of both milling
products; they were more pronounced in samples from heat-treated coarse grits than in
samples from heat-treated flour.
In a second approach, a mixture of maize grits with a defined proportion of GMO-derived
material (10%) was used in a lab-scaled process for the production of ethanol. This process
was chosen as example to assess the impact of individual stress conditions and technological
operations (e.g. mechanical stress, enzymatic and microbial fermentations and thermal
treatments, partially taking place under acidic conditions) on the degradation of DNA in raw
materials and consequently on the recovery of the actual GMO content along the process.
Control samples from mixtures of raw materials and further samples from the stages of
mashing, enzymatic liquefaction and saccharification, mash fermentation and mash
distillation were analyzed on the basis of the previously cited Method B (∆lB = +16 bp) and
using an additional assay, which was validated within the context of an international ring trial
(Method C, ∆lC = -50 bp). These analyses proved the postulated distortion of relative
quantification results, when applying unfavorably designed assays for the determination of
GMO contents in processed products. The increased sensibility of the longer target sequence
towards stress conditions resulted either in significantly overestimated (∆l > 0) or
underestimated (∆l < 0) GMO proportions. Thus, an accurate determination of the actual
GMO contents was only achievable in control samples and in samples from the first stages of
processing.
According to these findings, Method C was redesigned. The primer binding sites used for the
detection of the transgene were abandoned and substituted by new binding sites, allowing

4.3 Influence of DNA degradation on the relative quantification of GMO 86
the amplification of an internal fragment of the initial amplicon under application of the same
TaqMan probe. The appearance of distortion effects in the results of relative quantification
was successfully avoided by the minimized length difference between the target sequences
for recombinant and reference genes in the modified Method C’ (∆lC’ = -2 bp). Thus, a
nearly constant recovery of the actual proportion of GMO-derived material (10%) was
achieved even at high levels of processing.
Data gained from the performance assessment of these assays delivered important criteria
for future method development and for the design of validation studies. The development of
quantitative assays to be applied to the surveillance testing of products within the food chain
must ensure that the targeted sequences, i.e. fragments from recombinant and reference
genes, will be simultaneously degraded in the course of manufacturing and processing.
Validation of methods to be applied for these purposes cannot be restricted to the
assessment of trueness and precision in (unprocessed) certified reference materials, since
such performance parameters may not be unconditionally transferable to results obtained
from the analysis of processed samples. Validation procedures must therefore include
experiments demonstrating that the degradation of DNA will not result in an alteration of
relative quantification results.

4.4 Simultaneous detection and relative quantification of GMO by ligation-dependent probe amplification 87
4.4. Simultaneous detection and relative quantification of GMO by ligation-
dependent probe amplification
4.4.1. Introduction
The consequences of the enforcement and implementation of surveillance requirements in
the context of the recently adopted regulations on the use of GMO within the food and feed
chain [3, 4] will definitely represent a major challenge for research and reference
laboratories. The designated institutions will play a key role in supporting the control of
compliance with the expanded labeling demands, which apply to products consisting of, or
containing material derived from authorized GMO lines. Beyond this, research activities will
additionally have to deal with the development and establishment of assays suitable for the
screening, identification and quantification of (a) upcoming authorized GMO lines, (b) GMO
lines pending authorization, which have been positively assessed on their safety by the
European Food Safety Authority and (c) non-authorized GMO. Research will be certainly
based on the use of real-time PCR technology, as this represents the currently standard
platform for GMO analysis [10, 70, 165]. The steadily growing number of analytical targets
may result in a complex bulk of cost-intensive assays, considering that this technology has
shown satisfactory performance when run in either mono- or duplex formats [104, 150, 171,
172], whereas multiplex applications have been strongly limited by interactions between
primers and probes and further by the restricted number of reporter dyes.
Current alternative approaches attempt to solve this problem by using DNA arrays or
biosensors, either for the detection of products resulting from multiplex PCR (i.e. using
several pairs of primers) [174-180], or for the detection of previously amplified hybridization
probes in modular systems [181-183]. However, aside from the discussion whether these
high-throughput technologies represent a cost-effective tool for the detection of such a
rather limited number of transgenic organisms, some further points must be taken into
account. Firstly, the use of several pairs of primers in multiplex PCR systems permits only
limited setup alterations, i.e. incorporation of additional primers for the detection of further
target sequences. Secondly, non-competitive amplification of DNA targets via PCR prior to
on-chip detection does not allow subsequent quantitative assessment. And finally,
competitive amplification systems must permit the normalization of signals delivered by
recombinant targets with signals obtained from corresponding reference genes in order to
cope with regulatory demands and to eliminate quantification errors, e.g. owing to DNA
degradation in the course of food processing.

4.4 Simultaneous detection and relative quantification of GMO by ligation-dependent probe amplification 88
For these reasons, it seems questionable whether the application of such complex
technologies indeed represents a practicable alternative, especially if just used for the
visualization of a rather limited spectrum of PCR products.
The following approach describes the application of a novel, ligation-dependent probe
amplification (LPA) technique for the simultaneous event-specific detection and relative
quantification of DNA from several GMO in a single reaction. Ligation-dependent PCR was
originally introduced to allow the detection of nucleic acid sequences [184-186], but required
further development until its first applications for purposes of medical diagnostics, where it
permitted the detection and the relative quantification of up to 40 – 50 target sequences in a
single assay [187-191]. As illustrated in Figure 21, the technique does not amplify the target
sequences itself, but is rather based on the amplification of products resulting from the
ligation of hybridization probes. Successfully ligated probes are subsequently amplified in a
competitive reaction using one common pair of primers. One primer carries a fluorescein
(FAM) label allowing the detection of amplification products, e.g. via capillary
electrophoresis. The use of this analytical strategy results in a flexible system that can be
complemented with further hybridization probes to broaden the range of target sequences to
be detected. Automated detection and visualization of amplified products via capillary
electrophoresis simplifies and reduces the extent of post-PCR work-up significantly.

4.4 Simultaneous detection and relative quantification of GMO by ligation-dependent probe amplification 89
P5´ 3´
3´ 5´Target A
PBS´ PBSOH
Target B
5´3´
3´ 5´
PBS´PB
SOH P
Target C
5´
3´
PBS´
PBSOH P
thermostable DNA ligase
5´ 3´PBS´ PBS
5´3´
PBS´PB
S
5´
3´
PBS´
PBS
Ligation product A
Ligation product B
Ligation product C
A
P5´ 3´
3´ 5´Target A
PBS´ PBSOH
Target B
5´3´
3´ 5´
PBS´PB
SOH P
Target C
5´
3´
PBS´
PBSOH P
thermostable DNA ligase
5´ 3´PBS´ PBS
5´3´
PBS´PB
S
5´
3´
PBS´
PBS
Ligation product A
Ligation product B
Ligation product C
A
5´ 3´5´
PBS´ PBS
5´3´
5´
3´
PBS´PB
S
5´
3´5´
3´
PBS´
PBS
3´ Amplicon A
3´5´5´
3´
3´ 5´
5´
3´
3´
5´
5´
3´
DNA polymerase
*
*
* Amplicon B
Amplicon C
B5´ 3´
5´PBS´ PB
S5´ 3´
5´PBS´ PB
S
5´3´
5´
3´
PBS´PB
S
5´3´
5´
3´
PBS´PB
S
5´
3´5´
3´
PBS´
PBS
5´
3´5´
3´
PBS´
PBS
3´ Amplicon A
3´5´5´
3´
3´ 5´
5´
3´
3´
5´
5´
3´
DNA polymerase
*
*
* Amplicon B
Amplicon C
B
3´ Amplicon A
3´5´5´
3´
3´ 5´
5´
3´
3´
5´
5´
3´
DNA polymerase
*
*
* Amplicon B
Amplicon C
B
capillaryelectrophoresis
rela
tive
fluor
esce
nce
time
Product AProduct B
Product C
C
Amplicons A
**
*
Amplicons B
**
*
Amplicons C
**
*
capillaryelectrophoresis
rela
tive
fluor
esce
nce
time
Product AProduct B
Product C
C
Amplicons A
**
*
Amplicons A
**
*****
**
Amplicons B
**
*
Amplicons B
**
*****
**
Amplicons C
**
*
Amplicons C
**
*****
**
Figure 21 Ligation-dependent amplification reaction. (A) Synthetic probes hybridize on the corresponding target sequences and become ligated by the action of a thermostable ligase. The generated ligation products possess a characteristic length for each target DNA due to the introduction of spacer sequences between primer binding sites (PBS) and hybridization sites (dotted lines). Identical PBS at the 5’- and 3’ ends of the ligation products allow their subsequent competitive amplification using one pair of universal primers. (B) PCR starts with the annealing of the unlabelled primer to the 3´- end of the ligation products and the synthesis of complementary strands. PBS for the labeled primer are thus synthesized only if a successful ligation of the probes has taken place. Competitive PCR preserves the ratios between the amounts of originally available ligation products throughout the amplification process. (C) Labeled amplification products are separated and detected via capillary electrophoresis.

4.4 Simultaneous detection and relative quantification of GMO by ligation-dependent probe amplification 90
This LPA-system was modified by exclusively using synthetic oligonucleotides as hybridization
probes. This avoids complex cloning and preparation steps required for the isolation of
probes derived of single stranded viral DNA. Four pairs of synthetic oligonucleotides were
designed to allow the detection of reference genes in the genomes from maize and soya
(HMGa- and Le1-genes respectively), as well as event-specific regions of the transgenic
maize line MON810 and Roundup Ready soya. Hybridization sites of similar lengths
(52 ± 3 nt) were chosen for the detection of GMO-specific and reference target sequences.
This should guarantee the applicability of this system to the relative quantification of DNA in
processed products, avoiding discrepancies in the stability of GMO-specific and reference
target sequences towards stress conditions. The composition of the reaction mixtures (i.e.
the concentration of hybridization probes) was optimized to allow the simultaneous detection
of reference and transgenic target sequences at ratios of 0.1%. Performance parameters like
specificity, sensitivity, but also the quantitative properties of this method were assayed using
mixtures of DNA extracted from certified reference maize and soybean flours.
4.4.2. Design of an LPA-system for the detection of reference genes and event-
specific regions in the genomes of maize MON810 and Roundup Ready soya
As illustrated in Figure 21, the development of the LPA system required the design of two
hybridization probes for the detection of each target sequence. Probes consisted of synthetic
oligonucleotides, containing the respective target-specific hybridization sites as well as
identical primer binding sites (PBS) at their 5’- or 3’- ends. Right probes must be
phosphorylated at their 5’- ends to allow subsequent ligation by the action of a thermostable
enzyme. According to the specifications of the applied ligase, this catalyzes exclusively the
linkage of adjacent 3’-hydroxylated and 5’-phosphorylated termini in duplex DNA structures
that are stable at high temperatures. The use of spacer sequences (dotted lines) between
PBS and hybridization sites rendered ligation products with a characteristic length for each
target DNA. The use of a thermostable enzyme allowed the performance of repeated
denaturation, hybridization and ligation cycles to increase the yield of ligation products in a
linear process.
Target regions showing similar thermodynamic properties were chosen for the design of the
probes. Length and base composition of each hybridization site were adjusted to achieve
theoretical melting temperatures near 61°C. This allowed the performance of ligations at
high temperatures, thus increasing the specificity of the reaction. Further, it was
indispensable to consider that the total length of the hybridization region covered by each

4.4 Simultaneous detection and relative quantification of GMO by ligation-dependent probe amplification 91
pair of probes must remain nearly constant to guarantee the accurate relative quantification
of processed products showing highly degraded DNA. Previous studies revealed that longer
DNA fragments show an increased sensitivity towards processing stress. This effect leads
even in the case of slight length differences between GMO-specific and reference targets to
significant distortions of relative quantification results [192].
In the second step of the reaction, ligation products were amplified using one pair of
universal primers. Amplification was thus competitive, i.e. conserving the actual ratios
between the amounts of ligation products throughout the PCR reaction. Amplification was
initialized by the annealing of the unlabeled primers to the 3’- PBS of the ligation products
leading to the synthesis of complementary strands. In the case of successful ligation,
synthesis of complementary strands resulted in the formation of PBS for the FAM-labeled
primers. Following competitive PCR, FAM-labeled amplification products were separated and
detected via capillary electrophoresis, as illustrated schematically in Figure 21. The length of
the amplification products was determined on the basis of internal TAMRA-labeled length
standards. Relative quantification of recombinant DNA required data to be exported to an
Excel file. Here, signal intensities of the recombinant targets were normalized with the
intensities determined for the respective reference genes.
Sequences of LPA probes and primers are listed in Table 13. The event-specific detection of
maize MON810 and Roundup Ready soya was performed by targeting junction regions
between the 35S promoter and the plant DNA in each GM line [78, 79]. In both cases one
probe was designed to hybridize to the insert DNA, while the other was laid directly over the
junction region. The targeted regions of the reference genes used in this study (HMGa- and
Le1-gene, for maize and soya respectively) were previously shown to be suitable for
quantification purposes [150].
Primer and spacer sequences were derived from the bacteriophage λ genome (GenBank
accession nr. J02459) in order to obtain sequences without affinity to the targeted regions.
Differences between the lengths of ligation products (~5 nt) were achieved by the
introduction of AT-rich spacer sequences.

4.4 Simultaneous detection and relative quantification of GMO by ligation-dependent probe amplification 92
Table 13 Probes and primers designed for the detection of reference genes and event-specific junction sites in the genomes of maize MON810 and Roundup Ready soya
Target / GenBank accession nr Left probe / right probe Ligation
products [nt]
Maize MON810 / AF434709
5´ – CAGGCGGCGCATTTTTATTGCtaattcttctatttctga CTAACGTTTAACATCCTTTGCCATTGC - 3´
P – 5´ – CCAGCTATCTGTCACTTTATTGTGAAGA CTACGGCAAATGTCATCGACG - 3´
115
Roundup Ready soya / AJ308514
5´ – CAGGCGGCGCATTTTTATTGC TCGCAATGATGGCATTTGTAGGAGC - 3´
P – 5´ – CACCTTCCTTTTCCATTTGGGTTCCCT taattcttctatttcCTACGGCAAATGTCATCGACG - 3´
109
Maize HMGa-gene / AJ131373
5´ – CAGGCGGCGCATTTTTATTGCtaattcttctattt CGTTTGTGTGGATTGTAGGACAAGG - 3´
P – 5´ – CTCCCTATGTAGCCAAGGCTAACA CTACGGCAAATGTCATCGACG - 3´
105
Soya Le1-gene / K00821
5´ – CAGGCGGCGCATTTTTATTGC TTCCTTCAACTTCACCTTCTATGCCC - 3´
P – 5´ – CTGACACAAAAAGGCTTGCAGATGG taattctCTACGGCAAATGTCATCGACG - 3´
100
Sanprime-F (unlabeled) 5´- CGTCGATGACATTTGCCGTAG - 3´
Sanprime-R (labeled) FAM – 5´-CAGGCGGCGCATTTTTATTGC - 3´
Bold capitals: primer binding sites (PBS) Italic fonts: transgenic insert DNA Capitals: plant DNA Lowercase fonts: spacer DNA
4.4.3. Assessment of target specificity and sensitivity
The performance of the LPA system was assayed using sets of certified reference standards
from maize MON810 and Roundup Ready soya, containing GMO-derived material in
proportions of 0, 0.1, 0.5, 1, 2, and 5%. DNA isolates from these standards were diluted to
50 ng/µL and mixed in different regimes, simulating extracts from products composed of
maize and soya with respectively different proportions of material derived from the GM-lines.
Specificity assessment of the developed LPA-system demonstrated that this technique was
suitable for the simultaneous detection of all target sequences in a single reaction,
depending on the composition of the template DNA used in each experiment. As illustrated in

4.4 Simultaneous detection and relative quantification of GMO by ligation-dependent probe amplification 93
Figure 22, analysis of mixtures containing DNA from conventional maize and soya control
standards (75 ng, respectively) delivered exclusively signals corresponding to the HMGa- and
Le1- genes. In contrast, reactions started using mixtures of isolates from standards
containing respectively 1% GMO-derived material yielded signals corresponding to the
reference genes, as well as signals corresponding to both event-specific target sequences.
No signals were detected either by omission of ligase or ligation probes (data not shown).
96 L
e1
HM
Ga
96 L
e1
HM
Ga
A
Sign
al in
ten
sity
Si
gnal
inte
nsi
ty
Figure 22 SpecificityLe1- genecontrol statarget seqsoya (1%
50 75 100 139 nt
102
50 75 100 139 nt
102
810
810B
50 75 100 139 nt
96 L
e1
102
HM
Ga
106
RRS 112
MO
N
50 75 100 139 nt
96 L
e1
102
HM
Ga
106
RRS 112
MO
N
Target length
assessment of the LPA system. (A) Detection of the reference HGMa- and s in a mixture containing 75 ng DNA from conventional maize and soya ndards. (B) Simultaneous detection of reference genes and GMO-specific uences in a mixture containing 75 ng DNA from maize (1% MON810) and Roundup Ready).

4.4 Simultaneous detection and relative quantification of GMO by ligation-dependent probe amplification 94
Sensitivity testing was carried out to confirm that the detection of smallest traces of a GMO-
specific target was not restrained by the presence of high levels of other target sequences.
As shown in Figure 23, mixtures containing respectively 75 ng DNA from maize and soya
standards (0.1% maize MON810 and 5% Roundup Ready soya, and vice versa) were tested
positive on the presence of both GMO target sequences.
50 75 100 139 nt
96 L
e110
2 H
MG
a10
6 RR
S11
2 M
ON
810
50 75 100 139 nt
96 L
e110
2 H
MG
a10
6 RR
S11
2 M
ON
810
50 75 100 139 nt
96 L
e1
102
HM
Ga
106
RRS
112
MO
N81
0
50 75 100 139 nt
A
Sign
al in
ten
sity
96 L
e1
102
HM
Ga
106
RRS
112
MO
N81
0
B
Target length
Sign
al in
ten
sity
Figure 23 Sensitivity assessment of the LPA system. Optimization of reaction conditions and probe concentrations allowed the simultaneous detection of small traces of GMO-specific targets despite of the presence of high levels of other target sequences. (A) 0.1% maize MON810 DNA was tested positive in the presence of 5% Roundup Ready soya DNA, (B) 0.1% Roundup Ready soya DNA was tested positive in the presence of 5% maize MON810 DNA. Reaction mixtures contained 75 ng DNA from maize and soya standards.

4.4 Simultaneous detection and relative quantification of GMO by ligation-dependent probe amplification 95
The performance of the system remained unaffected either by the presence of DNA from
different sources, or by the simultaneous use of multiple pairs of probes. In fact, the
obtained results were equivalent to the superposition of the results of each single assay; i.e.
using single pairs of probes, or pure DNA extracts from maize or soya standards.
Fragment length analysis properly reflected the adjusted length differences between the
amplified ligation products. Determined absolute length values for each product were highly
reproducible (SD ± 0.1 nt) but showed a systematical shift of nearly 4 nt towards shorter
fragment lengths. This well described effect results from differences in the mobility of length
standards and analyzed fragments caused by the use of different labeling dyes, by the base
composition or by the structure of the DNA itself [193, 194]. Nevertheless, the identity of the
amplified ligation products was separately assayed and confirmed by sequence analysis.
Minor signals at exactly 1 nt distance from the main peaks result from a partial, non-
templated addition of dNTPs by the polymerase during the amplification process [194, 195].
In future, several methodical approaches may be followed to reduce or eliminate this effect
[196].
4.4.4. Construction of calibration curves for quantitative analysis
The suitability of this system for the relative quantification of recombinant DNA was tested
analyzing mixtures of isolates from maize and soya standards (respectively 75 ng/reaction)
with GMO proportions of 0.1, 0.5, 1, 2 and 5%. Delivered electropherograms yielded signals
corresponding to the event-specific targets and to the reference genes, at all GMO
concentrations. As illustrated in Figure 24, calibration curves were created by determining
the ratios between peak heights from the recombinant target and the corresponding
reference gene, and plotting these against the actual GMO-content of each sample.
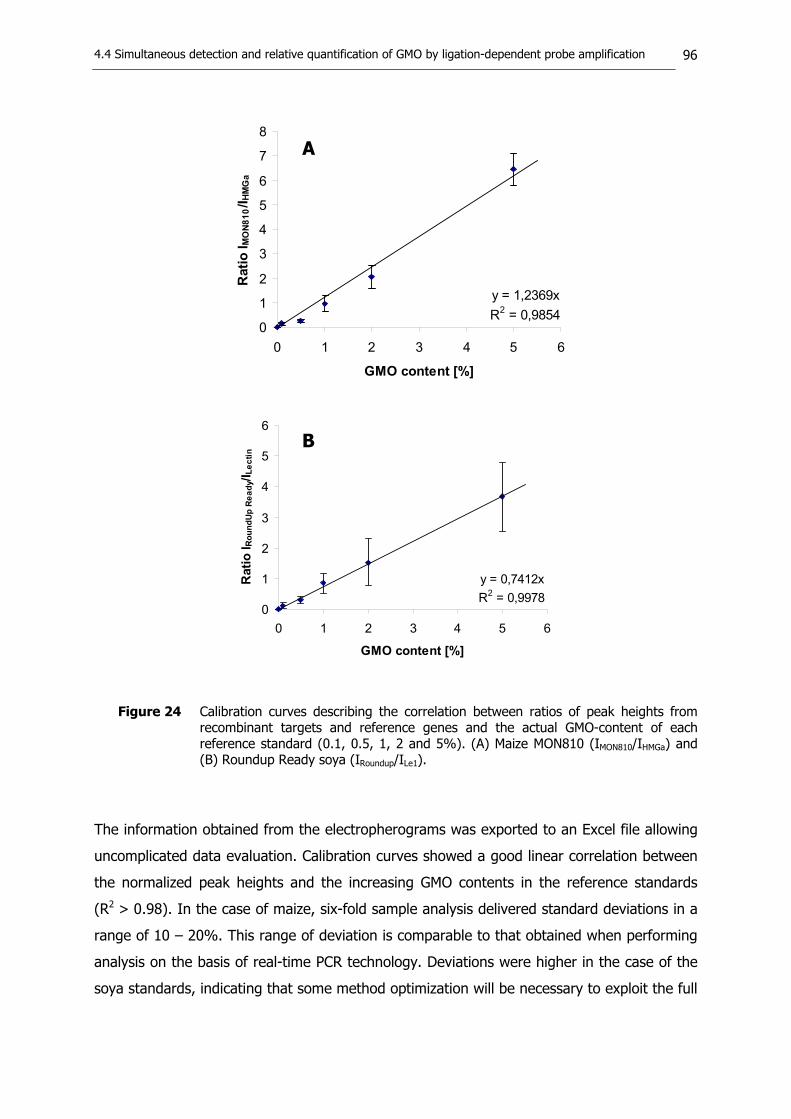
4.4 Simultaneous detection and relative quantification of GMO by ligation-dependent probe amplification 96
y = 1,2369xR2 = 0,9854
0
1
2
3
4
5
6
7
8
0 1 2 3 4 5 6
GMO content [%]
Rat
io I M
ON8
10/I H
MG
a
y = 0,7412xR2 = 0,9978
0
1
2
3
4
5
6
0 1 2 3 4 5 6
GMO content [%]
Rat
io I R
ound
Up
Rea
dy/I L
ectin
A
B
Figure 24 Calibration curves describing the correlation between ratios of peak heights from recombinant targets and reference genes and the actual GMO-content of each reference standard (0.1, 0.5, 1, 2 and 5%). (A) Maize MON810 (IMON810/IHMGa) and (B) Roundup Ready soya (IRoundup/ILe1).
The information obtained from the electropherograms was exported to an Excel file allowing
uncomplicated data evaluation. Calibration curves showed a good linear correlation between
the normalized peak heights and the increasing GMO contents in the reference standards
(R2 > 0.98). In the case of maize, six-fold sample analysis delivered standard deviations in a
range of 10 – 20%. This range of deviation is comparable to that obtained when performing
analysis on the basis of real-time PCR technology. Deviations were higher in the case of the
soya standards, indicating that some method optimization will be necessary to exploit the full

4.4 Simultaneous detection and relative quantification of GMO by ligation-dependent probe amplification 97
potential of this technique as valuable tool for the simultaneous detection and relative
quantification of several target sequences in one reaction.
Approaches for the reduction of deviations must focus on the optimization of the ligation
reaction. Carrying out the ligation reaction in a total volume of 5 µL makes the reaction
prone to bias in the composition of the reaction buffer. These are plausible due to the partial
condensation of H2O on the walls of the reaction vessels.
The simultaneous detection of reference genes and GMO-specific sequences at ratios of
0.1% was made possible by diluting the amounts of probes for the detection of reference
targets. This might represent another pitfall for the performance of balanced ligation
reactions. To avoid this dilution step, hybridization sites of lower melting temperatures could
be chosen for these sequences.
Finally, bias in the performance of the ligation of probes could have been additionally
amplified due to the repeated cycling of this reaction.
In future, the first aim will be to collect further data permitting a detailed validation of the
quantitative properties of this technique. Ideally, experiments should be performed using
self-prepared quantification standards, i.e. mixtures of DNA isolates from the respective
conventional and transgenic organisms. Thus, aliquots of these standards can be used along
the entire process of method development and optimization, eliminating uncertainties related
to batch-to-batch variations in the production of commercial standards. The accessibility to
material from transgenic organisms and from the corresponding conventional lines
represents at the same time a central requirement to allow the assessment of the influence
of food processing, e.g. on the basis of model processes starting from material with defined
GMO proportions (see 4.3.3), on the results delivered by the relative quantification of
recombinant DNA. Additionally, LPA could be applied to develop a versatile quantitative
screening system not only detecting further event-specific regions of food-relevant GMO and
fragments of the corresponding reference genes, but including probes for the detection of
commonly used regulatory sequences (35S CaMV promoter, NOS terminator) and of
conservative regions of mitochondrial plant DNA as an internal positive control.
4.4.5. Summary
The application of a novel, ligation-dependent probe amplification (LPA) technique to the
simultaneous event-specific detection and relative quantification of DNA from genetically
modified organisms in foods is described. The system is based on the ligation of synthetic
bipartite probes when hybridized to the corresponding target DNA. Ligation products possess

4.4 Simultaneous detection and relative quantification of GMO by ligation-dependent probe amplification 98
a characteristic length for each target and universal primer binding sites at their 5’ and 3’-
ends, enabling a subsequent competitive amplification using one common pair of primers.
The use of one fluorescein (FAM) labeled primer permits amplification products to be
separated and detected via capillary electrophoresis.
Respective probes were designed to allow the detection of reference genes in the genomes
from maize and soya, as well as event-specific junction regions in the transgenic maize line
MON810 and in Roundup Ready soya. This particular system was designed to permit the use
of synthetic oligonucleotides as hybridization probes. This avoided complex cloning and
preparation steps required for the isolation of probes derived of single stranded viral DNA, as
reported in other applications. Further, it was indispensable that hybridization probes
targeted at recombinant and reference sequences of nearly constant lengths, as this premise
builds the basis of accurate relative quantification of GMO in processed products showing
highly degraded DNA.
The specificity and sensitivity of this system was assayed on the basis of reference standards
consisting of maize and soybean flours with defined proportions of GMO-derived material in a
range of 0.1 – 5%. The system allowed the simultaneous detection of all targeted sequences
in one reaction, showing no negative interactions either due to the application of multiple
pairs of synthetic probes, or due to the analysis of mixtures of isolates from different
organisms. LPA allowed the detection of both, recombinant targets and reference genes,
starting from 75 ng DNA from standards containing 0.1% of GMO-derived material. Finally,
the potential of this technique to be applied for purposes of relative quantification of
recombinant DNA was demonstrated by the generation of calibration curves. These were
constructed by determining the ratios between signal intensities from recombinant targets
and the corresponding reference genes, and plotting these against the actual GMO-content
of reference standard.
The application of this analytical strategy results in a flexible modular system that can be
complemented with further probes to broaden the range of target sequences. This property
is of crucial importance for GMO analysis considering, the number of pending marketing
authorizations and the imminent necessity of screening and quantification methods for non-
authorized GMO. Another main advantage of the application of LPA-based systems is given
by the combination with a convenient and robust capillary electrophoresis-based detection
platform. This largely widespread detection technology allows the fully automated analysis of
a number of reactions without major post-PCR work-up.

5 Summary 99
5. Summary
The development of analytical methods, suitable for the detection and quantification of GMO
contents in agricultural commodities and processed products is essential to support the
control of compliance with regulatory provisions concerning the use of GMO and GMO-
derived material for the production of food and feed. DNA-based assays for the detection of
GMO within the food and feed chain must cope with a number of challenges that are linked
either to the background of the genetic modification and the genetic composition of the
GMO, or to adverse effects of technological parameters and manufacturing practices on the
availability of target sequences. Among the latter, limitations are mainly given by the
complexity of food composition and by the degradation/elimination of analytes during
manufacturing processes. In the presented studies the effects of food processing on the
quantification of GMO contents were investigated. In addition to the assessment of
established PCR-based technologies for the quantification of DNA sequences, an alternative
ligation-dependent modular system for the qualitative and quantitative detection of GMO in
composed and processed food products was developed.
The suitability of double-competitive PCR for the relative quantification of GMO was
demonstrated for heat-treated DNA mixtures and polenta samples, and complex bakery
mixes containing defined proportions of GMO-derived material. Investigations were
performed on the basis of a calibration curve generated using self-prepared quantification
standards consisting of mixtures of DNA from transgenic (Bt-176) and conventional maize. It
was shown that DNA degradation resulted in steadily decreasing amounts of competitor DNA
at the points of equivalence of the target (synthetic cryIA(b)- gene) and the reference
(maize-specific ivr1- gene) sequences. Normalization of points of equivalence from the
transgenic target with the values from the endogenous reference allowed a nearly constant
recovery of GMO contents regardless of the extent of DNA degradation. Similarly,
normalization of points of equivalence allowed the compensation of reduced proportions of
DNA of the targeted GMO, resulting from the unavoidable co-extraction of DNA from other
ingredients in isolates from samples of composed foods.
The influence of the particle size composition of food products on the determination of GMO
contents via real-time PCR was assessed exemplarily on the basis of different milling
fractions from conventional and transgenic corn. A strong correlation between the degree of
comminution of the milling fractions and the yield of DNA in the isolates could be
demonstrated using two different DNA isolation protocols. Fine flours delivered higher DNA
concentrations in the extracts than coarse grits due to a larger exposure surface towards the

5 Summary 100
extraction reagents. The impact of this effect on the determination of GMO contents was
assessed by analyzing composed samples generated by combining coarse grits and flours
from conventional and transgenic maize in different regimes. Results revealed that the
accurate quantification of the adjusted GMO content (1%) was only possible in mixes
containing conventional and transgenic material in form of analogous milling fractions.
Mixtures between fractions of different particle size distributions delivered significantly over-
and underestimated GMO contents depending on the compositions of the samples.
Distortions in the results of relative quantification occurred irrespective of the DNA extraction
methodology, showing that proportions of DNA in extracts from the different constituents of
a complex food do not necessarily represent a truthful reflection of the mass proportions of
the food ingredients.
Different real-time PCR assays were used to study the influence of DNA degradation on the
determination of GMO contents. Analyses were performed on samples taken at different
heat-treatment levels of ground maize kernels, and on samples from intermediate stages of
the process for the production of ethanol from maize grits. It was shown that even slight
differences in the lengths of target sequences for recombinant and reference genes
(|∆l| < 20 bp) caused stability disparities towards processing conditions; i.e. longer
sequences being more susceptible to degradation if exposed to adverse conditions. A
disproportional degradation of the targeted fragments in the course of processing resulted
consequently in significant distortions in the results of relative quantification. Underestimated
GMO contents were obtained when using quantification assays targeting at a shorter
fragment for the detection of the reference gene (∆l = -25 and -50 bp), whereas
overestimated GMO contents were obtained when targeting at a longer fragment for the
detection of the reference gene (∆l = +16 bp). To overcome distortion effects in the results
of relative GMO quantifications, a redesign of one quantification assay was carried out
reducing the length difference between recombinant and reference target sequences from
∆l = -50 to -2 bp. Applied to samples taken from intermediate stages within a model process
for the production of ethanol from maize grits, the modified assay allowed a nearly constant
recovery of the actual proportion of GMO-derived material (10%) even at high levels of DNA
degradation. Experiments demonstrated that validation of quantitative methods cannot be
restricted to the assessment of trueness and precision in (unprocessed) certified reference
materials, since such performance parameters may not be unconditionally transferable to
results obtained from the analysis of processed samples. Validation procedures must include
experiments demonstrating that processing steps will not result in an alteration of relative
quantification results.

5 Summary 101
An alternative system for the qualitative and quantitative detection of GMO in composed and
processed food products was developed on the basis of a ligation-dependent amplification
reaction (LPA). This modular approach is of special interest for GMO-analysis, as it may
contribute to overcome analytical challenges related to the steadily increasing number of
GMO that need to be detected. The system is based on the ligation of synthetic bipartite
probes when hybridized to the corresponding target DNA. Ligation products possess a
characteristic length for each target and universal primer binding sites at their 5’ and 3’-
ends, enabling a subsequent competitive amplification using one common pair of primers.
The use of one fluorescein labeled primer permits amplification products to be separated and
detected via capillary electrophoresis. Respective probes were designed to allow the
detection of reference genes in the genomes from maize and soya, as well as event-specific
junction regions in the transgenic maize line MON810 and in Roundup Ready soya. The
specificity and sensitivity of this system was assayed on the basis of mixtures of extracts
containing DNA from transgenic maize and soya. DNA was extracted from commercial
reference standards consisting of maize and soybean flours with defined proportions of
GMO-derived material. LPA allowed the simultaneous detection all target sequences (i.e.
recombinant sequences and reference genes) in one reaction. Finally, the potential of this
technique to be applied to the relative quantification of recombinant DNA was demonstrated
by the generation of calibration curves. These were constructed by determining the ratios
between signal intensities from recombinant targets and the corresponding reference genes,
and plotting these against the actual GMO-contents of the reference standards.
This analytical strategy offers a flexible modular system that can easily be complemented
with further probes to broaden the range of target sequences to be detected and quantified.

6 Zusammenfassung 102
6. Zusammenfassung
Die Entwicklung analytischer Methoden zur Detektion und Quantifizierung gentechnisch
veränderter Organismen (GVO) in landwirtschaftlichen Rohstoffen und ihren
Verarbeitungsprodukten ist ein wesentlicher Bestandteil von Maßnahmen zur Kontrolle der
Kennzeichnung von Lebens- und Futtermitteln, die unter Verwendung von GVO oder daraus
hergestellten Materialien gewonnen wurden. DNA-basierende Methoden zum Nachweis von
GVO in der Lebens- und Futtermittelkette müssen eine Reihe analytischer Herausforderungen
erfüllen; diese können sich sowohl aus den Hintergründen der gentechnischen Veränderung
und der genetischen Zusammensetzung unterschiedlicher GVO-Linien als auch aus negativen
Effekten lebensmitteltechnologischer Prozesse auf die Verfügbarkeit von DNA ergeben.
Limitierungen im Hinblick auf die Analytik prozessierter Lebens- und Futtermittel ergeben
sich hauptsächlich durch die Komplexität der Produktzusammensetzungen sowie durch die
Degradierung/Eliminierung von Analyten im Laufe unterschiedlicher Verarbeitungsprozesse.
In der vorliegenden Arbeit wurden Effekte lebensmitteltechnologischer Verfahren auf die
Bestimmung von GVO-Anteilen untersucht. Dabei wurden zunächst etablierte PCR-
Technologien zur Quantifizierung von DNA Sequenzen eingesetzt. Darüber hinaus wurde ein
alternatives System auf der Basis einer modularen ligationsabhängigen Reaktion entwickelt,
welches für den qualitativen und quantitativen Nachweis von GVO in zusammengesetzten
und prozessierten Lebensmitteln eingesetzt werden kann.
Die Anwendbarkeit doppelt-kompetitiver PCR zur relativen Quantifizierung von GVO wurde
anhand von thermisch behandelten DNA Mischungen, von Polentaproben sowie von
Backmischungen mit unterschiedlichen Anteilen an GVO-Material demonstriert. Die
Quantifizierungen erfolgten mit Hilfe einer Kalibriergeraden, die unter Verwendung von
Mischungen selbst präparierter DNA aus transgenem (Bt-176) und konventionellem Mais als
Quantifizierungsstandards erstellt wurde. Die Degradierung von DNA resultierte in einer
stetigen Abnahme der Mengen an Kompetitor-DNA an den Äquivalenzpunkten der
transgenen (synthetisches cry A(b - Gen) und endogenen (Mais-spezifisches ivr1- Gen)
Zielsequenzen. Die Normalisierung von Äquivalenzpunkten der transgenen Zielsequenz mit
den Werten der endogenen Referenz ermöglichte dennoch eine nahezu konstante
Wiederfindung der entsprechenden GVO-Anteile, unabhängig von dem Grad der DNA-
Degradierung. Durch die Normalisierung der Äquivalenzpunkte konnten auch reduzierte DNA-
Anteile aus dem zu untersuchendem GVO, die sich bei der unvermeidbaren Koextraktion von
DNA anderer Zutaten in Extrakten aus zusammengesetzten Lebensmitteln zwangsläufig
ergeben, relativiert werden.
I )

6 Zusammenfassung 103
Der Einfluss der Partikelgrößenzusammensetzung von Lebensmitteln auf die Bestimmung von
GVO-Anteilen mittels real-time PCR wurde anhand unterschiedlicher Mahlfraktionen aus
konventionellem und transgenem Mais untersucht. Nach unterschiedlichen Protokollen
durchgeführte Extraktionen von DNA zeigten eine deutliche Korrelation zwischen dem
Zerkleinerungsgrad der Mahlfraktionen und den DNA-Ausbeuten in den Extrakten. Aufgrund
ihrer gegenüber den Extraktionsreagenzien vergrößerten Expositionsfläche lieferten feine
Mehle Extrakte mit höheren DNA-Gehalten als grobe Grießfraktionen. Der Einfluss dieses
Effektes auf die Bestimmung von GVO-Anteilen wurde an Proben unterschiedlicher
Partikelgrößenzusammensetzungen untersucht, die durch Mischen von Mehl- und
Grießfraktionen aus konventionellem und transgenem Mais in verschiedenen Kombinationen
hergestellt wurden. Es zeigte sich, dass eine exakte Quantifizierung des auf 1% eingestellten
GVO-Anteiles nur in den Mischungen möglich war, die aus analogen Mahlfraktionen von
konventionellem und transgenem Material zusammengesetzt worden waren. Mischungen
bestehend aus Fraktionen unterschiedlicher Partikelgrößenverteilungen resultierten dagegen
in einer signifikanten Über- bzw. Unterschätzung der GVO-Anteile. Die festgestellten
Verzerrungen in den Ergebnissen der relativen Quantifizierung waren unabhängig von der
zur DNA-Extraktion eingesetzten Methodik. Diese Studien zeigten, dass die im Extrakt
vorkommenden Konzentrationsverhältnisse der DNA aus den unterschiedlichen Zutaten eines
komplex zusammengesetzten Lebensmittels nicht unbedingt ein Spiegelbild der
Massenverhältnisse der Zutaten im Lebensmittel selbst darstellen.
Verschiedene auf real-time PCR basierende Methoden wurden eingesetzt, um den Einfluss
der DNA Degradierung auf die Bestimmung von GVO-Anteilen zu untersuchen. Die Analysen
wurden durchgeführt anhand von Proben aus der thermischen Behandlung zerkleinerter
Maiskörner und aus Zwischenstufen eines Brennprozesses zur Gewinnung von Ethanol aus
Maisgrieß. Die Stabilität der nachzuweisenden rekombinanten und Referenzfragmente wurde
bereits durch geringfügige Unterschiede in ihren Längen (|∆l| < 20 bp) beeinflusst; längere
Zielsequenzen zeigten eine stets stärkere Degradierungsanfälligkeit im Falle einer Exposition
gegenüber Stressbedingungen. Aus den unproportionalen Degradierungen der Zielsequenzen
im Laufe von Verarbeitungsprozessen resultierten signifikante Verzerrungen bei der relativen
Quantifizierung. GVO-Anteile wurden unterschätzt bei der Anwendung von
Quantifizierungsmethoden, die auf kürzere Fragmente für den Nachweis des Referenzgens
im Vergleich zum Transgen zielten (∆l = -25 bzw. -50 bp). Beim Nachweis einer längeren
Zielsequenz für das Referenzgen (∆l = +16 bp) wurde dagegen eine Überschätzung der
GVO-Anteile festgestellt. Die Vermeidung solcher Verfälschungseffekte erforderte gezielte
Veränderungen in dem Design der angewandten Methoden. Für eine der eingesetzten

6 Zusammenfassung 104
Quantifizierungsmethoden wurde daher der Längenunterschied zwischen den Zielsequenzen
für das Transgen und das Referenzgen von ∆l = -50 auf -2 bp reduziert. Aufgrund dieser
Modifizierung war in Proben aus Zwischenstufen eines Modellprozesses zur Gewinnung von
Ethanol aus Maisgrieß eine nahezu konstante Wiederfindung des eingestellten GVO-Anteils
(10%) ungeachtet des zunehmenden Grades der DNA Degradierung möglich. Die Ergebnisse
verdeutlichen, dass die Validierung quantitativer Methoden sich nicht nur auf die
Bestimmung von Richtigkeit und Präzision in zertifizierten (unprozessierten)
Referenzmaterialien beschränken darf, da diese Parameter unter Umständen nicht ohne
weiteres auf die Analyse prozessierter Proben übertragbar sind. Validierungsstudien müssen
anhand prozessierungsbegleitender Untersuchungen sicherstellen, dass die damit
verbundene Degradierung von DNA nicht in einer Verfälschung der Ergebnisse einer relativen
Quantifizierung resultiert.
Ein alternatives System für den qualitativen und quantitativen Nachweis von GVO in
zusammengesetzten und prozessierten Lebensmitteln wurde auf der Basis einer
ligationsabhängigen Amplifizierung (LPA) entwickelt. Dieses modulare Verfahren ist von
besonderem Interesse für die GVO-Analytik, da es zu der Überwindung analytischer
Herausforderungen aufgrund der stetig steigenden Anzahl an nachzuweisenden GVO
beitragen kann. Das System basiert auf der Ligation synthetisierter Sondenpaare, wenn diese
auf den entsprechenden Zielsequenzen hybridisieren. Die entstandenen Ligationsprodukte
besitzen eine charakteristische Länge für die jeweiligen Zielsequenzen und verfügen über
universelle Primerbindestellen an ihren 5’ und 3’- Enden. Diese Bindestellen ermöglichen eine
anschließende kompetitive Amplifizierung aller Ligationsprodukte unter Anwendung eines
gemeinsamen Primerpaares. Die Benutzung eines Fluorescein-markierten Primers erlaubt die
Trennung und die Detektion der amplifizierten Produkte mittels Kapillarelektrophorese. Das
Design von Sonden zielte sowohl auf den Nachweis von Mais- und Soja-spezifischen
Referenzgenen als auch auf den Nachweis Event-spezifischer Regionen in den transgenen
Linien Mais MON810 und Roundup Ready Soja. Spezifitäts- und Sensitivitätsuntersuchungen
erfolgten mit Hilfe von Mischungen von DNA Extrakten aus kommerziellen Referenzstandards
von Mais und Soja mit definierten Anteilen an GVO-Material. Das LPA-System erlaubte den
simultanen Nachweis aller Zielsequenzen (d.h. sowohl rekombinante Fragmente als auch
Referenzgene) in einem Reaktionsansatz. Die potentielle Anwendbarkeit dieser Technik für
die relative Quantifizierung rekombinanter DNA wurde durch die Erstellung von
Kalibriergeraden demonstriert. Hierfür wurden die Signalintensitäten der rekombinanten
Sequenzen und der entsprechenden Referenzgene ins Verhältnis gesetzt und gegen die
jeweiligen GVO-Anteile der benutzten Referenzstandards aufgetragen.

6 Zusammenfassung 105
Diese analytische Strategie erlaubt den Aufbau eines modularen Systems, dessen Flexibilität
Erweiterungen für den Nachweis und die Quantifizierung weiterer Zielsequenzen durch das
Design zusätzlicher Sonden zulässt.

7 References 106
7. References
[1] Otsuka Y. (2003): Socioeconomic considerations relevant to the sustainable development, use and control of genetically modified foods. In: Genetically Modified Foods for Human Health and Nutrition. Trends in Food Sci. Tech. 14: 294-318
[2] Kuiper H. A., König A., Kleter G. A., Hammes W. P., Knudsen I. (2004): Concluding remarks. In: Safety Assessment, Detection and Traceability, and Societal Aspects of Genetically Modified Foods European Network on Safety Assessment of Genetically Modified Food Crops (ENTRANSFOOD). Food Chem. Tox. 42 (7): 1195-1202
[3] Regulation (EC) No 1829/2003 of the European Parliament and of the Council of 22 September 2003 on genetically modified food and feed. Official Journal of the European Union, L 268/1.
[4] Regulation (EC) No 1830/2003 of the European Parliament and of the Council of 22 September 2003 concerning the traceability and labelling of genetically modified organisms and the traceability of food and feed products produced from genetically modified organisms and amending Directive 2001/18/EC. Official Journal of the European Union, L 268/24.
[5] Regulation (EC) No 258/97 of the European Parliament and of the Council of 27 January 1997 concerning novel foods and novel food ingredients. Official Journal of the European Communities - 14.02.1997 - No L 043, P. 0001-0007.
[6] Council Regulation (EC) No 1139/98 of 26 May 1998 concerning the compulsory indication of the labelling of certain foodstuffs produced from genetically modified organisms of particulars other than those provided for in Directive 79/112/EEC. Official Journal of the European Communities - 03.06.1998 - No L 159, P. 0004-0007.
[7] Commission Regulation (EC) No 50/2000 of 10 January 2000 on the labelling of foodstuffs and food ingredients containing additives and flavourings that have been genetically modified or have been produced from genetically modified organisms. Official Journal of the European Communities - 11.1.2000 - No L 006, P. 0015-0017.
[8] Commission Regulation (EC) No 49/2000 of 10 January 2000 amending Council Regulation (EC) No 1139/98 concerning the compulsory indication on the labelling of certain foodstuffs produced from genetically modified organisms of particulars other than those provided for in Directive 79/112/EEC. Official Journal of the European Communities - 11.1.2000 - No L 6, P. 0013-0014.
[9] Anklam E., Neumann D. (2002): Method development in relation to regulatory requirements for detection of GMOs in the food chain. J. AOAC Int. 85 (3); 754-756
[10] Anklam E., Gadani F., Heinze P., Pijnenburg H., Van den Eede G. (2002): Analytical methods for detection and determination of genetically modified organisms in agricultural crops and plant-derived food products. Eur. Food Res. Tech. 214; 3-26
[11] Engel K.- H., Moreano F. Methods to detect the application of genetic engineering in composed and processed foods. In: Genetically Engineered Food; Methods and Detection. Heller K. J. (2003), Wiley-VHC GmbH & Co. KGaA, Weinheim, Germany. pp. 205-230

7 References 107
[12] Miraglia M., Berdal K. G., Brera C., Corbisier P., Holst-Jensen A., Kok E. J., Marvin H. J. P., Schimmel H., Rentsch J., van Rie J. P. P. F., Zagon J. Detection and traceability of genetically modified organisms in the food production chain. In: Safety Assessment, Detection and Traceability, and Societal Aspects of Genetically Modified Foods European Network on Safety Assessment of Genetically Modified Food Crops (ENTRANSFOOD). Food Chem. Tox. 42 (7): 1157-1180
[13] Heller K.J. Detection of genetic modifications: some basic considerations. In: Genetically Engineered Food; Methods and Detection. Heller K. J. (2003), Wiley-VHC GmbH & Co. KGaA, Weinheim, Germany. pp. 149-154
[14] BATS Zentrum für Biosicherheit und Nachhaltigkeit. (2003): Genetically Modified (GM) Crops: molecular and regulatory details. http://www.gmo-watch.org/GVO-report140703.pdf
[15] James C. Global Status of Commercialized Transgenic Crops: 2003. ISAAA Briefs No 30. International Service For The Acquisition Of Agri-Biotech Applications. Ithaca, NY
[16] Thomson J. (2003): Genetically modified food crops for improving agricultural practice and their effects on human health. In: Genetically Modified Foods for Human Health and Nutrition. Trends in Food Sci. Tech. 14: 210-228
[17] AGBIOS GM-Crop Database. http://www.agbios.com/main.php
[18] Schnepf E., Crickmore N., Van Rie J., Lereclus D., Baum J., Feitelson J., Zeigler D. R., Dean D. H. (1998): Bacillus thuringiensis and ts Pesticidal Crystal Proteins. Microbiol. Mol. Biol. Rev. 62 (3): 775–806
[19] Stirn S., Lörz H. Genetically Modified Plants. In: Genetically Engineered Food; Methods and Detection. Heller K. J. (2003), Wiley-VHC GmbH & Co. KGaA, Weinheim, Germany. pp. 26-61
[20] Shavindra Bajaj, Jayaprakash Targolli, Li-Fei Liu, Tuan-Hua David Ho, Ray Wu. (1999): Transgenic approaches to increase dehydration-stress tolerance in plants. Mol. Breeding 5: 493–503
[21] Kasuga M., Liu Q., Miura S., Yamaguchi-Shinozaki K., Shinozaki K. (1999): Improving plant drought, salt, and freezing tolerance by gene transfer of a single stress-inducible transcription factor. Nature Biotech. 17 (3): 287-291
[22] Pellegrineschi A., Reynolds M., Pacheco M., Brito R. M., Almeraya R., Yamaguchi-Shinozaki K., Hoisington D. (2004): Stress-induced expression in wheat of the Arabidopsis thaliana DREB1A gene delays water stress symptoms under greenhouse conditions. Genome/Génome 47 (3): 493-500
[23] Takahashi M., Nakanishi H., Kawasaki S., Nishizawa N. K., Mori S. (2001): Enhanced tolerance of rice to low iron availability in alkaline soils using barley nicotianamine aminotransferase genes. Nat. Biotechnol. 19: 466-469
[24] Theologis A., Sato T. (2000). Control of fruit ripening through genetic control of ACC synthase synthesis. United States Patent 6,156,956, Date Filed: 2/3/1998. Washington DC: United States. Patents and Trademark Office.
[25] Gan S., Amasino R. M. (1995): Inhibition of Leaf Senescence by Autoregulated Production of Cytokinin. Science 270 (5244): 1986-1988
[26] Bouis H. E., Chassy B. M., Ochanda J. O. (2003): Genetically modified food crops and their contribution to human nutrition and food quality. In: Genetically Modified Foods for Human Health and Nutrition. Trends in Food Sci. Tech. 14: 191-209
[27] Ritsema T., Smeekens S. C. M. (2003): Engineering fructan metabolism in plants. J. Plant Physiol. 160: 811–820

7 References 108
[28] Heyer A.G. (2000): Production of modified carbohydrates in transgenic plants. Bundesgesundheitsbl - Gesundheitsforsch – Gesundheitsschutz. 43: 94–98
[29] Slattery C. J., Halil Kavakli I., Okita T. W. (2000): Engineering starch for increased quantity and quality. Trends in Plant Sci. 5 (7): 291-298
[30] Zheng Z., Sumi K., Tanaka K., Murai N. (1995): The Bean Seed Storage Protein [beta]-Phaseolin Is Synthesized, Processed, and Accumulated in the Vacuolar Type-II Protein Bodies of Transgenic Rice Endosperm. Plant Physiol. 109: 777-786
[31] Chakraborty S., Chakraborty N., Datta A. (2000): Increased nutritive value of transgenic potato by expressing a nonallergenic seed albumin gene from Amaranthus hypochondriacus. PNAS 97: 3724-3729
[32] Drexler H., Spiekermann P., Meyer A., Domergue F., Zank T., Sperling P., Abbadi A., Heinz E. (2003): Metabolic engineering of fatty acids for breeding of new oilseed crops: strategies, problems and first results. J. Plant Physiol. 160: 779–802
[33] Ye X., Al-Babili S., Klöti A., Zhang J., Lucca P., Beyer P., Potrykus I. (2000): Engineering the Provitamin A (beta-Carotene) Biosynthetic Pathway into (Carotenoid-Free) Rice Endosperm. Science 287 (5451): 303-305
[34] Goto F., Yoshihara T., Shigemoto N., Toki S., Takaiwa F. (1999): Iron fortification of rice seed by the soybean ferritin gene. Nature Biotech. 17 (3): 282 - 286
[35] Lucca P., Hurrell R., Potrykus I. (2000): Development of Iron-rich Rice and Improvement of its Absorption in Humans by Genetic Engineering. Journal of Plant Nutrition 23: 1983-1988
[36] Lucca P., Hurrell R., Potrykus I. (2001): Genetic engineering approaches to improve the bioavailability and the level of iron in rice grains. Theoret. Appl Genet. 102: 392-397
[37] Venkatramesh, M. (2000): Transgenic plants containing altered levels of sterol compounds and tocopherols (International Patent Publication No. WO 00/61771, Date Filed: 19/10/2000). Geneva: World Intellectual Property Organization.
[38] Jung, W., Yu, O., Lau, S., O’Keefe, D., Odell, J., Fader, G., & McGonigle, B. (2000): Identification and expression of isoflavone synthase, the key enzyme for biosynthesis of isoflavones in legumes. Nature Biotech. 18: 208–212.
[39] Muir, S., Collins, G., Robinson, S., Hughes, S., Bovy, A., De Vos, C., van Tunen, A., Verhoeyen, M. (2001): Overexpression of petunia chalcone isomerase in tomato results in fruit containing increased levels of flavonols. Nature Biotech. 19: 470–474
[40] Barro, F., Rooke, L., Bekes, F., Gras, P., Tatham, Fido, R., Lazzeri, P., Shewry, P., Barcelo, P. (1997): Transformation of wheat with high molecular weight subunit genes results in improved functional properties. Nature Biotech. 15: 1295–1299
[41] He G. Y., Rooke L., Steele S., Békés F., Gras P., Tatham A. S., Fido R., Barcelo P., Shewry P.R., Lazzeri P.A. (1999): Transformation of pasta wheat (Triticum turgidum L. var. durum) with high-molecular-weight glutenin subunit genes and modification of dough functionality. Mol Breeding 5 (4): 377-386
[42] Nuutila A.M., Ritala A., Skadsen R.W., Mannonen L., Kauppinen V. (1999): Expression of fungal thermotolerant endo-1,4-β-glucanase in transgenic barley seeds during germination. Plant Mol. Biol. 41 (6) 777-783
[43] Kuiper H. A., Kleter G. A. (2003): The scientific basis for risk assessment and regulation of genetically modified foods. In: Genetically Modified Foods for Human Health and Nutrition. Trends in Food Sci. Tech. 14: 277–293

7 References 109
[44] Commission Regulation (EC) No 65/2004 of 14 January 2004 establishing a system for the development and assignment of unique identifiers for genetically modified organisms. Official Journal of the European Union, L 10/5
[45] Commission Press Release (IP/01/1095), 25 July 2001.
[46] Commission Regulation (EC) No 641/2004 of 6 April 2004 on detailed rules for the implementation of Regulation (EC) No 1829/2003 of the European Parliament and of the Council as regards the application for the authorisation of new genetically modified food and feed, the notification of existing products and adventitious or technically unavoidable presence of genetically modified material which has benefited from a favourable risk evaluation. Official Journal of the European Union, L 102/14.
[47] European Commission Directorate General JRC Joint Research Centre, Community Reference Laboratory for GM Food and Feed. ENGL Steering Committee in collaboration with the ENGL Working Group Validation. Method acceptance criteria and method performance requirements. Version 18.04.2004. http://gmo-crl.jrc.it
[48] Draft Commission Recommendation of […] on technical guidance for sampling and detection of genetically modified organisms and material produced from genetically modified organisms as or in products in the context of Regulation (EC) No 1830/2003. Brussels, ENV/04/04.
[49] Stave J.W. (2002): Protein immunoassay methods or detection of biotech crops: Applications, Limitations, and practical considerations. J. AOAC Int. 85 (3); 780-786
[50] Lipp M., Anklam E., Stave J.W. (2000): Validation of an immunoassay for detection and quantitation of a genetically modified soybean in food and food fractions using reference materials: interlaboratory study. J. AOAC Int. 83 (4); 919-927
[51] Adamczyk, J.J., Adams, L.C., Hardee, D.D. (2000): Quantification of cryIA(c) δ-endotoxin in transgenic BT cotton: Correlating insect survival to different protein levels among plant parts and varieties. Pro.-Beltwide Cotton Conf. 2; 929-932
[52] Bookout, J. T., Joaquim, T. R., Magin, K. M., Rogan, G. J., Lirette, R. P. (2000): Development of a Dual-Label Time-Resolved Fluorometric Immunoassay for the Simultaneous Detection of Two Recombinant Proteins in Potato. J. Agric. Food Chem. 48 (12); 5868-5873
[53] Fearing P. L., Brown D., Vlachos D., Meghji M., Privalle L. (1997): Quantitative analysis of CryIA(b) expression in Bt maize plants, tissues, and silage and stability of expression over successive generations. Molecular Breeding 3; 169-176
[54] Baumforth K.R., Nelson P.N., Digby J.E., O'Neil J.D., Murray P.G. (1999): Demystified... the polymerase chain reaction. Mol. Pathol. 52 (1); 1-10
[55] Gadani F., Bindler G., Pijnenburg H., Rossi L., Zuber J. (2000): Current PCR methods for the detection, identification and quantification of genetically modified organisms (GMOs): A brief review. Beitr. Tabakforsch. Int. 19 (2); 85-96
[56] Barallon R. (1999): Review of DNA extraction methods. Proceedings of the European Research Project SMT4-CT96-2072: Development of methods to identify foods produced by means of genetic engineering. BGVV-Hefte, 05/1999
[57] Zimmermann A., Lüthy J., Pauli U. (1998): Quantitative and qualitative evaluation of nine different extraction methods for nucleic acids on soya bean food samples. Zeitschrift für Lebensmitteluntersuchung und Forschung 207; 81-90

7 References 110
[58] Holden M. J., Blasic J. R., Bussjaeger L., Kao C., Shokere L. A., Kendall D. C., Freese L., Jenkins G. R. (2003): Evaluation of Extraction Methodologies for Corn Kernel (Zea mays) DNA for Detection of Trace Amounts of Biotechnology-Derived DNA. J. Agric. Food Chem. 51: 2468-2474
[59] Wurz A., Rüggeberg H., Brodmann P., Waiblinger H. U., Pietsch K. (1998): DNA-Extraktionsmethode für den Nachweis gentechnisch veränderter Soja in Sojalecithin. Dt. Lebensm. Rundsch. 94; 159-161
[60] Meyer K., Rosa Ch., Hischenhuber C., Meyer R. (2001): Determination of Locust Bean Gum and Guar Gum by Polymerase Chain Reaction and Restriction Fragment Length Polymorphism Analysis. J AOAC Int. 84 (1): 89-99
[61] Scheu P. M., Berghof K., Stahl U. (1998): Detection of pathogenic and spoilage micro-organisms in food with the polymerase chain reaction. Food Microbiol. 15; 13-31
[62] Lantz P.-G., Abu Al-Soud W., Knutsson R., Hahn-Hägerdal B., Radström P. (2000): Biotechnical use of polymerase chain reaction for microbiological analysis of biological samples. Biotechnology Annual Review Vol. 5
[63] Wilson I. (1997): Inhibition and facilitation of nucleic acid amplification. Appl. Environm. Microbiol. 63 (10); 3741-3751
[64] Mizushina Y., Yoshida S., Matsukage A., Sakaguchi K. (1997): The inhibitory action of fatty acids on DNA polymerase ß. Biochim. Biophys. Acta 1336; 509-521
[65] De Boer S. H., Ward L. J., Li X., Chittaranjan S. (1995): Attenuation of PCR inhibition in the presence of plant compounds by addition of BLOTTO. Nucl. Acids Res. 23; 2567-2566
[66] Rossen L., Norskov P., Holmstrom K., Rasmussen O..F. (1992): Inhibition of PCR by components of food samples, microbial diagnostic assays and DNA-extraction solutions. Int. J. Food Microb. 17: 37-45
[67] Englund S., Ballagi-Pordany A., Bölske G., Johansonn K.E. (1999): Improved reliability of diagnostic PCR with an internal positive control molecule. Proc. 6th Intl. Coll. Paratuberculosis: Manning E.J.B., Collins M.T. (eds). Section 4 Diagnostic Applications and Approaches.
[68] Spiegelhalter F., Lauter F.R., Russell J.M. (2001): Detection of genetically modified food products in a commercial laboratory. J. Food Sci. 66 (5); 634-640
[69] Lipp M., Bluth A., Eyquem F., Kruse L., Schimmel H., Van den Eede G., Anklam E. (2001): Validation of a method based on polymerase chain reaction for the detection of genetically modified organisms in various processed foodstuffs. Eur. Food Res. Technol. 212; 497-504
[70] Holst-Jensen A., Rønning S. B., Løvseth A., Berdal K. G. (2003): PCR technology for screening and quantification of genetically modified organisms (GMOs). Anal Bioanal Chem 375: 985–993
[71] Wolf C., Scherzingern M., Wurz A., Pauli U., Hübner P., Lüthy J. (2000): Detection of cauliflower mosaic virus by the polymerase chain reaction: testing of food components for false-positive 35S-promoter screening results. Eur. Food Res. Tech. 210; 367-372
[72] Stadler M., Hübner P. (1998): Probleme bei der Anwendung der 35S- und NOS-PCR für die GVO-Analytik. Mitt. Gebiete Lebensm. Hyg. 89; 308-317

7 References 111
[73] Pöpping B. (2001): Methods for the detection of genetically modified organisms: Precision, pitfalls and proficiency. International Laboratory 31(4); 23-29
[74] Matsuoka T., Kuribara H., Takubo K., Akiyama H., miura H., Goda Y., Kusakabe Y., Toyoda M., Hino A. (2002): Detection of recombinant DNA segments introduced to genetically modified maize (Zea maize). J. Agri Food Chem. 50; 2100-2109
[75] Meyer R. (1995): Nachweis gentechnologisch veränderter Pflanzen mittels der Polymerase Kettenreaktion (PCR) am Beispiel der Flavr Savr Tomate. Z. Lebensm. Unter. Forsch. 201; 583-586
[76] Van Duijn G., van Biert R., Bleeker-Marcelis B., Peppelman H., Hessing M. (1999): Detection methods for genetically modified crops. Food Control 10 (6); 375-378
[77] Hupfer C., Hotzel H., Sachse K., Engel K.-H. (1998): Detection of the genetic modification in heat-treated products of Bt maize by polymerase chain reaction. Z. Lebensm. Unters. Forsch. A 206; 203-207
[78] Holck A., Va M., Didierjean L., Rudi K. (2002): 5´-Nuclease PCR for quantitative event-specific detection of the genetically modified Mon810 MaisGuard maize. Eur. Food Res. Tech. 214; 449-453
[79] Windels P., Taverniers I., Depicker A., van Bockstaele E., de Loose M. (2001): Charachterisation of the Roundup Ready soybean insert. Eur. Food Res. Tech. 213; 107-112
[80] Berdal K.G., Holst-Jensen A. (2001): Roundup Ready soybean event-specific real time quantitative PCR assay and estimation of the practical detection and quantification limits in GMO analyses. Eur. Food Res. Tech. 213; 432-438
[81] Terry C.F., Harris N. (2001): Event-specific detection of Roundup Ready soya using two different real time PCR detection chemistries. Eur. Food Res. Tech. 213; 425-431
[82] Zimmermann A., Lüthy J., Pauli U. (2000): Event-specific transgene detection in Bt11 corn by quantitative PCR at the integration site. Lebensm. Wiss. und Technol. 33; 210-216
[83] ILSI Europe Novel Food Task Force in collaboration with the European Commission's Joint Research Centre (JRC) and ILSI International Food Biotechnology Committee. (2001): Method development in relation to regulatory requirements for the detection of GMOs in the food chain. In: ILSI Europe Report Series, Summary Report of a Joint Workshop held in December 2000; pp. 13
[84] Zimmermann K. und Mannhalter J. W. (1996): Technical Aspects of Quantitative Competitive PCR. BioTechniques 21; 268-279
[85] Reischl U. and Kochanowski B. Quantitative PCR. Mol. Biology 3; 55-71
[86] Piatak M. Jr., Luk K.-C., Williams B., Lifson J. D. (1993): Quantitative Competitive Polymerase Chain Reaction for Accurate Quantitation of HIV DNA and RNA Species. BioTechniques 14; 70-81
[87] Raeymaekers L. (1993): Quantitative PCR: Theoretical Considerations with Practical Implications. Analyt. Biochem. 214; 582-585
[88] Gilliland G., Perrin S., Blanchard K., Bunn H. F. (1990): Analysis of cytokine mRNA and DNA: Detection and quantitation by competitive polymerase chain reaction. Proc. Natl. Acad. Sci. USA 87; 2725-2729
[89] Hübner P., Studer E., Lüthy J. (1999): Quantitative competitive PCR for the detection of genetically modified organisms in food. Food Control 10; 353-358

7 References 112
[90] Hübner P., Studer E., Lüthy J. (1999): Detection of genetically modified organisms in food. Nature Biotech. 17; 1137-1138
[91] Wurz A., Bluth A., Zelz P., Pfeifer C., Willmund R. (1999): Quantitative analysis of genetically modified organisms (GMO) in processed food by PCR based methods. Food Control 10; 385-389
[92] Pietsch K., Waiblinger H.-U. (1999): Kompetitive PCR zur Quantifizierung "konventioneller" und transgener Lebensmittelbestandteile. Lebensmittelchemie, 53 (1); 13
[93] Hardegger M., Brodmann P., Herrmann A. (1999): Quantitative detection of the 35S promoter and the NOS terminator using quantitative competitive PCR. Eur. Food Res. Technol. 209; 83-87
[94] Studer E., Rhyner C., Lüthy J., Hübner P. (1998): Quantitative competitive PCR for the detection of genetically modified soybean and maize. Z. Lebensm. Unters. Forsch. 270; 207-213
[95] Hupfer C., Hotzel H., Sachse K., Moreano F., Engel K.-H. (2000): PCR-based quantification of genetically modified Bt maize: single-competitive versus dual-competitive approach. Eur. Food Res. Technol. 212 (1); 95-99
[96] Bustin S.A. (2000): Absolute quantification of mRNA using real-time reverse transcription polymerase chain reaction assays. J. Molec. Endocrinol. 25; 169-193
[97] Wilhelm J., Pingoud A. (2003): Real-Time Polymerase Chain Reaction. ChemBioChem 4: 1120-1128
[98] PE Applied Biosystems. (1997): Relative Quantification of Gene Expression. User Bulletin #2
[99] Specht K., Richter T., Müller U., Walch., Werner M., Höfler H. (2001): Quantitative Gene Expression Analysis in Microdissected Archival Formalin-Fixed and Paraffin-Embedded tumor Tissue. Am. J. of Pathology 158; 419-429
[100] Li X., Wang X. (2000): Application of real-time polymerase chain reaction for the quantitation of interleukin-1ß mNA upregulation in brain isochemic tolerance. Brain Res. Protoc. 5; 211-217
[101] Gut M., Leutenegger Ch., Huder J., Pedersen N., Lutz H. (1999): One-tube flourogenic reverse transcription-polymerase chain reaction for the quantitation of feline coronaviruses. J. of Virological Methods 77; 37-46
[102] Taverniers I., Van Bockstaele E., De Loose M. (2004): Cloned plasmid DNA fragments as calibrators for controlling GMOs: different real-time duplex quantitative PCR methods. Anal Bioanal Chem 378: 1198–1207
[103] Pardigol A., Guillet S., Pöpping B. (2003): A simple procedure for quantification of genetically modified organisms using hybrid amplicon standards. Eur Food Res Technol. 216: 412–420
[104] Höhne M., Santisi C.R., Meyer R. (2002): Real-time multiplex PCR: An accurate method for the detection and quantification of 35S-CaMV promoter in genetically modified maize-containing food. Eur. Food Res. Technol. 215; 59-64
[105] Taverniers, I.; Windels, P.; Van Bockstaele, E.; De Loose, M. (2001): Use of cloned DNA fragments for event-specific quantification of genetically modified organisms in pure and mixed food products. Eur. Food Res. Technol. 213; 417-424
[106] Pietsch K., Waiblinger H.-U. (2001): Quantification of genetically modified soybeans in food with the LightCycler system. Rapid Cycle Real-Time PCR, 385-389

7 References 113
[107] Waiblinger H. U., Gutmann M., Hädrich J., Pietsch K. (2001): Validierung der Real-time PCR zur Quantifizierung von gentechnisch veränderter Soja. Deutsche Lebensmittel-Rundschau Heft 4
[108] Broll H., Zagon A., Butschke., Grohmann L. GVO Analytik: Validierung und Ringversuche. GMO Analytik heute. Symposium organized by Scil Diagnostics GmbH and GeneScan Europe AG. Frankfurt am Main, Germany, 23th January 2002.
[109] Vaitilingom M., Pijnenburg H., Gendre F., Brignon P. (1999): Real-Time PCR detection of genetically modified Maximizer maize and Roundup Ready soybean in some representative foods. J. Agric. Food Chem. 47; 5261-5266
[110] Safety of Genetically Engineered Crops. In: VIB publication, Flanders Interuniversity Institute for Biotechnology, 2001. Custers R. (Ed.). Jo Bury, VIB Publisher; Zwijnaarde, Belgium.
[111] Coe E. H. (2001): The origins of maize genetics. Nature Reviews Genetics 2: 898-905
[112] Trifa Y., Zhang D. (2004): DNA Content in Embryo and Endosperm of Maize Kernel (Zea mays L.): Impact on GMO Quantification. J. Agric. Food Chem., 52, 1044-1048
[113] European Commission’s Fifth Framework Program, Quality of Life and Management of Living Resources. Project title: “Reliable, standardised, specific, quantitative detection of genetically modified food”. Final report of workpackage 2: Contract no. QLK1-CT-1999-01301.
[114] Maliga P. (2002): Engineering the plastid genome of higher plants. Current Opinion in Plant Biology 5: 164–172
[115] Ruf S., Hermann M., Berger I. J. Carrer H., Bock R. (2001): Stable genetic transformation of tomato plastids and expression of a foreign protein in fruit. Nature Biotech. 19 (9): 870 – 875
[116] Prokisch J., Zeleny R., Trapmann S., Le Guern L.,Schimmel H., Kramer G. N., Pauwels J. (2001): Estimation of the minimum uncertainty of DNA concentration in a genetically modified maize sample candidate certified reference material. Fresenius J Anal Chem. 370: 935–939
[117] Van den Eede G., Kay S., Anklam E. (2002): Analytical challenges: Bridging the gap from regulation to enforcement. J. AOAC Int. 85 (3); 757-761
[118] Belitz H.-D., Grosch W., Schieberle P. (2001): In: Lehrbuch der Lebensmittelchemie. Springer Pub. ISBN 3-540-41096-1
[119] Quillien L., Gaborit T., Gueguen J., Melcion J.P., Kozlowski A. (1990): ELISA as a tool for evaluating the denaturating effect of extrusion cooking on pea legumin (PISUM SATIVUM L.). Sciences des Aliments 10; 429-442
[120] Varshney G.C., Mahana W., Filloux A.M., Venien A., Paraf A. (1991): Structure of native and heat-denatured ovalbumin as revealed by monoclonal antibodies: Epitopic changes during heat treatment. J. Food Sci. 56 (1); 224-233
[121] Marín M.L., Casas C., Cambero M.I., Sanz B. (1992): Study of the effect of heat (treatments) on meat protein denaturation as determined by ELISA. Food Chem. 43; 147-150
[122] Unglaub W., Müller R., Jemmi T., Stuker G. (1998): Erhitzungsnachweis an Fleisch-Knochenmehl aus Nebenprodukten der Lebensmittelgewinnung mittels Enzym-immunologie. Fleischwirtschaft 78 (10); 1072-1078
[123] Roux K.H., Teuber S.S., Robotham J.M., Sathe S.K. (2001): Detection and stability of the major almond allergen in foods. J. Agri. Food Chem. 49; 2131-2136

7 References 114
[124] Lindahl T., Nyberg B. (1972): Rate of depurination of native deoxyribonucleic acid. Biochemistry 11: 3610-3618
[125] Adam R.E., Zimm B.H. (1977): Shear degradation of DNA. Nucl. Acids Res. 4 (5); 1513-1537
[126] Ausubel F.M., Brent R., Kingston R.E., Moore D.D., Seidman J.G., Smith J.A., Struh K. (1992): Current Protocols in Molecular Biology. Greene Publishing Associates and John Wiley & Sons, New York. ISBN 0-471-50338-x
[127] Thomson J. (2000): Joint FAO/WHO Expert Consultation on Foods Derived from Biotechnology, Topic 11: Gene Transfer: Mechanisms and Food Safety Risks. Biotech. 00/13
[128] Klein J., Altenbuchner J., Mattes R. (1998): Nucleic acid and protein elimination during the sugar beet manufacturing process of conventional and transgenic sugar beets. J. of Biotech. 60; 145-153
[129] Maniatis T., Fritsch E.F., Sambrook J. (1982): Molecular Cloning. CSH Press.
[130] Bauer T., Weller P., Hammes W. P., Hertel Ch. (2003): The effect of processing parameters on DNA degradation in food. Eur Food Res Technol. 217: 338–343
[131] Ebbehøy K. F. und Thomsen P. D. (1991): Species Differentiation of Heated Meat Products by DNA Hybridization. Meat Sci. 30: 221-234
[132] Ford M., Du Prat E., Barallon R. V., Rogers H. J., Parkers H. C. (1996): Detection of Genetic Modifications in Food. In: Authenticity '96, IFR, Norwich, September 1-3 1996. Poster/Conference Abstract.
[133] Kingombe C.I.B., Lüthy E., Schlosser H., Howald D., Kuhn M., Jemmi T. (2001): A PCR-based test for species-specific determination of heat treatment conditions of animal meals as an effective prophylactic method for bovine spongiform encephalopathy. Meat Sci. 57; 35-41
[134] Hupfer Ch., Mayer J., Hotzel H., Sachse K., Engel K.-H. (1999): The effect of ensiling on PCR-based detection of genetically modified Bt maize. Eur. Food Res. Technol. 209 (5); 301-304
[135] Golenberg E.M., Bickel A., Weihs P. (1996): Effect of highly fragmented DNA on PCR. Nucl. Acids. Res. 24 (24); 5026-5033
[136] Hupfer C., Hotzel H., Sachse K., Engel K.-H. (1998): Detection of the genetic modification in heat-treated products of Bt maize by polymerase chain reaction. Z. Lebensm. Unters. Forsch. A 206; 203-207
[137] Hupfer C., Schmitz-Winnenthal J., Engel K.-H. (1999): Detection of genetic change in transgenic potatoes during the distillery process in ethanol production. Lebensmittelchemie, 53 (1); 13-14
[138] Hellebrand M., Nagy M., Mörsel T. (1998): Determination of DNA traces in rapeseed oil. Z. Lebensm. Unters. Forsch. 206; 237-242
[139] Straub J.A., Hertel C., Hammes W.P. (1999): Limits of a PCR-based detection method for genetically modified soya beans in wheat bread production. Z. Lebensm. Unters. Forsch. 208; 77-82
[140] Moser M.A., Kniel B., Schmitz-Winnenthal J., Hupfer C., Engel K.-H. (1999): Einfluß verfahrenstechnischer Parameter auf den analytischen Nachweis gentechnisch veränderter Zutaten. Getreide, Mehl, Brot. Sonderdruck 6/99
[141] Straub J.A., Hertel C., Hammes W.P. (1999): The fate of recombinant DNA in thermally treated fermented sausages. Eur. Food Res. Technol. 210; 62-67

7 References 115
[142] Hurst C., Knight A., Bruce I. (1999): PCR detection of genetically modified soy and maize in foodstuffs. Mol. Breeding 5; 579-586
[143] Vaitilingom M., Gendre F., Brignon P. (1998): Direct detection of viable bacteria, molds and yeasts by reverse transcriptase PCR in contaminated milk samples after heat treatment. Appl. Environ. Microbiol. 64 (3); 1157-1160
[144] Busch U., Mühlbauer B., Böhm U., Liebl B. (2001): Gentechnisch veränderter Mais und Soja - qualitativer und quantitativer Nachweis. Deutsche Lebensmittel-Rundschau 97. Jahrgang, Heft 4
[145] Moreano F., Hotzel H., Sachse K., Engel K.-H. Quantification of DNA in thermally treated products. In: Book of Abstracts of the joint workshop on method development in relation to regulatory requirements for the detection of GMOs in the food chain. ILSI Europe Novel Food Task Force in collaboration with the European Commission's Joint Research Centre (JRC) and ILSI International Food Biotechnology Committee. December 2000, Brussels, Belgium.
[146] Matsuoka T., Kubribara H., Akiyama H., Miura H., Goda Y., Kusakabe Y., Isshiki K., Toyoda M., Hino A. (2001): A multiplex PCR method of detecting recombinant DNAs from five lines of genetically modified maize. J Food Hyg. Soc. Japan; 42 (1); 24-32
[147] Studer E., Dahinden I., Lüthy J., Hübner P. (1997): Nachweis des gentechnisch veränderten Maximizer Mais mittels der Polymerase-Kettenreaktion (PCR) Mitt. Gebiete Lebensmi. Hyg. 88; 515-524
[148] Krech A.B., Wurz A., Stemmer Ch., Feix G., Grasser K.D. (1999): Structure of genes encoding chromosomal HMG1 proteins from maize. Gene 234; 45-50
[149] Hernandez M., Rio A., Esteve T., Prat S., Pla M. (2001): A Rapeseed-Specific Gene, Acetyl-CoA Carboxylase, Can be Used as a Reference for Qualitative and Real-Time Quantitative PCR Detection of Transgenes from Mixed Food Samples. J. Agric. Food Chem. 49 (8); 3622-3627
[150] Foodstuffs - Methods of analysis for the detection of genetically modified organisms and derived products - Quantitative nucleic acid based methods. European Committee for Standardization. (ISO/DIS 21570:2003)
[151] Hübner P., Waiblinger H.U., Pietsch K., Brodmann, P. (2001): Validation of PCR Methods for Quantitation of Genetically Modified Plants in Food. Journal of AOAC International 84 (6): 1855-1864
[152] Berdal K.G., Holst-Jensen A. (2001): Roundup Ready soybean event-specific real time quantitative PCR assay and estimation of the practical detection and quantification limits in GMO analyses. Eur. Food Res. Tech. 213: 432-438
[153] Ehlers B., Strauch E., Goltz M., Kubsch D., Wagner H., Maidhof H., Bendiek J., Appel B., Buhk H.-J. (1997): Nachweis gentechnischer Veränderungen in Mais mittels PCR. Bundesgesundheitsbl. 40 (4): 118-121
[154] Koziel M. G., Beland G. L., Bowman C., Carozzi N. B., Crenshaw R., Crossland L., Dawson J., Desai N.,; Hill M. (1993): Field performance of elite transgenic maize plants expressing an insecticidal protein derived from Bacillus thuringiensis. Bio/Technology 11 (2): 194-200
[155] Grohmann L. GeneScan Analytics GmbH, Teltow, Germany. Personal communication.

7 References 116
[156] Detection of a genetic modification of Soybeans (Roundup Ready soya) by amplification of the modified DNA sequence using the polymerase chain reaction (PCR) and hybridization of the PCR product with a DNA probe L-23.01.22-1. Amtliche Sammlung von Untersuchungsverfahren nach §35 LMBG. Bundesinstitut für gesundheitlichen Verbraucherschutz und Veterinärmedizin. Beuth Verlag: Berlin, Germany, 1998.
[157] Molekularbiologische Methoden. Schweizerisches Lebensmittelbuch. Bundesamt für Gesundheit, Eidgenössische Drucksachen und Materialzentrale: Bern, Switzerland 1998; chap 52B.
[158] Spoth, B.; Strauss, E. Screening of genetically modified organisms in food using Promega’s Wizard Resin. Promega notes Mag. 1999, 73, 23-25
[159] Eckert, K. In: Die Verarbeitung von Mais in der Brennerei. In: Die Branntweinwirtschaft. 2. Septemberheft, 1976.
[160] Kreipe, H. In: Handbuch der Getränketechnologie. Getreide- und Kartoffelbrennerei. 3. Ed. Stuttgart: Ulmer, 1981.
[161] Die Verwendung von Novozymes´ Enzymen bei der Alkoholerzeugung. Novozymes Promotion Business Operations Nr. 2002-02616-01. Bagsvaerd: 2002.
[162] Begerow E. Technische Information B2.2.32 7/00 SH/MMa: Reinvergärung SIHA-Amyloferm. Langenlonsheim, 2000.
[163] England L.S., Holmes S.B., Trevors J.T. (1998): Persistence of viruses and DNA in soil. World J. Micrbiol. Biotechnol. 14: 163–169
[164] Jonas D.A., Elmadfa I., Engel K.-H., Heller K.J., Kozianowski G., König A., Müller D., Narbonne J.F., Wackernagel W., Kleiner J. (2001): Safety considerations of DNA in food. Annals of Nutrition and Metabolism 45 (6): 235–254
[165] Wiseman G. (2002): State of the art and limitations of quantitative polymerase chain reaction. J AOAC Int. 85 (3): 792-6
[166] Pauli U., Liniger M., Schrott M., Schouwey B., Hübner P., Brodmann P., Eugster A. (2001): Quantitative detection of genetically modified soybean and maize: Method evaluation in a Swiss ring trial. Mitt Lebensm. Hyg 92: 145-158
[167] Alexander, R. J. Corn dry milling: Processes, products, and applications. Corn: Chemistry and Technology. Watson, S. A., Ramstad, P. E., Eds.; American Association of Cereal Chemists, Inc.: St. Paul, Minnesota, 1987.
[168] Rooney, L.W.; Serena-Saldivar, S.O. Food uses of whole corn and dry-milled fractions. Corn: Chemistry and Technology. Watson, S. A., Ramstad, P. E., Eds.; American Association of Cereal Chemists, Inc.: St. Paul, Minnesota, 1987.
[169] Hoff AJ. (1971): On the degradation of DNA by heat. Proc K Ned Akad Wet C. 74 (2): 167-71
[170] Maniatis T., Fritsch E.F., Sambrook J. (1982): Molecular Cloning. CSH Press.
[171] Alary R., Serin A., Maury D., Jouira H. B., Sirven J. P., Gautier M. F., Joudrier P. (2002): Comparison of simplex and duplex real time PCR for the quantification of GMO in maize and soybean. Food Control 13; 235-244
[172] Brodmann P.D., Ilg E.C., Berthoud H., Herrmann A. (2002): Real-time quantitative polymerase chain reaction methods for four genetically modified maize varieties and maize DNA content in food. J. AOAC Int. 85 (3):646-653

7 References 117
[173] Hird H., Powell J. Johnson., M.-L., Oehlschlage S. (2003): Determination of Percentage of RoundUp Ready Soya in Soya Flour Using Real-Time Polymerase Chain Reaction: Interlaboratory Study. J. AOAC Int. 86 (1); 66-71
[174] Kok E. J., Aarts H. J., Van Hoef A. M., Kuiper H. A. (2002): DNA methods: critical review of innovative approaches. J. AOAC Int. 85 (3); 797-800
[175] Grohmann L. GMO Chip: Internal validation results. In: GMO Analytik heute. Symposium organized by Scil Diagnostics GmbH and GeneScan Europe AG. Frankfurt am Main, Germany, 23th January 2002
[176] Feriotto G., Gardenghi S., Bianchi N., Gambari R. (2003): Quantitation of Bt-176 Maize Genomic Sequences by Surface Plasmon Resonance-Based Biospecific Interaction Analysis of Multiplex Polymerase Chain Reaction (PCR). J. Agric. Food Chem. 51 (16); 4640-4646
[177] Feriotto G., Borgatti M., Mischiati C., Bianchi N., Gambari R. (2002): Biosensor Technology and Surface Plasmon Resonance for Real-Time Detection of Genetically Modified Roundup Ready Soybean Gene Sequences. J. Agric. Food Chem. 50 (5); 955-962
[178] Mariotti E., Minunni M., Mascini M. (2002): Surface Plasmon Resonance (SPR) Biosensor for Genetically Modified Organisms (GMOs) Detection. Anal. Chim. Acta 453; 165-172
[179] Minunni M., Tombelli S., Mariotti E., Mascini M., Mascini M. (2001): Biosensors as new analytical tool for detection of Genetically Modified Organisms (GMOs). Fresenius J. Anal. Chem. 369 (7-8); 589 – 593
[180] Wenijn Su, Siyang Song, Minnan Long and Guangming Liu (2003): Multiplex polymerase chain reaction/membrane hybridization assay for detection of genetically modified organisms. J. Biotech. 105 (3); 227-233
[181] Mezzelani A., Bordoni R., Consolandi C., Rossi Bernardi L., Frosini A., Castiglioni B., Rizzi E., Marchelli R., Marmiroli N., Corradini R., Germini A., Battaglia C., De Bellis G. (2002): Ligation detection reaction and universal array for detectionand identification of genetically modified organisms (GMOs). Minerva Biotec.14; 269-271
[182] De Bellis G., Castiglioni B., Bordoni R., Mezzelani A., Rizzi E., Frosini A., Busti E., Consolandi C., Rossi Bernardi L., Battaglia C. (2002): Ligase detection reaction (LDR) and universal array (Zip Code): application to DNA genotyping. Minerva Biotec. 14; 247-252
[183] Rudi K., Rud I., Holck A. (2003): A novel multiplex quantitative DNA array based PCR (MQDA-PCR) for quantification of transgenic maize in food and feed. Nucl. Acids Res. 31 (11); e62
[184] Carrino J.J. (1996): Multiplex ligations-dependent amplication. Patent application WO 96/15271
[185] Belgrader P., Barany F., Lubin M. (1997): Detection of nucleic acid sequence differences using coupled lieges detection and polymerase chain reactions. Patent application WO 97/45559
[186] Hsuih T.C., Park Y.N., Zaretsky C., Wu F., Tyagi S., Kramer F.R., Sperling R., Zhang D.Y. (1996): Novel, ligation-dependent PCR assay for detection of hepatitis C in serum. J. Clin. Microbiol. 34 (3); 501-507
[187] Schouten J. P., McElgunn C. J., Waaijer R., Zwijnenburg D., Diepvens F., Pals G. (2002): Relative quantification of 40 nucleic acid sequences by multiplex ligation-dependent probe amplification. Nucl. Acids. Res. 30 (12); e57

7 References 118
[188] Gille J.J., Hogervorst F.B., Pals G., Wijnen J.T., van Schooten R.J., Dommering C.J., Meijer G.A., Craanen M.E., Nederlof P.M., de Jong D, McElgunn C.J., Schouten J.P., Menko F.H. (2002): Genomic deletions of MSH2 and MLH1 in colorectal cancer families detected by a novel mutation detection approach. Br. J. Cancer. 87 (8); 892-897
[189] Hogervorst F.B., Nederlof P.M., Gille J.J., McElgunn C.J., Grippeling M., Pruntel R., Regnerus R., van Welsem T., van Spaendonk R., Menko F.H., Kluijt I., Dommering C., Verhoef S., Schouten J.P., van't Veer L.J., Pals G. (2003): Large genomic deletions and duplications in the BRCA1 gene identified by a novel quantitative method. Cancer Res. 63 (7); 1449-1453
[190] Taylor C.F., Charlton R.S., Burn J., Sheridan E., Taylor G.R. (2003): Genomic deletions in MSH2 or MLH1 are a frequent cause of hereditary non-polyposis colorectal cancer: Identification of novel and recurrent deletions by MLPA. Hum. Mutat. 22 (6); 428-433
[191] Eldering E., Spek C.A., Aberson H.L., Grummels A., Derks I.A., de Vos A.F., McElgunn C.J., Schouten J.P. (2003): Expression profiling via novel multiplex assay allows rapid assessment of gene regulation in defined signalling pathways. Nucl. Acids Res. 31 (23); e153
[192] Moreano F., Busch, U., Engel K.-H. Distortion of GMO Quantification Results: Influence of Heat Induced DNA Degradation as Assayed on Different Maize Milling Fractions. J. Agri. Food Chem. Submitted.
[193] Tu O., Knott T., Marsh M., Bechtol K., Harris D., Barker D., Bashkin J. (1998): The influence of fluorescent dye structure on the electrophoretic mobility of end-labeled DNA. Nucl. Acids Res. 26 (11): 2797 – 2802
[194] Wenz H.-M., Robertson J. M., Menchen S., Oaks F., Demorest D. M., Scheibler D., Rosenblum B. B., Wike C., Gilbert D. A., Efcavitch J. W. (1998): High-Precision Genotyping by Denaturing Capillary Electrophoresis. Genome Res. 8 (1); 69-80
[195] Magnuson V.L., Ally D.S., Nyland S.J., Karanjawala Z.E., Rayman J.B., Knapp J.I., Lowe A.L., Ghosh S., Collins F.S. (1996): Substrate nucleotide-determined non-templated addition of adenine by Taq polymerase: implications for PCR-based genotyping and cloning. BioTechniques 21; 700-709
[196] Brownstein M.J., Carpten J.D., Smith J.R. (1996): Modulation of non-templated nucleotide addition by TaqDNA polymerase: primer modifications that facilitate genotyping. BioTechniques 20; 1004-1010