Development of Single Parameter to Rate Architectural ... of Single Parameter to Rate Architectural...
8
Development of Single Parameter to Rate Architectural Design for Green Building Certifications Avlokita Agrawal, PhD Devavrata Singh [Indian Institute of Technology, Roorkee] [Felicity Estates Pvt. Ltd.] [email protected] ABSTRACT India is witnessing green building revolution. With rating schemes like LEED, IGBC and GRIHA in place and practice, building stakeholders are becoming more aware of sustainability issues. Issues under sustainability are clubbed under - Site, Energy, Water, Waste and materials and Environment. For most rating schemes across the world, Energy carries maximum number of points. High importance has been placed on energy because of current world energy scenario. Buildings are assuming critical role in energy dynamics. In India, building construction is taking place at a much higher rate than usual. Buildings consume tremendous amount of energy and this rate of energy consumption in buildings is also increasing. As per rating schemes, a comparison of energy consumption with base case or even an absolute figure of energy consumption is considered for ranking the energy efficiency of building. However, our traditional vernacular systems and passive features of building and design which impacted thermal comfort in response to climate are not accounted for in judgment criteria. At no place is the thermal comfort creation though spatial planning is emphasized, encouraged and rated. Therefore, in today’s time when relevance of energy efficiency is far larger than earlier, it becomes imperative that thermal comfort be achieved through spatial planning and efficiency of spatial planning be made judgment criteria for rating sustainability quotient of a building. Hence a common parameter needs to be evolved to quantify and judge achievement of thermal comfort through spatial planning and passive techniques in any building across the globe in context to the climate in which building is placed. This research is aimed at development of such parameter and its applicability in rating schemes. The paper details out the parameter, methodology to calculate it for any building and its relevance for building sustainability. INTRODUCTION India is a developing economy and building construction industry contributes substantially towards GDP, resource consumption, energy demand and pollution. (Tiwari P, 2001) Buildings therefore need to be constructed in a manner that they have least negative impact on the environment and maximize health and other benefits. (Arif M et. al, 2009) This fact has been duly recognized and that is the reason we have two successful Green Building Rating systems in our country – LEED-IGBC and GRIHA. (igbc.in, grihaindia.org)) Both these rating systems are more or less similar to many other existing systems in the world. A green building is evaluated based upon certain themes which are almost the same; while 30th INTERNATIONAL PLEA CONFERENCE 16-18 December 2014, CEPT University, Ahmedabad 1
Transcript of Development of Single Parameter to Rate Architectural ... of Single Parameter to Rate Architectural...

Development of Single Parameter to Rate Architectural Design for Green Building Certifications
Avlokita Agrawal, PhD Devavrata Singh [Indian Institute of Technology, Roorkee] [Felicity Estates Pvt. Ltd.] [email protected]
ABSTRACT
India is witnessing green building revolution. With rating schemes like LEED, IGBC and GRIHA in place and practice, building stakeholders are becoming more aware of sustainability issues. Issues under sustainability are clubbed under - Site, Energy, Water, Waste and materials and Environment. For most rating schemes across the world, Energy carries maximum number of points. High importance has been placed on energy because of current world energy scenario. Buildings are assuming critical role in energy dynamics. In India, building construction is taking place at a much higher rate than usual. Buildings consume tremendous amount of energy and this rate of energy consumption in buildings is also increasing. As per rating schemes, a comparison of energy consumption with base case or even an absolute figure of energy consumption is considered for ranking the energy efficiency of building. However, our traditional vernacular systems and passive features of building and design which impacted thermal comfort in response to climate are not accounted for in judgment criteria. At no place is the thermal comfort creation though spatial planning is emphasized, encouraged and rated. Therefore, in today’s time when relevance of energy efficiency is far larger than earlier, it becomes imperative that thermal comfort be achieved through spatial planning and efficiency of spatial planning be made judgment criteria for rating sustainability quotient of a building. Hence a common parameter needs to be evolved to quantify and judge achievement of thermal comfort through spatial planning and passive techniques in any building across the globe in context to the climate in which building is placed. This research is aimed at development of such parameter and its applicability in rating schemes. The paper details out the parameter, methodology to calculate it for any building and its relevance for building sustainability.
INTRODUCTION
India is a developing economy and building construction industry contributes substantially towards GDP, resource consumption, energy demand and pollution. (Tiwari P, 2001) Buildings therefore need to be constructed in a manner that they have least negative impact on the environment and maximize health and other benefits. (Arif M et. al, 2009) This fact has been duly recognized and that is the reason we have two successful Green Building Rating systems in our country – LEED-IGBC and GRIHA. (igbc.in, grihaindia.org)) Both these rating systems are more or less similar to many other existing systems in the world. A green building is evaluated based upon certain themes which are almost the same; while
30th INTERNATIONAL PLEA CONFERENCE 16-18 December 2014, CEPT University, Ahmedabad
1
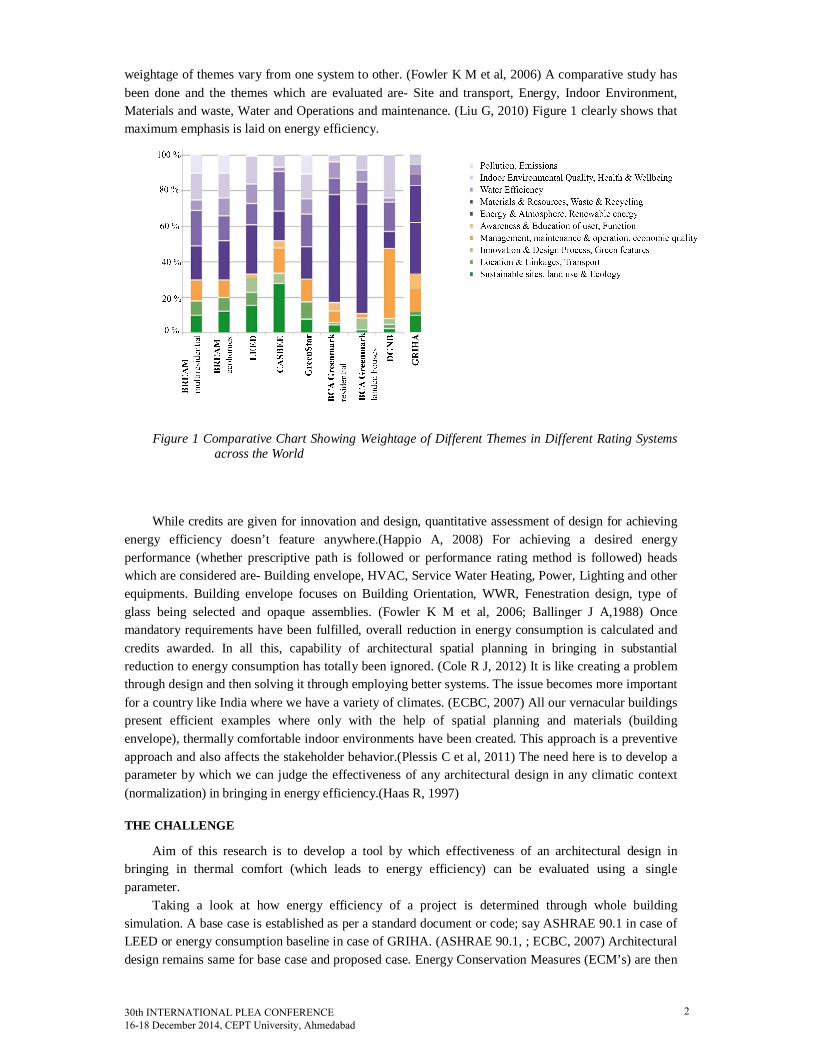
weightage of themes vary from one system to other. (Fowler K M et al, 2006) A comparative study has been done and the themes which are evaluated are- Site and transport, Energy, Indoor Environment, Materials and waste, Water and Operations and maintenance. (Liu G, 2010) Figure 1 clearly shows that maximum emphasis is laid on energy efficiency.
Figure 1 Comparative Chart Showing Weightage of Different Themes in Different Rating Systems across the World
While credits are given for innovation and design, quantitative assessment of design for achieving energy efficiency doesn’t feature anywhere.(Happio A, 2008) For achieving a desired energy performance (whether prescriptive path is followed or performance rating method is followed) heads which are considered are- Building envelope, HVAC, Service Water Heating, Power, Lighting and other equipments. Building envelope focuses on Building Orientation, WWR, Fenestration design, type of glass being selected and opaque assemblies. (Fowler K M et al, 2006; Ballinger J A,1988) Once mandatory requirements have been fulfilled, overall reduction in energy consumption is calculated and credits awarded. In all this, capability of architectural spatial planning in bringing in substantial reduction to energy consumption has totally been ignored. (Cole R J, 2012) It is like creating a problem through design and then solving it through employing better systems. The issue becomes more important for a country like India where we have a variety of climates. (ECBC, 2007) All our vernacular buildings present efficient examples where only with the help of spatial planning and materials (building envelope), thermally comfortable indoor environments have been created. This approach is a preventive approach and also affects the stakeholder behavior.(Plessis C et al, 2011) The need here is to develop a parameter by which we can judge the effectiveness of any architectural design in any climatic context (normalization) in bringing in energy efficiency.(Haas R, 1997)
THE CHALLENGE
Aim of this research is to develop a tool by which effectiveness of an architectural design in bringing in thermal comfort (which leads to energy efficiency) can be evaluated using a single parameter.
Taking a look at how energy efficiency of a project is determined through whole building simulation. A base case is established as per a standard document or code; say ASHRAE 90.1 in case of LEED or energy consumption baseline in case of GRIHA. (ASHRAE 90.1, ; ECBC, 2007) Architectural design remains same for base case and proposed case. Energy Conservation Measures (ECM’s) are then
30th INTERNATIONAL PLEA CONFERENCE 16-18 December 2014, CEPT University, Ahmedabad
2

added to proposed case (which mainly comprise of alternatives of building construction/ building envelope and mechanical systems) and performance of building is evaluated. In this entire process, potential of a better spatial design’s contribution towards energy efficiency is not being judged. Now if comparison of architectural design is to be done, what can be the base case? Since each building should respond to climate in which it is placed, the tool must have a tangible parameter through which effectiveness of architectural design can be evaluated.
SOLUTION FINDING
For evaluating effectiveness of architectural design towards creation of thermal comfort leading to energy efficiency, first solution that strikes is the use of thermal comfort indices for judging whether the design will be able to bring in thermal comfort.
Existing attempts
There are many thermal comfort indices which have been developed. To count a few popular ones- Effective Temperature, Corrected Effective Temperature, Operative Temperature, Equatorial Comfort Index, Bioclimatic Chart, Fanger’s PMV, Tropical Summer Index etc. (Koenigsberger et al, 1973). Each whole building simulation program is capable of generating thermal comfort data usually based upon PMV.But there are some problems with this assessment as it is not a clear indication of efficiency of architectural design-
1. The building design which is simulated includes all mechanical, electrical and other systems of thermal comfort creation. Thus a impact of only space design cannot be seen.
2. Even if simulation is intended to be done only for building (devoid of any mechanical/electrical installation), the results can be deceptive. For example in case of a building situated in a temperate climate like Bangalore; it would have more hours falling under comfort range as compared to a building (though efficiently designed) in an extreme climate like Jaisalmer.
Besides using thermal comfort indices, another factor called Degree Days is also being used. But Degree Days help to normalize the weather variation which are used for simulation rather than normalizing the building’s response to a climate.(Eto J H, 1988)
Thus the issue is of normalization of building’s response to weather because a robust green building rating system has to be applicable to any part of the world. Hence thermal comfort indices cannot be used directly for assessing the effectiveness of space design for green building rating. A lot of efforts towards weather normalization has been made world wide. The prime objective however was to normalize weather to normalize variations in weather. The PRInceton Scorekeeping Method (PRISM)’ which was initially created for calculating changes in energy consumption in a group of heated houses without cooling to individual houses (M. F. Fels et al. 1986), was developed to calculate energy consumption for individual house’s cooling and heating without integrating the two (C. L. Reynolds et al 1988). PRISM considers weather conditions as an important parameter while calculating energy consumption but does not regard architectural design as a parameter. Building Energy Analysis Consultant (BEACON) system was developed by Haberl et al (1988), which is capable of continuously monitoring and diagnosing the operation and maintenance problems identifying the causes of abnormal energy consumption. In most of the models it is considered that energy use in any other year is simply the product of the appropriate degree-days in this other year and the weather-invariant parameters (Joseph H. Eto, 1988). So, Joseph H. Eto (1988) developed a simulation model which accounts for temperature forecasting based on weather conditions of a decade. Radu Zmeureanu (1992) presented a new method for weather-normalization to be used for energy consumed from all types of energy sources and considers weather as a factor contributing to energy consumption but lacks consideration of architectural design.
None of the weather normalization techniques discuss the impact of architectural design on thermal
30th INTERNATIONAL PLEA CONFERENCE 16-18 December 2014, CEPT University, Ahmedabad
3

comfort normalized to the weather to which building is exposed. Hence a tool/parameter needs to be developed to evaluate thermal performance of building in response to climate it is being subjected to.
THE PARAMETER
The parameter uses Tropical Summer Index as the selected thermal comfort index for assessing thermal comfort creation. TSI has been chosen as the parameter is initially developed to respond to Indian subcontinent and TSI is the accepted thermal comfort index in National Building Code. The parameter is based upon the ability of building to convert uncomfortable hours outside in a selected climate into comfortable hours inside. Similar attempt (not to create a parameter but in approach) was made to compare passively designed office buildings in Germany. (Jens U et al, 2007) More is the number of such hours, more is the efficiency of design. Also the design has to be able to retain outdoor thermal comfort (when possible) inside the building.
Tropical Summer Index (Sharma M R, 1986; SP 41; SP 07)
TSI is defined as “the temperature of calm air, at 50 percent relative humidity which imparts the same thermal sensation as the given environment.” The 50 percent level of relative humidity is chosen for this index as it is a reasonable intermediate value for the prevailing humidity conditions.”
Mathematically, TSI (°C) is expressed as
841.006.2745.0308.0 VTTTSI gw (1) Tw = Wet Bulb temperature in ° C, Tg = Globe Temperature in ° C, V = Air Velocity in m/s For indoors, Globe temperature can be replaced with Dry-Bulb temperature. It is because Globe
temperature takes into account Dry-Bulb temperature as well as effect of direct radiation also. Thus in the absence of radiation, globe temperature is almost the same as DBT. The environment was found comfortable between 25 to 30 TSI. It was tolerable up to 34 and down to 19. Lesser than 19, it was considered as too cold and beyond 34 it was considered as too hot. The TSI decreases further with increase in air velocity. (Table 1)
Table 1Decrease in TSI with Increase in Air Velocity Air Velocity m/s Decrease in TSI in ° C
0.5 1.4 1.0 2.0 1.5 2.5 2.0 2.8 2.5 3.2
THE PARAMETER – DUHOI
DUHOI – Difference in Uncomfortable Hours Outside vs Inside. As the title clearly states- parameter is the difference of uncomfortable hours outside against inside in a given climate. The parameter compares thermal comfort achieved inside the building through design and construction to climate outside for all hours in a year. Each building design will have one single value for DUHOI. However DUHOI can be calculated for extreme seasons like summers in hot-dry climate, winters in cold climates depending upon the criticality. Calculation of DUHOI is demonstrated using analysis of hourly data obtained through whole building simulation of a traditional haveli residence in Sikar district of Shekhawati, Rajasthan, India (AgrawalA, 2006). Figure 2 shows typical ground floor plan of the case with open to sky courtyard in the centre and double layered rooms all around. All windows and walls are shaded by sun shades and thick walls are made up of brick set in lime mortar. Haveli is simulated for one year and hourly data (Dry Bulb temperature, Relative Humidity and air velocity inside) thus obtained is used to calculate TSI for all habitable spaces in the Haveli. Air velocity inside could not be obtained through simulation, therefore excel sheet was prepared as per NBC 2007 manually which were further
30th INTERNATIONAL PLEA CONFERENCE 16-18 December 2014, CEPT University, Ahmedabad
4

used to calculate TSI. After this DUHOI is calculated in the following manner-
Figure 2 Upper Ground Floor Plan of a typical and Design Builder snapshot of modeled Haveli (Shaded areas are the ones which have ben simulated for calculations)
Methodology
DUHOI is calculated in a step wise manner as follows- 1. Calculate TSI for all habitable spaces and outside weather for entire year and all hours as per the
formula of TSI stated above. (Table 2 – Because of limitation of space, calculations for only seven out of nineteen spaces have been demonstrated here)
2. Calculate the difference brought in TSI through design to each space. (When TSI inside is brought towards comfort it is counted as positive; if it is taken away from comfort it is taken as negative; based upon the comfort limits of TSI i.e. 25-30). (Table 3)
3. Overall difference brought in TSI (adding up positive and negative) is then averaged for the number of habitable spaces evaluated and number of hours for which evaluation is done. In case when TSI outside is already in comfort range say 29 and indoor TSI value also falls within comfort range say 25, such values will not be considered for calculations. (Table 3)
Table 2. Table showing Consolidated Thermal Comfort Data (TSI values) of Habitable Spaces in
Simulated Haveli for few hours on one Typical Summer Day and TSI values Outside Time Baithak Rasodha Chaughar
a Pauli Sal 1 Sal T TSI o
0:00 31.8 32.1 32.1 32.5 31.1 32.6 34.3 1:00 31.6 31.9 31.8 32.2 30.9 32.3 33.6 2:00 31.3 31.6 31.5 32.0 30.6 32.1 32.8
3:00 30.9 31.3 31.2 31.7 30.4 31.8 31.0 4:00 30.7 31.1 30.9 31.5 30.3 31.7 30.2 5:00 30.4 30.9 30.7 31.3 30.1 31.5 29.4 6:00 30.5 31.0 30.8 31.4 30.3 31.6 30.4 7:00 30.9 31.3 31.2 31.7 30.6 32.0 31.2
Table continues for 8760 hours.
N
30th INTERNATIONAL PLEA CONFERENCE 16-18 December 2014, CEPT University, Ahmedabad
5

Table 3. Table showing Difference of TSI Outdoors Vs Indoors for Uncomfortable Hours Outside
Time Baithak Rasodha Chaughara Pauli Sal 1 Sal T
0:00 2.5 2.2 2.2 1.8 3.2 1.7 1:00 2.0 1.7 1.8 1.4 2.7 1.3 2:00 1.5 1.2 1.3 0.8 2.2 0.7 3:00 0.1 -0.3 -0.2 -0.7 0.6 -0.8 4:00 -0.5 -0.9 -0.7 -1.3 -0.1 -1.5 5:00 -1.0 -1.5 -1.3 -1.9 -0.7 -2.1 6:00 0.7 0.2 0.4 -0.2 0.9 -0.4 7:00 0.3 -0.1 0.0 -0.5 0.6 -0.8
42.0 36.1 36.4 27.7 59.4 24.7 Table continues for 8760 hours.
DUHOI = ( ∑ dT) ÷ N*h Where ∑ dT = Summation of difference in TSI values of all habitable spaces to TSI Outside N = Number of Habitable Spaces Analyzed H = Number of Hours
Conditions for calculation of DUHOI
Based upon logics and rationale, certain conditions have been set to calculate DUHOI. 1. Only habitable spaces are accounted for in this calculation. Service and ancillary areas
such as circulation, toilets, machine rooms, kitchens etc are not included while calculating TSI and DUHOI.
2. If accessible open spaces have been provided in the building and schedule of activities suggests use of such a space during certain periods of the day, negative TSI difference values for those periods shall not be included in overall calculation of DUHOI. This is done in order to ensure that open spaces have been appropriately used. However for this option to be available, schedule has to be appropriately configured before simulating the building for its thermal comfort performance.
3. Building is assumed to be naturally ventilated without presence of any mechanical/electrical system in place. Natural ventilation schedule as perthe practice of opening windows during summer nights and winter day has been included.
4. Energy consumption for lighting and heat gain due to lighting is neglected for calculation of thermal comfort.
5. In case of large building complexes, such as campuses, mutual shading and local wind pattern of building complex will be accounted for in simulation.
Graph 1 plots hourly thermal comfort data for a Building. It can be seen that building is able to bring about positive changes in environmental conditions. Following the steps mentioned above to calculate DUHOI, difference brought is calculated using formula and the final value of DUHOI for the period simulated is calculated to be 1.41. This implies that building is able to convert uncomfortable hours into comfortable hours inside by 1.41 TSI on an average.
To know the performance of building in different seasons, seasonal DUHOI can also be found out and it can be ascertained that improvements are needed to bring down the temperature or to heat up a space. For the same building simulated here, DUHOI (summer) is 1.99 while DUHOI (Winter) is 1.32. This gives a clear picture that this building performs better in summers as compared to winter.
30th INTERNATIONAL PLEA CONFERENCE 16-18 December 2014, CEPT University, Ahmedabad
6

Graph 1. Graph showing Consolidated Thermal Comfort Data (TSI values) of selected Habitable Spaces in Simulated Haveli for an Year (excluding 3 months of March, half of September, October and Half of November) and TSI values for the same Outside
Advantages
DUHOI is a robust parameter which can be applied to any building in any climate and it has many advantages-
1. The need for a virtual base case has been eliminated. Weather of a place where building is situated acts as the reference and building is supposed to respond to weather only.
2. In this manner, any building situated anywhere in the world can be compared without making comparison of scale of building, typology and systems involved.
Application to Green Building Rating Schemes
Before DUHOI is included in rating schemes as a credit or a prerequisite, extensive base work needs to be carried out. For all climates of India and world, finest examples of passive designing (traditional and contemporary) can be picked up and DUHOI can be calculated for them. Based on this an acceptable range can be set for each climate and credits can be awarded. This would ensure that any building which is intended to be constructed as green building must have an architectural design which responds to climate of the place unlike current scenario. This way, newer green buildings based on DUHOI parameter will look local and respond appropriately to climate.
CONCLUSION
DUHOI is a robust and universal parameter which can be applied to green building rating systems. This would help in utilizing full potential of architects in making green buildings which would respond to climate as the first step towards building green. This move will have substantial effect in reducing energy consumption by buildings throughout the world.
GLOSSARY OF HINDI WORDS
Haveli – Traditional courtyard type residence Baithak - Living room Chaughara - Largest bedroom in the corner of house Rasodha - Kitchen Pauli - Transition space from outer court to inner court Sal - Bedroom/ Room
REFERENCES
30th INTERNATIONAL PLEA CONFERENCE 16-18 December 2014, CEPT University, Ahmedabad
7

Agrawal Avlokita, (2006), Shekhawati: urbanism in the semi-desert of India- A climatic study, 22nd Conference on Passive and Low Energy Architecture, 6th-8th September 2006, Geneva, Switzerland.
Appu Haapio, Pertti Viitaniemi (2008), A critical review of building environmental assessment tools, Environmental Impact Assessment Review 28: 469–482;
Arif, M., Egbu, C., Haleem, A., Ebohon, J., and Khalfan, M. (2009). ”Green Construction in India: Gaining a Deeper Understanding”. J. Archit. Eng., 15(1): 10–13;
Beaureau of Energy Efficiency, Energy Conservation Building Code, 2007; CASBEE for New Construction Technical Manual, March 2004 Edition and SoftwareCD 2004 Edition
CASBEE Web Site (in English). 2006. http://www.ibec.or.jp/CASBEE/english/ Chrisna du Plessis and Raymond J.Cole (2011), Motivating change: shifting the paradigm, Building
Research & Information (2011) 39(5), 436–449; C. L. Reynolds and M. F. Fels (1988), “Reliability Criteria for Weather Adjustment of Energy Billing
Data,” in Proceedings of the 1988 ACEEE Summer Study on Energy Eficiency in Buildings, American Council for an Energy-Efficient Economy, Vol. 10, pp. 10.236-10.251;
C. L. Reynolds, P. Komor, and M. Fels (1990), “Using Monthly Billing Data to Find Energy Efficiency Opportunities in Small Commercial Buildings,” in Proceedings of the ACEEE 1990 Summer Study on Energy Eficiency in Buildings, American Council for an Energy-Efficient Economy, Vol. 10, pp. 10.221-10.232;
Cole R J (2012), Transitioning from Green to Regenerative Design, Building Research & Information (2012) 40(1), 39–53;
Energy and Resources Institute. November 24, 2005. TERI-GRIHA (TERI–GreenRating for Integrated Habitat Assessment).
Fowler K M and Rauch E M (2006), Sustainable Buildings Rating System, PNNL 15858 Green Building Council Australia (2006) Green Star.http://www.gbcaus.org/greenstar/page.asp?id=117 Jens U, Pfafferott, Sebastian Herkel, Doreen E. Kalz, Andreas Zeuschner (2007), Comparison of low-
energy office buildings in summer using different thermal comfort criteria, Energy and Buildings 39: 750–757;
John A. Ballinger (1988), The 5 Star Design Rating System for Thermally Efficient, Comfortable Housing in Australia, Energy and Buildings, 11: 65 – 72;
Joseph H. Eto (1988), “On using degree-days to account for the effects of weather on annual energy use in office buildings”, Energy and Buildings, 12: 113 – 127;
J. S. Haberl and E. J. Vajda (1988), “Use of Metered Data Analysis to Improve Building Operation and Maintenance: Early Results from Two Federal Complexes,” in Proceedings of the 1988 ACEEE Summer Study on Energy Eficiency in Buildings, American Council for an Energy-Efficient Economy, Vol. 3: 3.98-3.111;
J. S. Haberl, L. Smith, and J. Kreider (1988), “Metered Data Analysis and Knowledge Based Methods that Reduce HVAC Operational and Maintenance Problems,” in Proceedings of the Fifth Annual Symposium on Improving Building Energy Eficiency in Hot and Humid Climates, Texas A & M, 65-71;
J. S. Haberl and P. S. Komor (1990), ASHRAE J132, 26; Koenignberger, Ingersoll, Mayhew and Szokolay (1973), Manual for Tropical Housing and building,
Orient Longman Ltd; Liu G, Nolte I, Potapova A, Michel S and Ruckert K (2010), Longlife Comparison of Worldwide
Certification Systems for Sustainable Buildings, SET 2010-9th International Conference on Sustainable Energy Technologies;
M. F. Fels, C. L. Reynolds, and D. 0. Stram (1986), “PRISMONPC. Documentation for Heating-only or Cooling-only Estimation Program: Version 4.0,” Center for Energy and Environmental Studies, Princeton University, Princeton, NJ;
Radu Zmeureanu (1992), “A New Method For Evaluating The Normalized Energy Consumption In Office Buildings” Energy Vol. 17, No. 3: 235-246;
Reinhard Haas, 1997, Energy efficiency indicators in the residential sector, Energy Policy, Vol. 25, Nos. 7-9: 789-802;
Sharma M R and Ali S., 1986, Tropical Summer Index- A study of Thermal Comfort of Indian Subjects, Building and Environment, 21(1): 11-24;
SP 7, 2005, National Building Code of India, Bureau of Indian Standards; SP 41, 2001, Handbook on Functional Requirements of Buildings other than Industrial Buildings,
Bureau of Indian Standards; Tiwari P (2001), Energy efficiency and building construction in India, Building and Environment 36:
1127–1135;
30th INTERNATIONAL PLEA CONFERENCE 16-18 December 2014, CEPT University, Ahmedabad
8