Development of simple models to evaluate the role of the ... of Mekong River (2) ・Asian Monsoon Æ...
39
Development of simple models to evaluate Development of simple models to evaluate the role of the the role of the Tonle Tonle Sap Lake Sap Lake as a flood retarding lake as a flood retarding lake for the Mekong River for the Mekong River Kazuhiko FUKAMI Kazuhiko FUKAMI and Junichi YOSHITANI and Junichi YOSHITANI Hydrologic Engineering Research Team, Hydraulic Engineering Research Group, Public Works Research Institute, Japan Contact: [email protected]
Transcript of Development of simple models to evaluate the role of the ... of Mekong River (2) ・Asian Monsoon Æ...

Development of simple models to evaluate Development of simple models to evaluate the role of the the role of the TonleTonle Sap LakeSap Lake
as a flood retarding lakeas a flood retarding lakefor the Mekong Riverfor the Mekong River
Kazuhiko FUKAMIKazuhiko FUKAMIand Junichi YOSHITANIand Junichi YOSHITANI
Hydrologic Engineering Research Team,Hydraulic Engineering Research Group,Public Works Research Institute, Japan
Contact: [email protected]

Outline of Mekong River (1)• Watershed area: 795,000km2
(21st in the world)
• Length:4,800km (12nd)• Average discharge:
15,000m3/s (8th)• Estimated contribution to
discharge:– China:16%, Myammar:2%,
Laos:35%h il d b di
ChinaChina
MyanmarMyanmar VietnamVietnam
LaosLaos
CambodiaCambodia
ThailandThailand
Outline of Mekong River (2)・Asian Monsoon Seasonal flood
Flood retardingby Tonle Sap Lake
・agricultrue, fishery ・biological diversity・land use, etc.
Living with floods
PP_Port Water Level (98-01 )PP_Port Water Level (98-01 )PP_Port Water Level (98-01 )PP_Port Water Level (98-01 )
0000
1111
2222
3333
4444
5555
6666
7777
8888
9999
10101010
11111111
12121212
13131313
14141414
15151515
16161616
17171717
1/11/11/11/1 2/12/12/12/1 3/13/13/13/1 4/14/14/14/1 5/15/15/15/1 6/16/16/16/1 7/17/17/17/1 8/18/18/18/1 9/19/19/19/1 10/110/110/110/1 11/111/111/111/1 12/112/112/112/1
wate
r le
ve
l(m
)w
ate
r le
ve
l(m
)w
ate
r le
ve
l(m
)w
ate
r le
ve
l(m
)
1998
1999
2000
2001
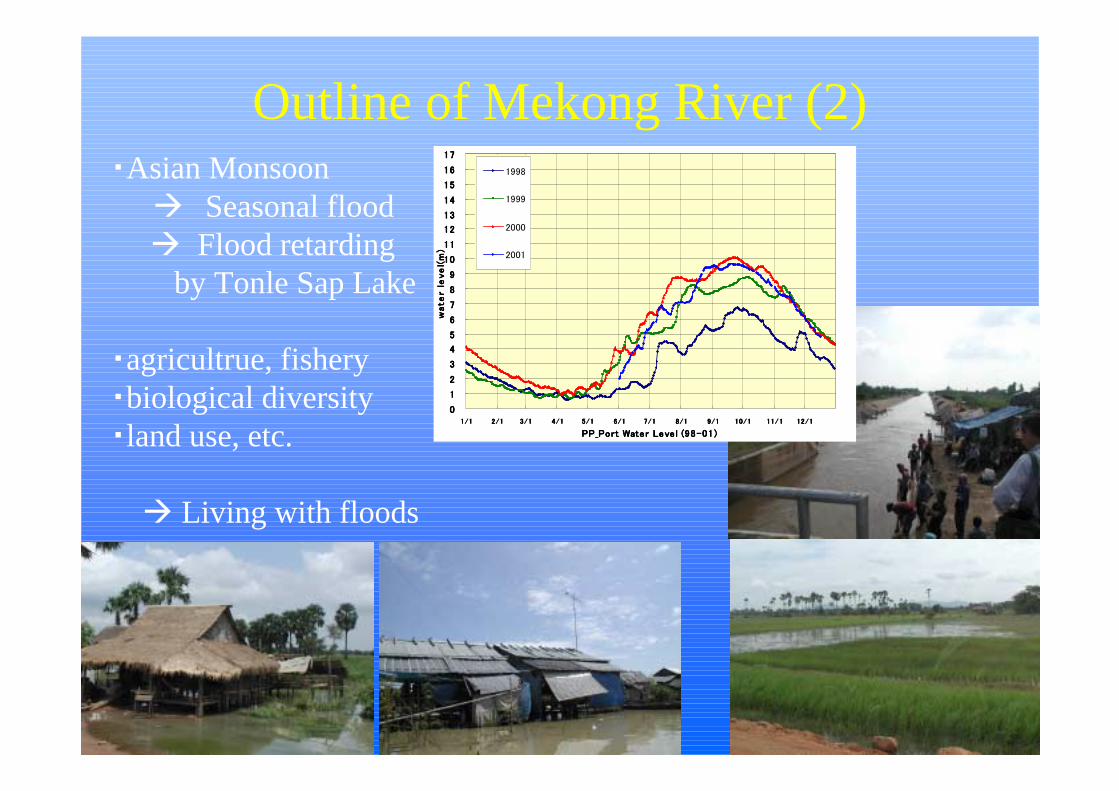
Historical estimation of water budget around the Tonle Sap Lake Watershed=
by Carbonnel & Guiscafire (1962-63)
OutflowOutflow 729729
Reverse flowReverse flow 450450
Mekong River~~4,0004,000
Tonle Sap Lake
Evap. 104 Precip. 139
Inflow fromwatersheds 243
Tonle Sap Lake Watershed67,000km2
Unit:0.1 billion m3
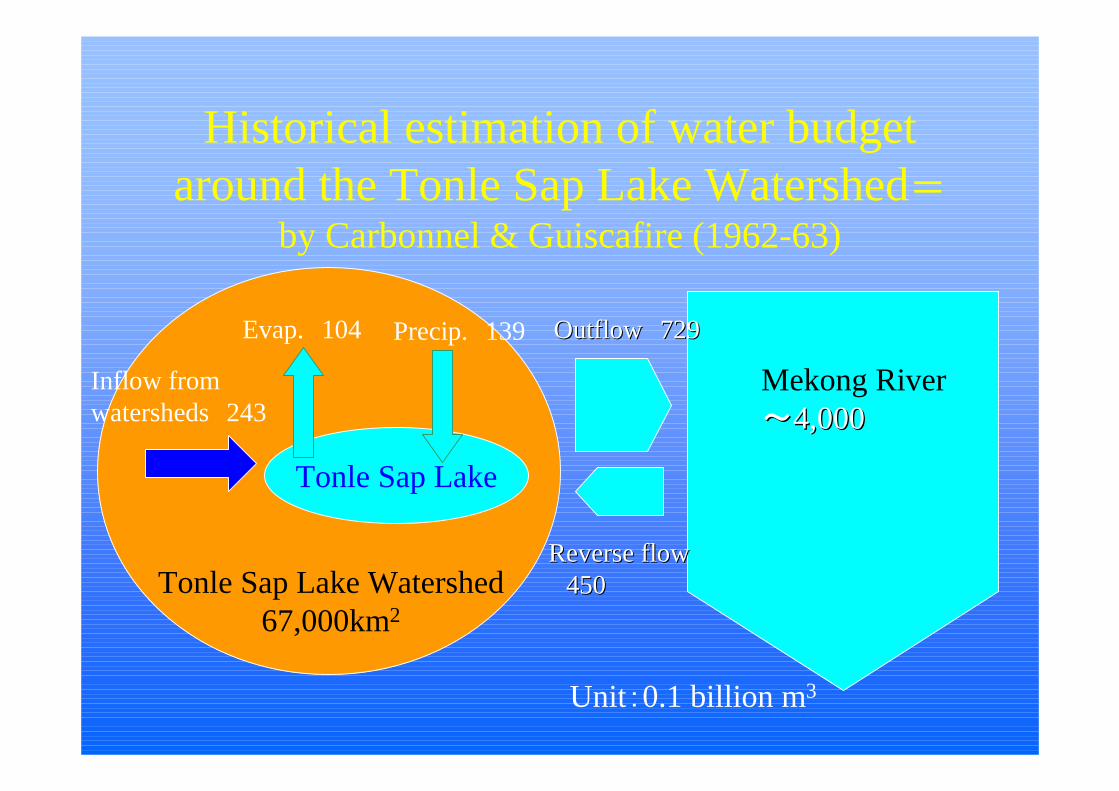
Amount of damage and number of dead(Committee on Hydraulics, Japan Society of Civil Engineers, 2001)
0
100
200
300
400
500
1 3 5 7 9
11
13
15 17 19 21
23
Total damage(10 billion VND)
Casualties
78 84 91 94 95 96 2000More floods in 2001
Recently, flood damage has increased.
Why?
Climage change? Basin development? Change of Tonle Sap Lake?
Deforestation? etc…
This study focuses on the role of the Tonle Sap Lakeas a flood retarding pond for the Mekong River

Background
• Recently, the hydrologic characteristics of flood and damage caused by them seems to be changed in the Lower Mekong. Many disputes have been made, but quantitative discussions have been very limited, because of the lack of historical meteorological and hydrologic database.
• In order to confirm any relationship between any possible factor and flood damage and/or characteristics, we need the long historical database for both of them.
• In order to understand the characteristics of flood and drought of the Mekong River, it’s indispensable to quantitatively grasp the Tonle-Sap-Lake’s function of flood control, including it’s annual variation.
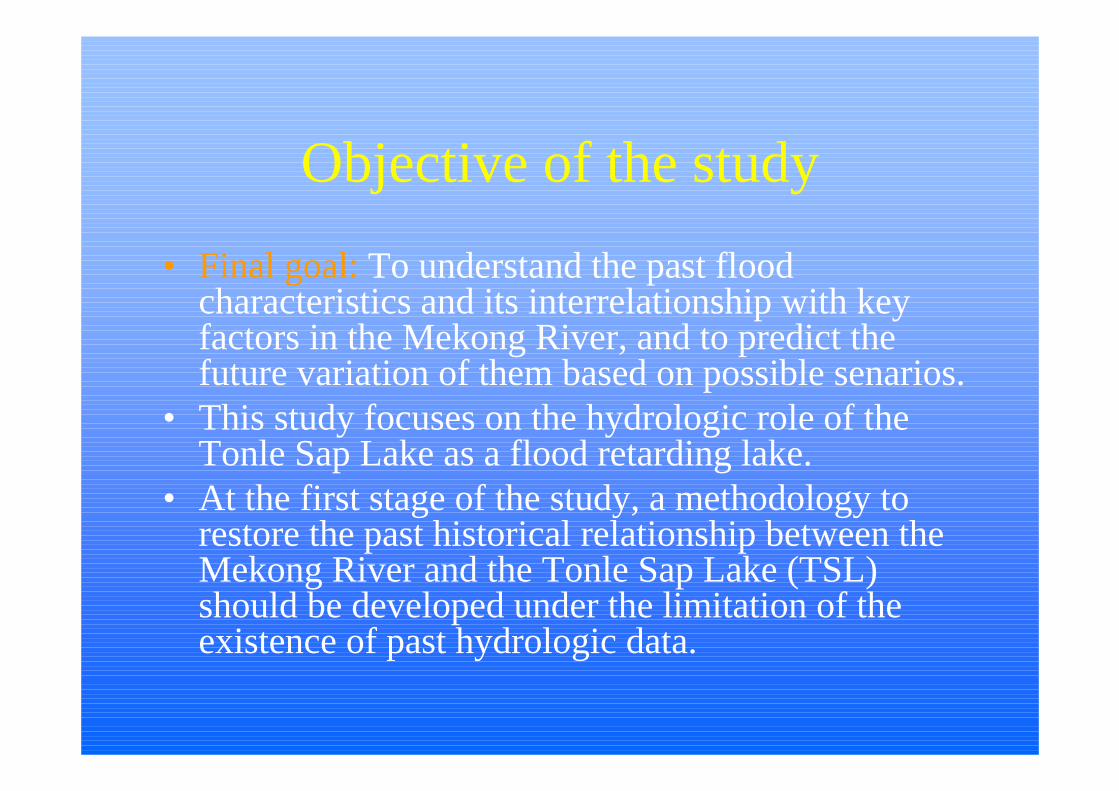
Objective of the study• Final goal: To understand the past flood
characteristics and its interrelationship with key factors in the Mekong River, and to predict the future variation of them based on possible senarios.
• This study focuses on the hydrologic role of the Tonle Sap Lake as a flood retarding lake.
• At the first stage of the study, a methodology to restore the past historical relationship between the Mekong River and the Tonle Sap Lake (TSL) should be developed under the limitation of the existence of past hydrologic data.
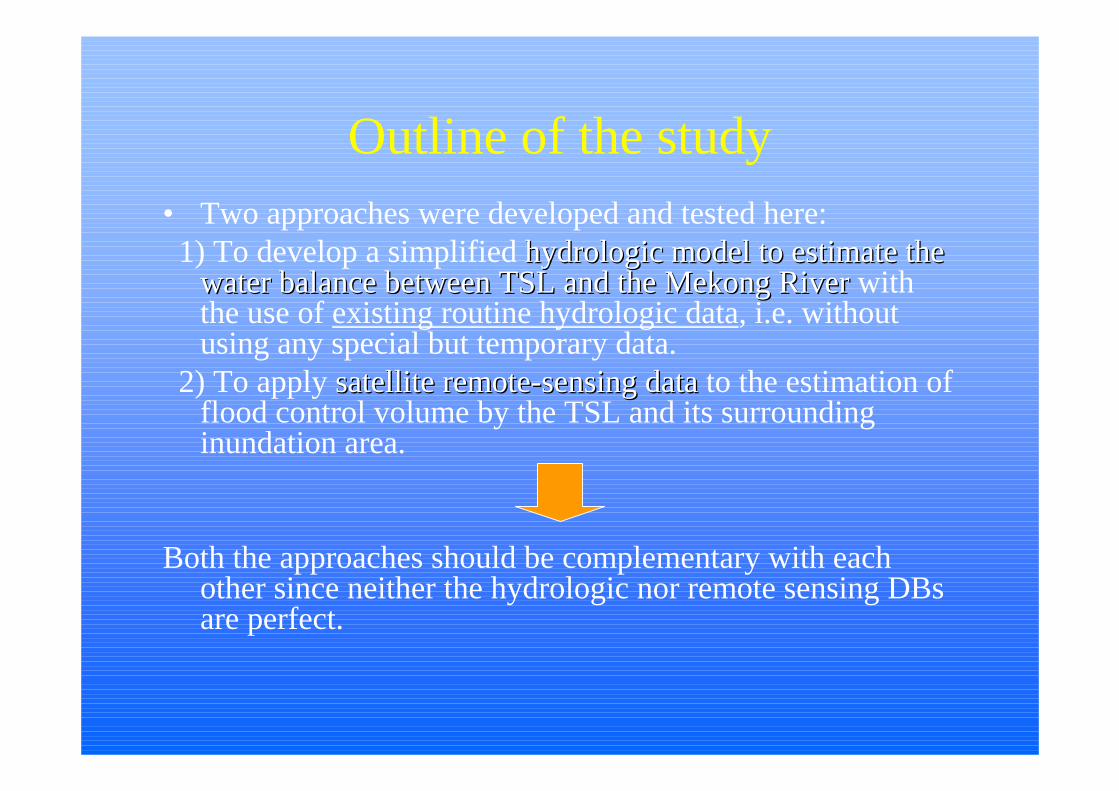
Outline of the study• Two approaches were developed and tested here:1) To develop a simplified hydrologic model to estimate the hydrologic model to estimate the
water balance between TSL and the Mekong Riverwater balance between TSL and the Mekong River with the use of existing routine hydrologic data, i.e. without using any special but temporary data.
2) To apply satellite remotesatellite remote--sensing datasensing data to the estimation of flood control volume by the TSL and its surrounding inundation area.
Both the approaches should be complementary with each other since neither the hydrologic nor remote sensing DBsare perfect.
1. Development of a simplified hydrologic model to estimate the water balance between TSL and the Mekong River with available ground-based hydrologic observations

Study area = zone 1 (TSLV project)
Kompong Chhnang
Prek Kdam
SOGREAH社の調査による社の調査による社の調査による社の調査による H‐‐‐‐Vの対象範囲の対象範囲の対象範囲の対象範囲((((想定)想定)想定)想定)
メコン委員会の作成したメコン委員会の作成したメコン委員会の作成したメコン委員会の作成した H‐‐‐‐Vの対象範囲の対象範囲の対象範囲の対象範囲
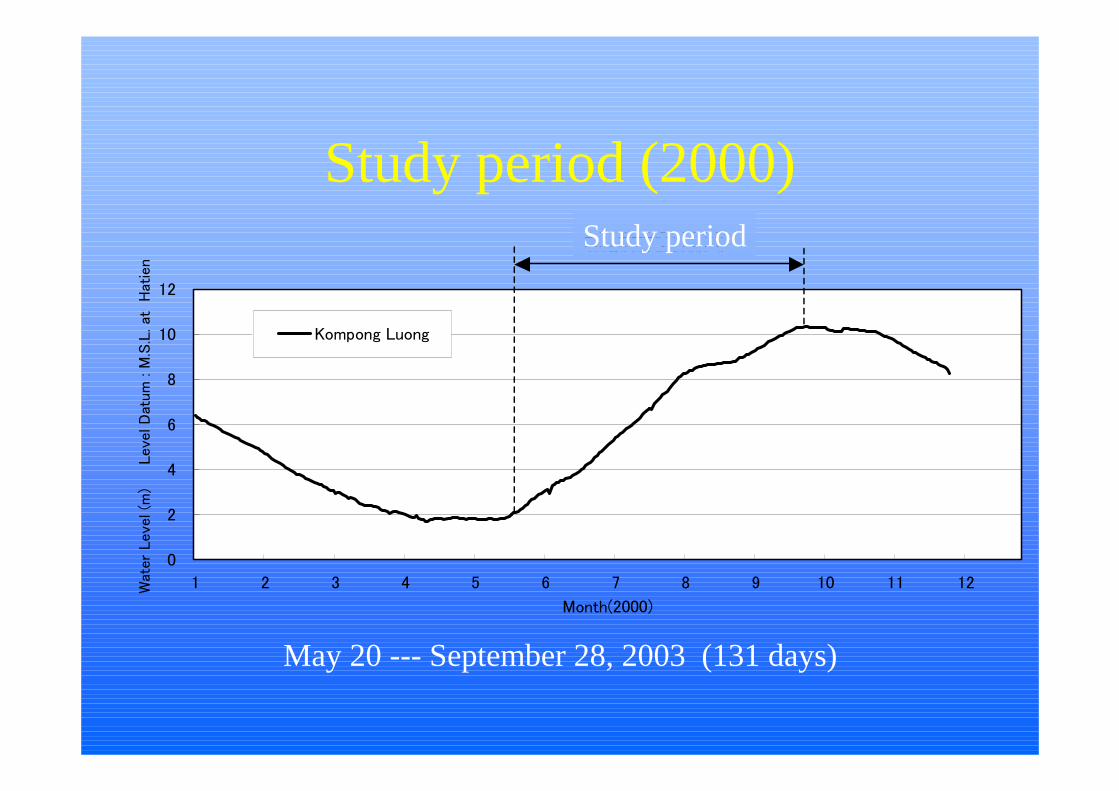
Study period (2000)
0
2
4
6
8
10
12
1 2 3 4 5 6 7 8 9 10 11 12
Month(2000)
Wat
er
Leve
l (m
) Leve
l D
atum
: M
.S.L
. at
H
atie
n
Kompong Luong
検討対象期間
May 20 --- September 28, 2003 (131 days)
Study period
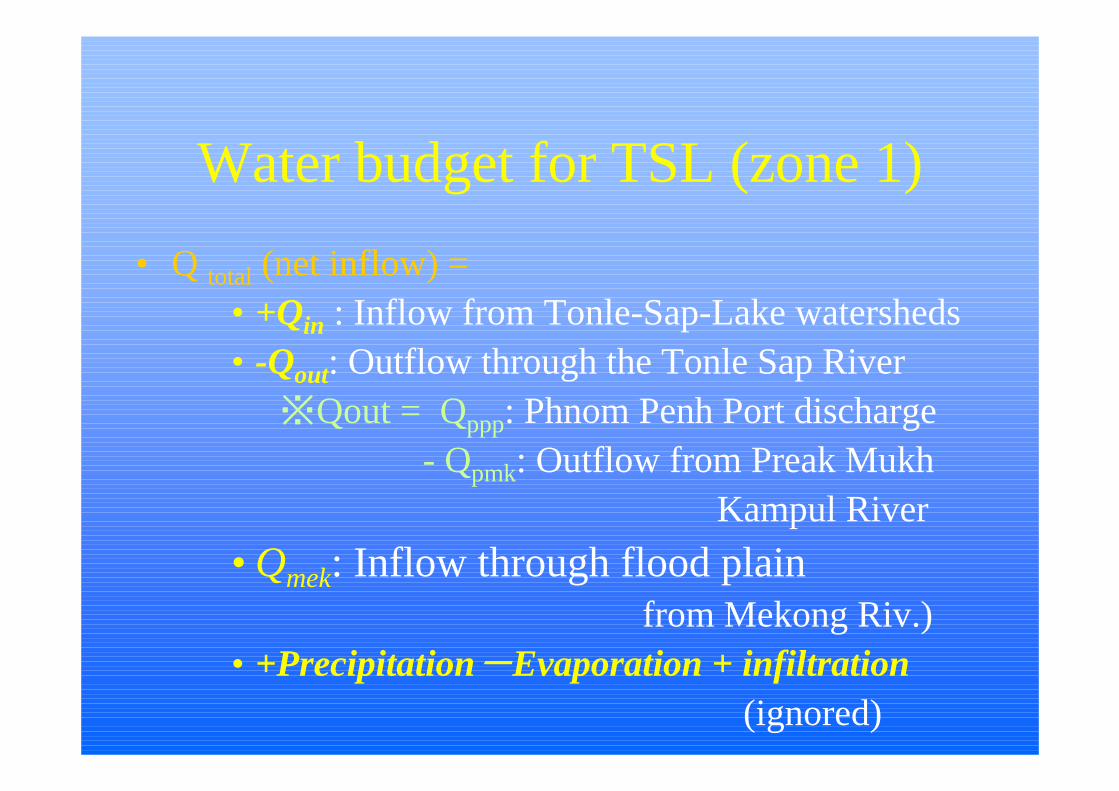
Water budget for TSL (zone 1)• Q total (net inflow) =
• +Qin : Inflow from Tonle-Sap-Lake watersheds• -Qout: Outflow through the Tonle Sap River
※Qout = Qppp: Phnom Penh Port discharge- Qpmk: Outflow from Preak Mukh
Kampul River• Qmek: Inflow through flood plain
from Mekong Riv.)• +Precipitation----Evaporation + infiltration
(ignored)

Water level stations along the Tonle Sap Lake & River
KompongLuong
PrekKdam Phnom Penh
Port
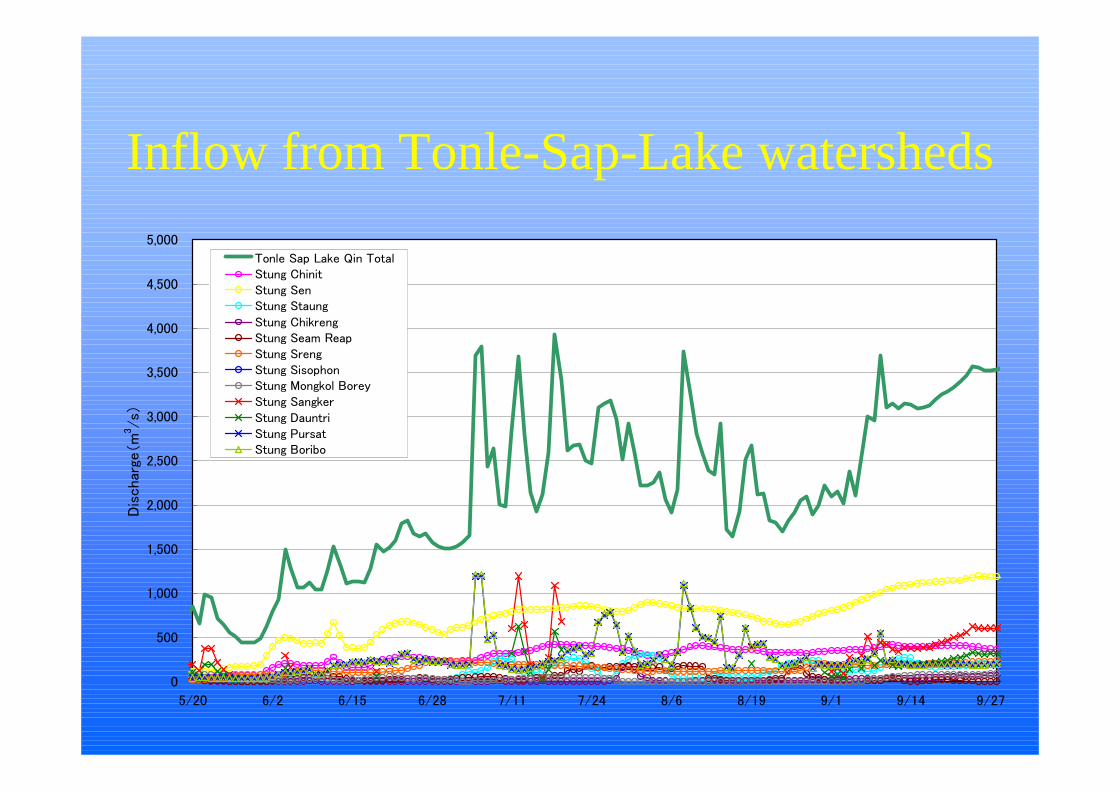
Inflow from Tonle-Sap-Lake watersheds
0
500
1,000
1,500
2,000
2,500
3,000
3,500
4,000
4,500
5,000
5/20 6/2 6/15 6/28 7/11 7/24 8/6 8/19 9/1 9/14 9/27
Dis
char
ge(m
3/s)
Tonle Sap Lake Qin TotalStung ChinitStung SenStung StaungStung ChikrengStung Seam ReapStung SrengStung SisophonStung Mongkol BoreyStung SangkerStung DauntriStung PursatStung Boribo
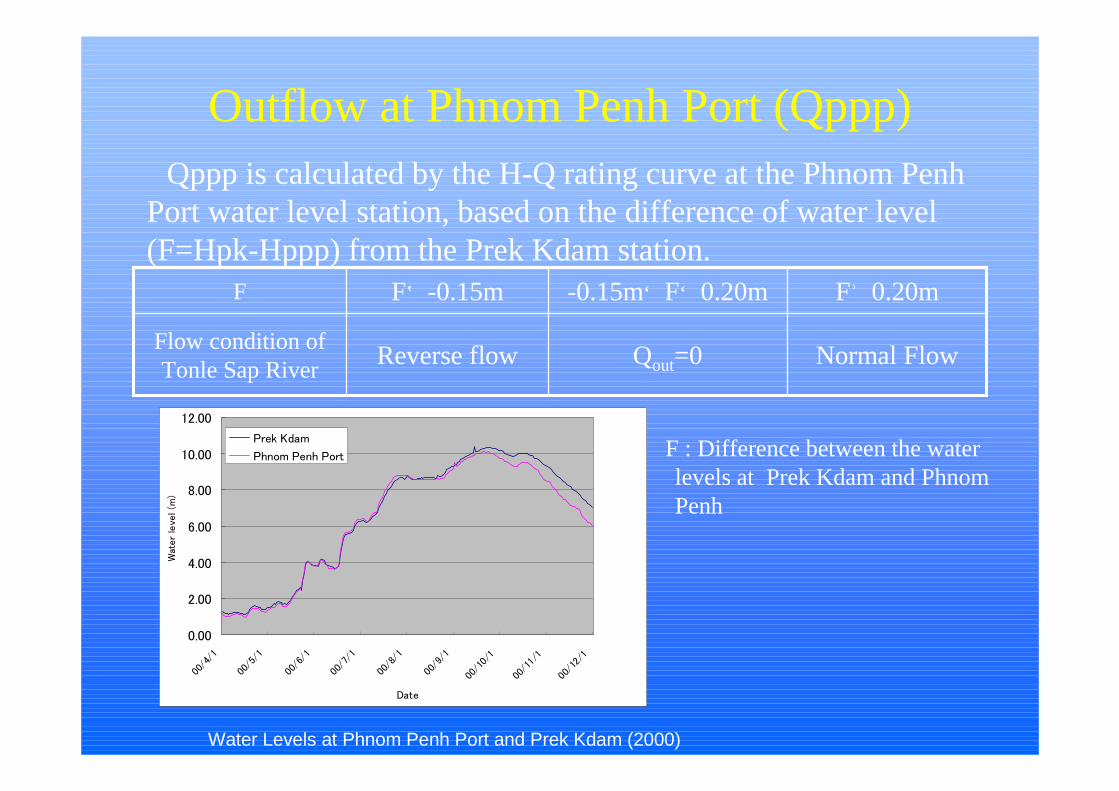
Normal FlowQout=0Reverse flowFlow condition of Tonle Sap River
F≧0.20m-0.15m<F<0.20mF≦-0.15mF
F : Difference between the water levels at Prek Kdam and Phnom Penh
Qppp is calculated by the H-Q rating curve at the Phnom Penh Port water level station, based on the difference of water level(F=Hpk-Hppp) from the Prek Kdam station.
Water Levels at Phnom Penh Port and Prek Kdam (2000)
Outflow at Phnom Penh Port (Qppp)
0.00
2.00
4.00
6.00
8.00
10.00
12.00
00/4
/1
00/5
/1
00/6
/1
00/7
/1
00/8
/1
00/9
/1
00/1
0/1
00/1
1/1
00/1
2/1
Date
Wat
er
leve
l (m
)
Prek Kdam
Phnom Penh Port
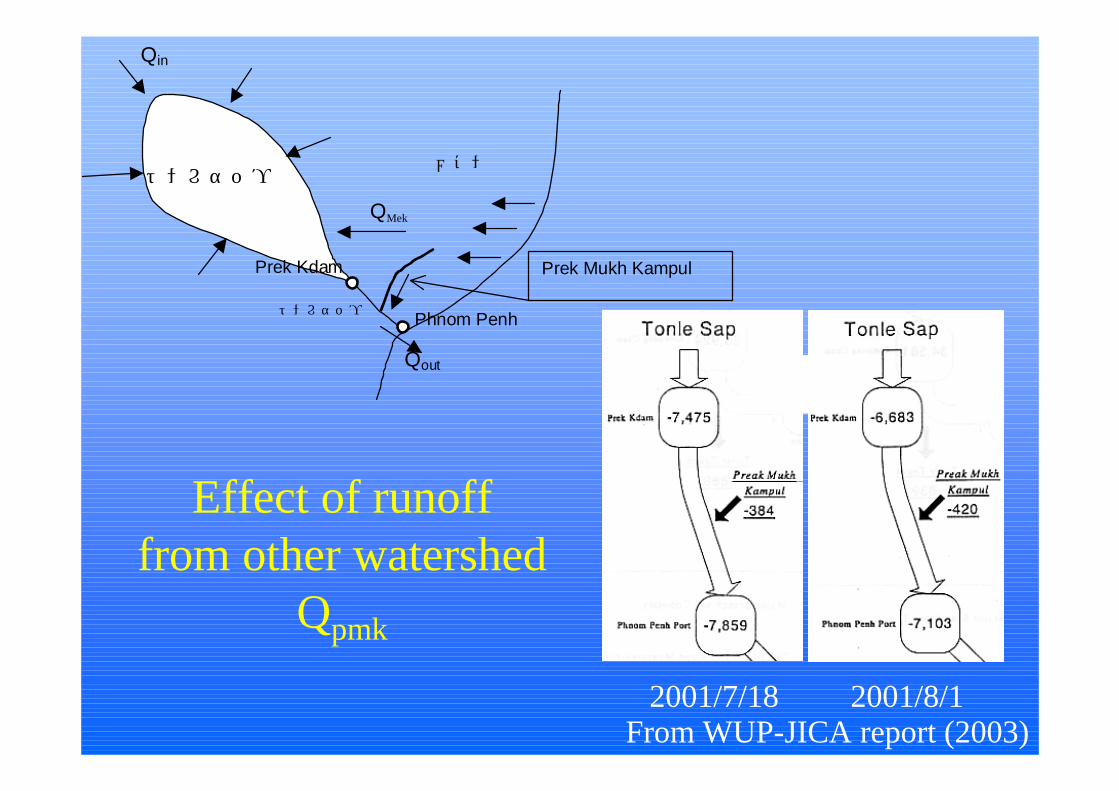
Effect of runoff from other watershed
Qpmk
トンレサップ湖
Qin
Qout
QMek
Prek Kdam
Phnom Penh
メコン川本川
トンレサップ川
Prek Mukh Kampul川
2001/7/18 2001/8/1From WUP-JICA report (2003)
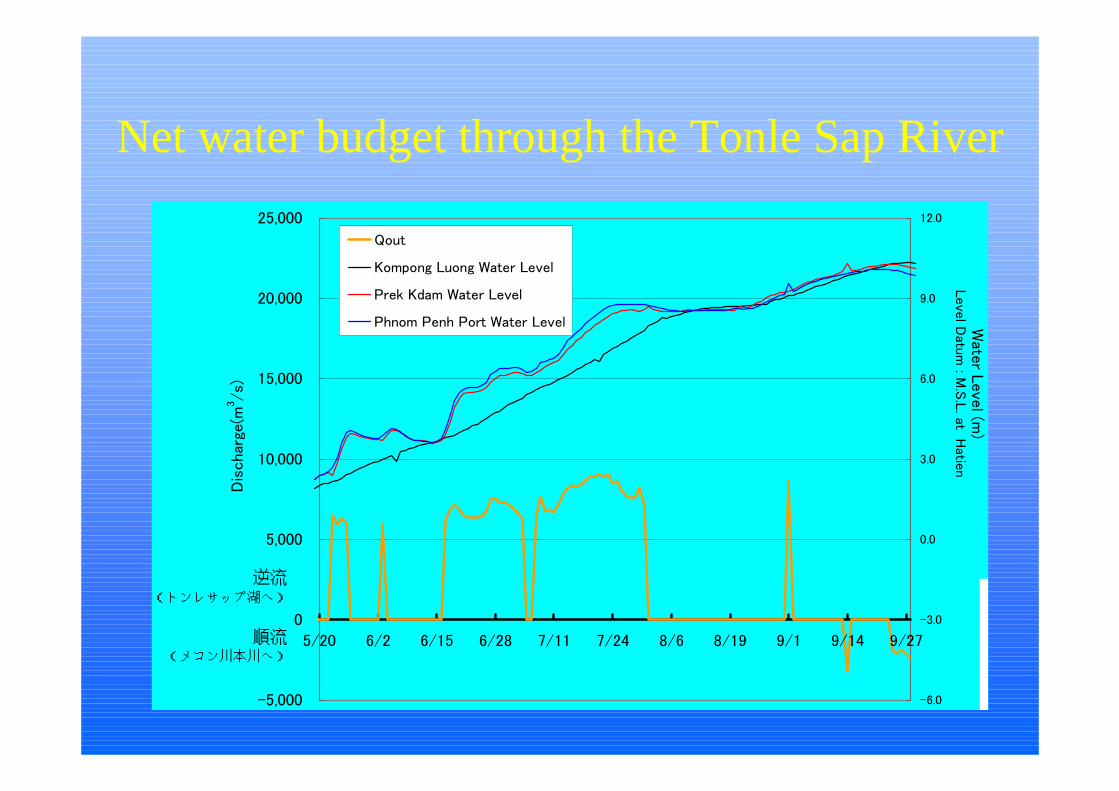
Net water budget through the Tonle Sap River
逆流(トンレサップ湖へ)
順流(メコン川本川へ)
-5,000
0
5,000
10,000
15,000
20,000
25,000
5/20 6/2 6/15 6/28 7/11 7/24 8/6 8/19 9/1 9/14 9/27
Wate
r Leve
l (m)
Leve
l Datu
m : M
.S.L
. at Hatie
n
-6.0
-3.0
0.0
3.0
6.0
9.0
12.0
Dis
char
ge(m
3/s)
Qout
Kompong Luong Water Level
Prek Kdam Water Level
Phnom Penh Port Water Level
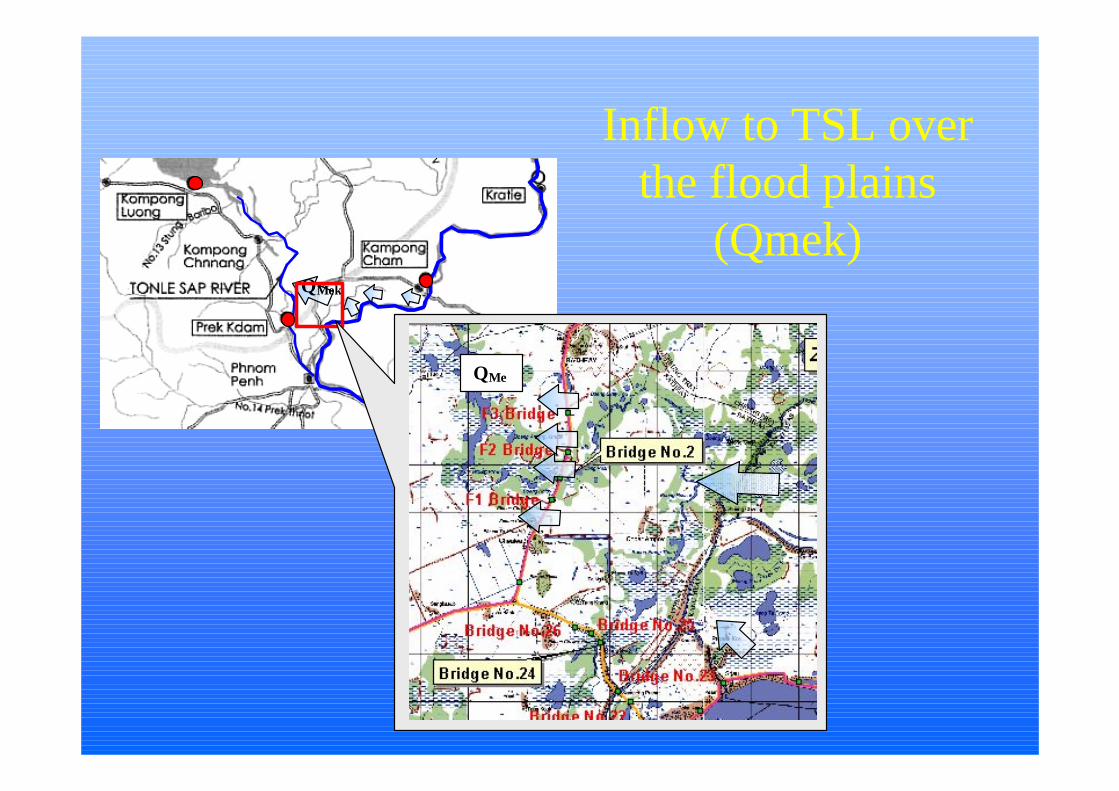
Inflow to TSL over the flood plains
(Qmek)QMek
QMe
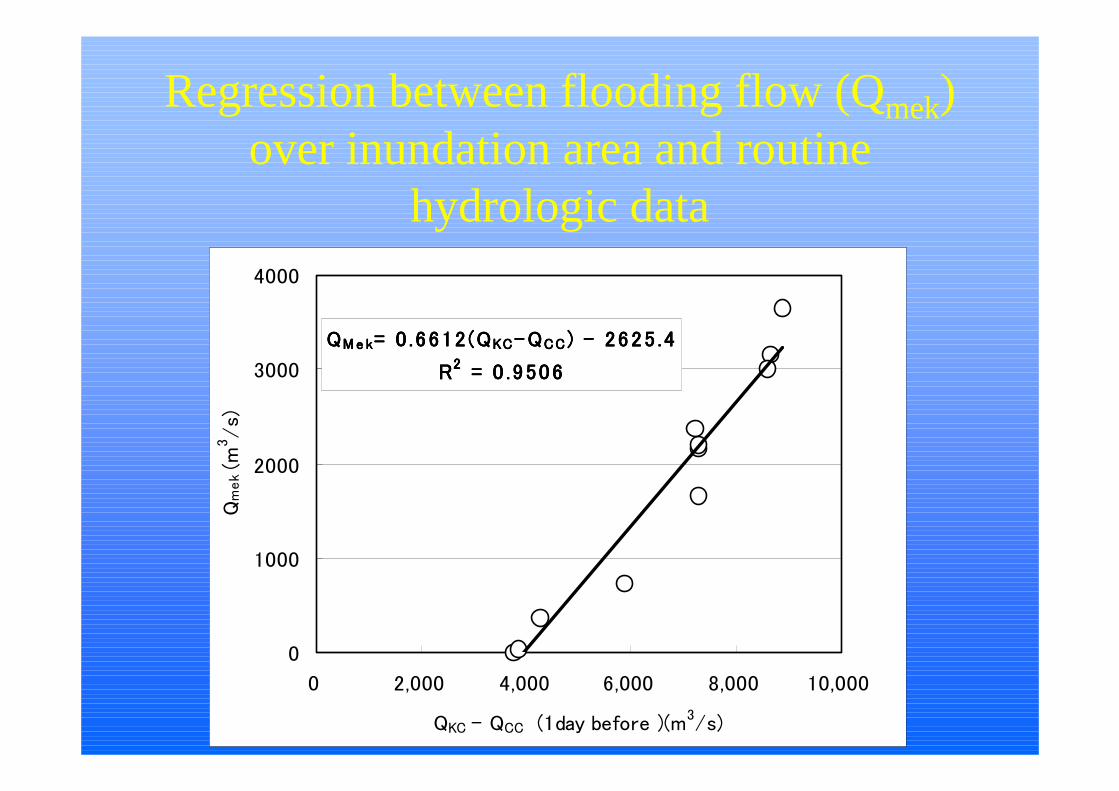
Regression between flooding flow (Qmek) over inundation area and routine
hydrologic data
QQQQMe kMe kMe kMe k= 0 .6612(Q= 0 .6612(Q= 0 .6612(Q= 0 .6612(QKCKCKCKC-Q-Q-Q-QCCCCCCCC) - 2625 .4) - 2625 .4) - 2625 .4) - 2625 .4
RRRR2222 = 0 .9506 = 0 .9506 = 0 .9506 = 0 .9506
0
1000
2000
3000
4000
0 2,000 4,000 6,000 8,000 10,000
QKC - QCC (1day before )(m3/s)
Qm
ek (m
3/s)
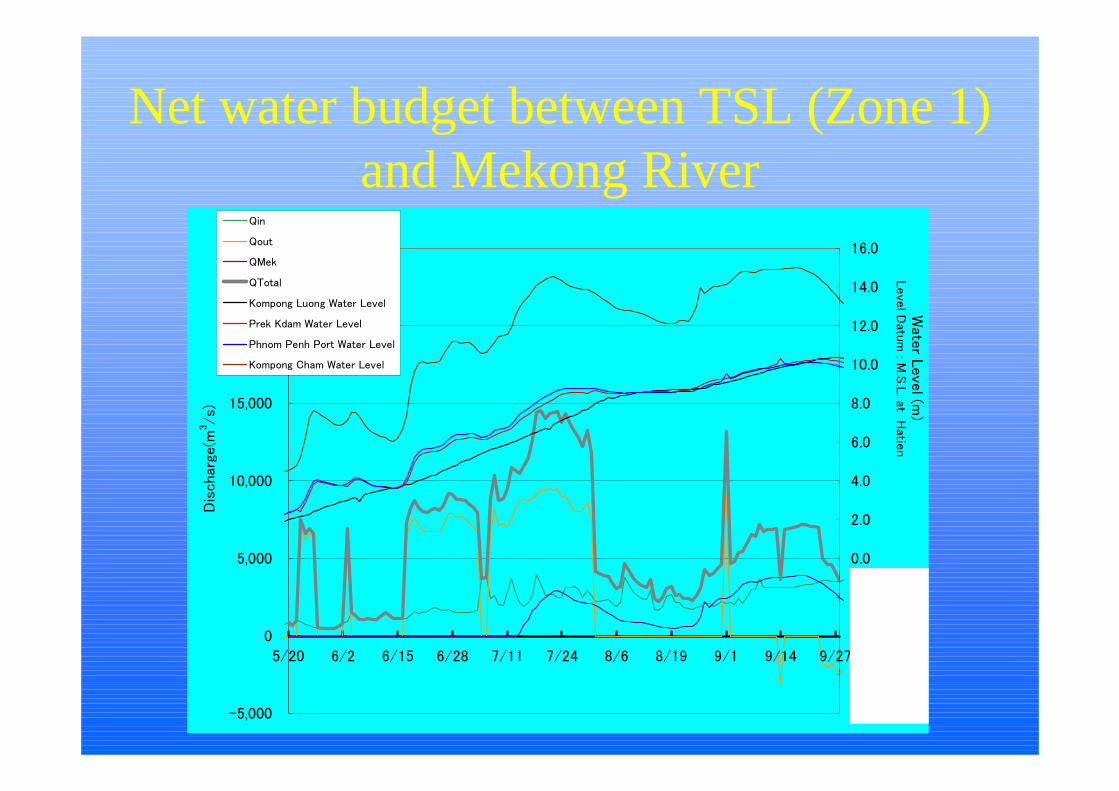
Net water budget between TSL (Zone 1) and Mekong River
-5,000
0
5,000
10,000
15,000
20,000
25,000
5/20 6/2 6/15 6/28 7/11 7/24 8/6 8/19 9/1 9/14 9/27
Wate
r Leve
l (m)
Leve
l Datu
m : M
.S.L
. at Hatie
n
-8.0
-6.0
-4.0
-2.0
0.0
2.0
4.0
6.0
8.0
10.0
12.0
14.0
16.0
Dis
char
ge(m
3 /s)
Qin
Qout
QMek
QTotal
Kompong Luong Water Level
Prek Kdam Water Level
Phnom Penh Port Water Level
Kompong Cham Water Level

Comparison on the Storage Volume-Level Relationship of the Tonle Sap Lake
0.0
2.0
4.0
6.0
8.0
10.0
12.0
14.0
16.0
18.0
0 20 40 60 80 100 120
トンレサップ湖容量(109m3)
トンレサ
ップ湖
水位
(m)
Leve
l D
atum
: M
.S.L
. at
H
atie
n
0 3,000 6,000 9,000 12,000 15,000 18,000
トンレサップ湖面積(km2)
Tonle Sap Lake H-V 算定結果
H-V SOGREAH社作成(Kompong Chhnangまで)
H-V メコン委員会作成 (Prek Kdamまで、SOGREAH社の図面より作成)
H-A メコン委員会作成 (Prek Kdamまで、SOGREAH社の図面より作成)
Flood retarding volume (109m3)Wat
er le
vel o
f Ton
leSa
p La
ke a
t Kom
pong
Luon
g(m
)
H-V relationship by PWRI model (until Prek Kdam)H-V relationship by SOGREAH (until Konpong Chhnang)H-V relationship by MRC based on Sogreah maps (until Prek Kdam)H-A relationship by MRC based on Sogreah maps (until Prek Kdam)
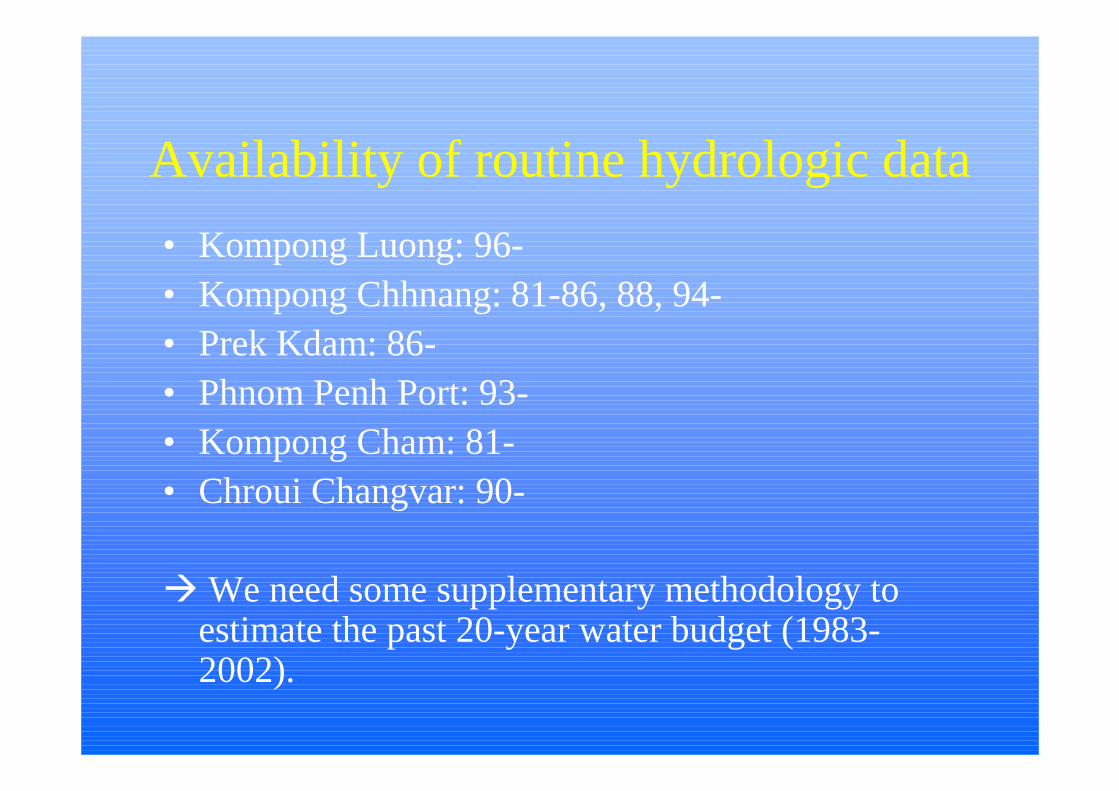
Availability of routine hydrologic data• Kompong Luong: 96-• Kompong Chhnang: 81-86, 88, 94-• Prek Kdam: 86-• Phnom Penh Port: 93-• Kompong Cham: 81-• Chroui Changvar: 90-
We need some supplementary methodology to estimate the past 20-year water budget (1983-2002).
2. Development of a model to estimate the flood-control volume of TSL with remotely-sensed data from satellites
- Foundation for understanding the annual & temporal change of flood inundation area
using satellite information -
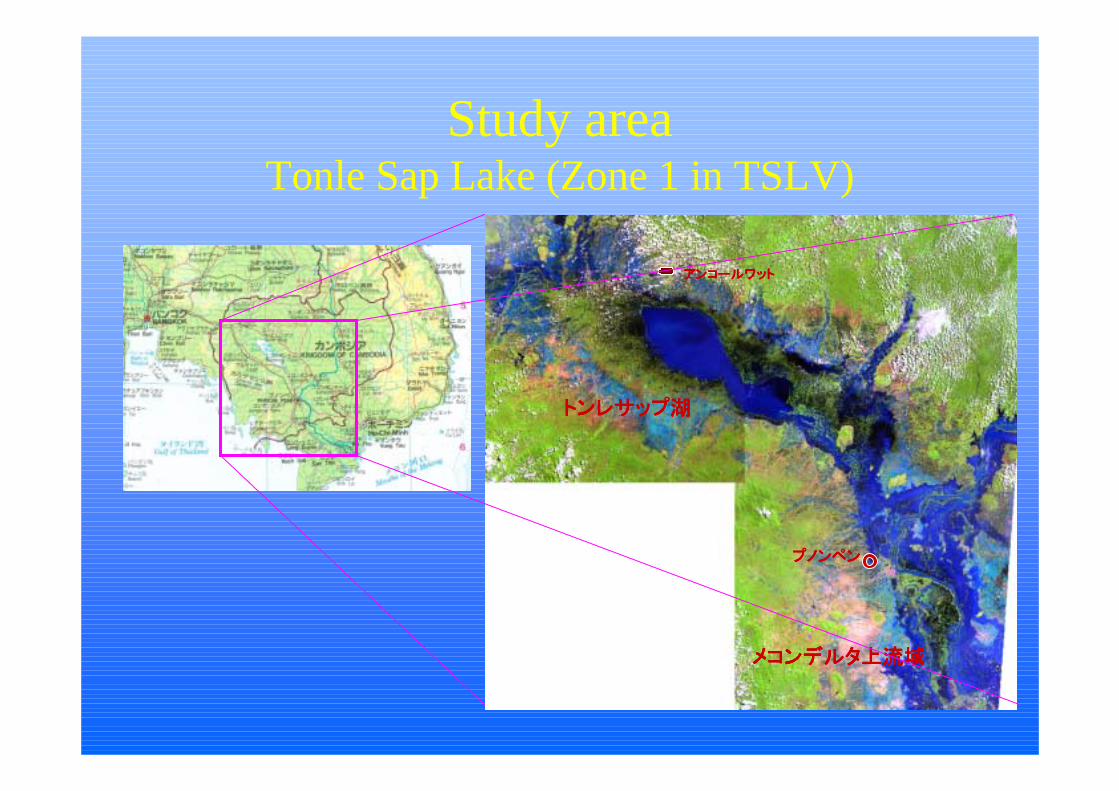
Study areaTonle Sap Lake (Zone 1 in TSLV)
トンレサップ湖トンレサップ湖トンレサップ湖トンレサップ湖
メコンデルタ上流域メコンデルタ上流域メコンデルタ上流域メコンデルタ上流域
プノンペンプノンペンプノンペンプノンペン
アンコールワットアンコールワットアンコールワットアンコールワット

Satellite data already acquired & processed
観測年(A年)観測年(A年)観測年(A年)観測年(A年) no.no.no.no. 解析対象エリア解析対象エリア解析対象エリア解析対象エリア 衛星/センサ名衛星/センサ名衛星/センサ名衛星/センサ名 パス-ロウパス-ロウパス-ロウパス-ロウ 観測年月日観測年月日観測年月日観測年月日2000 1 トンレサップ湖周辺 LANDSAT/ETM+ 127-51 2000/3/252000 2 トンレサップ湖周辺 LANDSAT/TM 127-51 2000/7/232000 3 トンレサップ湖周辺 LANDSAT/ETM+ 127-51 2000/8/162000 4 トンレサップ湖周辺 LANDSAT/ETM+ 127-51 2000/11/42000 5 トンレサップ湖周辺 LANDSAT/ETM+ 126-51 2000/3/182000 6 トンレサップ湖周辺 LANDSAT/ETM+ 126-51 2000/6/62000 7 トンレサップ湖周辺 LANDSAT/TM 126-51 2000/8/12000 8 トンレサップ湖周辺 LANDSAT/ETM+ 126-51 2000/9/262000 9 トンレサップ湖周辺 RADARSAT/SAR - 2000/9/42000 10 メコンデルタ上流域 LANDSAT/ETM+ 126-52 2000/3/182000 11 メコンデルタ上流域 LANDSAT/ETM+ 126-52 2000/6/62000 12 メコンデルタ上流域 LANDSAT/TM 126-52 2000/8/12000 13 メコンデルタ上流域 LANDSAT/ETM+ 126-52 2000/9/26
観測年(B年)観測年(B年)観測年(B年)観測年(B年) no.no.no.no. 解析対象エリア解析対象エリア解析対象エリア解析対象エリア 衛星/センサ名衛星/センサ名衛星/センサ名衛星/センサ名 パス-ロウパス-ロウパス-ロウパス-ロウ 観測年月日観測年月日観測年月日観測年月日1999 1 トンレサップ湖周辺 LANDSAT/TM 126-51 1999/8/151999 2 トンレサップ湖周辺 LANDSAT/ETM+ 126-51 1999/9/242001 3 トンレサップ湖周辺 LANDSAT/ETM+ 126-51 2001/10/152002 4 トンレサップ湖周辺 LANDSAT/ETM+ 126-51 2002/10/181999 5 トンレサップ湖周辺 RADARSAT/SAR - 1999/3/261999 6 メコンデルタ上流域 LANDSAT/TM 126-52 1999/8/151999 7 メコンデルタ上流域 LANDSAT/ETM+ 126-52 1999/9/242001 8 メコンデルタ上流域 LANDSAT/ETM+ 126-52 2001/10/152002 9 メコンデルタ上流域 LANDSAT/ETM+ 126-52 2002/10/18
Year Satellite/sensor Path-Row Date
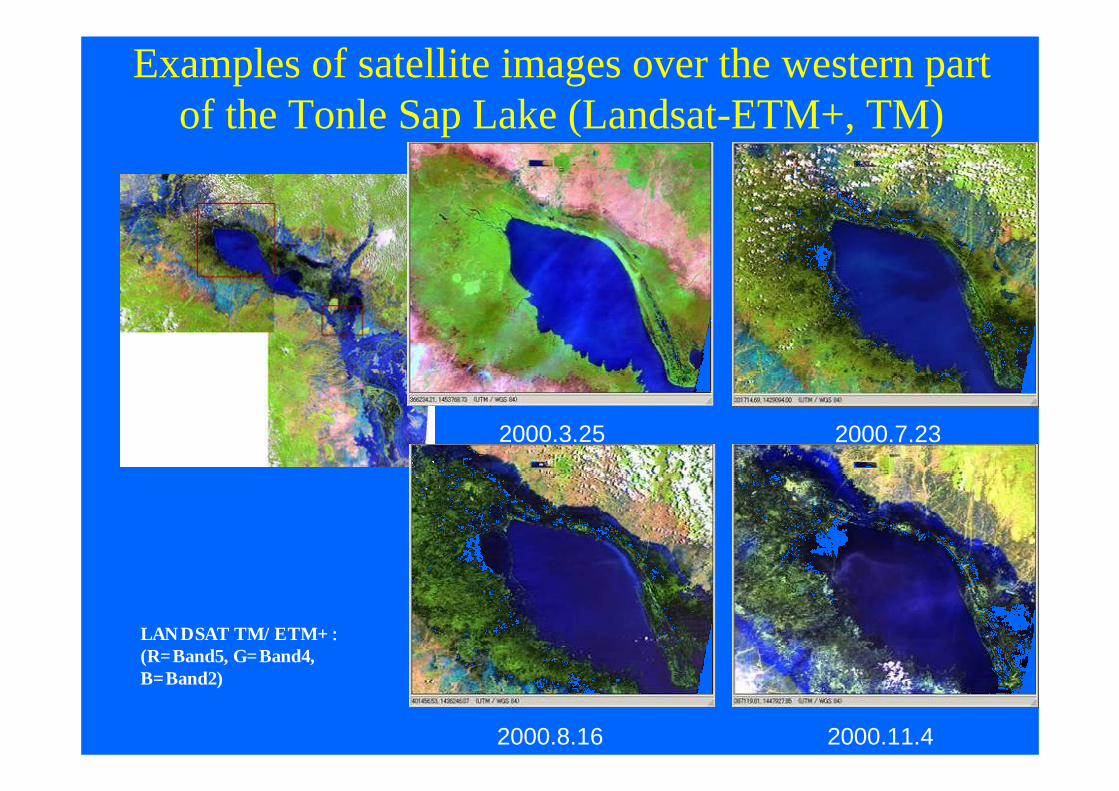
Examples of satellite images over the western part of the Tonle Sap Lake (Landsat-ETM+, TM)
2000.3.25 2000.7.23
2000.8.16 2000.11.4
LANDSAT TM/ETM+::::(R=Band5, G=Band4, B=Band2)
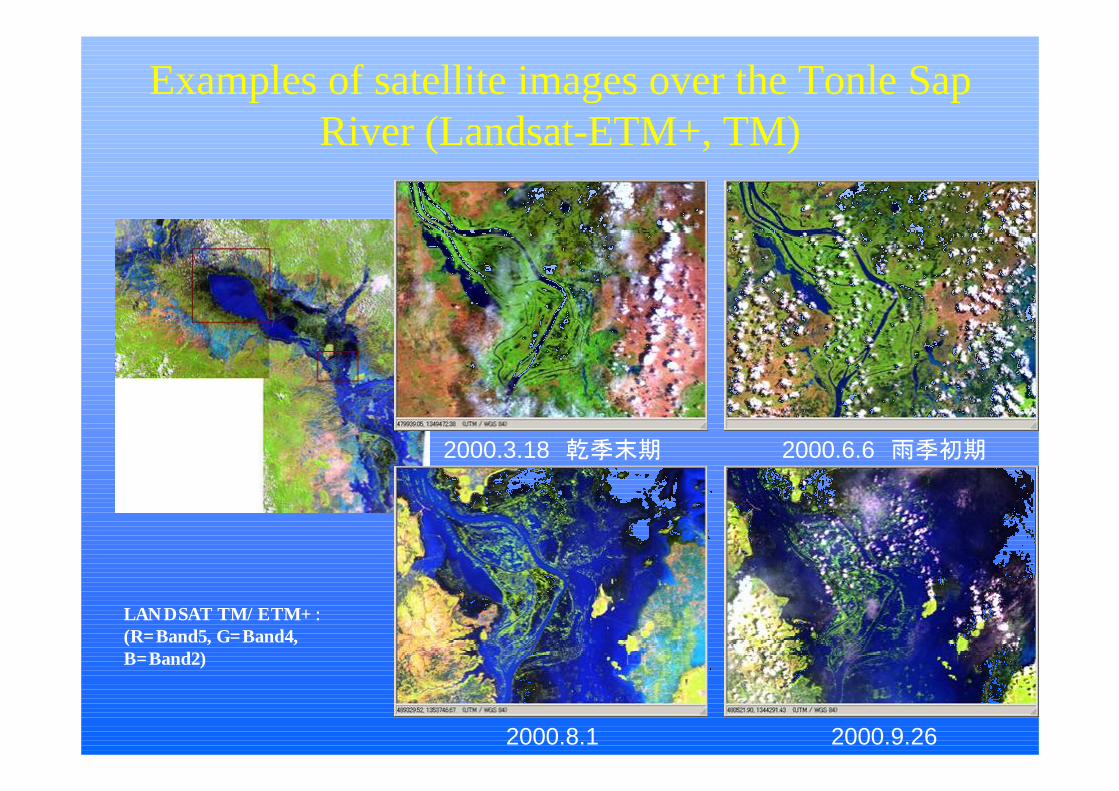
Examples of satellite images over the Tonle Sap River (Landsat-ETM+, TM)
2000.3.18 乾季末期 2000.6.6 雨季初期
2000.8.1 2000.9.26
LANDSAT TM/ETM+::::(R=Band5, G=Band4, B=Band2)

Making land cover map• Source data: LANDSAT TM / ETM+• The clustering method (ISODATA method,
without any training data) was applied.• The initial number of clustering was 15• Referring to the land use map in the Cambodian
GIS, the classified categories were merged into several ones.Original image
Result of 15-class classifications Land cover map
クラスター分類
Merging some categories

Change of land cover during dry & rainy seasons
凡 例水 面草 地低木地
低地にある植生高地にある植生
水田等雲
LANDSAT ETM+2000.3.25
LANDSAT ETM+2000.3.18
LANDSAT ETM+2000.11.4
LANDSAT ETM+2000.9.26
LegendWaterGrasslandBush treeVegetation over low landVegetation over highlandPaddy fieldsClouds

Unified land use
map
凡 例落葉樹林、荒れ地
低木地落葉樹林
広葉・落葉樹林帯水田等水面
雨季に水没する荒れ地(草地)雨季に水没する低木地雨季に水没する水田Ⅰ雨季に水没する水田Ⅱ雨季に水没する水田Ⅲ
LegendDeciduous trees, wastelandBush treesDeciduous treesEvergreen & deciduous treesPaddy fieldsWaterSubmerged grass(waste)landSubmerged bush treesPaddy fields 1Paddy fields 2Paddy fields 3
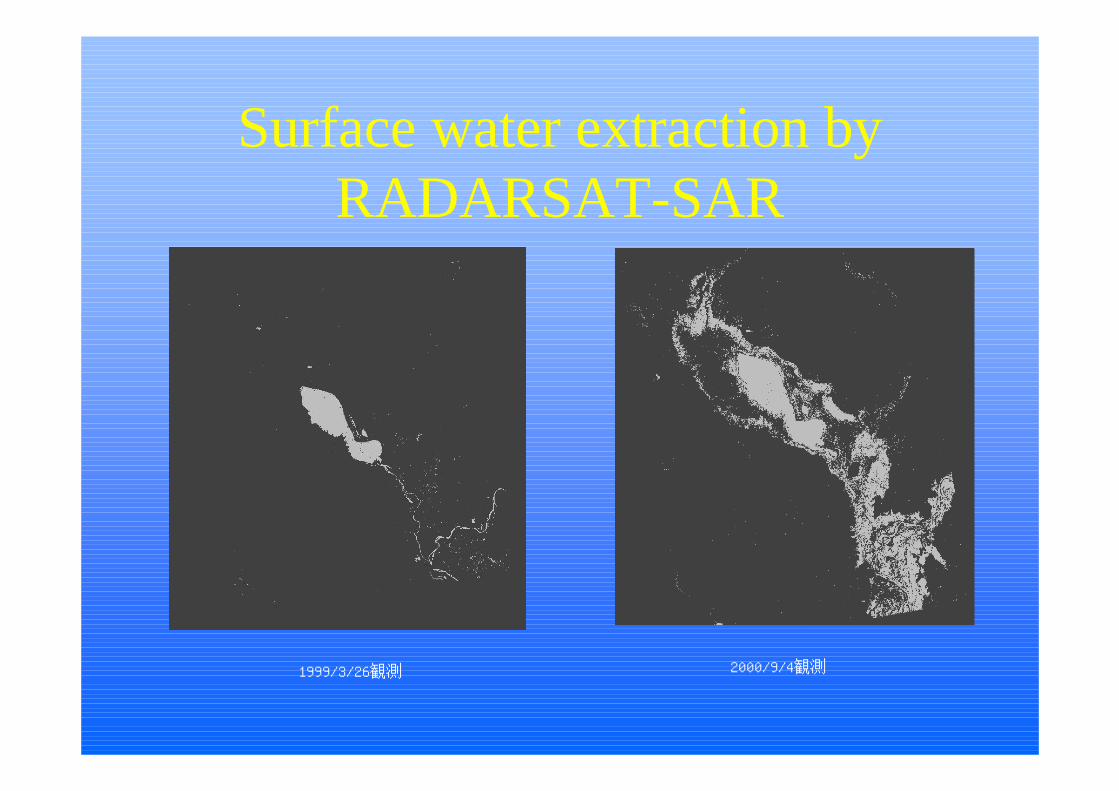
Surface water extraction by RADARSAT-SAR
2000/9/4観測1999/3/26観測
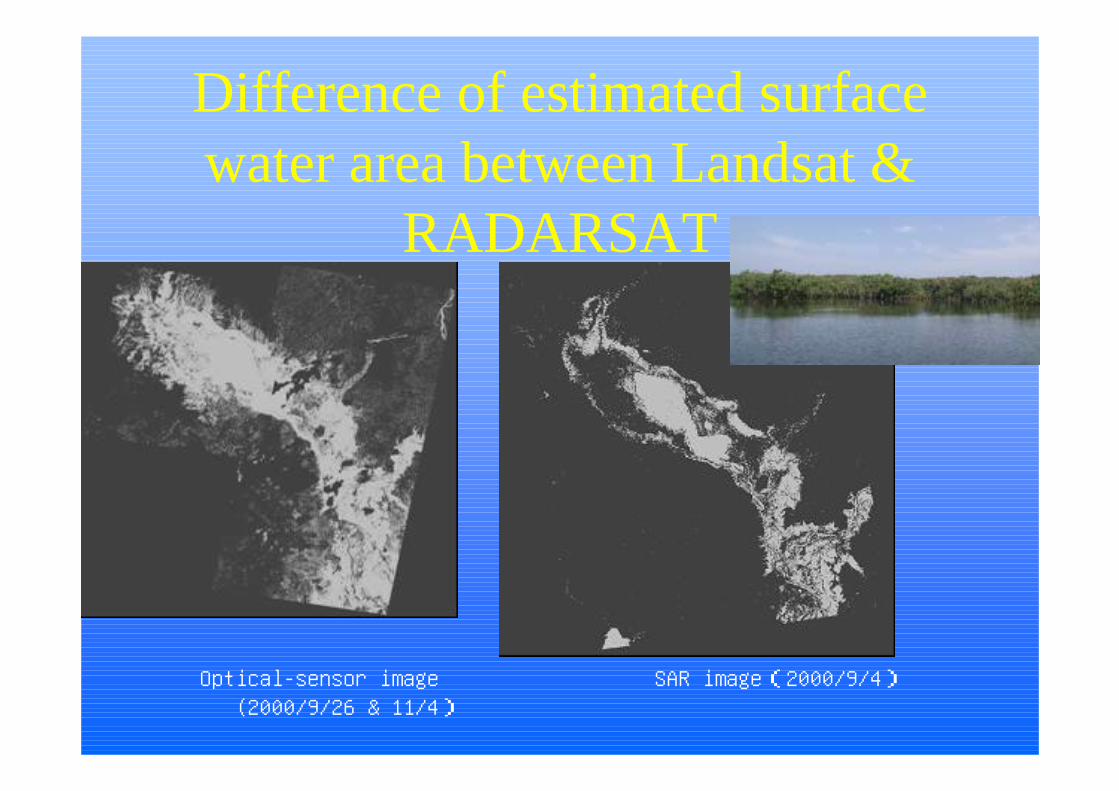
Difference of estimated surface water area between Landsat &
RADARSAT
Optical-sensor image SAR image(2000/9/4)(2000/9/26 & 11/4)
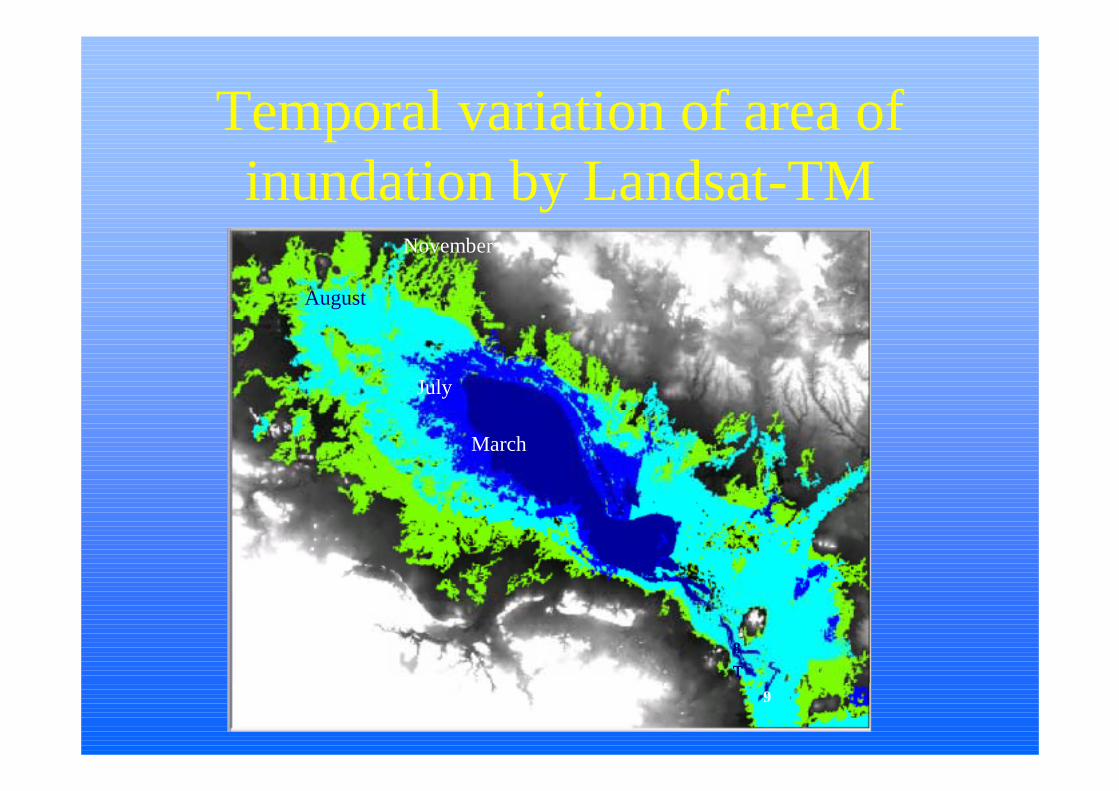
Temporal variation of area of inundation by Landsat-TM
March
July
August
November
9
8域域域域

Inundation boundary line by Landsat-TM images
凡例
2000.3.18
2000.8.1
2000.6.6
2000.9.26
2000.7.23
カンボジア国GIS等高線*

H-V relationship for Tonle Sap Lakewith remotely-sensed images (Landsat-TM)
average all path126 path127観測年月日 (ha) (ha) (ha)2003/3/18 2.40 301741.9 125720.7 176021.22003/6/6 2.92 162744.62003/7/23 7.02 535947.82003/8/1 7.98 1182331.5 540515.1 641816.42003/9/26 10.33 1444813.4 604109.8 840703.7
Water level(Kompong Loung)
Zone1
(m)
698692.34.97
H-V & H-A Relation for Zone 1
0
20,000
40,000
60,000
80,000
100,000
120,000
0.0 2.0 4.0 6.0 8.0 10.0 12.0Water Level in Kompong Luong : H (m)
Sto
rage
Volu
me: V
(M
CM
)
0
200,000
400,000
600,000
800,000
1,000,000
1,200,000
1,400,000
1,600,000
1,800,000
Surfac
e A
rea (h
a)
H-V
H-V (TSLV project)
H-A
H-A (TSLV project)

Comparison of H-V curves for Tonle Sap Lake (zone 1)
0.0
2.0
4.0
6.0
8.0
10.0
12.0
14.0
16.0
18.0
0.00 20.00 40.00 60.00 80.00 100.00 120.00
Water storage volume of Tonle Sap Lake (zone1) (10^9m3)
Wat
er
leve
l of
Tonle
Sap
Lak
e (m)
Leve
l D
atum
: M
.S.L
. at
H
atie
n
H-V PWRI simplified water budget method
H-V MRC-TSLV data (Prek Kdam) based on SOGREAH's data
H-V PWRI remote-sensing method

Conclusion1. The following two different types of algorithm to
estimate the flood water budget & flood control volume of the Tonle Sap Lake Watershed were developed.
1) a simplified water budget model between TSL and Mekong with available routine ground-based hydrologic observations only
2) a model to estimate the flood-control volume of TSL with remotely-sensed data
2. Both the above two methods were roughly coincident with the results (H-V relationship) of MRC-TSLV project. This supports their high potential to restore the past historical water-balance data by further tuning.
3. In order to restore the past 20-year hydrologic role of the Tonle Sap Lake, we should make combined use of the two algorithms.
Future subjects• To verify and finely tune a simplified water balance model
between TSL and the Mekong by using a few more recent years’extensive database available at MRC, and by comparing with a physically-based unsteady flow model.
• To verify the remote-sensing method using more widely available satellite images with medium- and/or coarse- spatial resolution such as NOAA-AVHRR, etc., and to make a sensitiviy analysis on the effect of topographical data.
• To establish the combined method of the two algorithms, considering the effect of the lack of data
• To restore the past 20-year hydrologic performances of the Tonle Sap Lake using the developed combined methods, which will be a basic foundation to clarify the mechanism of recent variation of flood characteristics and damage of the Mekong River and to predict the future trends under possible scenarios.

Ackknowledgements• The authors thank to the Mekong River Commission
Secretariat, the Cambodian Ministry of Water Resources and Meteorology, JICA, and WUP-JICA team for their provision of data and other substantial cooperation.
• This study was supported by the Japanese MEXT’sresearch grant = RR2002⑥ project titled “Model Development for the Prediction of Water-Resource change due to Natural Variation and Human Modification in the Asia Monsoon Region” (Project leader : Prof. KuniyoshiTAKEUCHI, Yamanashi Univ.)