Development of novel surface coatings based on acrylic...
56
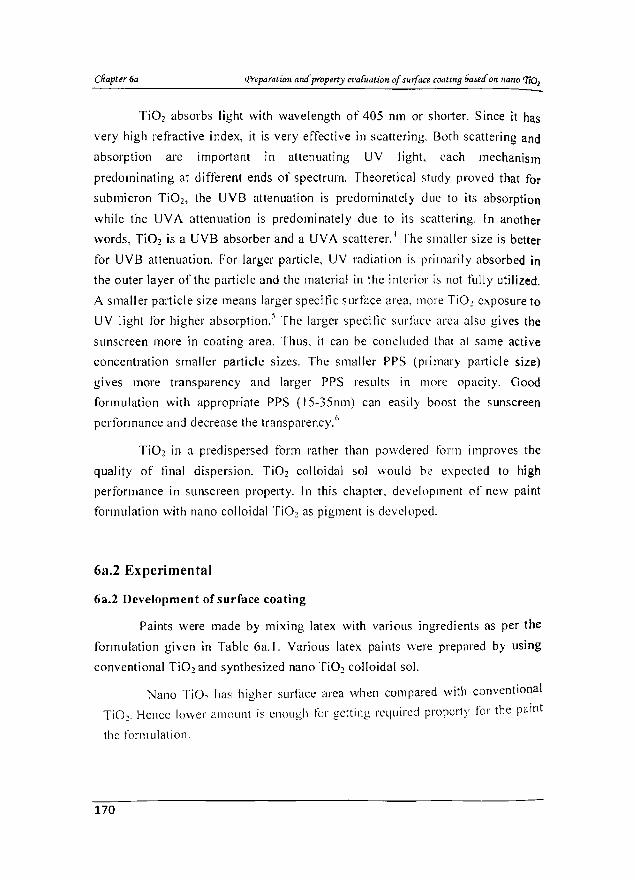
PREPARATION AND PROPERTY EVALUATION OF SURFACE COATING BASED ON NANO Ti02 6a: Development of paint formulation of VAc-BuA copolymer with nano Ti02 as pigment 6a.l Introduction Paints are required to be both decorative and protective. In the decorative context, it is essential that the surface is uniformly and cOlllpletely covered. This is most readily achieved by llsing a pigment of high reli'acti\'e index such as Ti0 2 Binder is used for the adhesion of pigment firmly to the surtace. fi0 2 (rutile) has been used as white colour pigment due to its very high refractive index (2.72), relatively low density and maximum scattering of visibk light and they absorb little energy in the visible part of the spectrum. The commercial Ti0 2 has some disadvantages. The untreated Ti0 1 pigment is not sufficiently basic. When react, acidic product will be formed as a result of photo- oxidation and thus does not help to maintain integrity of tilm. It has no fungicidal or bacteriostic properties. fi0 2 has much attention in the application field such as sunscreen properties, catalytic supporter. coating industry. photo catalyst and solar energy converters. Ti0 2 based coating has UV shielding ability due to UV ray absorption and UV ray scattering.' The ultraviolet spectrum is divided into three regions: UVC (200 - 290 nm), UVB (290-320 nm) and UV A (320--400 nm). UVC has the highest energy but is completely absorbed by ozone in the stratosphere. UVB is the most damaging UV light. UV A has the longest wavelength and lowest energy. Light scattering depends on the particle size and the wavelength of corresponding light. l Due to the reduction of particle size UV ray absorption increases. "Larger-sized TiO l particle exhibiting less effectivt:llcss as a sunscreen agent". The sunscreen performance depends on how well thc ultrafine particles are dispersed in the formulation.'
-
Upload
truonglien -
Category
Documents
-
view
216 -
download
1
Transcript of Development of novel surface coatings based on acrylic...
PREPARATION AND PROPERTY EVALUATION OF SURFACE
COATING BASED ON NANO Ti02
6a: Development of paint formulation of VAc-BuA copolymer with
nano Ti02 as pigment
6a.l Introduction
Paints are required to be both decorative and protective. In the
decorative context, it is essential that the surface is uniformly and cOlllpletely
covered. This is most readily achieved by llsing a pigment of high reli'acti\'e
index such as Ti02 Binder is used for the adhesion of pigment firmly to the
surtace. fi0 2 (rutile) has been used as white colour pigment due to its very high
refractive index (2.72), relatively low density and maximum scattering of visibk
light and they absorb little energy in the visible part of the spectrum. The
commercial Ti02 has some disadvantages. The untreated Ti01 pigment is not
sufficiently basic. When react, acidic product will be formed as a result of photo
oxidation and thus does not help to maintain integrity of tilm. It has no
fungicidal or bacteriostic properties. fi0 2 has much attention in the application
field such as sunscreen properties, catalytic supporter. coating industry. photo
catalyst and solar energy converters. Ti02 based coating has UV shielding ability
due to UV ray absorption and UV ray scattering.' The ultraviolet spectrum is
divided into three regions: UVC (200 - 290 nm), UVB (290-320 nm) and UV A
(320--400 nm). UVC has the highest energy but is completely absorbed by ozone
in the stratosphere. UVB is the most damaging UV light. UV A has the longest
wavelength and lowest energy. Light scattering depends on the particle size and
the wavelength of corresponding light. l Due to the reduction of particle size UV
ray absorption increases. "Larger-sized TiO l particle exhibiting less effectivt:llcss
as a sunscreen agent". The sunscreen performance depends on how well thc
ultrafine particles are dispersed in the formulation.'
Cliapter6a (Erepamtioll (lIId property £'I'a[uation of suiface coatillg 6ased Ot! /lallO '1i01
Ti02 absorbs light with wavelength of 405 nm or shOlier. Since it has
very high refractive index, it is very effective in scattering. Both scattering and
absorption are important In attenuating UV light, each mechanism
predominating at different ends of spectrum. Theoretical study proved that for
submicron TiO z, the UVB attenuation is predominately due to its absorption
while the UV A attenuation is predomi nately due to its scattering. In another
words, TiOz is a UVB absorber and a UV A scatterer. ~ The smaller size is better
for UVB attenuation. For larger particle, UV radiation is primarily absorbed in
the outer layer of the paliicle and the material in the interior is not fully utilized.
A smaller particle size means larger specitic surface area. more Ti02 exposure to
UV light for higher absorption. 5 The larger 5pecific SurE1C\: area also gives the
sunscreen more in coating area. Thus. it can be conclllded that at same active
concentration smaller paliide sizes. The smaller PPS (primary paIticle size)
gives more transparency and larger PPS results in more opacity. Good
formulation with appropriate PPS (15-35nm) can easil) boost the sunscreen
performance and decrease the transparency.('
Ti02 in a predispersed form rather than powdered form improves the
quality of tinal dispersion. Ti02 colloidal sol would be expected to high
performance in sunscreen property. In this chapter. development of new paint
formulation with nano colloidal TiOz as pigment is developed.
6a.2 Experimental
6a.2 Development of surface coating
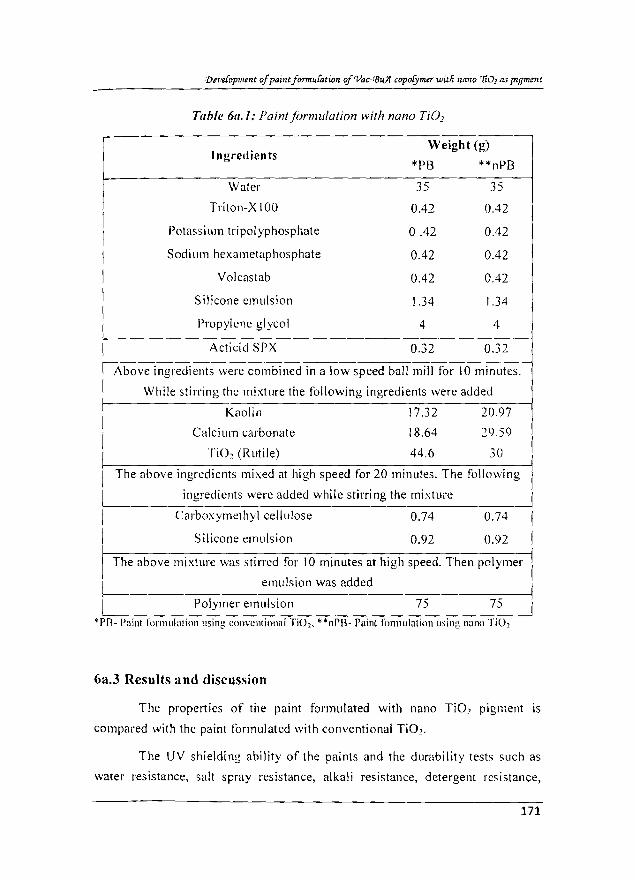
Paints were made by mixing latex with v,mOllS ingredients as per the
formulation given in Table 6a.l. Variolls latex paints were prepared by using
conventional Ti02 and synthesized nano Ti02 colloidal sol.
Nano TiO~ has higher surface area when compared with conventional
TiOe. Hence lower amount is enough for getting required property for the r aint
the formulation.
170
{Dtrr'e{opmmt of paint fomruCatioll oj'Vac-(BtV/ coporymer witli lIa1l0 '7iOz as pigmmt
Table 6(1.1: Paint f(mnulation with nano TiO]
Ingredients Weight (g)
*PB **nPB
Water 35 35
Triton-X 100 0.42 0.42
Potassium tripolyphosphate 0.42 0.42
Sodium hexametaphosphate 0.42 0.42
Yolcastab 0.42 0.42
Silicone emulsion 1.34 1.34
Propylene glycol 4 4
Acticid SPX 0.32 0.32
Above ingredients were combined in a low speed ball mill for 10 minutes.
I While stirring the mixture the following ingredients were added
Kaolin 17.32 20.97
I Calcium carbonate 18.64 29.59
I TiOe (Rutile) 44.6 30
i The above ingredients mixed at high speed for 20 minutes. The following
ingredients were added while stirring the mixture
I Carboxymethyl cellulose 0.74 0.74
I Silicone emulsion 0.92 0.92
i The above mixture was stirred for 10 minutes at high speed. Then polymer
emulsion was added
I Polymer emulsion 75 75 .. ." ·Pl'l· Pnlllt formulallOl1 uSIng t:oJ)\'l!ntuHml r102• "nPIl· Paint lonllulatJon lIslng nano IIO~
6a.3 Results a nd discussion
The properties of the paint formulated with nano TiO~ pigment is
compared with the paint formulated with conventional Ti02•
The UY shielding ability of the paints and the durability tests such as
water resistance, salt spray resistance, alkali resistance, detergent resistance,
171
weather resistance and adhesion tests are also carried out to know the effect of
nano sized effect of pigment. These lests were conducted according 10 standard
procedures described in chapler 2. The specimens for the tests were prepared by
coating the paint samples in mild steel panels of size 6in x 4in (BS
speci fication) .
The observations for various tests are summarised in the respective
tables. For each test the appearance (photographs) of the coated samples before
and after the tests are shown under the respective tests. The properties of the
formulated paints are compared with a commercially available paint.
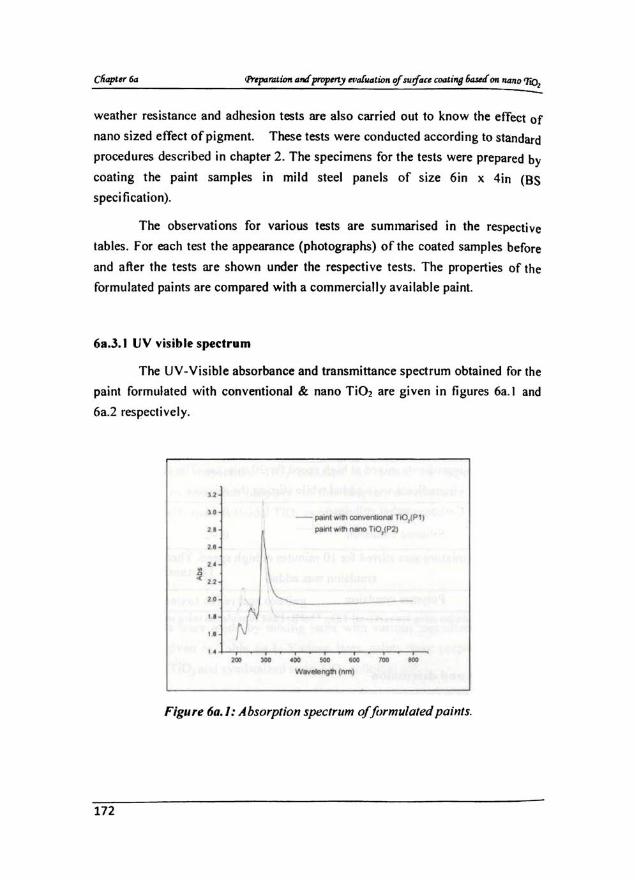
6a.3.1 UV visib lt spectrum
The UV.visibJe absorbance and transmittance spectrum obtained for the
paint formulated with conventional & nano TiO l are given in figures 6a.1 and
6a.2 respectively.
" .. - -" ....... _nO,IP,1
" j)M'II "' ......... TlO,IP21
u
" '., rt" ...
" " ..
Figure 60.1: Absorption spectrum offormulated paints.
172
" - P_ ............ ...-TIO,!Pl ) .. " ......... n_ TiO,11'21
" • I " ! to ..
••
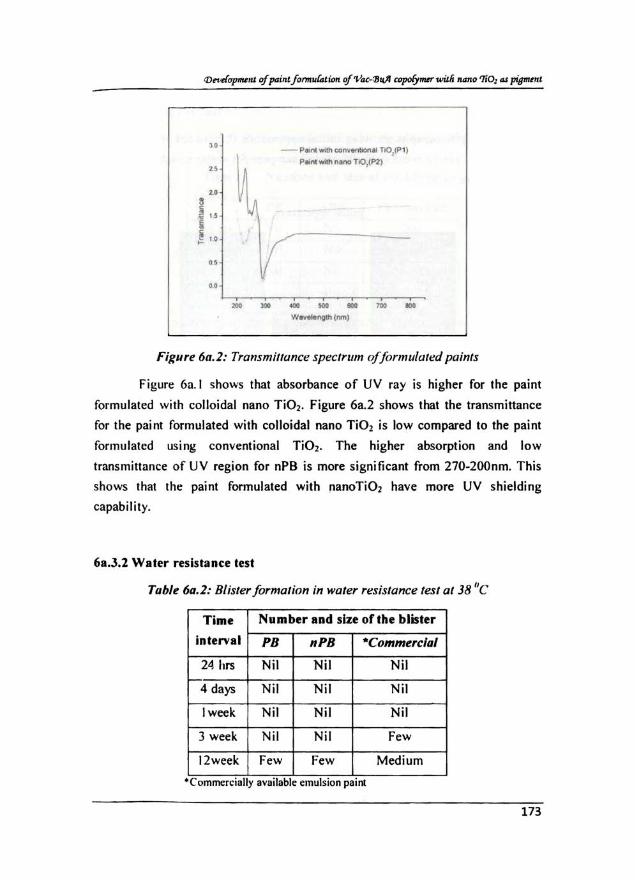
Figure 6o.]: Transmiflunce speC/rI/m o/formulated paints
Figure 6a. l sho ..... s that absorbance o f UV ray is higher for the paint
formulated with colloidal nano TiOl . Figure 6a.2 shows that the transmittance
for the paint formulated with colloidal nano TiO l is low compared to the paint
formulated usi ng conventional Ti02• The higher absorption and low
transmittance of UV region for oPB is more s ignificant from 270-200nm. This
shows that the painl formulated with nanoTiOz have more UV shielding
capability.
6a.3.2 Water resistance lest
Tuble 60.2: Blister formation in water resistance test at 38 "e
Time Number aDd sin of the blister
interval PB nPB ·Commerclal
24 hrs Nil Nil Nil
4 days Nil Nil Nil
I week Nil Nil Nil
3 week Nil Nil Few
12week Few Few Medium
• Comrt'll:rclolly avo llable emulSion pall1(
173
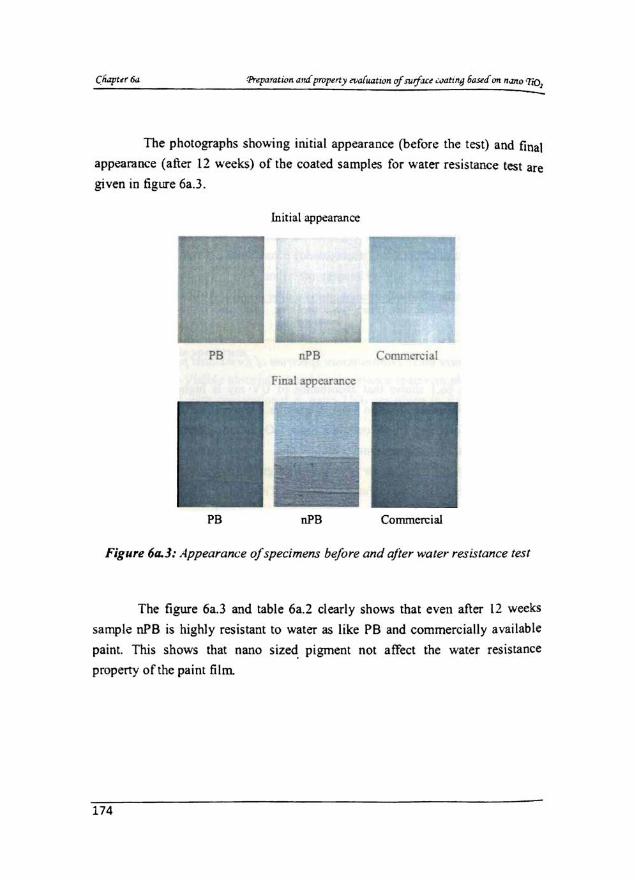
The photographs showing initial appearance (before the test) and final
appearance (after 12 weeks) of tbe coated samples for water resistance test are
given io figure 6a.3.
lnilial ap~arance
PS nPS Commercial
Filial appearance
PS nPS Commercial
Figure 60.3: Appearan<.'e o/specimens be/ore and after water resistance test
The figure 6a.3 and table 6a.2 clearly shows that even after 12 weeks
sample nPB is highly resistant to water as like PB and commercially available
paint. This shows that nano sized. pigment not affect the water resistance
property of the paint film
174
6a.3.3 Salt spray test
Table 6a.J: Blister formation in salr spray lest ar ltJC
Ti me Number aDd size of the blister
interval PS .PS Com.mercilzl
48 brs :-.iil ~i l 1'\ il
I week :-';il ~il ~i1
4 week ;o.iil Sil Few
I~week Few ~il Medium d('llSe
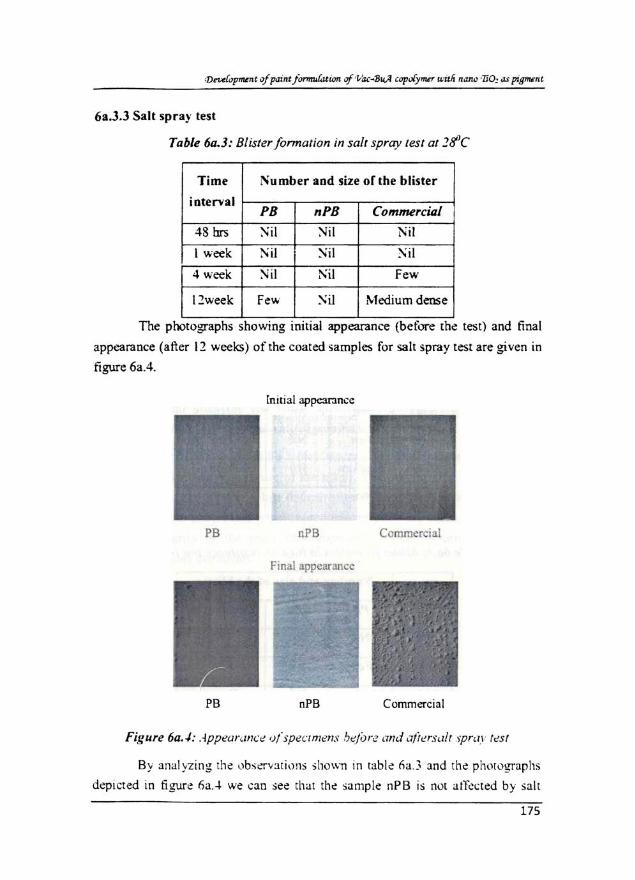
The photographs showmg IOltIal appearance (before the test) and final
appearance (after 11 weeks) of the coated samples for sail spray test are given in
figure 6aA.
Initial appcar:lO':C
PB nPB Commercial
Final appcarnncc
PB , PB Commercial
By 3nalyzing: th e ~lb.~.:rV:Hi\)1ls .. hown In tabk oa.3 and the phl1wgraphs
depicted to tlgurl! /1a../. we can see that the sample nPB is not atf<!(.;ted by salt
175
Cfiapter fia fuparation aM property el'a(U4tion cf sutjact cooti,'l/ 6ased on I14no 'lio]
spray even after 12 weeks. The specimens PB and commercially available paint
shows more blistering than nPB. This shows that the nano sized pigment
intimately and uniformly mixed with the paint and this gives more integrity to
the paint films. This may be the reason tor the good stability ofT paint film
containing nano Ti02•
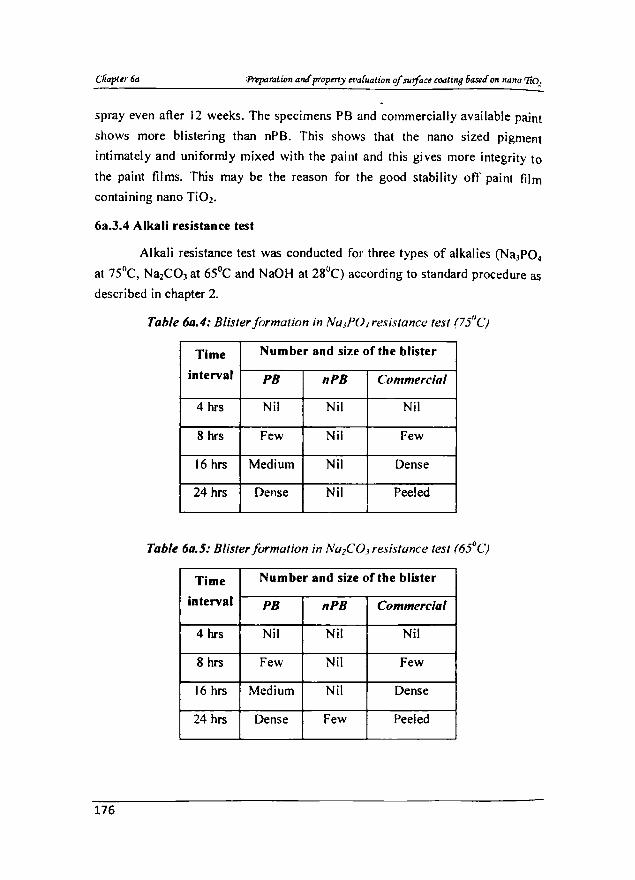
6a.3.4 Alkali resistance test
Alkali resistance test was conducted for three types of alkalies (NaJP04
at 7SoC, Na2C03 at 65°C and NaOH at 28°C) according to standard procedure as
described in chapter 2.
Table 60.4: Blister formation in NaJPO~ resistance test (75"C)
Time Number and size of the blister
interval PB nPB Comnrercial
4 hrs Nil Nil Nil
8 hrs Few Nil Few
16 hrs Medium Nil Dense
24 hrs Dense Nil Peeled
Table 60.5: Blister formation in NazCOJ resistance test (65 I1C)
Time Number and size of the blister
interval PB nPB Commercial
4 hrs Nil Nil Nil
8hrs Few Nil Few
16 hrs Medium Nil Dense
24 hrs Dense Few Peeled
176
.1)en{opment of pain: fol7lW.faJ.ion '!! 'VdC-rBlIft copo£ymer wit" nano 'li02 <IS pigmellt
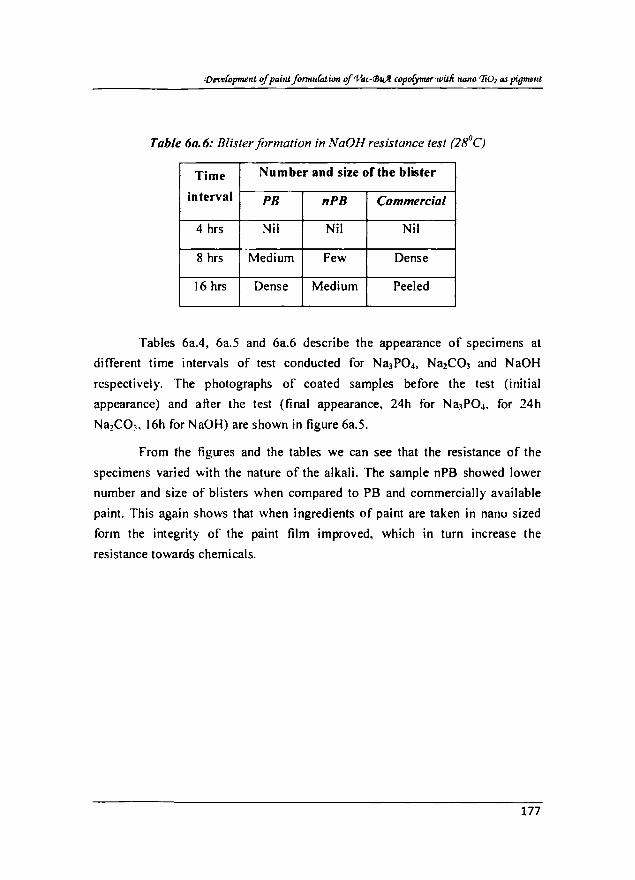
Table 60_6: Blister fiJrmation in NaOH resistance test (28 liC)
Time Number and size of the blister
interval PB nPB Commercial
4 hrs Nil Nil Nil
8 hrs Medium Few Dense
16 hrs Dense Medium Peeled
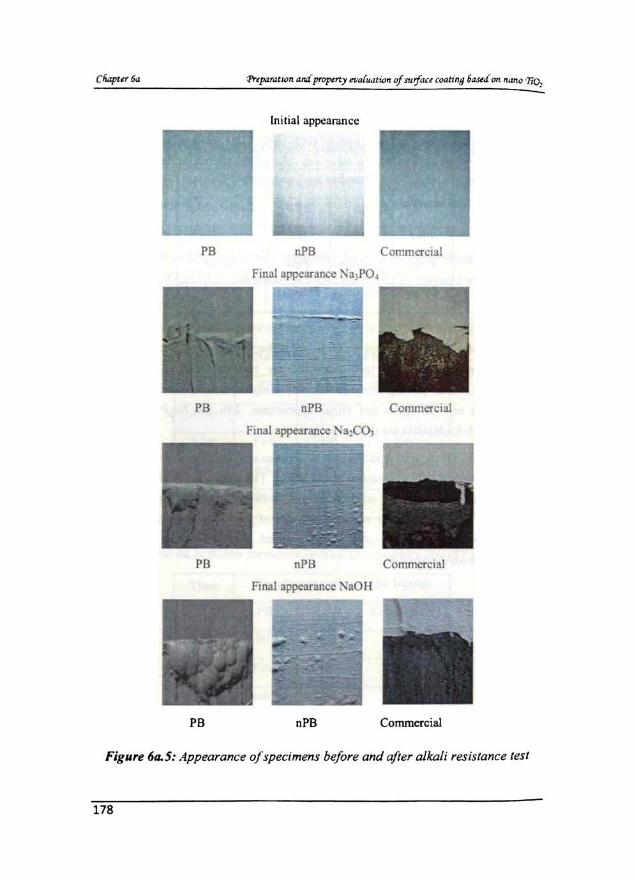
Tables 6a.4, 6a.5 and 6a.6 describe the appearance of specimens at
difTerent time intervals of test conducted for Na3P04• Na2C03 and NaOH
respectively. The photographs of coated samples before the test (initial
appearance) and after the test (final appearance, 24h for Na,P04• for 24h
NazCOJ • 16h for NaOH) are shown in figure 6a.5.
From the figures and the tables we can see that the resistance of the
specimens varied with the nature of the alkali. The sample nPB showed lower
number and size of blisters when compared to PB and commercially available
paint. This again shows that when ingredients of paint are taken in nano sized
form the integrity of the paint film improved. which in turn increase the
resistance towards chemicals.
177
[nilial appeanlIlCC
PB o1'B Commercial
Final appearance Na]PO. r-----.
~' \"";~~~IlJ : •. , . "", -r,..:~
',f"" ... ' .. ~,..... ,
PB nPB COnuDerciai
Final appearance Na:C~
PB nP B Commercial
Final appearance NaO ~1
PB nPB Conunercial
Figure 6",5: Appearance a/specimens before and after alkali resistance test
178
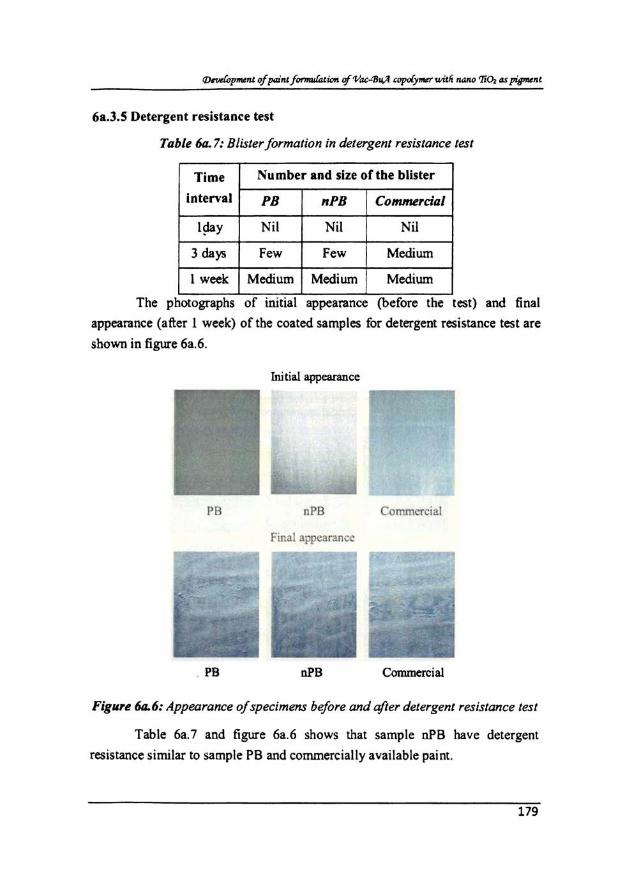
6 •. 3.5 Detergent resistance test
Table 6a. 7: Blister formation in detergent resistance test
Time Number and size of the blister
interval PH .PH Commercial
I!1aY Nil Nil Nil
3 day.; Few Few Mediwn
I week Medium Mediwn Medium ..
The photographs of initial appearance (before the [est) and final
appearance (after 1 week) of the coated samples for detergent resistance test are
shown in figure 6a.6.
Initial appearance
PB nPB Commercial
Final appearance
PS nPS Commercial
Figure 60.6: Appearance of specimens before and after detergent resistance lest
Table 00.7 and figure 68.6 shows that sample nPB have detergent
resistance similar to sample PB and commerc ially available paint.
179
6a.3.6 Natural weather resistance
Weather resistance test was conducted to know the effect of natural
weather on paint surface. The specimens were prepared by coating the paint on
mild steel panels of size 12x6in. The test was conducted for a period of IQ
months from March to December. This time period was selected because the
samples were exposed to all seasons during the test.
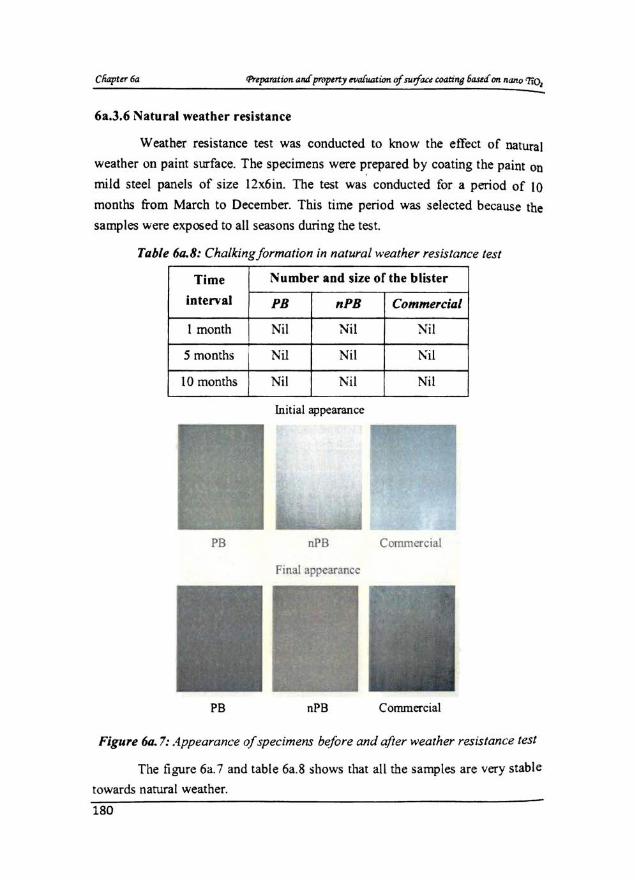
Table 6a.8: Chalkingformation in natural weather resistance test
Time Number and size of the blister
interval PB _PB Commercial
1 month Ni l Nil Nil
5 months Nil Nil r-: il 10 months Nil i'iil Nil
lnilial appearance
PB nPB Commercial
Final appearance
PB ,PB Commercial
Figure 6a. 7: Appearance of specimens before and after weather resistance test
The figure 6a.7 and table 6a.8 shows that all the samples are very stable
towards natural weather.
180
'Dtve{upment of paint Jormufalimz of'Vac-<J)1j)I copofymer tviUi 11<1110 'li01 <IS pigment
The durability tests such as water resistance, salt spray resistance, alkali
resistance, detergent resistance and weather resistance tests carried out for
different specimens shows that the sample nPB is have good resistance towards
all test conditions as like PB and commercially available paint. In the case of
alkali resistance and salt spray resistance nPB is superior to the other samples.
From the results we can conclude that the pigment in nano sized form enhance
the surface integrity of paint films.
Rutile Ti02 is the most thermodynamically stable allotropic form and is
generally obtained by a high temperature process. Calcination at high
temperature is usually accompanied by sintering among particles. This can
adversely affect the optical properties and dispersion stability. In this study nano
Ti02 colloidal sol never heated at above 100°C. So that particle size retained
even after the preparation. Therefore nano colloidal Ti02 sol in paint formulation
gave better dispersions stability and better surface integrity.
6a.3.7 Scotch test
The adhesive strength of the paints was determined using scotch
resistance test. The tests were carried out as described in chapter 2.
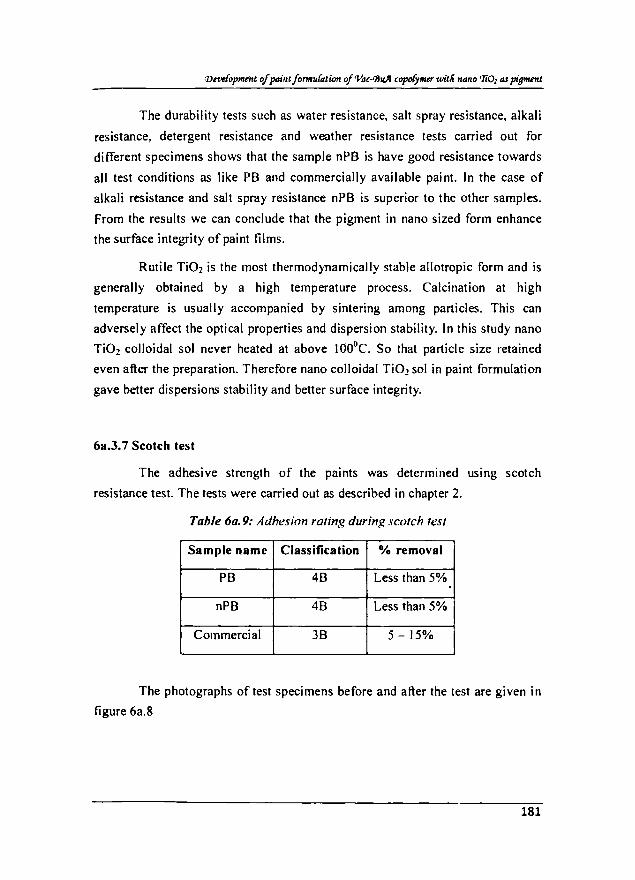
Table 6a. 9: Adhesion rating during scotch test
Sample name Classification % removal
PB 4B Less than 5%
nPB 4B Less than 5%
Commercial 3B 5 -15%
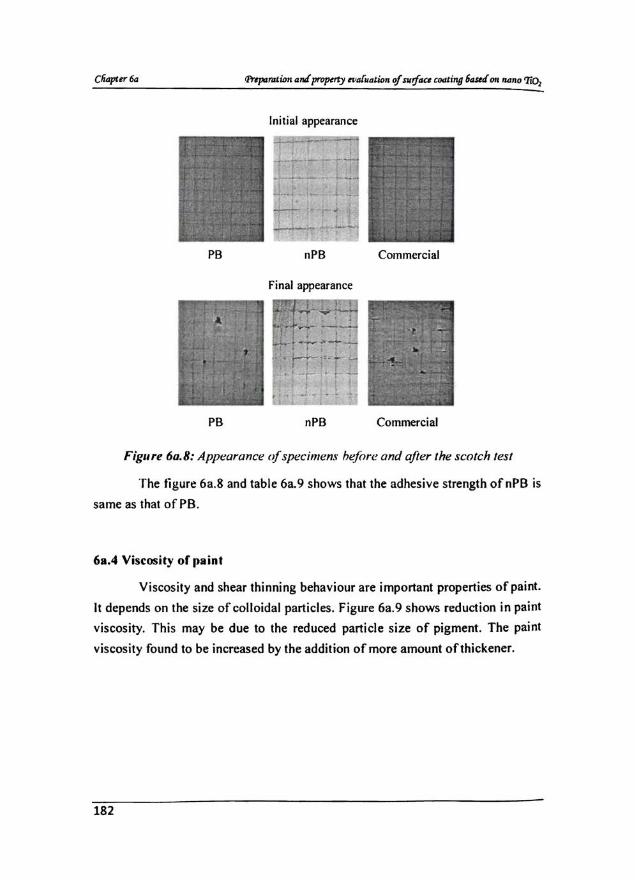
The photographs of test specimens before and after the test are given in
figure 6a.8
181
Inilial appearance
PS ,PS Commercial
Final appearance
--- , ---, .. j..-.;-- ,. -,
PS nPS Commercial
FigUrl! 60.8: ApPl.!orance of specimem; hefore and after the scotch test
The figure 6a.8 and table 6a.9 shows that the adhesive strength ofnPB is
same as that of PB.
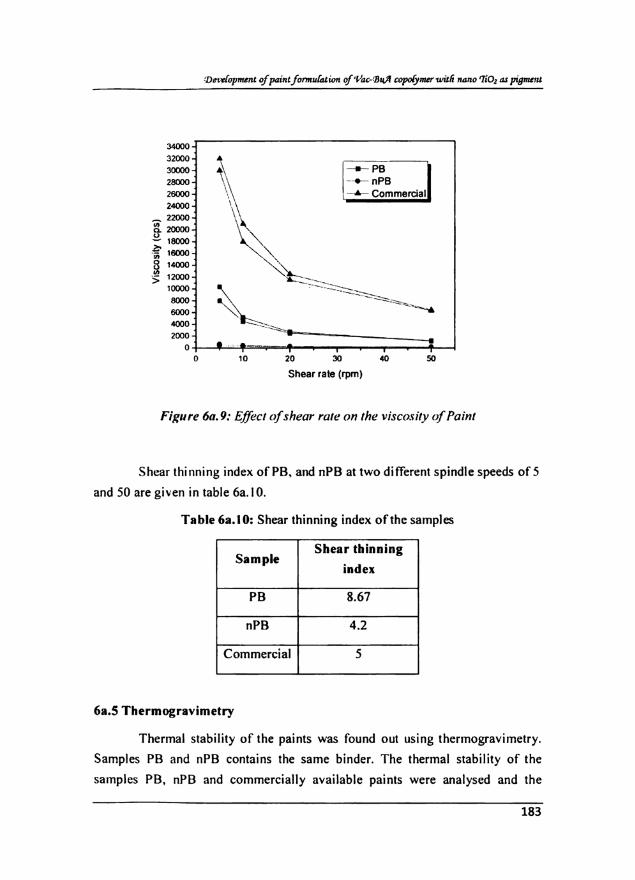
6 •. 4 Viscosity of paint
Viscosity and shear thinning behaviour are important properties of paint.
It depends on the size of colloidal particles. Figure 6a.9 shows reduction in paint
viscosity. This may be due to the reduced particle size of pigment. The paint
viscosity found to be increased by the addition of more amount of thickener.
182
,..,. """" ,.,., ""'" """" """" - ""'" i:.:
~leooo
~ """" """" "'''''' ""'" ""'" ""'" ""'" , ,
• ~PB
-'_nPB - ....... Commercial
.. '" " Shear rale (rpm)
•
FiKur~ 60. 9: Effect afshear rate on the ViSCO.fity of Paint
Shear thinning index ofPB. and nPB at two different spindle speeds of5
and 50 are given in table 6a.1 O.
Table 6a.10: Shear thinning index of the samples
SampJ« Shear Ihinning
index
PB 8.67
nPB 4.2
Commercial 5
6a.S Thermogravimelry
Thermal stability of the paints was found out using thermogravimetry.
Samples PS and nPB contains the same binder. The thermal stability of the
samples PB. nPB and commercially available paints were analysed and the
lB3
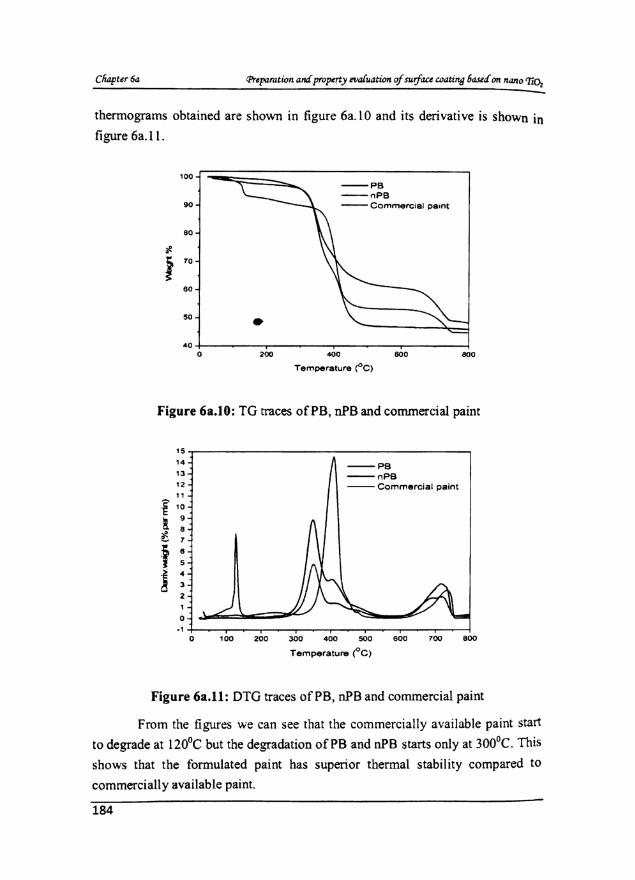
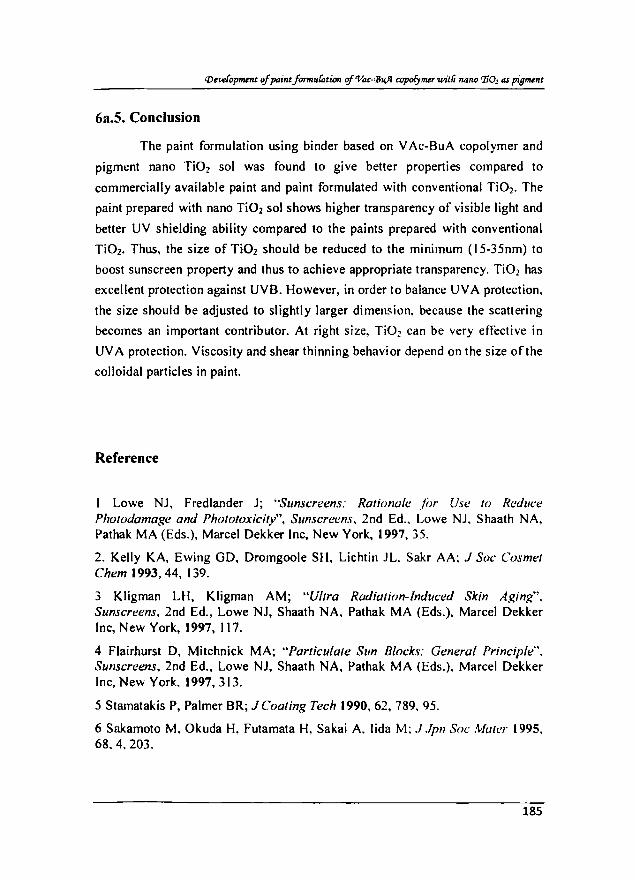
tbennograms obtained are shown in figure 6a.1O and its derivative is shown in
figure 6a.ll.
Figure 6 •• 10: TG traces of PS, nPS and commercial paint
" " --PS
" --oPS
" --Commercial p.il'lt
" f " ! • • l , t • • ~ • , ,
• , -. , 100 200 300 <000
Figure 6a.11: DTG traces of PS, nPB and commercial paint
From the figun:s we can see that the commercially available paint start
to degrade at IlOoe but the degradation of PS and nPS starts only at 300°C. This
shows that the formulated paint has superior tbermal stability compared to
commerciall y available paint.
184
(Deve(opment of paint jormllfaticrn of'Vac-<:B1()f ropc£ymer witli MM 'liOJ as pigment
6a.5. Conclusion
The paint formulation using binder based on V Ac-BuA copolymer and
pigment nano TiD2 sol was found to give better properties compared to
commercially available paint and paint formulated with conventional TiDz• The
paint prepared with nano TiD2 sol shows higher transparency of visible light and
better UV shielding ability compared to the paints prepared with conventional
TiD2. Thus, the size of TiD2 should be reduced to the minimum (15-35nm) to
boost sunscreen property and thus to achieve appropriate transparency. TiDz has
excellent protection against UVB. However, in order to balance UV A protection.
the size should be adjusted to slightly larger dimension. because the scattering
becomes an important contributor. At right size, TiD~ can be very etTective in
UV A protection. Viscosity and shear thinning behavior depend on the size of the
colloidal particles in paint.
Reference
I Lowe NJ, Fredlander J; "Sunscreens: Rationale /()r Use to Reduce Photodamage and Photoloxicity", Sunscreens. 2nd Ed .. Lowe NJ. Shaath NA, Pathak MA (Eds.), Marcel Dekker Inc, New York, 1997.35.
2. Kelly KA. Ewing GD. Dromgoole SH, Lichtin JL. Sakr AA; .I Sac Cos met Chem 1993,44, 139.
3 Kligman LH, Kligman AM; "Ultra Radiation-Induced Skin Aging". SIII1SCreens. 2nd Ed., Lowe NJ, Shaath NA. Pathak MA (Eds.). Marcel Dekker Inc, New York. 1997, 117.
4 Flairhurst D. Mitchnick MA; "Particlllate Sun Blocks: General Principle·'. Sunscreens, 2nd Ed., Lowe NJ, Shaath NA, Pathak MA (Eds.). Marcel Dekker Inc, New York, 1997,313.
5 Stamatakis P, Palmer BR; .ICoaling Tech 1990,62.789.95.
6 Sakamoto M, Dkuda H. Futamata H. Sakai A. lida M; J .Ipn Sac Muter 1995, 68,4.203.
185
6b: Paint formulation with nano Ti02 and rubber crumb
6b.l Introduction
The paint formulation developed with colloidal nano TiO) give gloss
surface. Ti02 in nano form will effectively screen the radiations from sun. I The
surface nature is modified with a matting agent activated rubber crumb2 as in
chapter 4 part b. The properties of the formulated paint were studied.
6b.2 Experimental
Rubber crumb is found to be uniformly dispersed in aqueous solution of
carboxy methyl cellulose. The dispersion containing the rubber crumb and latex
was prepared and is mixed with other ingredients. The optimum level of matting
agent was used for the easy brushing and good dispersion stability. For all
formulations the V Ac-BuA copolymer of 45% solid content was used. Table
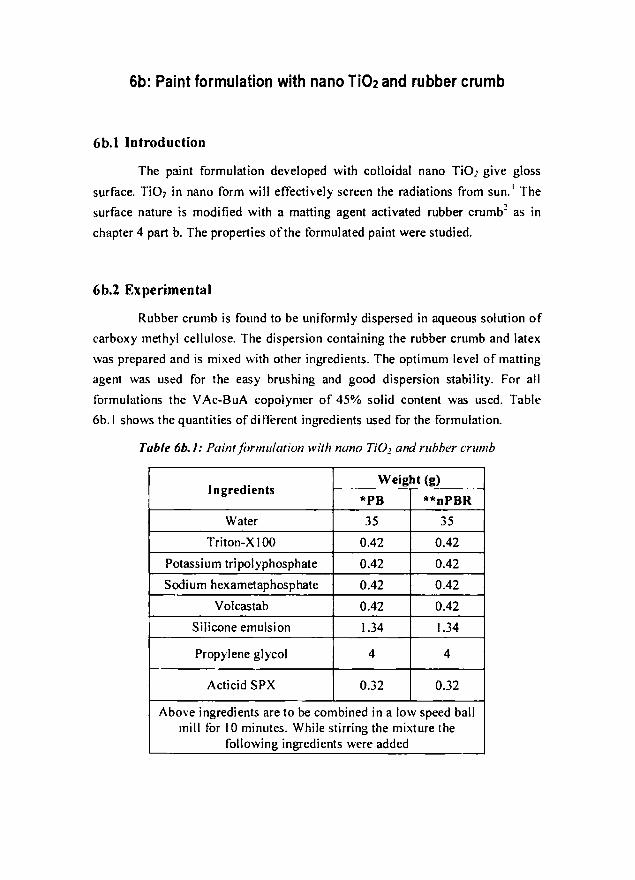
6b.1 shows the quantities of di Ilt.-rent ingredients used for the formulation.
Table 6b.l: Paint jimnulatiun with nano fiO) and rubber crllmb
In gred ien ts Weight (g)
*PB **nPBR
Water 35 35
Triton-X I 00 0.42 0.42
Potassium tripolyphosphate 0.42 0.42
Sodium hexametaphosphate 0.42 0.42
Volcastab 0.42 0.42
Silicone emulsion 1.34 1.34
Propylene glycol 4 4
Acticid SPX 0.32 0.32
Above ingredients are to be combined in a low speed ball mill for 10 minutes. While stirring the mixture the
following ingredients were added
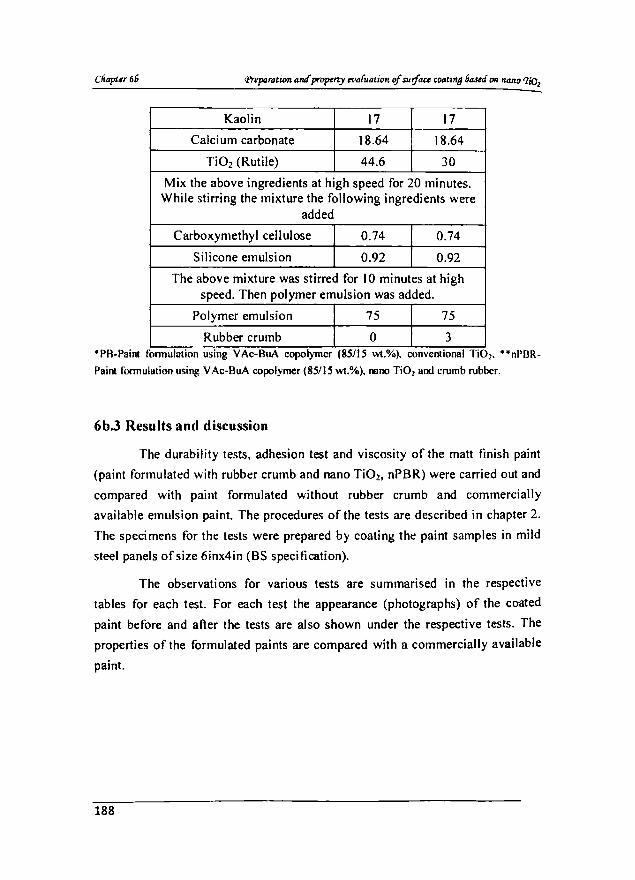
Chapm 66 <Preparation and" pruperty f'lJa{uatiol! of $Uif"ce cO/Jting 6asea on PImlO TI01
Kaolin 17 17
Calci urn carbonate 18.64 18.64
Ti02 (Rutile) 44.6 30
Mix the above ingredients at high speed for 20 minutes. While stirring the mixture the following ingredients were
added
Carboxymethyl cellulose 0.74 0.74
Silicone emulsion 0.92 0.92
The above mixture was stirred for 10 minutes at high speed. Then polymer emulsion was added.
Polymer emulsion 75 75
Rubber crumb 0 3 - . 'PB-Paint tonnulallon uSing VAc-BuA copolymer (85115 ",t.%), conventional [.Oz. '*nPBR
Paint tOrmulalion using VAc-BuA copolymer (8511 5 wt.%), moo TiOz and crumb rubber.
6b.3 Results and discussion
The durability tests, adhesion test and viscosity of the matt finish paint
(paint formulated with rubber crumb and nano Ti02, nPSR) were carried out and
compared with paint formulated without rubber crumb and commercially
available emulsion paint. The procedures of the tests are described in chapter 2.
The specimens for the tests were prepared by coating the paint samples in mild
steel panels of size 6inx4in (SS specification).
The observations for various tests are summarised in the respective
tables for each test. For each test the appearance (photographs) of the cooted
paint before and after the tests are also shown under the respective tests. The
properties of the formulated paints are compared with a commercially available
paint.
188

6b.3. 1 Water resistance test
TDble 6h.l: Blister formation in water resistance test al 3lte
T ime : Nu mber and size of the b lister
interval PS nPBR ·Commcrcia l
24 hn; Nil Nil Nil
4 daY-' Nil Nil Ni l
I week Nil Ni l Ni l
3 week I Ni l Ni l Few
I2week I Few Nil Medium
The photographs showing Initial appearance (berore the test) and final
appearance (after 12 weeks) of the coated samples for water resistance test are
given in figure 6b. 1.
Initial appearance
PB nPDR Commercial
Fi nal appearance
PB nPBR Commercial
Figure 6(). 1: Appearance of specimens before and qfier water resislal1ce test
The fil,.'Ure 6b. 1 and table 6b.2 clearly shows that sample nPBR is highly
resislalll 10 water and is nOl shows any blister even a l1 .:r I~ weeks. The sample
PB and commercially available paint show a little blis tering.
189
6b.3.2 Salt spray test
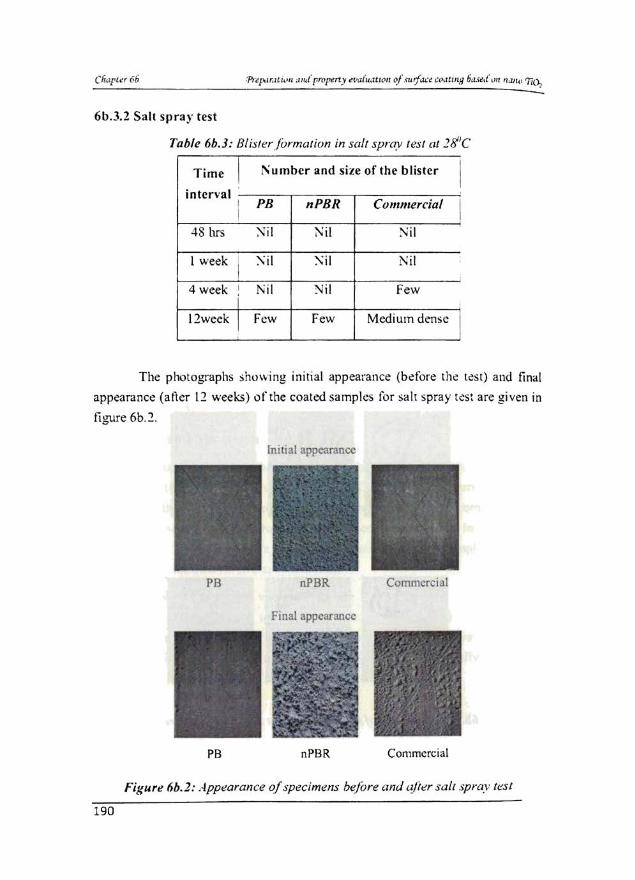
Table 6b.J: 81isler formation in saIl spray l e~·1 al ]SiC
. Time ! r\u mber and size of the blister I Interval
I PB nPBR Commercial I 48 hrs ~il 1'\d ~: il
t week I ~i1 :Sil Ni l
4 week I
i Nil ~il Few
12week ! F,w Few Medium dense I
The photographs showing in itial appearance (before the test) alld final
appcarJnce (after [2 weeks) of the coated samples for $a[t $pray test are given in
figure 6b.2 .
Ini tial appearance
PS nPBR Commercial
Final appearance
PB nPBR Commercial
Figure 6b.2: Appttarallce of specim!!ns btt}ore and uji!!r sall.,pra.v lesl
190
'Painl fomru{a.timt 'u"illi MM 7iOz ana ruDDer crumD
By analyzing the observations shown in table 6b.3 and the photographs
shown in figure 6b.2 we can see that the sample nPBR is stable as PB. The
sample coated with commercially available paint is more affected by salt water.
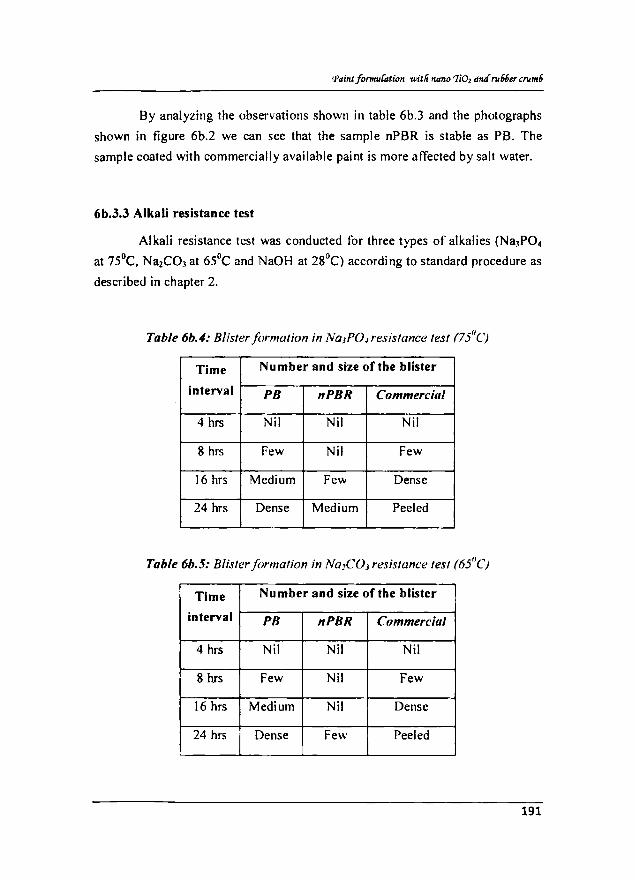
6b.3.3 Alkali resistance test
Alkali resistance test was conducted for three types of alkalies (NaJP04
at 7SoC, Na2C03 at 6SoC and NaOH at 28°C) according to standard procedure as
described in chapter 2.
Table 6b.4: Blister formation in NajPO~ resistance test (75"(')
Time Number and size of the blister
interval PH nPHR Commercial
4 hrs Nil Nil Nil
8 hrs Few Nil Few
16 hrs Medium Few Dense
24 hrs Dense Medium Peeled
Table 6b.5: Blister /brmation in Na}COJ resistance test (65IJC)
Time Number and size of the blister
interval PH nPHR Commercial
4 hrs Nil Nil Nil
8 hrs Few Nil Few
16 hrs Medium Nil Dense
24 hrs Dense Few Peeled
191
Cfillpttr 66 <PrtparatifJII aM property el'a{uation of surfaa coatino 6ast4 071 'kIno TLOz
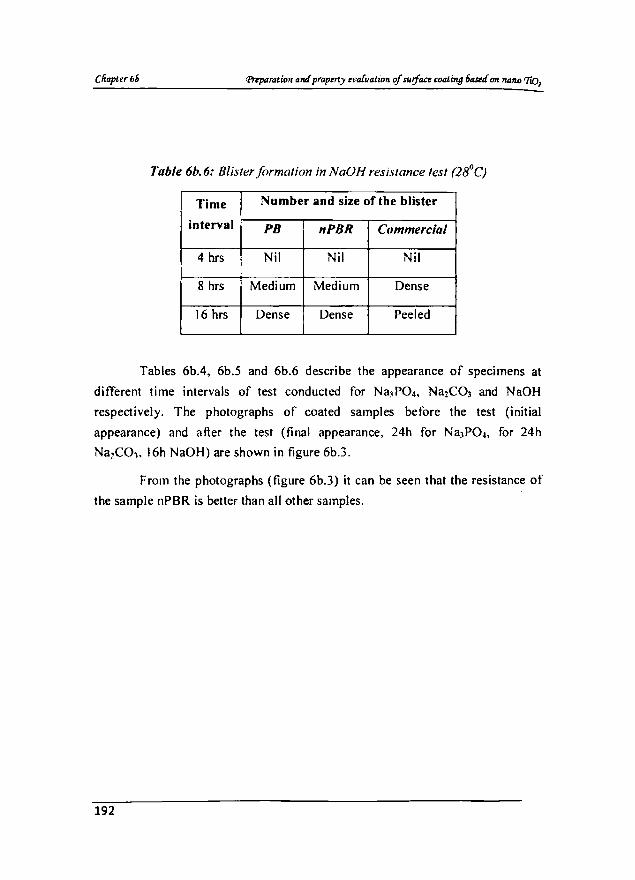
Table 6b.6: Blister formation in NaOH resistance test (28IJC:,)
Time Number and size of the blister
interval PB nPBR Commercial
4 hrs Nil Nil Nil
8 hrs Medium Medium Dense
16 hrs Dense Dense Peeled
Tables 6b.4, 6b.5 and 6b.6 describe the appearance of specimens at
different time intervals of test conducted for Na~P04, Na2COJ and NaOH
respectively. The photographs of coated samples before the test (initial
appearance) and after the test (final appearance, 24h for NaJP04, for 24h
Na2COJ. J6h NaOH) are shown in figure 6b.3.
From the photographs (figure 6b.3) it can be seen that the resistance of
the sample nPBR is better than all other samples.
192
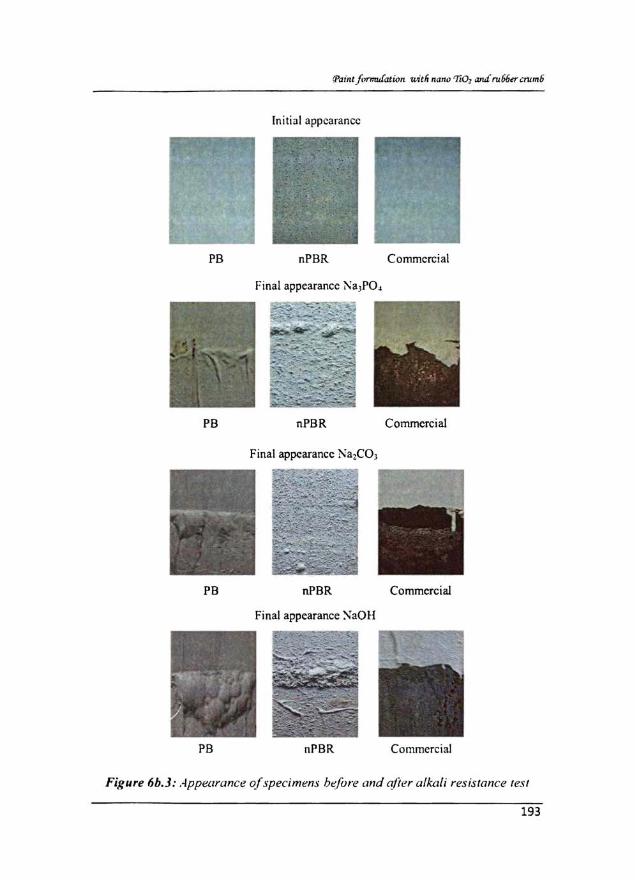
Initial appearance
PB nPBR Commercial
Final appearance l"alPO.
~ ~ PB nPBR Commercial
PS nPBR Commercial
Final appearance :\aOH
PB npaR Commercia!
Figure 6b.3: .-lppearance of specimens blt.{ure and q{ier alkali resistance (e_~t
193
Ct.tpw66
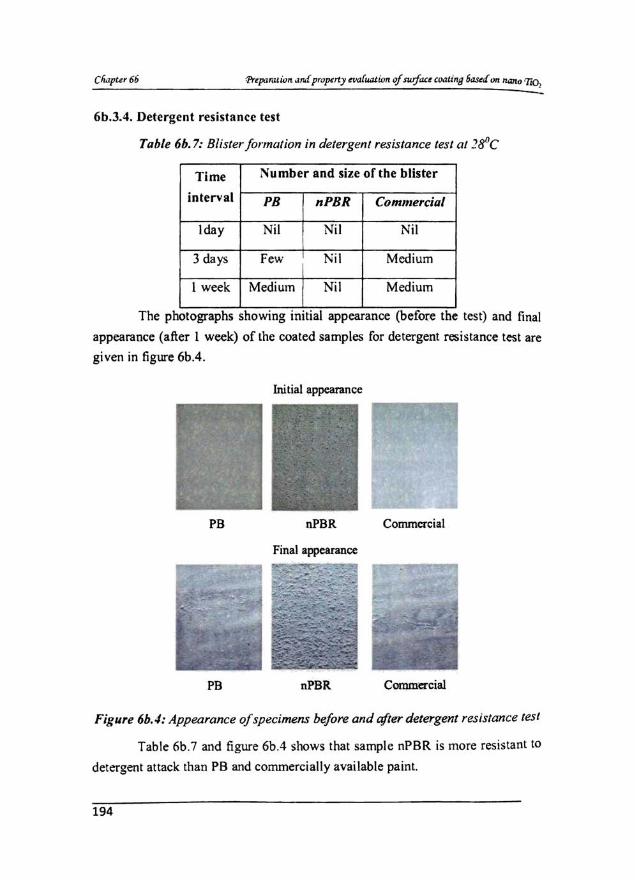
6b.J.4. Detergent resistance test
Tob/e 6h. 7: Blister formation in detergerll resistance lest al !ttc
Time Number and size orthe blister
interval PS nPBR Commerciol
lday Nil Nil Nil
3 day> Few Ni l Medium
I week Medium Nil Medium
. . The photographs shoWIng Imtlal appearance (before the test) and final
appearance (after I week) of the coated samples for detergent resistance test are
given in figure 6bA.
Initial appearance
PB nPBR Conunercial
Final appearance
PB nPBR Commercial
Figure 6b.J: Appearance of specimens before and atler detergent resistance test
Table 6b.7 and figure 6b.4 shows that sample nPBR is more resistant to
detergent attack than PB and commercially available paint.
194
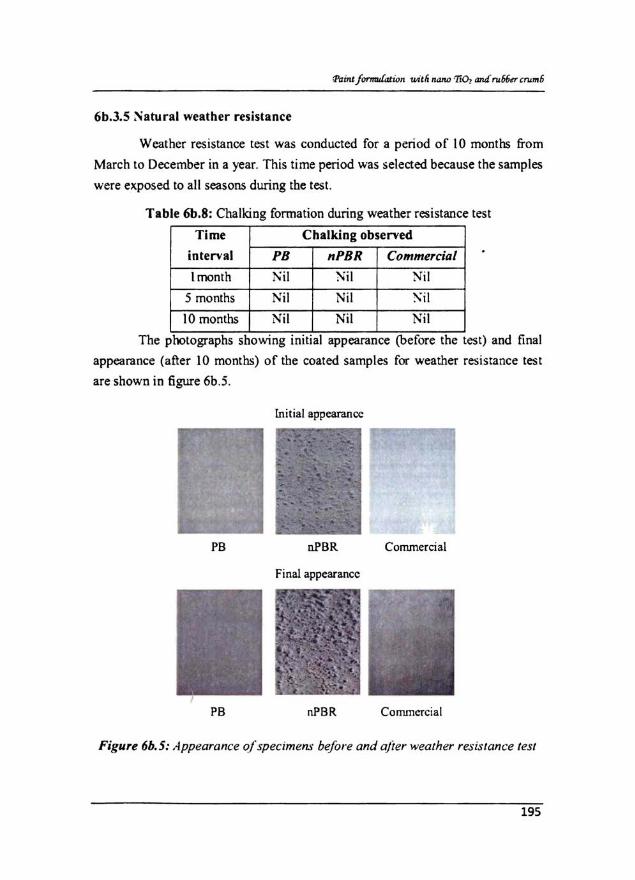
6b.3.S ~atural weather resistance
Weather resistance test was conducted for a period of to months from
March to December in a year. This time period was selected because the samples
were exposed to all seasons during the test.
Table 6b.8: Chalking formation during weather resistance test
Time Chalking observed
interval PH nPBR Commercial
I month Nil Nil Nil
5 months Nil Nil "Sil
10 months Nil Nil Nit
The photographs showmg Inttlal appearance (before the lest) and final
appearance (after 10 months) of the coated samples for weather resistance test
are shown in figure 6b.5.
mitial appearance
PB nPBR Commercial
Final ap~arancc
PB nPBR Commercial
Figure 6b.5: Appearance o/specimens bef ore and ajfer weather resistance test
195
CFiapter66 rJ>reparatwn alld property et,aIuatwn of surface Coali1lfJ 6a.mf 011 nGlIO TlQl
The figure 6b.5 and table 6b.8 shows that all the samples are very stable
towards natural weather and did not show any colour change or degradation
during the test.
The durability tests such as water resistance, salt spray resistance, alkali
resistance, detergent resistance and weather resistance tests carried out for
different specimens shows that the sample nP8R is having good resistance
towards various chemicals. The presence of rubber crumb may actively resist the
attack of chemicals and climate conditions due to the inherent resistance of
rubber crumb.
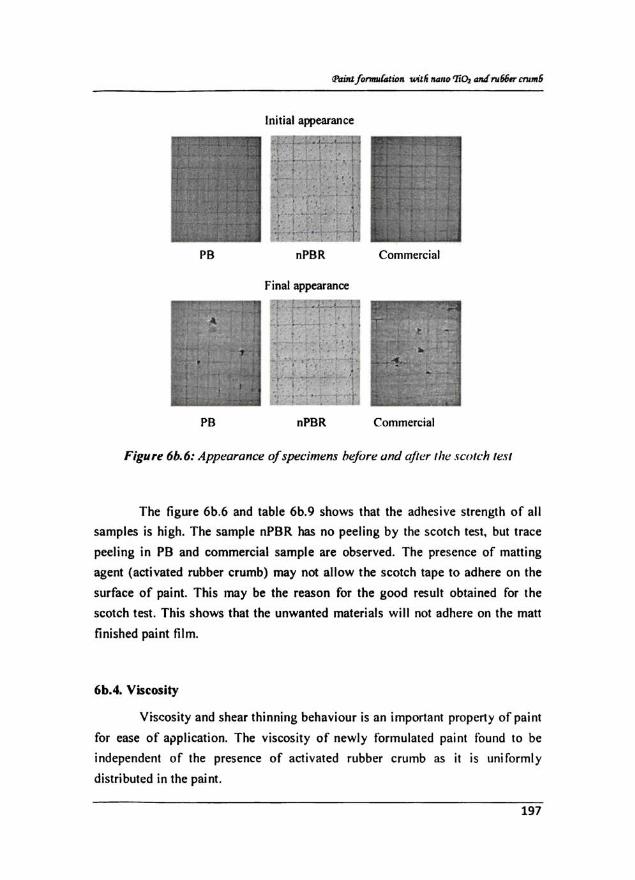
6b.3.6 Scotch test
The cross cut adhesion test is carried out to know the adhesion of paint
films on the substrate. The adhesion rating according to ASTM standards is
shown in the table 6b.9.
Table 6b.9: Adhesion rating assessed by scotch test
Sample name Classification % removal
PB 48 Less than 5%
nP8R 58 0%
Commercial 38 5 -15%
The photographs of test specimens before and after the test are shown in
figure 6b.6
196
Inilial appea1ance
., .' c.. j
P8 nPBR Commercial
Final appearance
P8 nPBR Commercial
Figuu 6b.6: Appearance o/specimens hejore and after Ihe Jcolc:h test
The figure 6b.6 and table 6b.9 shows that the adhesive strength of all
samples is high. The sample nPBR has no peeling by the scotch test. but trace
peeling in PS and commercial sample are observed. The presence of matting
agent (activated rubber crumb) may nol allow the scotch tape to adhere on the
surface of paint. This may be the reason for the good result obtained for Ihe
scotch test. This shows that the unwanted materials will not adhere on the matt
finished paint film.
6b.4. Viscosity
Viscosity and shear thinning behaviour is an importanl property of pain!
for ease of a"plication. The viscosity of newly formulated painl found to be
independenl of the presence of activated rubber crumb as it is uniformly
distributed in the paint.
197
- ,-PS • r. 'PBR ~ - Commercial
Shear rale (rpm)
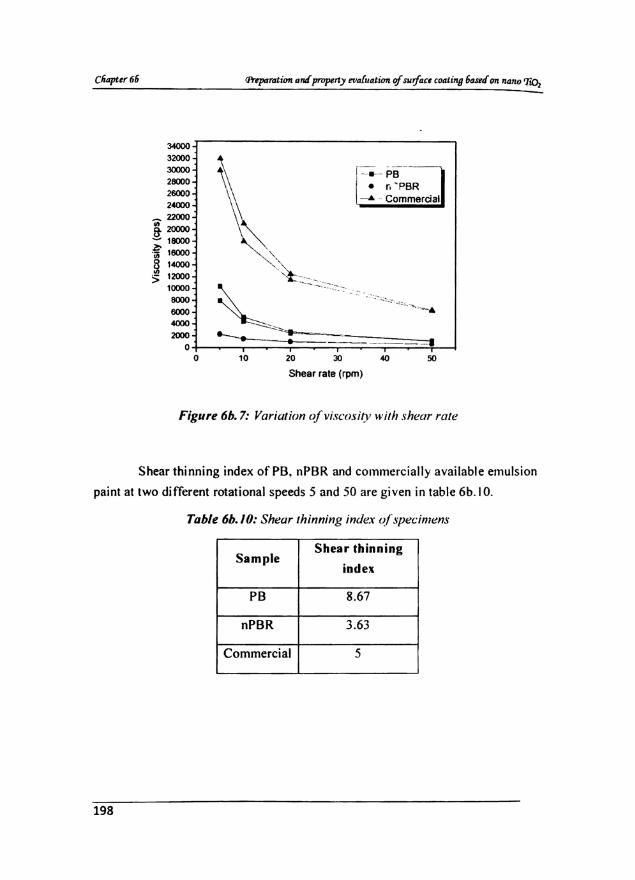
Figure 6b. 7: Variation ojv;.fcmity with shear rate
Shear thinning index ofPB. nPBR and commercially available emulsion
paint at two different rotational speeds 5 and 50 are given in table 6b. IO.
Table 6b.IO: Shear thinning index (?f"spec:inll:ns
Sample Shear thinning
index
PO 8.67
nPBR 3.63
Commercial 5
198
<Paint jonnu(Qtion witli nallo 'liOz mu! ru66er crum6
6b.S. Conclusions
The paint formulation using the binder based on V Ac-BuA copolymer,
pigment nano Ti02 sol and activated rubber crumb as a matting agent was found
to give better performance compared to commercially available paint and paint
formulated with conventional Ti02• The newly developed coating has good UV
shielding ability and durability compared to the paints prepared with
conventional Ti02•
Reference
1 (a) Flairhurst D. Mitchnick MA; "Particu/ate Sun Blocks: General Principle", Sunscreens, 2nd Ed .. Lowe NJ, Shaath NA, Pathak MA (Eds.), Marcel Dekker Inc, New York. 1997,313.
(b) Kligman LH, Kligman AM; "U/tra Radiation-Induced Skin Aging", Sunsc:reens, 2nd Ed .• Lowe NJ, Shaath NA, Pathak MA (Eds.), Marcel Dekker Inc, New York. 1997, 117
2 (a) Putman BJ; Quantification of the Effects of Crumb Rubber in CRM Binders, Dissertation. Clemson University, Clemson, SC, 2005.
(b) Rubber Manufacturers Association (RMA), US Scrap Tire Markets 2003 Edition, Rubber Manufacturers Association, Washington, D.e., 2004.
199
6c: Paint formulation with nano Ti02 and natural biocide
6c.l Introduction
The synthesised colloidal nano Ti01 sol has high sunscreen capability,
appropriate particle size, stabilization in a neutral pH region, and suppression of
photo catalytic activity. TiOrbased surface coating has ultraviolet ray (UV-ray)
shielding ability due to UV-ray absorption and UV-ray scattering. Since the
extent of light scattering depends on the relationship between the particle size
and the wavelength of corresponding light. reduction of Ti02 particle diameter
achieves high transparency in visible light, while UV-ray absorptivity increases
with the extension of the geometric area occupied by TiOz.
The particle size of conventional ultrafine Ti02 is about 20 to 50 nm,
which is designed in consideration of ideal sunscreen capability based on
powdery TiOz.' For further UV-ray absorption and visible light transparency,
particle size is required to be much smaller.2 However, the reduction of particle
size causes an aggregation, which behaves as though it is one larger-sized Ti02
particle, there by exhibiting less effectiveness as a sunscreen agcnt.H The
sunscreen performance is dependent on how well the ultra fine particles are
dispersed in the paint formulation. It is well known that employing the Ti02 in a
predispersed form rather than powder form improves the quality of final
dispersion.Ti02 colloidal sol, which is an ultimate dispersion, would be
expected to facilitate the preparation of high UV shielding coating.
Carboxymethyl chitosan used as biocide for improving the antimicrobial
activity of paint formulated with nano colloidal sol as pigment.
6c.2 Experimental
Paints were made by mixing latex with various ingredients as per the
formulation given in Table 6c.l. Various latex paints were prepared by using
conventional Ti02 and synthesized nano Ti02 colloidal sol.
Cfutpter6c 'Preparatioll and evJuation tf suifare c04tillg 6asetf 011 1IQ1l0 Tr01
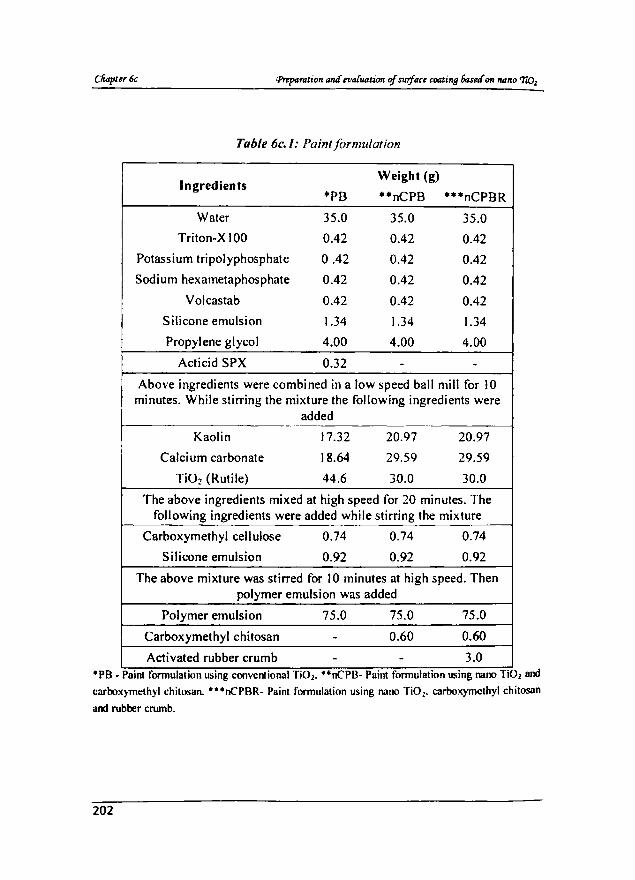
Table 6c.l: Paint formulation
Ingredients Weight (g)
·PB **nCPB ***nCPBR
Water 35.0 35.0 35.0
Triton-X I 00 0.42 0.42 0.42
Potassium tripolyphosphate 0.42 0.42 0.42
Sodium hexametaphosphate 0.42 0.42 0.42
Volcastab 0.42 0.42 0.42
Silicone emulsion 1.34 1.34 1.34
Propylene glycol 4.00 4.00 4.00
Acticid SPX 0.32 - -Above ingredients were combined in a low speed ball mill for 10
minutes. While stirring the mixture the following ingredients were added
Kaolin 17.32 20.97 20.97
Calcium carbonate 18.64 29.59 29.59
Ti02 (Rutile) 44.6 30.0 30.0
The above ingredients mixed at high speed for 20 minutes. The following ingredients were added while stirring the mixture
Carboxymethyl cellulose 0.74 0.74 0.74
Silicone emulsion 0.92 0.92 0.92
The above mixture was stirred for 10 minutes at high speed. Then polymer emulsion was added
Polymer emulsion 75.0 75.0 75.0
Carboxymethyl chitosan - 0.60 0.60
Activated rubber crumb - - 3.0 ·PB· Paint formulallon using convenllonul T,Ol. UnCPB· Paint formulation using naoo T101 and
caroox)methyl chitosan. ···nCPBR· Paint formulation using nuoo Ti01_ carbox)methyl chitosan
and rubber cnunb.
202
PdUu formulatioll witli 1112110 '1i0z IlIItf 'laluraJ 6iocitfe
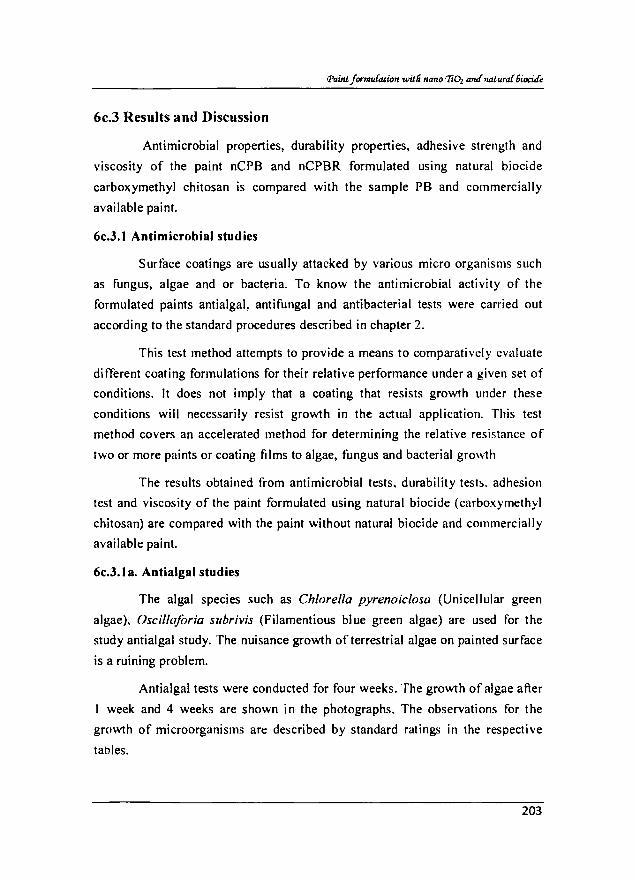
6c.3 Results and Discussion
Antimicrobial properties, durability properties, adhesive strength and
viscosity of the paint nCPB and nCPBR formulated using natural biocide
carboxymethyl chitosan is compared with the sample PB and commercially
available paint.
6c.3.1 Antimicrobial studies
Surface coatings are usually attacked by various micro organisms such
as fungus, algae and or bacteria. To know the antimicrobial activity of the
formulated paints antialgal, antifungal and antibacterial tests were carried out
according to the standard procedures described in chapter 2.
This test method attempts to provide a means to comparatively evaluate
different coating formulations for their relative performance under a given set of
conditions. It does not imply that a coating that resists grovvth under these
conditions will necessarily resist growth in the actual application. This test
method covers an accelerated method for determining the relative resistance of
two or more paints or coating films to algae, fungus and bacterial grO\~1h
The results obtained from antimicrobial tests, durability tests. adhesion
test and viscosity of the paint formulated using natural biocide (carboxymethyl
chitosan) are compared with the paint without natural biocide and commercially
available paint.
6c.3.1 a. Antialgal studies
The algal species such as Ch/oreI/o pyrenoiciosa (Unicellular green
algae), Oscil/a/oria subrivis (Filamentious blue green algae) are used for the
study anti algal study. The nuisance growth of terrestrial algae on painted surface
is a ruining problem.
Antialgal tests were conducted for four weeks. The growth of algae after
week and 4 weeks are shown in the photographs. The observations for the
growth of microorganisms are described by standard ratings in the respective
tables.
203
CFrDpter5C
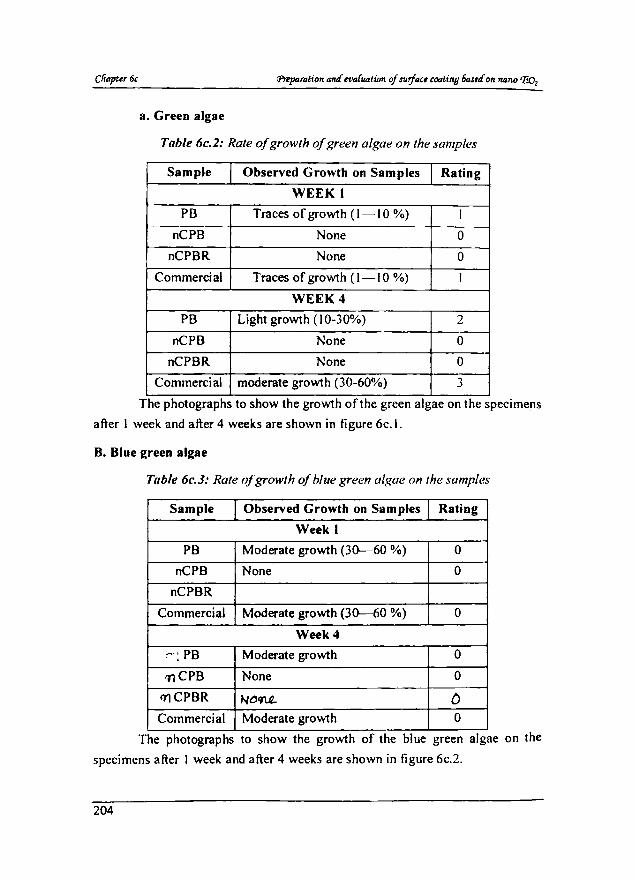
a. Green algae
Table 6c.2: Rate of growth of green algae on the samples
Sample Observed Growth on Samples Rating
WEEK t PB Traces of growth (1-10 %) I
nCPB None 0
nCPBR None 0
Commercial Traces of growth (1-10 %) I
WEEK4
PB Light growth ( I 0-30%) 2
nCPB None 0
nCPBR None 0
Commercial moderate growth (30-60%) 3
The photographs to show the growth of the green algae on the specimens
after I week and after 4 weeks are shown in figure 6c.l.
B. Blue green algae
n,ble 6c.3: Rate of growth of blue green algae on the samples
Sample Observed Growth on Samples Rating
Week I
PB Moderate growth (3(}""-60 %) 0
nCPB None 0
nCPBR
Commercial Moderate growth (3(}""-60 %) 0
Week 4
r;PB Moderate growth 0
'J1 CPB None 0
t)'lCPBR NO'1\A... D Commercial Moderate growth 0
The photographs to show the growth of the blue green algae on the
specimens after I week and after 4 weeks are shown in figure 6c.2.
204
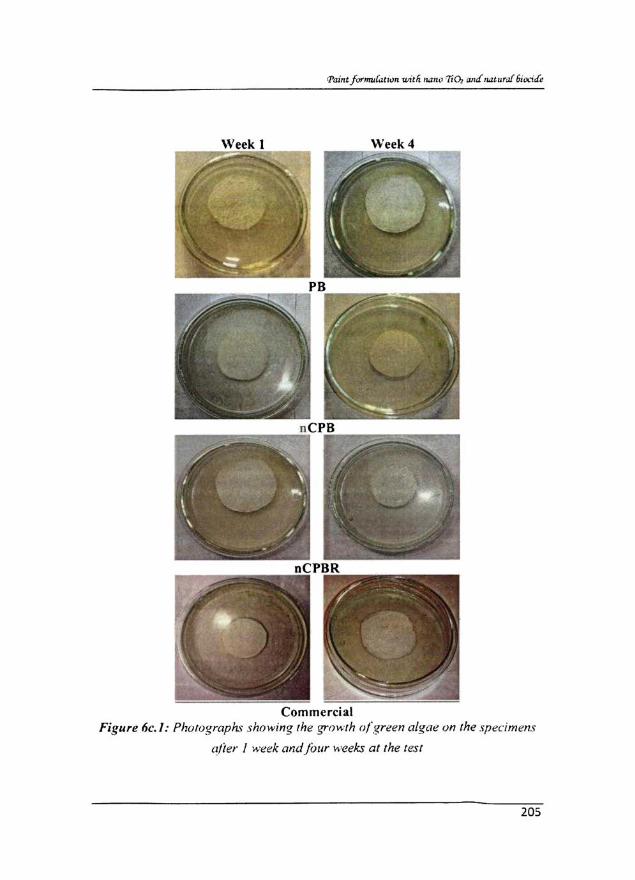
rnnlft !C)I'>mJ(oJl'<J" willi ••• l1w '7i0" ""t! ,r;Uur,;.{ 6iuri,{e
Commercial Figure 6e. J: Phutographs sho wing ' he !:,,,owrh o{ green a/gat! un the spet:im"fls
(~/ie,. I week andJour weeks at the test
205
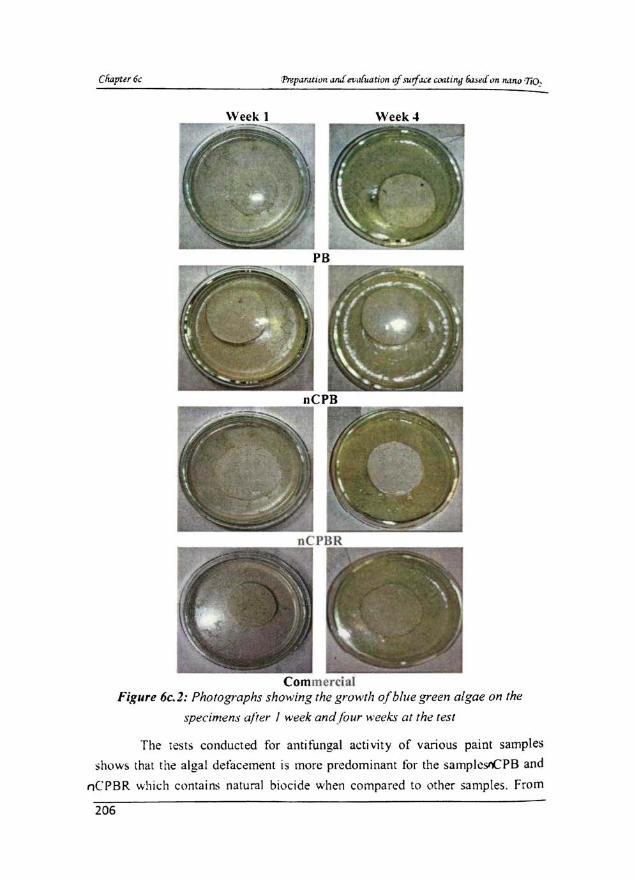
Cliapflr6c
Figure 6c. l : Photographs showing Ihe growth orb/lfe green algae 0 11 the
~pecimens ajier I week and/our weeks at (he tes/
The iests conducted for antifungal activi ty or various paint samples
shows that the algal defacement is more predominant for the samp[,:5/'CPB and
nCPBR whi~h clmtains natural biocide when compared to other samples. From
206
Paint jcrmuftaum witli IIallo'1lOz ad tUZturaf 5iociae
the rating tables and figures for the gro'Nth of green and blue green algae we can
observe that the samplegtCPB ancinCPBR are not attacked by algae. The gro'Nth
of the algae can be observed on PB and commercially available paint samples.
This shows that carboxymethyl chitosan can effectively control the growth of
algae in paints.
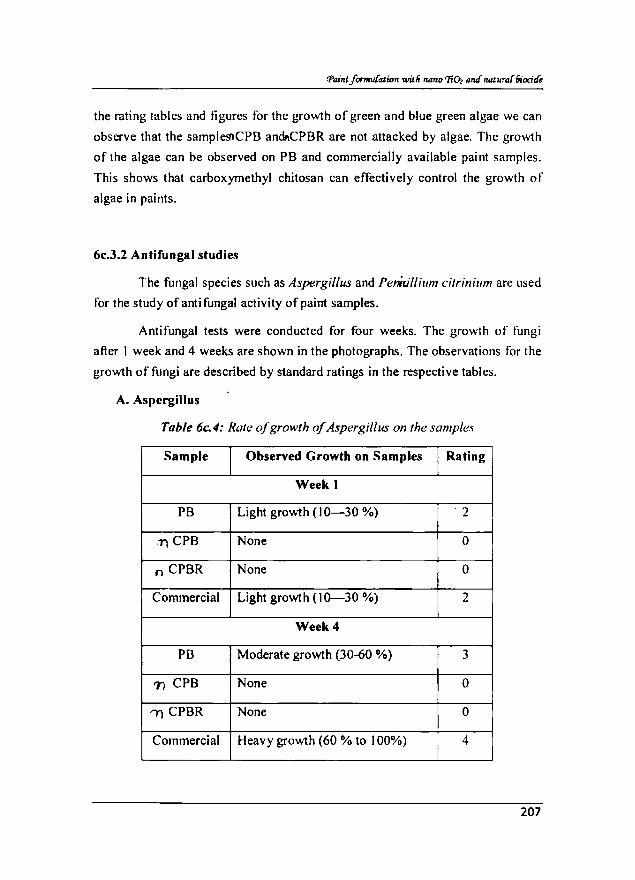
6c.3.2 Antifungal studies
The fungal species such as Aspergillus and Penicillium cilrinium are llsed
for the study of anti fungal activity of paint samples.
Antifungal tests were conducted for tour weeks. The growth of fungi
after I week and 4 weeks are shown in the photographs. The observations for the
gro'Nth of fungi are described by standard ratings in the respective tables.
A. Aspergillus
Table 6c.4: Rale afgrowth of Aspergillus on Ihe samples
Sample Observed Growth on Samples Rating
Week I
PB Light growth (10-30 %) '2
7) CPB None 0
n CPBR None 0
Commercial Light growth (10-30 %) 2
Week 4
PB Moderate growth (30-60 %) 3
71 CPB None 0
'1') CPBR None 0
Commercial Heavy gro'Nth (60 % to 100%) 4
207
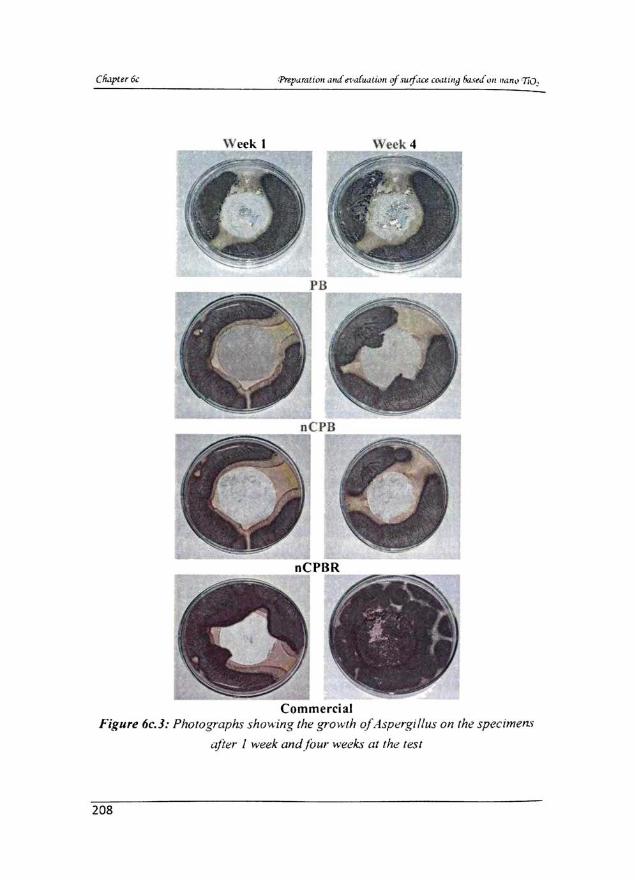
Week I
Commercial Figure 6c.J: Photographs sho ..... ing the growth o/Aspergillus on Iht! specimen.~
aPldr I week and/our ..... eeks allhe leSI
208
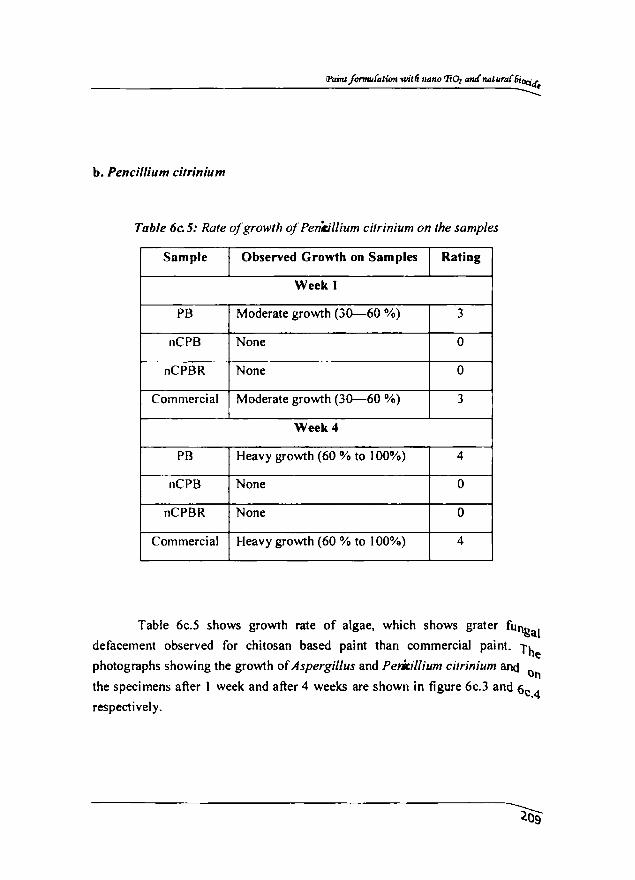
b. Pencillium c:itrinium
iPairU /tmnJI(atioTl wit Ii IUJIW '1i Oz an4 Rat rmJ( 6i1lcj~
-----
Table 6c.5: Rate of growth of Peni:illium citrinium on the samples
Sample Observed Growth on Samples Rating
Week I
PB Moderate growth (30-60 %) 3
nCPB None 0
nCPBR None 0
Commercial Moderate growth (30-60 %) 3
Week 4
PB Heavy growth (60 % to 100%) 4
nCPB None 0
nCPBR None 0
Commercial Heavy growth (60 % to 100%) 4
Table 6c.5 shows growth rate of algae, which shows grater fUn&a.1
defacement observed for chitosan based paint than commercial paint. l'he photographs showing the growth of Aspergillus and Peoollium citrinium and
Oil the specimens after I week and after 4 weeks are shown in figure 6c.3 and 6c.4
respectively.
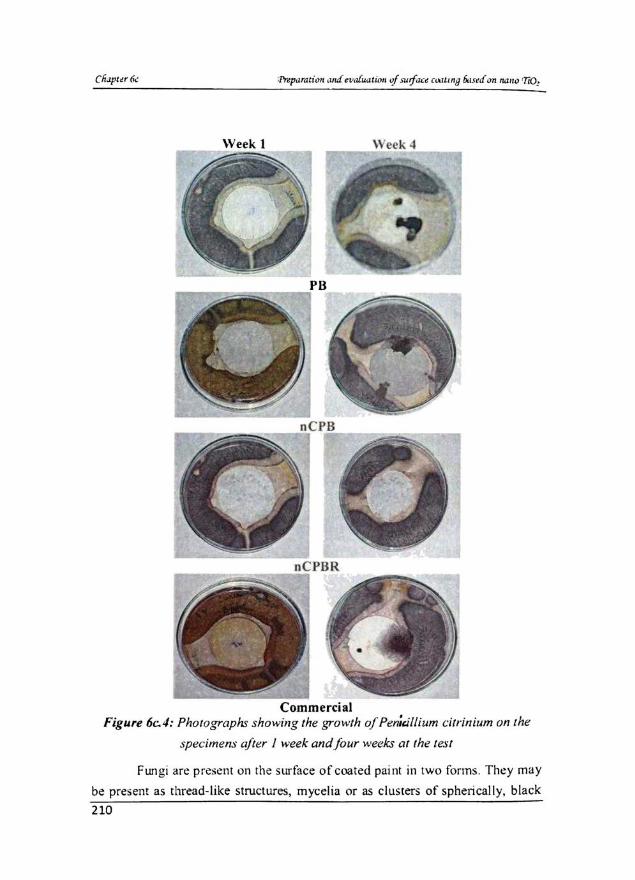
Figure 6c.4: Photographs showing the growth of Peniullium dtrinium on the
specimen:> after 1 week and/our weeks al the tel' ,
FWlgi are prl'::icl1t on the surface of coated paint in two forms. They may
be present as thread- like structures, mycelia or as clusters of spherically, black
210
Paint jfJf'l1Wfation witli 114110 '1iOz aM Ilaturaf6iocitle
coloured spores. The mycelia structures are observed when conditions under
fungi are relatively growing and reproducing. Spore clusters are found when
conditions for growth and reproduction are less favourable. Spores are more
resistant to environmental changes and anti-microbial agents than the mycelia
forms. Growth of two type of fungi spore on paint film is observed after 4
weeks, as shown in photograps. The carboxymethyl chitosan based coating
shows better resistance to fungi attack than commercial paint film.
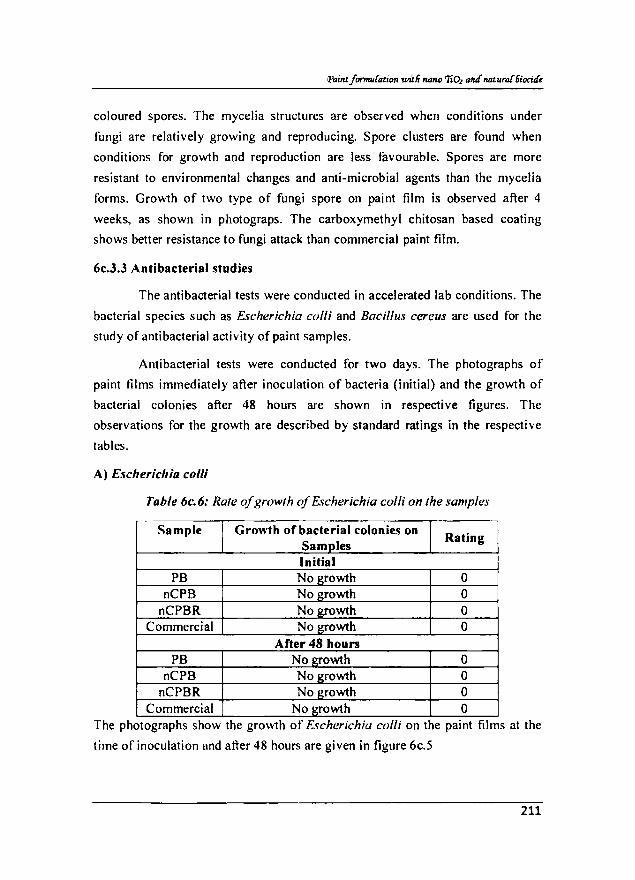
6c.3.3 Antibacterial studies
The antibacterial tests were conducted in accelerated lab conditions. The
bacterial species such as Escherichia colli and Bacillus cereus are used for the
study of antibacterial activity of paint samples.
Antibacterial tests were conducted for two days. The photographs of
paint films immediately after inoculation of bacteria (initial) and the growth of
bacterial colonies after 48 hours are shown in respective figures. The
observations for the growth are described by standard ratings in the respective
tables.
A) E.'ic/rericlria colli
Table 6c.6: Rate o/growth 0/ Escherichia colli on the samples -
Sample Growth ofbac:terial colonies on Rating
Samples Initial
PB No growth 0 nCPB No growth 0
nCPBR No growth 0 Commercial No growth 0
After 48 hours PB No growth 0
nCPB Nogrowth 0 nCPBR No growth 0
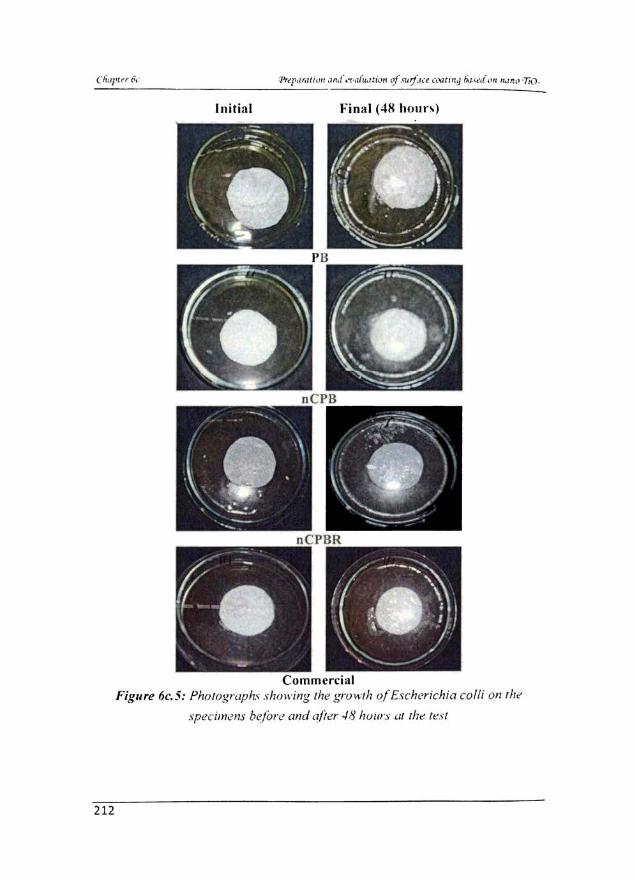
Commercial No growth 0 The photographs show the growth of Escherichia co/li on the pamt films at the
time of inoculation and after 48 hours are given in figure 6c.5
211
212
Initial .' ina! (48 hour),)
Commercial Figure 6c. 5: PholOgraph~ .~hol1'illg 'he gruw,h ~lE:,ch(!richia coW 0 11 rh ..
~pecimcl1s be/ore and (?Iir!r -18 huurs at rhe (est
'Paillt Jormufatioll witli 110110 'liDz ant! natura! 61'ocitfe
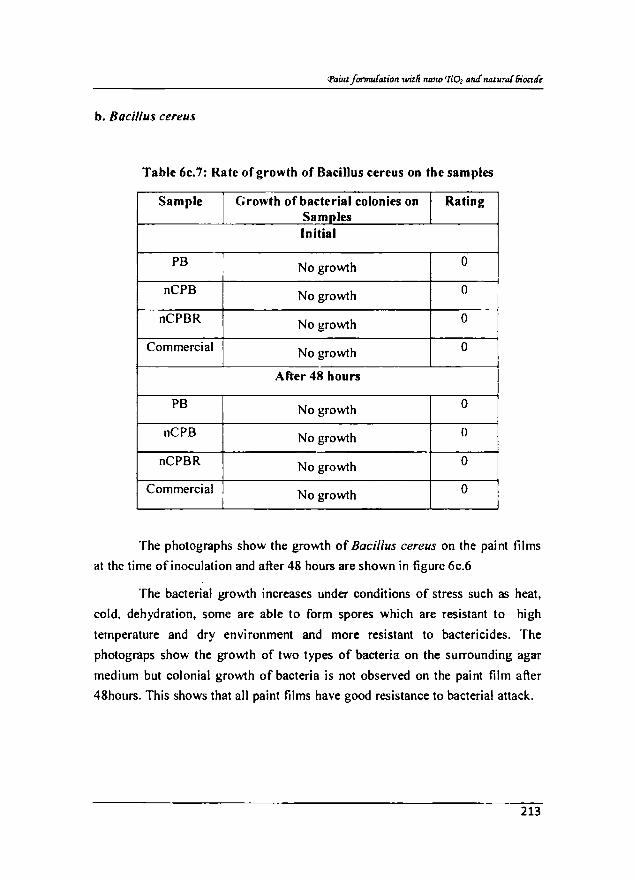
b. Bacillus cereus
Table 6c.7: Rate of growth of Bacillus cereus on the samples
Sample Growth of bacterial colonies on Rating Samples Initial
PB No growth 0
nCPB No growth 0
nCPBR No growth 0
Commercial No growth 0
After 48 hours
PB No growth 0
nCPB No growth 0
nCPBR No growth 0
Commercial No growth 0
The photographs show the growth of Bacillus cereus on the paint films
at the time of inoculation and after 48 hours are shown in figure 6c.6
The bacterial growth increases under conditions of stress such as heat,
cold, dehydration, some are able to form spores which are resistant to high
temperature and dry environment and more resistant to bactericides. The
photograps show the growth of two types of bacteria on the surrounding agar
medium but colonial growth of bacteria is not observed on the paint film after
48hours. This shows that all paint films have good resistance to bacterial attack.
213
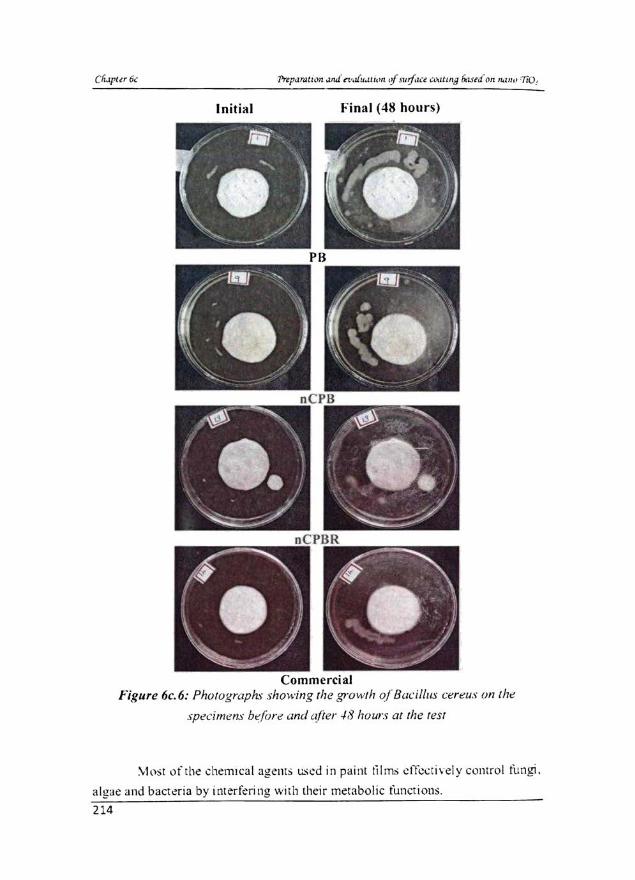
Initial Final (48 hours)
Figure 6c. 6: PhorogTilph~ showing the growth ofBacillw; cert!us on rht!
spi!~'imens b.:fori! and ,!Iiel' ../8 huurs at rhe lest
\"I,\SI ,lI the .;::hemlcal agents t.:. .. .:d in paint film.~ d!i.:":li\'cly control fungI.
algae and bac\.!ria by lnterl~ri ng with their metabolic functions .
214
!Paint jornaJfation witli n<l1Io'TfOz and IUlturaf 6iocUfe
The exact mechanism of the antimicrobial action of carboxymethyl
chitosan is still unknown, but ditTerent mechanisms have been proposed.
Interaction between positively charged chitosan molecules and negatively
charged microbial cell membranes leads to the leakage of proteinaceous and
other intracellular constituents.5 Chitosan acted mainly on the outer surface of
the bacteria. At a lower concentration «0.2 mg/mL), the polycationic chitosan
does probably bind to the negatively charged bacterial surface to cause
agglutination, while at higher concentrations, the larger number of positive
charges may have imparted a net positive charge to the bacterial surfaces to keep
them in suspension.6
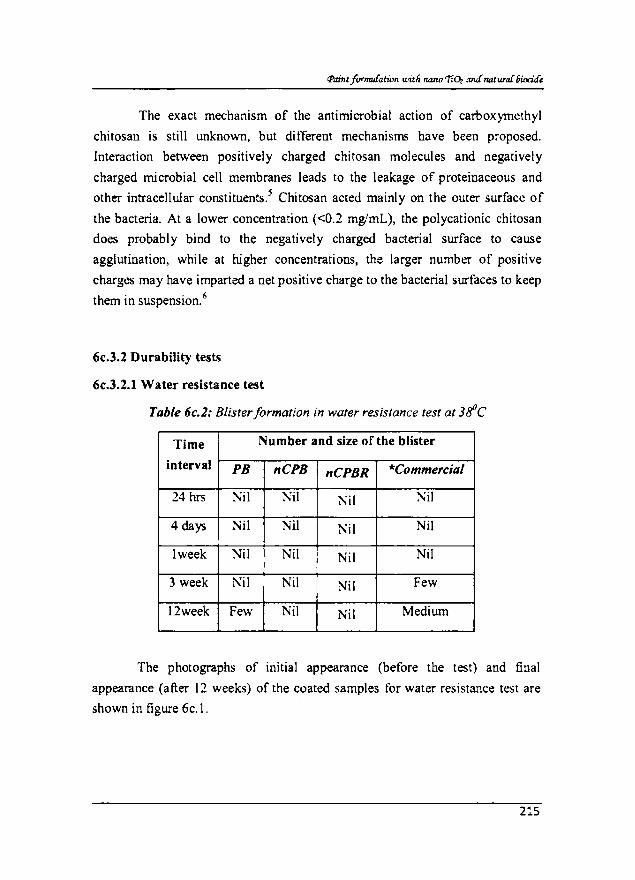
6c.3.2 Durability tests
6c.3.2.1 Water resistance test
Table 6c.2: Blister formation in water resistance test at 3/fC
Time Number and size of the blister
interval PB nCPB nCPBR *Commerc;al
24 hrs Nil ~il Nil ;-';il
4 days Nil Nil Nil Nil
lweek Nil Nil Nil Nil
3 week Nil Nil Nil Few
l2week Few Nil Nil Medium
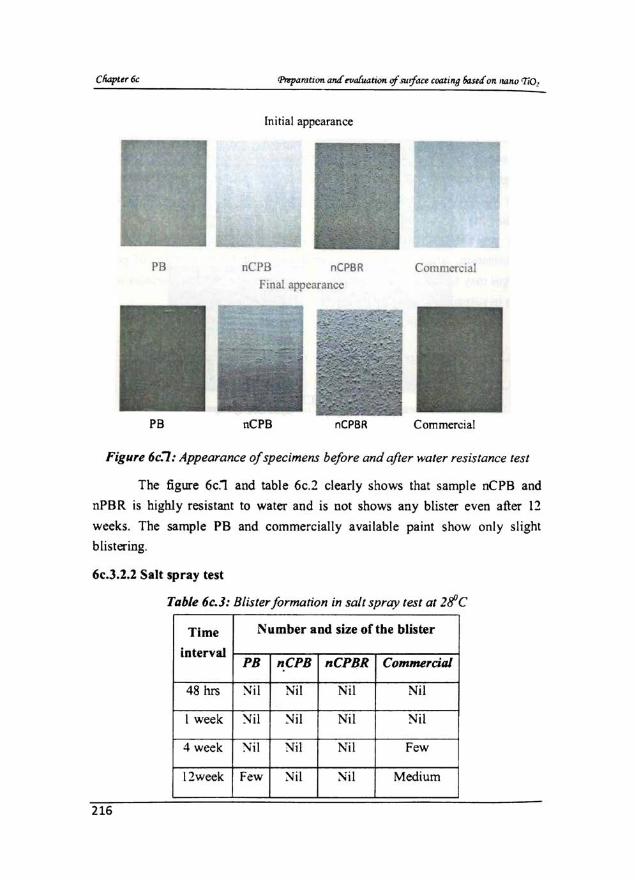
The photographs of initial appearance (before the test) and final
appearance (after 12 weeks) of the coated samples for water resistance test are
shown in figure 6c.l.
215
CMpttr6c
Initial appearance
PB nCPB nCPBR Commercial Final appearance
nC PB nCPBR Commercial
Fig ure 6c.' : Appearance o/specimens be/ore and after water resistance test
The figure 6c:1 and table 6c.2 clearly shows that sample nCPB and
nPaR is highJy resistant to water and is not shows any blister even after 12
weeks. The sample PB and commercially available paint show only slight
blistering.
6c.3.2.2 Salt spray test
Table 6c.J: Blister formation in salt spray lest 01 zSJc
Time Number a nd size or the blister
interval PR nCPB nCPBR Comwurcial
48 hrs ;..IiI Nil Nil Nil
I week ;..IiI :.IiI Nil Ni!
4 week :-.iil Nil Nil Few
12week Few Nil ;o.;i\ Medium
216
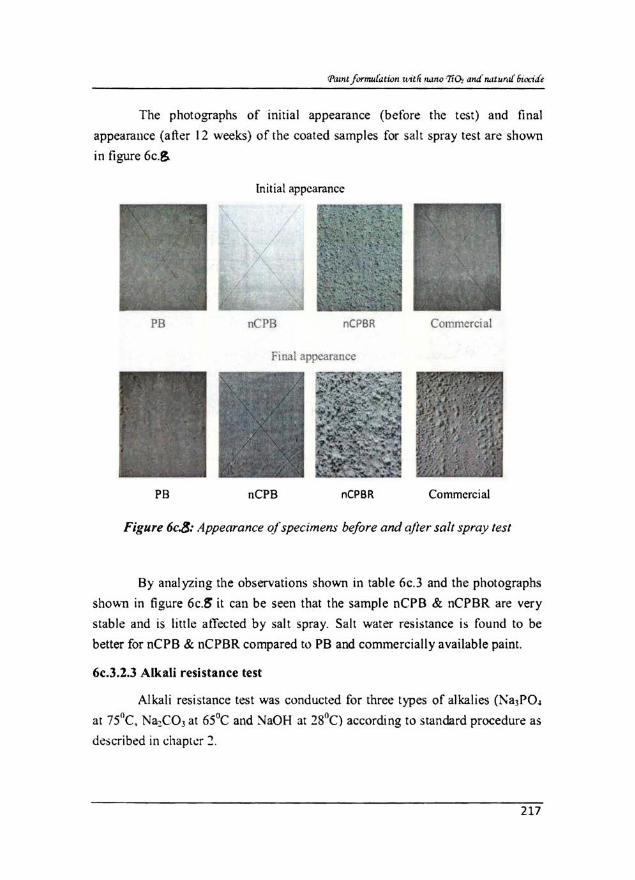
The photographs of initia l appearance (bcron;~ the test) and final
appearance (after 12 weeks) of the coated samples for salt spray test are shown
in figure 6c$
Initial appearance
PB .,erB nCPBR Commercia!
Final appearance
PB nePB n(PBR Commercial
Figure 6c./J: Appearance of specimens before and after salt spray test
By analyzing the observations shown in table 6c.3 and the photogrdphs
shov.n in figure 6c$ it can be seen that the sample nePB & nCPBR are very
stable and is little alTected by salt spray. Salt water res istance is found to be
better for nCPB & nCPBR compared tl> PB and commercially available paint.
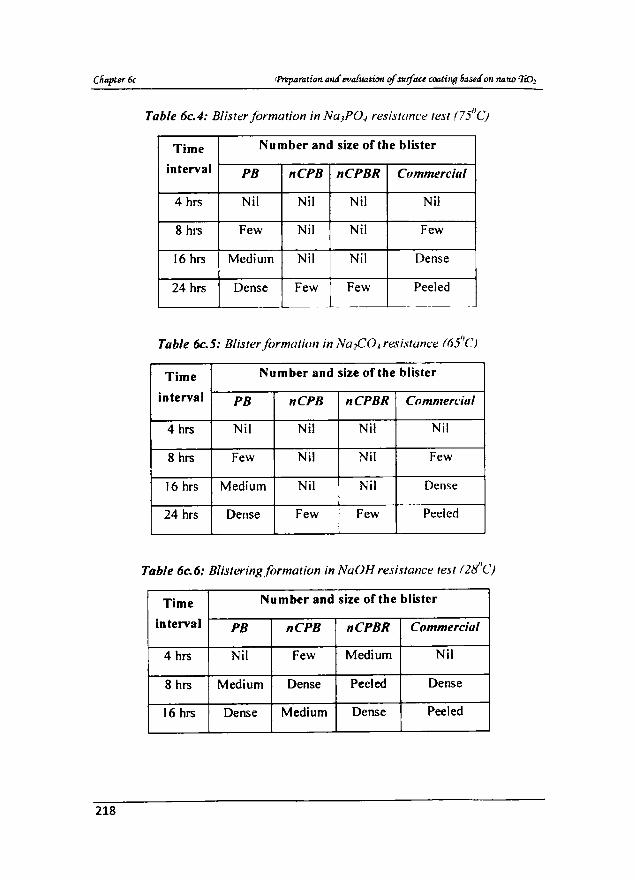
6c.3.2.3 Alkali resistance test
Alkali resistance test was Cl>nducted for three types of alkalies (l'a1POJ
at 7SIlC. Na!CO j at 65°C and ~aOH 3t 2SoC) according to standard procedun: as
described in chapt..:-r ::! .
217
Cliapter6c 'Preparation a,u! eYafJuztWtl of Sllfjace coatifIfJ oa.rea on nallO 'lio!
Table 6c.4: Blister formation in Na]PO-l resistance test (75()C)
Time Number and size of the blister
interval PB nCPB nCPBR Commercial
4 hrs Nil Nil Nil Nil
8 hI's Few Nil Nil Few
16 hrs Medium Nil Nil Dense
24 hrs Dense Few Few Peeled
Table 6c.5: Blister formation in Na~OJ resistance (65110
Time Number and size of the blister
interval PB nCPB nCPBR Commercial
4 hrs Nil Nil Nil Nil
8 hrs Few Nil Nil Few
16 hrs Medium Nil Nil Dense
24 hrs Dense Few Few Peeled
Table 6c.6: Blisteringformation in NaOH resistance test (N/C)
Time Number and size of the blister
interval PB nCPB nCPBR Commercial
4 hrs Nil Few Medium Nil
8 hrs Medium Dense Peeled Dense
16 hrs Dense Medium Dense Peeled
218
Initial appearance
PB oCPB nCPBR Commercial
PB nGPS nCPBR Commercial
Final appearance Na~COl
PB nCPB nCPBR Commercial
Final appearance :-.iaOH .--............
PB n(PS nCPBR Commercial
Figure 6c.9: Appt!(lrance of spec;meru /xjim! and {ljft!r alkali resisl<1l1ce lest
219
Cfiapter 6c (/>reparation anti tt,afuation of surface coating fituetf 011 ntlno '1iOz
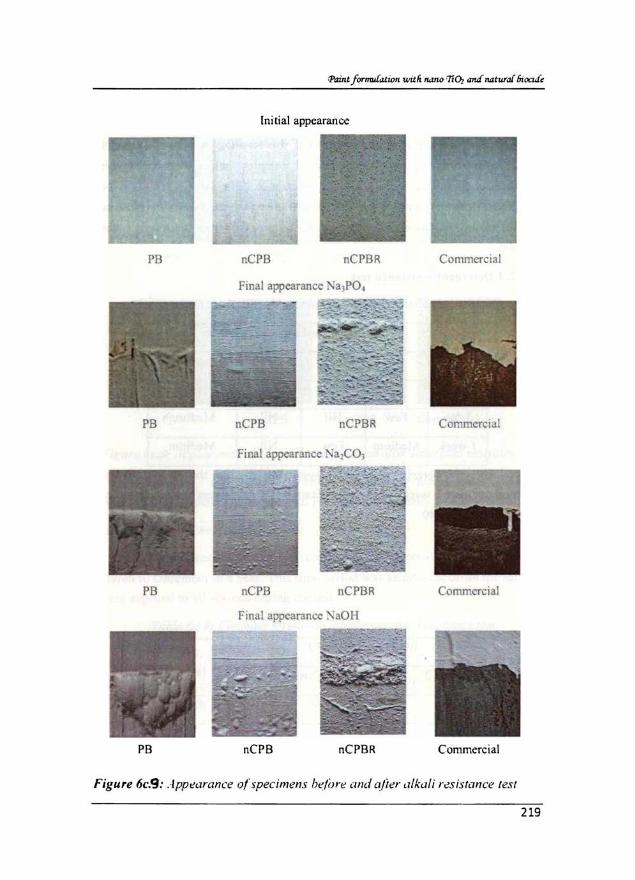
Tables 6c.4, 6c.5 and 6c.6 describe the appearance of specimens at
different time intervals of test conducted for Na]P04 , Na2COJ and NaOH
respectively. The photographs of coated samples before the test (initial
appearance) and after the test (final appearance, 24h for Na3P04, for 24h
Na2COJ , 16h NaOH) are shown in figure 6c.9. From the photographs we can see
that the alkali resistance of the sample nCPB and nCPBR are better than other
samples.
6c.3.2.4 Detergent resistance test
Tuble 6c.7: Blister formation in detergent resistance test at 2/lc
Time Number and size of the blister
interval PB nCPB nCPBR Commercial
I day Nil Nil Nil Nil
3 day Few Nil Nil Medium
I week Medium Few Nil Medium
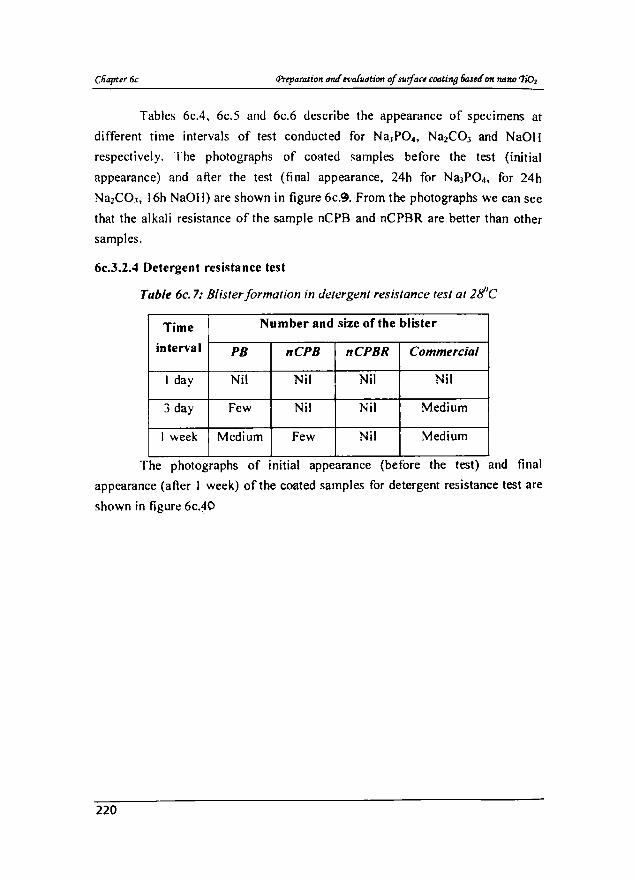
.. The photographs of Initial appearance (before the test) and final
appearance (after I week) of the coated samples for detergent resistance test are
shown in figure 6c.40
220
PS
PS
nCPB nCPBR
Final appearance
"""""~!!II
neps nCPBR
Commercial
Conunercial
Figu,.e 6c.1I: Appearance o/specimens before and after delergent resistance test
Table 6c.7 and figure 6c.1tI shows that sample nePB and nCPBR are
more resistant to detergent atlack than PS and commercially available paint.
6t.3.2.5 Natural weather resistance
Weather resistance test was conducted for a period of 10 months from
March to December in a year. This time period was selected because the samples
were exposed to all seasons during the test.
Table 6G8: ChallcingjormaJiQn during weather resistance lest
Time Chalkin& observed
interval PB nCPB nCPBR Commercial
1 month Nil Nil Nil Nil
5 months Ni l Nil i': i I Ni l
10 months Nil Nil :'\Iil ~il
221
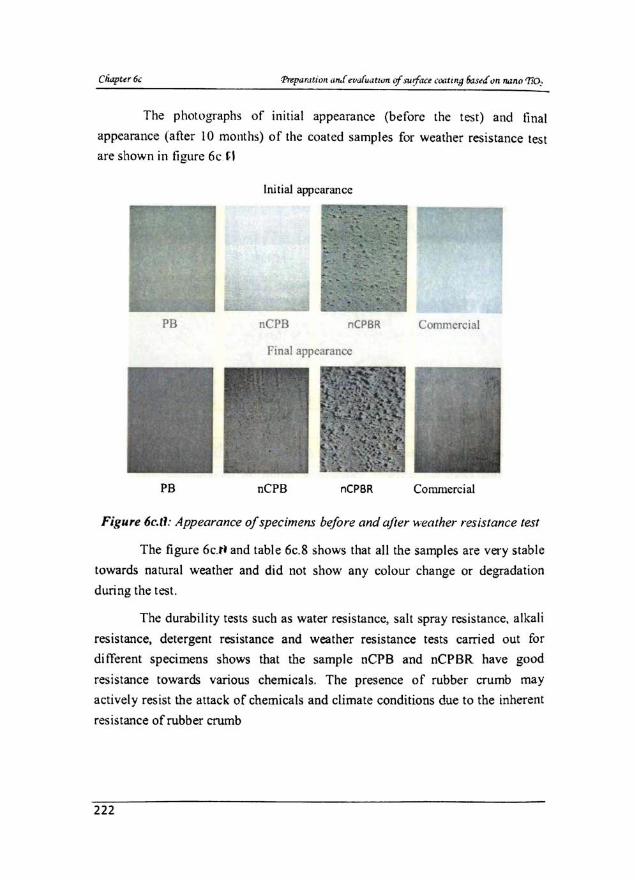
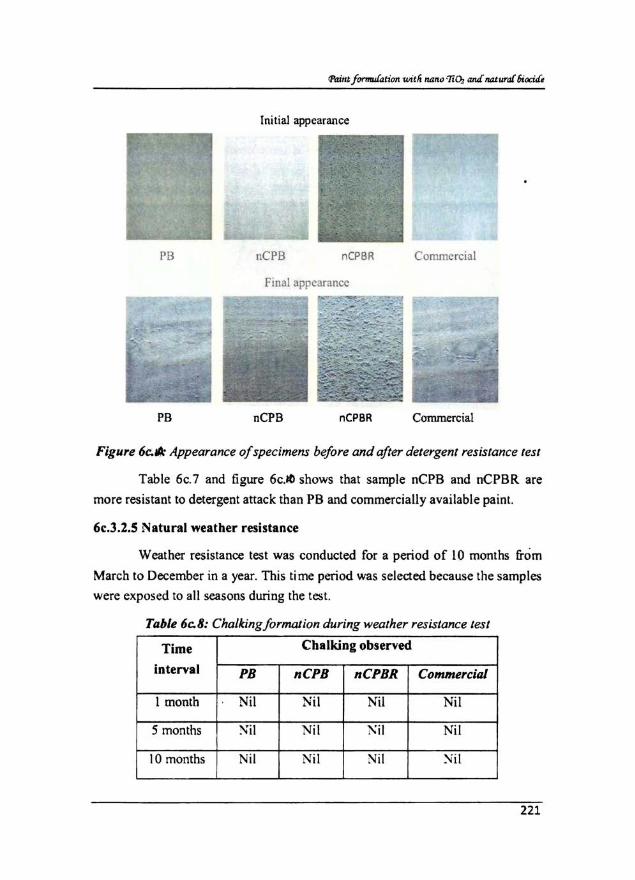
The photographs of initial appearance (before the lest) and linal
appcar<lnce (after 10 months) of the coated samples for weather resistance test
are shown in figure 6c U
PS
Initial appearance .....,............,. ...
nePB nCP8R
Final appearance
nCPB nCP8R
Commercial
Commercial
Figure 6c.tl: Appearance of specimens before and aJler weather resistance test
The figure 6c.tl and table 6c.8 shows that all the samples are very stable
towards narural weather and did not show any colour change or degradation
during the test.
The durability tests such as water resistance, salt sprdy resistance, alkali
resistance, detergent resistance and weather resistance tests carried out for
different specimens shows that the sample nePB and nePBR have good
resistance towards various chemicals. The presence of rubber crumb may
actively resist the attack of chemicals and climate conditions due to the inherent
resistance of rubber crumb
222
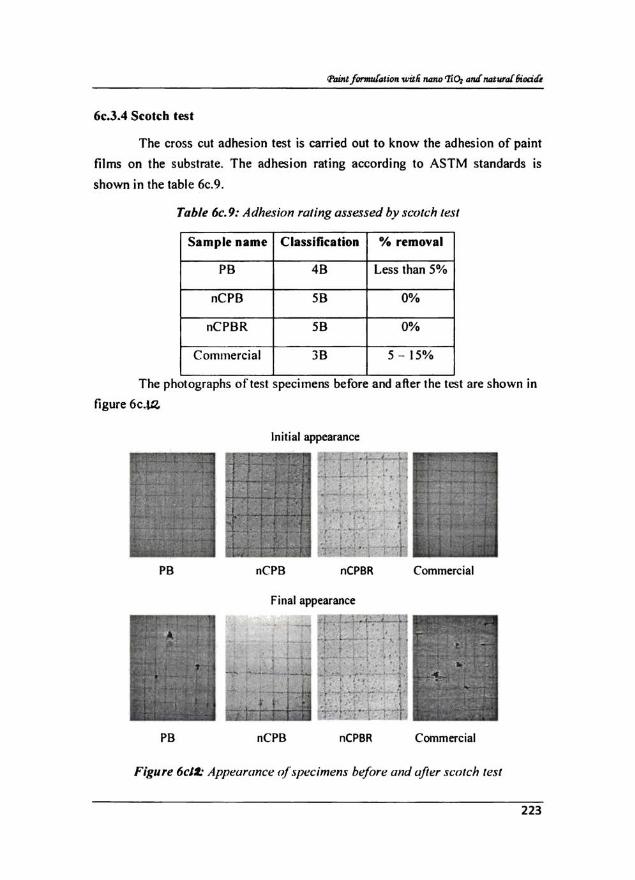
6c.3.4 Scorch test
The cross cut adhesion test is carried OUI to know the adhesion of paint
films on the subslrate. The adhesion rating according to ASTM standards is
shown in the table 6c.9.
Table 6c.9: Adhesion raling assessed by scutch test
Sample name Classification -I. removal
PB 4B Less than 5%
nCPB 5B 0%
nCPBR 5B 0%
Commercial )B 5 15%
The photographs of lest specLlnens before and after the test are shown in
figure 6c.Ul-
Initial appearance
PB nCPB n(PBR Commercial
Final appearance
PB nCPB n(PBR Commercial
Figure 6clJ: Appearance ofsJX!cimens before und ufter .fcolch lesl
223

The figure 6c.llZ.and table 6c.9 show that the adhesive strength of all
samples is high. The sample nePB and nCPBR has no peeling by the scotch test,
but s light peeling for PB and commercial sample are observed. The presence of
matting agent (activated rubber crumb) may not allow the scotch tape to adhere
on the surface of paint. This may be the reason for the good result obtained for
the scotch test. This shows that the unwanted materials will not adhere on the
matt finished paint film.
6c.3.5 Viscosity
Viscosity and shear thinning behaviour is an impotlant property of paint
for the ease of application. It depends on the size of the colloidal particles in
paint. Viscosity of newly formulated paint is independent of carboxymethyl
chitosan.
""'" """
\ -""'" • PB
""'" • nCPB
""" • nCPBR
- """ • Commercial §- \ - """ .'~;-.~ 1I!000 8 ,~ 5 """ ''''' \. ""'" ""'" ~
"'" , , '" '" '" '" Shear ra. (rpm)
Figure 6c.r!:Yarialion o/viscosity wilh shear role
Shear thinning index of PS. nePB. nCPBR and commercially available
emul sion paint at two differenl rOlational speeds 5 and 50 are given in table
6c.10.
224
Paint formuCation witli n<uw 'liDz aruf 1l4tural6iociu
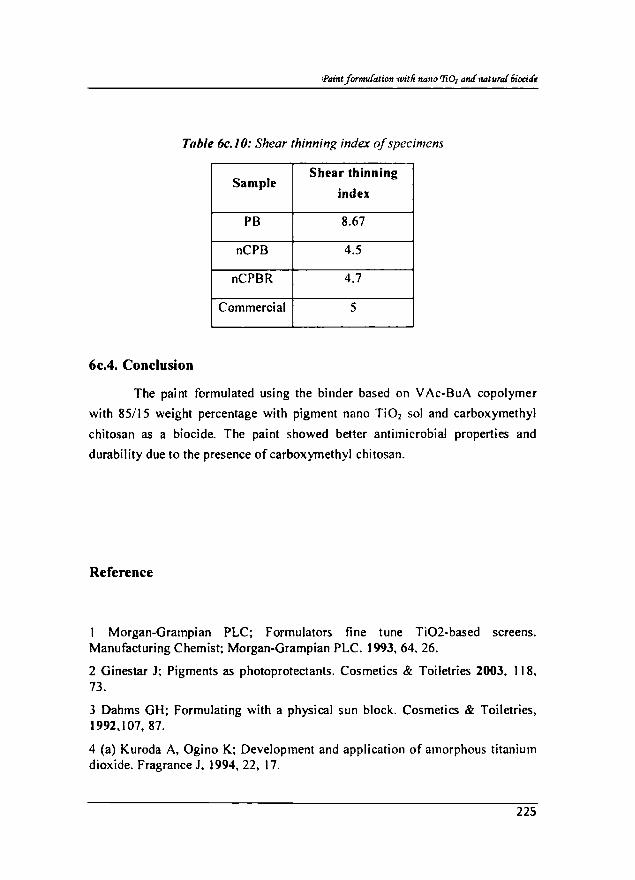
Table 6c.JO: Shear thinning index o.(specimens
Sample Shear thinning
index
PB 8.67
nCPB 4.5
nCPBR 4.7
Commercial 5
6c.4. Conclusion
The paint formulated using the binder based on VAc-BuA copolymer
with 85/15 weight percentage with pigment nano Ti02 sol and carboxymethyl
chitosan as a biocide. The paint showed better antimicrobial properties and
durability due to the presence of carboxymethyl chitosan.
Reference
Morgan-Grampian PLC; Formulators fine tune Ti02-based screens. Manufacturing Chemist; Morgan-Grampian PLC. 1993, 64, 26.
2 Ginestar J; Pigments as photoprotectants. Cosmetics & Toiletries 2003, 1 18, 73.
3 Dahms GH; Formulating with a physical sun block. Cosmetics & Toiletries, 1992,107, 87.
4 (a) Kuroda A, Ogino K; Development and application of amorphous titanium dioxide. Fragrance J, 1994, 22, 17.
225
Cliapter6c Preparallon aruf I'l'a{uati071 of suiface coati7ls 5asea 071 710710 'liOz
(b)Lowe NJ, Fredlander J; "Sunscreens: Ra/ionale for Use to Reduce Photodamuge and Phot%xicity", SlIl1screens, 2nd Ed., Lowe NJ, Shaath NA, Pathak MA (Eds.), Mm'cel Dekker Inc, New York, 1997,35.
(c) Kligman LH, Kligman AM; "Ulira Radiation-Induced Skin Aging", Sunscreen.\', 2nd Ed., Lowe NJ, Shaath NA, Pathak MA (Eds.). Marcel Dekker Inc, New York, 1997, 117.
(d) Stamatakis P, Palmcr BR; J Cootillg Tech 1990.62,789,95.
(e) Sakamoto M. Okuda H. Futamata H. Sakai A lida M: J Jpn 80c Mater 1995, 68,4,203.
(£) flairhurst D. Mitchnick MA; "j'ur/iell/u/e SUI1 B/ocks: General Principle", SlII1SCreem', 2nd Ed., Lowc NJ. Shaath NA. Pathak MA (Eds.), Marcel Dekker Inc. New York. 1997,3 I 3.
(g) Kelly KA. Ewing GD, Dromgoole SI L Lichtin .lL, Sakr AA; ./ Soc Cos met Ch em 1993.44. 139.
(h) Howard PH, Saxema J. Durkin PR: "RevieJ!' and Evulllatiof1 (if Available Techniques /Clr Determining Pr!rcestul1ce al1d ROll/es of Degradu/ion of chemical slIbstunce in the En virn I ll11elll" EAI' Report No.560/5-75-006, 1975.474.
(i) Wintesrs H, Goll: "NO/1 eIII.l'lI/u/ic ()xit/u/it'e Degradation of Hydroxyl cellul()se Thickened La/ex pain/ " . ./()lIf'11ulll/C()(Iling Technology 1976,48,622. 80.
U) Winters H; "Viscosity Loss il1 Cel/ulnsic F/her-Thickened Latex pain/ Caused by Oxidant IRedllcfant impurities", Journal (I{ Coating Technology 1980, 52, 664.
5 (a) Seo, H. J.; Mitsuhashi, K.: Tanibe. H. In AdVances ;11 Chitin and Chitosun; Brine. C. J., Sandford, P. A., Zikakis, J. P .. Eds.: EIsevier Applied Science: New York, 1992; pp 34.
(b) Chen. C. S.; Liau, W. Y.; Tsai. G. J. J Food Prof. 1998,61,1124.
(c) Fang, S. W.; Li, C. F.; Shin, D. Y. c..J. Food Prot. 1994,57,136.
(d) Hadwiger, L. A. J. Cell Biochem. 1986. I S-S (Suppl. I ~C).
(e) Jung. B.: Kim. c.; Choi, K.; Lee, Y. M.; Kim, J. J. Appl. Polym.Sci. 1999, 72,1713.
6 (a) Papineau, A. M.; Hoover, D. G.: Knorr. D.; Farkas, D. F. Food Biotechnol. 1991, 5, 45.
(b) Sudarshan, N. R.; Hoover, D. G.; Knorr, D. Food Biotechnol. 1992,6, 257.
226