Development of Methods for Impact Assessment of Electric ... · by the stringency goes up so that a...
24
Development of Methods Development of Methods for Impact Assessment of Electric Power Innovation and R&D Network Evaluation Prof. Tatsumi ISHIZUKA The Center for Economic Growth Strategy The Center for Economic Growth Strategy Yokohama National University Project Leader: Prof. Taro AKIYAMA Researcher: Dr. Ryuichi TAMURA (Postdoctoral Research Associate) Dr Toru TAKAHASHI (Postdoctoral Research Associate) Dr . Toru TAKAHASHI (Postdoctoral Research Associate) Yokohama National University Aug 28 2013 Innovation Policy WS of CAS-IPM, T. ISHIZUKA
Transcript of Development of Methods for Impact Assessment of Electric ... · by the stringency goes up so that a...

Development of Methods Development of Methods for Impact Assessment of Electric Power Innovation
and R&D Network Evaluation
Prof. Tatsumi ISHIZUKAThe Center for Economic Growth StrategyThe Center for Economic Growth Strategy
Yokohama National University
Project Leader: Prof. Taro AKIYAMAResearcher: Dr. Ryuichi TAMURA (Postdoctoral Research Associate)
Dr Toru TAKAHASHI (Postdoctoral Research Associate)Dr. Toru TAKAHASHI (Postdoctoral Research Associate)
Yokohama National University Aug 28 2013 Innovation Policy WS of CAS-IPM, T. ISHIZUKA

J i t R h P j t i YNU Joint Research Project in YNU between Economics and Engineering
collaborated with Industries and Local Government collaborated with Industries and Local Government
Term of Project: Nov. 2011- Oct. 2014
Project Leader: Prof. Taro AKIYAMA (Economics)
Economics EngineeringProf. Taro AKIYAMAProf. Akio TORII (Chuo Univ.)Prof. Eiichi TOMIURAP f R NAKAJIMA (K i U i )
Prof. Tsutomu OYAMAProf. Ken-ichiro OTAProf. Tomoki HAMAGAMIP f Shi i MITSUSHIMAProf. Ryo NAKAJIMA (Keio Univ.)
Prof. Tatsumi IHIZUKA (CEGS)Prof. Shigenori MITSUSHIMAProf. Yoshikazu SHUSA
Advisory Boardd so y oa dYokohama CityIHI CorporationNissan Motor Co., Ltd.
Yokohama National University Aug 28 2013 Innovation Policy WS of CAS-IPM, T. ISHIZUKA
,

1. Backgroundac g ou dDecision makers for Innovation Policy
Restrictive knowledge on current economic researches
Large GapEconomic Researchers
Restrictive knowledge on current political issues
After the Great East Japan EarthquakeReforming of Electricity system in Japan is urgent issue Reforming of Electricity system in Japan is urgent issue Creating a more competitive market
allowing Diversification of services and pricesby Liberalization the electricity retail marketby Liberalization the electricity retail market
◆Breakup of majorregional monopolies on household electricity◆Separate power generation and transmission businesses
Yokohama National University Aug 28 2013 Innovation Policy WS of CAS-IPM, T. ISHIZUKA

2. Objectives of YNU Akiyama ProjectObject es o U ya a ojectImpact Assessment of Electric Power Innovation◆Agent-based simulation approach to investigate Electric Power prices◆T id f l i l t f d i i ki f ti i lib li ti◆To provide useful simulator for decision making of options in liberalization◆To propose Electric Power Innovation Policy
Relations between two researches
Scenarios on increased use of FC-CHP, 10GW=1KW×10,000k household-use/2020
◆Impact of Fuel Cell CHP systemon Electric Power Market in future◆Efficiency of Promoting R&D of Fuel Cell using public funds
CHP: Combined Heat & Power
R&D Network Evaluation◆Construct Fuel cell R&D network using patent of joint applications◆Investigate roles of public funds to promote collaborated research◆Efficiency of public funds on important patents
Yokohama National University Aug 28 2013 Innovation Policy WS of CAS-IPM, T. ISHIZUKA

3. Impact Assessment of Electric Power Innovationp3.1 Spot Market Trading volume in 2013
90 45
70
80
35
40GWh JPY/kWh
60
70
30
35 Data of 2010FY0.6% :JEPX share in Japan
926,370GWh/Year in Japan5,680GWh/year in JEPX
40
50
20
25 5,680GWh/year in JEPXJEPX share is increasing after the Great East Japan Earthquake
20
30
10
15
Trading volume(GWh)
: simple mean value of system price from 8:00 to 22:00
0
10
0
5 DA-24
DA-DT
DA-PT : simple mean value of system price from 13:00 to 16:00
: 24-hour simple mean value of system price
4/1 5/1 6/1 7/1 8/1The spot transaction index in 2013
Yokohama National University Aug 28 2013 Innovation Policy WS of CAS-IPM, T. ISHIZUKAData: JEPX (Japan Electric Power Exchange)

3.2 Computational Model for Wholesale electric power market3 Co putat o a ode o o esa e e ect c po e a etMulti-Agent based Modeling of Electricity Systems
Reinforcement LearningProcess Manager
Iteration
Power Generation Companies (sellers)Reinforcement Learner Agents
Bid for sale
IterationRetail Business Companies (Buyers)Agents
Demand
Day-ahead marketsingle auction
Trade Process Price Calculation
0
Household Consumers (Buyers)Agents, off-peak real-time demand(Double auction: under construction)
Bid for Demand
Yokohama National University Aug 28 2013 Innovation Policy WS of CAS-IPM, T. ISHIZUKA

3.3 Class Diagram forJava g
Agent Class
Process Control Class
Reforming Market Structure at this stage Reforming Market Structure at this stage
◆Flexibility of programming structure◆Set quickly and easily new function◆Possibility to easily create new model◆Satisfying various users and various needs
Yokohama National University Aug 28 2013 Innovation Policy WS of CAS-IPM, T. ISHIZUKA

3.4 Model of Reinforcement Learningg
Modified Roth-Erev RL (Reinforcement Learning) Algorithm
Originally developed by A. Roth and I. Erev (Games and Economic Behavior 1995, American Economic Review 1998)
Modified Roth Erev RL (Reinforcement Learning) Algorithm
From Action Propensities to Action Choice ProbabilitiesFrom Action Propensities to Action Choice Probabilities
Yokohama National University Aug 28 2013 Innovation Policy WS of CAS-IPM, T. ISHIZUKA

3.5 Simulation of price fluctuation by the influence of market structure
Price (arbitrary unit)Scale and number of the generation company are varied
Price Cap
The price formation using reinforcement learning agent
Threshold Shift
g g
1 large+3 mediums 1 large+15 smalls even 5 even 10 Ratio to max. suppliable electric power (%)
The threshold that a remarkable rise
40%20
20% 40%
4%4% 4%
4% 4% 4% 4%The threshold that a remarkable rise happens for price of electricity demand by the stringency goes up so that a competitive condition becomes equal.
Yokohama National University Aug 28 2013 Innovation Policy WS of CAS-IPM, T. ISHIZUKA
20%
%4%
4%4%4%4%4%
4% 4%p q

3.6 Further research and final Goal3.6 Further research and final Goal
Modeling to be developed◆ D bl ti f D d id R l Ti P i i◆ Double auction for Demand side, Real-Time Pricing◆ Develop the model of Demand side◆ Smart Grid
(1) Effectiveness of the battery in statistical operation( ) y p(2) Popularization of Fuel cell CHP
Fi l G lFinal GoalTo provide a simulator which can be employed for quantitatively evaluating how market structures affect impact of prices
To show validity of the simulator under combinations of parameters varied in hypothetical market scenarios
Yokohama National University Aug 28 2013 Innovation Policy WS of CAS-IPM, T. ISHIZUKA

4. R&D Network Evaluation4.1 Methodology for Constructing Fuel cell R&D network
4. R&D Network Evaluation
◆Use Fuel cell Patent Dataset◆Use Fuel cell Patent Dataset
◆Find joint patent applications◆ d jo t pate t app cat o s
◆Visualize in a form of network graph
◆Find organizations of "important role”
◆Differences in structure for JP and US R&D Networks
Yokohama National University Aug 28 2013 Innovation Policy WS of CAS-IPM, T. ISHIZUKA

4.2 Identify Fuel Cell (FC) patents (JP)4.2 Identify Fuel Cell (FC) patents (JP)
FC patents Dataset◆Primary Data: full patent documents administrated by Japan Patent Office ◆Primary Data: full patent documents administrated by Japan Patent Office
51,896 FC-related patents granted in 2001-2011◆Aux Data: IIP Patent Database by Institute of Intellectual Property, Japan◆Utilized to complete some bibliographic information◆Extracted 24,857 FC patents
using FI/Fterm technological classification exactly match “Fuel Cell technologies”
Clean-up dataset◆Unifying organization name from notations variant and changed nameg◆Applicants by individuals are changed to organization etc.
Yokohama National University Aug 28 2013 Innovation Policy WS of CAS-IPM, T. ISHIZUKA

4.3 R&D Networks Construction
◆Representation by undirected graph structure – Node: Assignee (the owner of
patent)
◆Pool joint applications in time to create a static graph structure. This is the R&D network.patent)
– Edge: Patent with the following attributes:• Patent ID and its application
yearT h l i l Cl ifi ti
◆Edges are considered as possible combinations of organizations to collaborate.
• Technological Classification (IPC)
• Frequency of collaborations with the organization
– Skipped patents applied by i l fi ( d ith t single firm (= node without
edge)
13
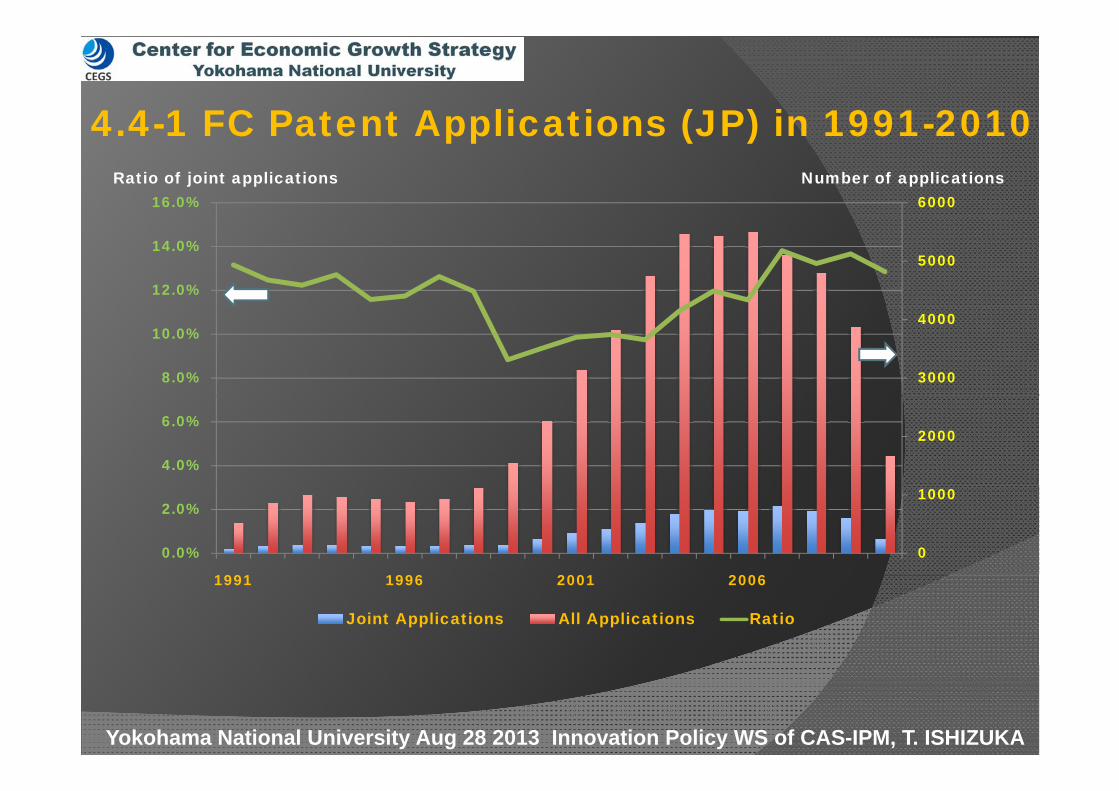
4 4-1 FC Patent Applications (JP) in 1991-2010
600016.0%Ratio of joint applications Number of applications
4.4-1 FC Patent Applications (JP) in 1991-2010
5000
12.0%
14.0%
3000
4000
8.0%
10.0%
2000
4.0%
6.0%
0
1000
0.0%
2.0%
1991 1996 2001 20061991 1996 2001 2006
Joint Applications All Applications Ratio
Yokohama National University Aug 28 2013 Innovation Policy WS of CAS-IPM, T. ISHIZUKA

4.4-2 FC Patent Applicants (JP) in 1998-20104.4 2 FC Patent Applicants (JP) in 1998 2010Number of applicantsRatio of collaborated applicants
600
700
800
50.0%
60.0%
400
500
600
30 0%
40.0%
200
300
400
20.0%
30.0%
0
100
200
0.0%
10.0%
1998 2003 2008
Collaborated Applicants Total Applicants Ratio
Yokohama National University Aug 28 2013 Innovation Policy WS of CAS-IPM, T. ISHIZUKA

4.4-3 FC TOP 20 Applicants: 2001-2011 in Japan and USNo. Count JPO Name Country
1 6,857 Toyota Motors, Co., Ltd. JP2 3,459 Nissan Motors, Co., Ltd. JP
No. Count USPTO Name Country
1 762 Samsung SDF Co, Inc. KR
2 494Matsushita Electric Industries Co., Ltd. JP2 3,459 Nissan Motors, Co., Ltd. JP
3 3,225 Honda Motor Co., Ltd. JP4 1,332 Matsushita Electoric, Co., Ltd. JP5 1,293 Toshiba Co., Ltd. JP
,3 422 Sanyo Electric Co., Ltd. JP4 399 SONY AMERICA US5 344 Toyota Motors Co., Ltd. JP6 305 Panasonic, Co., Ltd. JP
H d Gik K C 6 810 Aisin Seiki Co., Ltd JP7 739 Kyocera Corporation JP8 691 Mitsubishi Heavy Industris Co., Ltd. JP9 539 Sanyo Electric Co Ltd JP
7 291Honda Giken Kogyo Co.,
Ltd. JP8 244 General Motors US9 240 Nissan Motor Co., Ltd. JP10 234 Honda Motors Co., Ltd. JP9 539 Sanyo Electric Co., Ltd JP
10 525 Panasonic Corporation JP11 482 Hitachi, Ltd. JP12 445 Kansai Electoric Power Co., Inc. JP
,11 194 Toshiba Co., Ltd JP12 182 Gillette Inc. US13 180 LC Chemicals Inc. JP
14 174GM Global Technology
Operations US,13 444 Samsung SDI, Inc. KR14 443 Sony Corporation JP15 438 Dai Nippon Printing, Co., Ltd. JP
174 Operations US15 161 Eveready Battery Co., Inc JP16 147 Delphi Technologies, Inc. US17 132 UTC Fuel Cells, LLC. US18 119 Plug Power, Inc. US
16 420 Casio Corporation JP17 415 Equos Research Co., Ltd. JP18 413 Mitsubishi Materials Corporation JP19 372 Osaka Gas Co Ltd JP
19 112Ballard Power Systems,
LLC CA20 106 Canon Co., Ltd. JP: : : :
Yokohama National University Aug 28 2013 Innovation Policy WS of CAS-IPM, T. ISHIZUKA
19 372 Osaka Gas Co., Ltd. JP20 371 Toyota Central R&D Labs., Inc. JP
43 Bloom Energy, Corporation US

4.4-4 FC Patent Applications (US)
1400
1600
1800
5%
6%
pp ( )
800
1000
1200
3%
4%
200
400
600
800
1%
2%
0
200
0%1998 2,003 2008
All applications Joint Applications Ratio
Unlike JP FC applications, both numbers of applications and joint applicants are small and decreasing.
Yokohama National University Aug 28 2013 Innovation Policy WS of CAS-IPM, T. ISHIZUKA

4.5 JP R&D Networks (2001-2011)
1,498 assignees,6,614 Collaborations
5 J & et o s ( 00 0 )
6,614 Collaborations
◆Consists of 6,614 ,edges(joint application; gray)1,498 nodes(assignee; blue)
◆Many small subgraphand single huge subgraph.
Yokohama National University Aug 28 2013 Innovation Policy WS of CAS-IPM, T. ISHIZUKA

4 6 Exploring the largest cluster4.6 Exploring the largest clusterthe largest cluster929 assignees(59%),8,662(91%) Collaborations
Fi d 9 b l tFind 9 sub-clusters Using Community Detection Method (Girvan
d N 2002)and Newman, 2002)Technique of separating a connected network into the sub networks that havesub-networks that have dense connection, but sparse connection with others
Small clusters or Isolated
others
Yokohama National University Aug 28 2013 Innovation Policy WS of CAS-IPM, T. ISHIZUKA

4 7 9 sub-clusters4.7 9 sub-clustersNo.
Number of Organizatio
nsMajor Organizations
1 567 AIST, Nissan Motor2 132 Toyota Motor3 51 Toshiba4 39 Aishin4 39 Aishin5 36 Sanyo6 34 EU Research Institute7 27 Honda Motor8 23 Ballard Power Systems, GM
9 20 Hyundai MotorAIST: The National Institute of Advanced Industrial Science and Technology (AIST)
Yokohama National University Aug 28 2013 Innovation Policy WS of CAS-IPM, T. ISHIZUKA

Organization Name Degree Betweenness A: Rank
of Degree B: Rank of Betweenne A-B
4.8-1 Roles of university Degree centralityOrganization Name Centrality Centrality of Degree
Centrality
Betweenness
Centrality
A-B
PERMELEC ELECTRODE LTD. 16 7,836.1 30 14 16IHI Corporation 23 17,708.9 19 4 15
Nagoya University 22 11,266.8 21 10 11
Degree centrality11 universities (17%) are ranked in 30 organizations of approximately 5% of high ranksHokkaido University 19 6,973.4 25 17 8
Asahi Glass Co., Ltd. 21 7,774.9 23 15 8Yokohama National University 22 8,013.7 20 13 7
Kyoto University 23 9,540.3 18 11 7Kyushu University 25 13,484.1 14 8 6
high ranksBetweenness CentralityRanking about majority of the university (7/11 univ.) risesy y
Tohoku University 28 11,948.4 10 9 1Panasonic, Co., Ltd. 30 15,974.5 7 6 1
Kansai Electric Power Co., Ltd. 30 16,922.0 6 5 1Tokyo Institute of Technology 42 24,882.6 3 2 1
JX Nippon Oil & Energy Corporation 26 8,976.8 12 12 0
rises
pp gy p ,AIST 87 46,093.4 1 1 0
NEC Corporation 17 4,687.6 28 29 -1Nissan Motor Co., Ltd. 66 22,621.2 2 3 -1
Samsung SDI 20 5,312.5 24 26 -2Hitachi, Ltd. 40 14,388.4 4 7 -3
Universities have mediating role between organizations in the R&D , , 3
Tsukuba University 16 3,941.0 29 35 -6Toyota Central R&D Labs., Inc. 17 4,110.8 27 33 -6
Tokyo University 23 5,514.4 17 23 -6TOHO Gas Co., Ltd. 27 6,958.9 11 18 -7Osaka Gas Co., Ltd. 28 6,987.0 9 16 -7
Degree Centrality
organizations in the R&D network
, , 9 16 7Yamanashi University 26 5,653.8 13 21 -8
Asahi Kasei Chemicals Corp. 24 4,803.3 16 28 -12MITSUBISHI HEAVY INDUSTRY, LTD. 29 5,439.2 8 24 -16Tokyo University of Agriculture and
Technology 18 3,156.7 26 44 -18 Betweenness Centrality
Yokohama National University Aug 28 2013 Innovation Policy WS of CAS-IPM, T. ISHIZUKA
Tokyo Gas Co., Ltd. 31 5,410.2 5 25 -20KANEKA CORPORATION 24 1,724.3 15 71 -56
Toagosei Co., Ltd. 21 1,383.6 22 89 -67

4 8 2 4.8-2 Function of patents granted by public fund
P t t t d b bli f d (NEDO JST) hPatents granted by public fund (NEDO, JST) haveMediating function between the sub-networks in R & D network
The JST/NEDO patent is high in betweenness centrality than the patent except it (with 5% levels of statistical significant difference)
JSTpatents
NEDOpatents Others
Number of patents 32 364 9114Mean : Betweenness
Centrality 770.52 276.73 196.39Standard deviation : 1083 75 777 89 684 89Betweenness Centrality 1083.75 777.89 684.89
t values 2.99 1.94 —
JST: The Japan Science and Technology Agency
Yokohama National University Aug 28 2013 Innovation Policy WS of CAS-IPM, T. ISHIZUKA
JST: The Japan Science and Technology AgencyNEDO: The New Energy and Industrial Technology Development Organization

4.9 US R&D Networks (2001-2011)No. Organization name Countr
y Type
1Matsushita Electric Industries Co., Ltd. JP electronics
T t M t C Ltd
The largest cluster73 assignees,
186 Collaborations
( )
2 Toyota Motors Co., Ltd. JP automobile3 Honda Giken Kogyo Co., Ltd. JP automobile4 Hydro Quebec CA energy5 SONY AMERICA JP electronics6 NEC Corporation JP electronics
Japan Strage battery Co
186 Collaborations
7Japan Strage battery Co.,
Ltd. JP battery
8 Delphi Technologies, Inc. US automobile
9 CNRS FR research institute
10 HITACHI Ltd. JP electronics
254 assignees,364 Collaborations
11 Nissan Motor Co., Ltd. JP automobile
12Georgia Tech Research
Group US research institute
13L'UNIVERSITE DE
MONTREAL CA university
14 General Moters Corporation US automobile14 General Moters Corporation US automobile
15Kansai Electric Power Co.,
Ltd. JP electric power
16 Acep, Inc. CA Patent Attorney
17Sumitomo Electric Industries
JP electronics
US case as hypothesisGreater mobility in employment
17 Co., Ltd. JP electronics
18 Mitsui Chemicals, Inc. JP chemical
19Shin-Kobe Electric Machinery Co., Ltd. JP battery
20 Japan Vilene Co., Ltd. JP apparel
higher M&A activity
Unnecessary of collaborations of research on FC
Yokohama National University Aug 28 2013 Innovation Policy WS of CAS-IPM, T. ISHIZUKA

4 10 Further research4.10 Further research◆Proof analysis By "Counterfactual framework"
for effects of granted patents in R&D networkfor effects of granted patents in R&D network
◆Evaluating patents by citationsusing IIP patent databaseusing IIP patent database
◆Proof the hypothesis of the Japan-U.S. comparison
◆Research on the influence of public funds for innovationby controlling the economic characteristic
Yokohama National University Aug 28 2013 Innovation Policy WS of CAS-IPM, T. ISHIZUKA