Development of Methodology for Simulation Driven...
67
Development of Methodology for Simulation Driven Design - Evaluation of calculation and optimization tools integrated in Catia and development of methodology. Master’s thesis at Product development ROBIN LOMAN STRINNHOLM Department of Product and Production development Division of Product development Chalmers University of Technology Göteborg, Sweden 2012
Transcript of Development of Methodology for Simulation Driven...

Development of Methodology for Simulation
Driven Design - Evaluation of calculation and optimization tools integrated in Catia
and development of methodology. Master’s thesis at Product development
ROBIN LOMAN STRINNHOLM
Department of Product and Production development
Division of Product development
Chalmers University of Technology
Göteborg, Sweden 2012


Abstract
Scania is a Swedish manufacturer of trucks, buses and diesel engines. The department NA is
responsible for the development of axles and related components. Within NA, there is a
calculation group that uses FE-based tools, NAC, and a design group responsible for a set of
components, NAA. A product development process takes the form of an iterative process
between the calculation group and the design group. Even though less expensive than physical
prototype testing, this process crossing group borders is regarded as time consuming. One of
the components that follow this iterative product development process is the front axle beam.
The objective of this project has been to investigate the possibilities of reducing the lead time
by letting the designer at NAA perform FE based calculations and optimizations using tools
integrated in the designers CAD-application, Catia.
Method/Approach
A case study was made in order to gain an understanding of the current design process. An
evaluation was made regarding different FE-based calculation and optimization tools
integrated in Catia, and results ware compared to previous results from fully dedicated tools
used by NAC. Also, the possibilities to automate parts of the process using macros in Catia
were investigated.
Results
The results showed that the outcome from FE-based calculation tool integrated in Catia and
the outcome from Abaqus, used by NAC was very similar. A manual regarding the tool,
aimed for the designers, was made. One of the optimization tools showed results very close to
the results from OptiStruct used by NAC, and was easy to use. The results from the other
optimization tool differed from the ones of Catia, required an experienced user and did not
guarantee an optimal solution. It did, however, have a few other advantages. Also, an overall
methodology was proposed, involving the integrated tools.
Discussion and conclusion
It quickly became apparent that the capacity of desktop computers did not hold the capacity
necessary to use these calculation and optimization tools for a component so complex as the
front axle beams. If, however, these tools were used with a batch server handling the actual
calculations, they could form a foundation for a powerful product development process. With
this new process, products fulfilling customer needs could be developed fast and cheap.
Recommendations
For future investigations and evaluations, it is recommended to do a pilot project: Using the
proposed methodology and tools for the development of a new component. The experiences
from the pilot project would form a basis for future development of the methodology. Before
performing this pilot project, the tools must be integrated in Scania’s PDM system and a
solution for batch server calculations must exist.


Preface
This report is the outcome of a project conducted at Scania CV AB in Södertälje, Sweden.
The project was performed as a master’s thesis of 30p at Chalmers University of Technology
in Göteborg, Sweden. The report aims to reflect the progress, results and conclusions of the
project.
First off, I would like to thank my supervisor at Scania, Sandra Thorén, for motivation,
inspiration, support, valuable insight and feedback, as well as a great number of smiles and
laughs.
I would like to thank my supervisor at Chalmers, Samuel C. Lorin, as well as my examiner
Andreas Dagman, for great feedback and support, and contribution to the outline of the
project.
I would also like to thank Mikael Thellner and Magnus Bergman at Scania for invaluable
discussions and insights.
Finally, I would like to thank anyone else who in any way has contributed to this project
throughout the last 20 weeks.
Södertälje, February 2012
Robin Loman Strinnholm
Soon to become M.Sc.


Nomenclature
Throughout the report, different terms, names and acronyms are used. Even though explained
in the report, the most important are listed and described here:
FE
Finite Element. Used to acknowledge that a method with finite elements is used.
Examples: FE calculations, FE based tools
o FEM
Finite element method. A mathematical method for obtaining approximate
solutions for partial differential equations.
o FEA
Finite Element Analysis. The practical engineering application of FEM. Used
for e.g. stress calculations and heat transfer calculations.
NA
The department at Scania that is responsible for the development of axles and related
components. It is a part of the N department, which is responsible for the drivetrain.
o NAC
The calculation group at NA. Uses FE-based tools for calculations and
optimizations.
o NAA
The design group that designs front axle beams, among other components.
SDD
Simulation Driven Design. A concept in which simulations and calculations are used
to aid the designer from the beginning of a design process.
DBT-cycles
Design-Build-Test cycles. An iterative approach to product development.
FMEA
Failure Mode and Effects Analysis. A tool for identifying, evaluating and preventing
failures in a product or process.
QFD
Quality Function Deployment. A tool for identifying customer requirements and
translating those requirements to product or process characteristics.
VM stresses
Von Mises stress. An equivalent stress that can be calculated from the principle and
shear stresses.
Catia PEO
Product Engineering Optimizer. Part of Catia V5. Performs parameter based shape
optimization.
HyperShape/CATIA
Software from Altair Engineering Inc., integrated in Catia. Performs mesh based shape
optimization as well as topology optimization.


Table of Contents
1 INTRODUCTION ........................................................................................................................................ 1
1.1 BACKGROUND ........................................................................................................................................ 1
1.2 PURPOSE OF THE THESIS ......................................................................................................................... 5
1.3 OBJECTIVES ............................................................................................................................................ 5
1.4 DELIMITATIONS ...................................................................................................................................... 5
1.5 THE LAYOUT OF THE REPORT .................................................................................................................. 6
2 THEORY ...................................................................................................................................................... 7
2.1 PRODUCT DEVELOPMENT METHODOLOGIES ........................................................................................... 7
2.2 FINITE ELEMENT METHOD ..................................................................................................................... 9
3 METHOD/APPROACH ............................................................................................................................ 13
3.1 METHOD FOR DEFINING CASE ............................................................................................................... 13
3.2 BUILDING CALCULATION MODELS IN CATIA ......................................................................................... 13
3.3 HOW TO COMPARE AND EVALUATE OPTIMIZATION TOOLS .................................................................... 16
3.4 HOW TO CREATE OVERALL METHODOLOGY FOR DESIGN PROCESS........................................................ 17
4 CASE DESCRIPTION............................................................................................................................... 19
4.1 NA DESIGN PROCESS ............................................................................................................................ 19
4.2 SCANIA’S FRONT AXLE BEAMS ............................................................................................................. 20
5 RESULTS .................................................................................................................................................... 23
5.1 BUILT CALCULATION MODELS IN CATIA ............................................................................................... 23
5.2 EVALUATION OF STRUCTURAL OPTIMIZATION TOOLS ........................................................................... 30
5.3 OVERALL METHODOLOGY FOR DESIGN PROCESS .................................................................................. 36
6 DISCUSSION AND CONCLUSION ........................................................................................................ 45
6.1 REGARDING THE METHODS USED ......................................................................................................... 45
6.2 REGARDING CALCULATION MODEL AND CONVERGENCE STUDY ........................................................... 45
6.3 REGARDING OPTIMIZATION RESULTS .................................................................................................... 45
6.4 REGARDING OVERALL METHODOLOGY ................................................................................................. 47
6.5 CONNECTING TO THE PURPOSE OF THE THESIS ...................................................................................... 47
7 RECOMMENDATIONS ........................................................................................................................... 49
8 REFERENCES ........................................................................................................................................... 51
APPENDIX: CALCULATION MODELS FOR LOADING CASES .............................................................. 2
APPENDIX: PUBLICATIONS ........................................................................................................................... 4
APPENDIX: FMEA REGARDING OVERALL METHOD............................................................................. 6


1
1 Introduction In a more and more competitive and global market, manufacturers must continually improve
their products as well as the organisation in order to survive. Despite colourful business
descriptions or stated core values, a company’s survival depends on its economics: roughly
said how much money the company earns and how much it spends. Its income and expenses.
A well-functioning organisation with efficient Research and Development (R&D) does not
only have great chances of satisfying customers and bringing income to the company, but it
does so with a small consumption of resources. However, developing products that satisfies
the customer and keeping expenses to a minimum often contradicts each other, as developing
products can be expensive in both time and resources (Ulrich & Eppinger, 2000).
From the Toyota Production Systems, the concept of Muda, or waste, is derived (Burenius &
Lindstedt, 2003). Waste is defined as activities that do not add value to the customer. Since all
activities consume resources, it is of great importance to reduce waste. Since waste does not
add value to the customer, reducing it will not affect the customer negatively. In R&D, one
great source of resource consumption is development of solution proposals that, perhaps after
development and refinement, is found not feasible or not meeting the demands.
1.1 Background
In a design process, it is often suitable to apply an iterative approach, where different
concepts continually are developed, refined and improved. The solutions of each iteration will
eventually converge to a final design. Long iteration times, low convergence speed and the
initial design being far from the final design are factors that can increase the total lead time.
These iterations often take the form of Design-Build-Test (DBT) cycles (Wheelright & Clark,
1992). A DBT cycle consists of three phases:
The design phase
The problem is framed and defined.
The build phase
Working models of the current design are created.
The test phase
The prototypes or models are tested. The results from these tests will provide
information to the next iteration.
Throughout the design process testing is used, starting with a low level then gradually using
higher levels. A test at low level includes several simplifications. It has the drawback of not
representing all the aspects of the scenario it is built to represent, but the advantage of being
simple, cheap and fast to calculate. A test of higher levels might not include any
simplifications and can even be a field test of the final design. The higher test level has the
advantage of better reflecting the scenario, but the drawback of being slow and expensive.
Trade-off curves representing this dilemma can be found in figure 1.

2
Accuracy
Speed
Accuracy
Cost
Figure 1 – Principal trade-off curves of the test phase in DBT cycles
With FE calculations, detailed analyses of components and systems can be made without the
need of physical prototypes. A virtual model is rather quickly built and analyzed, and can be
used for a range of low test levels. For these virtual tests, cost and time consumption is much
lower than for a physical prototype test. These virtual models can also be used for different
types of optimizations.
Although faster than physical prototype tests, FE based tools are so complicated that
calculation engineers are fully dedicated on these tasks. This means that the designer of the
component seldom is involved in the calculations. Rather, a time consuming iterative process
between the designer and the calculation engineer takes place. Apart from being expensive,
this process might hinder the designer from fully understand the connection between design
alterations and results of the calculations.
Traditionally, simulations and physical testing has been used only as verification of refined
solutions and designs. However, simulations and numerical modelling can also be used as a
support when generating innovative solutions. Simulation Driven Design (SDD) is a concept
in which simulations and calculations are used to aid the designer from the beginning of a
DBT-cycle (Sellgren, 1999). SDD does not necessarily reduce the time of each DBT cycle,
but might help the designer to achieve more for each cycle and let the product design
converge faster.
According to a benchmark made by the Aberdeen Group, manufacturers rated as “Best in
class” not only provides simulation tools for their designers early in the product development
in order to reduce time to market and improve product performance, but are also more likely
to choose tools that are integrated with their CAD application (The Aberdeen Group, 2006).
The best in class category is a selection of survey respondents, based on measurements
regarding revenue, cost and development cost targets for products as well as product launch
dates and quality expectations. Best in class manufacturers had shorter time to market, lower
development cost, and fewer prototypes. In other words: a correlation was found between
applying SDD and reducing development cost and development time.
Scania is a Swedish manufacturer of heavy trucks, buses and engines for miscellaneous
applications. The head office, R&D office and the main production plant of Scania is located
in Södertälje, Sweden. Its product development process heavily depends on physical testing,
3
an approach which is expensive in both time and resources (Bergsjö, Almefelt, & Malmqvist,
2010). Scania’s products are heavily modularised, lifting it as one of the main reasons for
their commercial success. This heavy modularization is shown in the structure of the R&D
department. The different modules of the trucks and buses have its own R&D department,
which in much work independently of each other. Each department is divided into groups
depending on their areas of responsibility or engineering discipline.
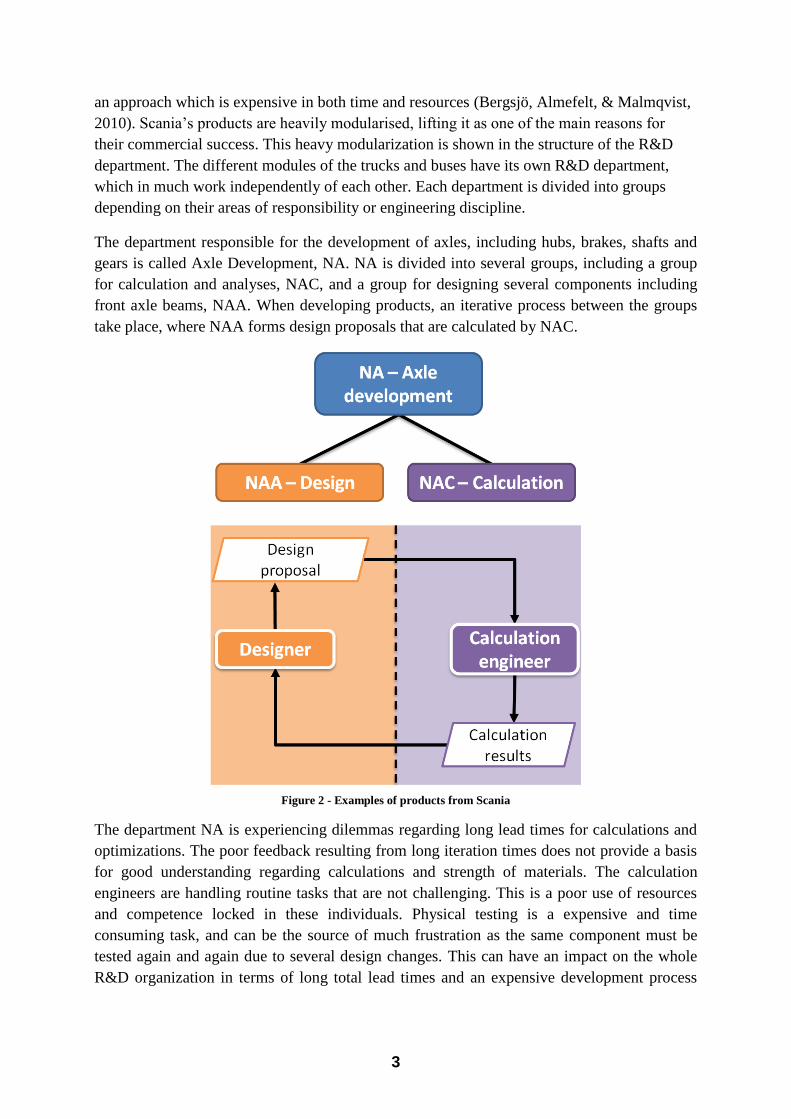
The department responsible for the development of axles, including hubs, brakes, shafts and
gears is called Axle Development, NA. NA is divided into several groups, including a group
for calculation and analyses, NAC, and a group for designing several components including
front axle beams, NAA. When developing products, an iterative process between the groups
take place, where NAA forms design proposals that are calculated by NAC.
Figure 2 - Examples of products from Scania
The department NA is experiencing dilemmas regarding long lead times for calculations and
optimizations. The poor feedback resulting from long iteration times does not provide a basis
for good understanding regarding calculations and strength of materials. The calculation
engineers are handling routine tasks that are not challenging. This is a poor use of resources
and competence locked in these individuals. Physical testing is a expensive and time
consuming task, and can be the source of much frustration as the same component must be
tested again and again due to several design changes. This can have an impact on the whole
R&D organization in terms of long total lead times and an expensive development process

4
due to many redesigns. The organization as a whole is then faced with low quality, customer
complaints and lost goodwill, see figure 3.
Figure 3 - What problems in the PD process can lead to
There is a desire for the designer group, NAA, to be able to perform FE calculations and
optimizations with tools integrated in their CAD application, CATIA V5. This could make for
a possible solution, and would allow the designer to make an iterative process by herself and
sending an already improved design to calculation by NAC and physical testing, see figure 4.
Figure 4 - How the designers calculations could be used in the design process

5
1.2 Purpose of the thesis
The purpose is to investigate the possibilities to reduce lead times for the design process at
NA. This by letting the designer at NA, who uses CATIA V5, to perform FE based
calculations and optimizations using tools integrated in Catia. The thesis aims to answer the
following questions:
Can calculations be done using Catia V5?
o Are they reliable
o What calculation models would be used?
o Can the calculations be done locally?
Can optimizations be done in Catia?
o Are they reliable
o Can the optimizations be done locally?
If calculations and optimizations can be done in Catia, HOW would they be used?
o Can a methodology be constructed?
1.3 Objectives
A framework methodology is to be development from the findings of the investigation, which
should define when and how different calculation and optimization tools are to be used. The
method should:
Employ factors that are identified to reduce lead time, either by reducing the time of
each DBT cycle, or reducing the needed amount of cycles.
Fit in to the established procedures used by designers and calculation engineers at NA
today
Be easy to use, so that the designer does not feel reluctant to use it
Be efficient enough to be considered worth its while
Let the designer gain deeper understanding of the simulation process
Be approved by the stakeholders.
A manual aimed for the designer is to be development. The manual will be a guide for
building calculation models with and without the use of macros, and analyzing results. The
working procedure included in the guide should be easy to follow and be approved by the
stakeholders.
1.4 Delimitations
In order to make some depth in the investigation, only the development of front axle beams
will be considered when making calculation models. For the evaluation of optimization tools,
a set of calculation examples will be used.
Only the development process and working procedures of the designers and calculation
engineers at NA, and the design issues that arise there, is considered. Alternative design
processes will not be investigated. Only Catia V5 and integrated tools will be considered.
6
1.5 The layout of the report
The following report is structured in six main parts:
Theory
The first part of the report lays a theoretical framework on which the rest of the report
is built. Different concepts and product development methods and tools are covered.
Case Description
The case which lays as an example for this thesis is described, as well as the
information gathering methods used. This chapter covers the existing design process
as well as the main design of the front axle beams.
Method/Approach
Here the approach for the thesis will be presented: when and how different methods
and tools are used.
Results
Results of the tools and methods previously presented will be presented here.
Discussion and conclusion
The results are discussed and analyzed. What do these results mean? What sort of
conclusion can be drawn from this? Is this reasonable? What could have been done
differently?
Recommendations
In the final part of the report recommendations for continued investigation and
analysis will be presented. It is based on the discussion in the previous section.
Please note that some of the information and results are considered to be part of Scania’s
intellectual property, and are therefore left out. Such information includes specific stress
levels and parameters defining the loading cases. It also includes macros that automatically
generate calculation models, which has parameters and forces included in them. Because of
that, much of the results and case description may seem incomplete and vague.

7
2 Theory In this chapter, used and needed product development methodologies will be explained, and
the theoretical basics of FE methods and structural optimizing will briefly be covered.
2.1 Product development methodologies
Product development, the process of bringing new products to the market, deals with the
challenge of creating products that fulfil the needs of the user as good as possible while
keeping cost at a minimum (Ulrich & Eppinger, 2000). It is a multidisciplinary process which
encompasses a wide range of both engineering and business skills.
2.1.1 Design-Build-Test cycles
All product development projects include some sort of Design-Build-Test (DBT) cycles
(Wheelright & Clark, 1992). A visualization of the DBT cycles can be seen in figure 5. As the
name implies, the cycle consists of three phases:
The design phase
Goals for the problem solving process are established, and the problem is identified.
Once the problem has been identified, a set of solution alternatives are generated.
The build phase
Working models or prototypes of the generated ideas are created.
The test phase
The prototypes or models are tested. Depending on the problem, the type of tests may
vary. The results of these tests are then evaluated: either the solution meets the goals,
or the results will serve as input for the generated alternatives in a new DBT cycle.
Targets
Current
design
Identifying
the problemGap
Evaluate
results
Does not
meet goals
Solution
Meets
goalsDesign
alternative
Build model
or prototype
Run
test
Design Build Test
Figure 5 - The Design-Build-Test Cycle in Problem Solving. Inspired by (Wheelright & Clark, 1992)
2.1.2 Failure Mode and Effects Analysis
The Failure Mode and Effects Analysis, or FMEA, is a tool for identifying and evaluating
risks or flaws in a product or process (Burenius & Lindstedt, 2003). There are several
different approaches and takes on the FMEA, but in this project the FMEA was carried out in
the following set of tasks:
Identifying steps in a process
Identifying possible failures
Evaluating factor 1: the possibility of each failure, on a scale from one to nine.
Identifying the consequence of each failure mode.

8
Evaluating factor 2: the severity of each consequence, on a scale from one to nine.
Identifying the manner in which each failure can be detected.
Evaluating factor 3: the possibility of each failure to go unnoticed, on a scale from one
to nine.
Calculate the risk number of each failure mode, by taking the product of the factors
evaluated.
A decision is made on what failure modes to regard for product/process improvement,
based on the risk number and the individual factors. The improvement can be
regarding the failure probability, the effect severity or the control efficiency.
The results of each step can be documented in a FMEA table, see table 1.
Failure mode Prob. Effect Severity Control Prob. Risk
number
Action taken
Table 1 - The outline of the FMEA table
2.1.3 Quality Function Deployment
Quality Function Deployment, or QFD, is a methodology which identifies customer
requirements and translates these into product or process characteristics. The QFD procedure
consists of four stages (Bergman & Klefsjö, 2010):
Performing a market analysis, identifying customer needs and expectations
Examining the competitors regarding their fulfilment of identified customer needs and
expectations
Identifying key factors for success based on the identified needs and expectations
Translating the key factors into product and process characteristics.
The result of the QFD is presented in the House of Quality, as can be seen in figure 6. QFD
can be used to represent every level of the product development process, by letting the
product characteristics of one level be the customer needs of the next level.

9
Correlation
matrix
Product
characteristics
Co
mp
ete
tiv
e
as
se
ss
me
nt
Relationship
matrix
Cu
sto
me
r n
ee
ds
Figure 6 - The House of Quality. Inspired by (Bergman & Klefsjö, 2010)
2.2 Finite Element Method
Many products and components have geometries in which e.g. the heat transfer or mechanical
strength is difficult to calculate. The problem can be defined as a Partial Differential Equation
(PDE) (Hutton, 2004). A PDE is a function of several independent variables, and can be
solved approximately by using numerical methods like the Finite Element Method (FEM).
The practical application of FEM is referred to as Finite Element Analysis (FEA).The main
concept behind FEM is dividing a complex geometry into a finite number of elements which
each can be calculated easily. An element is defined by external nodes, and can take many
forms. Often beam elements, triangular elements and quadratic elements are used, see figure
7.
Figure 7 - Different types of elements. Beam element defined by two nodes (upper left), triangular element defined by
three nodes (upper right), triangular element defined by six nodes (lower left) and an quadratic element defined by
four nodes (lower right).
When dividing a geometry into elements, meshing, the size of the elements is an important
parameter. The element size decides the number of elements needed, and how well the mesh
represents the geometry. It also affects how close to the analytic solution the approximate

10
solution will be. The mesh size can also be defined locally: a finer mesh can be used in a
certain area of interest, see figure 8.
Figure 8 –An example of a geometry divided up into elements. Upper left: Original geometry.
Upper right: Course mesh representing geometry. Lower left: Fine mesh representing geometry.
Lower right: Course mesh with local small mesh size around the ellipse.
Notice how the meshes follow the ellipse.
When deciding upon a suitable element size, a convergence study can be made. The
convergence study aims to find the most optimal size of the mesh. On one hand, a course
mesh means fast calculation times, but involves the risk of inaccurate results. On the other
hand, a fine mesh means more accurate results, but with calculation times increasing
exponentially with the number of elements. It is a trade-off, and an assessment has to be
made, see figure 9.
Number of
elements
Calculation
time
Approximative
stress level
Real stress
level
Calculation
time
Margin of error
Figure 9 – The trade-off curves of mesh size
2.2.1 Structural optimization
Structural optimization is a set of methods for finding an optimal design for a given structure.
The new design can either be based on an existing design which is altered, Shape
Optimization, or be a new design generated from a design space, Topology optimizing.

11
Topology optimization is a mathematical method for finding the optimal geometry in a
limited design space for a given problem (Sigmund & Bendsøe, 2003). The design space
consists of a mesh, and can be either 2D or 3D. The problem can have one or more loading
cases, with applied loads and boundary conditions. The optimization problem is solved
iteratively, generating an optimal distribution of material using a limited fraction of volume.
Shape optimization is a method for altering a pre-existing design for a given problem
(Christensen & Klarbring, 2009). The problem is defined by an objective, constraints and one
or more loading cases. The objective can typically be of mass, stress or displacement. The
constraints can be regarding mass, stress levels, displacement or certain parameters. The
optimization is solved iteratively. Shape optimization can either be mesh based or parameter
based. In the mesh based shape optimizing, the nodes of the mesh are moved in each iteration.
In the parameter based shape optimization, a set of geometrical parameters are allowed to
change. For each iteration, a new geometry is generated which is then remeshed.
2.2.2 FEA software
There are several different applications that support FE calculations and structural
optimizations. Without going deep in the different types of tools, here is a brief description of
the tools that are covered in this project.
Catia V5
A software suite for CAD, computer aided manufacturing (CAM) and computer aided
engineering (CAE). It is developed by Dassault Systemes.
Catia Generative Structural Analysis (GSA)
A part of Catia V5. It supports different types of FEM calculations.
Catia Product Engineering Optimizer (PEO)
Another part of Catia V5. Uses calculation models from GSA, for parameter based
shape optimization.
HyperShape/CATIA
A tool integrated in Catia V5, from Altair Engineering Inc. Uses calculation models
from Catia GSA, for mesh based shape optimization and topology optimization.
HyperShape/CATIA is based on OptiStruct, only the user interface is different.
Abaqus/Standard
FEM software from the Dassault Systemes brand Simulia. Used by NAC to perform
FEM calculations.
OptiStruct
Optimization software from Altair Engineering Inc. Used by NAC. Can perform mesh
based shape optimization as well as topology optimization.

12

13
3 Method/Approach The project consisted of five major parts:
Defining the case
Building calculation models in Catia
Writing a manual for calculation models in Catia
Evaluation of optimization tools in Catia
Construction of new design methodology
In this chapter, the approach for the projects five parts will be covered.
3.1 Method for defining case
In order to understand the design process employed at NA; interviews, field studies and
literature studies were conducted.
The interviews were semi-structured in order to let the interviewee speak freely, not be
constrained by the questions, and maybe lead the conversation into an important area not
considered when planning the interview. The interviewees were designers and calculation
engineers at NA, and a “judgement sampling” was made. A judgement sampling means that
the selection of interviewees was the ones who were considered to be able to contribute the
most (McQuarrie, 2006). Three calculations engineers and four designers were interviewed.
The chosen interviewees were also considered to be affected by the new methodology the
most. The interviews were conducted at the workplace of the interviewees, and aimed to
answer at least the following questions:
What is your role in the product development process?
What aspect of the product development process do you find work well?
What aspects of the product development process do you find troublesome?
What do you think can be accomplished by letting designers perform calculations and
optimizations on their own?
What risks do you think are involved in letting designers perform calculations and
optimizations on their own?
The field studies consisted of several visits to the testing laboratory, where components are
tested with respect to fatigue and strength. The purpose was to gain an understanding
regarding how the components were tested, and also to understand the organization as a
whole. Literature studies covered reports from affected actors at NA.
3.2 Building calculation models in Catia
When building the calculation models, they were constantly compared to the results from
NAC calculations, performed with tools dedicated solely to FEM calculations. An iterative
approach was used; where the calculation model for each loading case was refined and altered
until an accepted trade-off regarding complexity of the model was reached. First the iterations
was regarding simplifications of the model, and then regarding the mesh size. Then, a similar
approach was used in order to construct a manual for the designers to use. The manual was
refined and altered until representatives from both NAC and NAA were satisfied. This
approach is visualized in figure 10.

14
Understanding
the software
Study results
of old reports
Building
models in
CATIA V5
Comparing NAC’s
results with the results
from CATIA V5
Improve
further?
Yes
Construct a guide for
calculations in CATIA V5
No
Review, get feedback
from affected actors
Improve
further?
Yes
Understanding the
design process
Iteration loop 1:
Convergance studies
Iteration loop 2:
Constructing guide
Accepted guide for
constructing
calculation models
No
Figure 10 – Method used for this thesis to construct calculation models and guide
To test the loading cases, calculations were done to an already thoroughly tested and
calculated front axle beam. Throughout the process of creating calculation models
comparisons were made to the results from the calculations made by NAC. The comparisons
included analyses of stress plots and stress levels of critical areas. Both the Von Mises stress
and the principle stress were regarded.
3.2.1 Defining calculation models to be used in Catia
Models for each loading case was first built with extreme simplifications. It was then step by
step made more complex. It was in that sense a convergence study. This convergence study
resulted in three or four different models of each loading case, with names corresponding to
the degree of complexity, from “Very simple” to “Very complicated”. First, a “Very simple”
model was made and evaluated. It would contain many simplifications and very few
components. Then, more advanced models, with less simplifications and added components,
where built until the results converged with the results from NAC. The model was wanted to
be as simple as possible, yet giving accurate results, in order to reduce the work load of the
designer as well as the computation time.
3.2.2 Convergence study of the mesh
For each loading case a convergence study was made, aimed to find the most optimal fineness
of the mesh. The mesh size could be divided into two categories: global mesh size and local
mesh size. The global mesh size sets the general element size of a component, while a finer,
local mesh size can be defined at certain areas of interest.
For all the loading cases, several areas of importance were found, thus resulting in several
areas where the size of the mesh was essential. The method was to start off with a course

15
mesh, and step by step decreasing the size of the elements, and plotting the calculation time
and the maximum stresses of crucial areas.
Each step would take a certain amount of time, which would increase for each step. To save
time, a one-factor-at-a-time-approach was initially employed; only changing the mesh of one
area, until an accepted trade-off of that area was found. It was assumed that the calculations
would be done locally on a desktop computer just as this convergence study was. Later, the
findings of the trade-off of the different areas were used to find the initial values of a
multiple-factor-experiment.
3.2.3 Constructing method with automation
Catia supports the use of macros: pre-programmed set of instructions for the software to
interpret. These macros could be made to, e.g. assemble a predefined assembly or build a
calculation model.
By using macros different levels of automation could be obtained. A high level of automation
would mean fast results, at the cost of lost understanding of the process, and a low ability to
adapt the model to new conditions, see figure 11. Several scenarios were created, and
discussions with affected actors were held in order to find the optimal solution.
Build solid model in CATIA V5
Results, plot of stresses
Lo
w le
ve
l of a
uto
ma
tion
:
Co
mp
lete
ly m
an
ua
l pro
ce
ss
Hig
h le
ve
l of a
uto
ma
tion
:
To
tally
au
tom
ate
d p
roce
ss
Increasing speed
Increasing understanding of the process
Increasing level of adaptivity of new conditions
Figure 11 - Different levels of automation
3.2.4 Writing manual regarding calculation models
Based on the experience of building models and the results of the convergence study,
calculation results and discussions regarding automation, a manual was written. The manual
was to be a support for designers building calculation models. With it, a designer should with
ease be able to build calculation models with or without the support of macros. An iterative
process was used, where the manual was refined based on opinions and suggestions from
calculation engineers as well as designers.

16
3.3 How to compare and evaluate optimization tools
Two tools were evaluated, Catia PEO and HyperShape/CATIA. In order to evaluate the
different tools for structural optimizing two calculation examples were used. The two
calculation examples were called “the bridge” and “the bracket”. A convergence study was to
be done, analyzing how the results and calculation times would change with different element
sizes. As a reference, the problems were solved by NAC with a small element size, using
OptiStruct.
The reason for not using a front axle beam as an example is that optimization tools are far
more performance demanding than FEM calculations. The experiments were done on a
desktop computer so running large optimization models was not an option. Instead, these
examples were used in order to gain an understanding regarding limitations and advantages of
the two calculation tools.
The bridge
The bridge is a 2D example, as seen in figure 12. To reduce calculation time, the symmetry of
the geometry was used and only half of the bridge was modelled. For the shape optimization
the objective was to minimize the weight of the component, with a constraint being that the
maximum Von Mises stress could not exceed the maximum Von Mises stresses of the initial
design. For the topology optimization another calculation model was used, also shown in
figure 12. Here, the goal was to maximize the stiffness, given a limited amount of material.
Again, this was a 2D mesh representing half of the bridge.
Figure 12 - The loading case of the bridge (left), the corresponding calculation model (middle) and the model for
topology optimization (right)
The bracket
The bracket example consists of a T-shaped bracket, as can be seen in figure 13. A load of 10
kN is being applied at the far end of the bracket. The calculation model representing the
bracket was a 3D mesh, and no simplifications were done.

17
Figure 13 - The bracket loading case
For the shape optimizing, the objective was to minimize the weight of the component, with a
constraint on the displacement at the far end of the bracket. It was not to exceed 1 mm. The
topology optimization model was a solid 3D rectangular box, as can be seen in figure 14.
Once again, the goal was to maximize stiffness with a limited amount of material.
Figure 14 - The topology optimization model for the bracket loading case
3.4 How to create overall methodology for design process
A methodology for using the different tools was to be constructed. It was to start with the
need for a new product, and end with a geometric model being sent to NAC for verifying

18
calculations. These calculations would contain more complex models, and also take in to
account the fatigue strength of the material. The aim of the methodology was that an optimal
solution would be found and that the evaluation of the verifying calculation would not result
in a redesign. An optimal design was said to be the design using the least amount of material,
but still meeting the demands in material strength.
Brainstorming, discussions with designers and calculation engineers as well as a questionnaire
sent out to affected actors, resulted in a collection of needs, wishes, expectations and potential
risks. This list made a foundation for a QFD. Later it was also considered in a FMEA. The
questionnaire contained the following questions, here translated into English:
What are the problems with today’s design process? What isn’t working as it should?
What are the advantages with today’s design process? What is going well?
What do you want the designers to accomplish by doing calculations and
optimizations themselves? What do you expect them to accomplish?
What problems do you see in the designers performing calculations and simulations by
their own? What could go wrong?
How do you expect the designers’ role in the design process would look like, if they
did calculations and optimizations by their own?
How do you expect the calculation engineers’ role in the design process would look
like, if the designers did calculations and optimizations by their own?
A QFD was done in order to meet the wishes and needs of the user and customer of the
method. From the QFD and the results from the comparison of optimization tools, an initial
method was constructed. An FMEA was made in order to analyze the initial method and
eliminate or reduce the consequences of potential failures. This resulted in a slightly altered
method.

19
4 Case description In order to make a more narrow analysis of the tools and gain some depth, the development of
front axle beams at NA served as an example for calculations and simulations. It was also the
subject of the development of the manual as well as the new methodology. By doing so, the
objective of the project was not how the tools could be used generally, but rather how they
could be used for the development of front axle beams.
The department NA is responsible for axle development. Axle development includes hubs,
brakes, propeller shafts and axle gears. NA is a part of the department N, which handles all
the drivetrain development. Within NA there are several groups, including NAA and NAC.
NAA designs front axle beams, among other components. NAC performs calculations and
optimization for the NA department. See figure 15 for a structure tree of the different
departments and groups.
Scania AB
Research and Development
N – Drivetrain
Development
NA – Axle
Development
NAA – Design NAC – Calculation
Figure 15 - Extract of the orginazational structure at Scania AB
4.1 NA design process
The design process at NA is built upon DBT cycles. The first tests are FE-based calculations
and optimizations done by NAC. Later in the design process, physical prototypes are used in
test rigs and for field testing. The lead time for standard FE calculations averages about a
week, the lead time for a prototype in a test rig can be several months. When it comes to field
tests, it is not unusual that lead times are measured in years. If the need for redesign is
discovered after the field testing, it can mean that the design process is set back several years.

20
4.2 Scania’s front axle beams
The shape of the front axle beam is based on an I-beam. As it is forged, it is practical to stay
with the I-beam shape, as only two tools are needed. The two forging tools would press upon
the I-beam from one side each. Holes for interfaces are thereafter created by machining. An
example of this design can be seen on the AM900 beam, see figure 16.
Figure 16 - The AM900 beam
As with all of Scania’s components, the front axle beam has defined interfaces in order to
support a high level of modularization. There are two main interfaces covered in this project:
the kingpin interface and the spring seat. Both can be seen in figure 17. The kingpin interface
connects the beam to the spindle, and consists of two contact surfaces for tapered roller
bearing raceways. The spring seat consists of a contact surface and four holes to connect two
hooks which hold the leaf spring in place.
Figure 17 - Standard beam interfaces at Scania. Left: Kingpin interface. Middle: FE model of beam, spindle and
suspension package. Right: Spring seat.
4.2.1 The loading cases
Regarded in this project are three loading cases used by NA. They are used to dimension front
axle beams regarding fatigue strength and are called: the braking load case, the side force
load case and the pulsating wheel force loading case. Of course, the beams are tested in more
scenarios, but the initial FE calculations are done according to these three specific loading
cases. When FE calculations has been done, and the front axle beam has been verified,
physical prototypes are tested in the same loading cases. The physical loading cases can be
seen in table 2.
The braking load case is designed to represent the scenario in which the brakes are applied.
This is accomplished by using a lever with a length corresponding to the wheel radius. The
results show that high stresses are located in the area around the spring seat. The side load
case is designed to represent the forces that occur when the truck is turning. The pulsating
wheel force load case represents a high force from one of the wheels through the front axle
beam. The results show that high stresses are located in the area around the spring seat, as
well as at the bottom of the beam, directly below the spring seat.

21
Name Loading case as tested for physical prototypes
Braking
load
Side
force
Pulsating
wheel
force
Table 2 – Schematic representations of the physical loading cases
4.2.2 Calculation models used by NAC for FE calculations
The calculation loading cases used by NAC are based on the loading cases for the physical
prototype testing, but do include some simplifications. The calculation model rig components
are replicates of the real rig components. Some physical levers are replaced by virtual beams,
and long drop arms with revolute joints are replaced by components with limited degrees of
freedom. The calculations do not only consider the static yield strength, but rather the fatigue
strength of the component.
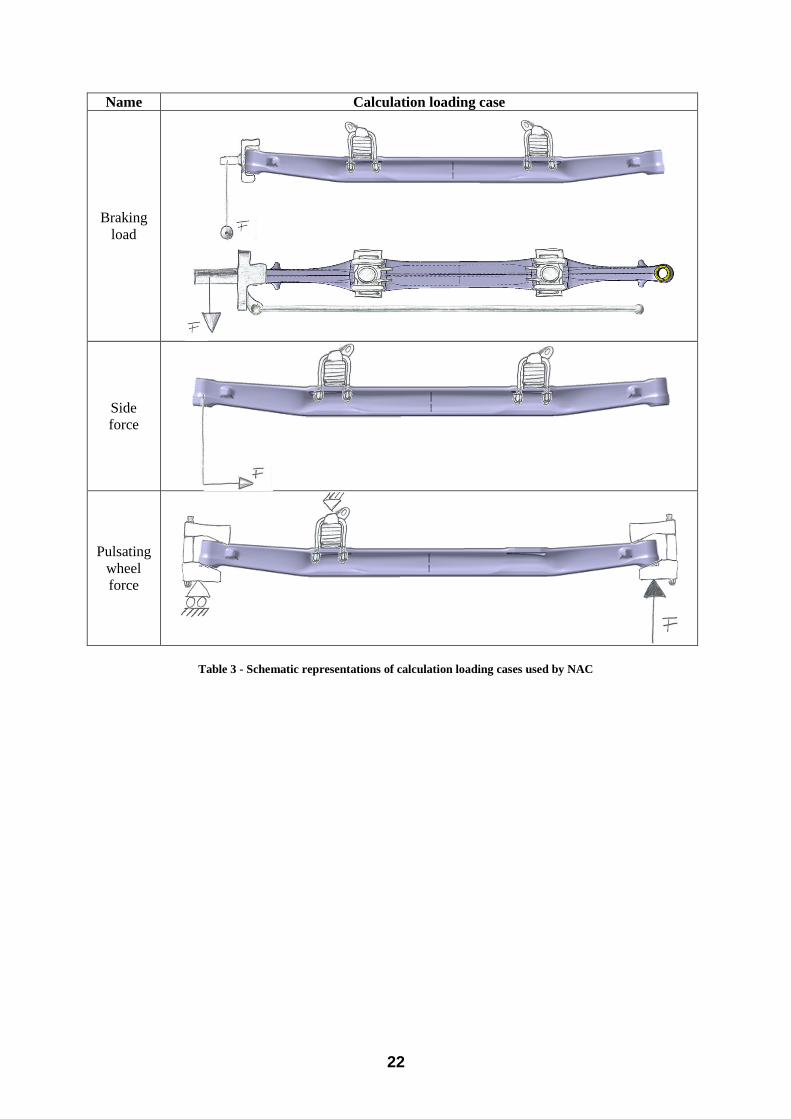
22
Name Calculation loading case
Braking
load
Side
force
Pulsating
wheel
force
Table 3 - Schematic representations of calculation loading cases used by NAC

23
5 Results Here, the results from the methods described in the previous chapter will be shown. Only a
summary of the results will be shown here, the rest can be found in appendices referenced in
this chapter.
5.1 Built calculation models in Catia
Here the constructed calculation models for Catia will be presented. Also, the constructed
macros for automation will be covered.
5.1.1 Defined calculation models to be used in Catia
Several models were made for each loading case. For a detailed description of the different
models, see Appendix: Calculation models for loading cases.
Generally, the components of the test rig were somewhat simplified, partly in order to reduce
complexity of the calculation model, but also to ease the assembly of the test rig. For
example, the revolution joints and degrees of freedom could be applied to geometrical
features of the components, which is much easier than applying them to virtual parts, as it
were done by NAC. The simplifications were deemed necessary in order to reduce lead time
and ease the construction of the models. The simplification only affected the calculation
results marginally.
Braking load
The braking load case where simplified in several ways, apart from using the simplified rig
components. One of the suspension packages was removed and the steering rod was removed.
Further simplifications could not be done without compromising the accuracy of the results.
For the final calculation model used for the braking load case, see figure 18.
Figure 18 - Calculation model used in Catia representing the brake load case
Side load
For the side load case, there was one major simplification: both the suspension packages were
removed. This had no effect on the stress levels at the areas of interest. For the final
calculation model used for the side load case, see figure 19.

24
Figure 19 - Calculation model used in Catia representing the side load case
Pulsating wheel force
For the pulsating wheel force load case no further simplifications apart from the use of
simplified rig components could be used without compromising the accuracy of the results.
For an illustration of the final calculation model representing the pulsating wheel force load
case, see figure 20.
Figure 20 - Calculation model used in Catia representing the pulsating wheel force load case
5.1.2 Performed convergence study
The results of the convergence study were discussed with calculation engineers, and the size
of the elements was decided upon. The calculation times for the recommended models
decided upon ranged from 10 to 20 minutes. When analyzing results of the study, experience
from previous calculations and field tests were used as a comparison. Models with smaller
elements than the recommended ones was calculated, with results closer to the ones from
NAC, but the calculation times was considered too long.
Braking load
For the braking load case, the area around the spring seat was considered critical. The element
size was set to 7 mm. Also, the radius between the front outer spring seat hole and the web of
the beam was considered. There, the element size was set to 1mm.
Side force
The areas of interest were the bottom and top of the beam in the direct vicinity of the holder.
Since the side force varied between positive and negative values, both the top and bottom
surfaces were deemed equally important. Therefore, the element size of both surfaces was
changed together. The element size was finally set to 5 mm.

25
Pulsating wheel force
For the pulsating wheel force load case, two areas of interest were identified:
The surface on the bottom of the beam, below spring seat. Element size set to 10mm.
The surfaces around the spring seat. Element size set to 7mm.
5.1.3 Comparison between Catia and NAC calculations
When comparing the results of the Catia calculation models with the ones form NAC, the
critical areas showed some differences regarding stress levels, and a negligible difference
regarding the stress plots and stress concentrations. These differences became smaller if the
element size was further decreased, but the calculation times would peak. The final
comparison was made using specific loads that testing had shown gave the beam a given
probability of failure when running a given amount of load cycles. The given values are part
of the standard procedure of component testing at Scania.
Braking load
For the NAC calculations of the braking load case, stress concentrations were located around
holes of the spring seat as well as the radius between the front outer spring seat hole and the
web of the beam. These stress concentrations were located on the same place when running
the calculations in Catia, see figure 21. However, for the hole, the maximum Von Mises stress
level was 6.7% lower, and the principle stress was 0.5% lower. For the radius, the Von Mises
stress was 2,2% lower, and the principle stress 3,2% lower.
Figure 21 - Comparison between calculation models of the braking load case.
Showing the Von Mises stresses of the spring seat. Left: NAC calculations. Right: Catia calculations.
26
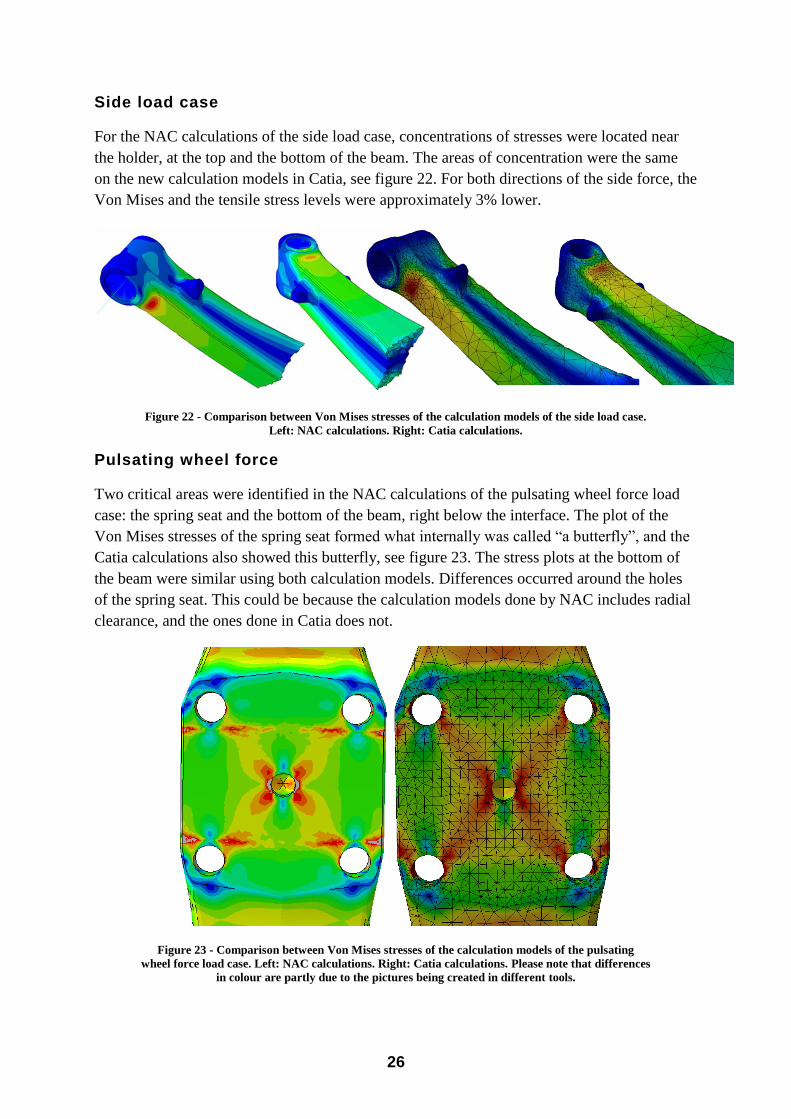
Side load case
For the NAC calculations of the side load case, concentrations of stresses were located near
the holder, at the top and the bottom of the beam. The areas of concentration were the same
on the new calculation models in Catia, see figure 22. For both directions of the side force, the
Von Mises and the tensile stress levels were approximately 3% lower.
Figure 22 - Comparison between Von Mises stresses of the calculation models of the side load case.
Left: NAC calculations. Right: Catia calculations.
Pulsating wheel force
Two critical areas were identified in the NAC calculations of the pulsating wheel force load
case: the spring seat and the bottom of the beam, right below the interface. The plot of the
Von Mises stresses of the spring seat formed what internally was called “a butterfly”, and the
Catia calculations also showed this butterfly, see figure 23. The stress plots at the bottom of
the beam were similar using both calculation models. Differences occurred around the holes
of the spring seat. This could be because the calculation models done by NAC includes radial
clearance, and the ones done in Catia does not.
Figure 23 - Comparison between Von Mises stresses of the calculation models of the pulsating
wheel force load case. Left: NAC calculations. Right: Catia calculations. Please note that differences
in colour are partly due to the pictures being created in different tools.

27
As with the other load cases, the actual stress levels differed somewhat from the NAC
calculations. At the holes in the spring seat, the maximum Von Mises stress was 22.2% lower,
and the maximum principle stress was 3.1% lower. At the bottom of the beam the Von Mises
stress was 5.1% higher, and the maximum principle stress was 4.6% higher. This was the only
area in the comparison study that showed higher levels of stress than NAC’s calculation.
5.1.4 Constructed method with automation
In order for the macro to assemble the different parts correctly, a tool was needed to identify
certain surfaces, edges and points of the beam of importance. Catia has such a tool already:
Publications. It is simply a list of selected features, which can be given names for easy
identification. A list of what features to select, and what names to give these was made, and
can be found in Appendix: Publications.
Of several different levels of automation, the following four levels were considered:
Completely manual
The calculation model was built completely manually, without the use of macros.
Mostly automated I
Publications are created and defined. A macro is used for creating a calculation model.
The calculation model could then be altered to the designer’s desire. Then, another
macro was used to calculate the model and present the results.
Mostly automated II
Certain parameters, like forces and element sizes, are defined in a document.
Publications are created and defined. Then a macro is used, which reads the document
and builds a calculation model according to the data in the document.
Completely automated
One macro is used which builds the calculation model and runs the calculation, after
the publications are created and defined. There is no room for altering the calculation
model.
After discussions with designers, the level “Mostly automated I” was selected on the basis
that it would be the best trade-off regarding speed, understanding and ability to perform
changes. It included five steps between a solid model and results of a FE calculation:
Run macro for creating and naming publications
Connect publications according to given specifications.
Run macro 1 for chosen loading case.
o The macro creates an assembly, imports front axle beam and components, and
places them correctly
o The assembly is converted into a calculation model. Material, mesh,
connections, constraints and loads are defined
With the calculation model built according to standards, make changes if needed.
Run macro 2 for the chosen loading case.
o Sensors for locating maximum stresses are defined, and the calculation is run.

28
Each loading case has two macros: one that builds a calculation model according to standards,
and one that runs the calculation and identifies the maximum stresses of critical areas, see
figure 24. The point of having two separated macros is the ability to make changes to the
model before the calculation is run, and thereby adapt it to any changed conditions. Defining
publications took less than three minutes for a novice, and thereafter letting a macro create the
calculation model would be done in a matter of seconds.
Design
proposal
Define
sensors
Kör
simulering
Create
assembly
Import
components
Place
components
correctly
Change workbench:
Generative
Structure Analysis
Define mesh
Define
connections
Define
constraints
Eventually
make
changes
Calculation
results
Define loads
Define
publications
Macro
#1
Macro
#2
Define
material
Figure 24 – The chosen level of automation
5.1.5 Written manual regarding calculation models
A written report was made and was eventually approved by both calculation engineers as well
as designers. It encompassed the overall method of constructing a calculation model, the
construction of the specific models for the different loading cases, a description on how to use
macros as well as a guide regarding analysis of results. Of confidentiality reasons, it has been
decided not to release the manual, since it is regarded as part of Scania’s intellectual property.
An extract of the manual can be seen in figure 25. The outline of the manual is as follows:
Overall structure
The structure of the document is explained, as well as the purpose of each chapter.
Nomenclature
The names of the different parts of the front axle beam is explained.

29
Manually building calculation models
Here the reader is taught how to construct a calculation model with mesh, restraints,
connections and loads.
Using Macros
Here the reader is taught how to use macros, and how to prepare the front axle beam
for the use of macros.
Interpreting results
Interpreting calculation results is not a straight forward task. In this chapter, guidelines
for interpreting results for calculations of the front axle beam are presented.
To keep in mind
Here the importance of analyzing the results critically is stressed. This to avoid the
risk of basing design alterations on faulty calculation results.
Appendixes
The appendixes contain detailed calculation results.
Figure 25 - Extract from the manual

30
5.2 Evaluation of structural optimization tools
The comparison of the optimization tools resulted in several geometries being created. The
resulting shapes and topologies were compared to solutions from NAC using OptiStruct.
These were assumed to be the optimal solutions of the different examples, therefore the
designs were compared rather than stress levels or amount of material used.
5.2.1 Topology optimization comparison
Only the tool HyperShape/CATIA can perform topology optimisation. Hence, the only
comparison to the topology optimization was an optimization done in OptiStruct. Since
HyperShape/CATIA is based on OptiStruct, the only difference in the results should be due to
differences the element size.
The maximum volume fraction was set to 0.3, meaning that a maximum of 30% of the
volume of the design domain is allowed to be used. As the objective is to maximize the
stiffness of the design, all of the allowed material will be used.
Topology optimization results for the bracket loading case
The convergence study regarding the topology optimization of the bracket resulted in several
geometries. Even though it was similar to the results from the optimization done in
OptiStruct, there was several differences, see table 4. The resulting geometry from OptiStruct
contains a cavity which cannot be found in the results from HyperShape/CATIA due to the
larger element size, see figure 26. The convergence study was carried out until the calculation
times reached two hours.

31
Mesh
size Tool Topology results
Des
ign
sp
ace
20 m
m
HS
C
15 m
m
HS
C
10
mm
HS
C

32
9 m
m
HS
C
8 m
m
HS
C
5 m
m
Opti
-Str
uct
(D
one
by N
AC
)
Table 4 - The results of the convergence study of the bracket loading case
Figure 26 - Cavity in the topology optimization results of the bracket loading case from OptiStruct

33
Topology optimization results for the bridge loading case
The convergence study regarding the topology optimization of the bridge loading case
resulted in several geometries, see table 5. The results quickly converged to a design that was
identical to the results from OptiStruct. Also here the convergence study was carried out until
calculation times reached two hours.
Element
size Design space 32 mm 16 mm
Topology
results
Element
size 8 mm 4 mm 2 mm
1 mm (Identical
to OptiStruct
results)
Topology
results
Table 5 - The results of the convergence study of the bridge loading case
5.2.2 Shape optimization evaluation
Both the evaluated tools, HyperShape/CATIA and Catia PEO, were able to perform shape
optimization. HyperShape/CATIA performs mesh based shape optimization, and Catia PEO
performs geometry based mesh optimization. In HyperShape/CATIA the optimization is
solved using a first order algorithm, guaranteeing the solution is the optimal solution. In Catia
PEO the optimization can be done using different algorithms, either a first order algorithm or
a zero order algorithm. A zero order algorithm as used in this evaluation does not guarantee
an optimal solution. The algorithm decides how the next design alteration will be done.
Therefore it was not only a comparison between the different tools, but also a comparison
between the different methods.
Mesh based shape optimization results
The mesh based shape optimization method has the drawback that it is hard to perform large
shape changes, as the mesh may then become distorted. The optimization is aborted if the
mesh becomes too distorted. For the mesh based shape optimization several mesh sizes was

34
tested; not in order to make a convergence study, but rather to see when the mesh easily
would become distorted.
Optimizations of the bracket example always resulted in a distorted mesh after a few
iterations, regardless of element size. However, the geometry generated before the mesh
became distorted were similar to the results from NAC, see table 6.
Results
Element size 20 mm global, 4mm local at
the radius
10mm global, 4mm local at
the radius 2 mm (Done by NAC)
Comments Distorted mesh Distorted mesh Distorted mesh Table 6 - Results of the mesh based shape optimization of the bracket loading case
The mesh based shape optimization of the bridge loading case brought about many
geometries, see table 7. It quickly took the shape of the benchmark results from NAC, even
though the mesh became distorted at some of the element sizes.
Results
Mesh size 32 mm 16 mm 8 mm 4 mm 2 mm 2,5 mm (done
by NAC)
Comments Converged Converged Distorted mesh Converged Distorted mesh Converged Table 7 - Results of the mesh based shape optimization of the bridge loading case
Parameter based shape optimization results
For the parameter based shape optimization the analysis was not regarding different element
sizes, as the geometry was remeshed for each iteration. Rather an analysis regarding free
geometric parameters was performed. Since the tool alters the different parameters, the
solution becomes dependant on the definition of the original geometry. A predefined zero
order algorithm was used. This had the drawback of not guaranteeing an optimal solution, but
of the predefined algorithms, it was the one that was the most easy to use and worked the
fastest.

35
In the bracket optimization model, four free parameters was defined and a solution was
quickly found, see figure 27. Other optimizations with several more free parameters were
done with similar results.
Figure 27 – Left: Results from parameter based shape optimization of the bracket loading case.
Right: Free parameters in the shape optimization model
Please not that the entire left side of the bracket is clamped and therefore locked regarding all degrees of freedom.
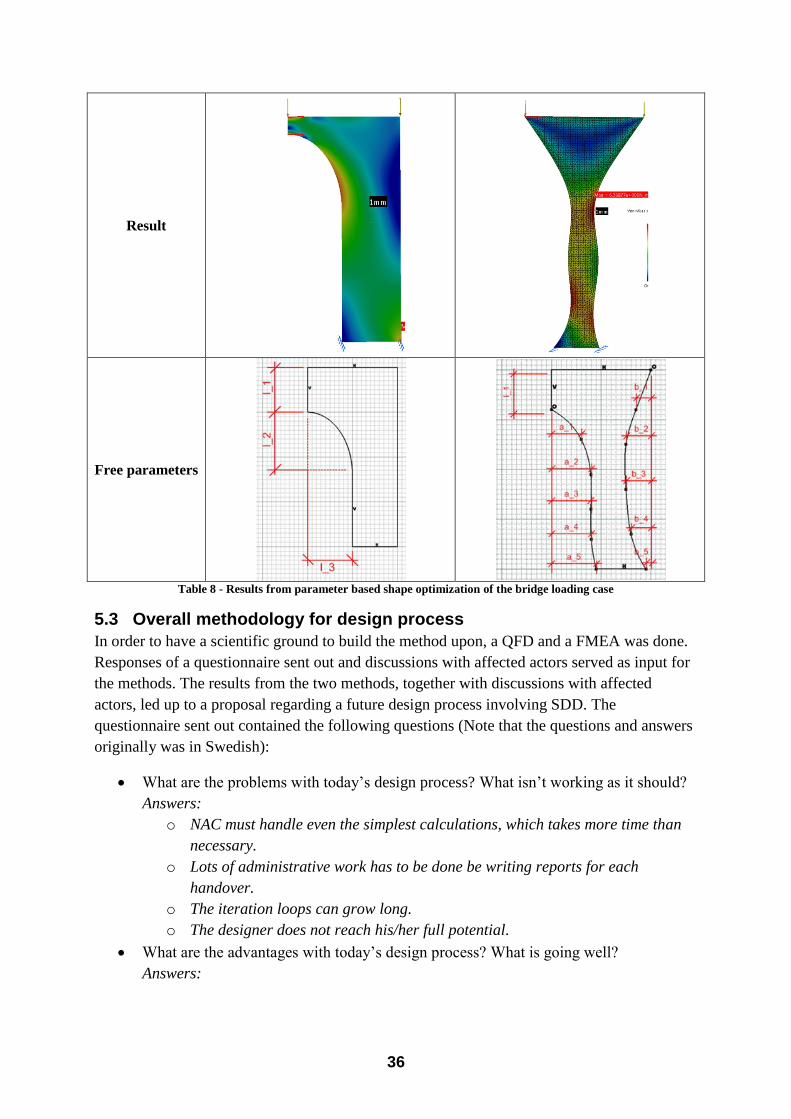
For the bridge loading case several different ways of defining the geometry was tested, and
two of them are presented here, see table 8. The first of them was defined by three parameters.
The second was built up using splines defined by five points each, and the model had a total
of eleven free parameters. In theory, the model with eleven free parameters could converge to
the same results as the mesh based shape optimization, see table 7, but in practice it is hard to
obtain.
36
Result
Free parameters
Table 8 - Results from parameter based shape optimization of the bridge loading case
5.3 Overall methodology for design process
In order to have a scientific ground to build the method upon, a QFD and a FMEA was done.
Responses of a questionnaire sent out and discussions with affected actors served as input for
the methods. The results from the two methods, together with discussions with affected
actors, led up to a proposal regarding a future design process involving SDD. The
questionnaire sent out contained the following questions (Note that the questions and answers
originally was in Swedish):
What are the problems with today’s design process? What isn’t working as it should?
Answers:
o NAC must handle even the simplest calculations, which takes more time than
necessary.
o Lots of administrative work has to be done be writing reports for each
handover.
o The iteration loops can grow long.
o The designer does not reach his/her full potential.
What are the advantages with today’s design process? What is going well?
Answers:

37
o The calculation engineers gain a great experience and expertise by only doing
calculations.
o The calculations that are done, are done very well.
o Not every calculation is so simple that anyone can do them.
o The designer does not have to make decisions he/she is not capable of making.
What do you want the designers to accomplish by doing calculations and
optimizations themselves? What do you expect them to accomplish?
Answers:
o Make valuable calculations from the start.
o Quickly understand the problem areas of different designs.
o Achieve a greater quality of the geometries sent to NAC.
o Reduce the time for each iteration.
o Perhaps even perform calculations at level that makes NAC calculations
redundant.
What problems do you see in the designers performing calculations and simulations by
their own? What could go wrong?
Answers:
o The designer makes mistakes in the calculations, and builds the design on
inaccurate results.
o The designer becomes overconfident, and deems NAC calculations redundant
even though they might not be.
How do you expect the designers’ role in the design process would look like, if they
did calculations and optimizations by their own?
Answers:
o The models sent to NAC would be optimized solutions for evaluation and fine
tuning, as opposed to raw models for optimization.
o Their role would encompass more fields of work. However, the designer would
be able create geometries with higher quality faster.
How do you expect the calculation engineers’ role in the design process would look
like, if the designers did calculations and optimizations by their own?
Answers:
o By focusing on more complex and challenging tasks, the calculation engineer
would develop and increase their knowledge and experience.
o They would become a support for designers running into problems.
o NAC would handle only calculations and tasks so complex that the designers
tools or knowledge are not enough.
5.3.1 Results of QFD regarding overall methodology
A set of customer requirements was listed and based on their importance and how well they
were filled today, a rating of each requirement was made. The requirements that scored a high
rating were classed as prioritized areas and were deemed most important to solve. The
requirements were:

38
Speed
The main purpose of the method is to reduce lead time. This was considered to be a
prioritized area.
Precision
The results gained from the calculations must be accurate enough to make the
calculations worth its while. This was not considered to be a prioritized area, as NAC
already had high precision tools.
Ease of use
The methodology and tools involved must be easy enough to use in order for the user
to feel motivated to use it. This was considered to be a prioritized area.
Understanding of strength of materials
By using the methodology, the user should be able to gain an understanding regarding
strength of materials. The idea is that this understanding should help the designer in
later projects. This was considered to be a prioritized area.
Understanding of the calculation process
The user should understand what he/she is doing, and thereby not running and
analyzing calculations containing errors. This was considered to be a prioritized area.
Being able to perform estimations of fatigue
The ideal would be that the user could be able to perform calculations and estimations
of fatigue, even though it requires complex calculations. This was not considered to be
a prioritized area.
Integration with Catia V5
By only using tools integrated in Catia, the user would not as easily feel alienated by
using them. This was considered to be a prioritized area.
Six characteristics was identified, these were:
Automation
The use of macros to automate parts of the process.
Designer performing FE calculations
Building calculation models and performing strength calculations.
Designer performing parameter based shape optimization
Using the built calculation model to perform parameter based shape optimization in
Catia PEO.
Designer performing mesh based shape optimization
Using the built calculation model to perform mesh based shape optimization in
HyperShape/Catia.
Designer performing topology optimization
Building a calculation model for topology optimization.
Designer using batch server for calculation
By sending the calculations to a batch server, more complex calculations are done
faster and does not use performance of the designers work station.
All this was added to a House of Quality, see figure 28.

39
Figure 28 – House of quality regarding overall methodology
The last characteristic, Designer using batch server for calculation, only had positive effects.
All other had a positive effect on one or more of the requirements, and a negative effect on at
least one other. Not one of the characteristics could therefore be ruled out. Instead, the initial
overall methodology would contain elements of all these characteristics.
5.3.2 Initial overall methodology
Based on the QFD and the findings of the evaluation of the different tools, an initial
methodology was made, see figure 29.
+
+ +
+ +
+ + - +
Import
ance
Auto
mation
Desig
ner
perf
orm
ing F
E c
alc
ula
tions
Desig
ner
perf
orm
ing s
hape o
ptim
izin
g (
PE
O)
Desig
ner
perf
orm
ing s
hape o
ptim
izin
g (
HS
C)
Desig
ner
perf
orm
ing t
opolo
gy o
ptim
izin
g
Desig
ner
usin
g b
atc
h s
erv
er
for
calc
ula
tions
I II III IV IV
Speed0,7 9 3 3 3 9 9 X
2,1 Prioritized Area
Precision0,5 -3 -3 -3 -3 9 X
0
Not considered
a prioritized
area
Ease of use0,7 9 -3 -3 -3 X
2,1 Prioritized Area
Understanding of strength of materials0,9 9 3 3 9 X
3,6 Prioritized Area
Understanding of the calcution process0,8 -3 9 3 3 9 X
3,2 Prioritized Area
Estimation of fatigue0,7 -3 -3 -3 -3 X
0,7
Not considered
a prioritized
area
Integration with Catia V5 0,63 9 9 3 3 X
2,4 Prioritized Area
Current method
Cu
sto
mer
Req
uir
em
en
ts
How the parameters
affect each other
How the parameters
affect customer needs.
9 – Very positive
3 – Somewhat positive
0 – No effect
-3 – Somewhat negative
-9 – Very negative
Prioritized area
Not a
prioritized area
Prioritized area
Prioritized area
Prioritized area
Not a
prioritized area
Prioritized area

40
New
project
Confirming
calculations at NAC
Does geometry
meet demands?
YesNo
Geometry for
physical testing
Designer builds
calculation model
Designer sets up
optimization
problem
Parameter based
shape optimizing
Designer builds
calculation model
Designer sets up
optimization
problem
Designer interprets
results and changes
geometry
Mesh based
shape optimization
Designer builds
calculation model
Designer defines
optimization
parameters
Designer analyzes
optimization
results
Designer
interprets results
and creates new
geometry
Topology
optimiziation
Problem
definition
Designer analyzes
the problem
Designer defines
simplifications
Figure 29 - Initial proposal of overall methodology
The methodology was divided into the following set of points:
Problem definition
The designer analyzes the problem and decides upon simplifications.
Topology optimization
The designer would build a calculation model according to the defined problem,
define the optimization parameters, analyze results and interpret them into a new
geometry.
Shape optimization
Even though the geometry is interpreted from a topology optimization result, it does
not mean that it is optimal. A shape optimization can further improve the design.
Based on the problem and geometry, the designer must decide between a mesh based
and a parameter based shape optimization.
o Mesh based shape optimization
The designer builds the calculation model, sets up the optimization problem,
runs optimization and interprets results into a new geometry.
o Parameter based shape optimization
The designer builds the calculation model, sets up the optimization problem
and runs the optimization. The optimal geometry is automatically returned.

41
Confirming calculations at NAC
NAC performs confirming calculations and evaluates if the geometry meets the
demands and also to evaluate if the geometry is optimal or if more mass can be
reduced. If it meets the demands it is sent to physical prototype testing. If not, it is to
be redesigned.
5.3.3 Results of FMEA regarding overall methodology
The FMEA was performed, see figure 30, and several possible failures was detected. These
included making incorrect calculation models, failure to detect errors in the calculation model
or misinterpreting results. As recommended actions there was only two actions repeated for
several failure modes:
Designer and NAC calculation engineer together receiving and reviewing the
problems.
Train designers to carefully review results.
Discussions with calculation engineers led to the conclusions that the NAC calculation
engineer would also be consulted during the review of calculation results, and also that a
confirming calculation in Catia would be made. The FMEA can also be found in Appendix:
FMEA regarding overall method.
Process step Failure ModeProbability
of failureEffect Severity Control
Probability
of detection
Linear Risk
NumberRecommended action taken
Designer receives, interprets and
analyzes information regarding the
problem
Designer misinterprets problem 2Design process becomes based on
inaccurate information9 Comparison to NAC calculations 3 54,00
Designer and NAC calculation
engineer together receives and
reviews a new problem
Designer misses information 2Design process becomes based on
inaccurate information9 Comparison to NAC calculations 3 54,00
Designer and NAC calculation
engineer together receives and
reviews a new problem
Designer is misinformed 2Design process becomes based on
inaccurate information9 Comparison to NAC calculations 3 54,00
Designer and NAC calculation
engineer together receives and
reviews a new problem
Designer decides upon suitable
simplifications
Designer makes unsuitable
simplifications4 Calculation model does not reflect reality 9
Analyses of results; Comparison to NAC
calculations3 108,00
Designer and NAC calculation
engineer discusses different
simplifications
Designer does not make enough
simplifications4
Calculation model too complex, long
calculation times7 None until prototype and field testing 9 252,00
Designer and NAC calculation
engineer discusses different
simplifications
Designer builds calculation modelDesigner makes mistake in building
calculation model5 Calculation model does not reflect reality 9
Analyses of results; Comparison to NAC
calculations2 90,00
Train designers to critically
review calculation results.
Designer defines topology
optimization goal and limitations
Designer makes mistake in building
optimization model3 Calculation model does not reflect reality 9
Analyses of results; Comparison to NAC
calculations2 54,00
Train designers to critically
review calculation results.
Designer analyzes the topology
optimization results
Designer misinterprets the optimization
results1
Rest of design process is not based on
optimal design7
Analyses of results; Comparison to NAC
calculations3 21,00
Designer interprets topology
optimization results and creates
geometry
Designer misinterprets the optimization
results1
Geometry does not entirely reflect
optimization results, greater gap for
shape optimization to fill
4Not being able to perform shape
optimization1 4,00
Designer rebuilds calculation model
based on topology optimization
results
Designer makes mistake in building
calculation model3 Calculation model does not reflect reality 9
Analyses of results; Comparison to NAC
calculations2 54,00
Train designers to critically
review calculation results.
Designer sets up mesh based shape
optimization problem
Designer makes mistake in building
optimization model3
Optimization of geometry does not reach
it's full potential5
Analyses of results; Comparison to NAC
calculations4 60,00
Train designers to critically
review calculation results.
Designer interprets mesh based shape
optimization results and changes
geometry
Designer misinterprets the optimization
results3
Geometry does not entirely reflect
optimization results, greater gap for
parameter based shape optimization to
fill
4 Comparison to NAC calculations 3 36,00
Designer rebuilds calculation model
based on mesh based shape
optimization results
Designer makes mistake in building
calculation model2 Calculation model does not reflect reality 9
Analyses of results; Comparison to NAC
calculations2 36,00
Train designers to critically
review calculation results.
Designer sets up parameter based
shape optimization problem
Designer makes mistake in defining
parameters3
Calculation results may not converge to
an optimum7
Analyses of results; Comparison to NAC
calculations; Model might crash1 21,00
Designer sends geometry to NAC for
confirmation calculations
Designer misses to inform NAC of the
entire problem2
The calculation process at NAC
becomes based on inaccurate or
inadequate information
9 None until prototype and field testing 9 162,00
Designer and NAC calculation
engineer together receives and
reviews a new problem
NAC misinterprets the designer 2
The calculation process at NAC
becomes based on inaccurate
information
9 None until prototype and field testing 9 162,00
Designer and NAC calculation
engineer together receives and
reviews a new problem Figure 30 - FMEA regarding overall methodology

42
5.3.4 Refined overall methodology
After the FMEA a new, refined, overall methodology proposal was constructed, see figure 31.
It consists of the following points:
Problem definition
The designer analyzes the problem and decides upon simplifications, with the aid of a
consulting calculation engineer.
Topology optimization
The designer would build a calculation model according to the defined problem,
define the optimization parameters, analyze results and interpret them into a new
geometry, with the help of a calculation engineer.
Shape optimization
Even though the geometry is interpreted from a topology optimization result, it does
not mean that it is optimal. A shape optimization improves the design further. Based
on the problem and geometry, the designer must decide between a mesh based and a
parameter based shape optimization.
o Mesh based shape optimization
The designer builds the calculation model, sets up the optimization problem,
runs optimization and interprets results into a new geometry, with the help of a
calculation engineer.
o Parameter based shape optimization
The designer builds the calculation model, sets up the optimization problem
and runs the optimization, with the help of a calculation engineer.
Confirming calculations in Catia
The designer performs a strength calculation in order to evaluate the geometry, with
the help of a calculation engineer. Together, they evaluate if the geometry meets the
set demands and also to evaluate if the geometry is optimal or if more mass can be
reduced. If it meets the demands it is sent to NAC. If not, it is to be redesigned.
Confirming calculations at NAC
NAC performs final confirming calculations and evaluate if the geometry meets the
demands and also to evaluate if the geometry is optimal or if more mass can be
reduced. If it meets the demands it is to physical prototype testing. If not, it is to be
redesigned.

43
New project
Confirming
calculations at NAC
Does geometry
meet demands?
Yes
No
Geometry for
physical testing
Designer builds
calculation model
Designer sets up
optimization
problem
Designer interprets
results and changes
geometry
Mesh based
shape optimization
Designer builds
calculation model
Designer sets up
optimization
problem
Parameter based
shape optimizingDesigner builds
calculation model
Designer defines
optimization
parameters
Designer analyzes
optimization
results
Designer
interprets results
and creates new
geometry
Topology
optimiziation
Confirming
calculations in Catia
Problem
definition
Designer analyzes
the problem
Designer defines
simplifications
Does geometry
meet demands?
Yes
No
Consultation
of NAC
Calculation
Engineer
Figure 31 - Refined overall methodology proposal
Automation in the overall methodology
The macros created can be used for more than just strength calculations. The calculation
models made by the macros can also be used in the optimization tools. The use of macros in
the proposed overall methodology would be to quickly build models that later would be used
in an optimization problem, see Figure 32.

44
Run macro for
creating
publications
Connecting
publications to
geometries
Geometry of
new front axle
beam
Calculation model
for calculation or
optimization
Create calculation
model
Run macro
for creating
calculation
model
Perform
changes to
calculation
model
Loading case
#1
Loading case
#2
Run macro
for creating
calculation
model
Perform
changes to
calculation
model
Loading case
#3
Run macro
for creating
calculation
model
Perform
changes to
calculation
model
Figure 32 - The use of macros in the proposed overall methodology

45
6 Discussion and Conclusion Here, the methods used and results are discussed and compared. Also, conclusions of the
discussions are presented.
6.1 Regarding the methods used
The interviews were held with people that were most likely to adapt the new methodology
and the people who showed the most interest. A questionnaire was sent out to all the affected
actors, but only a handful of responses were received. The people responding were more or
less the same people that were interviewed. Even though it resulted in a great amount of
information, some information may still have been missed, by not getting information from
every single one. With that being said, it was still concluded that the information gathered
was sufficient to build a study upon, as a great many of both advantages and drawbacks was
identified.
Just as with the interviews and questionnaires, the QFD and the FMEA was discussed and
performed with a selection of the affected people. Even if the participants was considered
sufficient for the information gathering, the outcome of the QFD and FMEA might have been
slightly affected by the narrow selection. Especially people more skeptic to the new tools
might have had a different input that would have changed the outcomes.
It was considered that more information only would change the conclusions and results from
the performed QFD and FMEA marginally, and that the information gathered was sufficient
for this project. However, for future evaluation and development of the methodology it would
be appropriate to perform a more extensive information gathering, with focus groups and
maybe employ tools such as the SWOT analysis.
6.2 Regarding calculation model and convergence study
The results was very similar to the ones from NAC, and the margin of error became smaller
when the element sizes decreased. The convergence study was performed with one condition
being that the calculations would be done locally. If, however, it would be done on a more
powerful batch server, and a new convergence study would be done, the results would be
better. Much smaller element sizes could be set, and the calculations would be much more
reliable and closer to the ones made by NAC. That would make FEM calculations as a much
more obvious choice for the designers, and might persuade even the most sceptic ones.
The conclusion is simple: The results of the convergence study was the best that could be
obtained at the given situation. If a batch server solution would be used, better results would
be had, and the designer would be more likely to perform the calculations.
6.3 Regarding optimization results
When the optimization models first was calculated, it became obvious that the if the desktop
computers performance was limiting for simple FEM calculations, it was nowhere near the
performance needed for optimization. Therefore very simple optimization examples were
used, as a batch server solution could not be used. However, if the optimizations had been

46
done using a server solution, different results may have been had and different conclusions
may had been drawn.
Topology optimization in HyperShape/Catia
For the bridge, the results quickly converged to the ones from NAC. Even though some
differences was shown for the bracket loading case, the differences decreased with the
element size. It showed that the tool would bring satisfactory results, if the model was
detailed enough. Hence, the limitations identified was regarding the specific computer’s
performance and not the tool or the method. The HyperShape/Catia tool was very easy to use,
and should not be an obstacle for the designer.
Mesh based shape optimization in HyperShape/Catia
For the bridge, the results quickly converged to the ones from NAC. Some problems were had
regarding distorted mesh due to the big geometrical change from the original geometry. The
issue is due to the method rather than the actual tool. The same goes for the bracket example.
Both the optimizations from HyperShape and the one from NAC resulted in a distorted mesh,
due to the big geometrical change. The conclusion was drawn that the HyperShape/CATIA is
a reliable tool, and that the limitations regarding big geometrical changes was a problem with
the method itself, and not the tools.
Parameter based shape optimization in Catia PEO
The parameter based shape optimizations did not have problems regarding big geometrical
changes. The problems were rather regarding what parameters that would be changed, i.e. the
problem definition. For the bridge example, it was difficult to identify what parameters were
to be set as variables. Either there was hardly any mass change, or the results did not make
any sense, see table 8.
However, the parameter based shape optimization was the only method that made a
significant reduction of material for the bracket example. No mesh could be distorted, but
there was still a limitation in how much the geometry could change: the parameterization of
the geometry. This has an advantage and a drawback. The advantage is that the
parameterization could be set so interfaces are not affected and manufacturing constraints are
considered. The drawback is that the truly optimal solution can be very hard to find. This is
the reason that the results from PEO differed so much form the ones from HyperShape/Catia
and OptiStruct.
Hence, parameter based shape optimization in Catia PEO also is a powerful tool, if the
problem is set up correctly. It gives the user the ability to better control what parameters to
change, and how the geometry can change. However, the choices regarding the parameters
can also restrain the tool, and blocking the path to an even more optimal solution. Also,
instead of one optimal solution being generated, the user is presented with a list of different
design proposals. One of these proposals must be chosen. It therefore requires a lot of the
user. Therefore it cannot be considered as easy to use, and that may become discouraged not
use the tool.

47
6.4 Regarding overall methodology
Since all of the structural optimization methods and tools were found to have specific
advantages and drawbacks, not one of them could be ruled out. The QFD showed this as well.
All of them should in one way or the other be included in the final methodology.
When the overall methodology proposal was constructed it was assumed that a batch server
solution would be used, allowing the user to employ all of the tools without restraints.
The methodology has only been constructed and refined using a theoretical basis, with tools
as QFD and FMEA. When actually testing the methodology, it will probably be refined and
developed further. The methodology proposed is therefore not a suggestion for how to
conduct product development, but rather a first step in a longer development process.
6.5 Connecting to the purpose of the thesis
The purpose of was to investigate how simulation driven design could reduce the lead time of
the design process. It can be argued that the proposed methodology makes a foundation for
reducing the lead time, but without actually testing the methodology we cannot know. As
mentioned in chapter 1.1 Background, the Aberdeen group has found a correlation between
implementing simulation driven design and and reducing development cost and development
time, but whether it is true for this methodology and Scania, we cannot say.
Apart from the reduction of lead time, the thesis also aimed to find the answer of the
following set of questions:
Can calculations be done using Catia V5?
o Are they reliable
o What calculation models would be used?
o Can the calculations be done locally?
Answer: Yes, calculations can be done, and suitable calculation models were
found. Calculations are somewhat reliable if they are done locally, but if they
were to be done using a batch server solution, the calculations could be made
even more reliable.
Can optimizations be done in Catia?
o Are they reliable
o Can the optimizations be done locally?
Answer: Yes, optimizations can be done in Catia. However, it requires an
experienced user to determine what tool to use, and an even more experienced
user to use the Catia PEO tool. The optimizations cannot be done locally, if
reliable results are to be returned.
If calculations and optimizations can be done in Catia, HOW would they be used?
o Can a methodology be constructed?
Answer: A methodology has been constructed, that in theory utilise the tools
and method in such a way that the lead time of the design process is reduced.
However, evaluation and further development is needed, see chapter 7
Recommendations.

48
It was argued in chapter 1.1 Background, that the problems at NA had affects throughout the
organization. As discussed, it cannot be said that the proposed methodology actually solves
these problems, but conclusions can be drawn on the assumption that it would.
If the designer do calculations and optimizations, she would get better and faster feedback and
gain an understanding regarding the calculation process and strength of materials. The
calculation engineers could focus on more challenging tasks and develop their competence. It
would be a better utilization of the competence locked in the engineers. The testing of
components would be unaffected, but the need for physical testing would decrease as fewer
design solutions are tested. Therefore, the problems at the testing level would not affect the
organization as much.
This would decrease the total lead time of the R&D process, and make it more efficient as
fewer redesigns are needed. The organization as a whole would produce products with higher
quality, have more satisfied customers and gain goodwill, see figure 33.
Figure 33 - The solved problem throughout the organization

49
7 Recommendations Here follows recommendations for further evaluation and investigations. It includes areas
deliberately delimitated from this project as well as predicted areas of interest.
As the proposed methodology needs further refinement, it is recommended to use it for a pilot
project for future investigations and evaluations. During this pilot project, the proposed
methodology and tools are to be used for the development of a new component. The
experiences from the pilot project would form a basis for future development of the
methodology.
During the evaluation, the tools and methods have been used on a desktop computer. This
means that all files were saved locally, and all calculations and optimizations have been done
locally.
During a product development project at Scania, a PDM system is used. Thus, for a pilot
project to be made and a correct evaluation to be possible, the tools must be integrated with
Scania’s PDM system. The macros designed are made to work locally, and they have to be
adapted in order to work with the PDM system.
Even though already part of the Catia portfolio, Scania does not have a batch server solution
for PEO. Neither does one exist at Scania for HyperShape/CATIA. This must exist in order
for a pilot project to take place.

50

51
8 References Bergman, B., & Klefsjö, B. (2010). Quality from Customer Needs to Custumer Satisfaction.
Lund: Studentlitteratur.
Bergsjö, D., Almefelt, L., & Malmqvist, J. (2010). Supporting Requirements management in
embedded sstems development in a lean-influenced organization. International Design
Conferance - Design 2010 .
Burenius, J., & Lindstedt, P. (2003). The Value Model: How to Master Product Development
and Create Unrivalled Customer Value. Sweden: Nimba.
Christensen, P. W., & Klarbring, A. (2009). An introduction to Structural Optimization.
Linköping: Springer Science.
Hutton, D. (2004). Fundamentals of Finite Element Analysis. New York, NY: McGraw-Hill.
McQuarrie, E. F. (2006). The Market Research Toolbox, Second Edition. Thousand Oaks:
Sage Publications Ltd.
Sellgren, U. (1999). Simulation-Driven Design - Motives, Means, and Opportunities.
Stockholm: The Royal Institute of Technology.
Sigmund, O., & Bendsøe, M. P. (2003). Topology Optimization - Theory, Methods and
Applications. Lyngby: Springer.
The Aberdeen Group. (2006). The Simulation Driven Deign Benchmark Report. Boston, MA:
Aberdeen Group, Inc.
Ulrich, K. T., & Eppinger, S. D. (2000). Product design and development. USA:
Irwin/McGraw-Hill.
Wheelright, S. C., & Clark, K. B. (1992). Revolutionizing Product Development: quantum
leaps in speed, effiency and quality. New York, N.Y.: The Free Press.

I

II
Appendix: Calculation models for loading cases Here follow representations of the different calculation models that was made.
For the side loading case, two models where made:
Complexity Model
Very simple
(Chosen)
Somewhat
simple
For the braking load case, four models was made
Complexity Model
Very simple
Somewhat
simple
(Chosen)
Somewhat
complex
Very
complex

III
For the pulsating wheel force load case, two models were made
Complexity Model
Very simple
Somewhat
simple (Chosen)

IV
Appendix: Publications

V

VI
Appendix: FMEA regarding overall method
Pro
cess s
tep
Failu
re M
ode
Pro
babili
ty
of fa
ilure
Effe
ct
Seve
rity
Contr
ol
Pro
babili
ty
of dete
ction
Lin
ear
Ris
k
Num
ber
Recom
mended a
ction t
aken
1
De
sig
ne
r re
ce
ive
s, i
nte
rpre
ts a
nd
an
aly
ze
s in
form
ati
on
re
ga
rdin
g t
he
pro
ble
m
Desig
ner
mis
inte
rpre
ts p
roble
m2
Desig
n p
rocess b
ecom
es b
ased o
n
inaccura
te info
rmation
9C
om
parison t
o N
AC
calc
ula
tions
354,0
0
Desig
ner
and N
AC
calc
ula
tion
engin
eer
togeth
er
receiv
es a
nd
revi
ew
s a
new
pro
ble
m
Desig
ner
mis
ses info
rmation
2D
esig
n p
rocess b
ecom
es b
ased o
n
inaccura
te info
rmation
9C
om
parison t
o N
AC
calc
ula
tions
354,0
0
Desig
ner
and N
AC
calc
ula
tion
engin
eer
togeth
er
receiv
es a
nd
revi
ew
s a
new
pro
ble
m
Desig
ner
is m
isin
form
ed
2D
esig
n p
rocess b
ecom
es b
ased o
n
inaccura
te info
rmation
9C
om
parison t
o N
AC
calc
ula
tions
354,0
0
Desig
ner
and N
AC
calc
ula
tion
engin
eer
togeth
er
receiv
es a
nd
revi
ew
s a
new
pro
ble
m
2D
esi
gn
er
de
cid
es
up
on
su
ita
ble
sim
pli
fica
tio
ns
Desig
ner
makes u
nsuitable
sim
plif
ications
4C
alc
ula
tion m
odel does n
ot
refle
ct
realit
y9
Analy
ses o
f re
sults;
Com
parison t
o N
AC
calc
ula
tions
3108,0
0
Desig
ner
and N
AC
calc
ula
tion
engin
eer
dis
cusses d
iffere
nt
sim
plif
ications
Desig
ner
does n
ot
make e
nough
sim
plif
ications
4C
alc
ula
tion m
odel to
o c
om
ple
x,
long
calc
ula
tion t
imes
7N
one u
ntil pro
toty
pe a
nd fie
ld t
esting
9252,0
0
Desig
ner
and N
AC
calc
ula
tion
engin
eer
dis
cusses d
iffere
nt
sim
plif
ications
3D
esi
gn
er
bu
ild
s ca
lcu
lati
on
mo
de
lD
esig
ner
makes m
ista
ke in b
uild
ing
calc
ula
tion m
odel
5C
alc
ula
tion m
odel does n
ot
refle
ct
realit
y9
Analy
ses o
f re
sults;
Com
parison t
o N
AC
calc
ula
tions
290,0
0Tra
in d
esig
ners
to c
ritically
revi
ew
calc
ula
tion r
esults.
4D
esi
gn
er
de
fin
es
top
olo
gy
op
tim
iza
tio
n g
oa
l a
nd
lim
ita
tio
ns
Desig
ner
makes m
ista
ke in b
uild
ing
optim
ization m
odel
3C
alc
ula
tion m
odel does n
ot
refle
ct
realit
y9
Analy
ses o
f re
sults;
Com
parison t
o N
AC
calc
ula
tions
254,0
0Tra
in d
esig
ners
to c
ritically
revi
ew
calc
ula
tion r
esults.
5D
esi
gn
er
an
aly
ze
s th
e t
op
olo
gy
op
tim
iza
tio
n r
esu
lts
Desig
ner
mis
inte
rpre
ts t
he o
ptim
ization
results
1R
est
of desig
n p
rocess is n
ot
based o
n
optim
al desig
n7
Analy
ses o
f re
sults;
Com
parison t
o N
AC
calc
ula
tions
321,0
0
6
De
sig
ne
r in
terp
rets
to
po
log
y
op
tim
iza
tio
n r
esu
lts
an
d c
rea
tes
ge
om
etr
y
Desig
ner
mis
inte
rpre
ts t
he o
ptim
ization
results
1
Geom
etr
y d
oes n
ot
entire
ly r
efle
ct
optim
ization r
esults,
gre
ate
r gap for
shape o
ptim
ization t
o fill
4N
ot
bein
g a
ble
to p
erform
shape
optim
ization
14,0
0
7
De
sig
ne
r re
bu
ild
s ca
lcu
lati
on
mo
de
l
ba
sed
on
to
po
log
y o
pti
miz
ati
on
resu
lts
Desig
ner
makes m
ista
ke in b
uild
ing
calc
ula
tion m
odel
3C
alc
ula
tion m
odel does n
ot
refle
ct
realit
y9
Analy
ses o
f re
sults;
Com
parison t
o N
AC
calc
ula
tions
254,0
0Tra
in d
esig
ners
to c
ritically
revi
ew
calc
ula
tion r
esults.
8D
esi
gn
er
sets
up
me
sh b
ase
d s
ha
pe
op
tim
iza
tio
n p
rob
lem
Desig
ner
makes m
ista
ke in b
uild
ing
optim
ization m
odel
3O
ptim
ization o
f geom
etr
y d
oes n
ot
reach
it's
full
pote
ntial
5A
naly
ses o
f re
sults;
Com
parison t
o N
AC
calc
ula
tions
460,0
0Tra
in d
esig
ners
to c
ritically
revi
ew
calc
ula
tion r
esults.
9
De
sig
ne
r in
terp
rets
me
sh b
ase
d s
ha
pe
op
tim
iza
tio
n r
esu
lts
an
d c
ha
ng
es
ge
om
etr
y
Desig
ner
mis
inte
rpre
ts t
he o
ptim
ization
results
3
Geom
etr
y d
oes n
ot
entire
ly r
efle
ct
optim
ization r
esults,
gre
ate
r gap for
para
mete
r based s
hape o
ptim
ization t
o
fill
4C
om
parison t
o N
AC
calc
ula
tions
336,0
0
10
De
sig
ne
r re
bu
ild
s ca
lcu
lati
on
mo
de
l
ba
sed
on
me
sh b
ase
d s
ha
pe
op
tim
iza
tio
n r
esu
lts
Desig
ner
makes m
ista
ke in b
uild
ing
calc
ula
tion m
odel
2C
alc
ula
tion m
odel does n
ot
refle
ct
realit
y9
Analy
ses o
f re
sults;
Com
parison t
o N
AC
calc
ula
tions
236,0
0Tra
in d
esig
ners
to c
ritically
revi
ew
calc
ula
tion r
esults.
11
De
sig
ne
r se
ts u
p p
ara
me
ter
ba
sed
sha
pe
op
tim
iza
tio
n p
rob
lem
Desig
ner
makes m
ista
ke in d
efin
ing
para
mete
rs3
Calc
ula
tion r
esults m
ay n
ot
conve
rge t
o
an o
ptim
um
7A
naly
ses o
f re
sults;
Com
parison t
o N
AC
calc
ula
tions;
Model m
ight
cra
sh
121,0
0
12
De
sig
ne
r se
nd
s g
eo
me
try t
o N
AC
fo
r
co
nfi
rma
tio
n c
alc
ula
tio
ns
Desig
ner
mis
ses t
o info
rm N
AC
of th
e
entire
pro
ble
m2
The c
alc
ula
tion p
rocess a
t N
AC
becom
es b
ased o
n inaccura
te o
r
inadequate
info
rmation
9N
one u
ntil pro
toty
pe a
nd fie
ld t
esting
9162,0
0
Desig
ner
and N
AC
calc
ula
tion
engin
eer
togeth
er
receiv
es a
nd
revi
ew
s a
new
pro
ble
m
NA
C m
isin
terp
rets
the d
esig
ner
2
The c
alc
ula
tion p
rocess a
t N
AC
becom
es b
ased o
n inaccura
te
info
rmation
9N
one u
ntil pro
toty
pe a
nd fie
ld t
esting
9162,0
0
Desig
ner
and N
AC
calc
ula
tion
engin
eer
togeth
er
receiv
es a
nd
revi
ew
s a
new
pro
ble
m