Development of lipid based depot formulations using ...
201
Dissertation zur Erlangung des Doktorgrades der Fakultät für Chemie und Pharmazie der Ludwig-Maximilians-Universität München Development of lipid based depot formulations using interferon-beta-1b as a model protein Vorgelegt von Christian Thomas Karl-Heinz Neuhofer aus Eggenfelden 2015
Transcript of Development of lipid based depot formulations using ...
I
Dissertation
zur Erlangung des Doktorgrades
der Fakultät für Chemie und Pharmazie der
Ludwig-Maximilians-Universität München
Development of lipid based depot formulations using
interferon-beta-1b as a model protein
Vorgelegt von
Christian Thomas Karl-Heinz Neuhofer
aus Eggenfelden
2015
II
Erklärung
Diese Dissertation wurde im Sinne von § 7 der Promotionsordnung vom 28. November
2011 von Herrn Prof. Dr. Gerhard Winter betreut.
Eidesstattliche Versicherung
Diese Dissertation wurde selbständig, ohne unerlaubte Hilfe erarbeitet.
München, den
_______________________
(Christian Neuhofer)
Dissertation eingereicht am:
1. Gutachter: Prof. Dr. Gerhard Winter
2. Gutachter: Prof. Dr. Wolfgang Frieß
Mündliche Prüfung am: 30.11.2015

III
Für meine Familie und Freunde
IV
Abstract
Due to their specificity and potency, biologicals allow entering new therapeutic application
areas. Therefore, therapeutic proteins are a very important part of the global pharmaceutical
market. A common characteristic of proteins is their short half-life which makes frequent
parenteral application necessary and consequently might decrease patient compliance. Drug
loaded depot systems are able to address this challenge.
The goal of this project was to investigate the suitability of triglyceride based extrudates (SLIs)
and vesicular phospholipid gels (VPGs) as a depot system for protein delivery for the very
hydrophobic and labile model protein interferon-β-1b (IFN-β-1b). To improve the
physicochemical properties of the protein, a side specific PEGylation technique was used. This
gives also the opportunity to investigate the influence of PEGylation on the release.
Furthermore, it gives the option to combine two principles of half-life extension: PEGylation
and a depot system. Because of the combination of a hydrophobic depot system and a
hydrophobic protein, protein-lipid interactions are likely to occur. The investigation of the
influence of protein-lipid-interactions on protein stability and the influence of these
interactions on the protein release was also part of this project.
IFN-β-1b was successfully PEGylated using a 40 kDa branched PEGaldehyde. PEGylation of IFN-
β-1b does significantly improve the solubility and also the stability of the protein. However,
the changed physicochemical properties result in a new molecule with completely different
characteristics.
SLIs were successfully prepared by mixing the protein lyophilisate and the lipids using hot-
melt extrusion. Therefore, a human serum albumin free lyophilisate was developed for IFN-β-
1b and PEG-IFN-β-1b. For both, the native and the PEGylated protein species, a sustained
release over seven days was achieved. While the addition of a surfactant was necessary to
release native IFN-β-1b at all, a release under physiological conditions was possible for PEG-
IFN-β-1b. Also the effect of protein-lipid interactions was reduced. Even though the
preparation and short-term storage did not harm the protein stability, a drop of biological
activity was observed during the later stage of the release. This loss of activity was the result
of instabilities of both protein species in the release medium in the presence of lipids.
Due to the occurrence of strong protein-lipid interactions, a release of the native IFN-β-1b
from VPGs was not possible. PEGylation of IFN-β-1b made the investigation of VPGs as a depot
system possible. However, the release rate was very slow and incomplete. This was also due
to protein-lipid interactions, which were reduced by PEGylation but not completely avoided.
Those interactions did not only affect the release, but did also change the mechanical
properties of the VPGs by increasing their viscosity. During the release, a significant drop of
the biological activity was observed even at the first day which indicates a degeneration of the
protein during VPG preparation.
In order to get a better understanding regarding the observed protein-lipid interactions and
to find a quick and material saving tool to get information of possible effects that might
influence the release from VPGs, different tools and methods were investigated. Both IFN-β-
1b species were compared to other more hydrophilic proteins.
V
Depending on the model, the effect of interaction between some proteins and phospholipids
could even be seen macroscopically. However, other proteins needed more sensitive
methods. Therefore, a quartz crystal microbalance or a Langmuir film balance and different
models like liposomes or monolayers were used. Due to the complexity of the interactions no
consistent correlation between the methods and no prediction regarding the influence on the
release behavior was possible.
VI
Acknowledgement
The present thesis was prepared at the Department of Pharmacy, Pharmaceutical Technology
and Biopharmaceutics at the Ludwig-Maximilians-University in Munich under the supervision
of Prof. Dr. Gerhard Winter.
First of all I want to express my deepest gratitude to my doctoral advisor Prof. Dr. Gerhard
Winter for giving me the chance to join his research team. Thank you very much for the
scientific guidance and the trustful and professional advice throughout this project. You did
not only support my scientific development but also my personal. I also want to say thank you
for the very good and creative working atmosphere within your research group which was also
reflected by the always enjoyable social events.
I would like to thank Dr. Ahmed Besheer who supervised me through the first two years of my
work. Thank you very much for the tremendous amount of time and effort you put in the
regular meetings and discussions.
The present thesis was in collaboration with Bayer Pharma AG, and was also supervised in
person of Dr. Carsten Olbrich, who made this project possible by funding and material support.
I would also like to thank Carsten for the regular scientific input during the project.
My special thanks to Prof. Dr. Wolfgang Frieß for being the co-referee of this thesis. I would
also thank you for the scientific guidance and discussions. Together with Prof. Dr. Winter, you
managed to create an extremely constructive and enjoyable atmosphere within both working
groups.
My tremendous gratitude is expressed to all my companions from the research groups from
Prof. Dr. Winter and Prof. Dr. Frieß. Thank you for the great time during the past years. There
was always somebody there to help and support in scientific and non-scientific questions. The
social events like the hiking and skiing trips and excursions were always fun.
Particularly, I would like to thank my former lab mates Matthäus Noga, Elisabeth Härtl and
Moritz Vollrath for the great and trustful time and for still being friends. I would also like to
thank especially Raimund Geidobler, Markus Hofer and Christian Hildebrandt for all the
personal and scientific help.
I also want to thank my family and friends for supporting me during my thesis!
VII
Table of contents
Chapter I General Introduction ............................................................................................ 1
1 Examples of depot-systems and PEGylation of proteins for half-Life extension ............ 2
1.1 PEGylation ................................................................................................................ 4
1.2 Current Market Overview ........................................................................................ 5
1.3 Challenges of PEGylation: Immunogenicity ............................................................. 7
2 Depot formulations for delivery of biopharmaceuticals ................................................. 8
2.1 Poly(lactide-co-glycolide) ....................................................................................... 10
2.2 Lipids ...................................................................................................................... 13
3 Background knowledge on interferons especially interferon-β-1b .............................. 23
3.1 Interferon-β ............................................................................................................ 23
3.2 Interferon-β-1a ...................................................................................................... 24
3.3 Interferon-β-1b ...................................................................................................... 24
Chapter II Objective of the thesis........................................................................................ 28
Chapter III Development of a lipid based depot formulation for Interferon-β-1b .............. 29
1 Introduction ................................................................................................................... 29
2 Materials and Methods ................................................................................................. 30
2.1 Materials ................................................................................................................ 30
2.2 Methods ................................................................................................................. 30
3 Results of preliminary tests with VPGs and IFN-β-1b ................................................... 37
3.1 Extraction of the incorporated protein from VPGs ............................................... 37
3.2 Investigation of size distribution after protein loading ......................................... 40
3.3 Conclusion .............................................................................................................. 42
4 Solid Lipid implants ....................................................................................................... 43
4.1 Development of a HSA-free interferon-β lyophilisate ........................................... 43
4.2 Preparation of extrudates ...................................................................................... 53
VIII
4.3 Release buffer ........................................................................................................ 56
4.4 Release studies ....................................................................................................... 61
5 Summary and Conclusion .............................................................................................. 76
Chapter IV Development of a depot formulation for the PEGylated interferon-β-1b ........ 78
1 Materials and Methods ................................................................................................. 79
1.1 Materials ................................................................................................................ 79
1.2 Methods ................................................................................................................. 80
2 Results of the PEGylation of IFN-β-1b ........................................................................... 84
2.1 Method development ............................................................................................ 85
2.2 Characterization of 40 kDa PEG-IFN-β-1b .............................................................. 92
3 Release from solid lipid implants .................................................................................. 97
3.1 Development of HSA-free PEG-IFN lyophilisate .................................................... 97
3.2 Release studies from solid lipid implants ............................................................ 103
3.3 Biological activity after release ............................................................................ 106
3.4 Investigation of the reason of protein oxidation ................................................. 112
4 Release Studies from VPGs ......................................................................................... 115
4.1 Effect of protein incorporation on the gel properties of the VPGs ..................... 116
4.2 Release tests from VPGs ...................................................................................... 118
4.3 Investigation of the incomplete release .............................................................. 125
4.4 Biological activity after release ............................................................................ 127
4.5 Summary and conclusion ..................................................................................... 129
Chapter V Protein-lipid-interactions ................................................................................. 131
1 Materials and Methods ............................................................................................... 132
1.1 Materials .............................................................................................................. 132
1.2 Methods ............................................................................................................... 132
2 Results of the protein-triglyceride interaction............................................................ 139
IX
2.1 Protein adsorption determined by quartz crystal microbalance (QCM) ............. 139
3 Interaction with phospholipids ................................................................................... 144
3.1 Influence on viscosity and microscopic appearance of the VPGs ....................... 146
3.2 Langmuir trough ................................................................................................... 149
3.3 Interactions with liposomes ................................................................................. 154
3.4 Investigation of protein adsorption to phospholipids ......................................... 165
4 Summary and conclusion ............................................................................................ 170
Chapter VI Final summary .................................................................................................. 173
Chapter VII References ........................................................................................................ 178

X
List of abbrevations
BSA bovine serum albumin
CMC critical micelle concentration
Da dalton
DAC dual asymmetric centrifuge
DSC differential scanning calorimetry
EPO erythropoietin
FDA Food and Drug Administration
FNU formazine nephelometric units
FTIR-spectroycopy fourier-transformed infrared spectroscopy
G-CSF granulocyte-colony stimulating factor
HES hydroxyethyl starch
HPW highly purified water
HSA human serum albumin
IEX ion exchange chromatography
IFN interferon
IgG immunoglobulin G
LO light obscuration
mAb monoclonal antibody
ml milliliter
mM millimolar
MS multiple sclerosis
MWCO molecular weight cut off
nIFN native interferon β-1b
PBS phosphate buffered saline
PC phosphatidylcholine
PEG poly(ethylene glycol)
PEG-IFN-α-2a PEGylated interferon α-2a
PEG-IFN-β-1b PEGylated interferon β-1b
PLGA poly(lactide-co-glycolide)
PS polysorbate
PVDF polyvinylidene fluoride
RLU relative light units
RP-HPLC reversed phase high Performance liquid chromatography
SDS sodium dodecyl sulfate
SDS-PAGE Sodium dodecyl sulfate polyacrylamide gel electrophoresis
SE-HPLC size exclusion high performance liquid chromatography
Tg glass transition temperature
Tm melting temperature
Tris tris(hydroxymethyl)aminomethane
UV ultraviolet
1
Chapter I General Introduction
Since the approval of insulin by the Food and Drug Administration (FDA) in 1982, which was
the first genetically engineered consumer health product on the market, the number of
biotechnological products on the pharmaceutical market increased enormously. In 2013, the
top four of the best selling drugs were therapeutic proteins. Eight products of the top ten are
biopharmaceutics which generated global sales of more than 58 billion US$ in 2013 [1].
According to IMS Institute for Healthcare Informatics in their 2013 report, the global
medicines market will exceed a value of one trillion U.S. dollars for the first time in 2014 [2].
Biologicals currently represent a very important part of the total global market volume with
currently 212 marketed products in the United States and European Union. This market has
been steadily rising, reaching a total cumulative sales value of $140 billion for 2013 and
biologicals are expected to further increase their share. Most of the therapeutic proteins in
the beginning aimed usually at replacing naturally occurring human proteins due to a
deficiency or abnormal activity. Another group is mainly represented by Fc fusion proteins and
monoclonal antibodies (mAB) targeting specific structures. The high specificity and potency
compared to most of the small molecules allows to enter new therapeutic application areas
[2, 3].
This specificity is due to their complex macromolecular nature. Proteins are macromolecules
consisting of forty to several hundred L-amino acids which are connected via peptide bonds.
The primary structure is determined by the sequence of the amino acids which are covalently
linked by planar peptide bonds. The general three-dimensional form is called secondary
structure and is defined by the patterns of hydrogen bonds between backbone amide and
carboxyl groups. The most common secondary structures are α-helices and β-sheets. The
specific atomic positions in three-dimensional space are considered as the tertiary structure.
Several protein molecules or polypeptide chains are able to form the quaternary structure of
a protein. Not only chemical changes can alter the biological activity of proteins, but also
changes in the mentioned steric structures [4].
Because of the large size and fragile three-dimensional structure of proteins, which must be
maintained for biological activity, the delivery of proteins is very challenging. The most
common way to administer drugs in general is the oral route because of the ease of
administration and widespread acceptance. While for small molecular drugs this route is the
2
most used one, several severe problems arise when it comes to the application of proteins
and peptides. Inactivation due to the pH conditions in the stomach and enzymatic degradation
in the gastrointestinal tract reduce protein activity [5]. Even though protection of proteins
from acidic and enzymatic degradation has been successfully achieved, the low permeability
through the intestinal wall and consequently the low bioavailability present a huge challenge.
While adsorption enhancers have shown some increase in bioavailability [6], the delivery of a
reproducible dose is still very hard to achieve [5, 7].
Because of these drawbacks, protein drugs generally need to be administered parenterally.
However, frequent parenteral administration is normally required due to the often short half-
life of peptides and proteins. This results in poor patient compliance and high costs for the
health care system. To circumvent these issues strategies for half-life extension are
investigated. Looking at currently marketed products, the most common strategy is the
covalent conjugation of other molecules to the protein or peptide. This involves the
conjugation of polyethylene glycol (PEG), hydroxyethyl starch (HES), lipids or other proteins,
like human serum albumin (HSA), or parts of proteins [8] to extend the plasma half-life of the
therapeutic protein [9, 10].
Other strategies involve the sustained delivery via depot systems. Biodegradable polymers like
poly(D,L-lactic acid) (PLA) and poly(lactic-co-glycolic acid) (PLGA) as a basis for depot
formulations have been already successfully investigated for small molecular drugs and small
peptides. Due to their unique properties, larger molecular weight proteins behave quite
differently in such systems. Therefore, besides these polymers alternative materials like lipids
or hydrogels are under investigation [11].
1 Examples of depot-systems and PEGylation of proteins for half-Life extension
As already mentioned, most of the biologicals have to be administered via the parenteral
route to achieve the desired bioavailability and reproducibility regarding the dose. The most
common routes are intravenous, intramuscular and subcutaneous injections. Subcutaneous
injections require the minimal skills and are in general the most convenient way among the
three of them. In general, proteins are relatively fast cleared from the system by proteolytic
enzymes, rapid kidney clearance and their propensity to generate neutralizing antibodies [12].

3
Different approaches have been undertaken in order to increase the plasma half-life of
therapeutic proteins like the covalent attachment of polymers like PEG or HES (hydroxyethyl
starch), the fusion of the Fc subunit of immunoglobulin G (IgG) or the fusion of albumin to the
therapeutic protein. The increase of the molecular mass and the Fc receptor-mediated
recycling are currently focused when it comes to half-life extension for proteins.
IgG and albumin have a very long half-life of 2-4 weeks. The reason for this is a recycling
through the neonatal Fc receptor. Both proteins are taken up by cells through
micropinocytosis. The binding to the Fc receptor within the cell leads to a redirection to the
plasma membrane and prevents them from degradation in the endolysosomal compartment
[8]. By Fc engineering it is possible to increase the affinity of therapeutic proteins to the Fc
receptor. Marketed examples for this strategy are Avastin® (bevacizumab) and Erbitux®
(cetuximab). Fc-fusion proteins like the FDA approved Orencia® (abatercept) and Enbrel®
(etanercept) not only make use of the Fc receptor-mediated recycling, but also of the
increased molecular weight [8, 13].
The conjugation of albumin has been done in different ways. One option is the genetic fusion
of human albumin and the therapeutic protein. An example is the fusion of albumin and
interferon-α-2b (no FDA approval) for the hepatitis C treatment. Proteins can also be fused
either to the N-terminus or C-terminus of albumin [8, 13]. Non-covalent interaction with
albumin can be achieved by lipidation. Lipidation is the covalent binding of fatty acids to
peptide side chains. This results in an increased hydrodynamic radius and a decreased renal
filtration rate. Since the lipid part is relatively small, the effect is mediated indirectly through
the non-covalent binding of the lipid moiety to circulating albumin. Approved examples of
albumin conjugated biopharmaceutics are Levemir® (insulin detemir) and the long-acting
glucagon-like peptide-1 receptor agonist Victoza® (liraglutide) [8, 14].
Other strategies are the glycosylation and the conjugation of carbohydrates. It has been
shown that glycosylation for example of the N-terminus leads to an increased half-life. An
example is the 2001 approved Aranesp® (darbepoetin alfa) which is a hyperglycosilated form
of erythropoietin (EPO). With the two additional N-glycosilation sites the half-life was
prolonged three-fold. An example for the conjugation of carbohydrates is the attachment of
the approved plasma volume expander hydroxylethyl starch (HES) [8].
4
1.1 PEGylation
A method to change the physicochemical characteristics of a molecule is the formation of a
derivative. To modify proteins, the covalent attachment of the polymer polyethylene glycol
(PEG) is a well-established method to achieve this. PEG has been approved by the FDA in foods,
cosmetics and pharmaceuticals. It shows little toxicity, has a simple structure and is chemically
inert. The main elimination pathway for PEG molecules under 30 kDa is the kidney. Molecules
over 20 kDa are mostly eliminated from the body in the faeces [15].
The main goals of PEGylation are improved pharmacokinetic profiles respectively a plasma
half-life extension. By PEGylation it is also possible to reduce the immunogenicity, improve
the solubility of the protein and also improve protein stability [16].
In 1977, Davis and Abouchowski investigated the effect of PEG-protein conjugates on plasma
half-life and the effect on immunogenicity. They were able to show that after conjugation of
1.9 kDa methoxypolyethylene glycol to a glutaminase-asparaginase, the plasma residence
time was increased [17]. The reduction of the original immunogenicity was achieved by
attaching 5 kDa linear PEGs to bovine serum albumin and glutaminase-asparaginase [17, 18].
These observed effects can be explained by the fact that PEGylation masks the protein surface
and the approach of antibodies respectively antigen processing cells is reduced. Due to its
hydrophilic and neutral characteristics and its low opsonization rate, PEG is also known as a
“stealth” molecule to avoid phagocytosis. Since PEGylation also increases the molecular size
of the protein, the renal ultrafiltration and the degradation by proteolytic enzymes is reduced
[10, 19]. The larger the used PEG-chain, the more pronounced are these effects. Not only the
molecular weight, but also the shape of PEG used (for example linear or branched) will lead to
changed parameters with branched PEGs extending elimination half-life more than linear
PEGs [20].
A drawback of PEGylation is the decreased biological activity of PEG-conjugates compared to
the native form of the protein in vitro. This effect can be explained by the shielding effect of
the PEG which protects the protein from environmental influences and reduces interactions.
This effect increases with larger molecular weight of the polymer and with a more branched
structure of the polymer. Branched PEGs reduce the biological activity in vitro to a larger
5
extend than linear ones. Also the coupling position influences the loss of biological activity
[10].
A prediction regarding the therapeutic effect can hardly be derived from the in vitro results.
The reduced activity is caused by steric hindrance and not by a conformational change of the
protein. The often observed major improved pharmacokinetics in vivo are able to more than
compensating the loss of activity resulting an equal or even increased efficacy [12].
1.2 Current Market Overview
Davis and Abouchowski used a dichloro-triazine-activated PEG derivate as a coupling agent
that reacts through an alkylation to form a secondary amine. Even though the amino groups
of the proteins are the most reactive entities, the used PEG-derivate is also able to react with
hydroxyl groups of serine, tyrosine, threonine and the secondary amine of histidine to form a
hydrolytically unstable linkage. This kind of activated PEG belongs to the first generation of
PEG as a bioconjugation polymer. Further examples of first generation PEG reagents are
monomethoxy-PEG (mPEG) and mPEG-succinimidyl carbonate [21]. The use of the first
generation of PEGs was additionally hampered by the presence of diol contaminations which
lead to dimerized polymer molecules, lack of selectivity and alterations in protein charges. A
characteristic of marketed first generation PEG conjugates is the use of linear low molecular
weight PEGs [18, 19, 22]. By using improved analytics, better separation and purification
mechanisms (removal of the PEG-diol (HO-PEG-OH)) and different chemistries (for example
the conjugation of a PEG aldehyde through a Schiff base relatively selectively to the N-
terminus of a protein), the second generation of PEGs was able to improve these issues. The
new derivatives like mPEG-propionaldehyde were able to form more stable linkages and a
more selective PEGylation leading to an increased bioactivity [12]. Other examples for second
generation PEGs with different chemistry are PEG-maleimide and PEG-vinylsulfone
(thiolreactive PEGs). Furthermore, the restriction to low molecular weight PEGs could be
avoided. Table I-I gives an overview of currently marketed PEGylated biopharmaceuticals.
Most of the PEGylated proteins are produced by random PEGylation and are in general a
mixture of monoPEGylated position isomers [19].
6
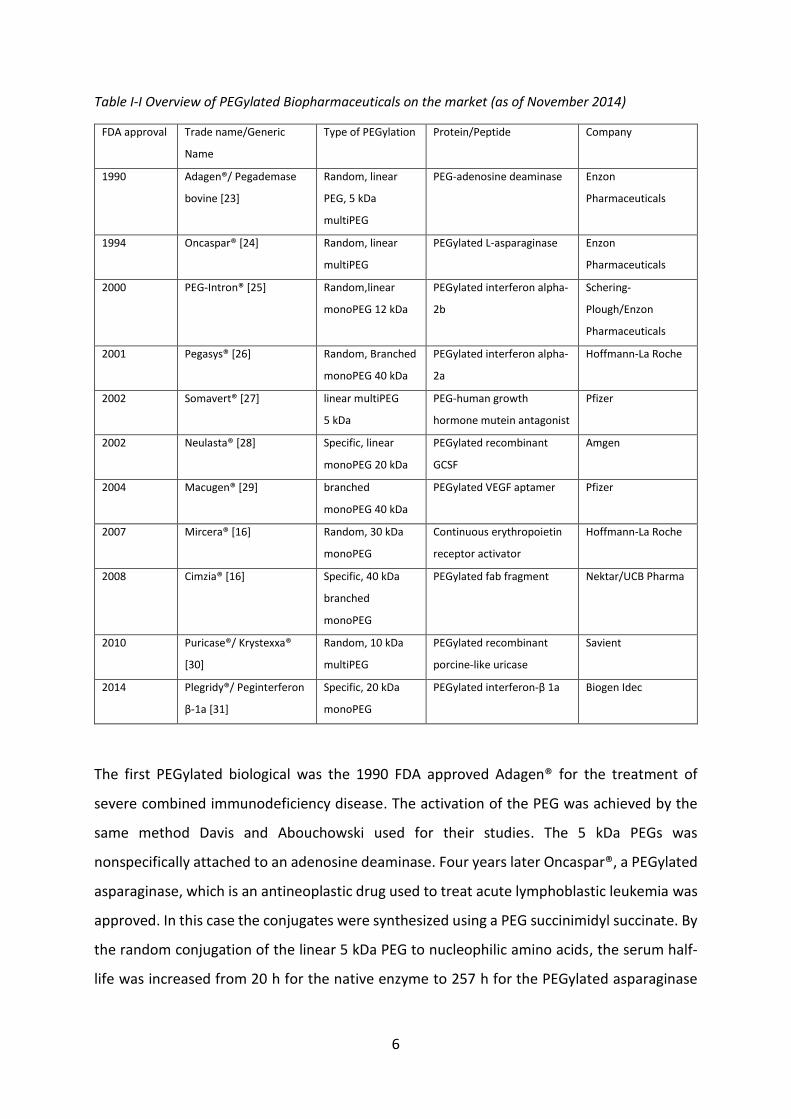
Table I-I Overview of PEGylated Biopharmaceuticals on the market (as of November 2014)
FDA approval Trade name/Generic
Name
Type of PEGylation Protein/Peptide Company
1990 Adagen®/ Pegademase
bovine [23]
Random, linear
PEG, 5 kDa
multiPEG
PEG-adenosine deaminase Enzon
Pharmaceuticals
1994 Oncaspar® [24] Random, linear
multiPEG
PEGylated L-asparaginase Enzon
Pharmaceuticals
2000 PEG-Intron® [25] Random,linear
monoPEG 12 kDa
PEGylated interferon alpha-
2b
Schering-
Plough/Enzon
Pharmaceuticals
2001 Pegasys® [26] Random, Branched
monoPEG 40 kDa
PEGylated interferon alpha-
2a
Hoffmann-La Roche
2002 Somavert® [27] linear multiPEG
5 kDa
PEG-human growth
hormone mutein antagonist
Pfizer
2002 Neulasta® [28] Specific, linear
monoPEG 20 kDa
PEGylated recombinant
GCSF
Amgen
2004 Macugen® [29] branched
monoPEG 40 kDa
PEGylated VEGF aptamer Pfizer
2007 Mircera® [16] Random, 30 kDa
monoPEG
Continuous erythropoietin
receptor activator
Hoffmann-La Roche
2008 Cimzia® [16] Specific, 40 kDa
branched
monoPEG
PEGylated fab fragment Nektar/UCB Pharma
2010 Puricase®/ Krystexxa®
[30]
Random, 10 kDa
multiPEG
PEGylated recombinant
porcine-like uricase
Savient
2014 Plegridy®/ Peginterferon
β-1a [31]
Specific, 20 kDa
monoPEG
PEGylated interferon-β 1a Biogen Idec
The first PEGylated biological was the 1990 FDA approved Adagen® for the treatment of
severe combined immunodeficiency disease. The activation of the PEG was achieved by the
same method Davis and Abouchowski used for their studies. The 5 kDa PEGs was
nonspecifically attached to an adenosine deaminase. Four years later Oncaspar®, a PEGylated
asparaginase, which is an antineoplastic drug used to treat acute lymphoblastic leukemia was
approved. In this case the conjugates were synthesized using a PEG succinimidyl succinate. By
the random conjugation of the linear 5 kDa PEG to nucleophilic amino acids, the serum half-
life was increased from 20 h for the native enzyme to 257 h for the PEGylated asparaginase
7
[15, 30]. Neulasta® (approved in 2002) is an example for a specific monoPEGylation of the N-
terminus of a granocyte colony-stimulating factor using second generation techniques [30].
While for Adagen® and Oncaspar® first generation techniques were used, all other PEGylated
pharmaceuticals use second generation PEGs. The main purpose for PEGylation of all
marketed product was the extension of the serum half-life [30, 32]. The 2012 approved
Omontys®, a PEGylated synthetic peptide which is a functional analog of erythropoietin was
voluntarily withdrawn from the market in 2013 by Affymax and Takeda when reports of
serious hypersensitivity reactions occurred [33].
Nonetheless, the success of PEGylated pharmaceuticals can be seen by the sales of PEGylated
blockbuster drugs. In 2013, PEGfilgrastim (Neulasta®) and PEGylated interferon alpha-2a
(Pegasys®) generated worldwide sales of more than one billion US$ (Neulasta®: 4.4 bn [1],
Pegasys® 1.2 bn [34]). A trend of increasing importance of PEGylated drugs is visible, since the
top four selling PEGylated pharmaceuticals (Neulasta®, PEGasys®, Cimzia® and Pegintron®)
generated larger sales in 2013 than all PEGylated products combined in 2010 [2, 19].
With the 2014 approved Mvantik® (PEGylated opiod antagonist) and 2011 approved
PEGylated doxorubicin containing liposomes (Doxil/Caelyx®, 2001) there are two more non-
protein PEGylated pharmaceuticals on the market [16].
1.3 Challenges of PEGylation: Immunogenicity
One of the challenges of PEGylation is the before mentioned decrease of biological activity
after conjugation of the PEG molecule. While this issue is overcompensated by the increased
biological half-life of the conjugate in comparison with the native protein [12], other
challenges occurred regarding an increased immunogenicity induced by PEG itself [35].
It has been shown that PEGylation is able to decrease the immunogenicity of proteins [10, 12,
18, 35] and in a 2003 published review the authors even claimed that PEG lacks
immunogenicity and anti-PEG-antibodies have only be seen under extreme experimental
conditions [15].
Nowadays, several publications have mentioned that the PEG moiety itself is responsible for
the induction of anti-PEG antibodies. The formation of anti-PEG antibodies can result in
negative clinical effects like the accelerated blood clearance or might even affect the safety of
8
protein drugs [35]. But not only can the immune response, triggered by the PEGylated
pharmaceuticals, cause this increase in antibodies. Some reports suggest also an increased
incidence of anti-PEG antibodies in normal donors. This can be explained by the increased
usage of PEG in numerous products in the food, cosmetic and pharmaceutical industry [36].
In 1984, Richter and Åkerblom found anti-PEG (IgM) antibodies in 0.2 % of healthy individuals
and in 3.3 % of untreated allergic patients [37]. In 2004, Garratty et al. reported significantly
higher values of 22-25 % [38, 39]. Even though both groups used comparable assays the results
can’t be compared directly due to the lack of reference sera and a lack of data on the validation
and specifications [35]. Moreover, in 2011, Liu et al. found PEG-specific antibodies in 15
human serum samples in a total population of 350 donors (4.3 %) using a double antigen
bridging enzyme linked immunosorbent assay (ELISA) [40].
Especially the accelerated blood clearance was observed by different research groups. It has
been shown that anti-PEG antibodies can shorten the survival of PEGylated red blood cells in
rabbits and pose a huge challenge for the potential “stealth” red blood cells in order to
produce universal group O donor red blood cells [38]. Armstrong et al. (2007) reported a rapid
clearance of PEG-asparaginase which was associated with the presence of anti-PEG antibodies
[41]. An accelerated blood clearance has been observed for PEGylated liposomes, as well [42].
In 2010, Tillmann et al. did not observe a changed response of PEG-IFN alpha 2a/2b when they
compared a group of 68 hepatitis C patients with an antibody prevalence of 44 % with groups
with an average prevalence of 7 %. They concluded that there is a high frequency of anti-PEG
antibodies in hepatitis C-infected patients and these anti-PEG antibodies do not lead to
impaired response to either of the PEG-IFNs [43].
Whether the observed PEG antibodies do have a clinical relevance and are responsible for
treatment failures or not, still needs to be investigated and current inconsistent results do not
allow a final conclusion. In addition to that, no validated assays for anti-PEG antibodies are
available and the nonspecific binding of IgG and IgM by PEGylated products also makes the
validation of the specificity of anti-PEG binding assay extremely difficult [35].
2 Depot formulations for delivery of biopharmaceuticals
Another way to decrease the injection intervals for biopharmaceuticals is the delivery of the
drug in a depot system. Depot systems provide the advantage that a system with a higher
9
loading of the drug releases the therapeutic agent over a period of time within a designated
region of the body [44]. Benefits are a decrease in the dosing frequency and therefore the
increase of patient compliance. Moreover, the effect of patient compliance has less effect on
the therapeutic results of the treatment. Other benefits are decreased adverse effects
through lower peak drug concentrations and an increased pharmacological activity. Apart
from therapeutic aspects, packing an existing drug into controlled release formulations
extends its patent life as a new product. In contrast to PEGylation, no chemical change of the
drug is necessary. Therefore, the development of a new drug release system is much cheaper
than the costs of a completely new or chemically changed drug [44-46].
With PEGylation and other alternatives the pharmacokinetic of proteins can be improved.
These improvements can’t even closely match long term depots which achieve release profiles
of several weeks, months or even years. Marketed examples for such long term depot is one
the first parenteral depot formulation called Norplant® (approved in Finland 1983). It is a
subcutaneous contraceptive implant with levonorgestrel made of silicone rubber (crosslinked
polydimethylsiloxane) through which levonorgestrel diffuses and provides birth control over
five years [45, 47]. Implanon®, which was first approved for use in Indonesia in 1998, is a
single-rod, progestogen-only implant based on a polyethylene-vinyl acetate as a rate-
controlling membrane. It can be used for up to three years [48]. Both implants have the
disadvantage that after a certain time the implant has to be removed surgically. To overcome
these drawbacks and to also increase the comfort regarding the application, different
materials have been investigated which provide for example biodegradability. Besides
biodegradability other desired biological properties of controlled-release drug delivery
systems are the absence of cytotoxicity and immunogenicity. Furthermore, also the physical
properties like mechanical strength and a suitable viscosity/elasticity for application are very
important [49]. While the first parenteral depot systems belong the class of implants, there
are different other technologies under investigation to deliver molecules to our system in a
controlled way like liposomes, micro-/nanoparticles, oily solutions and suspensions [44].
Especially when depot formulations for proteins and peptides were investigated not only the
release rate or the biocompatibility of the material was in the focus but also the stability of
the therapeutic agent itself within the depot formulation and during release. Proteins pose
unique challenges that are not so common when working with small molecules [50]. During
10
the manufacturing, storage and delivery process proteins are able to undergo different
physical and chemical changes which often will lead to disadvantages like decreased efficacy
or increased immunogenicity [51]. In the following some information about the most
frequently used biodegradable carrier material poly(lactide-co-glycolide) (PLGA) is given and
newer alternative approaches like the use of lipids in combination with proteins and peptides
are presented.
2.1 Poly(lactide-co-glycolide)
An important representative of biodegradable polymers is PLGA. PLGA is a synthetic
copolymer consisting of monomers of lactic acid and glycolic acid which hydrolyses to glycolic
and lactic acid by an acid- or a base-catalyzed reaction. These non-toxic by-products, which
occur during degradation, are further eliminated by the normal metabolic pathways [52]. Even
though a good biocompatibility has been confirmed, unwanted side-effects especially during
injection or implantation can cause inflammation, granulation or foreign body reaction [53].
PLGA was first patented as a surgical suture in 1967 and six years later as a biodegradable drug
delivery system for sustained release [45]. Decapeptyl® was the first PLGA system which was
approved in Europe in 1986. It is an injectable and degradable micro particle based depot
containing triptorelin (gonadotropin-releasing hormone) against non-metastatic prostate
cancer [45]. Meanwhile PLGA based systems have been extensively studied as delivery
vehicles for drugs, proteins, DNA, RNA and peptides [52, 54, 55]. Its physical strength and high
biocompatibility advantages made PLGA most popular biodegradable polymer. PLGA based
formulations have been widely used in marketed products. Currently those polymer systems
are used for small molecules like risperidone (Risperdal®, Consta®), dexamethasone
(Ozurdex®) or naltrexone (Vivitrol®) but also for peptides like goserelin (Zoladex®), octreotide
(Sandostatin®) or leuprorelin (Eligard®/Enantone®) [44, 56].
2.1.1 PLGA as a material for drug delivery system for biologicals
Currently marketed products only comprise peptides and small molecules. No protein depot
system is currently on the market. The only PLGA based depot formulation comprising a
protein was Nutropin Depot® by Genentec which was approved in 1998 but withdrawn in 2004
[57]. Several studies have investigated the suitability of PLGA for protein and peptide delivery.
Some examples for the most common systems are given in the next paragraphs.
11
2.1.1.1 Microparticles/Nanoparticles
The capability of PLGA particles as a drug delivery system has been widely investigated.
Regarding protein and peptide delivery, PLGA microparticles are the most studied drug
delivery systems. Different proteins have been investigated like BSA, lysozyme, interferon
alpha, insulin and many more [58]. Mundargi et al. (2008) presents a great overview of
research and developmental activities in this area outlining the chances and challenges of
PLGA and PLGA-based nano/microparticles [59].
Gu et al. prepared recombinant human nerve growth factor (rhNGF)/BSA loaded microspheres
(17 µm) which were produced by a water/oil/water emulsion and solvent evaporation
technique. The particles released the protein over four weeks and rhNGF was still biologically
active [60].
Besides PLGA microparticles, also nanoparticles are investigated protein and peptide delivery.
Sánchez et al. (2003) investigated biodegradable PLGA micro- and nanoparticles as long-term
delivery vehicles for interferon alpha. Even after 30 days they were able to detect the
interferon in an in vitro experiment using an ELISA technique [61]. Insulin has also been in the
focus. By the encapsulation of insulin in PLGA nanoparticles the integrity of insulin during
formulation and delivery was maintained and the release of insulin was peakless and without
fluctuations over 72h [62].
PLGA based delivery systems for peptides have already been approved. Most of the
formulations are microparticles. In 1998, Nutropin Depot® was approved as the first PLGA
depot system containing a protein. The injectable suspension contained micronized particles
of recombinant human growth hormone (somatropin, 22 kDa) embedded in biodegradable
microspheres. The sustained release was achieved by the slow degradation of the matrix
maintaining therapeutic concentrations for up to four weeks. For comparison, a subcutaneous
somatropin injection provided therapeutic relevant concentrations for 20 h. In 2004, the
product was withdrawn from the market due to high cost and manufacturing challenges [56,
57]. Currently, there are only microparticle based PLGA systems for peptides on the market
like octreotid (Sandostatin®), octreotide (Sandostatin®) or leuprorelin (Enantone®) [44].
2.1.1.2 Implants
Implants are dosage forms that are subcutaneously applied by using surgery or a hypodermic
needle. They are designed to release drugs over an extended period of time. Approved PLGA
12
based implants comprising peptides are Zoladex® and Profact®. Implants can be prepared by
different methods. The most common are extrusion techniques like hot melt extrusion, or
screw/ram extrusion. But also solvent-casting or compression molding are suitable methods
[52, 63, 64].
Zoladex® is indicated for the treatment of prostate carcinoma and was approved 1989 by the
FDA. It contains 3.6 mg of the decapeptide goserelin (a gonadotrophine-releasing hormone
agonist) per implant with a length of 12 mm and a diameter of 1 mm (matrix material:
lactide−glycolide copolymer). It is applied with a siliconized hypodermic needle every four
weeks [44, 65].
Profact depot® contains the gonadotropin-releasing hormone agonist buserelin. It is marketed
by Aventis for prostate cancer treatment. Eligard® contains leuprorelin which is formulated in
PLGA and N-methyl-2-pyrrolidon as an in-situ forming implant against prostate cancer [54].
2.1.2 Disadvantages of PLGA based systems regarding proteins and peptides
While PLGA has been successfully used as a drug delivery system for small molecules and
peptides there is no PLGA based depot formulation for proteins currently on the market. To
prepare PLGA microparticles, in general three steps have to be taken. The protein loading, the
microparticle formation and the drying. All these steps involve a number of potential
denaturation stresses for the proteins [52, 66]. During the protein loading step, usually
organic solvent to dissolve the polymer is used. Also the contact with the polymer itself can
have a negative influence on protein stability. While loading, using an emulsion technique,
proteins are exposed to large shear and cavitation stress during emulsification. The created
water/organic solvent interfaces are important disadvantages of this method and are the
reason for protein denaturation and aggregation. Also during the particle formation step,
these interfaces are present and the stirring results in shear forces. This step has less negative
influence on protein stability in comparison with the loading step. In addition to that,
removing the hydrating water shell during drying results in another stress for the protein [52,
54, 66].
Proteins do not only face challenging conditions during preparation of PLGA particles but also
during release from these matrix systems. The biodegradability of PLGA is due to degradation
of the polymers by hydrolysis of the ester bonds. This results in the formation of low molecular
13
weight degradation products like glycolic and lactic acid [66, 67]. Degradation products are
trapped within the matrices and the entrapped proteins are facing to a completely altered
microenvironment. This leads to a decrease of the pH value, the increase of osmotic pressure
and the accumulation of reactive species. Especially for labile molecules like proteins, which
stability depends, amongst other, on the mentioned parameters might be negatively
influenced [66]. Apart from protein stability, an incomplete protein release from PLGA systems
was also observed [68, 69]. Interactions between the protein and the matrix material have
been identified as a reason for this observation. These interactions are often adsorption
phenomena due to hydrophobic but also electrostatic interactions [54, 55, 66, 67].
2.2 Lipids
To overcome the issues with PLGA as a matrix material, other suitable materials as a drug
delivery system were investigated. Therefore, lipids came into focus. Lipids are a group of
naturally occurring hydrophobic or amphiphilic molecules. They can be classified into 8
different categories [70]: fatty acyls, glycerolipids, glycerophospholipids, sphingolipids, sterol
lipids, prenol lipids, saccharolipids, and polyketides. Lipids are molecules which are not
defined by their chemical structures but by their hydrophobic nature. All of them are barely
soluble in water but provide solubility in non-polar solvents. As natural substances lipids
provide good biocompatibility [71, 72] and have widely been investigated as drug delivery
systems [73-77].
During degradation, no acidic degradation products are formed which do not lead to a
significant pH drop or changes in osmotic pressure that might have detrimental effects on
protein stability [78]. This poses an advantage over polymeric systems especially when it
comes to labile molecules like proteins. Lipids also can provide certain advantages regarding
their release profile. In contrast to PLGA systems which have often a multi-phase release
profile (initial burst, lag phase, second burst), lipids usually provide higuchi/zero order kinetics
without a significant burst release [74, 79, 80].
The following chapters give an overview of triglyceride-based systems and will introduce the
phospholipid based system vesicular phospholipid gels (VPGs) and will discuss advantages and
challenges of these systems.
14
2.2.1 Drug delivery systems based on triglycerides
2.2.1.1 Microparticles/Nanoparticles
Nanoparticles and microspheres form a wide class of delivery systems mainly studied for
parenteral administration. While solid lipid microparticles (SLM) are particles with a size in the
range of 1 μm to 1000 μm, solid lipid nanoparticles (SLN) range between 10-1000 nm.
Commonly used materials for lipid microparticles are fatty alcohols, fatty acid esters, waxes
and cholesterols, etc. They can be prepared by a solvent evaporation method which is similar
to the preparation of polymer microparticles (including the mentioned disadvantages
regarding protein stability). Lipids are dissolved in an organic solvent and emulsified in an
aqueous (drug containing) phase. By evaporating the organic solvent, solid drug microparticles
are obtained. Other methods to prepare solid lipid particles are e.g. spray drying, spray cooling
(“prilling”) or coazervation [81].
Several studies have already shown the suitability of SLMs for proteins and peptides like
insulin, thymocartin or somatostatin [72, 82]. Also the release over 30 days in-vivo of
gonadotropin release hormone antagonist loaded in lipid microparticles made of glycerol
monobehenate and glycerol monostearate was successfully demonstrated [83].
Solid lipid nanoparticles (SLN) have been investigated as drug delivery devices since the
beginning of the 1990s. They can be prepared by different methods like high pressure
homogenization [84], hot homogenization techniques [85], solvent emulsification techniques
or super critical fluid based techniques [86].
Several studies that investigate the suitability of SLN for peptide and protein delivery have
been published. A nice overview of therapeutically relevant peptides (e.g. calcitonin,
cyclosporine A, insulin, LHRH, somatostatin) or model proteins (BSA and lysozyme) is given in
the review by Almeida et al. [86]. More currently, Li et al. encapsulated recombinant IFN-alpha
into solid lipid nanoparticles by double emulsion solvent evaporation (w/o/w) method. The
protein was released over a 16-day period [87].
2.2.1.2 Implants
Due to their high compressibility, lipophilic materials like cholesterol, fatty acids, glycerides
and waxes can be formed to solid matrices by traditional compression or extrusion at mild
conditions. The preparation of implants via extrusion has advantages compared to the already
15
mentioned methods. It lacks high temperatures or organic solvents that might compromise
protein integrity. Extrusion is also a potentially faster and more easily up-scalable production
procedure. An extruder consists at least of two main components: a transport system and a
die system which forms the material [88].
Common techniques are ram extrusion and screw extrusion. Ram extrusion is a method in
which the extruder consists of a barrel, which is pre-filled with the powder mixture, with a die
at the bottom. The barrel can be heated and cooled. By using of a piston (or ram) the material
is forced through the die at the bottom of the barrel. It is a non-continuous procedure for
which only small amounts of substance are necessary [89, 90].
When using screw extrusion, the material is transported within a stationary cylindrical barrel
with one or two rotating screws. Eventually, the lipid blend is extruded through a die at the
end of this barrel. Basically, the extrusion channel of a screw extruder can be divided into
three distinct zones: In the feed zone, the lipid blend is loaded into the extruder. In the
transition or melting zone the material is compressed and finally in the metering zone, where
the homogeneous lipid melt arrives suitable for extrusion. Single- or twin-screw extruders are
the predominantly used extruders in the industrial manufacturing of implants because of the
high extrusion rates [88].
Mohl et al. developed a tristearin-based implant system for the sustained release of interferon
α-2a (IFN-α-2a) over one month up to 90 % in its monomeric form. IFN-α-2a, which was co-
lyophilisate with hydroxypropyl-β-cyclodextrin (HP-β-CD), provided long-term stability in
these formulations. While not more than 83 % of the incorporated protein could be liberated
from tristearin implants manufactured with IFN-α-2a and trehalose as pore forming agent, a
95 % release of the initially incorporated IFN-α-2a could be liberated continuously using PEG
6000 as an excipient. Mohl further investigated the role of PEG on the protein release from
implants. The addition of PEG 6000, which is a nontoxic, hydrophilic excipient approved for
parenteral application, gave the option to control the protein liberation from the implants. In
addition to the more complete release, the burst release was reduced [91].
Herrmann et al. further investigated the influence of the excipient PEG and different
diameters on the release mechanic for different molecules. It was shown that PEG is not only
a porogen. It is able to influences the release kinetic of IFN-α-2a by a reversible precipitation
during release in PEG-containing matrices. It was shown that protein stability was not
16
influenced [92]. The temporarily decreased protein solubility and the consequential
precipitation can be explained by the volume exclusion effect. PEG chains occupy the solvent
space and by sterical hindrance proteins are excluded from the solvent. So the protein is
concentrated until it is “desalted” and precipitates/crystallizes. Proteins with a larger
molecular weight seem to precipitate at lower concentrations [92-94].
Schwab et al. investigated the in vivo release properties of these implants in rabbits to
establish an in vivo–in vitro correlation. After 28 days of incubation, apart from the implant
being surrounded by fibrous tissue, no major adverse effects were observed. Serum samples
showed high IFN-α-2a contents on an almost constant level over nine days after the insertion
of the implant. Furthermore, during the first nine days, protein release in vivo is in well
accordance with the data gained by in vitro experiments. However, protein levels abruptly
wear off from day ten on. This phenomenon is most likely attributed to the antibodies
generated in rabbits against human recombinant IFN-α-2a [95].
Drug release mechanism from lipid implants are complex and depend on various factors [96]:
type and amount of lipid
type and amount of incorporated drug
drug distribution within the implant
type and amount of potential additional excipients
mechanical properties of the release system
process conditions applied during the manufacturing process
A protein molecule has to traverse through several pores of the implant. It is necessary that
the pores are directly connected to each other, forming an intact channel network. In many
cases it can be described by Ficks second low of diffusion. Pure triglyceride implants neither
show an obvious water uptake nor do they show erosion [97]. To improve extrusion properties
of the lipid blend and make extrusion possible at lower temperatures, Herrmann et al. mixed
lipids with a high melting point (72 °C) with lipids with a melting range of around 37 °C [90].
Sax et al. were able to show that proteins are released basically by two mechanisms. The first
is the diffusion via water filled pores, the second is the diffusion through molten lipid [80]. By
using lipids with a high melting point and a low melting point as matrix materials, he achieved
a release of IgG over 150 days without a lag phase or burst release. IFN-α-2a was released over
17
60 days. The differences were explained by varying molecular weight of the drugs and
therefore the difference in diffusion speed [88].
2.2.2 Drug delivery systems based on phospholipids – vesicular phospholipid gels
2.2.2.1 Vesicular phospholipid gels
Vesicular phospholipid gels (VPGs) are highly concentrated, semisolid, aqueous phospholipid
dispersions where the liposomes form a three-dimensional network. They are generated by a
“forced hydration” of phospholipids in the presence of relatively low amounts of water. The
gels normally consist of 300 mg/g-600 mg/g lipids which is also the reason for their high
viscosity. The gel-like consistency is formed by numerous densely packed vesicles. This is in
contrast to other hydrogels where the gel like rheological behavior is caused by
macromolecular thickeners. The aqueous compartments are both within the cores of the
vesicles and in-between them and the amount of water of each compartment reaches about
the same magnitude [98, 99].
Compared to liposomal formulations, an advantage of VPGs is the higher encapsulation
efficiency for hydrophilic compounds. Even the fraction of drug which is not liposomally
encapsulated during the preparation process, is localized in-between the vesicles of the
phospholipid matrix and thereby is retained in the gel. Even if a leakage of the phospholipid
membrane occurs, a burst effect will not appear, since the drug stays in the gel matrix. This is
also the reason for better retention of the incorporated drug compared to liposomes [99].
VPGs can be prepared by high pressure homogenization (HPH) or a dual asymmetric centrifuge
(DAC). HPH is used for preparing VPGs of small and unique vesicle sizes. The raw lipid
dispersion which consists of a mixture of dry lipids and water is processed with a high-pressure
homogenizer. To obtain finely dispersed gels a pressure of 70 MPa with ten processing cycles
is necessary. The size distribution of the liposomes depends on different factors like the
applied pressure, the number of homogenization cycles or the lipid content [98].
DAC is known since the 1970s as a convenient technology for the rapid mixing of viscous
components. The preparation of VPGs with dual asymmetric centrifugation was first
introduced by Massing et al. [98, 100] who used a blend of hydrogenated phosphatidylcholine
(PC) and cholesterol (55:45 mole/mole). The working principle of this special centrifugation
technique is that the sample is not only rotated around a central axis at a defined speed but

18
also around a second axis in the center of the sample container. This results in two overlaying
movements of the sample material in the centrifugation vial. The centrifugal forces caused by
the main rotation pushes the sample material in an outward direction. Since the vial holder
rotates in the opposite direction with approximately one fourth of the speed of the main
rotation, the sample is pushed in the opposite direction due to the adhesion between the
sample material and the rotating vial. The rotation of the sample container around its own
axis causes an inward transport of the sample material, which is effective, if the adhesion of
the sample material on the vial material and the viscosity of the sample are high enough. The
combination of these contra rotating movements results in shear forces and thus in efficient
homogenization [98, 99].
Compared to high pressure homogenization, DAC is a fast and straight forward method which
is also suitable for small scale production like lab scale studies. In addition to that, aseptic
production is easily achieved, by using a hermetically sealed sample vial. The content of
lysophophatidylcholine generated in the sterile process conditions of DAC was lower
compared with the process of HPH plus autoclaving [99, 100]. Steam sterilization is also
considered as applicable for VPGs, since they maintain their vesicular structure. Only a small
increase of the vesicle size was observed [99]. Due to much lower shear forces in comparison
with HPH, the DAC method is more suitable for the work with labile compounds like proteins.
Massing et al. also showed that the trapping efficiency using DAC as a preparation method is
higher than using HPH (56.0 ± 3.3 % DAC vs. 36.0 ± 3.2 % HPH) [98-100].
VPGs can be diluted to conventional liposomes and then used for example for parenteral
application. Examples for liposomes based on VPG having been effectively used via
intravenous administration in animal experiments are the liposomal nucleoside analog
gemcitabine [101] and the liposomal vinca alkaloid vincristine [102]. Besides, the use as an
intermediate for preparing conventional small unilamellar vesicles (SUV) dispersions, VPGs
can be also used as a depot for sustained release of drugs and for absorbability screening [99].
Grohganz et al. prepared VPGs with the decapeptide cetrorelix (LH-RH antagonist) by HPH and
tested their suitability as an implantable sustained release system, in vitro. The VPGs
contained 300–500 mg/g egg PC (Lipoid E80) and 0.5–10 mg/g cetrorelix acetate. The release
of the peptide was influenced by the lipid and drug content. The release range was from less
than 24h (0.5 cetrorelix CXA; 400 mg/g E80) to up to six weeks with a formulation containing
19
8.6 mg/g cetrorelix and 280 mg/g E80. The main release mechanism was the erosion of the
phospholipid matrix following zero order or first order kinetics (depending on the composition
of the VPGs) [99, 103].
Tian investigated the release of the three proteins EPO, G-CSF and a monoclonal antibody
(mAb) from VPGs which were loaded into the VPG matrix by DAC. For the in vitro release tests
a flow-through cell with the design described by Tardi [104] was used. For EPO, a sustained
release was observed for 280 to over 400 hours with a close to zero order kinetic without
initial burst. The increase of the lipid content from 300 to 500 mg/g resulted in delayed
release. The release profile could be influenced by the lipid charge. Incorporating 20 % of
positively charged lipids (DOTAP) into VPGs resulted in a strongly accelerated release rate
while adding 10 % of negatively charged lipids (DPPA) delivered the incorporated protein in a
comparable manner to the uncharged formulation. Matrix erosion was found to be the
dominant mechanism controlling the EPO release [105, 106].
A similar result was shown for G-CSF. About 63 % of the total entrapped G-CSF was delivered
from the VPGs containing 400 mg/g lipids and 4.0 mg/g G-CSF over 408 h (17 days). In contrast
to the EPO release studies, a rather incomplete release was observed which was more
pronounced at higher protein concentrations. This observation was explained by the presence
of protein-lipid interactions [105]. The release of the mAb from VPGs was only little influenced
by the protein and lipid content. Sustained release of mAb was observed over 1000 h (42 days)
following zero-order kinetics. Again, erosion was the dominating mechanism controlling the
protein release from VPGs [105].
2.2.3 Biodegradation of lipid systems
Biodegradation and biocompatibility have been shown for phospholipid systems in different
studies and reviews [107-110]. When it comes to triglycerides, not all lipids in all formulations
do degrade in vivo respectively in a reasonable timeframe. The rate of erosion depends on the
lipid material, the size of the lipid formulation and the amount of lipases. Several publications
showed the degradation of SLN [73, 111]. The slowest degradation rate was observed using
lipids with longer fatty acid chains by Müller et al.. Glycerolbehenate (C22 fatty acid) SLNs
were degraded slower than cetylpalmitate particles (C16 fatty acid) and the fastest
degradation has been seen for Dynasan 114 (C14 fatty acid) [84]. Olbrich et al. were able to
influence the enzymatic degradation of Dynasan 114 SLN by lipase. Degradation depends on
20
the size of the particles and could be slowed down using Poloxamer 407 [85]. While it has
been shown that glyceryl trimyristate (Dynasan 114) SLN matrices are able to erode,
Vogelhuber et al. demonstrated that compressed matrix cylinders with 2 mm diameter did
not show any signs of matrix erosion in vivo [112].
Schwab also examined the lipase induced degradation of lipid based microparticles and
compressed implants. Implants show very slow degradation kinetics most probably due to the
small surface area. He stated that a complete degradation of the implants is very unlikely [78].
In contrast to these findings, Sax et al. were able to demonstrate that triglyceride matrices
based on a certain mixture of Dynasan 118 and a mixture of lauric, myristic and palmitic acid
prepared by twin-screw extrusion are biodegradable in vivo in the presence of endogen
lipases. The biodegradation process is independent from the release rate and after six months
an erosion of 75 % was detected in rabbits [113].
2.2.4 Challenges using lipid based depot systems
Lipids provide certain advantages in comparison with PLGA but also pose different challenges.
While the biocompatibility for triglycerides, phospholipids and cholesterol is generally good
[71, 72], fatty acids have been reported to lead to inflammation [78]. Besides the
biocompatibility of the system, also the stability of the incorporated protein is an issue in lipid
based systems. Even though lipids avoid huge changes of the micro environment during
degradation and release in comparison to PLGA systems (Chapter I .2.1.2), drug-lipid
interactions can result in decreased drug activity and/or adsorption effects.
Even though the manufacturing processes for lipid based systems are rather gentle, potential
stability issues might also occur during this step. The applied pressure during implant
compression or extrusion is also a possible factor for protein denaturation and aggregation
[51]. Nonetheless, during the extrusion process, a stabilization against pressure induced
denaturation can be expected. Since the protein is dispersed as solid (protein lyophilisate) in
the matrix material. It has been reported that pressure induced unfolding of proteins
decreases with the water content of the system [114].
Also changes regarding the structure of the lipid itself, like appearance of different
modifications (polymorphism) or chemical changes like the hydrolysis of phospholipids have
to be considered.

21
2.2.4.1 Protein-lipid interactions and protein stability
Interaction with triglycerides have been reported in literature as a reason for protein loss or
protein degradation [72, 115, 116]. Maschke et al. reported a rise of degradation products of
insulin to 7.5 % after being incorporated in the glycerol tripalmitate microspheres for 28 days
during the release test [116]. Reithmeier et al. prepared insulin loaded particles with a melt
dispersion technique. While no aggregation was detected directly after preparation of the
particles, Reithmeier et al. observed the formation of insulin aggregates after incubating the
SLMs for 13 days in phosphate-buffered saline (PBS) at 22 °C. Also protein adsorption to the
lipid occurred. This was determined as the reason for the incomplete release of insulin [72].
Adsorption of different blood proteins to emulsified triglycerides and the ability of proteins to
interact with triglycerides have also been shown [117]. Different excipients like
hydroxypropyl-β-cyclodextrin (HP-β-CD) seem to be beneficial regarding protein stability.
Mohl et al. investigated an implant system for IFN-α-2a delivery which compromised the
protein which was co-lyophilized with HP-β-CD. HP-β-CD improved the integrity of released
IFN-α-2a and of IFN-α-2a trapped within the matrix over one month [91]. Without the addition
of HP-β-CD an increase in aggregates and oxidized IFN-α-2a species from the 10th day on
during the release of extrudates which were stored for three and six months was observed
[79].
Interactions with triglycerides do not necessarily result in negative effects. Interactions have
also resulted in a more active state of lysozyme after adsorption to solid lipid nanoparticles
[86]. This increase of activity was explained by the principle of interfacial activation which has
been reported for example for lipase after the immobilization on hydrophobic surfaces [118].
Adsorption of proteins to fatty acids or triglycerides have been especially investigated in food
science since proteins (for instance lactoglobulin) contribute to emulsion formation and
stability in most food products [119]. Adsorption of BSA [120], HSA [121] or calcitonin [122]
to solid lipid nanoparticles have been used as a loading technique.
Interactions with phospholipids have been intensively studied for membrane proteins. These
protein-lipid interactions play an important role in a wide variety of cellular processes like the
functioning of natural membranes [123, 124], membrane transport [125] or signal
transduction [126, 127]. It has been shown, however, that proteins without a membrane-
spanning region are also able to interact with membranes [128] which makes these
22
interactions relevant for therapeutic protein, peptide drugs and drug delivery from
phospholipid systems. The interactions of several therapeutic relevant proteins and peptides
with phospholipids have been reported [128-134]. The observed interaction did lead to
positive effects like increased encapsulation efficiency of acetyl choline esterase [132] or
interleukin-2 [133]. Interactions with phospholipid have been shown to stabilize a protein
even under high temperature conditions. An example is recombinant G-CSF after membrane
insertion [128]. Also the stabilization during aerosolization of IFN-γ was shown, indicating a
greater stabilizing effect correlating with the strength of interaction [134]. Apart from these
positive aspects interactions can also have a negative influence on proteins like a decreased
loading efficiency in the case of insulin [130] or the aggregation of vesicles in the case of IFN-
γ [129]. The interaction of phospholipid carriers with serum proteins did lead to a change of
liposome stability, as well, and has been an issue in several studies [135-137].
2.2.4.2 Challenges regarding the structure of the lipids
Besides changes of the drug itself, also the depot system is able to undergo certain changes.
Polymorphism is the characteristic of a substance to appear in different
modifications/crystalline forms. Almost all fats and fatty acids possess the ability to form
different polymorphs. The three basic polymorphs are the α-modification, the intermediate
β’-modification and the β-modification. α, β’ and β modifications relate to the characteristic
packings of the hydrocarbon chains of the triglyceride molecules and differ in the melting
point. If a manufacturing process includes a melting or dissolution steps, a polymorphic
transformation might appear during the preparation of controlled release systems based on
lipid materials. Furthermore, polymorphic transformations can also occur during storage or
incubation/release. Therefore polymorphism has to be considered since rearrangement might
influence the release behavior and can change the appearance of the lipid formulation [82,
138].
The hydrolysis of phospholipids is one of the most determining factors for the long term
stability of liposome dispersions. They can be hydrolyzed to lyso-phospholipid with 2-
lysophospholipids as the main initial hydrolysis products. These lyso-phospholipids can be
further hydrolyzed. Phosphatidylcholine has a pH-stability optimum concerning hydrolysis at
pH 6.5. The rate of hydrolysis of phosphatidylcholine increases linearly found when moving
the pH in more acid/basic regions. Furthermore, there was a linear relationship between the
23
buffer concentration and the observed rate [139]. Zhang et al. suggested based on the
Arrhenius equation, that egg PC liposomes should be formulated in a buffer with pH equal to
or greater than 4.2 in order to have a shelf-life longer than one year at 5 °C [140].
3 Background knowledge on interferons especially interferon-β-1b
An important group the cytokines are the interferons. Interferons (IFN) are a family of
naturally occurring glycoproteins that are produced by eukaryotic cells in response to viral
infection and other biological inducers. Interferons have antiviral, antiproliferative and
immunomodulating properties. They were first described as a product of influenza virus-
infected chick embryo cells, capable of inducing resistance to infection with homologous or
heterologous viruses by Isaacs and Lindenmann in 1957 [141, 142].
At least three types of human interferons, α, β and γ have been distinguished based on a
number of factors, including anti-viral and antiproliferative activities. Interferons are divided
into two families: type I interferons and type II interferons [142].
Interferons of the type I IFN family (IFN-αβ-family) are pleiotropic cytokines that regulate
many different cellular functions. This group includes numerous subtypes, of which IFN-α and
IFN-β are predominant. Other members are IFN-ω, IFN-τ, IFN-δ, IFN-κ, and IFN-ε. Whereas the
IFN-α group is encoded by 13 genes, there is only one gene for IFN-β. All type I IFNs are
genetically and structurally very similar. The genetic code lacks introns and is located on the
short arm of chromosome 9. Furthermore, they interact with the same receptor subunits.
However, different type I IFNs are able to stimulate different antiviral, antiproliferative and
immunoregulatory responses. The type II IFN family (or the IFN-γ-family) is a single member
family with IFN-γ as the sole member [142, 143].
3.1 Interferon-β
IFN-β is mainly produced in fibroblasts. Naturally IFN-β is a 166 amino acid glycoprotein. To
produce this protein, two different strategies have been used to generate recombinant IFN-β
therapeutics. One approach is the production in mammalian cells (IFN-β-1a), another one is
the expression in Escherichia coli (E. coli) bacteria (IFN-β-1b), which has the lower production
costs [144, 145]. Both, IFN-β-1a and IFN-β-1b have products on the market.
24
3.2 Interferon-β-1a
IFN-β-1a (AVONEX®, Rebif®) is used in multiple sclerosis (MS) therapy and is the glycosylated
form of IFN-β. It is expressed in Chinese hamster ovary cells into which the human interferon-
β gene has been introduced. It is structurally identical to natural IFN-β in its primary sequence
and carbohydrate content with a molecular weight of approximately 22500 Dalton [146].
AVONEX® was approved in the US in 1996 and in Europe in 1997. It is produced by the Biogen
Idec Biotechnology Company. It is sold in two formulations. A solid form which comprises a
lyophilized powder in a glass vial and a liquid formulation delivered in a ready-to-use prefilled
syringe or a single-use autoinjector [145]. The lyophilisate is formulated for intramuscular
injection after reconstitution with supplied sterile water once a week. Each 1 ml of
reconstituted AVONEX® contains 30 mg of Interferon-β-1a, 15 mg HSA, 5.8 mg sodium
chloride, 5.7 mg dibasic sodium phosphate and 1.2 mg monobasic sodium phosphate, at a pH
of about 7.3. The liquid formulation is HSA-free containing 30 µg protein in acetate buffer
(11.6 mM, pH 4.8) + 150 mM arginine + 0.005 % polysorbate 20 [146-148].
Rebif®, which is co-marketed by Merck Serono and Pfizer in the US, is another IFN-β-1a drug
on the market used in multiple sclerosis therapy. Rebif® is administered subcutaneously three
times a week and was approved in Europe in 1998 and in the US in 2002 [146].
In 2014, a PEGylated IFN-β-1a (Plegridy®) from BIOGEN IDEC was approved for the treatment
of multiple sclerosis. 20 kDa methoxy-PEG-O-2-methylpropionaldehyde was attached to the
α-amino group of the N-terminus. In comparison to the native interferon-β-1a the half-life of
PEGylated interferon-β-1a is two-fold longer and the in vitro biological activity was retained
at approximately 50 % after PEGylation in an antiviral and antiproliferative assay. The
suggested dose intervals are every 2-4 weeks. Solutions of 63 µg and a 94 µg PEGylated IFN-
β-1a in 0.5 ml doses have been approved containing sodium acetate, arginine, polysorbate 20
and sodium chloride in their formulations [149, 150].
3.3 Interferon-β-1b
Interferon-β-1b (Betaferon®, Betaseron®) was the very first beta interferon product to reach
the market, as well as the first for the treatment of MS. Betaferon® was developed by Schering
AG, and was approved in 1993 and became the first therapy proven to be effective in reducing
25
the frequency of clinical exacerbations, the disease severity and improving the course of
relapsing-remitting MS [151]. Today it is marketed by Bayer Pharma AG.
IFN-β-1b is a nonglycoslylated protein expressed in E. coli. Beside this difference to the natural
Interferon-β, it lacks the N-terminal methionine and has a Cys-17-Ser substitution. It has 165
AS and a molecular weight of about 18500 Dalton [152].
Betaferon® is a lyophilized powder containing 0.3 mg Interferon-β-1b and each 15 mg HSA and
mannitol as stabilizers. Before use, it has to be reconstituted with 1.2 ml of the supplied 0.54 %
NaCl solution. Betaferon® is injected subcutaneously every other day and dosage is increased
over a period of six weeks until a final dosage of 0.25 mg Betaferon is reached (1 ml of the
reconstituted solution). The serum levels rapidly decrease in a biphasic kinetic after
intravenous injection with half-live values ranging from 25 min to 4.4 h [153].
In 2008, Extavia® (marketed by Novartis), a new brand of interferon-β-1b was approved by
the European Medicines Agency. Extavia is bioidentical to Betaferon® and it is produced in the
same production facility [154].
3.3.1 Structural differences natural IFN-β and recombinant IFN-β-1b
The natural IFN-β contains three cysteine (Cys) amino acids at amino acid position 17, 31 and
141 from which two of them (31 and 141) are required to form a disulfid bond. This bond is
necessary for biological activity. The extra amino acid contributes to the instability of this
protein by participating in disulfide bond scrambling. Therefore, the extra Cys in position 17
was replaced by serine (Ser) by site-specific mutagenesis. Furthermore, there is a methionine
(Met) deletion at the N-terminus, which is a result of the method of production [152, 155,
156]. Runkel et al. reported a 10x lower activity of the IFN-β-1b in comparison with the IFN-β-
1a. This was not explained by the differences in the sequence but due to the lack of
glycosylation and the decreased solubility [156].
3.3.2 Stability and solubility of IFN-β-1b in solution
Because of the fact that E. coli-derived IFN-β is not glycosylated, the already hydrophobic
protein becomes even more hydrophobic. This can be explained by hydrophobic side chains
which are located on the protein surface, close to its glycosylation site [145]. IFN-β-1b is
sparingly soluble at neutral pH (less than 0.05 mg/ml) leading to protein aggregation without
an additive. The solubility is significantly increased (about 1 mg/ml) at acidic pH values (4 and
below) or alkaline pH values (pH 10 and above). The reason that the protein is prone to
26
aggregation is because of hydrophobic interactions at neutral or near-neutral pH values in the
absence of solubilizing agents. These aggregates are reversible as they render soluble again
by readdition of solubilizers like SDS or adjusting the pH value [152]. Besides aggregation, the
protein is also prone to chemical degradations like deamidation, oxidation and tends to adsorb
to surfaces [145].
3.3.3 Enhancing stability and solubility for IFN-β-1b
Lin et al. reported that IFN-β-1b can be solubilized at concentrations in the range of 1-5 mg/ml
at neutral pH in the presence of surfactants such as 0.1 % SDS or chaotropic agents such as
4 M guanidine hydrochloride. To solubilize 1 mg/ml of IFN-β-1b at pH 7.0, the required SDS
amount is about 0.66 mg/ml. Adding 1 mg/ml of the nonionic surfactant polysorbat-80, the
amount of SDS could be reduced to 0.175 mg/ml. Therefore, SDS is a more effective solubilizer
for IFN-β-1b than polysorbat-80 [152]. For running an iso electric focusing (IEF) gel on IFN-β-
1b Hershenson et al. used the nonionic surfactant polyoxyethylene-12-lauryl ether (Laureth-
12) to maintain IFN-β-1b soluble also at neutral pH values. Hershenson et al. reported that
neither Tween-20, Tween-80, Triton X-100 nor urea were able to prevent aggregates [157].
The suitability of different nonionic surfactants like Laureth-12 and Plurafac C-17 (oxyalkylated
alcohol) were evaluated at room temperature at pH values close to neutral pH by Shaked et
al. using an ultracentrifugation assay. They were also benchmarked against HSA showing the
superiority of both surfactants. A protein recovery of 86 % for Plurafac® and 93 % for Laureth-
12 was obtained while HSA achieved a recovery of 32 % [158].
Another surfactant, the zwitterionic surfactant Zwittergent 3-14 (3-(N,N-Dimethyltetradecyl-
ammonio)propanesulfonate) which belongs to the group of solfobetaines, was successfully
used for the purification of IFN-β-1b and provided solubility at neutral pH at room
temperature [159]. Basu et al. used Zwittergent 3-14 to solubilize IFN-β-1b during the
purification step during PEGylation [160].
Carrier proteins like HSA and plasma protein fraction (PPF) have also been considered suitable
for rendering the IFN-β-1b protein soluble at a concentration of 1 mg/ml under physiological
pH conditions by adding HSA in a 1:50 weight-weight-ratio. PPF which consists of 83 % HSA
and a maximum of 17 α- and β-globulines, was also able to solubilize IFN-β-1b at a similar
weight-to-weight-ratio. The solubilizing effect of HSA and PPF is due to interaction between
the hydrophobic segments of IFN-β-1b and HSA [152]. HSA in the formulation acts as a
27
stabilizer and solubilizer. However, HSA has some drawbacks like the risk of blood borne
pathogens and a batch to batch variation since it usually is extracted from human plasma.
Recombinant HSA can prevent these problems but is not yet used routinely in the field of
protein formulation due to the high material costs [161]. Even though the immunogenicity of
HSA itself is low, in the presence of a second protein, and the formation of mixed aggregates
can lead to specific immunoreactions [162].
Another approach to increase the stability and solubility of IFN-β-1b is the chemical
modification by PEGylation. Basu et al. PEGylated IFN-β-1b with different PEG sizes and were
able to increase the stability and solubility of IFN-β-1b after conjugation of a 40 kDa PEG
molecule [160].
Also surface adsorption is an issue of IFN-β. In the market product (Betaferon®), this issue is
addressed with the addition of a 50 times excess of HSA. Hawe et al. successfully mitigated
adsorption in a HSA-free formulation using pH values below 5, a low ionic strength and the
addition of polysorbate [163]
28
Chapter II Objective of the thesis
Previous works of Sax [88], Schwab [164], Herrmann [90], Mohl [165] and Tian [106] were able
to successfully show the suitability of vesicular phospholipid gels (VPGs) and solid lipid
implants (SLIs) for protein delivery. The aim of this thesis was to test the suitability of VPGs
and SLIs for a hydrophobic and very labile protein.
Due to the lack of glycosylation as a result of the production method, IFN-β-1b has a very
hydrophobic character and matches the requirements of a hydrophobic model protein. The
native IFN-β-1b is prone to aggregation, oxidation and deamidation. On the one hand these
properties make the formulation development a big challenge but on the other hand it is more
likely to show even small influences regarding protein stability compared to a much more
stable protein. In the market product the solubility and stability of IFN-β-1b is improved by
HSA. Since the presence of HSA has several disadvantages, the aim is the development of a
HSA free depot system.
In addition to that, the physicochemical characteristics and also the immunogenicity of IFN-β-
1b will be improved by using a side specific PEGylation technique. Moreover, PEGylation
increases the serum half-life of proteins and provides a lower dose frequency [166]. In my
studies I want to examine the release of the hydrophobic IFN-beta-1b from a lipid matrix and
from VPGs on the one hand and to compare it to the PEGylated IFN-β-1b which provides better
properties regarding solubility and stability on the other hand [160]. This gives the opportunity
to investigate the influence of PEGylation on the release rate and does also give the option to
combine two principles of half-life extension: PEGylation and a depot system.
This project also investigates the influence of protein-lipid-interactions on protein stability and
the influence of these interactions on the protein release. Protein-lipid interactions are likely
to occur when working with a hydrophobic depot system and a hydrophobic protein. This
poses another interesting challenge but also an opportunity to use these interactions as a way
to positively influence the release rate and maybe even the stability of the protein. Different
models like liposomes and monolayers and different methods like quartz crystal microbalance
or a Langmuir film balance are investigated to characterize and quantify these interactions.
Furthermore, the influence of PEGylation on these interactions is investigated.

29
Chapter III Development of a lipid based depot formulation for
Interferon-β-1b
1 Introduction
Usually, IFN-β-1b is formulated with a high excess of human serum albumin (HSA). The market
product is a lyophilized powder containing 0.3 mg IFN-β-1b and each 15 mg HSA and mannitol
as stabilizers. Interferon-β-1b is used in multiple sclerosis therapy. Currently it has to be
applied by parenteral s.c. injection every other day. The aim of the project is to create a depot
formulation which increases the injection intervals and delivers a therapeutically relevant
dose (250 µg every other day) over a time frame of at least seven days. HSA increases the
protein stability and solubility but has also negative aspects (see Chapter I 3.3.3) [167]. To
avoid these problems, the goal is a depot formulation which is HSA-free. To circumvent the
before mentioned disadvantages of PLGA (see Chapter I 2.1.2), lipids in form of fatty acids and
phospholipids were investigated.
Lipids are natural substances that provide very good biocompatibility and biodegradability
[113]. Furthermore, lipid systems can easily be prepared by extrusion, lacking the use of
organic solvent. The benefit of lipid extrudates as a sustained release system for proteins has
been successfully shown by Schulze et al. [168] and Sax et al. [80]. Extrudates are prepared by
extruding a mixture of triglycerides, lyophilized protein and excipients. Extrusion in general is
a fast and easily up-scalable technique using relatively low temperatures. It has been shown
for different proteins (i.e. Interferon-α, lysozyme, IgG-1) that extrudates from twin screw
extruders provide sustained protein release over a period up to 150 days [168]. The release
kinetics can be influenced using excipients like pore-forming agents, precipitation agents like
PEG or by type and amount of the lipid [80, 97, 168]. The rod-shaped extrudates can be
produced with various diameters ranging from 0.5 to 2 mm. This size offers the possibility to
administer the extrudates with a hollow needle or a trocar.
In this chapter a lipid based depot formulation for the IFN-β-1b is investigated and it is tested
whether a sustained release of this hydrophobic protein from vesicular phospholipid gels and
solid lipid implants is possible. The hydrophobicity and instability especially in the absence of
HSA, however, poses an interesting challenge in formulation development.
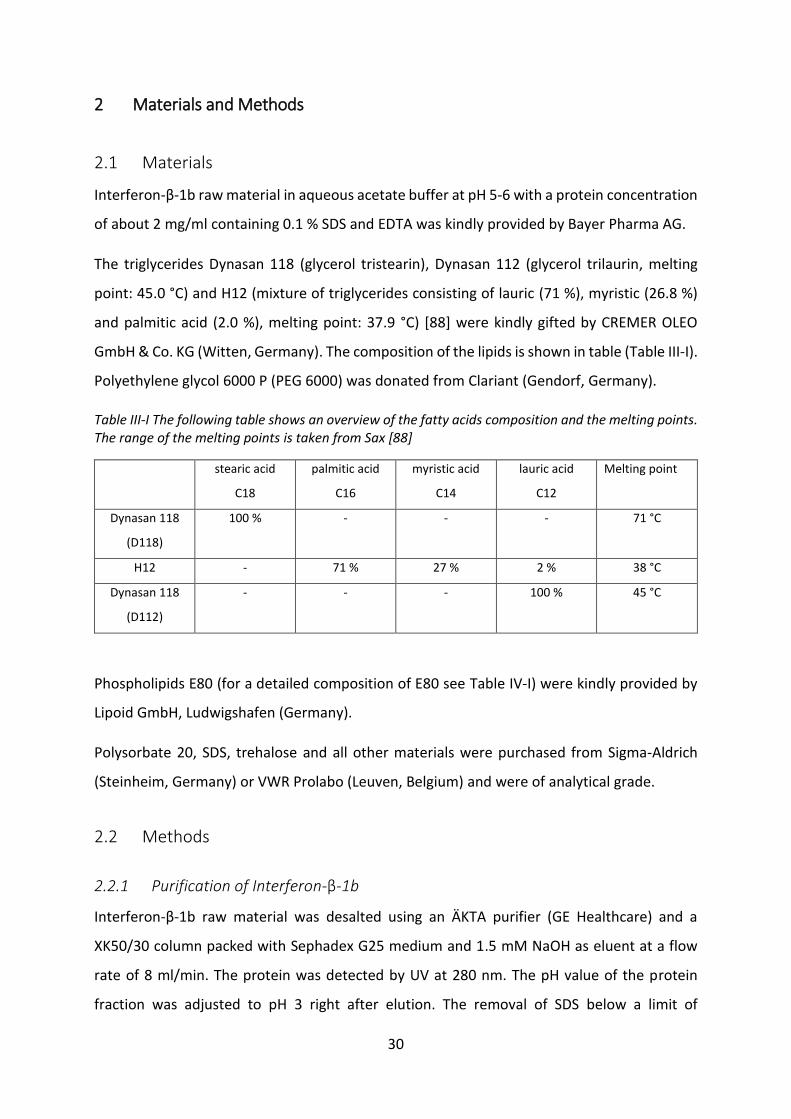
30
2 Materials and Methods
2.1 Materials
Interferon-β-1b raw material in aqueous acetate buffer at pH 5-6 with a protein concentration
of about 2 mg/ml containing 0.1 % SDS and EDTA was kindly provided by Bayer Pharma AG.
The triglycerides Dynasan 118 (glycerol tristearin), Dynasan 112 (glycerol trilaurin, melting
point: 45.0 °C) and H12 (mixture of triglycerides consisting of lauric (71 %), myristic (26.8 %)
and palmitic acid (2.0 %), melting point: 37.9 °C) [88] were kindly gifted by CREMER OLEO
GmbH & Co. KG (Witten, Germany). The composition of the lipids is shown in table (Table III-I).
Polyethylene glycol 6000 P (PEG 6000) was donated from Clariant (Gendorf, Germany).
Table III-I The following table shows an overview of the fatty acids composition and the melting points. The range of the melting points is taken from Sax [88]
stearic acid
C18
palmitic acid
C16
myristic acid
C14
lauric acid
C12
Melting point
Dynasan 118
(D118)
100 % - - - 71 °C
H12 - 71 % 27 % 2 % 38 °C
Dynasan 118
(D112)
- - - 100 % 45 °C
Phospholipids E80 (for a detailed composition of E80 see Table IV-I) were kindly provided by
Lipoid GmbH, Ludwigshafen (Germany).
Polysorbate 20, SDS, trehalose and all other materials were purchased from Sigma-Aldrich
(Steinheim, Germany) or VWR Prolabo (Leuven, Belgium) and were of analytical grade.
2.2 Methods
2.2.1 Purification of Interferon-β-1b
Interferon-β-1b raw material was desalted using an ÄKTA purifier (GE Healthcare) and a
XK50/30 column packed with Sephadex G25 medium and 1.5 mM NaOH as eluent at a flow
rate of 8 ml/min. The protein was detected by UV at 280 nm. The pH value of the protein
fraction was adjusted to pH 3 right after elution. The removal of SDS below a limit of

31
0.000025 % was confirmed by using a Corona® CAD® which was kindly provided temporarily
by Thermo Fisher Scientific GmbH, Germany, using a RP-HPLC method. All tests were
conducted with the desalted and purified protein except it is stated otherwise.
2.2.2 Size exclusion high performance chromatography (SE-HPLC)
SE-HPLC was used to analyze the formation of soluble aggregates of IFN-β-1b. SEC analytic was
conducted on a Dionex Ultimate 3000 (Dionex, Germany). The flow rate was 0.7 mL/min and
100 μl of each sample were injected onto a TSK-Gel G3000PWXL 30 cm x 7.8 mm ID and
detected with UV-detection at 280 nm. Protein concentrations were determined with an IFN-
β-1b calibration curve. The running buffer was composed of 175 mM sodium phosphate and
0.1 % SDS with a pH adjusted to 6.8. Protein concentrations were determined by UV
absorbance using a Nanodrop 2000 (Thermo Scientific, Germany) at 280 nm, with an IFN-β-1b
extinction coefficient of 1.7 ml/mg*cm.
Since the addition of SDS is likely to veil some aggregates (especially those that are
reversible in the presence of SDS), different approaches have been conducted to avoid SDS.
A short list of different running buffers that were tested as an alternative to the SDS
containing buffer is given below (Table III-II). Salt concentrations were kept relatively low,
since otherwise the protein would have been salted out. Since none of the alternative
running buffers resulted in reproducible results, 0.1 % SDS had to be added, eventually.
Table III-II Different SEC running buffers for tested for IFN-β-1b in order to avoid SDS
Running buffer Result
2.5 mM Acetate, 18.3 mM NaCl,
pH 3.3
Strong adsorption of IFN beta to the column, no reproducible peak areas,
no improvement after multiple injections in order to saturate the column
0.2 M Arginin, pH 3.3 Strong adsorption of IFN beta to the column, no reproducible peak areas,
no improvement after saturation of the column
0.2 M Arginin, pH 7.4
Minor adsorption of IFN beta to the column, very broad peak + several
additional unidentifiable peaks
0.2 M Arginin, pH 11.0
Minor adsorption of IFN beta to the column, very broad peak + several
additional unidentifiable peaks
PBS-buffer, pH 6.8 +
0.1% SDS
Only minor adsorption to the column, after 3-4 injections, the column
was saturated and reproducible peaks were obtained
32
2.2.3 Reversed phase high performance liquid chromatography (RP-HPLC)
RP-HPLC was used for quantification and to determine conjugate purity and oxidation levels.
RP-HPLC was performed using a Jupiter C4 column with 300 Å, 5 μm, 250*4.6 mm.
(Phenomenex, Aschaffenburg, Germany), which was kept at 30 °C for the analytics. Running
buffers were 0.1 % TFA in 10 % acetonitrile (buffer A) and 0.1 % TFA in 100 % acetonitrile (ACN)
(buffer B). The samples were analyzed using a 0-42 % gradient over 15 minutes and a 42-55 %
gradient over 30 min at 0.8 mL/min of buffer B. Protein was detected by UV-detection at
280 nm and fluorescence using an excitation wavelength of 278 nm and an emission
wavelength of 355 nm.
2.2.4 Sodium dodecyl sulfate - polyacrylamide gel electrophoresis (SDS-PAGE)
SDS-PAGE analysis was used to detect aggregates and was performed under non-reducing
conditions using NuPAGE® 10 % Bis-Tris Gel (NOVEX high performance pre-cast gels,
Invitrogen, Karlsruhe, Germany) and NuPAGE® MES SDS running buffer (Invitrogen, Karlsruhe,
Germany) on an XCell II Mini cell system (Novex, San Diego, CA, USA). Samples were denatured
for 20 min at 95 °C and 20 μl of the solution were loaded to each well. Band identification was
done with a Mark 12™ unstained standard (Life Technologies GmbH, Darmstadt, Germany).
Electrophoresis was performed at a consistent current of 0.04 A. gels were stained with
SilverXPress® Silver Staining Kit (Invitrogen, Karlsruhe, Germany)
2.2.5 Karl-Fischer-titration
Coloumetric Karl–Fischer titration using the Aqua 40.00 titrator with a headspace module
(Analytik Jena AG, Halle, Germany) was used to determine the residual moisture. The content
of a complete vial (7.15 mg lyophilisate) was heated to 80 °C. The evaporated water was
transferred into the titration solution and the amount of H2O was determined.
2.2.6 Dynamic light scattering (DLS)
DLS measurements were conducted on a Zetasizer Nano (Malvern, Herrenberg, Germany) to
characterize protein molecules and particles in the range from 1 to 1500 nm. It is operating
with a noninvasive backscatter technique and a 4 mW He-Ne-Laser at 633 nm at a constant
temperature of 25 °C. Before measurement, all samples were filtered using a 0.2 µm Whatman
PVDF filter (GE Healthcare, UK).
33
The size distribution by intensity and volume was calculated from the correlation function
using the multiple narrow mode of the Dispersion Technology Software from Malvern.
2.2.7 Light obscuration
Particles were determined using a PAMAS SVSS-35 particle counter (PAMAS-Partikelmess- und
Analysesysteme GmbH, Rutesheim, Germany) equipped with an HCB-LD-25/25 sensor. Each
measurement consisted of two subruns with a volume of 0.3 ml. The rinsing volume of the
sample before measurement was 0.5 ml. Before each measurement the system was rinsed
with HPW until the total particle count was less than 50 particles in total and no particle was
larger than 10 µm. Data was collected by PAMAS PMA software.
2.2.8 Microscopic studies
Microscopic studies for investigation of the structure of the VPGs were conducted using a
Keyence VHX-500f digital microscope (Keyence, Neu-Isenburg, Germany) equipped with a VH-
Z100R objective (magnification 100x - 1000x).
2.2.9 Laser diffraction
Particle distribution by intensity was measured using a Horiba LA-950 (Retsch, Haan,
Germany) equipped with two laser light sources at 650 and 405 nm and 23 wide angle
detectors. The sample was diluted in highly purified water (HPW) in a low volume cuvette LA-
950. The refractive index of the sample was 1.44 (liposomes) and 1.33 for water. Data was
collected using the LA-950 software.
2.2.10 Fourier transform infrared spectroscopy (FTIR)
For determination of the secondary structure, FITR measurements with Tensor 27 (Bruker
Optics, Ettlingen, Germany) and an Aquaspec-Cell were performed. Spectra were recorded
from 4000 to 850 cm-1 wavenumbers in transmission mode at 20 °C. The average of three
measurements was taken. After analysis, the particular buffer spectrum was subtracted from
the protein spectrum. The spectra were further processed by an off-set correction, forming
the second derivative and vector normalization. For a better comparison of the spectra a min-
max-normalization was conducted as a final step. Data collection and analysis was done by
using Opus software 6.5.
34
2.2.10.1 Analysis of the protein/phospholipid precipitate after the VPG extraction attempts
50 mg of protein-loaded VPGs were dispersed in 950 µl organic solvent. The dispersion was
centrifuged for 20 min at 20000x g. To wash the precipitates, they were resuspended in 400 µl
of the corresponding solvent, vortexed and an additional centrifugation step was applied after
waiting for 30 min with the above mentioned conditions. The filtrate was discharged and the
precipitates were dried in a desiccator for four days until a constant mass was achieved. After
that, the precipitates were investigated with a Tensor 27 spectrometer with the Hyperion
microscope including an ATR objective (20x) (Bruker Optik GmbH, Ettlingen, Germany). After
measuring the background the CaF2-crystal was placed on the dried precipitate. As a
comparison, pure Lipoid E80 was analyzed in the same manner. Data collection and analysis
was done by using Opus software 6.5.
2.2.11 Lyophilisation
Lyophilisation was conducted using an Epsilon 2-6 D freeze-drier from Christ (Osterrode,
Germany). Samples were equilibrated at 6 °C for 1h before the cycle started.
Two different freeze-drying cycles were used:
1. Samples were frozen using a ramp of 0.45 °C/min to -50 °C. Primary drying was
conducted after 2 h. The pressure in the chamber was decreased to 0.045 mbar and
the shelf-temperature set to -15 °C. Primary drying was carried out for 20 h. For
secondary drying, a shelf-temperature of 40 °C (10 h) was used with a ramp of
0.5 °C/min. The vials were closed under N2 atmosphere at a pressure of 800 mbar
2. Same conditions as above but a lower shelf temperature (-25 °C) during primary drying
was used. An increase of the time of the primary drying step (from 20 h to 30 h) was
used.
2.2.12 Preparation of solid lipid extrudates
The preparation of lipid extrudates was done according to Schulze et al (2009) [168]. Lipids
with a low melting point like H12 (mixture of triglycerides consisting of lauric, myristic and
palmitic acid, melting point: 37 °C) or Dynasan 112 (glycerol trilaurin, melting point: 45.0 °C)
and lipids with a high melting point (D118) were used in a ratio of 30:70. The lyophilized
protein was admixed to the mixture of the lipids in an agate mortar until a uniform powder
35
mixture was achieved. Before extrusion, the mixture was homogenized using a sieve with a
mesh size of 0.3 µm.
Extrudates were prepared using a twin–screw extruder (Haake MiniLab Micro Rheology
Compounder). Extrusion temperature was set to 41 °C (H12 as low melting point lipid) which
is slightly above the melting maximum of the low melting point lipid (37 °C). Extrusion of rod-
shaped implants was performed through a 1.9 mm outlet. When extruding Dynasan 112, an
extrusion temperature of 45 °C was used.
The extrudates were cut into 2.5 cm long pieces with an average weight of 80.2 ± 0.7 mg.
2.2.13 Preparation of vesicular phospholipid gels (VPGs)
VPGs were prepared using a dual asymmetric centrifuge (SpeedMixerTM DAC 150 FVZ, Hauschild
GmbH & Co KG, Hamm, Germany) according to Tian et al. [105]. Interferon-β-1b was
incorporated by direct loading. Protein containing buffer was added to the designated amount
of phospholipids in a 25 ml cylindrical container (PP, Duerrmann GmbH, Hohenlinden,
Germany). A rotation speed of 3500 rpm was used over 30 min in 2 min steps with
intermediate cooling of the sample container in ice water.
2.2.14 Extraction of protein from lipid implants
Extrudates were ground in an agate mortar which was cooled on dry ice and incubated in
20 mM glycine buffer pH 2 with 0.2 % SDS and heated to 50 °C for 5 min in a Thermomixer
Comfort (Eppendorf, Germany) at 100 rpm. The samples were centrifuged and the protein
amount of the supernatants was quantified by RP-HPLC. Protein recovery after extraction was
around 60 %. Extraction efficiency could not be improved by using other buffers (glycine buffer
pH 2 without SDS, PBS buffer pH 7.4 + 0.1 % SDS and 0.1 M NaOH pH 11) or temperatures
(45 °C, 50 °C, 60 °C).
2.2.15 Determination of IFN-β-1b solubility in buffers
The stock solution of IFN-β-1b was diluted to 250 µg/ml with the corresponding surfactant
containing buffer. 0.5 ml of the dilution was placed in 1.5 ml safe lock reaction tubes. Samples
were stored for either 30 min at room temperature, 24 h at 37 °C or 48 h at 37 °C. To determine
the still solubilized protein, the samples were centrifuged at 20000x g for 30 minutes after the
incubation time and the protein recovery of the supernatant was analyzed using RP-HPLC and
36
a fluorescence detector. A dilution of 250 µg/ml of IFN-β-1b (20 mM glycine buffer) of the
stock solution was analyzed without the centrifugation step with RP-HPLC and was used as a
reference and was set to 100 %.
2.2.16 In-vitro release tests
Release tests were conducted in 2.0 mL safe lock reaction tubes (Eppendorf AG, Germany) in
1.9 ml of PBS buffer pH 7.4 + 0.1 % SDS. Sampling was conducted after 24 h over seven days.
Samples were drawn by a complete exchange of the incubation medium. Before quantification
by RP-HPLC, the supernatant of the samples were centrifuged with a Sigma 4K15 centrifuge
(Sigma, Osterode am Harz, Germany) for 20 minutes at 20000x g. For quantification, the use
of RP-HPLC and a fluorescence detector was necessary. A fluorescence detector is able to
detect smaller amounts in comparison with an UV-detector. Lipid residues were present even
after centrifugation and resulted in a UV/fluorescence signal. RP-HPLC has the advantage that
by knowing the retention time and peak shape of the protein peak, the area under the curve
of the protein peak can be selectively integrated and calculated.
2.2.17 Determination of biological activity using a luciferase IFN reporter gene assay
Biological activity of interferon-β-1b was determined by using the iLite™alphabeta Human
Type I Interferon Activity Detection Kit (Biomonitor Ltd., Ireland) according to the “Instructions
For Use” Rev. 6. It is a gene reporter cell assay in which the binding of IFN to its receptor starts
a cascade of signal transduction events. This cascade induces the luciferase gene under the
transcriptional control of an interferon sensitive response element producing the luciferase
enzyme in a dose dependent manner. A substrate is added and consequently oxidized by the
luciferase resulting in bioluminescence which is determined [169]. Every sample was
measured in duplicates. An interferon-β-1b standard with 900 IU/ml provided by Biomonitor
was used to determine the activity. After the release from the depot system, the released
fractions were stored at 6-8 °C until they were used for measurement. Protein concentrations
were determined one day before the assay to avoid protein loss during storage. Before
analysis, all protein samples were diluted to the same concentration (5.0 ng/ml) before using
it for the test in order to compare the biological activity independent of the released protein
amount. The biological activity of the stock solution of the same concentration was set 100 %.
37
In short: Samples in duplicates were diluted in a 96 well plate with highly purified water and
assay diluent to a theoretical activity of 100 IU according to the protein amount quantified
with RP-HPLC and a theoretical activity of 3x10⁷ IU/mg, as reported in literature [152, 156,
160]. The IFN-β standard was diluted to activities of 10, 25, 50, 75, 100, 150 and 200 IU for the
calibration curve. Cell suspension was given to each well using a multichannel micro-pipette
with sterile tips under sterile environment. Samples were incubated at 37 oC in 5 % CO2 for
7 h. After incubation, the reconstituted lysis substrate was added using a multichannel pipette.
After 2 min, the luminescence was measured in white 96 well plates on a luminometer for 10 s
(Centro LB 960 instrument, Berthold, Bad Wildbad, Germany).
Activity was calculated by plotting the IFN activity of the standard curve (log scale) against the
relative light units (RLU) (linear scale). The obtained linear function was used to calculate the
activity of the samples indicated by the mean RLU.
3 Results of preliminary tests with VPGs and IFN-β-1b
After the desalting step, IFN-β-1b is already in solution and can be directly used for VPG
preparation. The development of a lyophilisate as an intermediate, like it is necessary for the
solid lipid implants, is not required.
Since the solubility of the IFN-β-1b in the desired concentration (1 mg/ml) is only provided at
pH values below pH 4, first tests were conducted in 20 mM pH 3 glycine buffer to provide
sufficient protein solubility. Possible hydrolysis of phospholipids that would lead to changes
during long term storage [139] were accepted. The addition of surfactants like SDS to increase
the solubility of IFN-β-1b in less acidic pH value would have rendered the system much more
complex. SDS can also solubilize the liposomes making the depot system useless, due to the
destruction of the vesicular structure [170]. Therefore, the addition of SDS was not considered
further.
3.1 Extraction of the incorporated protein from VPGs
350 mg Lipoid E80 was added to a 650 µl 20 mM pH 3 glycine protein buffer with a final protein
concentration in the formulation of 1 mg/g gel. The mixture was processed as described in
chapter 2.2.13 until a macroscopically homogeneous semi solid gel was achieved.
38
After the successful incorporation of the protein, the next step was the investigation of
extraction methods like the redispersion of the gel and solubilizing the vesicles with organic
solvent [105]. Gentle vortexing of the protein loaded VPGs for two minutes in a ten-fold excess
of water or glycine buffer at pH 3 resulted in a very turbid dispersion. Filtration of the
dispersion was barely possible since the filters were blocked even after a small volume.
However, redispersed placebo VPGs of the same concentration were filterable. Centrifugation
of the VPGs dispersion resulted in a relatively clear supernatant and a rather large precipitate.
The precipitates of the placebo VPGs were much smaller. Quantification by RP-HPLC resulted
in a protein recovery of about 15 % in the supernatant indicating that the majority of the
protein is within the precipitate.
According to Tian et al. [106] extraction of EPO from VPGs was successfully achieved with a
protein recovery of about 85 % by using chloroform. Using this method for IFN-β-1b loaded
VPGs, a very high turbidity of the chloroform phase was observed, even though the dissolution
of the protein and Lipoid E80 in chloroform alone resulted in two clear solutions.
In general, water is immiscible in chloroform and a clear phase separation is visible. As
amphiphilic molecules, phospholipids are able to emulsify the water in the chloroform
resulting in a very turbid emulsion. Even after centrifugation at 20000x g for 20 min and
filtration through 0.2 µm PVDF filters, a turbidity was still visible. Moreover, the protein
recovery determined by analyzing the supernatant by RP-HPLC was less than 20 % of the
theoretical protein amount of the VPG. Therefore, several other extraction methods with
different solvents were tested as shown in Table III-III. To determine IFN solubility in organic
solvent and protein solution were mixed in a ratio of 9:1 to a final protein concentration of
250 µg/ml.
Table III-III Solubility of 5 % (m/m) Lipoid E80, 20 % (m/m) placebo VPGs and IFN loaded VPGs in different solvents determined by visual inspection.
solvent Lipoid E80 IFN-β-1b placebo VPG IFN-VPGs
acetonitrile 100 % not soluble soluble not soluble not soluble
acetonitrile/methanol (50/50)
soluble soluble soluble not soluble
methanol 100 % soluble soluble soluble not soluble
chloroform soluble soluble not soluble not soluble
tetrahydrofuran soluble soluble soluble not soluble
ethanol soluble soluble soluble not soluble
39
Even though several solvents were able to dissolve the placebo VPGs, all of them failed
dissolving the protein loaded VPGs. Dimethylformamide (DMF) and dimethyl sulfoxide
(DMSO) were also tested but failed already dissolving the pure phospholipid. The
acetonitrile/methanol (50/50), tetrahydrofuran and ethanol samples also showed a visible
turbidity after centrifugation. Therefore, the samples were additionally filtrated through
0.2 µm PVDF filters. Even after filtration, the turbidity was present which indicates the
presence of colloidal particles. The addition of methanol resulted in a less turbid sample but
little white flakes appeared. To avoid solubility limitations the amount of organic solvent was
increased to an IFN-VPG/solvent-ratio of 1:19. In none of the cases the protein loaded VPGs
could be dissolved and the observed decrease in turbidity was mainly due to the dilution
effect.
To analyze the composition of the non-solubilized component and the flakes, the resulting
precipitate after centrifugation was further investigated. Figure III-1 shows the presence of
the protein characteristic amid-I-band and amid-II-band between 1500 cm-1 and 1700 cm-1
(marked area) [171] in the spectra of the precipitate. These are missing in the IR-spectra of
the pure Lipoid E80 sample. Also peaks of E80 are visible in the spectrum of the precipitate
like between 2600 and 3000 cm-1 or around 1100 cm-1. This shows that the particles causing
the turbidity and resulting in a precipitate after centrifugation, consist of lipid and protein.
According to literature, the addition of chlorofom or DMF dissolves the liposomes and sets the
encapsulated protein free [105]. In our case, the protein amount in the supernatant after the
addition of the organic solvents was very low, indicating that the majority of the protein did
either form phospholipid induced protein-protein-aggregates (the protein alone did not show
signs of aggregation or reduced recovery in the organic solvent) or phospholipid-protein-
aggregates. Vortexing the precipitate in fresh solvent, was not able to dissolve the precipitate,
even though protein and lipid alone are soluble in the tested solvents.
With FTIR spectroscopy the secondary structure of proteins can be analyzed and possible
structural changes point out protein instabilities [171]. An attempt to investigate the
secondary structure in order to get more information of potential aggregation of the protein
did not give proper results. Due to difficulties in background subtraction, which were also
reported by Tian et al. [105], the secondary structure of the protein could not be determined
in a reproducable manner. Similar problems have been reported in the work of Herrmann who
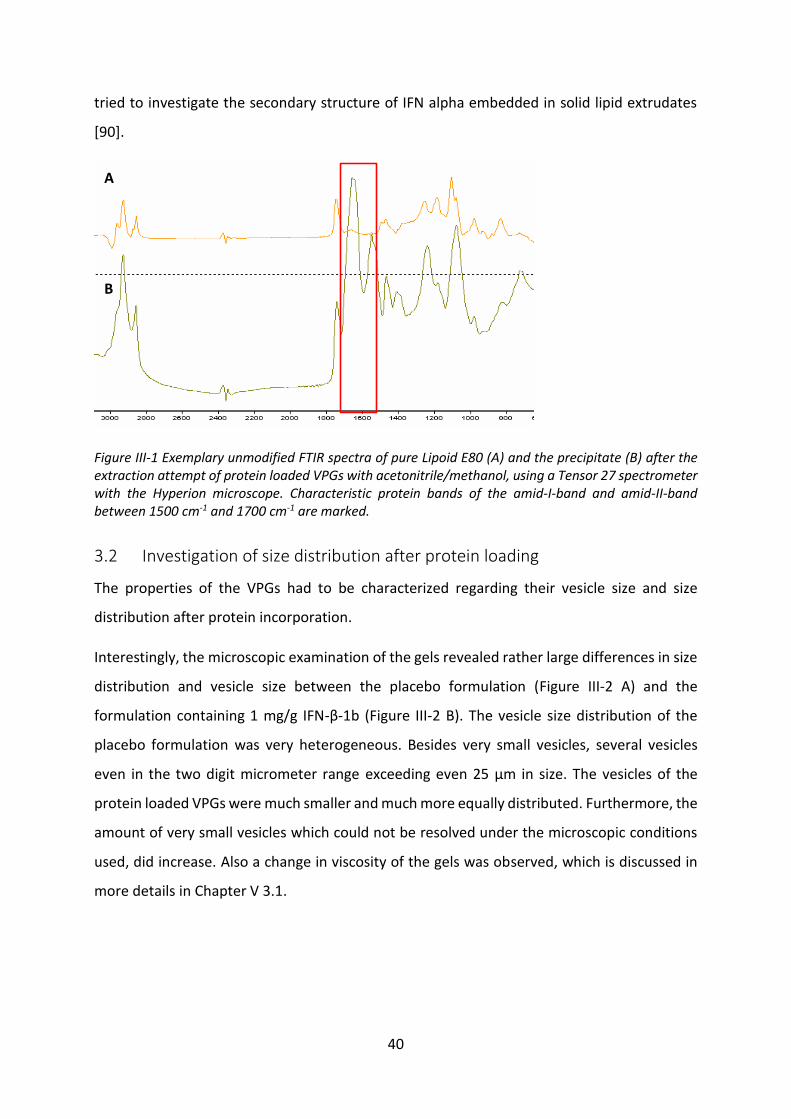
40
tried to investigate the secondary structure of IFN alpha embedded in solid lipid extrudates
[90].
Figure III-1 Exemplary unmodified FTIR spectra of pure Lipoid E80 (A) and the precipitate (B) after the extraction attempt of protein loaded VPGs with acetonitrile/methanol, using a Tensor 27 spectrometer with the Hyperion microscope. Characteristic protein bands of the amid-I-band and amid-II-band between 1500 cm-1 and 1700 cm-1 are marked.
3.2 Investigation of size distribution after protein loading
The properties of the VPGs had to be characterized regarding their vesicle size and size
distribution after protein incorporation.
Interestingly, the microscopic examination of the gels revealed rather large differences in size
distribution and vesicle size between the placebo formulation (Figure III-2 A) and the
formulation containing 1 mg/g IFN-β-1b (Figure III-2 B). The vesicle size distribution of the
placebo formulation was very heterogeneous. Besides very small vesicles, several vesicles
even in the two digit micrometer range exceeding even 25 µm in size. The vesicles of the
protein loaded VPGs were much smaller and much more equally distributed. Furthermore, the
amount of very small vesicles which could not be resolved under the microscopic conditions
used, did increase. Also a change in viscosity of the gels was observed, which is discussed in
more details in Chapter V 3.1.
B
A
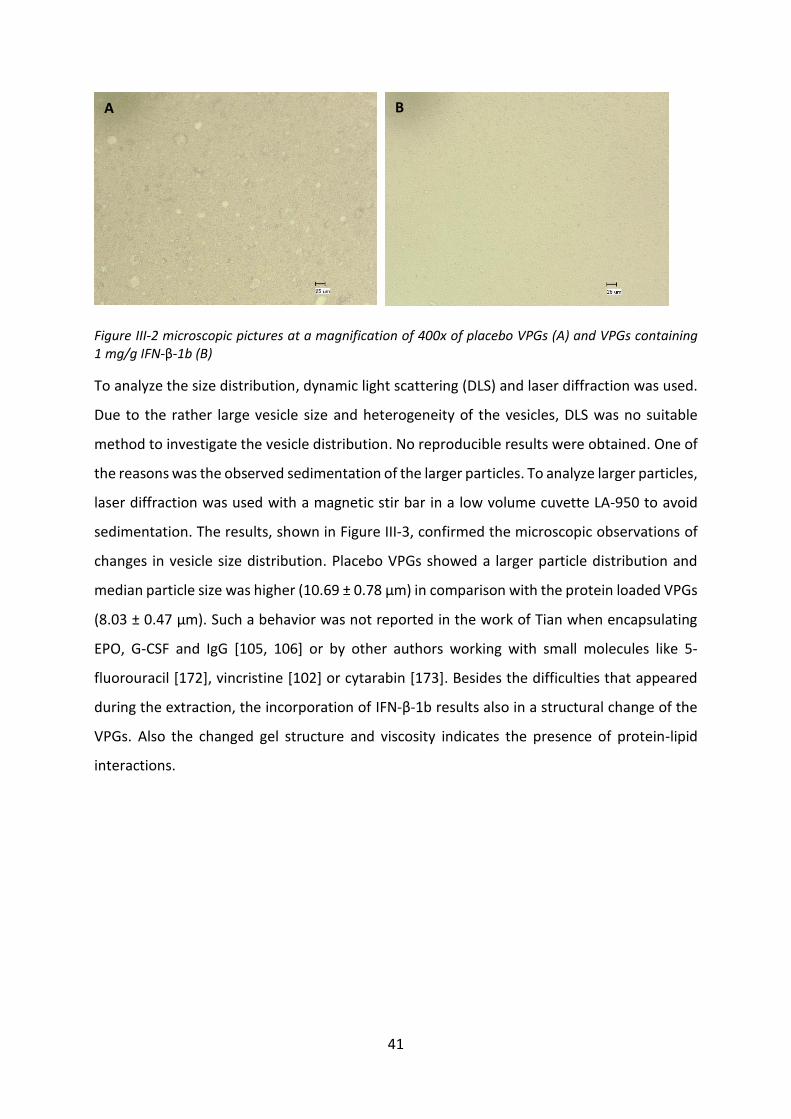
41
Figure III-2 microscopic pictures at a magnification of 400x of placebo VPGs (A) and VPGs containing 1 mg/g IFN-β-1b (B)
To analyze the size distribution, dynamic light scattering (DLS) and laser diffraction was used.
Due to the rather large vesicle size and heterogeneity of the vesicles, DLS was no suitable
method to investigate the vesicle distribution. No reproducible results were obtained. One of
the reasons was the observed sedimentation of the larger particles. To analyze larger particles,
laser diffraction was used with a magnetic stir bar in a low volume cuvette LA-950 to avoid
sedimentation. The results, shown in Figure III-3, confirmed the microscopic observations of
changes in vesicle size distribution. Placebo VPGs showed a larger particle distribution and
median particle size was higher (10.69 ± 0.78 µm) in comparison with the protein loaded VPGs
(8.03 ± 0.47 µm). Such a behavior was not reported in the work of Tian when encapsulating
EPO, G-CSF and IgG [105, 106] or by other authors working with small molecules like 5-
fluorouracil [172], vincristine [102] or cytarabin [173]. Besides the difficulties that appeared
during the extraction, the incorporation of IFN-β-1b results also in a structural change of the
VPGs. Also the changed gel structure and viscosity indicates the presence of protein-lipid
interactions.
A B
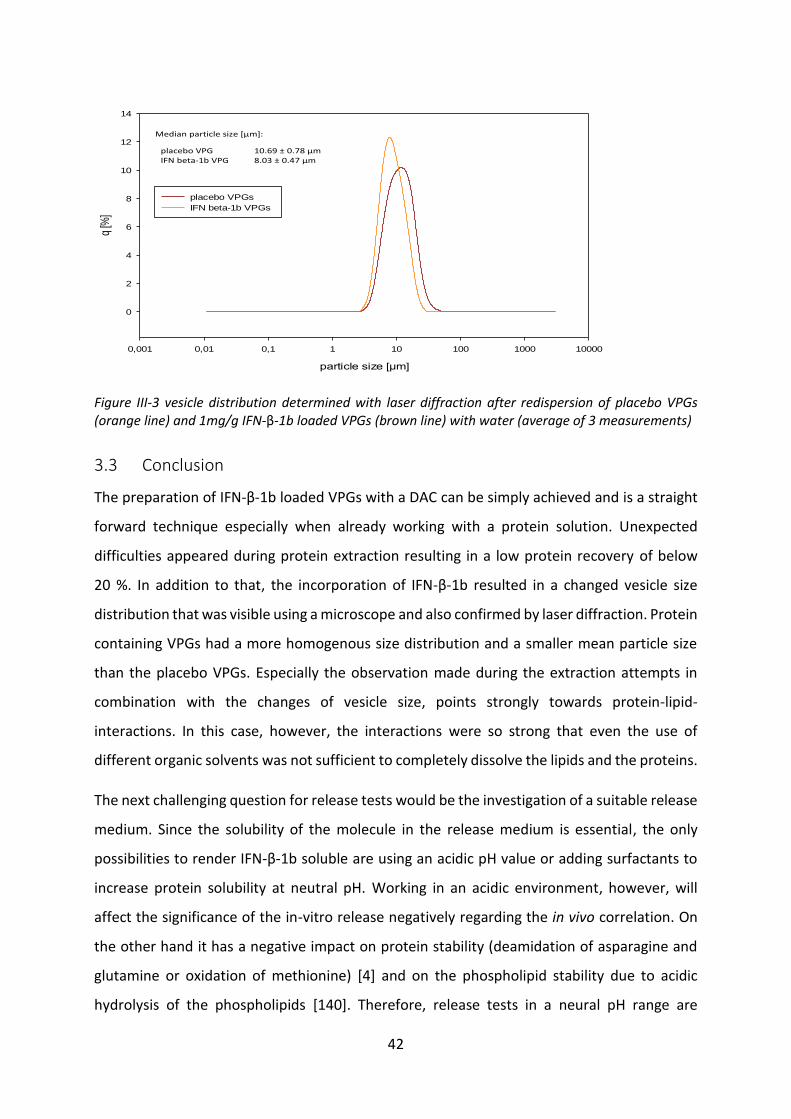
42
particle size [µm]
0,001 0,01 0,1 1 10 100 1000 10000
q [%
]
0
2
4
6
8
10
12
14
placebo VPGs
IFN beta-1b VPGs
Median particle size [µm]:
placebo VPG 10.69 ± 0.78 µm IFN beta-1b VPG 8.03 ± 0.47 µm
Figure III-3 vesicle distribution determined with laser diffraction after redispersion of placebo VPGs (orange line) and 1mg/g IFN-β-1b loaded VPGs (brown line) with water (average of 3 measurements)
3.3 Conclusion
The preparation of IFN-β-1b loaded VPGs with a DAC can be simply achieved and is a straight
forward technique especially when already working with a protein solution. Unexpected
difficulties appeared during protein extraction resulting in a low protein recovery of below
20 %. In addition to that, the incorporation of IFN-β-1b resulted in a changed vesicle size
distribution that was visible using a microscope and also confirmed by laser diffraction. Protein
containing VPGs had a more homogenous size distribution and a smaller mean particle size
than the placebo VPGs. Especially the observation made during the extraction attempts in
combination with the changes of vesicle size, points strongly towards protein-lipid-
interactions. In this case, however, the interactions were so strong that even the use of
different organic solvents was not sufficient to completely dissolve the lipids and the proteins.
The next challenging question for release tests would be the investigation of a suitable release
medium. Since the solubility of the molecule in the release medium is essential, the only
possibilities to render IFN-β-1b soluble are using an acidic pH value or adding surfactants to
increase protein solubility at neutral pH. Working in an acidic environment, however, will
affect the significance of the in-vitro release negatively regarding the in vivo correlation. On
the other hand it has a negative impact on protein stability (deamidation of asparagine and
glutamine or oxidation of methionine) [4] and on the phospholipid stability due to acidic
hydrolysis of the phospholipids [140]. Therefore, release tests in a neural pH range are
43
favorable. Adding surfactants to render IFN-β-1b soluble at neutral pH has an impact on the
gel/liposome structure [170] and is therefore no reasonable option, as well.
The only option to further investigate VPGs as a potential depot formulation for IFN-β-1b
requires an increase of the solubility especially in the neutral pH range and a decrease of
protein-lipid interactions. The first aspect can be addressed by changing the physicochemical
properties of the protein by creating a protein-polymer conjugate. PEGylation of IFN-β-1b will
most likely also change the protein-lipid interactions. Therefore, the focus was on solid lipid
implants as a depot formulation for IFN-β-1b, until a PEGylated version of the protein was
synthesized.
4 Solid Lipid implants
The encounter of challenges regarding the development of a VPG-based depot formulation
shifted the priorities to solid lipid implants (SLI) as a depot formulation. SLIs based on
triglycerides have been successfully tested as suitable depot systems for proteins by Mohl
[165], Herrmann [90], Schwab [164] and Sax [88]. The release kinetics can be influenced using
excipients like pore-forming agents, precipitation agents like polyethylene glycol or by the
type and amount of the lipid. PEG can be used as a porogen but also as a precipitation agent.
PEG leads to a reversible precipitation of the protein resulting in a decreased release rate in
the beginning and also to a more complete release [92].
To investigate the release of IFN-β-1b from SLIs, the extrudates have to be prepared by mixing
the lyophilized protein with the matrix material. Therefore, the development of a stable
human serum albumin free lyophilisate of IFN-β-1b as an intermediate is necessary. Due to its
challenging solubility, a suitable release medium has to be used that provides sufficient
protein solubility under physiological conditions and does not dissolve the matrix material
itself.
4.1 Development of a HSA-free interferon-β lyophilisate
Lyophilisation or freeze-drying is the most common technique to prepare solid protein
pharmaceuticals. Nonetheless, during lyophilisation different freezing and drying stresses are
generated that might negatively affect protein stability. HSA is able to protect the protein from
freezing (cryoprotectant) and from dehydration (lyoprotectant) [174]. Since a HSA-free
44
formulation should be developed, alternative compounds like the disaccharides trehalose or
sucrose needed to be used. To avoid surface denaturation of the proteins at the ice-water
interfaces, surfactants like polysorbate (PS) can be used. By reducing the surface tension of
the protein solution they reduce the driving force of protein adsorption and/or aggregation
[167].
Hence, different formulations were tested comprising different sugars, varying protein/sugar
ratios and the addition of polysorbate 20. The approximate composition of the formulation
was adopted from literature [163, 175-177] and modified with the goal of a protein:excipient
ratio of 1:6.7 (13 %) within the lyophilisate. This limitation is due to the desire to incorporate
a therapeutic relevant dose of IFN-β-1b for ten days within one extrudates. On the other hand
there is a limit of approximately 10 % lyophilisate in the final lipid blend of the extrudates,
which should not be exceeded. Increasing content of lyophilisate/soluble material above 10 %
will increase the release rate of the protein [88].
According to literature, low ionic strength and a low pH value is beneficial regarding stability
and solubility of IFN-β-1b in a HSA free formulation. Also glycine buffer was reported to have
a positive influence on protein stability [175, 176]. Besides trehalose and sucrose also
mannitol was selected as it is used in the market product. Mannitol easily crystallizes, which
is a disadvantage, as it is a potential source for the destabilization of some proteins during
lyophilisation [167]. Table III-IV gives an overview of the tested formulations:
Table III-IV Composition of the tested formulations for HSA-free IFN-β-1b lyophilisation
formul
ation
IFN-β-1b
[mg/ml]
glycine
[mg/ml]
sucrose
[mg/ml]
mannitol
trehalose PS 20 pH protein-
content
cycle
1 1.440 0.246 1.095 4.379 - - 3.0 20 % 1
2 1.440 0.246 - 5.005 - - 3.0 22 % 1
3 1.440 0.246 - - 5.005 - 3.0 22 % 1
4 1.000 0.769 - - 5.922 - 3.0 13 % 2
5 1.000 0.769 - - 5.922 0.005 % 3.0 13 % 2
6 1.000 0.769 - - 5.921 0.020 % 3.0 13 % 2
Preliminary tests were conducted with buffer the composition of formulation 1-3 (Table III-IV)
starting with a slightly higher pH value (pH 3.8 instead of pH 3.0) to avoid possible negative
influences going along with low pH values. These can be chemical changes of the protein like
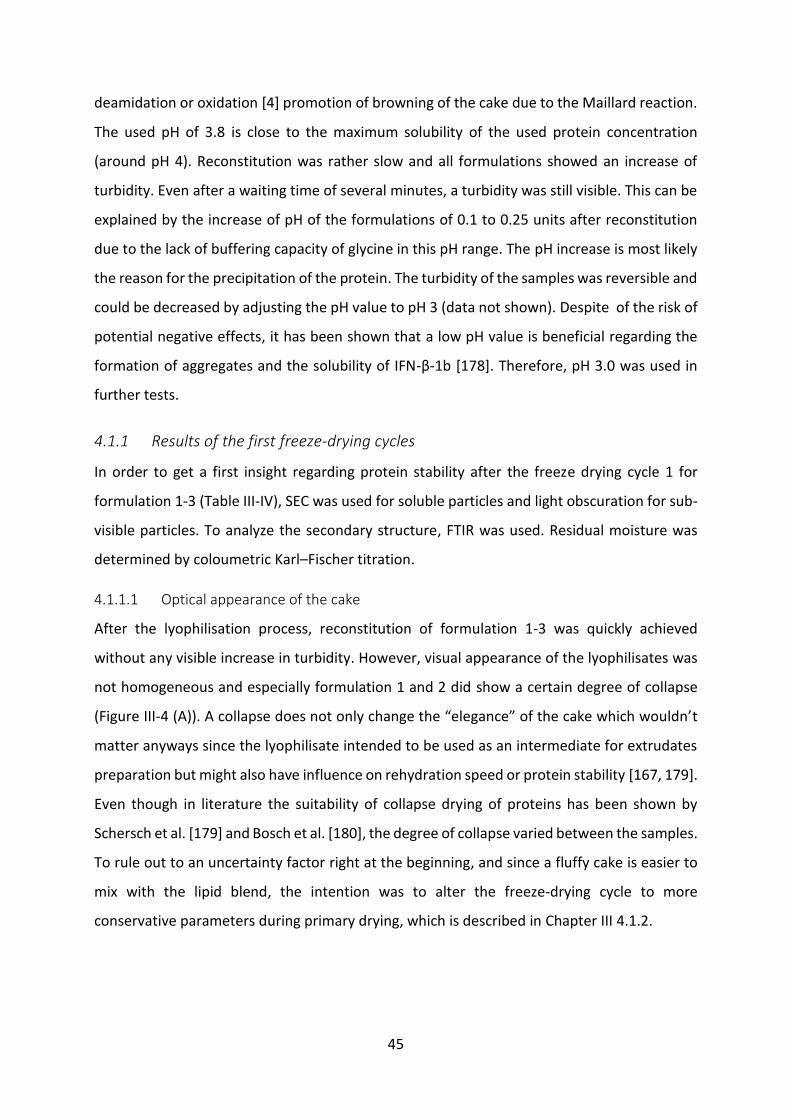
45
deamidation or oxidation [4] promotion of browning of the cake due to the Maillard reaction.
The used pH of 3.8 is close to the maximum solubility of the used protein concentration
(around pH 4). Reconstitution was rather slow and all formulations showed an increase of
turbidity. Even after a waiting time of several minutes, a turbidity was still visible. This can be
explained by the increase of pH of the formulations of 0.1 to 0.25 units after reconstitution
due to the lack of buffering capacity of glycine in this pH range. The pH increase is most likely
the reason for the precipitation of the protein. The turbidity of the samples was reversible and
could be decreased by adjusting the pH value to pH 3 (data not shown). Despite of the risk of
potential negative effects, it has been shown that a low pH value is beneficial regarding the
formation of aggregates and the solubility of IFN-β-1b [178]. Therefore, pH 3.0 was used in
further tests.
4.1.1 Results of the first freeze-drying cycles
In order to get a first insight regarding protein stability after the freeze drying cycle 1 for
formulation 1-3 (Table III-IV), SEC was used for soluble particles and light obscuration for sub-
visible particles. To analyze the secondary structure, FTIR was used. Residual moisture was
determined by coloumetric Karl–Fischer titration.
4.1.1.1 Optical appearance of the cake
After the lyophilisation process, reconstitution of formulation 1-3 was quickly achieved
without any visible increase in turbidity. However, visual appearance of the lyophilisates was
not homogeneous and especially formulation 1 and 2 did show a certain degree of collapse
(Figure III-4 (A)). A collapse does not only change the “elegance” of the cake which wouldn’t
matter anyways since the lyophilisate intended to be used as an intermediate for extrudates
preparation but might also have influence on rehydration speed or protein stability [167, 179].
Even though in literature the suitability of collapse drying of proteins has been shown by
Schersch et al. [179] and Bosch et al. [180], the degree of collapse varied between the samples.
To rule out to an uncertainty factor right at the beginning, and since a fluffy cake is easier to
mix with the lipid blend, the intention was to alter the freeze-drying cycle to more
conservative parameters during primary drying, which is described in Chapter III 4.1.2.
46
Figure III-4 Visual inspection of the lyophilisates after using freeze-drying cycle 1 (top row (A)) and a representative selection of the cake of formulations 4-6 using freeze-drying cycle 2 (B). For the exact composition see Table III-IV.
4.1.1.2 Protein stability: Secondary structure
IR-spectroscopy is a well-established method for the analysis of secondary structure of
polypeptides and proteins to determine protein stability. Peptide groups give up to nine
characteristic bands in the IR-spectrum. The major bands of the protein infrared spectrum are
the amide I and amide II bands. While the amide I band (between a wavenumber of 1600 and
1700 cm-1) is mainly associated with the C=O stretching vibration and is directly related to the
backbone conformation, the amide II band (about 1550 cm-1) results from the N-H bending
vibration and from the C-N stretching vibration. The shape of the amide I band of globular
proteins is the most sensitive spectral region for the protein secondary structure. Within the
amide I band, the area around 1640-1660 cm-1 is assigned to α-helical structures of the protein
while the area around 1620-1630 cm-1 represents β-sheet structures [181, 182]. Regarding
secondary structure, no major differences were detected between the three tested
formulations (Figure III-5).
Formulation 1, Cycle 1 Formulation 2, Cycle 1 Formulation 3, Cycle 1
Formulation 4, Cycle 2 Formulation 5, Cycle 2 Formulation 6, Cycle 2
A
B

47
wavenumber [cm-1]
1580160016201640166016801700
reference
Sample 1
Sample 2
Sample 3
Figure III-5 Vector-normalized second derivative of the FTIR spectrum of 1.0 mg/ml native Interferon in 20 mM glycine buffer pH 3.0 (reference) in comparison with the spectra of formulation 1-3 after lyophilisation and reconstitution
All lyophilized samples showed similar spectra. Slight differences can be seen comparing the
band around 1654 cm-1 in comparison with the reference protein solution. The slight shift
might indicate heterogeneity of intramolecular α-helix structures between the reference
sample and the lyophilized samples. Formulation 3 showed also a slight increase in intensity
around 1621 cm-1 which indicates an increase of intramolecular β-sheet structures of the
protein. According to literature, an increase of intermolecular β-sheet can be attributed to
aggregated protein [181].
4.1.1.3 Protein stability: particle formation and aggregation
Already the interferon-β-1b raw material (data not shown) and the desalted IFN-β-1b
contained monomers (band between 14.4 and 21.5 kDa), dimers (36 kDa) and trimers (approx.
55 kDa) that were confirmed by SDS-PAGE (Figure III-6 A) and also by SE-HPLC (Figure III-6 B).
SEC analysis (Figure III-6 B) and SDS-PAGE (Figure III-6 A) indicated no considerable increase
of soluble aggregates after lyophilisation. Also the protein recovery of all samples was
between 95-103 % (data not shown). It should be considered that the addition of 0.1 % SDS in
the running buffer, which is mandatory to perform SEC runs, is likely to veil some aggregates.
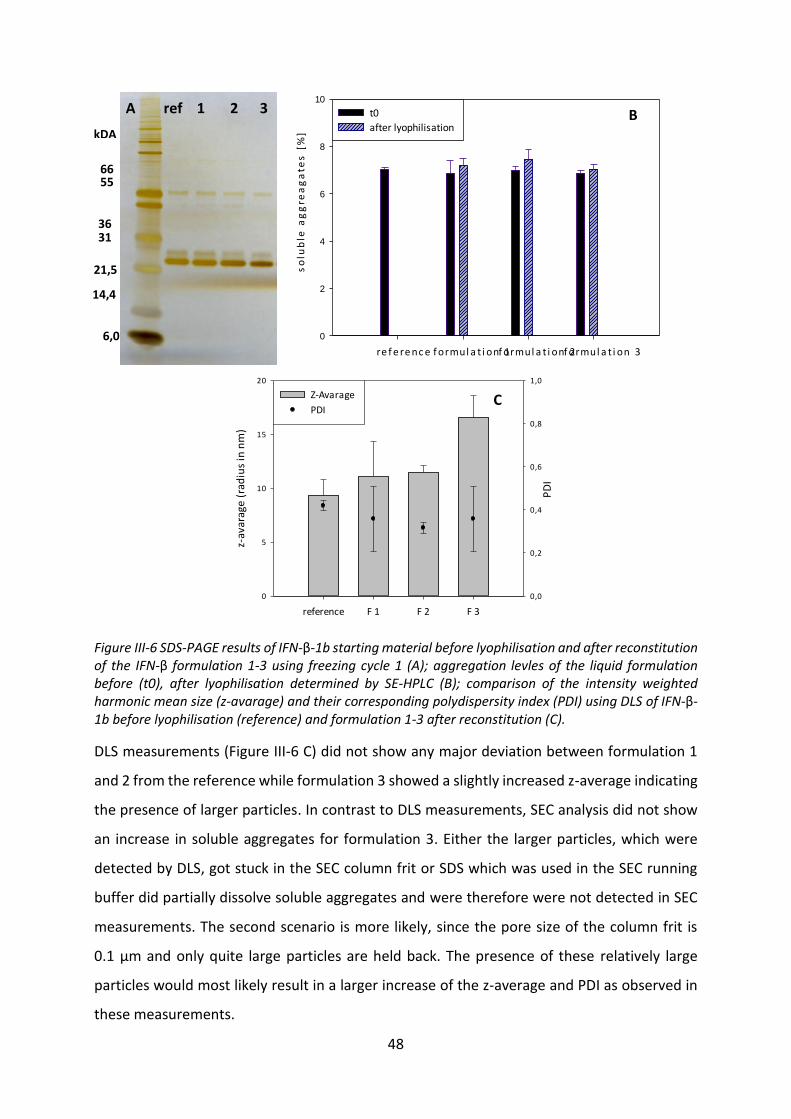
48
re f e re nc e f ormul a t i on 1f ormul a t i on 2f ormul a t i on 3
so
lub
le a
gg
rea
ga
tes
[%
]
0
2
4
6
8
10
t0
after lyophilisation
reference F 1 F 2 F 3
z-av
arag
e (
rad
ius
in n
m)
0
5
10
15
20
PD
I
0,0
0,2
0,4
0,6
0,8
1,0
Z-Avarage
PDI
Figure III-6 SDS-PAGE results of IFN-β-1b starting material before lyophilisation and after reconstitution of the IFN-β formulation 1-3 using freezing cycle 1 (A); aggregation levles of the liquid formulation before (t0), after lyophilisation determined by SE-HPLC (B); comparison of the intensity weighted harmonic mean size (z-avarage) and their corresponding polydispersity index (PDI) using DLS of IFN-β-1b before lyophilisation (reference) and formulation 1-3 after reconstitution (C).
DLS measurements (Figure III-6 C) did not show any major deviation between formulation 1
and 2 from the reference while formulation 3 showed a slightly increased z-average indicating
the presence of larger particles. In contrast to DLS measurements, SEC analysis did not show
an increase in soluble aggregates for formulation 3. Either the larger particles, which were
detected by DLS, got stuck in the SEC column frit or SDS which was used in the SEC running
buffer did partially dissolve soluble aggregates and were therefore were not detected in SEC
measurements. The second scenario is more likely, since the pore size of the column frit is
0.1 µm and only quite large particles are held back. The presence of these relatively large
particles would most likely result in a larger increase of the z-average and PDI as observed in
these measurements.
6,0
66
36 31
55
21,5
14,4
kDA
A ref 1 2 3 B
C
49
4.1.2 Freeze-drying cycle II: Optimization of the formulation and freeze-drying cycle
To improve the collapse of the cake (Chapter III 4.1.1.1) and to achieve more reproducible
results, the parameters of the freeze-drying cycle were slightly adjusted. Besides using more
conservative parameters during primary drying (reduction from -15 °C to -25 °C) the duration
of the primary drying step was also increased from 20 to 30 h for the freeze-drying cycle 2.
Even though SEC- and SDS-PAGE-analysis did not show an increase of aggregates after
lyophilisation, a small trend regarding aggregation can be seen in the FTIR-spectrum and in
DLS analysis especially in formulation 3. Furthermore, all tested formulations showed a small
deviation in the FTIR-spectrum around 1654 cm-1 in comparison with the reference protein
solution. Therefore, the protein:sugar-ratio was increased, and additionally the influence of
polysorbate 20 on the basis of the trehalose formulation (formulation 2) on protein stability
(composition of formulation 4-6 see Table III-IV) was investigated. Furthermore, the freeze-
drying cycle was slightly modified (Chapter III 2.2.11).
4.1.2.1 Optical appearance of the cake and residual moisture
After lyophilisation with freeze-drying cycle 2, the visual inspection of the cakes of the new
formulations (formulation 4-6) did improve significantly and also a good reproducibility of the
cake appearance over the total shelf was achieved (Figure III-4 B). Reconstitution of all
lyophilisates was fast and without visible turbidity.
By the prolongation of the primary drying step the lower temperature during primary drying
was more than compensated. Using the cycle 2, the residual moisture could be decreased
(Table III-V). The glass transition temperature respectively the melting temperature of the
lyophilisate was also determined using differential scanning calorimetry.
Table III-V Residual moisture of the lyophilisates determined by Karl-Fischer direct injection method with methanol
formulation (used polyol) residual moisture freeze-drying
cycle
glass transition temperature (Tg)/
melting temperature (Tm)
1 (mannitol) 1.60 % ± 0.75 1 138.0 °C ± 1.83 (Tm)
2 (trehalose) 1.24 % ± 0.07 1 89.3 °C ± 1.41 (Tg)
3 (sucrose) 0.99 % ± 0.06 1 39.0 °C ± 0.99 (Tg)
4 (trehalose) 0.79 % ± 0.22 2 88.1 °C ± 1.37 (Tg)
5 (trehalose) 0.82 % ± 0.15 2 89.7 °C ± 1.69(Tg)
6 (trehalose) 0.73 % ± 0.08 2 88.4 °C ± 1.55 (Tg)
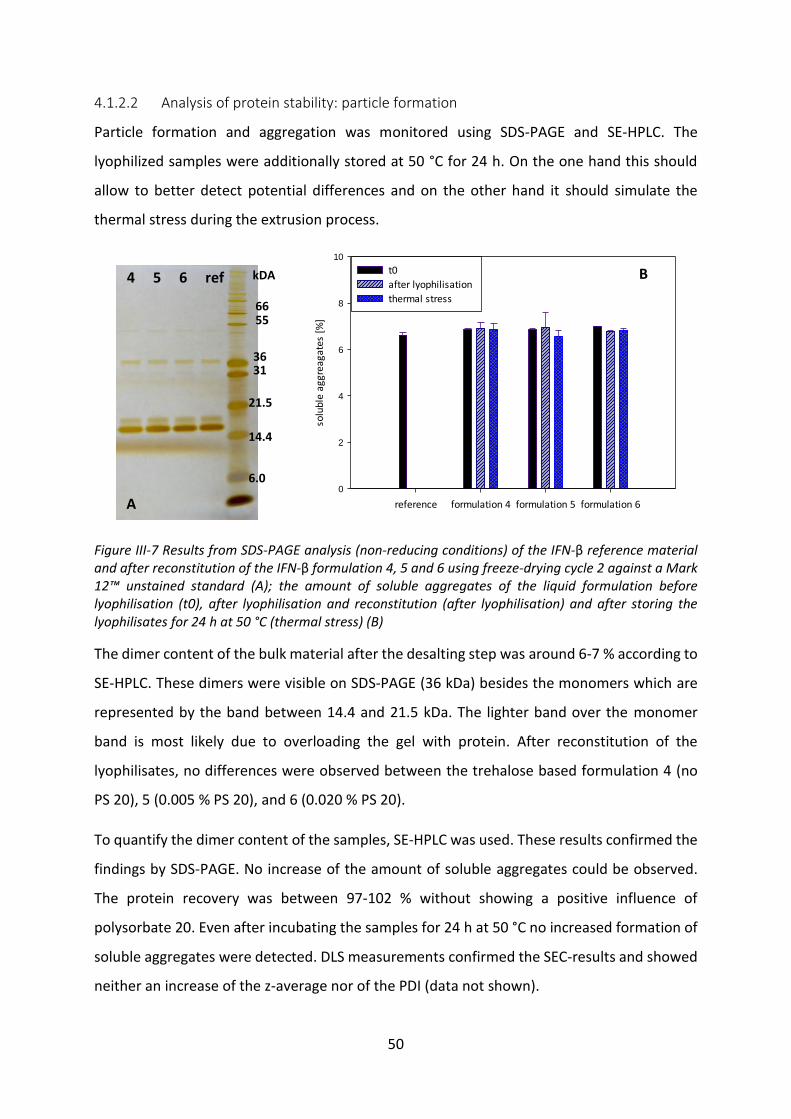
50
4.1.2.2 Analysis of protein stability: particle formation
Particle formation and aggregation was monitored using SDS-PAGE and SE-HPLC. The
lyophilized samples were additionally stored at 50 °C for 24 h. On the one hand this should
allow to better detect potential differences and on the other hand it should simulate the
thermal stress during the extrusion process.
reference formulation 4 formulation 5 formulation 6
solu
ble
aggr
eaga
tes
[%]
0
2
4
6
8
10
t0
after lyophilisation
thermal stress
Figure III-7 Results from SDS-PAGE analysis (non-reducing conditions) of the IFN-β reference material and after reconstitution of the IFN-β formulation 4, 5 and 6 using freeze-drying cycle 2 against a Mark 12™ unstained standard (A); the amount of soluble aggregates of the liquid formulation before lyophilisation (t0), after lyophilisation and reconstitution (after lyophilisation) and after storing the lyophilisates for 24 h at 50 °C (thermal stress) (B)
The dimer content of the bulk material after the desalting step was around 6-7 % according to
SE-HPLC. These dimers were visible on SDS-PAGE (36 kDa) besides the monomers which are
represented by the band between 14.4 and 21.5 kDa. The lighter band over the monomer
band is most likely due to overloading the gel with protein. After reconstitution of the
lyophilisates, no differences were observed between the trehalose based formulation 4 (no
PS 20), 5 (0.005 % PS 20), and 6 (0.020 % PS 20).
To quantify the dimer content of the samples, SE-HPLC was used. These results confirmed the
findings by SDS-PAGE. No increase of the amount of soluble aggregates could be observed.
The protein recovery was between 97-102 % without showing a positive influence of
polysorbate 20. Even after incubating the samples for 24 h at 50 °C no increased formation of
soluble aggregates were detected. DLS measurements confirmed the SEC-results and showed
neither an increase of the z-average nor of the PDI (data not shown).
6.0
66
36 31
55
21.5
14.4
kDA 4 5 6 ref
A
B
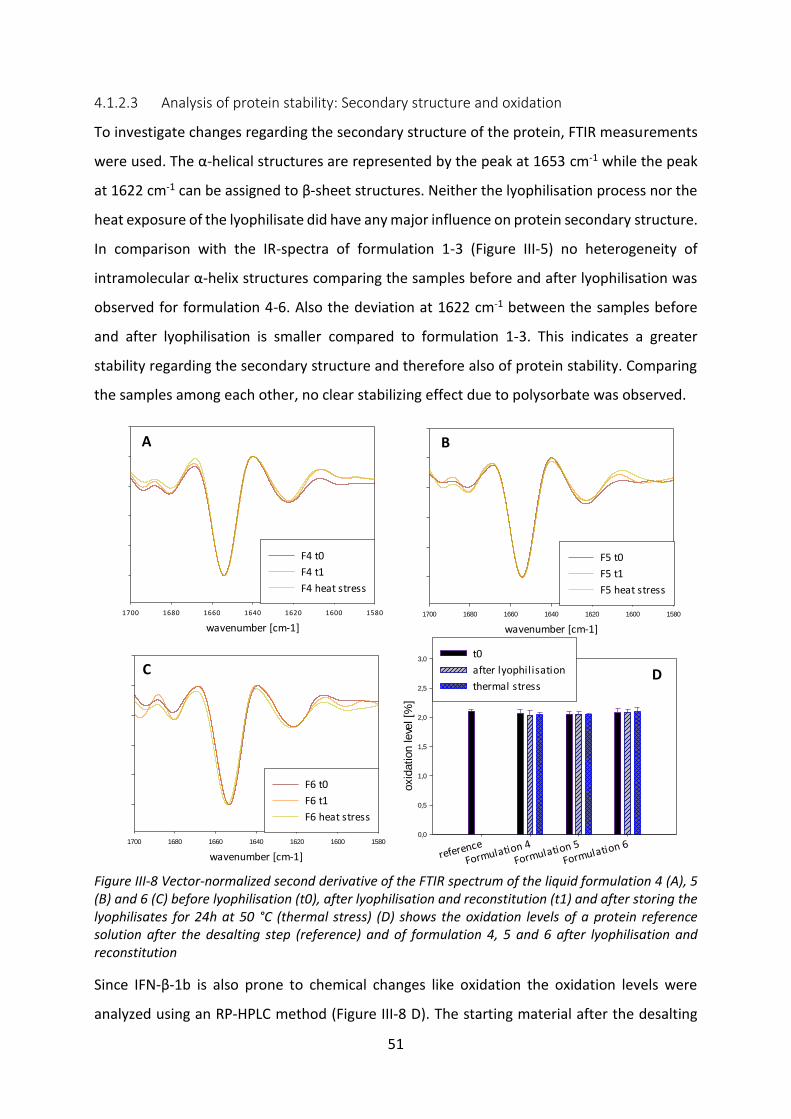
51
4.1.2.3 Analysis of protein stability: Secondary structure and oxidation
To investigate changes regarding the secondary structure of the protein, FTIR measurements
were used. The α-helical structures are represented by the peak at 1653 cm-1 while the peak
at 1622 cm-1 can be assigned to β-sheet structures. Neither the lyophilisation process nor the
heat exposure of the lyophilisate did have any major influence on protein secondary structure.
In comparison with the IR-spectra of formulation 1-3 (Figure III-5) no heterogeneity of
intramolecular α-helix structures comparing the samples before and after lyophilisation was
observed for formulation 4-6. Also the deviation at 1622 cm-1 between the samples before
and after lyophilisation is smaller compared to formulation 1-3. This indicates a greater
stability regarding the secondary structure and therefore also of protein stability. Comparing
the samples among each other, no clear stabilizing effect due to polysorbate was observed.
wavenumber [cm-1]
1580160016201640166016801700
F4 t0
F4 t1
F4 heat stress
wavenumber [cm-1]
1580160016201640166016801700
F5 t0
F5 t1
F5 heat stress
wavenumber [cm-1]
1580160016201640166016801700
F6 t0
F6 t1
F6 heat stress
reference
Formulation 4
Formulation 5
Formulation 6
oxid
ation leve
l [%
]
0,0
0,5
1,0
1,5
2,0
2,5
3,0t0
after lyophilisation
thermal stress
Figure III-8 Vector-normalized second derivative of the FTIR spectrum of the liquid formulation 4 (A), 5 (B) and 6 (C) before lyophilisation (t0), after lyophilisation and reconstitution (t1) and after storing the lyophilisates for 24h at 50 °C (thermal stress) (D) shows the oxidation levels of a protein reference solution after the desalting step (reference) and of formulation 4, 5 and 6 after lyophilisation and reconstitution
Since IFN-β-1b is also prone to chemical changes like oxidation the oxidation levels were
analyzed using an RP-HPLC method (Figure III-8 D). The starting material after the desalting
A
D
B
C
52
step had an oxidation level of 2.1 %. No major increase or a trend even after the thermal stress
regarding oxidation was visible.
4.1.3 Conclusion
As already stated in literature [163], the formulation pH is very important for IFN-β-1b, when
developing a HSA free formulation. A pH of 3.8 resulted in a slow reconstitution speed of the
lyophilisates and protein aggregation occurred because of the observed pH shift resulting in a
decrease in protein solubility. Lowering the formulation pH value to pH 3 improved the
reconstitution speed and no turbidity was visible after reconstitution.
The visual appearance of the lyophilisates and its reproducibility was improved using a slightly
modified freeze-drying cycle by reducing the temperature during primary drying. The increase
of the primary drying time resulted in a decrease of the residual moisture below 1 % in all
tested samples which is beneficial regarding storage stability.
Formulation 1-3 showed slight deviations of the IR-spectra in comparison with the reference
solution of the protein. By increasing the protein:sugar-ratio (from 1:5 to 1:7.7) and modifying
the freeze-drying cycle the secondary structure before and after lyophilisation was
maintained.
Since formulation 4 without any polysorbate was already performing relatively well, no clear
positive effect on protein stability of polysorbate 20 was observed in the tested formulation 5
and 6. Therefore, the formulation without polysorbate was considered suitable as an
intermediate and is further used in the preparation of the implants.
53
4.2 Preparation of extrudates
Extrudates were prepared with a twin-screw-extruder according to Herrmann [90, 168] and
Sax [88]. The implants were based on a mixture of tri- and monoglycerides composed of a high
melting lipid, Dynasan 118 (glycerol tristearin, melting point: 72.0 °C), and the low melting
point lipids Dynasan 112 (glycerol trilaurin, melting point: 45.0 °C) or H12 (mixture of
triglycerides consisting of lauric, myristic and palmitic acid, melting point: 37.9 °C).
The used Haake MiniLab Micro Rheology Compounder is designed for small amounts.
Nonetheless, approximately 5 g of a lipid blend is necessary to achieve a sufficient amount of
useable extrudates since the “dead volume” is approximately 2.2 g of lipid. Furthermore, the
first 10 cm of the strand were discarded because of different density and a less homogeneous
appearance of the extrudates in comparison with the later parts [88]. To reduce the wastage
of IFN-β-1b during extrusion the suitability of feeding two different blends directly after each
other was tested. The first one includes the protein lyophilisate, the second one is a pure lipid
blend which was used to push the protein containing material out of the extruder.
To investigate the degree of mixing between these two blends, a test was conducted by
feeding 2.5 g placebo lipids and 2.5 g of lipids containing methylene blue. The mixing zone is
relatively small and the two blends are clearly separated. Since also the reproducibility was
reliable (33 ± 2 cm), it was considered as a suitable method to reduce the protein usage during
extrusion (Figure III-9 C). In the next extrusion processes, 2.5 g of the lipid blend including the
lyophilisate was fed into the extruder. Directly after the last parts of the protein containing
blend vanished in the extruder, the placebo blend was added. After discarding the first 10 cm
of the strand only the parts between 10 and 25 cm were used to provide a sufficient difference
and buffer area.
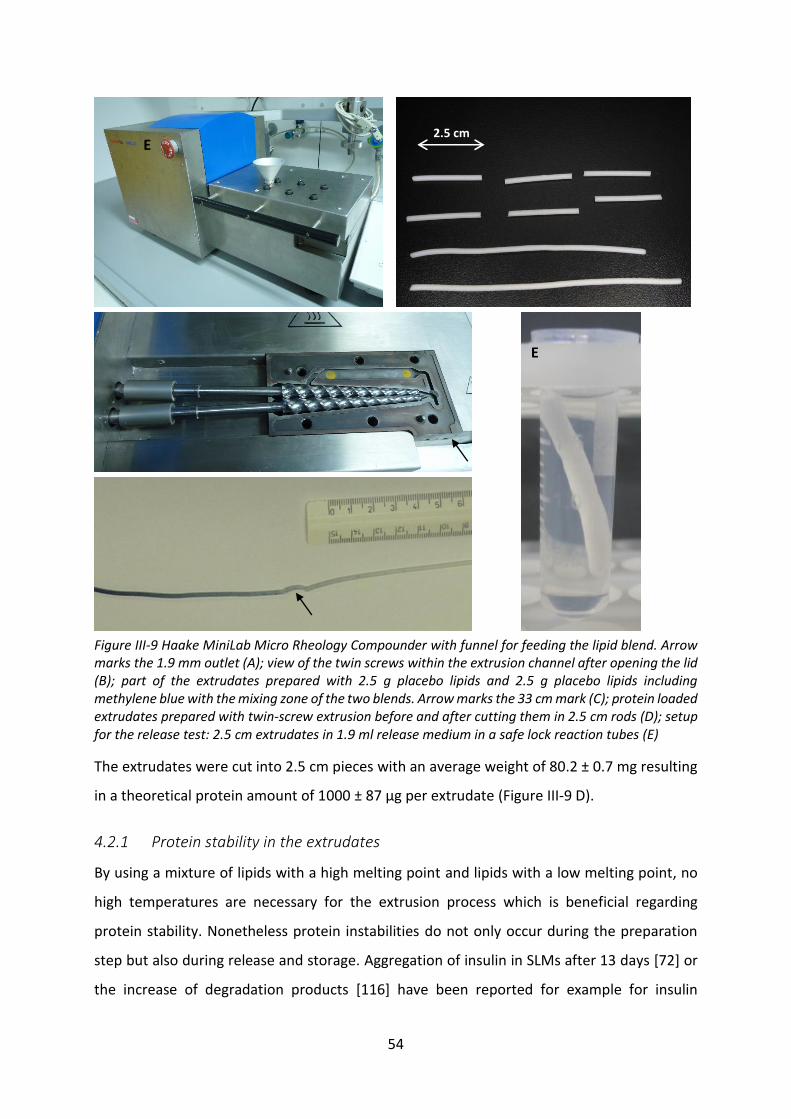
54
Figure III-9 Haake MiniLab Micro Rheology Compounder with funnel for feeding the lipid blend. Arrow marks the 1.9 mm outlet (A); view of the twin screws within the extrusion channel after opening the lid (B); part of the extrudates prepared with 2.5 g placebo lipids and 2.5 g placebo lipids including methylene blue with the mixing zone of the two blends. Arrow marks the 33 cm mark (C); protein loaded extrudates prepared with twin-screw extrusion before and after cutting them in 2.5 cm rods (D); setup for the release test: 2.5 cm extrudates in 1.9 ml release medium in a safe lock reaction tubes (E)
The extrudates were cut into 2.5 cm pieces with an average weight of 80.2 ± 0.7 mg resulting
in a theoretical protein amount of 1000 ± 87 µg per extrudate (Figure III-9 D).
4.2.1 Protein stability in the extrudates
By using a mixture of lipids with a high melting point and lipids with a low melting point, no
high temperatures are necessary for the extrusion process which is beneficial regarding
protein stability. Nonetheless protein instabilities do not only occur during the preparation
step but also during release and storage. Aggregation of insulin in SLMs after 13 days [72] or
the increase of degradation products [116] have been reported for example for insulin
B
C
E
2.5 cm
A D
E
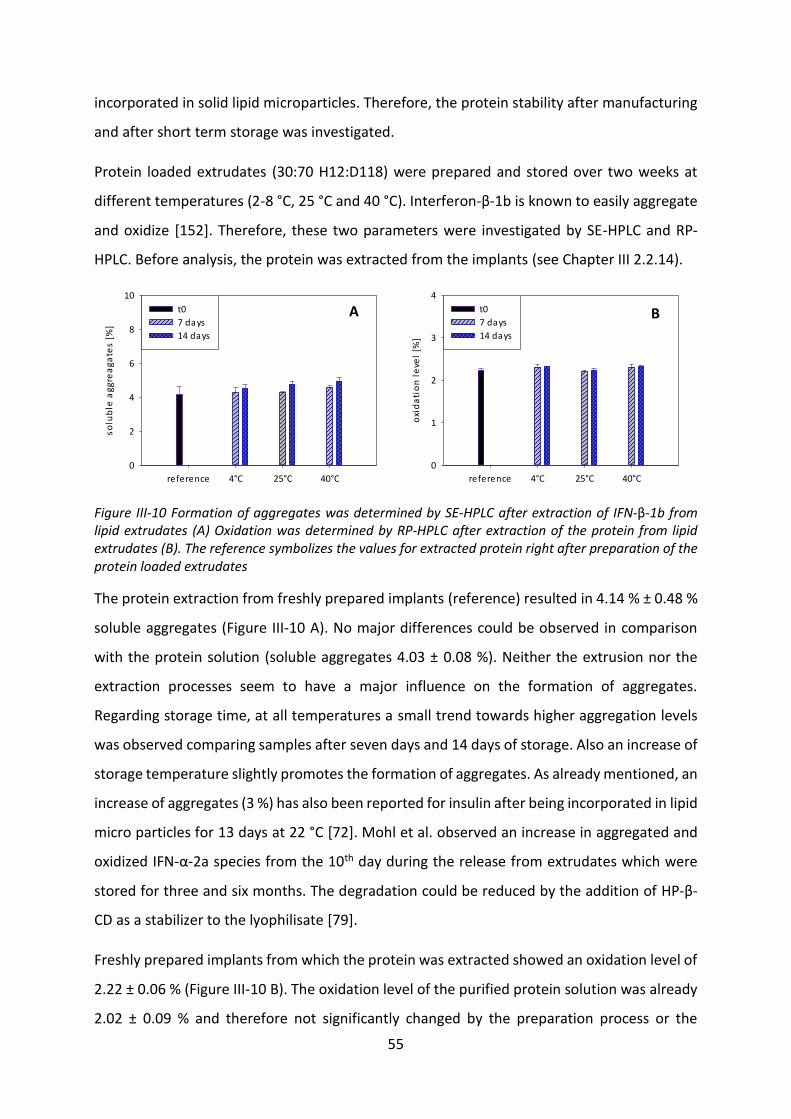
55
incorporated in solid lipid microparticles. Therefore, the protein stability after manufacturing
and after short term storage was investigated.
Protein loaded extrudates (30:70 H12:D118) were prepared and stored over two weeks at
different temperatures (2-8 °C, 25 °C and 40 °C). Interferon-β-1b is known to easily aggregate
and oxidize [152]. Therefore, these two parameters were investigated by SE-HPLC and RP-
HPLC. Before analysis, the protein was extracted from the implants (see Chapter III 2.2.14).
reference 4°C 25°C 40°C
oxi
da
tio
n l
eve
l [%
]
0
1
2
3
4
t0
7 days
14 days
reference 4°C 25°C 40°C
so
lub
le a
gg
rea
ga
tes
[%
]
0
2
4
6
8
10
t0
7 days
14 days
Figure III-10 Formation of aggregates was determined by SE-HPLC after extraction of IFN-β-1b from lipid extrudates (A) Oxidation was determined by RP-HPLC after extraction of the protein from lipid extrudates (B). The reference symbolizes the values for extracted protein right after preparation of the protein loaded extrudates
The protein extraction from freshly prepared implants (reference) resulted in 4.14 % ± 0.48 %
soluble aggregates (Figure III-10 A). No major differences could be observed in comparison
with the protein solution (soluble aggregates 4.03 ± 0.08 %). Neither the extrusion nor the
extraction processes seem to have a major influence on the formation of aggregates.
Regarding storage time, at all temperatures a small trend towards higher aggregation levels
was observed comparing samples after seven days and 14 days of storage. Also an increase of
storage temperature slightly promotes the formation of aggregates. As already mentioned, an
increase of aggregates (3 %) has also been reported for insulin after being incorporated in lipid
micro particles for 13 days at 22 °C [72]. Mohl et al. observed an increase in aggregated and
oxidized IFN-α-2a species from the 10th day during the release from extrudates which were
stored for three and six months. The degradation could be reduced by the addition of HP-β-
CD as a stabilizer to the lyophilisate [79].
Freshly prepared implants from which the protein was extracted showed an oxidation level of
2.22 ± 0.06 % (Figure III-10 B). The oxidation level of the purified protein solution was already
2.02 ± 0.09 % and therefore not significantly changed by the preparation process or the
B A
56
extraction process. Neither the storage time nor the storage temperatures seem to have a
major influence on protein oxidation.
Since no major protein degradation during short term storage at elevated temperatures was
detected, the next step was the execution of a first in vitro release test.
4.3 Release buffer
To successfully release a molecule from a depot form, the solubility in the release medium is
crucial. To avoid solubility of the molecule being the driving factor influencing the release
kinetic, drug concentration in the release medium does not exceed 10-20 % of its solubility
(sink condition) [183]. Usually, PBS-buffer pH 7-7.4 is used as a release medium since the
osmolarity and ion concentration match those in the human body [77, 88, 90, 165, 184]. Due
to its hydrophobicity, IFN-β-1b can only be solubilized at neutral pH values in a range of 1-
5 mg/ml in the presence of surfactants such as 0.1 % of the anionic surfactant SDS (Chapter I
3.3.2 and Chapter I 3.3.3)
As the release test is conducted at a physiological temperature (37 °C) the solubility and
stability in solution is a very important factor since protein instabilities like aggregation usually
increase with elevated temperatures [51]. Other options include using a pH value of the
release medium above pH 10 or at low pH values. It is reported that IFN-β-1b is relatively
stable in a low ionic strength solution at pH 2 even at 37 °C (loss of 20 % of its antiviral activity
after 10 days). The addition of the physiological amount of 0.15 M NaCl resulted in a loss of
antiviral activity of 80 % after 10 days and an increase of oligomers were observed. These
oligomers were monomerized and reactivated by the addition of 1 % SDS [185]. The addition
of a surfactant is necessary to retain the activity of IFN-β-1b in the presence of physiological
amounts of salts even at low pH values that generally favor the stability and solubility of IFN-
β-1b. To be as close to physiological conditions as possible, as many physiological conditions
(salt concentration, temperature, pH value) as possible were combined.
4.3.1 Protein solubility
After a literature screening several promising surfactants in different concentrations were
tested under the specific release conditions (37 °C, physiological salt concentration, pH of 7.4)
regarding their potential to solubilize IFN-β-1b (Figure III-11). The solubility was determined
by the assessment of the protein recovery in the supernatant of the samples after different
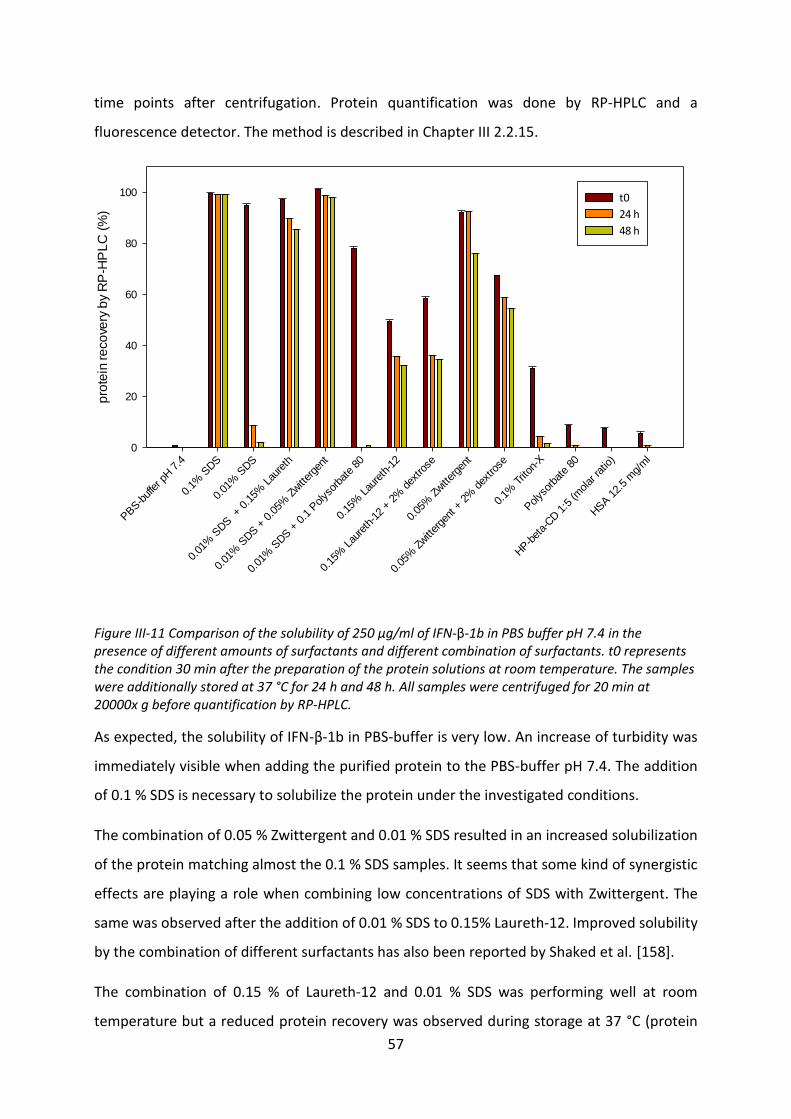
57
time points after centrifugation. Protein quantification was done by RP-HPLC and a
fluorescence detector. The method is described in Chapter III 2.2.15.
PBS-b
uffer p
H 7
.4
0.1%
SDS
0.01
% S
DS
0.01
% S
DS +
0.1
5% L
aure
th
0.01
% S
DS +
0.0
5% Z
witt
erge
nt
0.01
% S
DS +
0.1
Polys
orba
te 8
0
0.15
% L
aure
th-1
2
0.15
% L
aure
th-1
2 + 2
% d
extro
se
0.05
% Z
witt
erge
nt
0.05
% Z
witt
erge
nt +
2%
dex
trose
0.1%
Trit
on-X
Polys
orba
te 8
0
HP-b
eta-
CD 1
:5 (m
olar
ratio
)
HSA 1
2.5
mg/
ml
pro
tein
re
co
very
by
RP
-HP
LC
(%
)
0
20
40
60
80
100 t0
24 h
48 h
Figure III-11 Comparison of the solubility of 250 µg/ml of IFN-β-1b in PBS buffer pH 7.4 in the presence of different amounts of surfactants and different combination of surfactants. t0 represents the condition 30 min after the preparation of the protein solutions at room temperature. The samples were additionally stored at 37 °C for 24 h and 48 h. All samples were centrifuged for 20 min at 20000x g before quantification by RP-HPLC.
As expected, the solubility of IFN-β-1b in PBS-buffer is very low. An increase of turbidity was
immediately visible when adding the purified protein to the PBS-buffer pH 7.4. The addition
of 0.1 % SDS is necessary to solubilize the protein under the investigated conditions.
The combination of 0.05 % Zwittergent and 0.01 % SDS resulted in an increased solubilization
of the protein matching almost the 0.1 % SDS samples. It seems that some kind of synergistic
effects are playing a role when combining low concentrations of SDS with Zwittergent. The
same was observed after the addition of 0.01 % SDS to 0.15% Laureth-12. Improved solubility
by the combination of different surfactants has also been reported by Shaked et al. [158].
The combination of 0.15 % of Laureth-12 and 0.01 % SDS was performing well at room
temperature but a reduced protein recovery was observed during storage at 37 °C (protein
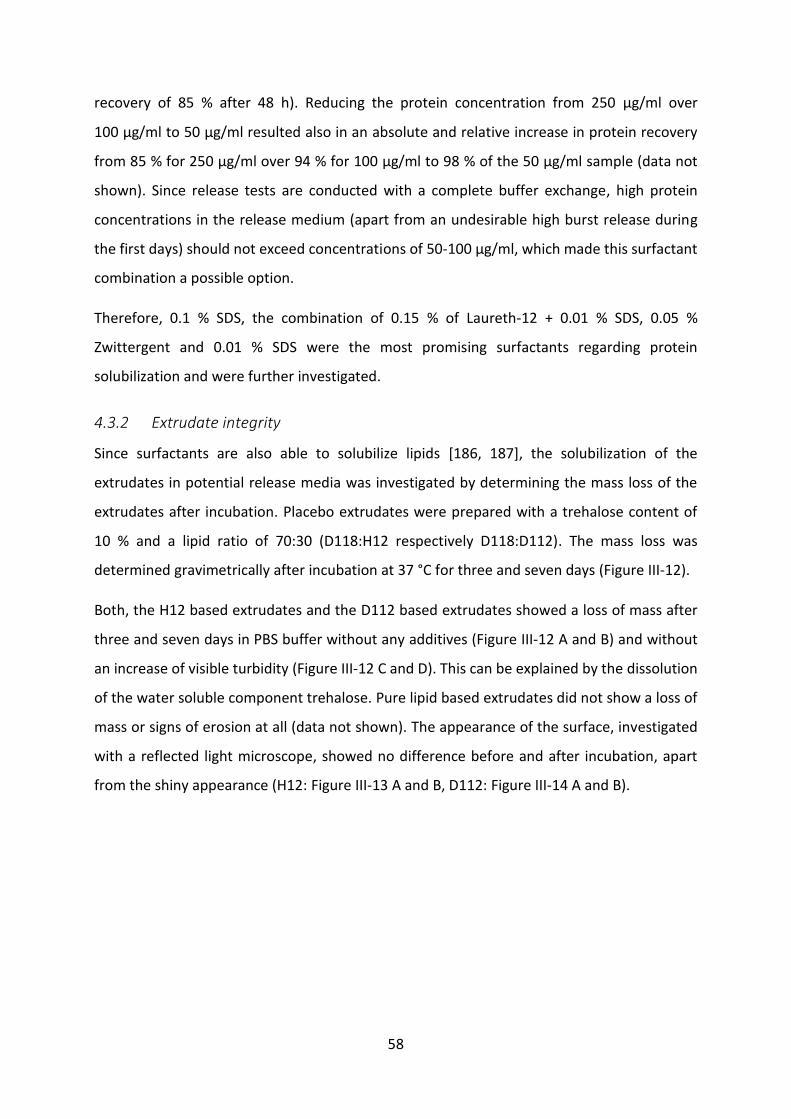
58
recovery of 85 % after 48 h). Reducing the protein concentration from 250 µg/ml over
100 µg/ml to 50 µg/ml resulted also in an absolute and relative increase in protein recovery
from 85 % for 250 µg/ml over 94 % for 100 µg/ml to 98 % of the 50 µg/ml sample (data not
shown). Since release tests are conducted with a complete buffer exchange, high protein
concentrations in the release medium (apart from an undesirable high burst release during
the first days) should not exceed concentrations of 50-100 µg/ml, which made this surfactant
combination a possible option.
Therefore, 0.1 % SDS, the combination of 0.15 % of Laureth-12 + 0.01 % SDS, 0.05 %
Zwittergent and 0.01 % SDS were the most promising surfactants regarding protein
solubilization and were further investigated.
4.3.2 Extrudate integrity
Since surfactants are also able to solubilize lipids [186, 187], the solubilization of the
extrudates in potential release media was investigated by determining the mass loss of the
extrudates after incubation. Placebo extrudates were prepared with a trehalose content of
10 % and a lipid ratio of 70:30 (D118:H12 respectively D118:D112). The mass loss was
determined gravimetrically after incubation at 37 °C for three and seven days (Figure III-12).
Both, the H12 based extrudates and the D112 based extrudates showed a loss of mass after
three and seven days in PBS buffer without any additives (Figure III-12 A and B) and without
an increase of visible turbidity (Figure III-12 C and D). This can be explained by the dissolution
of the water soluble component trehalose. Pure lipid based extrudates did not show a loss of
mass or signs of erosion at all (data not shown). The appearance of the surface, investigated
with a reflected light microscope, showed no difference before and after incubation, apart
from the shiny appearance (H12: Figure III-13 A and B, D112: Figure III-14 A and B).
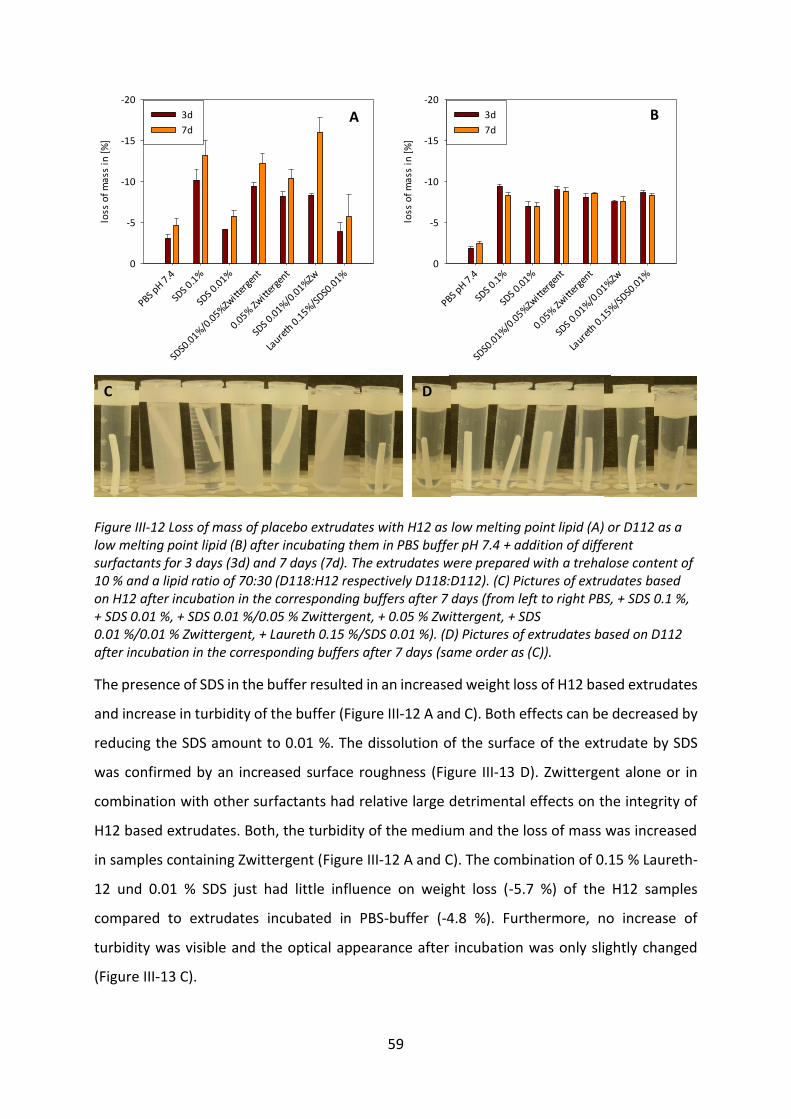
59
PBS pH 7
.4
SDS 0
.1%
SDS 0
.01%
SDS0
.01%/0
.05%Zw
itter
gent
0.05% Zw
itter
gent
SDS 0
.01%/0
.01%Zw
Laure
th 0
.15%/S
DS0.0
1%
loss
of
ma
ss i
n [
%]
-20
-15
-10
-5
0
3d
7d
PBS pH 7
.4
SDS 0
.1%
SDS 0
.01%
SDS0
.01%/0
.05%Zw
itter
gent
0.05% Zw
itter
gent
SDS 0
.01%/0
.01%Zw
Laure
th 0
.15%/S
DS0.0
1%
loss
of
ma
ss i
n [
%]
-20
-15
-10
-5
0
3d
7d
Figure III-12 Loss of mass of placebo extrudates with H12 as low melting point lipid (A) or D112 as a low melting point lipid (B) after incubating them in PBS buffer pH 7.4 + addition of different surfactants for 3 days (3d) and 7 days (7d). The extrudates were prepared with a trehalose content of 10 % and a lipid ratio of 70:30 (D118:H12 respectively D118:D112). (C) Pictures of extrudates based on H12 after incubation in the corresponding buffers after 7 days (from left to right PBS, + SDS 0.1 %, + SDS 0.01 %, + SDS 0.01 %/0.05 % Zwittergent, + 0.05 % Zwittergent, + SDS 0.01 %/0.01 % Zwittergent, + Laureth 0.15 %/SDS 0.01 %). (D) Pictures of extrudates based on D112 after incubation in the corresponding buffers after 7 days (same order as (C)).
The presence of SDS in the buffer resulted in an increased weight loss of H12 based extrudates
and increase in turbidity of the buffer (Figure III-12 A and C). Both effects can be decreased by
reducing the SDS amount to 0.01 %. The dissolution of the surface of the extrudate by SDS
was confirmed by an increased surface roughness (Figure III-13 D). Zwittergent alone or in
combination with other surfactants had relative large detrimental effects on the integrity of
H12 based extrudates. Both, the turbidity of the medium and the loss of mass was increased
in samples containing Zwittergent (Figure III-12 A and C). The combination of 0.15 % Laureth-
12 und 0.01 % SDS just had little influence on weight loss (-5.7 %) of the H12 samples
compared to extrudates incubated in PBS-buffer (-4.8 %). Furthermore, no increase of
turbidity was visible and the optical appearance after incubation was only slightly changed
(Figure III-13 C).
A B
C D
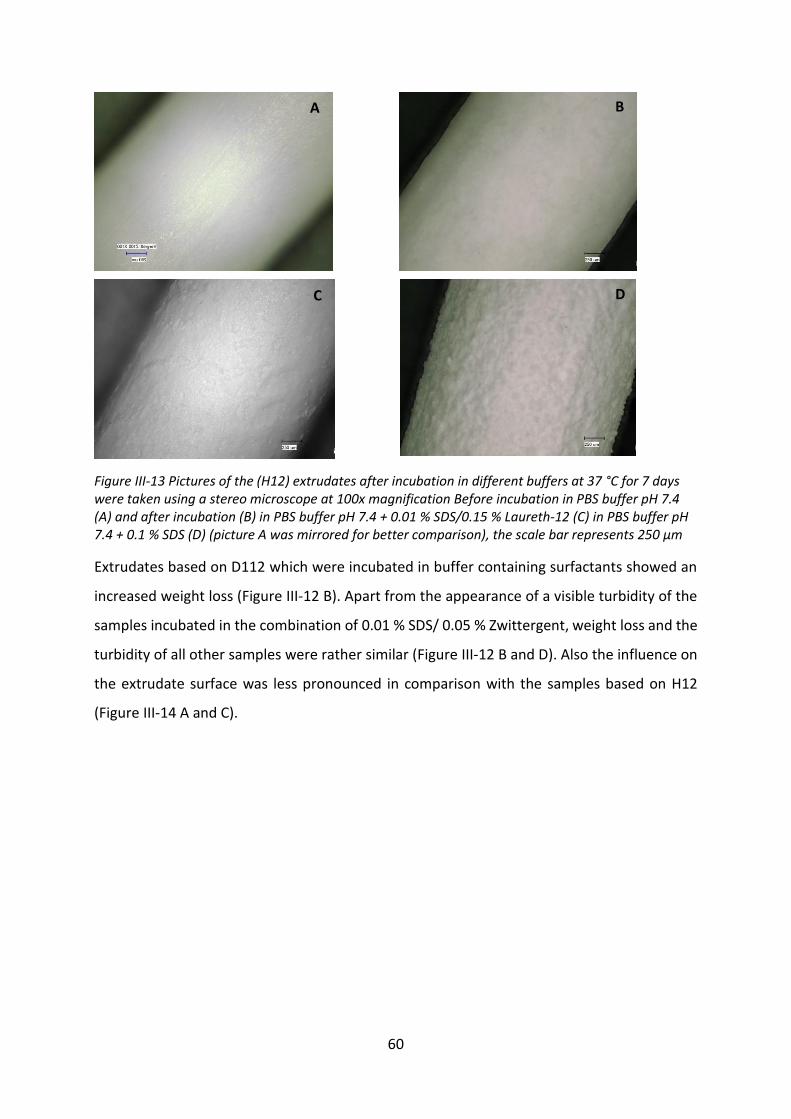
60
Figure III-13 Pictures of the (H12) extrudates after incubation in different buffers at 37 °C for 7 days were taken using a stereo microscope at 100x magnification Before incubation in PBS buffer pH 7.4 (A) and after incubation (B) in PBS buffer pH 7.4 + 0.01 % SDS/0.15 % Laureth-12 (C) in PBS buffer pH 7.4 + 0.1 % SDS (D) (picture A was mirrored for better comparison), the scale bar represents 250 µm
Extrudates based on D112 which were incubated in buffer containing surfactants showed an
increased weight loss (Figure III-12 B). Apart from the appearance of a visible turbidity of the
samples incubated in the combination of 0.01 % SDS/ 0.05 % Zwittergent, weight loss and the
turbidity of all other samples were rather similar (Figure III-12 B and D). Also the influence on
the extrudate surface was less pronounced in comparison with the samples based on H12
(Figure III-14 A and C).
A B
C D
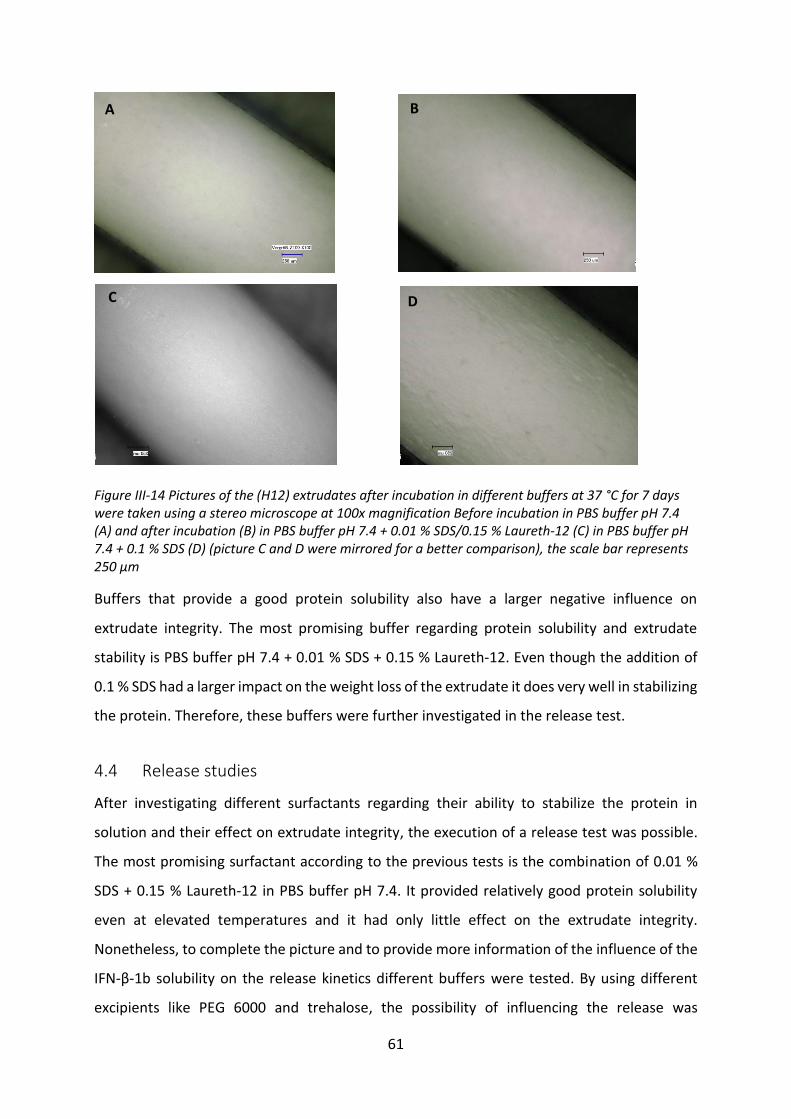
61
Figure III-14 Pictures of the (H12) extrudates after incubation in different buffers at 37 °C for 7 days were taken using a stereo microscope at 100x magnification Before incubation in PBS buffer pH 7.4 (A) and after incubation (B) in PBS buffer pH 7.4 + 0.01 % SDS/0.15 % Laureth-12 (C) in PBS buffer pH 7.4 + 0.1 % SDS (D) (picture C and D were mirrored for a better comparison), the scale bar represents 250 µm
Buffers that provide a good protein solubility also have a larger negative influence on
extrudate integrity. The most promising buffer regarding protein solubility and extrudate
stability is PBS buffer pH 7.4 + 0.01 % SDS + 0.15 % Laureth-12. Even though the addition of
0.1 % SDS had a larger impact on the weight loss of the extrudate it does very well in stabilizing
the protein. Therefore, these buffers were further investigated in the release test.
4.4 Release studies
After investigating different surfactants regarding their ability to stabilize the protein in
solution and their effect on extrudate integrity, the execution of a release test was possible.
The most promising surfactant according to the previous tests is the combination of 0.01 %
SDS + 0.15 % Laureth-12 in PBS buffer pH 7.4. It provided relatively good protein solubility
even at elevated temperatures and it had only little effect on the extrudate integrity.
Nonetheless, to complete the picture and to provide more information of the influence of the
IFN-β-1b solubility on the release kinetics different buffers were tested. By using different
excipients like PEG 6000 and trehalose, the possibility of influencing the release was
A B
C D
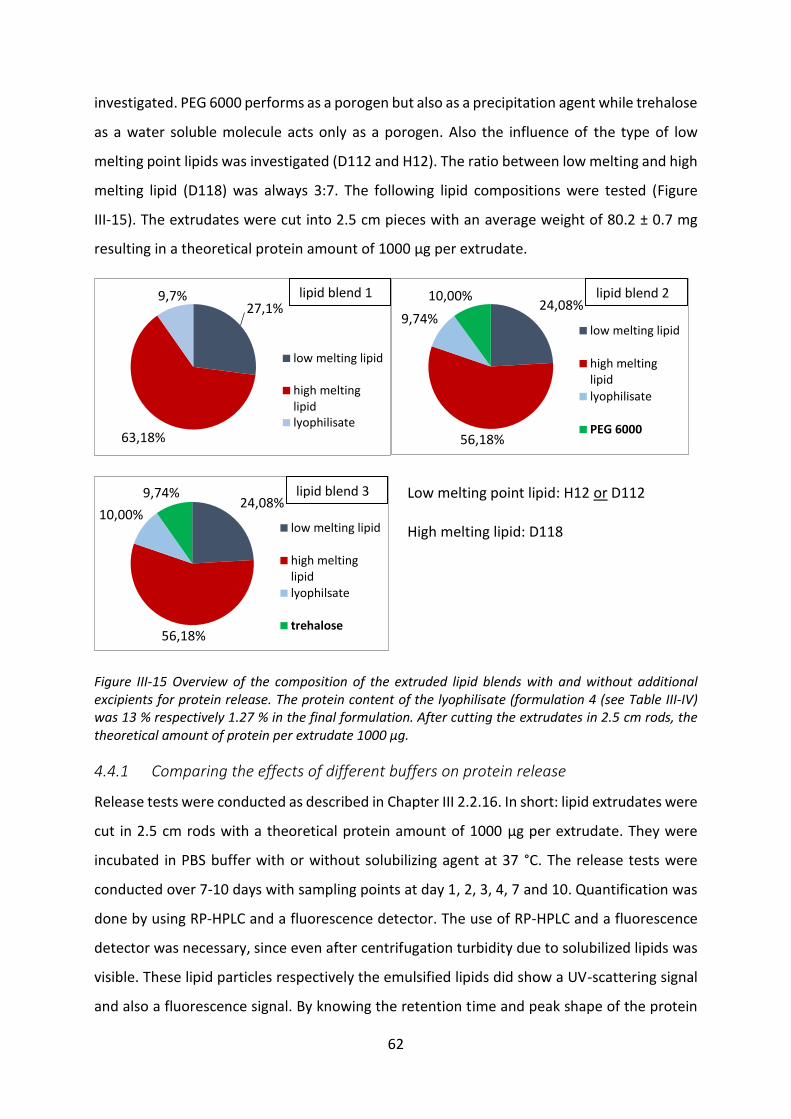
62
investigated. PEG 6000 performs as a porogen but also as a precipitation agent while trehalose
as a water soluble molecule acts only as a porogen. Also the influence of the type of low
melting point lipids was investigated (D112 and H12). The ratio between low melting and high
melting lipid (D118) was always 3:7. The following lipid compositions were tested (Figure
III-15). The extrudates were cut into 2.5 cm pieces with an average weight of 80.2 ± 0.7 mg
resulting in a theoretical protein amount of 1000 µg per extrudate.
Figure III-15 Overview of the composition of the extruded lipid blends with and without additional excipients for protein release. The protein content of the lyophilisate (formulation 4 (see Table III-IV) was 13 % respectively 1.27 % in the final formulation. After cutting the extrudates in 2.5 cm rods, the theoretical amount of protein per extrudate 1000 µg.
4.4.1 Comparing the effects of different buffers on protein release
Release tests were conducted as described in Chapter III 2.2.16. In short: lipid extrudates were
cut in 2.5 cm rods with a theoretical protein amount of 1000 µg per extrudate. They were
incubated in PBS buffer with or without solubilizing agent at 37 °C. The release tests were
conducted over 7-10 days with sampling points at day 1, 2, 3, 4, 7 and 10. Quantification was
done by using RP-HPLC and a fluorescence detector. The use of RP-HPLC and a fluorescence
detector was necessary, since even after centrifugation turbidity due to solubilized lipids was
visible. These lipid particles respectively the emulsified lipids did show a UV-scattering signal
and also a fluorescence signal. By knowing the retention time and peak shape of the protein
27,1%
63,18%
9,7%
low melting lipid
high meltinglipidlyophilisate
24,08%
56,18%
9,74%
10,00%
low melting lipid
high meltinglipid
lyophilisate
PEG 6000
24,08%
56,18%
10,00%
9,74%
low melting lipid
high meltinglipidlyophilsate
trehalose
Low melting point lipid: H12 or D112 High melting lipid: D118
lipid blend 1 lipid blend 2
lipid blend 3
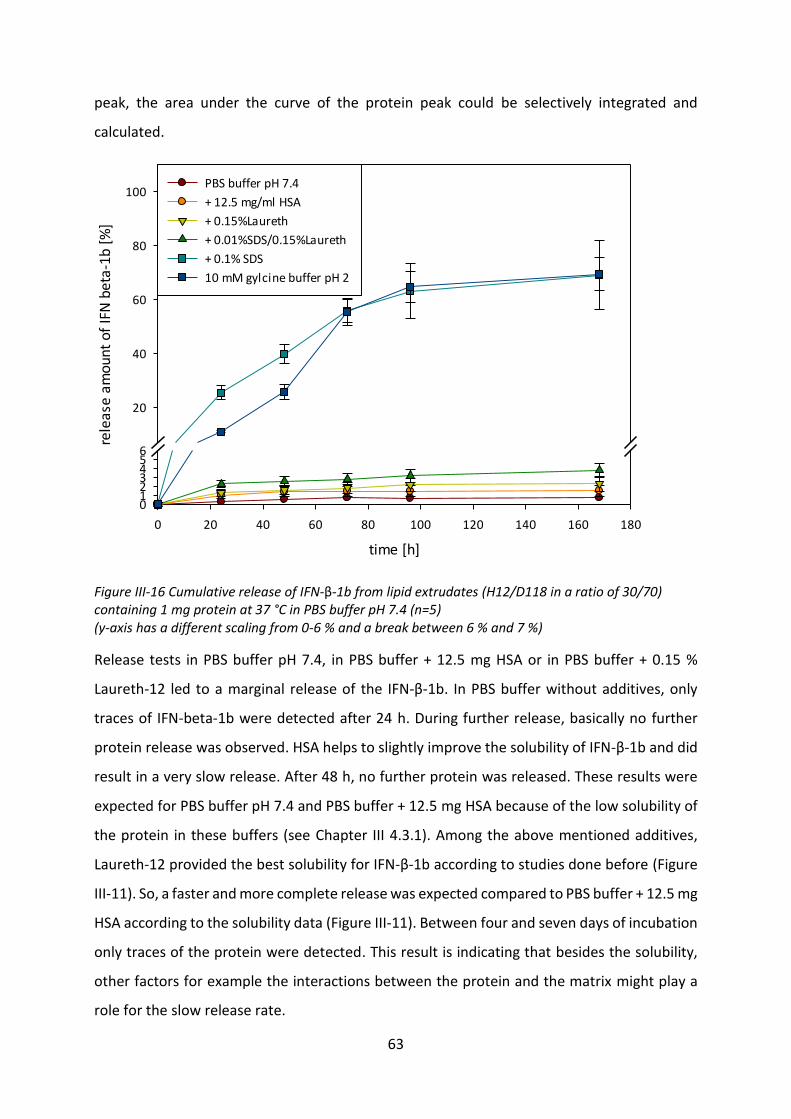
63
peak, the area under the curve of the protein peak could be selectively integrated and
calculated.
time [h]
0 20 40 60 80 100 120 140 160 180
rele
ase
amou
nt o
f IF
N b
eta-
1b [
%]
0123456
20
40
60
80
100PBS buffer pH 7.4
+ 12.5 mg/ml HSA
+ 0.15%Laureth
+ 0.01%SDS/0.15%Laureth
+ 0.1% SDS
10 mM gylcine buffer pH 2
Figure III-16 Cumulative release of IFN-β-1b from lipid extrudates (H12/D118 in a ratio of 30/70) containing 1 mg protein at 37 °C in PBS buffer pH 7.4 (n=5) (y-axis has a different scaling from 0-6 % and a break between 6 % and 7 %)
Release tests in PBS buffer pH 7.4, in PBS buffer + 12.5 mg HSA or in PBS buffer + 0.15 %
Laureth-12 led to a marginal release of the IFN-β-1b. In PBS buffer without additives, only
traces of IFN-beta-1b were detected after 24 h. During further release, basically no further
protein release was observed. HSA helps to slightly improve the solubility of IFN-β-1b and did
result in a very slow release. After 48 h, no further protein was released. These results were
expected for PBS buffer pH 7.4 and PBS buffer + 12.5 mg HSA because of the low solubility of
the protein in these buffers (see Chapter III 4.3.1). Among the above mentioned additives,
Laureth-12 provided the best solubility for IFN-β-1b according to studies done before (Figure
III-11). So, a faster and more complete release was expected compared to PBS buffer + 12.5 mg
HSA according to the solubility data (Figure III-11). Between four and seven days of incubation
only traces of the protein were detected. This result is indicating that besides the solubility,
other factors for example the interactions between the protein and the matrix might play a
role for the slow release rate.
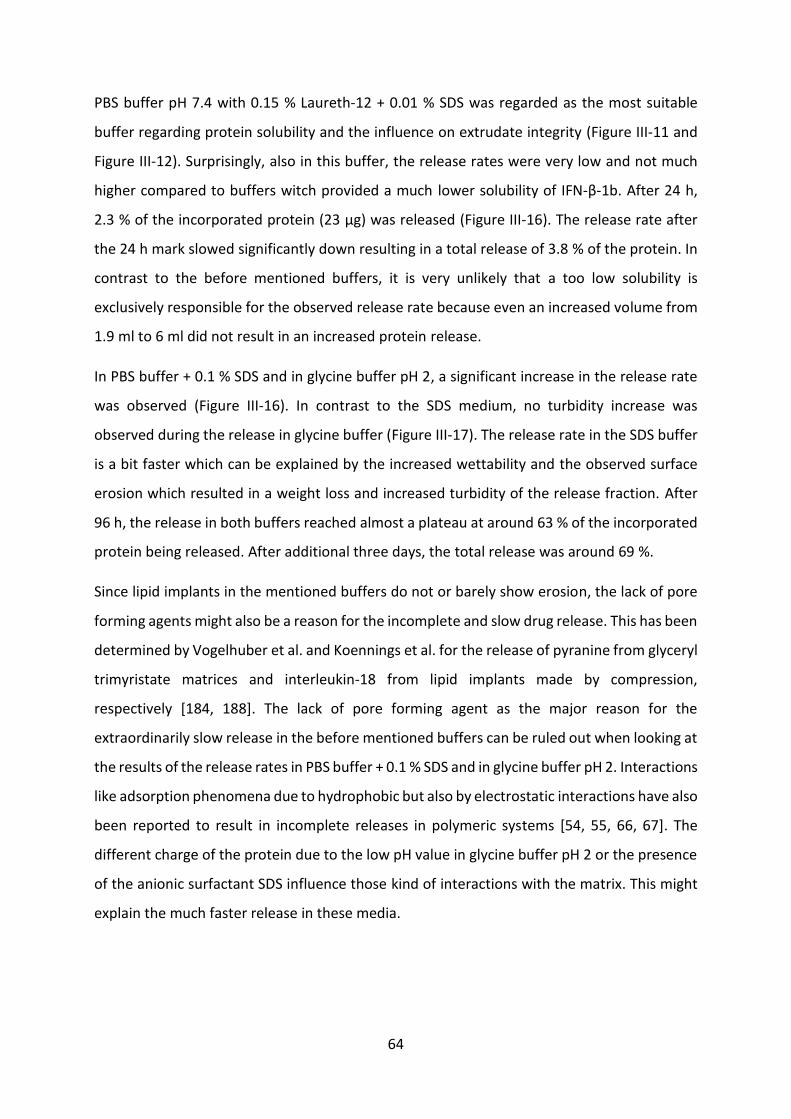
64
PBS buffer pH 7.4 with 0.15 % Laureth-12 + 0.01 % SDS was regarded as the most suitable
buffer regarding protein solubility and the influence on extrudate integrity (Figure III-11 and
Figure III-12). Surprisingly, also in this buffer, the release rates were very low and not much
higher compared to buffers witch provided a much lower solubility of IFN-β-1b. After 24 h,
2.3 % of the incorporated protein (23 µg) was released (Figure III-16). The release rate after
the 24 h mark slowed significantly down resulting in a total release of 3.8 % of the protein. In
contrast to the before mentioned buffers, it is very unlikely that a too low solubility is
exclusively responsible for the observed release rate because even an increased volume from
1.9 ml to 6 ml did not result in an increased protein release.
In PBS buffer + 0.1 % SDS and in glycine buffer pH 2, a significant increase in the release rate
was observed (Figure III-16). In contrast to the SDS medium, no turbidity increase was
observed during the release in glycine buffer (Figure III-17). The release rate in the SDS buffer
is a bit faster which can be explained by the increased wettability and the observed surface
erosion which resulted in a weight loss and increased turbidity of the release fraction. After
96 h, the release in both buffers reached almost a plateau at around 63 % of the incorporated
protein being released. After additional three days, the total release was around 69 %.
Since lipid implants in the mentioned buffers do not or barely show erosion, the lack of pore
forming agents might also be a reason for the incomplete and slow drug release. This has been
determined by Vogelhuber et al. and Koennings et al. for the release of pyranine from glyceryl
trimyristate matrices and interleukin-18 from lipid implants made by compression,
respectively [184, 188]. The lack of pore forming agent as the major reason for the
extraordinarily slow release in the before mentioned buffers can be ruled out when looking at
the results of the release rates in PBS buffer + 0.1 % SDS and in glycine buffer pH 2. Interactions
like adsorption phenomena due to hydrophobic but also by electrostatic interactions have also
been reported to result in incomplete releases in polymeric systems [54, 55, 66, 67]. The
different charge of the protein due to the low pH value in glycine buffer pH 2 or the presence
of the anionic surfactant SDS influence those kind of interactions with the matrix. This might
explain the much faster release in these media.
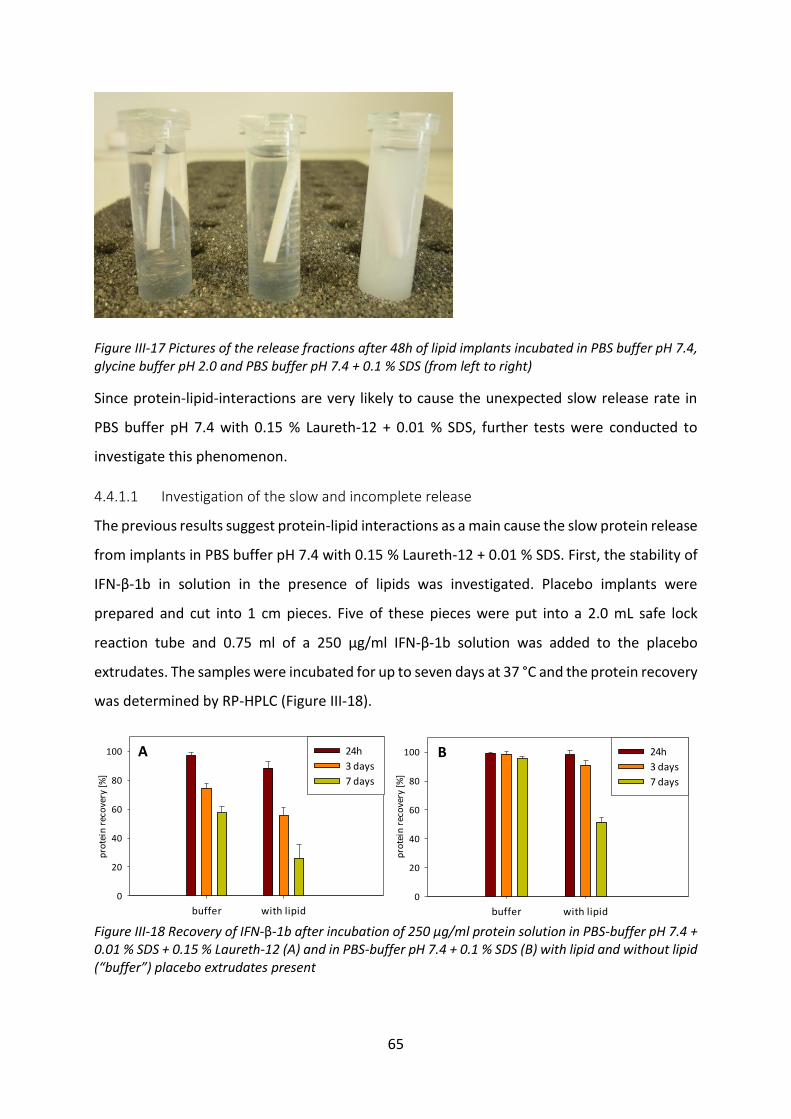
65
Figure III-17 Pictures of the release fractions after 48h of lipid implants incubated in PBS buffer pH 7.4, glycine buffer pH 2.0 and PBS buffer pH 7.4 + 0.1 % SDS (from left to right)
Since protein-lipid-interactions are very likely to cause the unexpected slow release rate in
PBS buffer pH 7.4 with 0.15 % Laureth-12 + 0.01 % SDS, further tests were conducted to
investigate this phenomenon.
4.4.1.1 Investigation of the slow and incomplete release
The previous results suggest protein-lipid interactions as a main cause the slow protein release
from implants in PBS buffer pH 7.4 with 0.15 % Laureth-12 + 0.01 % SDS. First, the stability of
IFN-β-1b in solution in the presence of lipids was investigated. Placebo implants were
prepared and cut into 1 cm pieces. Five of these pieces were put into a 2.0 mL safe lock
reaction tube and 0.75 ml of a 250 µg/ml IFN-β-1b solution was added to the placebo
extrudates. The samples were incubated for up to seven days at 37 °C and the protein recovery
was determined by RP-HPLC (Figure III-18).
buffer with lipid
pro
tein
rec
ove
ry [
%]
0
20
40
60
80
100 24h
3 days
7 days
buffer with lipid
pro
tein
rec
ove
ry [
%]
0
20
40
60
80
100 24h
3 days
7 days
Figure III-18 Recovery of IFN-β-1b after incubation of 250 µg/ml protein solution in PBS-buffer pH 7.4 + 0.01 % SDS + 0.15 % Laureth-12 (A) and in PBS-buffer pH 7.4 + 0.1 % SDS (B) with lipid and without lipid (“buffer”) placebo extrudates present
A B
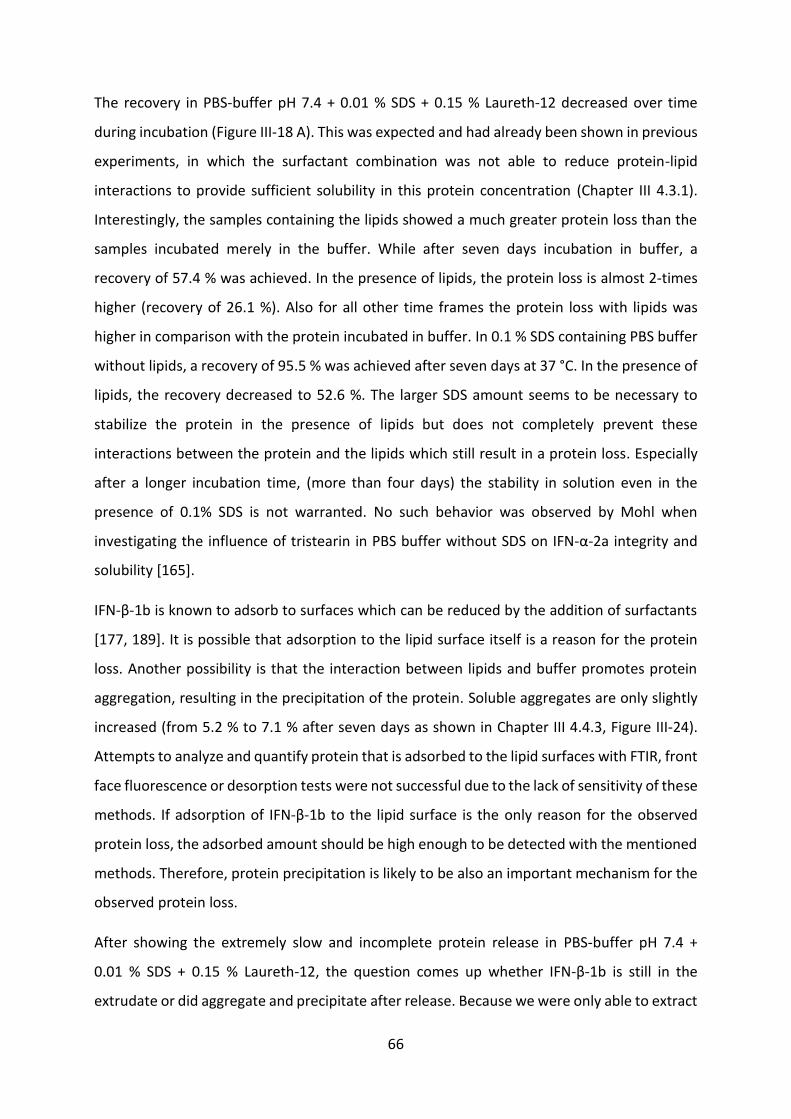
66
The recovery in PBS-buffer pH 7.4 + 0.01 % SDS + 0.15 % Laureth-12 decreased over time
during incubation (Figure III-18 A). This was expected and had already been shown in previous
experiments, in which the surfactant combination was not able to reduce protein-lipid
interactions to provide sufficient solubility in this protein concentration (Chapter III 4.3.1).
Interestingly, the samples containing the lipids showed a much greater protein loss than the
samples incubated merely in the buffer. While after seven days incubation in buffer, a
recovery of 57.4 % was achieved. In the presence of lipids, the protein loss is almost 2-times
higher (recovery of 26.1 %). Also for all other time frames the protein loss with lipids was
higher in comparison with the protein incubated in buffer. In 0.1 % SDS containing PBS buffer
without lipids, a recovery of 95.5 % was achieved after seven days at 37 °C. In the presence of
lipids, the recovery decreased to 52.6 %. The larger SDS amount seems to be necessary to
stabilize the protein in the presence of lipids but does not completely prevent these
interactions between the protein and the lipids which still result in a protein loss. Especially
after a longer incubation time, (more than four days) the stability in solution even in the
presence of 0.1% SDS is not warranted. No such behavior was observed by Mohl when
investigating the influence of tristearin in PBS buffer without SDS on IFN-α-2a integrity and
solubility [165].
IFN-β-1b is known to adsorb to surfaces which can be reduced by the addition of surfactants
[177, 189]. It is possible that adsorption to the lipid surface itself is a reason for the protein
loss. Another possibility is that the interaction between lipids and buffer promotes protein
aggregation, resulting in the precipitation of the protein. Soluble aggregates are only slightly
increased (from 5.2 % to 7.1 % after seven days as shown in Chapter III 4.4.3, Figure III-24).
Attempts to analyze and quantify protein that is adsorbed to the lipid surfaces with FTIR, front
face fluorescence or desorption tests were not successful due to the lack of sensitivity of these
methods. If adsorption of IFN-β-1b to the lipid surface is the only reason for the observed
protein loss, the adsorbed amount should be high enough to be detected with the mentioned
methods. Therefore, protein precipitation is likely to be also an important mechanism for the
observed protein loss.
After showing the extremely slow and incomplete protein release in PBS-buffer pH 7.4 +
0.01 % SDS + 0.15 % Laureth-12, the question comes up whether IFN-β-1b is still in the
extrudate or did aggregate and precipitate after release. Because we were only able to extract
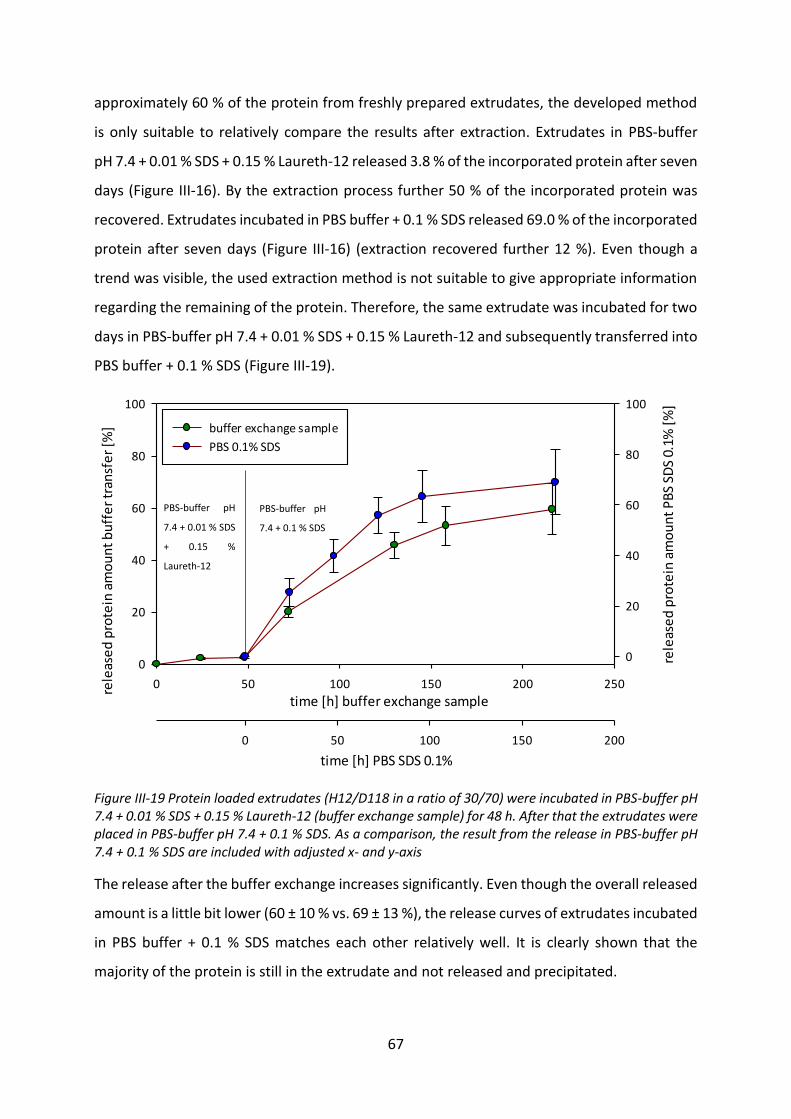
67
approximately 60 % of the protein from freshly prepared extrudates, the developed method
is only suitable to relatively compare the results after extraction. Extrudates in PBS-buffer
pH 7.4 + 0.01 % SDS + 0.15 % Laureth-12 released 3.8 % of the incorporated protein after seven
days (Figure III-16). By the extraction process further 50 % of the incorporated protein was
recovered. Extrudates incubated in PBS buffer + 0.1 % SDS released 69.0 % of the incorporated
protein after seven days (Figure III-16) (extraction recovered further 12 %). Even though a
trend was visible, the used extraction method is not suitable to give appropriate information
regarding the remaining of the protein. Therefore, the same extrudate was incubated for two
days in PBS-buffer pH 7.4 + 0.01 % SDS + 0.15 % Laureth-12 and subsequently transferred into
PBS buffer + 0.1 % SDS (Figure III-19).
time [h] buffer exchange sample0 50 100 150 200 250re
leas
ed
pro
tein
am
ou
nt
bu
ffe
r tr
ansf
er
[%]
0
20
40
60
80
100
time [h] PBS SDS 0.1%
0 50 100 150 200
rele
ase
d p
rote
in a
mo
un
t P
BS
SDS
0.1%
[%
]0
20
40
60
80
100
buffer exchange sample
PBS 0.1% SDS
Figure III-19 Protein loaded extrudates (H12/D118 in a ratio of 30/70) were incubated in PBS-buffer pH 7.4 + 0.01 % SDS + 0.15 % Laureth-12 (buffer exchange sample) for 48 h. After that the extrudates were placed in PBS-buffer pH 7.4 + 0.1 % SDS. As a comparison, the result from the release in PBS-buffer pH 7.4 + 0.1 % SDS are included with adjusted x- and y-axis
The release after the buffer exchange increases significantly. Even though the overall released
amount is a little bit lower (60 ± 10 % vs. 69 ± 13 %), the release curves of extrudates incubated
in PBS buffer + 0.1 % SDS matches each other relatively well. It is clearly shown that the
majority of the protein is still in the extrudate and not released and precipitated.
PBS-buffer pH
7.4 + 0.01 % SDS
+ 0.15 %
Laureth-12
PBS-buffer pH
7.4 + 0.1 % SDS
68
The protein solubility in PBS-buffer pH 7.4 + 0.01 % SDS + 0.15 % Laureth-12 even in the
presence of lipids is higher than the released amount suggests. Obviously, 0.01 % SDS + 0.15 %
Laureth-12 are not able to displace the protein from the lipid surface.
Still, the release also in PBS buffer + 0.1 % SDS is rather incomplete. Therefore, different
excipients were tested to improve the release regarding release kinetic and completeness.
4.4.2 Influence of excipients
For further tests, only buffers which provided sufficient solubility also in the presence of the
lipids were used.
PEG 6000 as a release modifier was successfully tested for IFN-α-2a by Herrmann et al. [92].
On the one hand it acts as a precipitation agent because it reversibly precipitates the protein
and influences the release kinetics. On the other hand, it acts as a pore forming agent due to
its water solubility. When these hydrophilic molecules are dissolved, they leave a porous
matrix with more interconnected pore networks behind. Through this more pronounced
network the release medium can diffuse faster in the matrix, dissolve the protein which can
consequently diffuse faster out of the matrix. Due to the greater number of pores, also the
probability that protein is embedded in an area of the extrudate, which is not connected to
the porous network is decreased. Therefore, also the incomplete release should be addressed
with pore formers, which has already been shown in literature [90, 165].
To determine the suitability of PEG 6000 as a release modifier for IFN-β-1b, the solubility of
IFN in PEG 6000 solutions (PBS buffer pH 7.4 + 0.1 % SDS) with different PEG 6000
concentrations ranging from 5 %-30 % were tested (Figure III-20). At a PEG-concentration of
20 % the protein recovery dropped beyond the detection limit. This was accompanied by a
visible turbidity. However, the turbidity was reversible when diluting the sample with PBS
buffer pH 7.4 + 0.1 % SDS. Therefore, PEG 6000 seems to be a suitable precipitation agent and
release modifier for IFN-beta-1b in this buffer. No precipitation of IFN-β-1b in the presence of
PEG 6000 was observed in 10 mM glycine buffer pH 2 (Figure III-20).
69
0% PEG 10% PEG 15% PEG 20% PEG 30% PEG
prot
ein
reco
very
by
UV
mea
sure
men
t [%
]
0
20
40
60
80
100
PBS pH 7.4 0.1% SDS
10 mM glycine pH 2
Figure III-20 IFN-β-1b recovery in PBS buffer pH 7.4 + 0.1 % SDS with different concentrations of PEG6000 determined with UV-spectroscopy
As already shown in Figure III-16, a sustained release in glycine buffer (pH 2) and PBS buffer
(pH 7.4) with the addition of SDS is possible for four days. However, the release was
incomplete ending at about 69 % of the incorporated protein. Therefore, trehalose, as a pure
pore forming agent, and PEG 6000 with its particular properties were tested. While the pure
pore forming agent should result in a faster and more complete release, PEG 6000 should slow
the release down in the beginning. Due to their pore forming properties, both should lead to
a more complete release as it has already been shown by Herrmann et al. [90].
Figure III-21 shows the influence of the excipients on the release from H12 based implants in
in PBS-buffer pH 7.4 + 0. 1 % SDS and 10 mM glycine buffer pH 2. In PBS-buffer pH 7.4 + 0.1 %
SDS, all implants resulted in a total protein release between 69 % and 85 % of their loading
dose (Figure III-21 A). Extrudates without excipients released 25.4 % of the protein load within
the first 24h. The release rate wears off after four days resulting in a total release of 69.0 %
after seven days. As expected the implants containing trehalose (10 %) as a porogen show an
increased release rate in the first three days in comparison to the implants without excipients
(H12) and with PEG 6000 as an excipient (+10 % PEG). After 24h, 36.0 % of the protein was
released. The higher total release in comparison with the implants without excipients can be
explained by a more pronounced porous network due to the presence of more water soluble
components. PEG-containing implants show a more sustained release in comparison to the
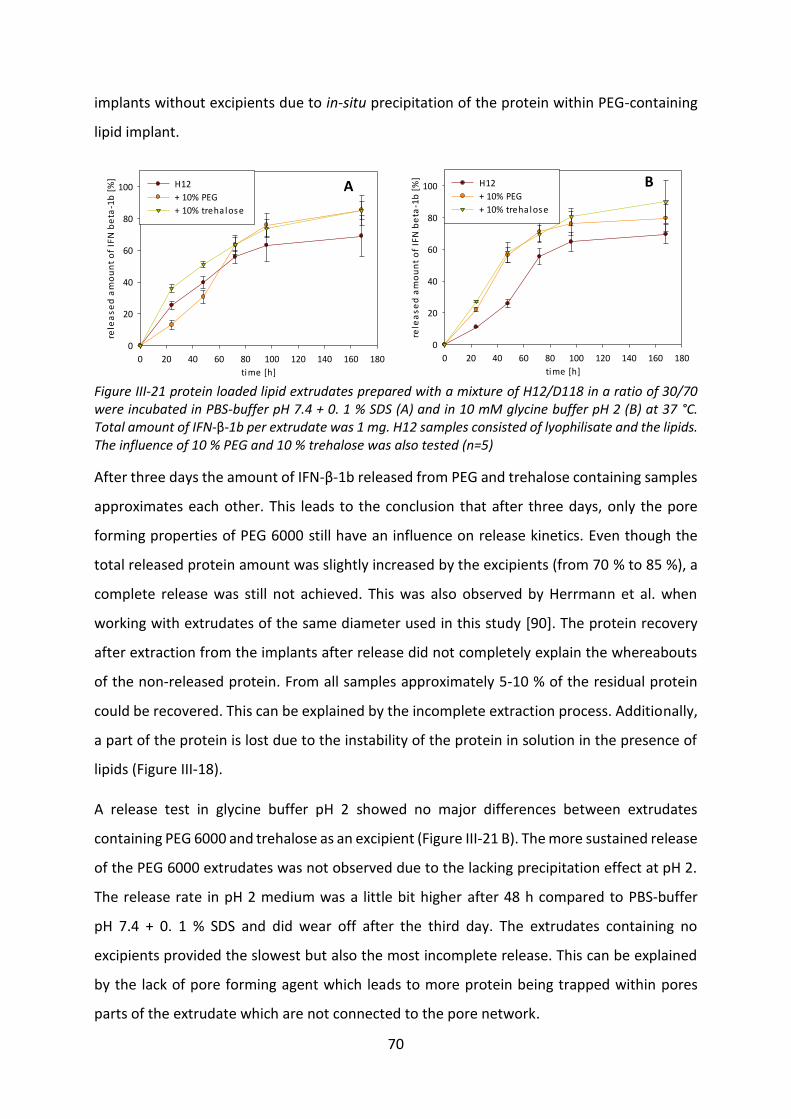
70
implants without excipients due to in-situ precipitation of the protein within PEG-containing
lipid implant.
time [h]
0 20 40 60 80 100 120 140 160 180
rele
as
ed
am
ou
nt
of
IFN
be
ta-1
b [
%]
0
20
40
60
80
100 H12
+ 10% PEG
+ 10% trehalose
time [h]
0 20 40 60 80 100 120 140 160 180
rele
as
ed
am
ou
nt
of
IFN
be
ta-1
b [
%]
0
20
40
60
80
100 H12
+ 10% PEG
+ 10% trehalose
Figure III-21 protein loaded lipid extrudates prepared with a mixture of H12/D118 in a ratio of 30/70 were incubated in PBS-buffer pH 7.4 + 0. 1 % SDS (A) and in 10 mM glycine buffer pH 2 (B) at 37 °C. Total amount of IFN-β-1b per extrudate was 1 mg. H12 samples consisted of lyophilisate and the lipids. The influence of 10 % PEG and 10 % trehalose was also tested (n=5)
After three days the amount of IFN-β-1b released from PEG and trehalose containing samples
approximates each other. This leads to the conclusion that after three days, only the pore
forming properties of PEG 6000 still have an influence on release kinetics. Even though the
total released protein amount was slightly increased by the excipients (from 70 % to 85 %), a
complete release was still not achieved. This was also observed by Herrmann et al. when
working with extrudates of the same diameter used in this study [90]. The protein recovery
after extraction from the implants after release did not completely explain the whereabouts
of the non-released protein. From all samples approximately 5-10 % of the residual protein
could be recovered. This can be explained by the incomplete extraction process. Additionally,
a part of the protein is lost due to the instability of the protein in solution in the presence of
lipids (Figure III-18).
A release test in glycine buffer pH 2 showed no major differences between extrudates
containing PEG 6000 and trehalose as an excipient (Figure III-21 B). The more sustained release
of the PEG 6000 extrudates was not observed due to the lacking precipitation effect at pH 2.
The release rate in pH 2 medium was a little bit higher after 48 h compared to PBS-buffer
pH 7.4 + 0. 1 % SDS and did wear off after the third day. The extrudates containing no
excipients provided the slowest but also the most incomplete release. This can be explained
by the lack of pore forming agent which leads to more protein being trapped within pores
parts of the extrudate which are not connected to the pore network.
A B
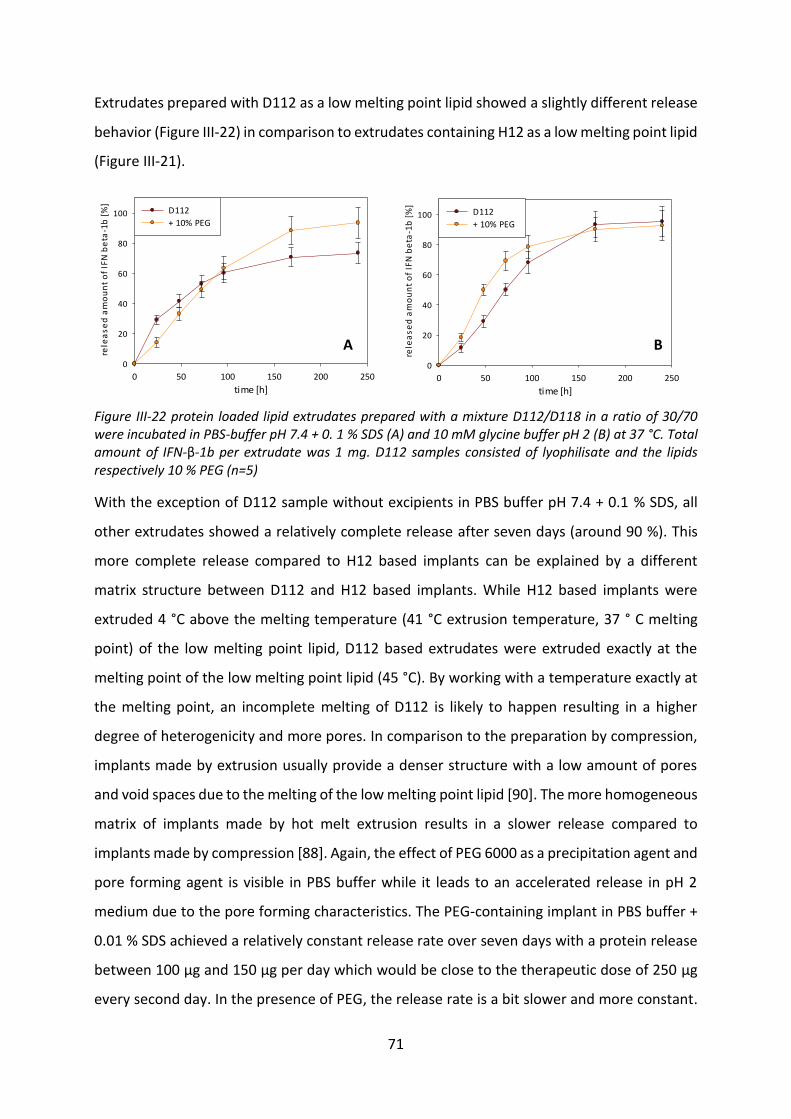
71
Extrudates prepared with D112 as a low melting point lipid showed a slightly different release
behavior (Figure III-22) in comparison to extrudates containing H12 as a low melting point lipid
(Figure III-21).
time [h]
0 50 100 150 200 250
rele
ase
d a
mo
un
t o
f IF
N b
eta
-1b
[%
]
0
20
40
60
80
100 D112
+ 10% PEG
time [h]
0 50 100 150 200 250
rele
ase
d a
mo
un
t o
f IF
N b
eta
-1b
[%
]
0
20
40
60
80
100 D112
+ 10% PEG
Figure III-22 protein loaded lipid extrudates prepared with a mixture D112/D118 in a ratio of 30/70 were incubated in PBS-buffer pH 7.4 + 0. 1 % SDS (A) and 10 mM glycine buffer pH 2 (B) at 37 °C. Total amount of IFN-β-1b per extrudate was 1 mg. D112 samples consisted of lyophilisate and the lipids respectively 10 % PEG (n=5)
With the exception of D112 sample without excipients in PBS buffer pH 7.4 + 0.1 % SDS, all
other extrudates showed a relatively complete release after seven days (around 90 %). This
more complete release compared to H12 based implants can be explained by a different
matrix structure between D112 and H12 based implants. While H12 based implants were
extruded 4 °C above the melting temperature (41 °C extrusion temperature, 37 ° C melting
point) of the low melting point lipid, D112 based extrudates were extruded exactly at the
melting point of the low melting point lipid (45 °C). By working with a temperature exactly at
the melting point, an incomplete melting of D112 is likely to happen resulting in a higher
degree of heterogenicity and more pores. In comparison to the preparation by compression,
implants made by extrusion usually provide a denser structure with a low amount of pores
and void spaces due to the melting of the low melting point lipid [90]. The more homogeneous
matrix of implants made by hot melt extrusion results in a slower release compared to
implants made by compression [88]. Again, the effect of PEG 6000 as a precipitation agent and
pore forming agent is visible in PBS buffer while it leads to an accelerated release in pH 2
medium due to the pore forming characteristics. The PEG-containing implant in PBS buffer +
0.01 % SDS achieved a relatively constant release rate over seven days with a protein release
between 100 µg and 150 µg per day which would be close to the therapeutic dose of 250 µg
every second day. In the presence of PEG, the release rate is a bit slower and more constant.
A B
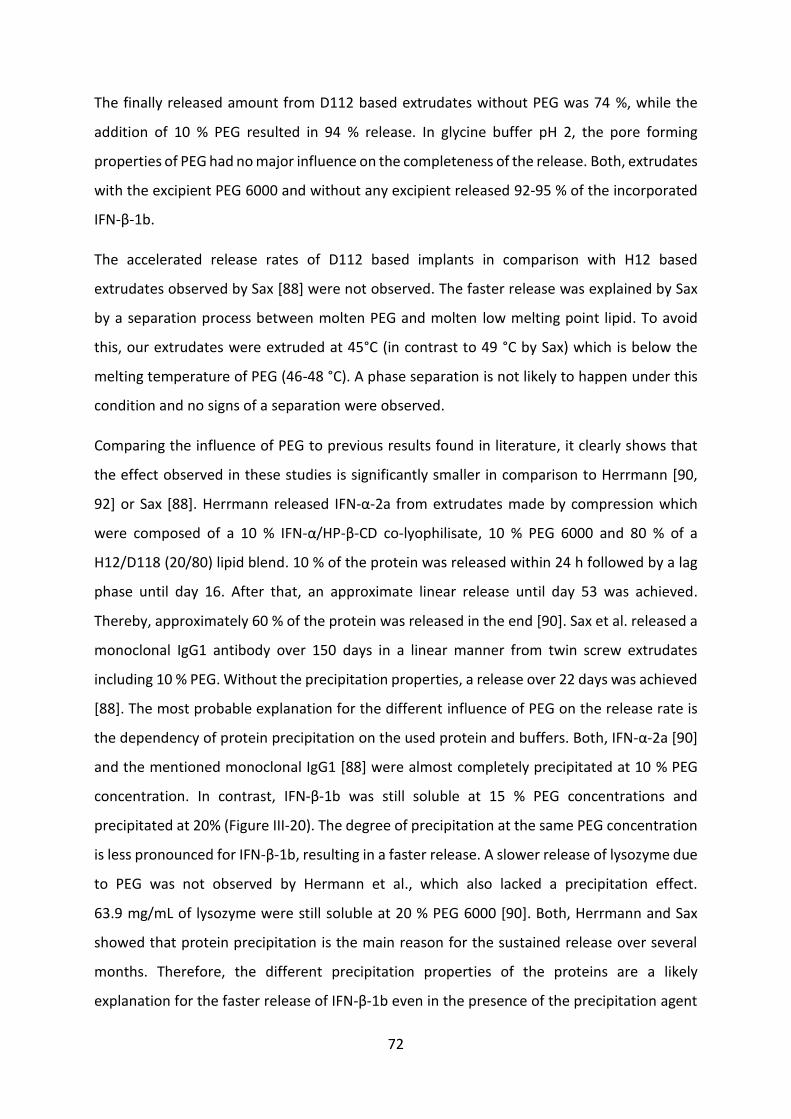
72
The finally released amount from D112 based extrudates without PEG was 74 %, while the
addition of 10 % PEG resulted in 94 % release. In glycine buffer pH 2, the pore forming
properties of PEG had no major influence on the completeness of the release. Both, extrudates
with the excipient PEG 6000 and without any excipient released 92-95 % of the incorporated
IFN-β-1b.
The accelerated release rates of D112 based implants in comparison with H12 based
extrudates observed by Sax [88] were not observed. The faster release was explained by Sax
by a separation process between molten PEG and molten low melting point lipid. To avoid
this, our extrudates were extruded at 45°C (in contrast to 49 °C by Sax) which is below the
melting temperature of PEG (46-48 °C). A phase separation is not likely to happen under this
condition and no signs of a separation were observed.
Comparing the influence of PEG to previous results found in literature, it clearly shows that
the effect observed in these studies is significantly smaller in comparison to Herrmann [90,
92] or Sax [88]. Herrmann released IFN-α-2a from extrudates made by compression which
were composed of a 10 % IFN-α/HP-β-CD co-lyophilisate, 10 % PEG 6000 and 80 % of a
H12/D118 (20/80) lipid blend. 10 % of the protein was released within 24 h followed by a lag
phase until day 16. After that, an approximate linear release until day 53 was achieved.
Thereby, approximately 60 % of the protein was released in the end [90]. Sax et al. released a
monoclonal IgG1 antibody over 150 days in a linear manner from twin screw extrudates
including 10 % PEG. Without the precipitation properties, a release over 22 days was achieved
[88]. The most probable explanation for the different influence of PEG on the release rate is
the dependency of protein precipitation on the used protein and buffers. Both, IFN-α-2a [90]
and the mentioned monoclonal IgG1 [88] were almost completely precipitated at 10 % PEG
concentration. In contrast, IFN-β-1b was still soluble at 15 % PEG concentrations and
precipitated at 20% (Figure III-20). The degree of precipitation at the same PEG concentration
is less pronounced for IFN-β-1b, resulting in a faster release. A slower release of lysozyme due
to PEG was not observed by Hermann et al., which also lacked a precipitation effect.
63.9 mg/mL of lysozyme were still soluble at 20 % PEG 6000 [90]. Both, Herrmann and Sax
showed that protein precipitation is the main reason for the sustained release over several
months. Therefore, the different precipitation properties of the proteins are a likely
explanation for the faster release of IFN-β-1b even in the presence of the precipitation agent
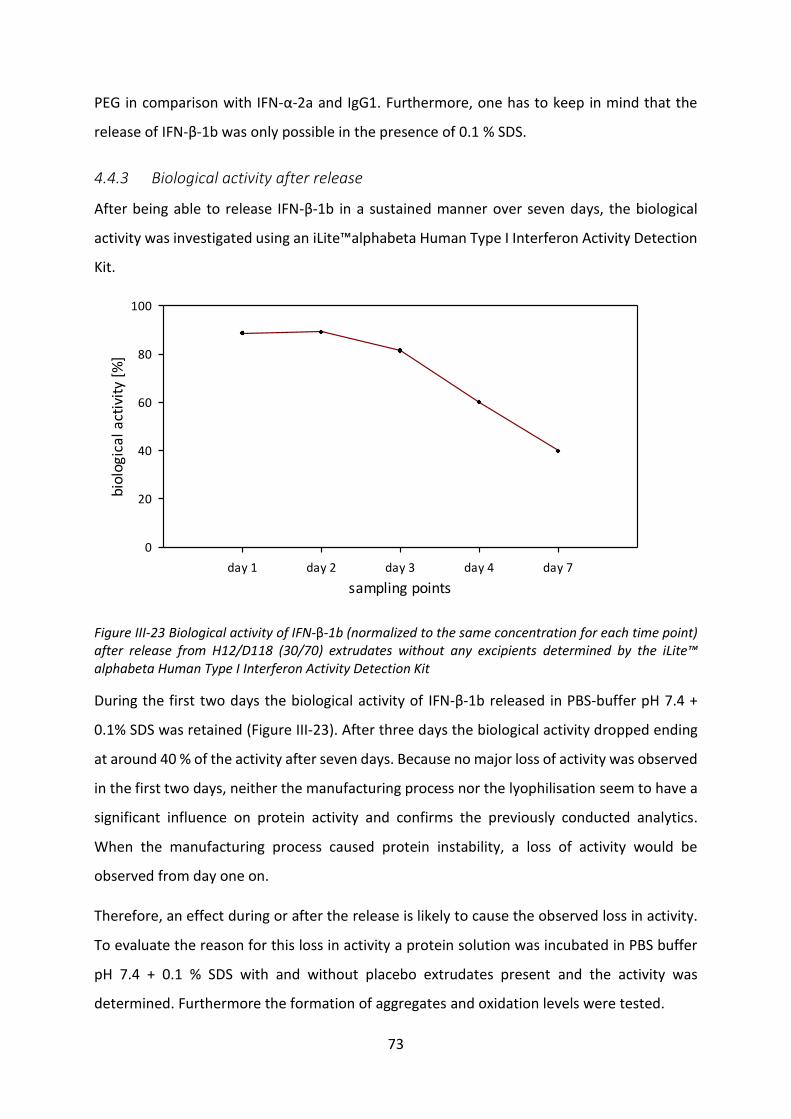
73
PEG in comparison with IFN-α-2a and IgG1. Furthermore, one has to keep in mind that the
release of IFN-β-1b was only possible in the presence of 0.1 % SDS.
4.4.3 Biological activity after release
After being able to release IFN-β-1b in a sustained manner over seven days, the biological
activity was investigated using an iLite™alphabeta Human Type I Interferon Activity Detection
Kit.
sampling points
day 1 day 2 day 3 day 4 day 7
biol
ogic
al a
ctiv
ity
[%]
0
20
40
60
80
100
Figure III-23 Biological activity of IFN-β-1b (normalized to the same concentration for each time point) after release from H12/D118 (30/70) extrudates without any excipients determined by the iLite™ alphabeta Human Type I Interferon Activity Detection Kit
During the first two days the biological activity of IFN-β-1b released in PBS-buffer pH 7.4 +
0.1% SDS was retained (Figure III-23). After three days the biological activity dropped ending
at around 40 % of the activity after seven days. Because no major loss of activity was observed
in the first two days, neither the manufacturing process nor the lyophilisation seem to have a
significant influence on protein activity and confirms the previously conducted analytics.
When the manufacturing process caused protein instability, a loss of activity would be
observed from day one on.
Therefore, an effect during or after the release is likely to cause the observed loss in activity.
To evaluate the reason for this loss in activity a protein solution was incubated in PBS buffer
pH 7.4 + 0.1 % SDS with and without placebo extrudates present and the activity was
determined. Furthermore the formation of aggregates and oxidation levels were tested.
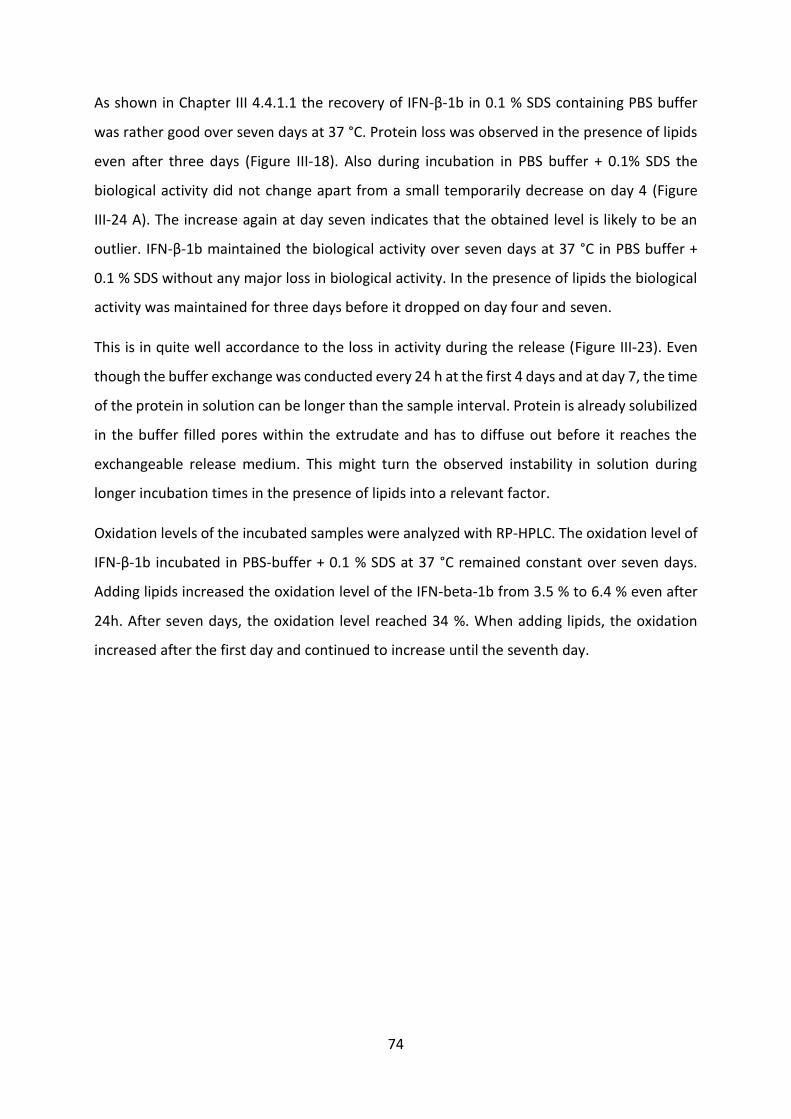
74
As shown in Chapter III 4.4.1.1 the recovery of IFN-β-1b in 0.1 % SDS containing PBS buffer
was rather good over seven days at 37 °C. Protein loss was observed in the presence of lipids
even after three days (Figure III-18). Also during incubation in PBS buffer + 0.1% SDS the
biological activity did not change apart from a small temporarily decrease on day 4 (Figure
III-24 A). The increase again at day seven indicates that the obtained level is likely to be an
outlier. IFN-β-1b maintained the biological activity over seven days at 37 °C in PBS buffer +
0.1 % SDS without any major loss in biological activity. In the presence of lipids the biological
activity was maintained for three days before it dropped on day four and seven.
This is in quite well accordance to the loss in activity during the release (Figure III-23). Even
though the buffer exchange was conducted every 24 h at the first 4 days and at day 7, the time
of the protein in solution can be longer than the sample interval. Protein is already solubilized
in the buffer filled pores within the extrudate and has to diffuse out before it reaches the
exchangeable release medium. This might turn the observed instability in solution during
longer incubation times in the presence of lipids into a relevant factor.
Oxidation levels of the incubated samples were analyzed with RP-HPLC. The oxidation level of
IFN-β-1b incubated in PBS-buffer + 0.1 % SDS at 37 °C remained constant over seven days.
Adding lipids increased the oxidation level of the IFN-beta-1b from 3.5 % to 6.4 % even after
24h. After seven days, the oxidation level reached 34 %. When adding lipids, the oxidation
increased after the first day and continued to increase until the seventh day.
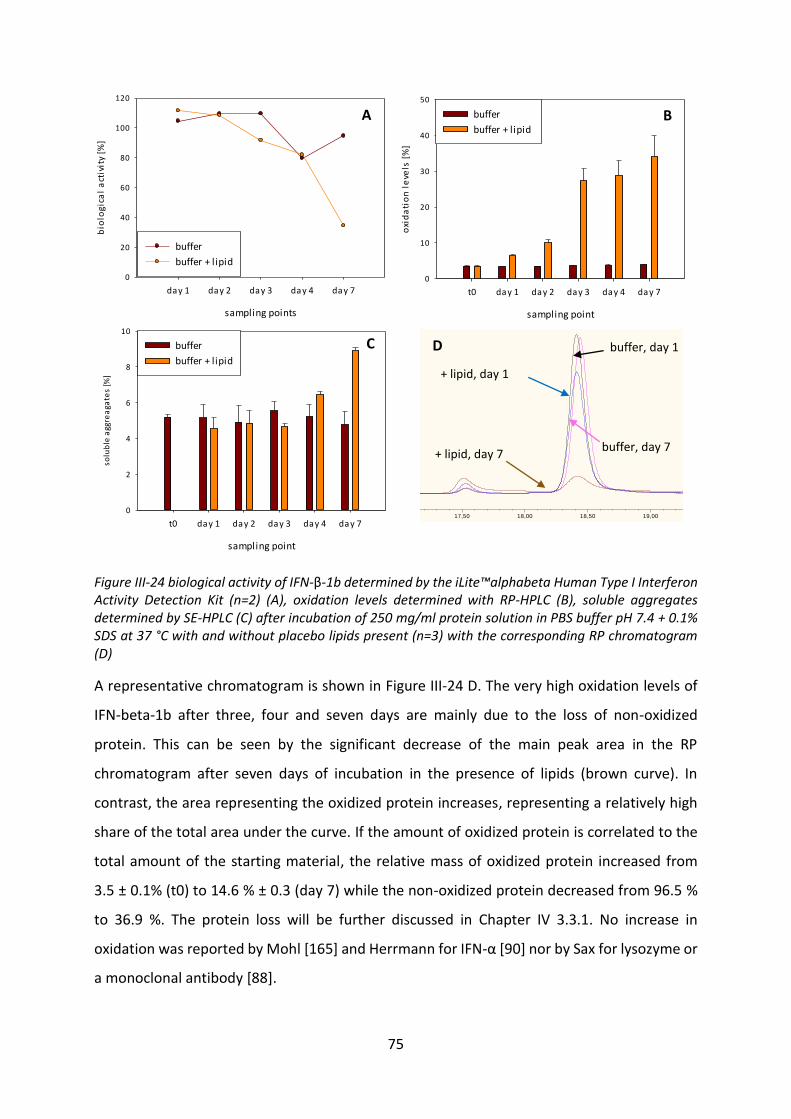
75
sampling point
t0 day 1 day 2 day 3 day 4 day 7
solu
ble
agg
rea
gate
s [%
]
0
2
4
6
8
10
buffer
buffer + lipid
sampling point
t0 day 1 day 2 day 3 day 4 day 7
oxi
da
tio
n l
eve
ls [
%]
0
10
20
30
40
50
buffer
buffer + lipid
sampling points
day 1 day 2 day 3 day 4 day 7
bio
log
ica
l a
ctiv
ity
[%]
0
20
40
60
80
100
120
buffer
buffer + lipid
Figure III-24 biological activity of IFN-β-1b determined by the iLite™alphabeta Human Type I Interferon Activity Detection Kit (n=2) (A), oxidation levels determined with RP-HPLC (B), soluble aggregates determined by SE-HPLC (C) after incubation of 250 mg/ml protein solution in PBS buffer pH 7.4 + 0.1% SDS at 37 °C with and without placebo lipids present (n=3) with the corresponding RP chromatogram (D)
A representative chromatogram is shown in Figure III-24 D. The very high oxidation levels of
IFN-beta-1b after three, four and seven days are mainly due to the loss of non-oxidized
protein. This can be seen by the significant decrease of the main peak area in the RP
chromatogram after seven days of incubation in the presence of lipids (brown curve). In
contrast, the area representing the oxidized protein increases, representing a relatively high
share of the total area under the curve. If the amount of oxidized protein is correlated to the
total amount of the starting material, the relative mass of oxidized protein increased from
3.5 ± 0.1% (t0) to 14.6 % ± 0.3 (day 7) while the non-oxidized protein decreased from 96.5 %
to 36.9 %. The protein loss will be further discussed in Chapter IV 3.3.1. No increase in
oxidation was reported by Mohl [165] and Herrmann for IFN-α [90] nor by Sax for lysozyme or
a monoclonal antibody [88].
15,39 16,00 16,50 17,00 17,50 18,00 18,50 19,00 19,50 20,00 20,50 20,90
-7.510.573
12.500.000
25.000.000
37.500.000
50.000.000
62.500.000
81.557.734
1 - AKTIVITÄTSVERLUST NIFN PEG-IFN #14 [modified by user] Tag 1 nIFN beta 250 µg/ml in SDS FLD_Emission
2 - AKTIVITÄTSVERLUST NIFN PEG-IFN #16 [modified by user] Tag 1 nIFN beta 250 µg/ml in SDS + Lipid FLD_Emission
3 - AKTIVITÄTSVERLUST NIFN PEG-IFN #100 [modified by user] Tag 7 nIFN beta 250 µg/ml in SDS FLD_Emission
4 - AKTIVITÄTSVERLUST NIFN PEG-IFN #104 [modified by user] Tag 7 nIFN beta 250 µg/ml in SDS + Lipid FLD_Emissioncounts
min
4321
278 nm /355 nm
A B
C D
+ lipid, day 7
+ lipid, day 1
buffer, day 7
buffer, day 1
76
Soluble aggregates were determined by SE-HPLC. IFN-β-1b did not show any major changes
when incubated in PBS buffer + 0.1% SDS in aggregation levels. Adding lipids increased the
amount of soluble aggregates of the nIFN after day 4 (Figure III-24 C). After day four, also the
amount of trimers increased from 1.1 %/4.1 % (trimer/dimer-content) in the starting material
to 1.9 %/7.0 % at day 7 (data not shown). A clear correlation between the formation of soluble
aggregates and loss of activity was not observed. It seems that the oxidation is the main factor
for the loss of activity.
5 Summary and Conclusion
In this chapter the suitability of vesicular phospholipid gels (VPGs) and SLIs as a depot
formulation for the native IFN-β-1b were investigated. The preparation of VPGs is a fast and
straight forward process when a liquid protein formulation is already available. After the
incorporation of IFN-β-1b into VPGs, the extraction was neither possible in aqueous solutions
nor in organic solvents. The lack of protein in the supernatant and the presence of lipids and
proteins in the precipitate, make protein-lipid interactions a very likely reason for this very
low protein recovery. VPGs seem to be no suitable depot formulation for the native IFN-β-1b.
In order to further investigate VPGs as a depot formulation changing the physicochemical
properties by PEGylation seems a suitable step and will be investigated in the next chapter.
As a second depot system, SLIs were investigated. In order to prepare protein loaded SLIs, the
development of a lyophilized formulation of the protein was necessary. A HSA free
formulation and a lyophilisation process were established which provided protein stability.
The protein-excipient-ration was suitable to prepare extrudates with a therapeutic dose for
ten days at a content of 10 % lyophilisate in the extrudate. Because of the unique
physicochemical properties of the protein, the suitability of different surfactants was
investigated on the subject of protein solubility in PBS buffer pH 7.4 at 37 °C. Furthermore,
the influence on extrudate integrity of different surfactants was investigated. Most
surfactants which provided sufficient protein solubility at these conditions did also affect the
extrudate integrity to a larger extend. The occurrence of protein-lipid interactions, which led
to a reduced stability of the protein in solution required the use of 0.1 % of SDS in the release
medium. The surfactants did effect extrudate integrity but provided at least sufficient protein
solubility in the presence of lipids.
77
Release rates from SLIs in PBS buffer + 0.1 % SDS could be influenced by using pore forming
agents, the release modifier PEG and different low melting lipids. Also the huge impact of the
release medium which drastically changed the release rates and the influence of the excipients
was shown. Finally, a sustained release in the before mentioned buffer was achieved over
seven days. But a loss of biological activity was observed during the release. The instability of
the protein in the release medium in the presence of lipids are a major issue. In addition to
the loss in activity in the presence of lipids, an increase of oxidized protein was observed as
well as an increase of soluble aggregates.
While VPGs are no suitable depot system for IFN beta-1b, SLIs provide the option for a
sustained release of the protein when adjusting the release medium by, for example, the
addition of a surfactant. In vivo, serum constituents might take over the role of the in vitro
used excipient, making a release possible. Although a release in vitro was possible, the
observed degradation of IFN beta-1b in the release medium in the presence of lipids is a
serious issue. To avoid solubility and stability problems of IFN beta-1b, the physicochemical
properties of the protein must be improved. For both, VPGs and SLIs, PEGylation is expected
to be a suitable approach to solve these issues.
78
Chapter IV Development of a depot formulation for the PEGylated
interferon-β-1b
Problems encountered in Chapter III should be circumvented by PEGylation. Due to the steric
hindrance and changed physicochemical properties, PEGylation is able to decrease
interactions between proteins and other molecules [15, 16, 22]. Even though the primary
reasons for PEGylation were improved, physicochemical properties of the protein like
solubility and stability even another effect of PEGylation, the increase of the serum half-life,
came in handy [166]. Another benefit of PEGylated proteins is the reduced immunogenicity
especially by the attachment of larger and branched PEGs [20].
The combination of PEGylated proteins or peptides and a depot formulation has been already
studied for polymeric depot systems. The adsorption and the protein loss of bovine pancreatic
ribonuclease A by adsorption to polylactid-co-glycolid (PLGA) materials was significantly
reduced by PEGylation. Therefore, PEG-ribonuclease showed a more complete protein release
from PLG including higher mean intrinsic activity values [190]. By PEGylation of IFN-α-2a (2
and 5 kDa PEG), the aggregation levels during microencapsulation were decreased and the
released protein amount was increased (native IFN (nIFN) 16 % after three weeks in
comparison to 72 % for the 2 kDa PEG-IFN). Nonetheless, the PEG IFN microparticles showed
a high burst release of 35 % after 1 h [191]. Hinds et al. investigated the influence of PEGylation
(5 kDa linear PEG) on insulin release from PLGA microparticles. A very low burst release and
increased stability during manufacture and release were detected [192]. An increased protein
stability during encapsulation in PLGA microspheres was also observed for lysozyme after
PEGylation [193].
Vyas et al. investigated the release from native and PEGylated (5000 kDa mPEG) IFN-α-2a from
multivesicular liposomes prepared by double emulsification. While they showed an increased
stability in solution for the PEGylated protein in organic solvents and during vortexing, they
didn’t test the stability or activity after release. They observed differences in the encapsulation
efficiency (75 % for the native IFN-α and 65 % for the PEG-IFN-α), a large burst release and a
much faster release and a more complete release of the nIFN-α (90 % in seven days with a
burst release of 35 % in 1 h) in comparison with the PEG-IFN-α. The authors suggested that
the different burst releases were due to an uneven distribution of proteins in the vicinity of
the surface of the vesicles [194].
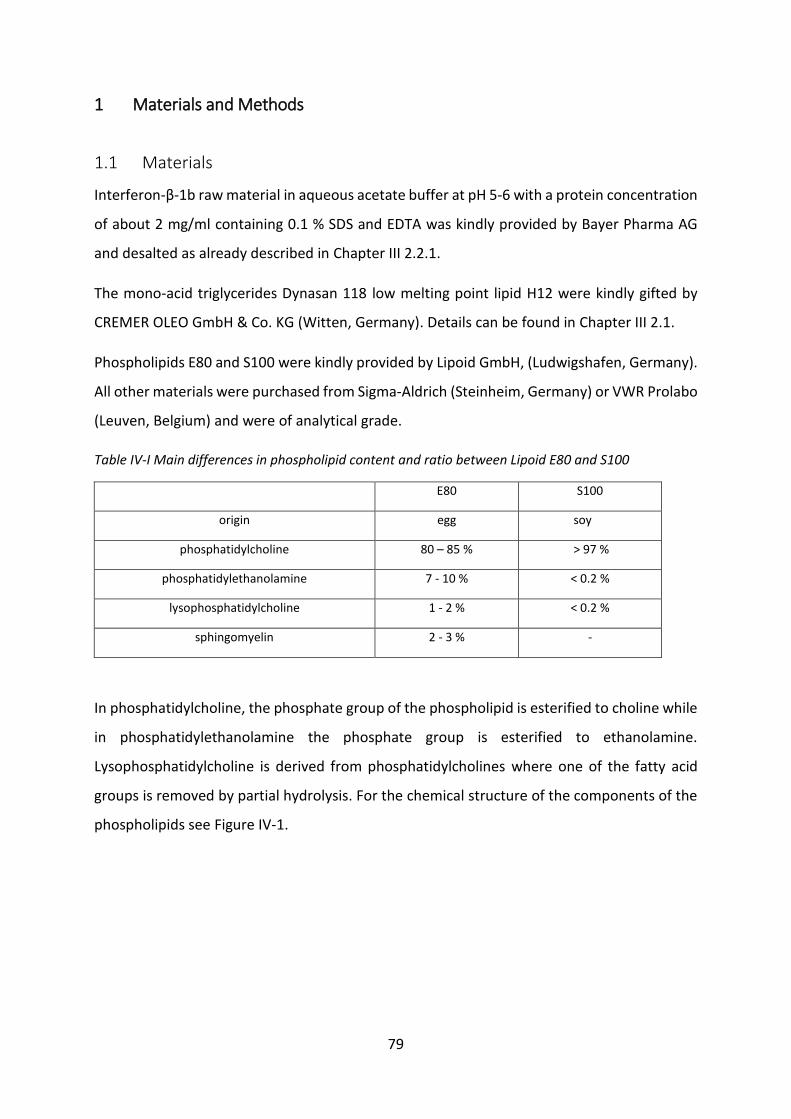
79
1 Materials and Methods
1.1 Materials
Interferon-β-1b raw material in aqueous acetate buffer at pH 5-6 with a protein concentration
of about 2 mg/ml containing 0.1 % SDS and EDTA was kindly provided by Bayer Pharma AG
and desalted as already described in Chapter III 2.2.1.
The mono-acid triglycerides Dynasan 118 low melting point lipid H12 were kindly gifted by
CREMER OLEO GmbH & Co. KG (Witten, Germany). Details can be found in Chapter III 2.1.
Phospholipids E80 and S100 were kindly provided by Lipoid GmbH, (Ludwigshafen, Germany).
All other materials were purchased from Sigma-Aldrich (Steinheim, Germany) or VWR Prolabo
(Leuven, Belgium) and were of analytical grade.
Table IV-I Main differences in phospholipid content and ratio between Lipoid E80 and S100
E80 S100
origin egg soy
phosphatidylcholine 80 – 85 % > 97 %
phosphatidylethanolamine 7 - 10 % < 0.2 %
lysophosphatidylcholine 1 - 2 % < 0.2 %
sphingomyelin 2 - 3 % -
In phosphatidylcholine, the phosphate group of the phospholipid is esterified to choline while
in phosphatidylethanolamine the phosphate group is esterified to ethanolamine.
Lysophosphatidylcholine is derived from phosphatidylcholines where one of the fatty acid
groups is removed by partial hydrolysis. For the chemical structure of the components of the
phospholipids see Figure IV-1.
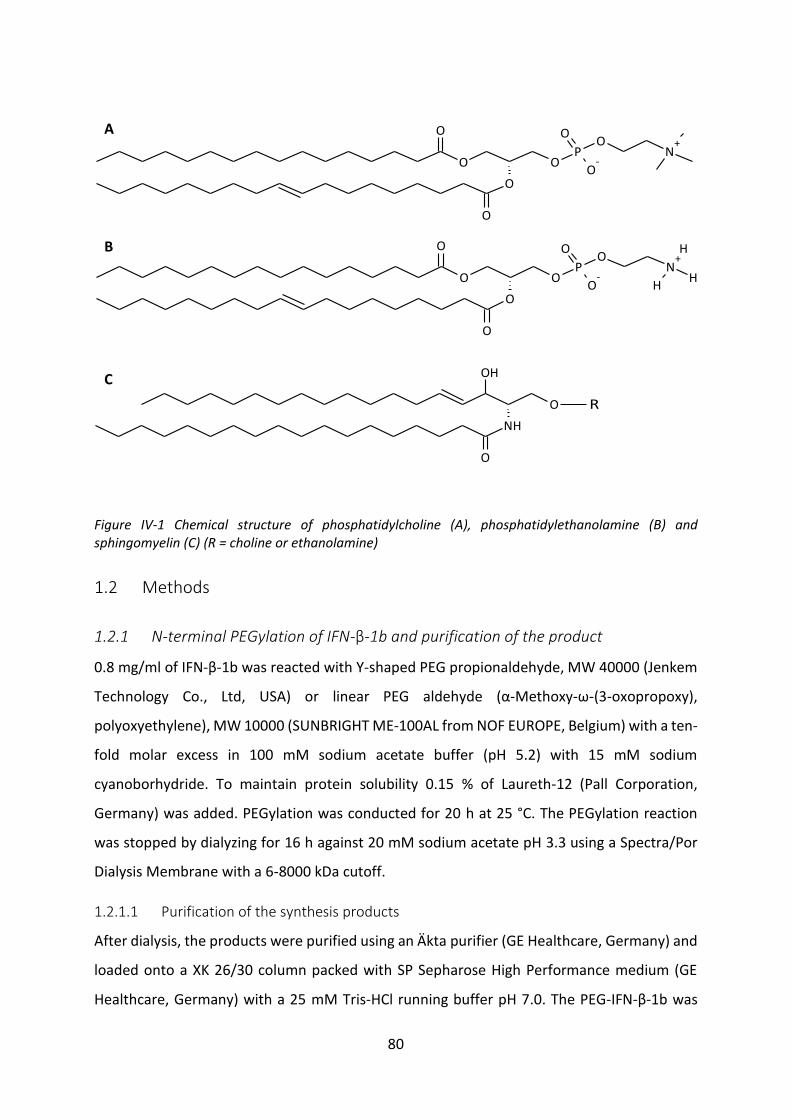
80
O
O O
O
PO
O
O-
N+
O
O
O O
O
PO
O
O-
N+H
HH
O
O
NH
O
OH
R
Figure IV-1 Chemical structure of phosphatidylcholine (A), phosphatidylethanolamine (B) and sphingomyelin (C) (R = choline or ethanolamine)
1.2 Methods
1.2.1 N-terminal PEGylation of IFN-β-1b and purification of the product
0.8 mg/ml of IFN-β-1b was reacted with Y-shaped PEG propionaldehyde, MW 40000 (Jenkem
Technology Co., Ltd, USA) or linear PEG aldehyde (α-Methoxy-ω-(3-oxopropoxy),
polyoxyethylene), MW 10000 (SUNBRIGHT ME-100AL from NOF EUROPE, Belgium) with a ten-
fold molar excess in 100 mM sodium acetate buffer (pH 5.2) with 15 mM sodium
cyanoborhydride. To maintain protein solubility 0.15 % of Laureth-12 (Pall Corporation,
Germany) was added. PEGylation was conducted for 20 h at 25 °C. The PEGylation reaction
was stopped by dialyzing for 16 h against 20 mM sodium acetate pH 3.3 using a Spectra/Por
Dialysis Membrane with a 6-8000 kDa cutoff.
1.2.1.1 Purification of the synthesis products
After dialysis, the products were purified using an Äkta purifier (GE Healthcare, Germany) and
loaded onto a XK 26/30 column packed with SP Sepharose High Performance medium (GE
Healthcare, Germany) with a 25 mM Tris-HCl running buffer pH 7.0. The PEG-IFN-β-1b was
A
B
C
81
eluted with 25 mM Tris-HCl pH 7.0 containing 1 M NaCl at 2 mL/min using a 0 – 12.5 % gradient
over 40 min. To retain the solubility of the native IFN-β-1b, 0.15% Laureth-12 was added to
the running buffer and to the elution buffer.
Only fractions containing over 98 % of PEG-IFN-β-1b, determined by RP-HPLC, were used. To
improve the yield, the other fractions were pooled and purified once again over cationic
exchange chromatography.
To remove the surfactant Laureth-12, a buffer exchange was done using dialysis (Spectra/Por
Dialysis Membrane with a 6-8000 kDa cutoff) and Vivaspins 20 ml 10,000 MWCO (Sartorius,
Germany). Purified 40 kDa PEG-IFN-β-1b samples were analyzed using RP-HPLC and a Corona
Charged Aerosol Detector (Dionex, Germany) regarding residues of the surfactant. This
detector is able to detect analytes with or without a chromophor by generating a charged
aerosol which is detected by an electrometer. In short, the eluent is nebulized and dried which
generates analyte particles. The particle size is in direct proportion of analyte concentration.
These particles are directed to a chamber where they collide with positively charged gas ions
(in this case nitrogen). The positive charges are transferred to the particles. The larger the
particles, the more positive charge is accepted. Before entering the electrometer where the
charge of the particles is measured, free ions are removed by an ion trap. By using a calibration
curve, the residues of the surfactant Laureth-12 in the purified sample was determined at
around 0.0075 %. This is a 20 times reduction in comparison with the original amount of
Laureth-12 in the formulation.
1.2.2 Size exclusion chromatography + multi-angle static light scattering (SEC-MALS)
Characterization of the conjugates was performed on an AF2000 Focus (Postnova Analytics,
Germany) with a miniDAWn Tristar MALS detector (Wyatt Technology, Germany) and an PN
3150 RI-detector (Postnova Analytics, Germany). 50 µg of protein conjugate were injected on
a TSK-Gel G3000PWXL 30cm x 7.8 mm SEC column (TOSOH Bioscience GmbH, Germany). The
running buffer was composed of 175 mM sodium phosphate with a pH adjusted to 6.8. The
protein was detected by an UV-VIS Detector (Shimadzu, Germany) at 280 nm. The extinction
coefficient used was 1.7 mL/mg*cm.
Calculation of the molar mass was done by using Astra software version 5.0 (Wyatt
Technology, Germany) using the template “Wyatt protein conjugate application”.
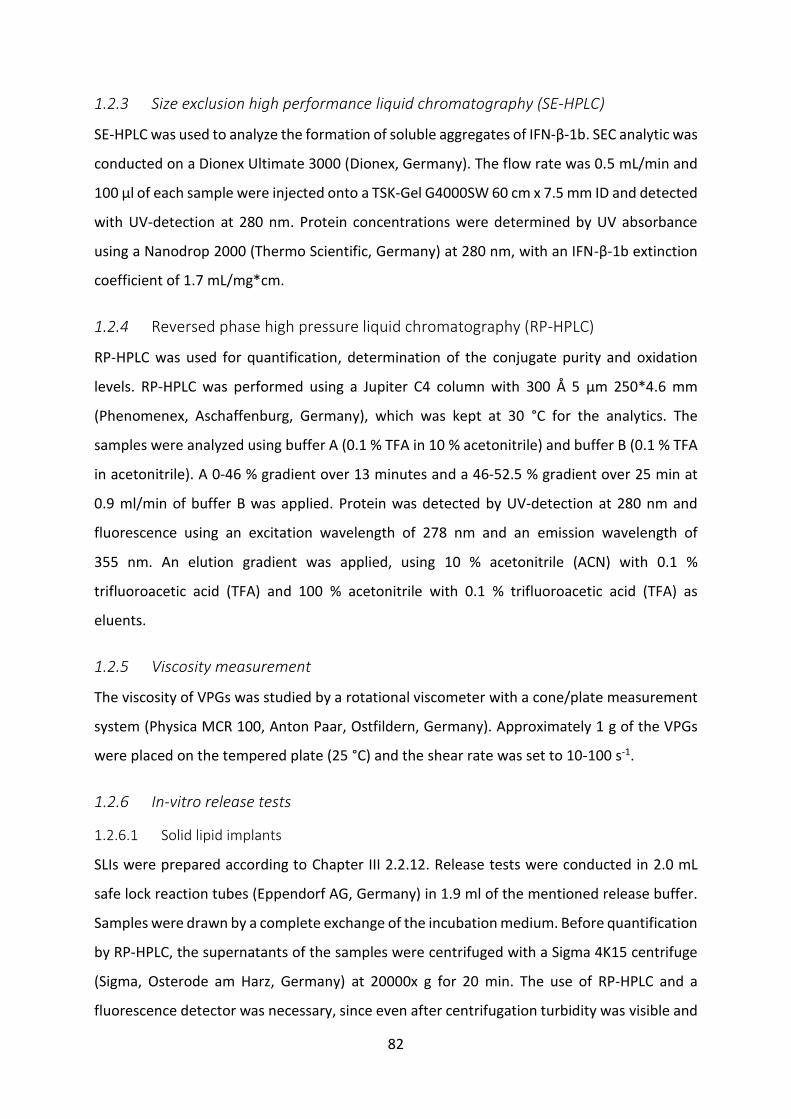
82
1.2.3 Size exclusion high performance liquid chromatography (SE-HPLC)
SE-HPLC was used to analyze the formation of soluble aggregates of IFN-β-1b. SEC analytic was
conducted on a Dionex Ultimate 3000 (Dionex, Germany). The flow rate was 0.5 mL/min and
100 μl of each sample were injected onto a TSK-Gel G4000SW 60 cm x 7.5 mm ID and detected
with UV-detection at 280 nm. Protein concentrations were determined by UV absorbance
using a Nanodrop 2000 (Thermo Scientific, Germany) at 280 nm, with an IFN-β-1b extinction
coefficient of 1.7 mL/mg*cm.
1.2.4 Reversed phase high pressure liquid chromatography (RP-HPLC)
RP-HPLC was used for quantification, determination of the conjugate purity and oxidation
levels. RP-HPLC was performed using a Jupiter C4 column with 300 Å 5 μm 250*4.6 mm
(Phenomenex, Aschaffenburg, Germany), which was kept at 30 °C for the analytics. The
samples were analyzed using buffer A (0.1 % TFA in 10 % acetonitrile) and buffer B (0.1 % TFA
in acetonitrile). A 0-46 % gradient over 13 minutes and a 46-52.5 % gradient over 25 min at
0.9 ml/min of buffer B was applied. Protein was detected by UV-detection at 280 nm and
fluorescence using an excitation wavelength of 278 nm and an emission wavelength of
355 nm. An elution gradient was applied, using 10 % acetonitrile (ACN) with 0.1 %
trifluoroacetic acid (TFA) and 100 % acetonitrile with 0.1 % trifluoroacetic acid (TFA) as
eluents.
1.2.5 Viscosity measurement
The viscosity of VPGs was studied by a rotational viscometer with a cone/plate measurement
system (Physica MCR 100, Anton Paar, Ostfildern, Germany). Approximately 1 g of the VPGs
were placed on the tempered plate (25 °C) and the shear rate was set to 10-100 s-1.
1.2.6 In-vitro release tests
1.2.6.1 Solid lipid implants
SLIs were prepared according to Chapter III 2.2.12. Release tests were conducted in 2.0 mL
safe lock reaction tubes (Eppendorf AG, Germany) in 1.9 ml of the mentioned release buffer.
Samples were drawn by a complete exchange of the incubation medium. Before quantification
by RP-HPLC, the supernatants of the samples were centrifuged with a Sigma 4K15 centrifuge
(Sigma, Osterode am Harz, Germany) at 20000x g for 20 min. The use of RP-HPLC and a
fluorescence detector was necessary, since even after centrifugation turbidity was visible and
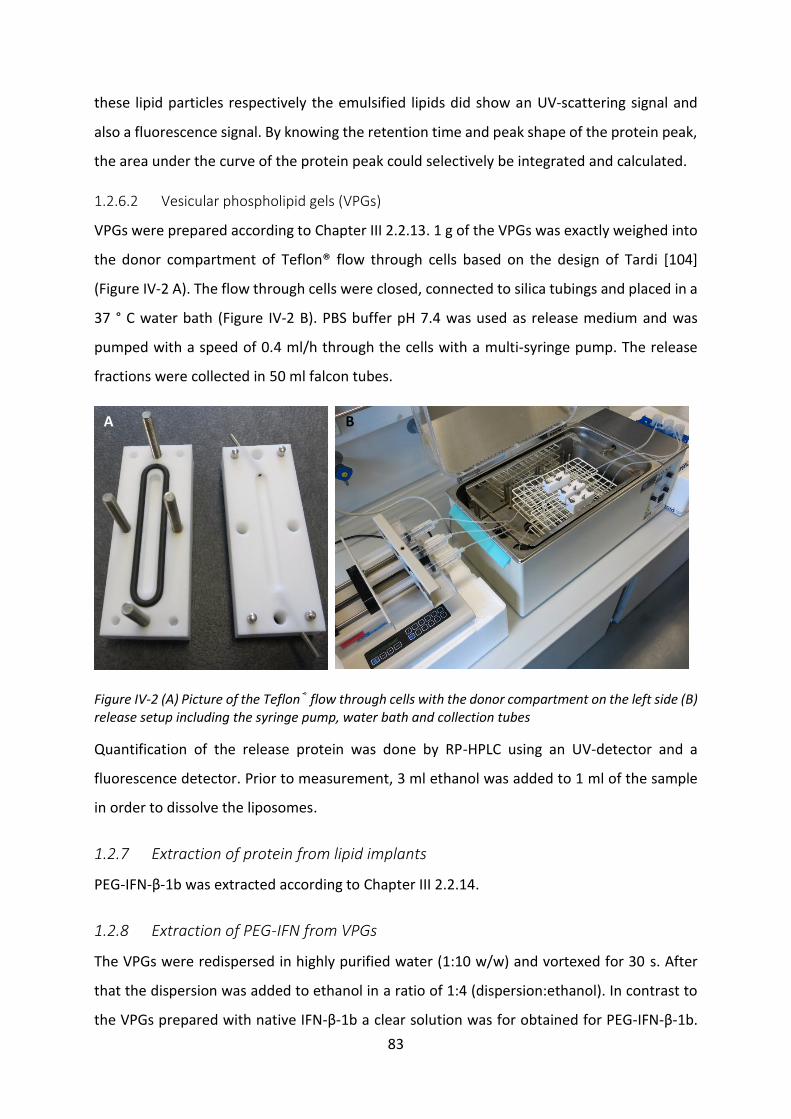
83
these lipid particles respectively the emulsified lipids did show an UV-scattering signal and
also a fluorescence signal. By knowing the retention time and peak shape of the protein peak,
the area under the curve of the protein peak could selectively be integrated and calculated.
1.2.6.2 Vesicular phospholipid gels (VPGs)
VPGs were prepared according to Chapter III 2.2.13. 1 g of the VPGs was exactly weighed into
the donor compartment of Teflon® flow through cells based on the design of Tardi [104]
(Figure IV-2 A). The flow through cells were closed, connected to silica tubings and placed in a
37 ° C water bath (Figure IV-2 B). PBS buffer pH 7.4 was used as release medium and was
pumped with a speed of 0.4 ml/h through the cells with a multi-syringe pump. The release
fractions were collected in 50 ml falcon tubes.
Figure IV-2 (A) Picture of the Teflon® flow through cells with the donor compartment on the left side (B) release setup including the syringe pump, water bath and collection tubes
Quantification of the release protein was done by RP-HPLC using an UV-detector and a
fluorescence detector. Prior to measurement, 3 ml ethanol was added to 1 ml of the sample
in order to dissolve the liposomes.
1.2.7 Extraction of protein from lipid implants
PEG-IFN-β-1b was extracted according to Chapter III 2.2.14.
1.2.8 Extraction of PEG-IFN from VPGs
The VPGs were redispersed in highly purified water (1:10 w/w) and vortexed for 30 s. After
that the dispersion was added to ethanol in a ratio of 1:4 (dispersion:ethanol). In contrast to
the VPGs prepared with native IFN-β-1b a clear solution was for obtained for PEG-IFN-β-1b.
A B
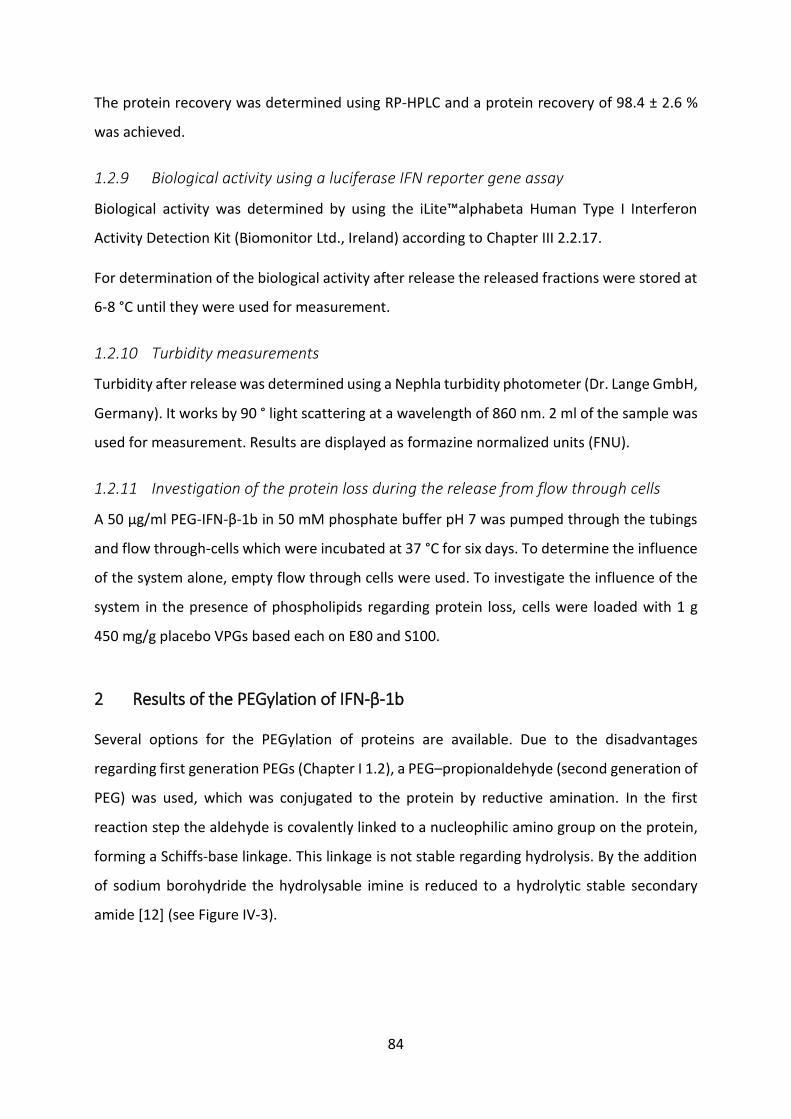
84
The protein recovery was determined using RP-HPLC and a protein recovery of 98.4 ± 2.6 %
was achieved.
1.2.9 Biological activity using a luciferase IFN reporter gene assay
Biological activity was determined by using the iLite™alphabeta Human Type I Interferon
Activity Detection Kit (Biomonitor Ltd., Ireland) according to Chapter III 2.2.17.
For determination of the biological activity after release the released fractions were stored at
6-8 °C until they were used for measurement.
1.2.10 Turbidity measurements
Turbidity after release was determined using a Nephla turbidity photometer (Dr. Lange GmbH,
Germany). It works by 90 ° light scattering at a wavelength of 860 nm. 2 ml of the sample was
used for measurement. Results are displayed as formazine normalized units (FNU).
1.2.11 Investigation of the protein loss during the release from flow through cells
A 50 µg/ml PEG-IFN-β-1b in 50 mM phosphate buffer pH 7 was pumped through the tubings
and flow through-cells which were incubated at 37 °C for six days. To determine the influence
of the system alone, empty flow through cells were used. To investigate the influence of the
system in the presence of phospholipids regarding protein loss, cells were loaded with 1 g
450 mg/g placebo VPGs based each on E80 and S100.
2 Results of the PEGylation of IFN-β-1b
Several options for the PEGylation of proteins are available. Due to the disadvantages
regarding first generation PEGs (Chapter I 1.2), a PEG–propionaldehyde (second generation of
PEG) was used, which was conjugated to the protein by reductive amination. In the first
reaction step the aldehyde is covalently linked to a nucleophilic amino group on the protein,
forming a Schiffs-base linkage. This linkage is not stable regarding hydrolysis. By the addition
of sodium borohydride the hydrolysable imine is reduced to a hydrolytic stable secondary
amide [12] (see Figure IV-3).
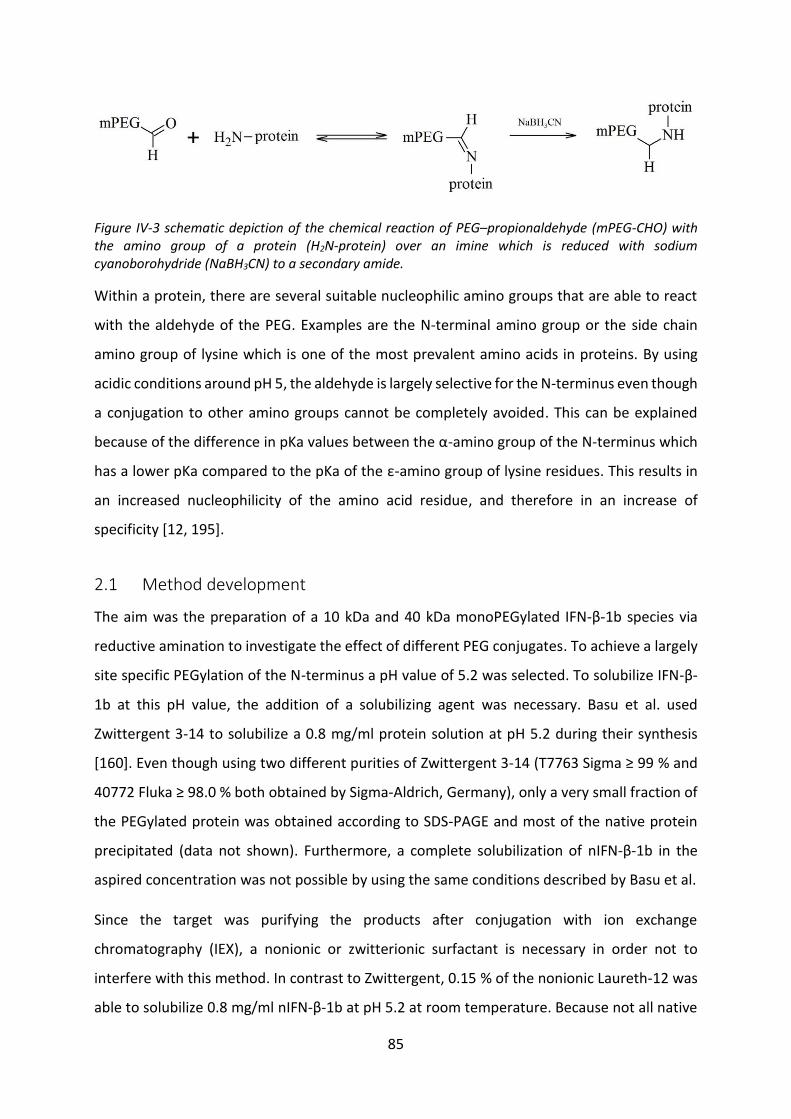
85
Figure IV-3 schematic depiction of the chemical reaction of PEG–propionaldehyde (mPEG-CHO) with the amino group of a protein (H2N-protein) over an imine which is reduced with sodium cyanoborohydride (NaBH3CN) to a secondary amide.
Within a protein, there are several suitable nucleophilic amino groups that are able to react
with the aldehyde of the PEG. Examples are the N-terminal amino group or the side chain
amino group of lysine which is one of the most prevalent amino acids in proteins. By using
acidic conditions around pH 5, the aldehyde is largely selective for the N-terminus even though
a conjugation to other amino groups cannot be completely avoided. This can be explained
because of the difference in pKa values between the α-amino group of the N-terminus which
has a lower pKa compared to the pKa of the ε-amino group of lysine residues. This results in
an increased nucleophilicity of the amino acid residue, and therefore in an increase of
specificity [12, 195].
2.1 Method development
The aim was the preparation of a 10 kDa and 40 kDa monoPEGylated IFN-β-1b species via
reductive amination to investigate the effect of different PEG conjugates. To achieve a largely
site specific PEGylation of the N-terminus a pH value of 5.2 was selected. To solubilize IFN-β-
1b at this pH value, the addition of a solubilizing agent was necessary. Basu et al. used
Zwittergent 3-14 to solubilize a 0.8 mg/ml protein solution at pH 5.2 during their synthesis
[160]. Even though using two different purities of Zwittergent 3-14 (T7763 Sigma ≥ 99 % and
40772 Fluka ≥ 98.0 % both obtained by Sigma-Aldrich, Germany), only a very small fraction of
the PEGylated protein was obtained according to SDS-PAGE and most of the native protein
precipitated (data not shown). Furthermore, a complete solubilization of nIFN-β-1b in the
aspired concentration was not possible by using the same conditions described by Basu et al.
Since the target was purifying the products after conjugation with ion exchange
chromatography (IEX), a nonionic or zwitterionic surfactant is necessary in order not to
interfere with this method. In contrast to Zwittergent, 0.15 % of the nonionic Laureth-12 was
able to solubilize 0.8 mg/ml nIFN-β-1b at pH 5.2 at room temperature. Because not all native
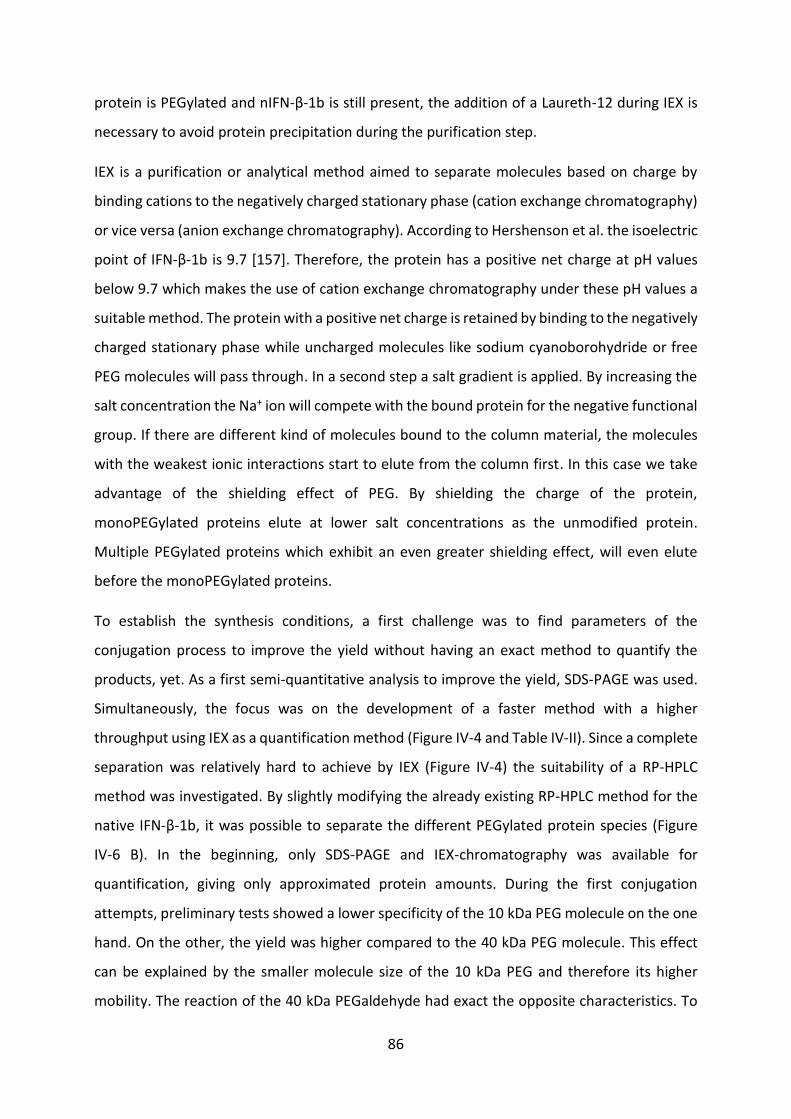
86
protein is PEGylated and nIFN-β-1b is still present, the addition of a Laureth-12 during IEX is
necessary to avoid protein precipitation during the purification step.
IEX is a purification or analytical method aimed to separate molecules based on charge by
binding cations to the negatively charged stationary phase (cation exchange chromatography)
or vice versa (anion exchange chromatography). According to Hershenson et al. the isoelectric
point of IFN-β-1b is 9.7 [157]. Therefore, the protein has a positive net charge at pH values
below 9.7 which makes the use of cation exchange chromatography under these pH values a
suitable method. The protein with a positive net charge is retained by binding to the negatively
charged stationary phase while uncharged molecules like sodium cyanoborohydride or free
PEG molecules will pass through. In a second step a salt gradient is applied. By increasing the
salt concentration the Na+ ion will compete with the bound protein for the negative functional
group. If there are different kind of molecules bound to the column material, the molecules
with the weakest ionic interactions start to elute from the column first. In this case we take
advantage of the shielding effect of PEG. By shielding the charge of the protein,
monoPEGylated proteins elute at lower salt concentrations as the unmodified protein.
Multiple PEGylated proteins which exhibit an even greater shielding effect, will even elute
before the monoPEGylated proteins.
To establish the synthesis conditions, a first challenge was to find parameters of the
conjugation process to improve the yield without having an exact method to quantify the
products, yet. As a first semi-quantitative analysis to improve the yield, SDS-PAGE was used.
Simultaneously, the focus was on the development of a faster method with a higher
throughput using IEX as a quantification method (Figure IV-4 and Table IV-II). Since a complete
separation was relatively hard to achieve by IEX (Figure IV-4) the suitability of a RP-HPLC
method was investigated. By slightly modifying the already existing RP-HPLC method for the
native IFN-β-1b, it was possible to separate the different PEGylated protein species (Figure
IV-6 B). In the beginning, only SDS-PAGE and IEX-chromatography was available for
quantification, giving only approximated protein amounts. During the first conjugation
attempts, preliminary tests showed a lower specificity of the 10 kDa PEG molecule on the one
hand. On the other, the yield was higher compared to the 40 kDa PEG molecule. This effect
can be explained by the smaller molecule size of the 10 kDa PEG and therefore its higher
mobility. The reaction of the 40 kDa PEGaldehyde had exact the opposite characteristics. To
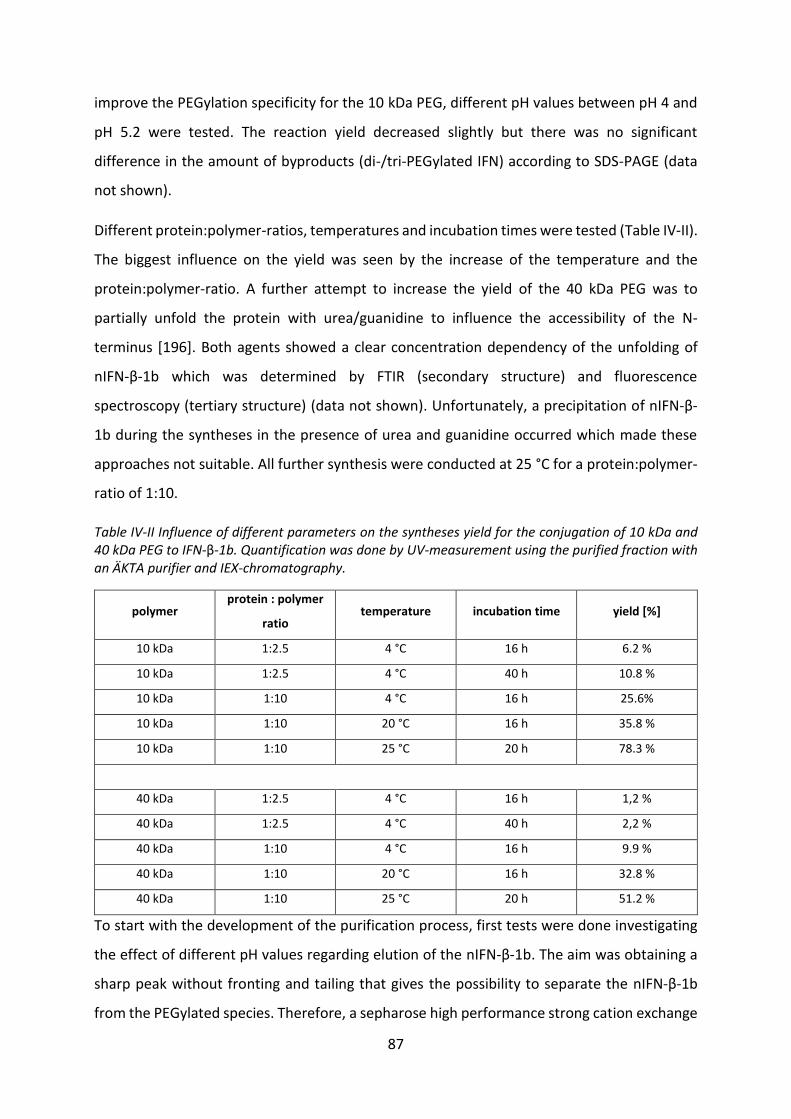
87
improve the PEGylation specificity for the 10 kDa PEG, different pH values between pH 4 and
pH 5.2 were tested. The reaction yield decreased slightly but there was no significant
difference in the amount of byproducts (di-/tri-PEGylated IFN) according to SDS-PAGE (data
not shown).
Different protein:polymer-ratios, temperatures and incubation times were tested (Table IV-II).
The biggest influence on the yield was seen by the increase of the temperature and the
protein:polymer-ratio. A further attempt to increase the yield of the 40 kDa PEG was to
partially unfold the protein with urea/guanidine to influence the accessibility of the N-
terminus [196]. Both agents showed a clear concentration dependency of the unfolding of
nIFN-β-1b which was determined by FTIR (secondary structure) and fluorescence
spectroscopy (tertiary structure) (data not shown). Unfortunately, a precipitation of nIFN-β-
1b during the syntheses in the presence of urea and guanidine occurred which made these
approaches not suitable. All further synthesis were conducted at 25 °C for a protein:polymer-
ratio of 1:10.
Table IV-II Influence of different parameters on the syntheses yield for the conjugation of 10 kDa and 40 kDa PEG to IFN-β-1b. Quantification was done by UV-measurement using the purified fraction with an ÄKTA purifier and IEX-chromatography.
polymer protein : polymer
ratio temperature incubation time yield [%]
10 kDa 1:2.5 4 °C 16 h 6.2 %
10 kDa 1:2.5 4 °C 40 h 10.8 %
10 kDa 1:10 4 °C 16 h 25.6%
10 kDa 1:10 20 °C 16 h 35.8 %
10 kDa 1:10 25 °C 20 h 78.3 %
40 kDa 1:2.5 4 °C 16 h 1,2 %
40 kDa 1:2.5 4 °C 40 h 2,2 %
40 kDa 1:10 4 °C 16 h 9.9 %
40 kDa 1:10 20 °C 16 h 32.8 %
40 kDa 1:10 25 °C 20 h 51.2 %
To start with the development of the purification process, first tests were done investigating
the effect of different pH values regarding elution of the nIFN-β-1b. The aim was obtaining a
sharp peak without fronting and tailing that gives the possibility to separate the nIFN-β-1b
from the PEGylated species. Therefore, a sepharose high performance strong cation exchange

88
column (HiTrap SP HP, 1 ml) was used. As running buffer A 20 mM phosphate buffer + 0.15 %
Laureth-12 and as running buffer B 20 mM phosphate buffer 1 M NaCl + 0.15 % Laureth-12
were used (Figure IV-4). As expected, by increasing the pH value of the running buffers the
beginning of the elution was moved towards shorter retention times. The lower the pH of the
running buffer, the more positively charged is the protein which leads to stronger interactions
with the column. Unfortunately, no sharp peak was obtained for neither pH value (Figure IV-4),
which leads to difficulties obtaining pure fractions.
time [min]
0 10 20 30 40 50
UV
abs
orba
nce
[mA
U]
0
20
40
60
80
100
120
140
cond
ucti
vity
[m
S/cm
]
0
20
40
60
80
100
perc
enta
ge o
f 1
M N
aCl
0
20
40
60
80
100phosphate pH 3.3
phosphate pH 4.3
phosphatepH 5.3
phosphate pH 6.3
phosphate pH 7.3
conductivity
ratio of buffer B
Figure IV-4 cation exchange chromatograms of nIFN-β-1b showing the effect of different pH values of the running buffers. Running buffer A was a 20 mM phosphate buffer + 0.15 % Laureth-12 and running buffer B a 20 mM phosphate buffer 1 M NaCl + 0.15 % Laureth-12. The gradient is depicted in the “ratio of running buffer B” curve while the conductivity of the eluent is depicted in the “conductivity” graph (used column: HiTrap SP HP, 1 ml)
Also the change of the buffer substance (phosphate buffer to acetate buffer) had little effect
on the shape of the eluting “peak” and a separation between the PEGylated protein and the
native protein was barely achieved. Tests with citrate buffer did neither improve the
separation nor the peak shape. Also the change of the gradient (linear, steps) using different
slopes did not have the necessary positive influence (data not shown). Using a phosphate
buffer at pH 11.5 and an anion exchange column (HiTrap Q HP) did also not improve the
separation or the peak shape (data not shown).
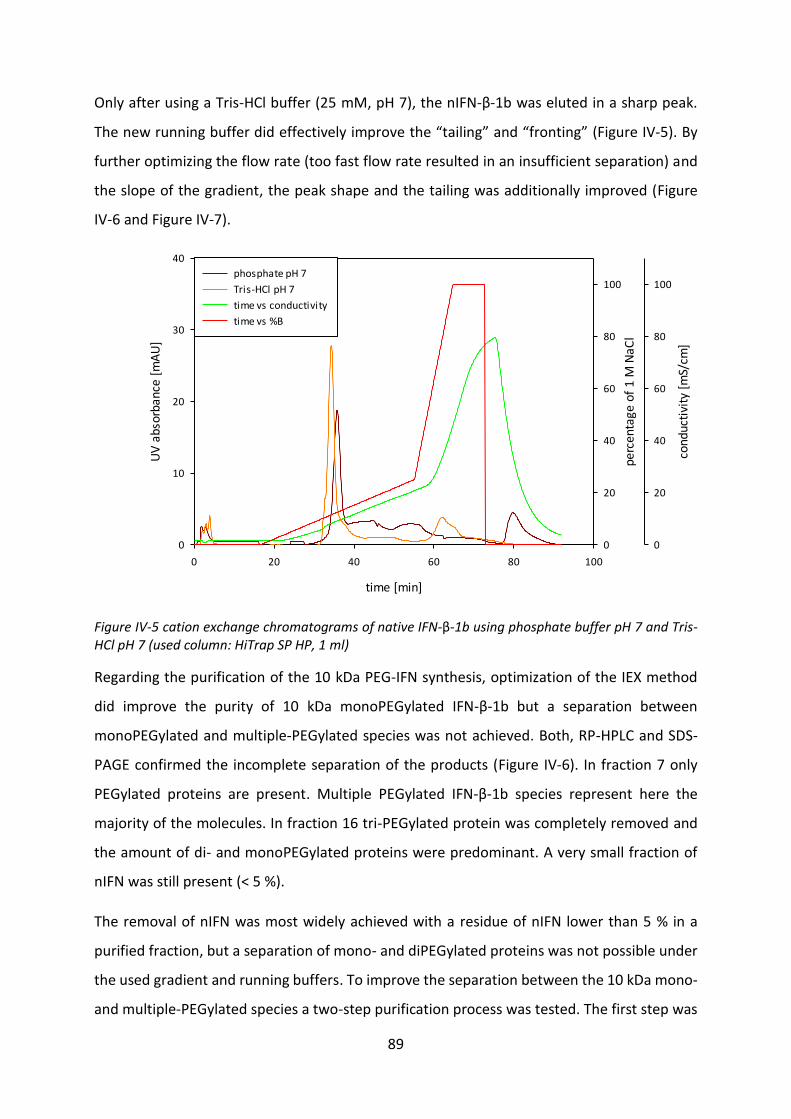
89
Only after using a Tris-HCl buffer (25 mM, pH 7), the nIFN-β-1b was eluted in a sharp peak.
The new running buffer did effectively improve the “tailing” and “fronting” (Figure IV-5). By
further optimizing the flow rate (too fast flow rate resulted in an insufficient separation) and
the slope of the gradient, the peak shape and the tailing was additionally improved (Figure
IV-6 and Figure IV-7).
time [min]
0 20 40 60 80 100
UV
abs
orba
nce
[mA
U]
0
10
20
30
40
cond
ucti
vity
[m
S/cm
]
0
20
40
60
80
100
perc
enta
ge o
f 1
M N
aCl
0
20
40
60
80
100phosphate pH 7
Tris-HCl pH 7
time vs conductivity
time vs %B
Figure IV-5 cation exchange chromatograms of native IFN-β-1b using phosphate buffer pH 7 and Tris-HCl pH 7 (used column: HiTrap SP HP, 1 ml)
Regarding the purification of the 10 kDa PEG-IFN synthesis, optimization of the IEX method
did improve the purity of 10 kDa monoPEGylated IFN-β-1b but a separation between
monoPEGylated and multiple-PEGylated species was not achieved. Both, RP-HPLC and SDS-
PAGE confirmed the incomplete separation of the products (Figure IV-6). In fraction 7 only
PEGylated proteins are present. Multiple PEGylated IFN-β-1b species represent here the
majority of the molecules. In fraction 16 tri-PEGylated protein was completely removed and
the amount of di- and monoPEGylated proteins were predominant. A very small fraction of
nIFN was still present (< 5 %).
The removal of nIFN was most widely achieved with a residue of nIFN lower than 5 % in a
purified fraction, but a separation of mono- and diPEGylated proteins was not possible under
the used gradient and running buffers. To improve the separation between the 10 kDa mono-
and multiple-PEGylated species a two-step purification process was tested. The first step was
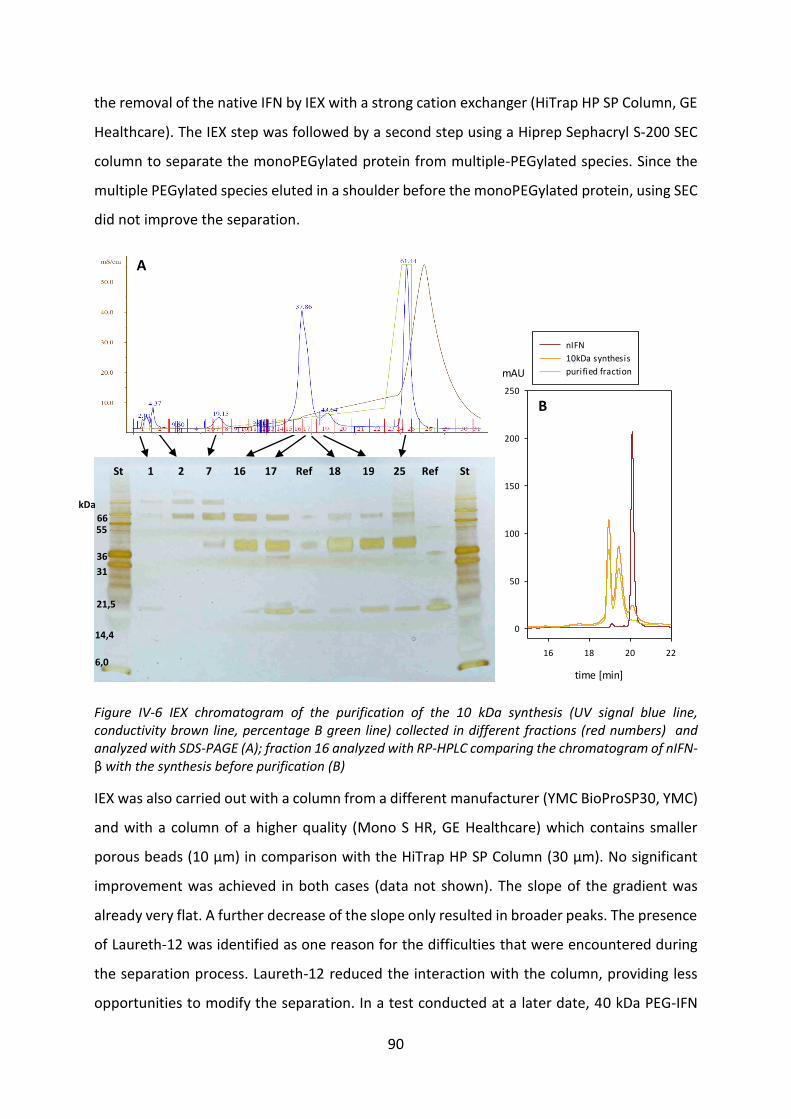
90
the removal of the native IFN by IEX with a strong cation exchanger (HiTrap HP SP Column, GE
Healthcare). The IEX step was followed by a second step using a Hiprep Sephacryl S-200 SEC
column to separate the monoPEGylated protein from multiple-PEGylated species. Since the
multiple PEGylated species eluted in a shoulder before the monoPEGylated protein, using SEC
did not improve the separation.
time [min]
16 18 20 22
mAU
0
50
100
150
200
250
nIFN
10kDa synthesis
purified fraction
Figure IV-6 IEX chromatogram of the purification of the 10 kDa synthesis (UV signal blue line, conductivity brown line, percentage B green line) collected in different fractions (red numbers) and analyzed with SDS-PAGE (A); fraction 16 analyzed with RP-HPLC comparing the chromatogram of nIFN-β with the synthesis before purification (B)
IEX was also carried out with a column from a different manufacturer (YMC BioProSP30, YMC)
and with a column of a higher quality (Mono S HR, GE Healthcare) which contains smaller
porous beads (10 µm) in comparison with the HiTrap HP SP Column (30 µm). No significant
improvement was achieved in both cases (data not shown). The slope of the gradient was
already very flat. A further decrease of the slope only resulted in broader peaks. The presence
of Laureth-12 was identified as one reason for the difficulties that were encountered during
the separation process. Laureth-12 reduced the interaction with the column, providing less
opportunities to modify the separation. In a test conducted at a later date, 40 kDa PEG-IFN
6,0
14,4
31
21,5
36
55 66
kDa
St 1 2 7 16 17 Ref 18 19 25 Ref St
A
B
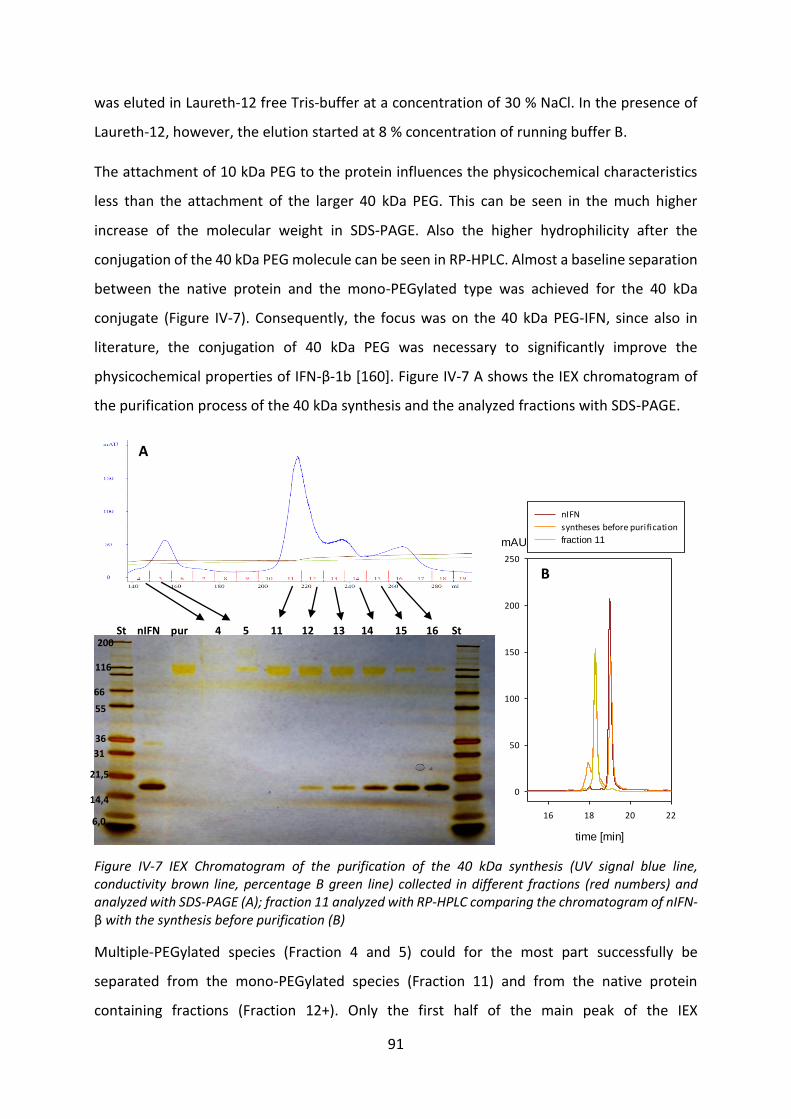
91
was eluted in Laureth-12 free Tris-buffer at a concentration of 30 % NaCl. In the presence of
Laureth-12, however, the elution started at 8 % concentration of running buffer B.
The attachment of 10 kDa PEG to the protein influences the physicochemical characteristics
less than the attachment of the larger 40 kDa PEG. This can be seen in the much higher
increase of the molecular weight in SDS-PAGE. Also the higher hydrophilicity after the
conjugation of the 40 kDa PEG molecule can be seen in RP-HPLC. Almost a baseline separation
between the native protein and the mono-PEGylated type was achieved for the 40 kDa
conjugate (Figure IV-7). Consequently, the focus was on the 40 kDa PEG-IFN, since also in
literature, the conjugation of 40 kDa PEG was necessary to significantly improve the
physicochemical properties of IFN-β-1b [160]. Figure IV-7 A shows the IEX chromatogram of
the purification process of the 40 kDa synthesis and the analyzed fractions with SDS-PAGE.
time [min]
16 18 20 22
mAU
0
50
100
150
200
250
nIFN
syntheses before purification
fraction 11
Figure IV-7 IEX Chromatogram of the purification of the 40 kDa synthesis (UV signal blue line, conductivity brown line, percentage B green line) collected in different fractions (red numbers) and analyzed with SDS-PAGE (A); fraction 11 analyzed with RP-HPLC comparing the chromatogram of nIFN-β with the synthesis before purification (B)
Multiple-PEGylated species (Fraction 4 and 5) could for the most part successfully be
separated from the mono-PEGylated species (Fraction 11) and from the native protein
containing fractions (Fraction 12+). Only the first half of the main peak of the IEX
St nIFN pur 4 5 11 12 13 14 15 16 St
6,0
14,4
31
21,5
36
55
200
116
66
B
A
92
chromatogram contained mono-PEGylated species with a content of nIFN of less than 1 % and
multiple-PEGylated species less than 5 % according to RP-HPLC. Since additional columns
(Hiprep Sephacryl S-200 SEC, YMC BioProSP30-IEX, Mono S HR) did not significantly improve
the separation, the process was scaled up from using a 1 ml HiTrap HP SP Column to a XK
26/30 column (780 ml) packed with SP Sepharose High Performance medium (GE Healthcare,
Germany). To increase the yield, fractions containing larger amounts of mono-PEGylated
protein and multi-PEGylated respectively native protein were pooled and purified again using
the same IEX method. This resulted in an increase of the multi-PEGylated species up to 10 %
but the yield of the mono-PEGylated protein was increased from under 10 % to 25-30 % after
purification. The yield is based on the used protein amount before synthesis (approx. 50 %
PEGylated species due to the incomplete synthesis of the 40 kDa PEG-IFN).
2.2 Characterization of 40 kDa PEG-IFN-β-1b
2.2.1 Determination of the molecular weight of the product
To confirm the monoPEGylation of the purified fraction, the molecular weight was determined
by SEC-MALS (Figure IV-8). The residues of di-PEGylated IFN species were separated from the
monoPEGylated species using a SEC 3000SWXL column.
The measured molecular mass of the monoPEGylated protein was 59.6 kDa with a
polydispersity of 0.6 %. The molecular weight of the polymer alone could successfully be
determined at 40.1 kDa with a polydispersity of 1 % which matches exactly the polydispersity
of the certificate of analysis of the PEG. The molecular mass of the protein was measured at
18.5 kDa. Though, it was not possible to calculate the molecular weight of the diPEGylated
peak with this method. This is probably due to the fact that the diPEGylated peak consists of
a mixture of different species of larger molecules (multiple PEGylated IFN-β-1b,
monoPEGylated IFN-β-1b aggregates).

93
Figure IV-8 Detail of the chromatogram of SEC-MALS analysis to determine the mass of the monoPEGylated species of the 40 kDa PEG-IFN (total mass) the molar mass of the conjugate (modifier mass) and of the protein (protein mass).
Furthermore, the molecular weight was determined by SE-HPLC using a 3000SWXL column
comparing the retention times with a gel filtration standard by Bio Rad. The size of the PEG-
IFN-β-1b was also determined by SDS-PAGE analytics using a Mark 12™ unstained standard.
The big difference in size between SE-HPLC and the calculated mass can be explained by the
fact that SEC does not measure the mass of the analyte but its hydrodynamic volume. PEG
increases the hydrodynamic volume which is significantly increased by branched PEG
molecules [20, 197]. Since the electrophoretic mobility is also depending on the hydrodynamic
radius, the calculated molecular weight of the product differs also in SDS-PAGE [197].
2.2.2 Secondary structure of PEG-IFN
FTIR measurements were conducted to determine the influence of PEGylation on the
secondary structure of the protein. According to literature, no changes of the secondary
structure are expected [160]. The peak at 1654 cm-1 of the native IFN derives from α-helical
structures. The peak at 1622 cm-1 can be assigned to β-sheet structures. The PEG-IFN sample
shows a decrease in the intensity of the peak in the area of 1622 cm-1 in comparison to nIFN.
This decrease in intensity points to a decrease of β-sheet structures for the PEG-IFN. It is
known from literature, that an increased intensity in the β-sheet region can be attributed to
intermolecular β-sheets within aggregated protein [198]. The native IFN-β-1b is prone to
aggregation, which can be reduced by PEGylation [160] and this could be a reason for the
decreased intensity of the β-sheet band. Also the adsorption of the protein to the surface of
the measuring cell can result in an elevated intensity at 1622 cm−1 at pH 3.0. This has also been
observed by Hawe et al. for a hydrophobic cytokine comparing the spectra obtained with a
flow through cell with the spectra obtained from the ATR cell [177]. Since PEGylation should
decrease these interactions due to changed physical properties and steric hindering, this
method molecular mass
calculated 58.5 kDa
SE-HPLC ≈ 320 kDa
SDS-PAGE ≈ 120 kDa
SEC-MALS 59.6 kDa
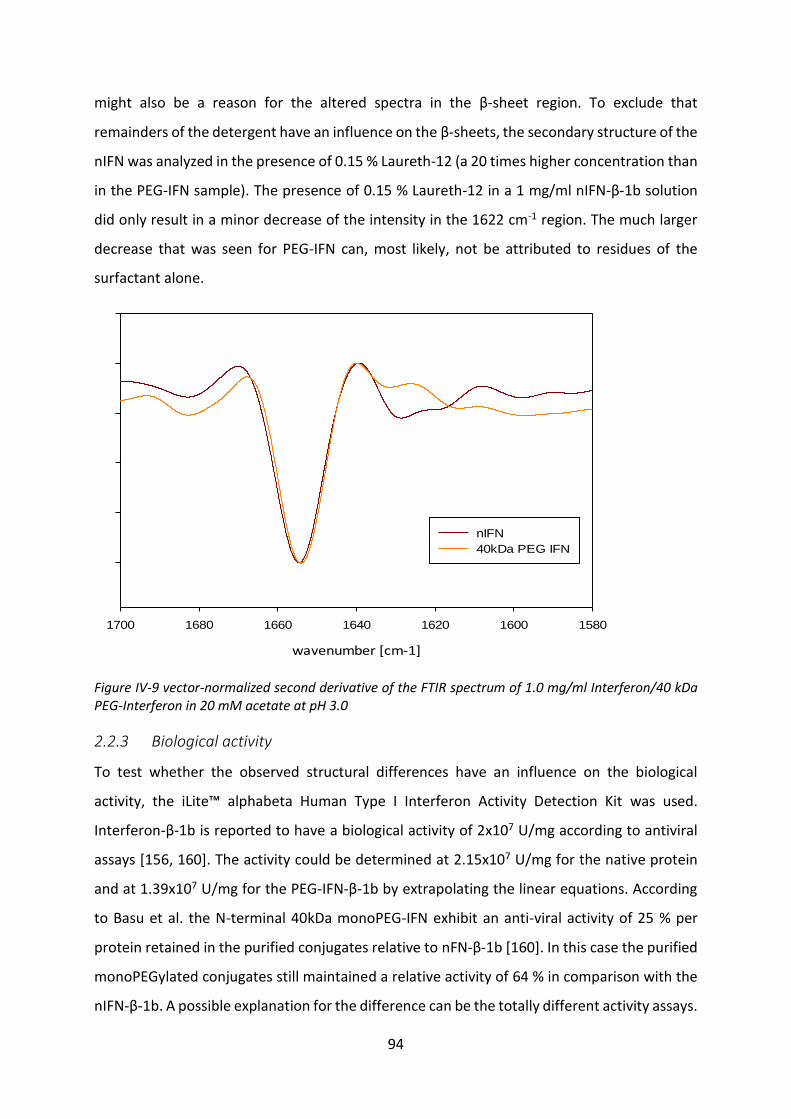
94
might also be a reason for the altered spectra in the β-sheet region. To exclude that
remainders of the detergent have an influence on the β-sheets, the secondary structure of the
nIFN was analyzed in the presence of 0.15 % Laureth-12 (a 20 times higher concentration than
in the PEG-IFN sample). The presence of 0.15 % Laureth-12 in a 1 mg/ml nIFN-β-1b solution
did only result in a minor decrease of the intensity in the 1622 cm-1 region. The much larger
decrease that was seen for PEG-IFN can, most likely, not be attributed to residues of the
surfactant alone.
wavenumber [cm-1]
1580160016201640166016801700
nIFN
40kDa PEG IFN
Figure IV-9 vector-normalized second derivative of the FTIR spectrum of 1.0 mg/ml Interferon/40 kDa PEG-Interferon in 20 mM acetate at pH 3.0
2.2.3 Biological activity
To test whether the observed structural differences have an influence on the biological
activity, the iLite™ alphabeta Human Type I Interferon Activity Detection Kit was used.
Interferon-β-1b is reported to have a biological activity of 2x10⁷ U/mg according to antiviral
assays [156, 160]. The activity could be determined at 2.15x10⁷ U/mg for the native protein
and at 1.39x10⁷ U/mg for the PEG-IFN-β-1b by extrapolating the linear equations. According
to Basu et al. the N-terminal 40kDa monoPEG-IFN exhibit an anti-viral activity of 25 % per
protein retained in the purified conjugates relative to nFN-β-1b [160]. In this case the purified
monoPEGylated conjugates still maintained a relative activity of 64 % in comparison with the
nIFN-β-1b. A possible explanation for the difference can be the totally different activity assays.
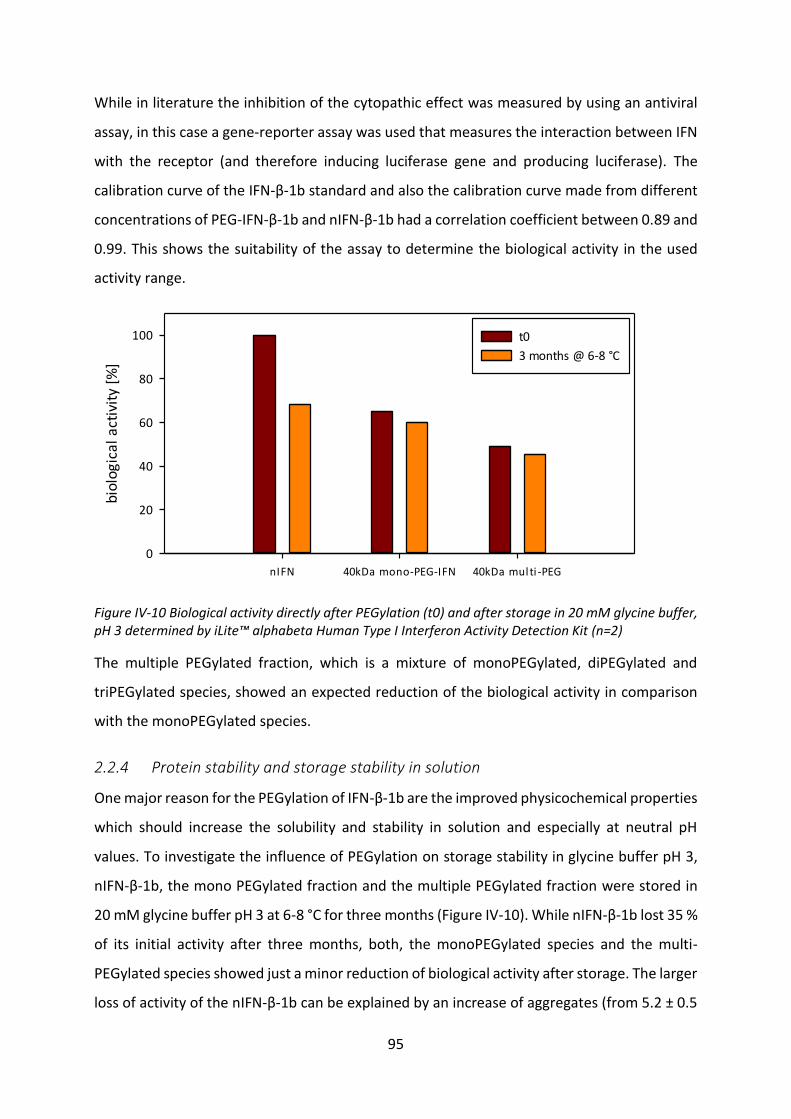
95
While in literature the inhibition of the cytopathic effect was measured by using an antiviral
assay, in this case a gene-reporter assay was used that measures the interaction between IFN
with the receptor (and therefore inducing luciferase gene and producing luciferase). The
calibration curve of the IFN-β-1b standard and also the calibration curve made from different
concentrations of PEG-IFN-β-1b and nIFN-β-1b had a correlation coefficient between 0.89 and
0.99. This shows the suitability of the assay to determine the biological activity in the used
activity range.
nIFN 40kDa mono-PEG-IFN 40kDa multi -PEG
bio
log
ica
l a
ctiv
ity
[%]
0
20
40
60
80
100 t0
3 months @ 6-8 °C
Figure IV-10 Biological activity directly after PEGylation (t0) and after storage in 20 mM glycine buffer, pH 3 determined by iLite™ alphabeta Human Type I Interferon Activity Detection Kit (n=2)
The multiple PEGylated fraction, which is a mixture of monoPEGylated, diPEGylated and
triPEGylated species, showed an expected reduction of the biological activity in comparison
with the monoPEGylated species.
2.2.4 Protein stability and storage stability in solution
One major reason for the PEGylation of IFN-β-1b are the improved physicochemical properties
which should increase the solubility and stability in solution and especially at neutral pH
values. To investigate the influence of PEGylation on storage stability in glycine buffer pH 3,
nIFN-β-1b, the mono PEGylated fraction and the multiple PEGylated fraction were stored in
20 mM glycine buffer pH 3 at 6-8 °C for three months (Figure IV-10). While nIFN-β-1b lost 35 %
of its initial activity after three months, both, the monoPEGylated species and the multi-
PEGylated species showed just a minor reduction of biological activity after storage. The larger
loss of activity of the nIFN-β-1b can be explained by an increase of aggregates (from 5.2 ± 0.5
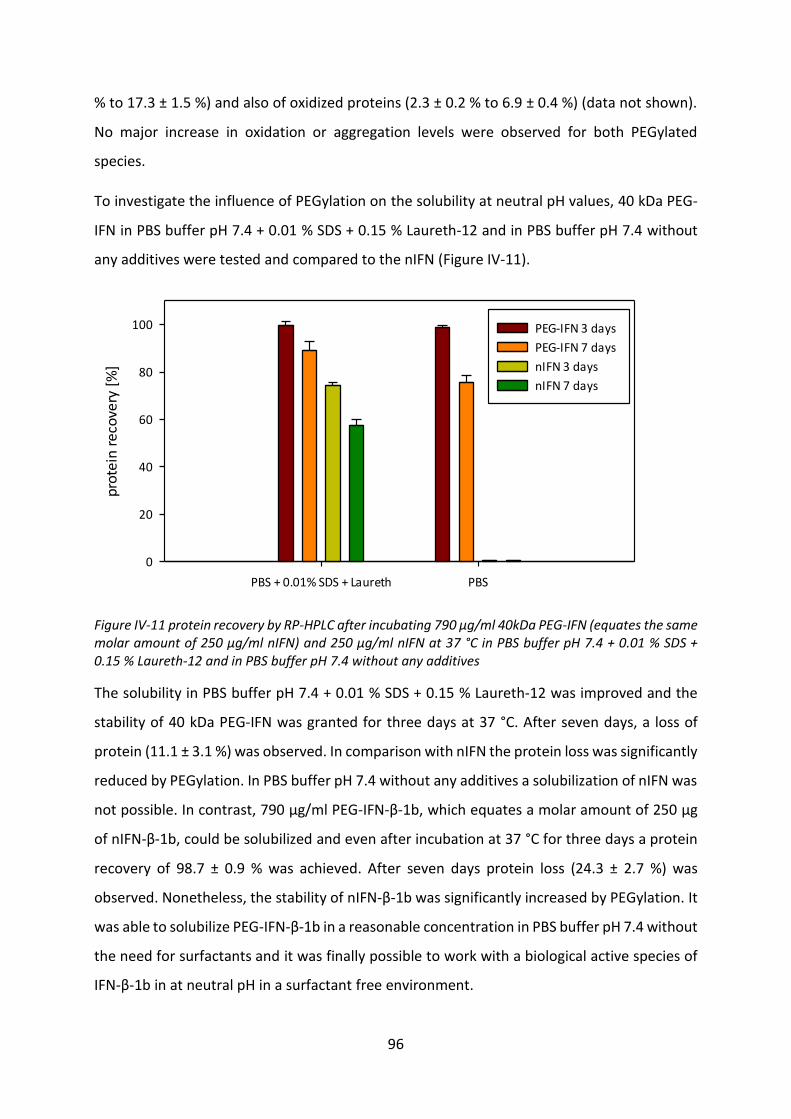
96
% to 17.3 ± 1.5 %) and also of oxidized proteins (2.3 ± 0.2 % to 6.9 ± 0.4 %) (data not shown).
No major increase in oxidation or aggregation levels were observed for both PEGylated
species.
To investigate the influence of PEGylation on the solubility at neutral pH values, 40 kDa PEG-
IFN in PBS buffer pH 7.4 + 0.01 % SDS + 0.15 % Laureth-12 and in PBS buffer pH 7.4 without
any additives were tested and compared to the nIFN (Figure IV-11).
PBS + 0.01% SDS + Laureth PBS
pro
tein
re
cove
ry [
%]
0
20
40
60
80
100 PEG-IFN 3 days
PEG-IFN 7 days
nIFN 3 days
nIFN 7 days
Figure IV-11 protein recovery by RP-HPLC after incubating 790 µg/ml 40kDa PEG-IFN (equates the same molar amount of 250 µg/ml nIFN) and 250 µg/ml nIFN at 37 °C in PBS buffer pH 7.4 + 0.01 % SDS + 0.15 % Laureth-12 and in PBS buffer pH 7.4 without any additives
The solubility in PBS buffer pH 7.4 + 0.01 % SDS + 0.15 % Laureth-12 was improved and the
stability of 40 kDa PEG-IFN was granted for three days at 37 °C. After seven days, a loss of
protein (11.1 ± 3.1 %) was observed. In comparison with nIFN the protein loss was significantly
reduced by PEGylation. In PBS buffer pH 7.4 without any additives a solubilization of nIFN was
not possible. In contrast, 790 µg/ml PEG-IFN-β-1b, which equates a molar amount of 250 µg
of nIFN-β-1b, could be solubilized and even after incubation at 37 °C for three days a protein
recovery of 98.7 ± 0.9 % was achieved. After seven days protein loss (24.3 ± 2.7 %) was
observed. Nonetheless, the stability of nIFN-β-1b was significantly increased by PEGylation. It
was able to solubilize PEG-IFN-β-1b in a reasonable concentration in PBS buffer pH 7.4 without
the need for surfactants and it was finally possible to work with a biological active species of
IFN-β-1b in at neutral pH in a surfactant free environment.
97
3 Release from solid lipid implants
3.1 Development of HSA-free PEG-IFN lyophilisate
In this chapter the option to combine two different depot principles was investigated:
PEGylation of IFN-β-1b and the incorporation in a depot system. PEGylation increases the
plasma half-life of IFN-β-1b from 1-2 h to around 7-18 h (depending on the PEGylation site and
PEG size [160, 195]. This makes the delivery of PEG-IFN-β-1b via a depot formulation quite
interesting, in order to increase the half-life even further. For the preparation of the
extrudates the development of a stable HSA-free PEG-IFN-β-1b lyophilisate as an intermediate
is necessary.
As mentioned in Chapter III 1, a protein:sugar-ratio of 1:6.7 for the native protein is needed
for a therapeutic dose. Since monoPEGylation with 40 kDa PEG increases the mass of the
native protein by 216 %, the protein-conjugate:sugar-ratio has to be decreased to at least
1:2.4. This ratio maintains the same molar amount of protein in the same mass of lyophilisate
compared to the lyophilisate of the native protein.
During freezing of PEG alone and also of PEG which is covalently bound to proteins, the
polymer tends to crystallize and is able to have an influence on protein stability [199].
Bhatnagar et al. were able to modify and even inhibit the crystallization of free PEG by using
additives like high sucrose to PEG ratios. The addition of sucrose, however, did not influence
the crystallization of covalently attached PEG. The crystallization of a 40 kDa PEG covalently
attached to a human growth hormone did not influence the protein stability during freeze
drying. However, the authors mentioned a negative influence during storage [200]. Also other
authors sounded a note of caution regarding the lyophilisation of PEGylated proteins. By
PEGylation the proteins surface characteristics changes and therefore also the interaction
between the stabilizing excipients and the protein vary [201]. But also protective effects of
PEG (8 kDa) co-lyophilized with lactate dehydrogenase have been shown [202].
Therefore, different formulations of PEG-IFN were tested (Table IV-III). Formulation 2 and 3
match the above mentioned requirements containing a therapeutic sufficient amount of
protein to act as a suitable intermediate for extrudate preparation. Formulation 1 and 4 were
used as a comparison to investigate the influence of different protein-excipient-ratios.
Formulation 1 has the exact same molar protein:sugar-ratio as the trehalose formulation for
98
the nIFN-β-1b, which was used for extrudate preparation. Formulation 4 tests the influence of
a higher amount of excipients.
Table IV-III Overview of the tested 40kDa PEG-IFN-beta lyophilisate formulations
formulation PEG-IFN
[mg/ml]
Glycine
[mg/ml]
trehalose
[mg/ml]
total mass
[mg/ml]
protein:sugar-
ratio
1 1.00 0.77 5.92 7.69 1:7.7
2 3.16 / / 3.16 /
3 3.16 0.52 4.01 7.69 1:1.4
4 1.00 0.77 16.00 17.77 1:16
3.1.1 Residual moisture
The same lyophilisation cycle as for the nIFN formulation was used for the lyophilisation of the
PEG-IFN-β-1b samples (see Chapter III 2.2.11). To see if the lyophilisation process is also
suitable for the PEG-IFN, the residual moisture was analyzed by Karl-Fischer-titration. All
lyophilized formulations had a water content < 1 % indicating efficient drying (Table IV-IV).
Mosharraf et al. observed a decrease of the residual moisture when PEG was incorporated
into the lyophilisate using a recombinant growth hormone antagonist [203]. This effect was
even more pronounced when the PEG (5x 6 kDa) was covalently bound to the protein. It was
suggested that the ability of the protein to bind water is changed by PEGylation. In our studies,
a tendency to decreased residual moisture of the formulation containing the PEGylated
protein was observed (Table IV-IV).
Table IV-IV Residual moisture after lyophilisation determined by Karl-Fischer titration
formulation residual moisture
nIFN 0.005 % PS20 0.79 % ± 0.22
nIFN 0.02 % PS20 0.82 % ± 0.15
nIFN 0% PS20 0.73 % ± 0.08
PEG-IFN formulation 1 0.46 % ± 0.06
PEG-IFN formulation 2 0.52 % ± 0.10
PEG-IFN formulation 3 0.56 % ± 0.09
PEG-IFN formulation 4 0.65 % ± 0.03
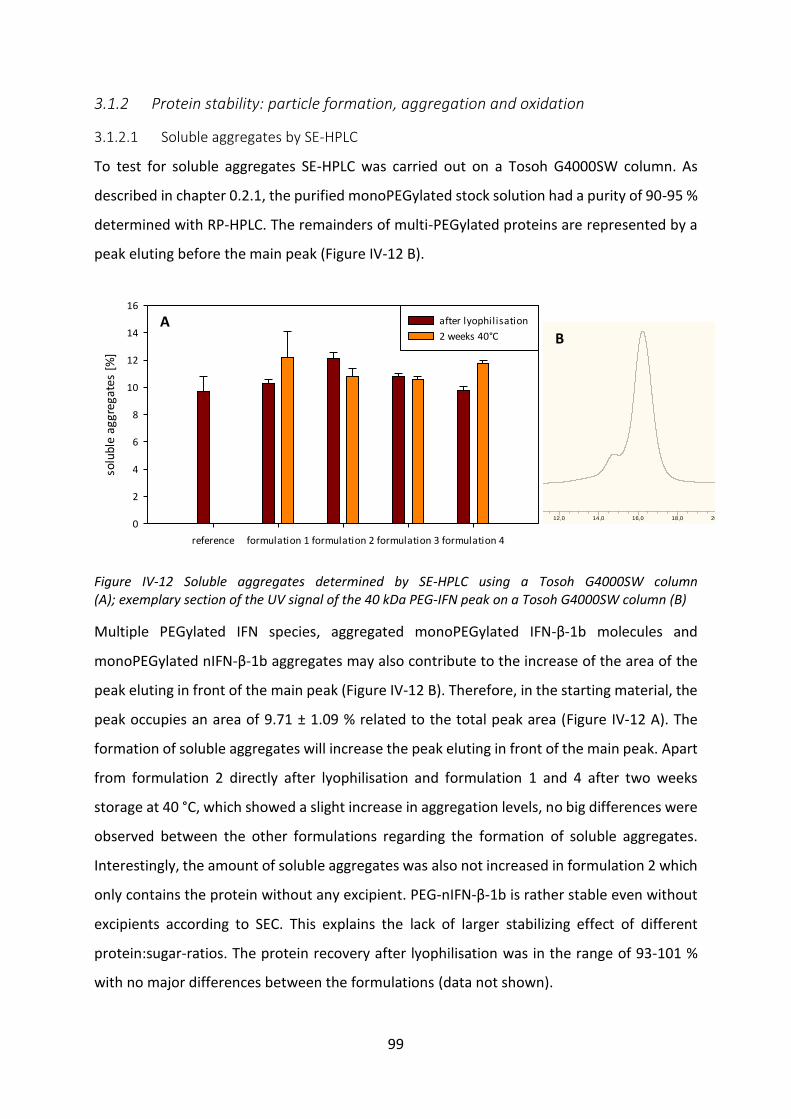
99
3.1.2 Protein stability: particle formation, aggregation and oxidation
3.1.2.1 Soluble aggregates by SE-HPLC
To test for soluble aggregates SE-HPLC was carried out on a Tosoh G4000SW column. As
described in chapter 0.2.1, the purified monoPEGylated stock solution had a purity of 90-95 %
determined with RP-HPLC. The remainders of multi-PEGylated proteins are represented by a
peak eluting before the main peak (Figure IV-12 B).
reference formulation 1 formulation 2 formulation 3 formulation 4
solu
ble
aggr
egat
es [
%]
0
2
4
6
8
10
12
14
16
after lyophilisation
2 weeks 40°C
Figure IV-12 Soluble aggregates determined by SE-HPLC using a Tosoh G4000SW column (A); exemplary section of the UV signal of the 40 kDa PEG-IFN peak on a Tosoh G4000SW column (B)
Multiple PEGylated IFN species, aggregated monoPEGylated IFN-β-1b molecules and
monoPEGylated nIFN-β-1b aggregates may also contribute to the increase of the area of the
peak eluting in front of the main peak (Figure IV-12 B). Therefore, in the starting material, the
peak occupies an area of 9.71 ± 1.09 % related to the total peak area (Figure IV-12 A). The
formation of soluble aggregates will increase the peak eluting in front of the main peak. Apart
from formulation 2 directly after lyophilisation and formulation 1 and 4 after two weeks
storage at 40 °C, which showed a slight increase in aggregation levels, no big differences were
observed between the other formulations regarding the formation of soluble aggregates.
Interestingly, the amount of soluble aggregates was also not increased in formulation 2 which
only contains the protein without any excipient. PEG-nIFN-β-1b is rather stable even without
excipients according to SEC. This explains the lack of larger stabilizing effect of different
protein:sugar-ratios. The protein recovery after lyophilisation was in the range of 93-101 %
with no major differences between the formulations (data not shown).
0,0 2,0 4,0 6,0 8,0 10,0 12,0 14,0 16,0 18,0 20,0 22,0 24,0 26,0 28,0 30,0 32,0 35,0
-20
0
20
40
60
80
100
120SEC Stabi Lyo PEG-IFN SW4000 #10 [modified by user] Formulierung 3.1 t0 UV_VIS_1mAU
min
WVL:280 nmA B
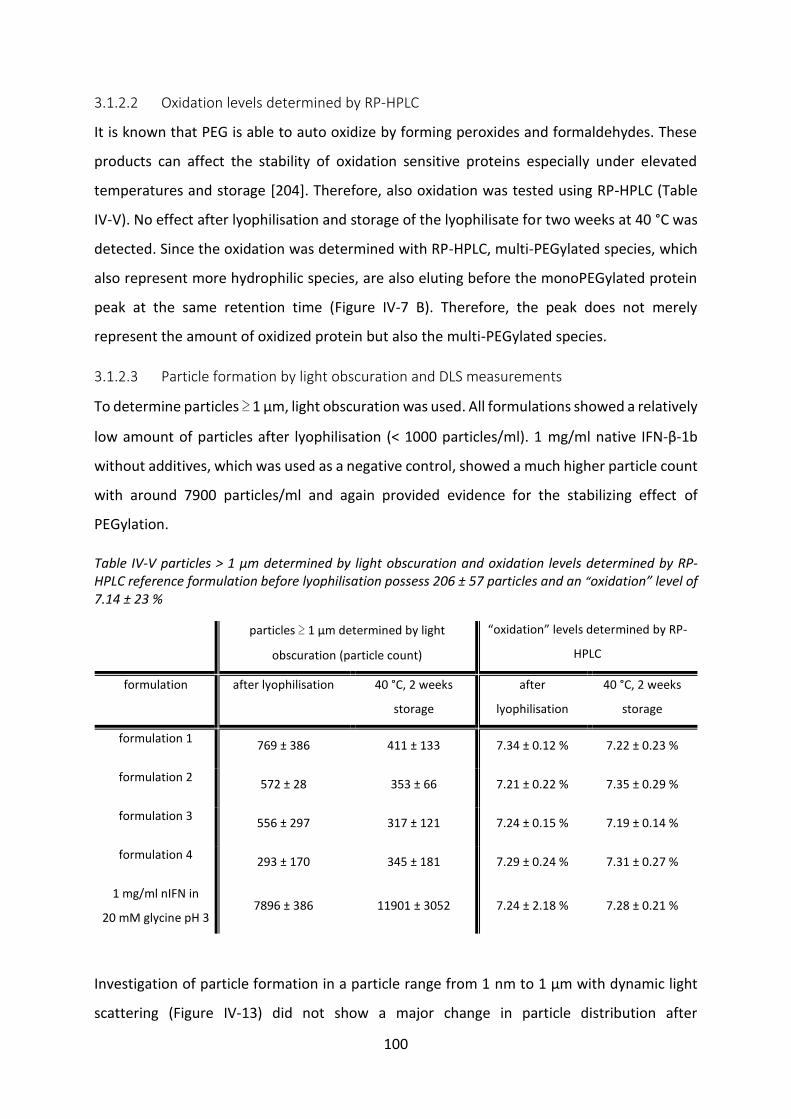
100
3.1.2.2 Oxidation levels determined by RP-HPLC
It is known that PEG is able to auto oxidize by forming peroxides and formaldehydes. These
products can affect the stability of oxidation sensitive proteins especially under elevated
temperatures and storage [204]. Therefore, also oxidation was tested using RP-HPLC (Table
IV-V). No effect after lyophilisation and storage of the lyophilisate for two weeks at 40 °C was
detected. Since the oxidation was determined with RP-HPLC, multi-PEGylated species, which
also represent more hydrophilic species, are also eluting before the monoPEGylated protein
peak at the same retention time (Figure IV-7 B). Therefore, the peak does not merely
represent the amount of oxidized protein but also the multi-PEGylated species.
3.1.2.3 Particle formation by light obscuration and DLS measurements
To determine particles ≥ 1 μm, light obscuration was used. All formulations showed a relatively
low amount of particles after lyophilisation (< 1000 particles/ml). 1 mg/ml native IFN-β-1b
without additives, which was used as a negative control, showed a much higher particle count
with around 7900 particles/ml and again provided evidence for the stabilizing effect of
PEGylation.
Table IV-V particles > 1 µm determined by light obscuration and oxidation levels determined by RP-HPLC reference formulation before lyophilisation possess 206 ± 57 particles and an “oxidation” level of 7.14 ± 23 %
particles ≥ 1 μm determined by light
obscuration (particle count)
“oxidation” levels determined by RP-
HPLC
formulation after lyophilisation
40 °C, 2 weeks
storage
after
lyophilisation
40 °C, 2 weeks
storage
formulation 1 769 ± 386 411 ± 133 7.34 ± 0.12 % 7.22 ± 0.23 %
formulation 2 572 ± 28 353 ± 66 7.21 ± 0.22 % 7.35 ± 0.29 %
formulation 3 556 ± 297 317 ± 121 7.24 ± 0.15 % 7.19 ± 0.14 %
formulation 4 293 ± 170 345 ± 181 7.29 ± 0.24 % 7.31 ± 0.27 %
1 mg/ml nIFN in
20 mM glycine pH 3 7896 ± 386 11901 ± 3052 7.24 ± 2.18 % 7.28 ± 0.21 %
Investigation of particle formation in a particle range from 1 nm to 1 µm with dynamic light
scattering (Figure IV-13) did not show a major change in particle distribution after
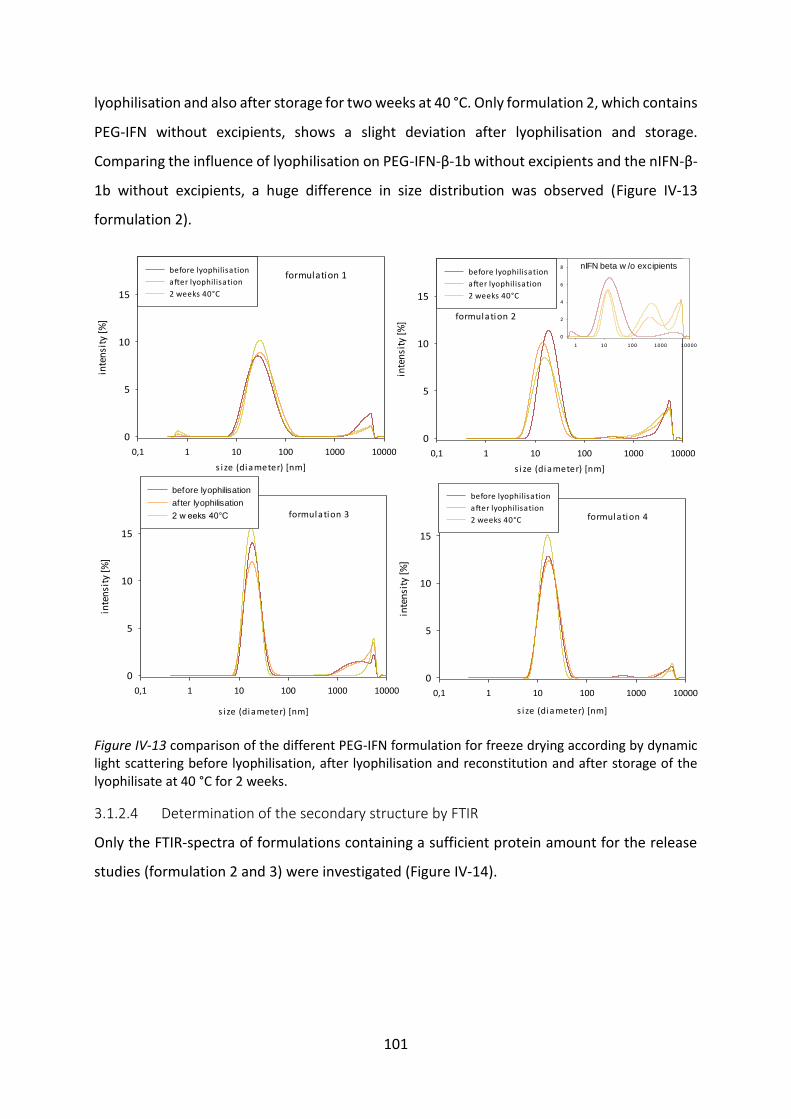
101
lyophilisation and also after storage for two weeks at 40 °C. Only formulation 2, which contains
PEG-IFN without excipients, shows a slight deviation after lyophilisation and storage.
Comparing the influence of lyophilisation on PEG-IFN-β-1b without excipients and the nIFN-β-
1b without excipients, a huge difference in size distribution was observed (Figure IV-13
formulation 2).
formulation 1
s ize (diameter) [nm]
0,1 1 10 100 1000 10000
inte
nsi
ty [
%]
0
5
10
15
before lyophilisation
after lyophilisation
2 weeks 40°C
formulation 2
s ize (diameter) [nm]
0,1 1 10 100 1000 10000
inte
nsi
ty [
%]
0
5
10
15
before lyophilisation
after lyophilisation
2 weeks 40°C
formulation 4
s ize (diameter) [nm]
0,1 1 10 100 1000 10000
inte
nsi
ty [
%]
0
5
10
15
before lyophilisation
after lyophilisation
2 weeks 40°Cformulation 3
s ize (diameter) [nm]
0,1 1 10 100 1000 10000
inte
nsi
ty [
%]
0
5
10
15
before lyophilisation
after lyophilisation
2 w eeks 40°C
nIFN beta w /o excipients
1 10 100 1000 10000
0
2
4
6
8
Figure IV-13 comparison of the different PEG-IFN formulation for freeze drying according by dynamic light scattering before lyophilisation, after lyophilisation and reconstitution and after storage of the lyophilisate at 40 °C for 2 weeks.
3.1.2.4 Determination of the secondary structure by FTIR
Only the FTIR-spectra of formulations containing a sufficient protein amount for the release
studies (formulation 2 and 3) were investigated (Figure IV-14).
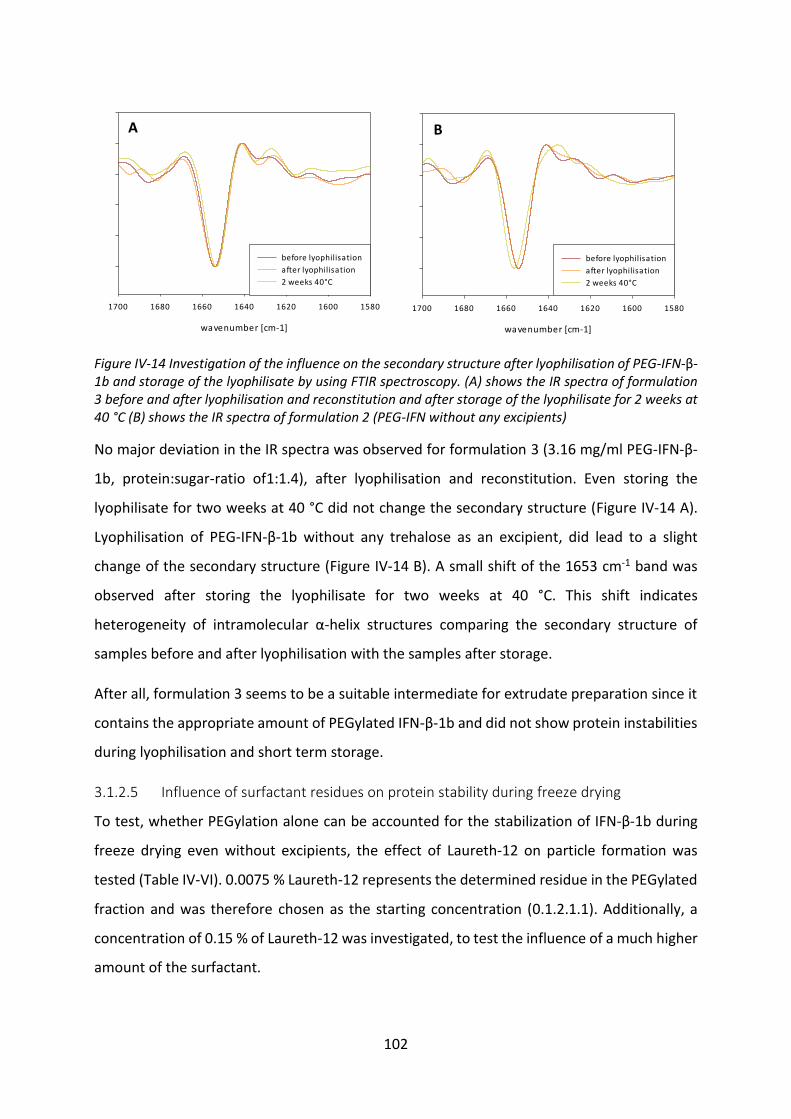
102
wavenumber [cm-1]
1580160016201640166016801700
before lyophilisation
after lyophilisation
2 weeks 40°C
wavenumber [cm-1]
1580160016201640166016801700
before lyophilisation
after lyophilisation
2 weeks 40°C
Figure IV-14 Investigation of the influence on the secondary structure after lyophilisation of PEG-IFN-β-1b and storage of the lyophilisate by using FTIR spectroscopy. (A) shows the IR spectra of formulation 3 before and after lyophilisation and reconstitution and after storage of the lyophilisate for 2 weeks at 40 °C (B) shows the IR spectra of formulation 2 (PEG-IFN without any excipients)
No major deviation in the IR spectra was observed for formulation 3 (3.16 mg/ml PEG-IFN-β-
1b, protein:sugar-ratio of1:1.4), after lyophilisation and reconstitution. Even storing the
lyophilisate for two weeks at 40 °C did not change the secondary structure (Figure IV-14 A).
Lyophilisation of PEG-IFN-β-1b without any trehalose as an excipient, did lead to a slight
change of the secondary structure (Figure IV-14 B). A small shift of the 1653 cm-1 band was
observed after storing the lyophilisate for two weeks at 40 °C. This shift indicates
heterogeneity of intramolecular α-helix structures comparing the secondary structure of
samples before and after lyophilisation with the samples after storage.
After all, formulation 3 seems to be a suitable intermediate for extrudate preparation since it
contains the appropriate amount of PEGylated IFN-β-1b and did not show protein instabilities
during lyophilisation and short term storage.
3.1.2.5 Influence of surfactant residues on protein stability during freeze drying
To test, whether PEGylation alone can be accounted for the stabilization of IFN-β-1b during
freeze drying even without excipients, the effect of Laureth-12 on particle formation was
tested (Table IV-VI). 0.0075 % Laureth-12 represents the determined residue in the PEGylated
fraction and was therefore chosen as the starting concentration (0.1.2.1.1). Additionally, a
concentration of 0.15 % of Laureth-12 was investigated, to test the influence of a much higher
amount of the surfactant.
A B
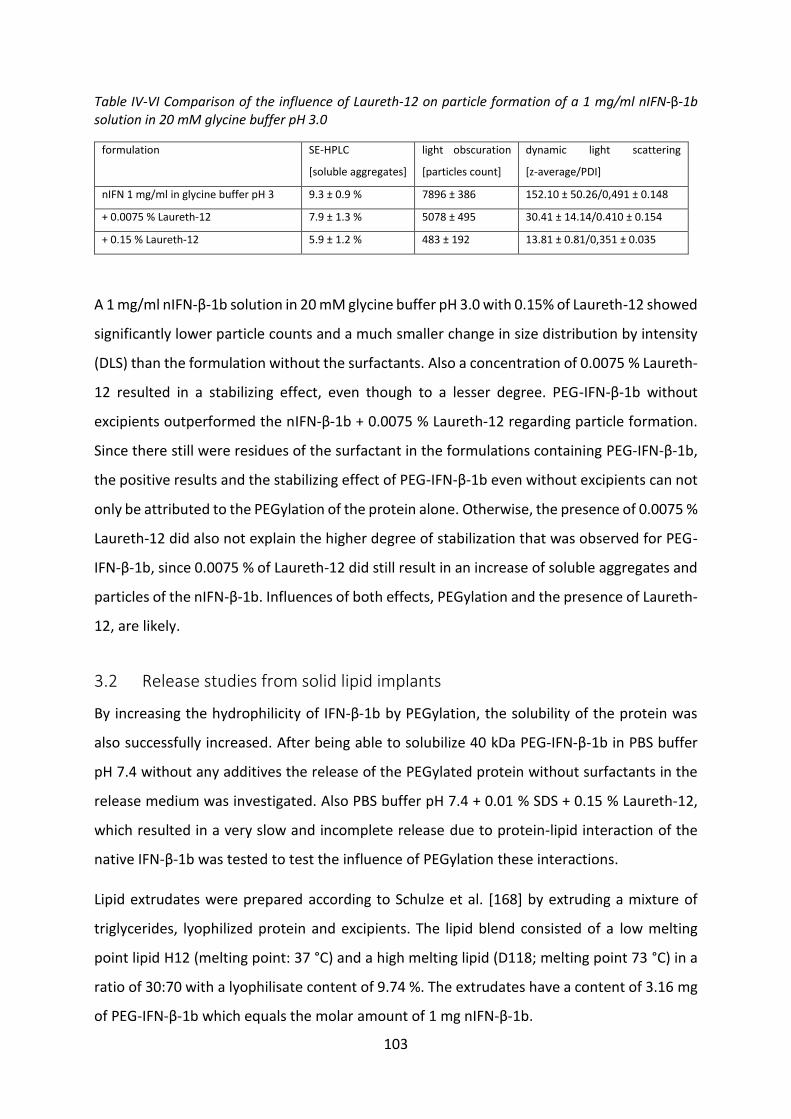
103
Table IV-VI Comparison of the influence of Laureth-12 on particle formation of a 1 mg/ml nIFN-β-1b solution in 20 mM glycine buffer pH 3.0
formulation SE-HPLC
[soluble aggregates]
light obscuration
[particles count]
dynamic light scattering
[z-average/PDI]
nIFN 1 mg/ml in glycine buffer pH 3 9.3 ± 0.9 % 7896 ± 386 152.10 ± 50.26/0,491 ± 0.148
+ 0.0075 % Laureth-12 7.9 ± 1.3 % 5078 ± 495 30.41 ± 14.14/0.410 ± 0.154
+ 0.15 % Laureth-12 5.9 ± 1.2 % 483 ± 192 13.81 ± 0.81/0,351 ± 0.035
A 1 mg/ml nIFN-β-1b solution in 20 mM glycine buffer pH 3.0 with 0.15% of Laureth-12 showed
significantly lower particle counts and a much smaller change in size distribution by intensity
(DLS) than the formulation without the surfactants. Also a concentration of 0.0075 % Laureth-
12 resulted in a stabilizing effect, even though to a lesser degree. PEG-IFN-β-1b without
excipients outperformed the nIFN-β-1b + 0.0075 % Laureth-12 regarding particle formation.
Since there still were residues of the surfactant in the formulations containing PEG-IFN-β-1b,
the positive results and the stabilizing effect of PEG-IFN-β-1b even without excipients can not
only be attributed to the PEGylation of the protein alone. Otherwise, the presence of 0.0075 %
Laureth-12 did also not explain the higher degree of stabilization that was observed for PEG-
IFN-β-1b, since 0.0075 % of Laureth-12 did still result in an increase of soluble aggregates and
particles of the nIFN-β-1b. Influences of both effects, PEGylation and the presence of Laureth-
12, are likely.
3.2 Release studies from solid lipid implants
By increasing the hydrophilicity of IFN-β-1b by PEGylation, the solubility of the protein was
also successfully increased. After being able to solubilize 40 kDa PEG-IFN-β-1b in PBS buffer
pH 7.4 without any additives the release of the PEGylated protein without surfactants in the
release medium was investigated. Also PBS buffer pH 7.4 + 0.01 % SDS + 0.15 % Laureth-12,
which resulted in a very slow and incomplete release due to protein-lipid interaction of the
native IFN-β-1b was tested to test the influence of PEGylation these interactions.
Lipid extrudates were prepared according to Schulze et al. [168] by extruding a mixture of
triglycerides, lyophilized protein and excipients. The lipid blend consisted of a low melting
point lipid H12 (melting point: 37 °C) and a high melting lipid (D118; melting point 73 °C) in a
ratio of 30:70 with a lyophilisate content of 9.74 %. The extrudates have a content of 3.16 mg
of PEG-IFN-β-1b which equals the molar amount of 1 mg nIFN-β-1b.
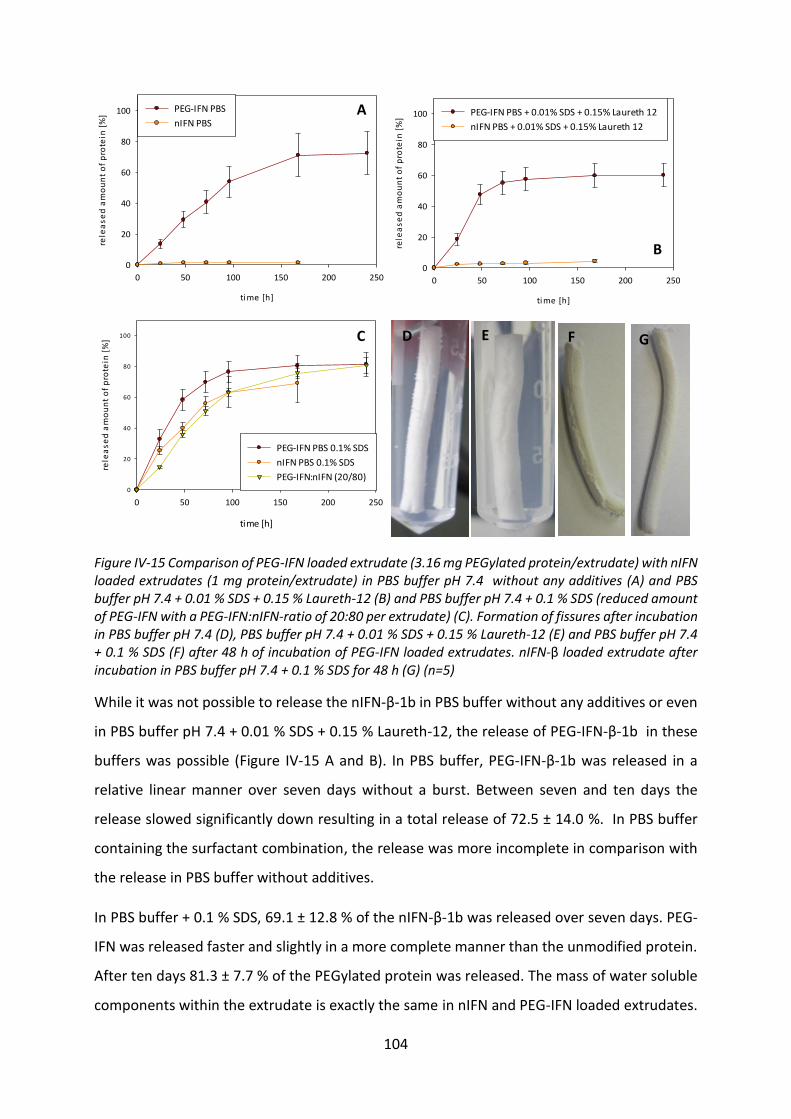
104
time [h]
0 50 100 150 200 250
rele
ase
d a
mo
un
t o
f p
rote
in [
%]
0
20
40
60
80
100 PEG-IFN PBS + 0.01% SDS + 0.15% Laureth 12
nIFN PBS + 0.01% SDS + 0.15% Laureth 12
time [h]
0 50 100 150 200 250
rele
ase
d a
mo
un
t o
f p
rote
in [
%]
0
20
40
60
80
100 PEG-IFN PBS
nIFN PBS
time [h]
0 50 100 150 200 250
rele
ase
d a
mo
un
t o
f p
rote
in [
%]
0
20
40
60
80
100
PEG-IFN PBS 0.1% SDS
nIFN PBS 0.1% SDS
PEG-IFN:nIFN (20/80)
Figure IV-15 Comparison of PEG-IFN loaded extrudate (3.16 mg PEGylated protein/extrudate) with nIFN loaded extrudates (1 mg protein/extrudate) in PBS buffer pH 7.4 without any additives (A) and PBS buffer pH 7.4 + 0.01 % SDS + 0.15 % Laureth-12 (B) and PBS buffer pH 7.4 + 0.1 % SDS (reduced amount of PEG-IFN with a PEG-IFN:nIFN-ratio of 20:80 per extrudate) (C). Formation of fissures after incubation in PBS buffer pH 7.4 (D), PBS buffer pH 7.4 + 0.01 % SDS + 0.15 % Laureth-12 (E) and PBS buffer pH 7.4 + 0.1 % SDS (F) after 48 h of incubation of PEG-IFN loaded extrudates. nIFN-β loaded extrudate after incubation in PBS buffer pH 7.4 + 0.1 % SDS for 48 h (G) (n=5)
While it was not possible to release the nIFN-β-1b in PBS buffer without any additives or even
in PBS buffer pH 7.4 + 0.01 % SDS + 0.15 % Laureth-12, the release of PEG-IFN-β-1b in these
buffers was possible (Figure IV-15 A and B). In PBS buffer, PEG-IFN-β-1b was released in a
relative linear manner over seven days without a burst. Between seven and ten days the
release slowed significantly down resulting in a total release of 72.5 ± 14.0 %. In PBS buffer
containing the surfactant combination, the release was more incomplete in comparison with
the release in PBS buffer without additives.
In PBS buffer + 0.1 % SDS, 69.1 ± 12.8 % of the nIFN-β-1b was released over seven days. PEG-
IFN was released faster and slightly in a more complete manner than the unmodified protein.
After ten days 81.3 ± 7.7 % of the PEGylated protein was released. The mass of water soluble
components within the extrudate is exactly the same in nIFN and PEG-IFN loaded extrudates.
A
B
C D E F G
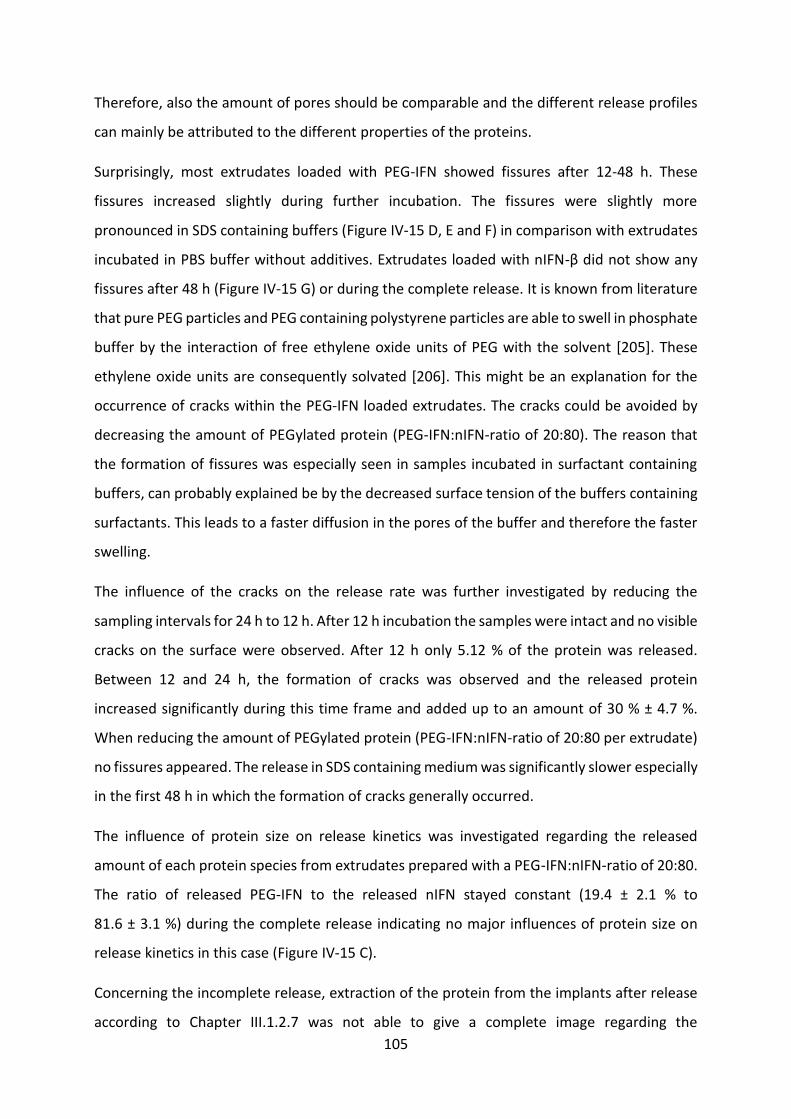
105
Therefore, also the amount of pores should be comparable and the different release profiles
can mainly be attributed to the different properties of the proteins.
Surprisingly, most extrudates loaded with PEG-IFN showed fissures after 12-48 h. These
fissures increased slightly during further incubation. The fissures were slightly more
pronounced in SDS containing buffers (Figure IV-15 D, E and F) in comparison with extrudates
incubated in PBS buffer without additives. Extrudates loaded with nIFN-β did not show any
fissures after 48 h (Figure IV-15 G) or during the complete release. It is known from literature
that pure PEG particles and PEG containing polystyrene particles are able to swell in phosphate
buffer by the interaction of free ethylene oxide units of PEG with the solvent [205]. These
ethylene oxide units are consequently solvated [206]. This might be an explanation for the
occurrence of cracks within the PEG-IFN loaded extrudates. The cracks could be avoided by
decreasing the amount of PEGylated protein (PEG-IFN:nIFN-ratio of 20:80). The reason that
the formation of fissures was especially seen in samples incubated in surfactant containing
buffers, can probably explained be by the decreased surface tension of the buffers containing
surfactants. This leads to a faster diffusion in the pores of the buffer and therefore the faster
swelling.
The influence of the cracks on the release rate was further investigated by reducing the
sampling intervals for 24 h to 12 h. After 12 h incubation the samples were intact and no visible
cracks on the surface were observed. After 12 h only 5.12 % of the protein was released.
Between 12 and 24 h, the formation of cracks was observed and the released protein
increased significantly during this time frame and added up to an amount of 30 % ± 4.7 %.
When reducing the amount of PEGylated protein (PEG-IFN:nIFN-ratio of 20:80 per extrudate)
no fissures appeared. The release in SDS containing medium was significantly slower especially
in the first 48 h in which the formation of cracks generally occurred.
The influence of protein size on release kinetics was investigated regarding the released
amount of each protein species from extrudates prepared with a PEG-IFN:nIFN-ratio of 20:80.
The ratio of released PEG-IFN to the released nIFN stayed constant (19.4 ± 2.1 % to
81.6 ± 3.1 %) during the complete release indicating no major influences of protein size on
release kinetics in this case (Figure IV-15 C).
Concerning the incomplete release, extraction of the protein from the implants after release
according to Chapter III.1.2.7 was not able to give a complete image regarding the
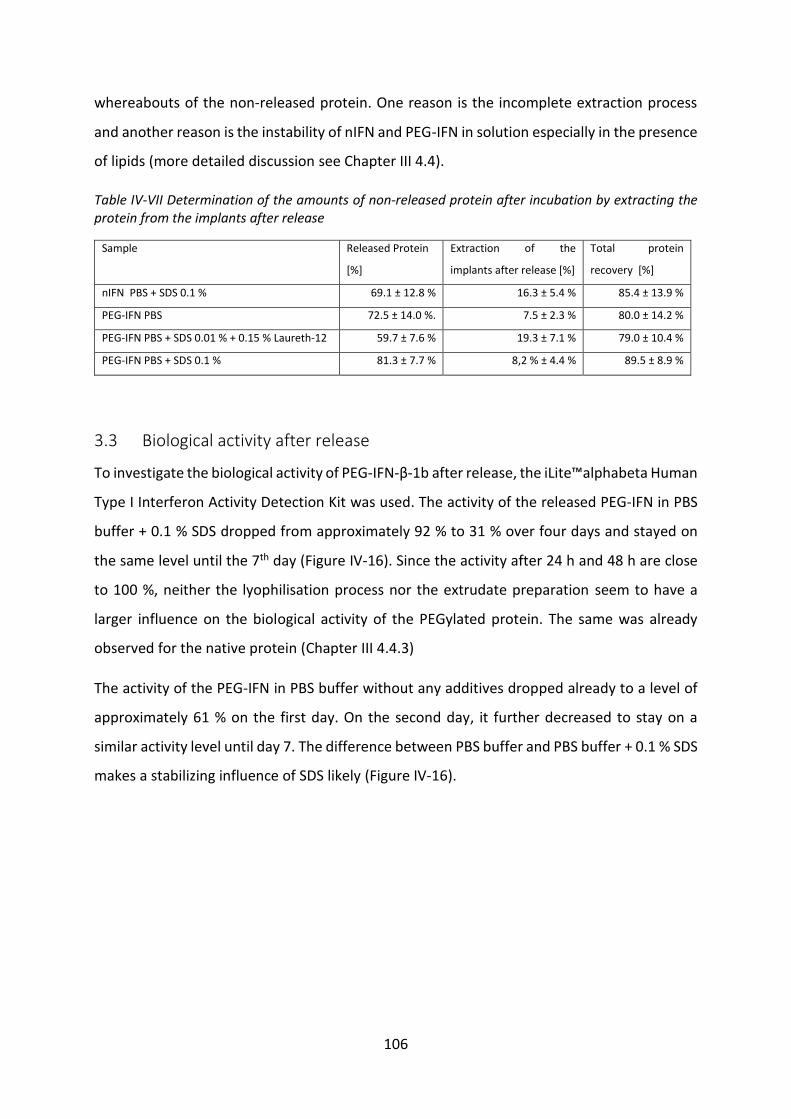
106
whereabouts of the non-released protein. One reason is the incomplete extraction process
and another reason is the instability of nIFN and PEG-IFN in solution especially in the presence
of lipids (more detailed discussion see Chapter III 4.4).
Table IV-VII Determination of the amounts of non-released protein after incubation by extracting the protein from the implants after release
Sample Released Protein
[%]
Extraction of the
implants after release [%]
Total protein
recovery [%]
nIFN PBS + SDS 0.1 % 69.1 ± 12.8 % 16.3 ± 5.4 % 85.4 ± 13.9 %
PEG-IFN PBS 72.5 ± 14.0 %. 7.5 ± 2.3 % 80.0 ± 14.2 %
PEG-IFN PBS + SDS 0.01 % + 0.15 % Laureth-12 59.7 ± 7.6 % 19.3 ± 7.1 % 79.0 ± 10.4 %
PEG-IFN PBS + SDS 0.1 % 81.3 ± 7.7 % 8,2 % ± 4.4 % 89.5 ± 8.9 %
3.3 Biological activity after release
To investigate the biological activity of PEG-IFN-β-1b after release, the iLite™alphabeta Human
Type I Interferon Activity Detection Kit was used. The activity of the released PEG-IFN in PBS
buffer + 0.1 % SDS dropped from approximately 92 % to 31 % over four days and stayed on
the same level until the 7th day (Figure IV-16). Since the activity after 24 h and 48 h are close
to 100 %, neither the lyophilisation process nor the extrudate preparation seem to have a
larger influence on the biological activity of the PEGylated protein. The same was already
observed for the native protein (Chapter III 4.4.3)
The activity of the PEG-IFN in PBS buffer without any additives dropped already to a level of
approximately 61 % on the first day. On the second day, it further decreased to stay on a
similar activity level until day 7. The difference between PBS buffer and PBS buffer + 0.1 % SDS
makes a stabilizing influence of SDS likely (Figure IV-16).
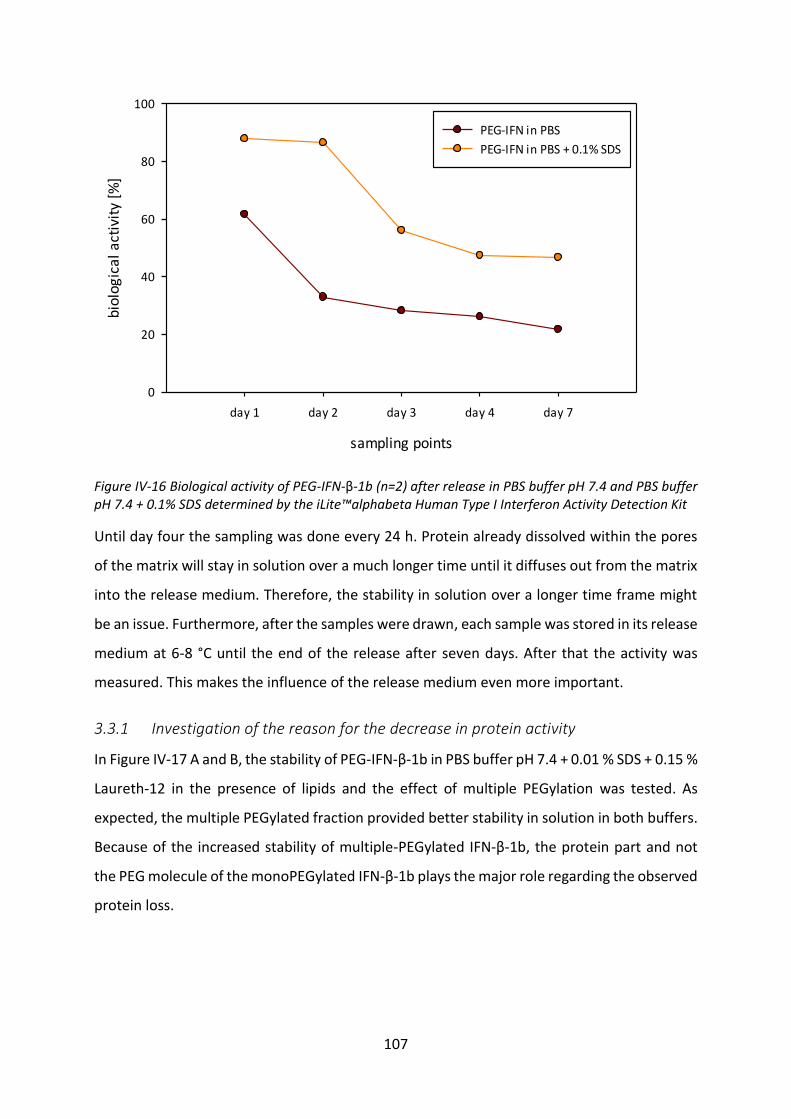
107
sampling points
day 1 day 2 day 3 day 4 day 7
bio
log
ica
l a
ctiv
ity
[%]
0
20
40
60
80
100
PEG-IFN in PBS
PEG-IFN in PBS + 0.1% SDS
Figure IV-16 Biological activity of PEG-IFN-β-1b (n=2) after release in PBS buffer pH 7.4 and PBS buffer pH 7.4 + 0.1% SDS determined by the iLite™alphabeta Human Type I Interferon Activity Detection Kit
Until day four the sampling was done every 24 h. Protein already dissolved within the pores
of the matrix will stay in solution over a much longer time until it diffuses out from the matrix
into the release medium. Therefore, the stability in solution over a longer time frame might
be an issue. Furthermore, after the samples were drawn, each sample was stored in its release
medium at 6-8 °C until the end of the release after seven days. After that the activity was
measured. This makes the influence of the release medium even more important.
3.3.1 Investigation of the reason for the decrease in protein activity
In Figure IV-17 A and B, the stability of PEG-IFN-β-1b in PBS buffer pH 7.4 + 0.01 % SDS + 0.15 %
Laureth-12 in the presence of lipids and the effect of multiple PEGylation was tested. As
expected, the multiple PEGylated fraction provided better stability in solution in both buffers.
Because of the increased stability of multiple-PEGylated IFN-β-1b, the protein part and not
the PEG molecule of the monoPEGylated IFN-β-1b plays the major role regarding the observed
protein loss.
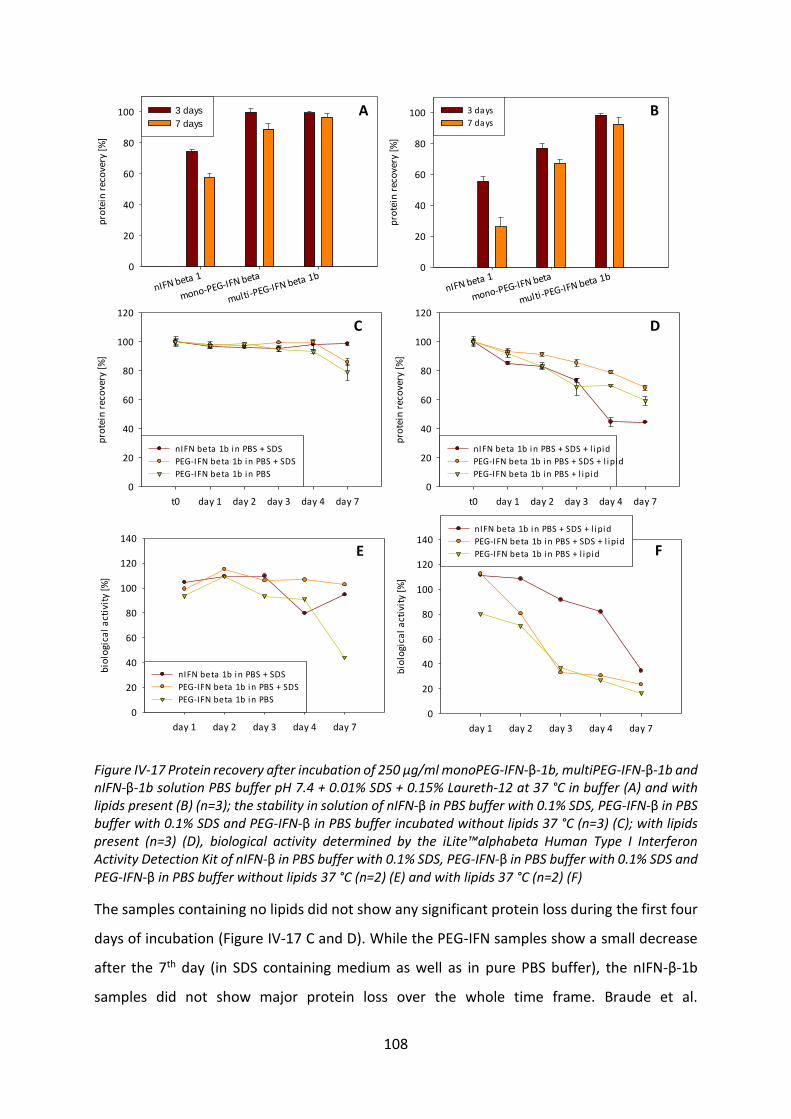
108
t0 day 1 day 2 day 3 day 4 day 7
pro
tein
rec
ove
ry [
%]
0
20
40
60
80
100
120
nIFN beta 1b in PBS + SDS + l ipid
PEG-IFN beta 1b in PBS + SDS + l ipid
PEG-IFN beta 1b in PBS + l ipid
t0 day 1 day 2 day 3 day 4 day 7
pro
tein
rec
ove
ry [
%]
0
20
40
60
80
100
120
nIFN beta 1b in PBS + SDS
PEG-IFN beta 1b in PBS + SDS
PEG-IFN beta 1b in PBS
nIFN beta 1
mono-PEG-IFN beta
multi-PEG-IFN beta 1b
pro
tein
rec
ove
ry [
%]
0
20
40
60
80
100 3 days
7 days
nIFN beta 1
mono-PEG-IFN beta
multi-PEG-IFN beta 1b
pro
tein
rec
ove
ry [
%]
0
20
40
60
80
100 3 days
7 days
day 1 day 2 day 3 day 4 day 7
bio
logi
cal
act
ivit
y [%
]
0
20
40
60
80
100
120
140
nIFN beta 1b in PBS + SDS
PEG-IFN beta 1b in PBS + SDS
PEG-IFN beta 1b in PBS
day 1 day 2 day 3 day 4 day 7
bio
logi
cal
act
ivit
y [%
]
0
20
40
60
80
100
120
140nIFN beta 1b in PBS + SDS + l ipid
PEG-IFN beta 1b in PBS + SDS + l ipid
PEG-IFN beta 1b in PBS + l ipid
Figure IV-17 Protein recovery after incubation of 250 µg/ml monoPEG-IFN-β-1b, multiPEG-IFN-β-1b and nIFN-β-1b solution PBS buffer pH 7.4 + 0.01% SDS + 0.15% Laureth-12 at 37 °C in buffer (A) and with lipids present (B) (n=3); the stability in solution of nIFN-β in PBS buffer with 0.1% SDS, PEG-IFN-β in PBS buffer with 0.1% SDS and PEG-IFN-β in PBS buffer incubated without lipids 37 °C (n=3) (C); with lipids present (n=3) (D), biological activity determined by the iLite™alphabeta Human Type I Interferon Activity Detection Kit of nIFN-β in PBS buffer with 0.1% SDS, PEG-IFN-β in PBS buffer with 0.1% SDS and PEG-IFN-β in PBS buffer without lipids 37 °C (n=2) (E) and with lipids 37 °C (n=2) (F)
The samples containing no lipids did not show any significant protein loss during the first four
days of incubation (Figure IV-17 C and D). While the PEG-IFN samples show a small decrease
after the 7th day (in SDS containing medium as well as in pure PBS buffer), the nIFN-β-1b
samples did not show major protein loss over the whole time frame. Braude et al.
A B
C D
E F
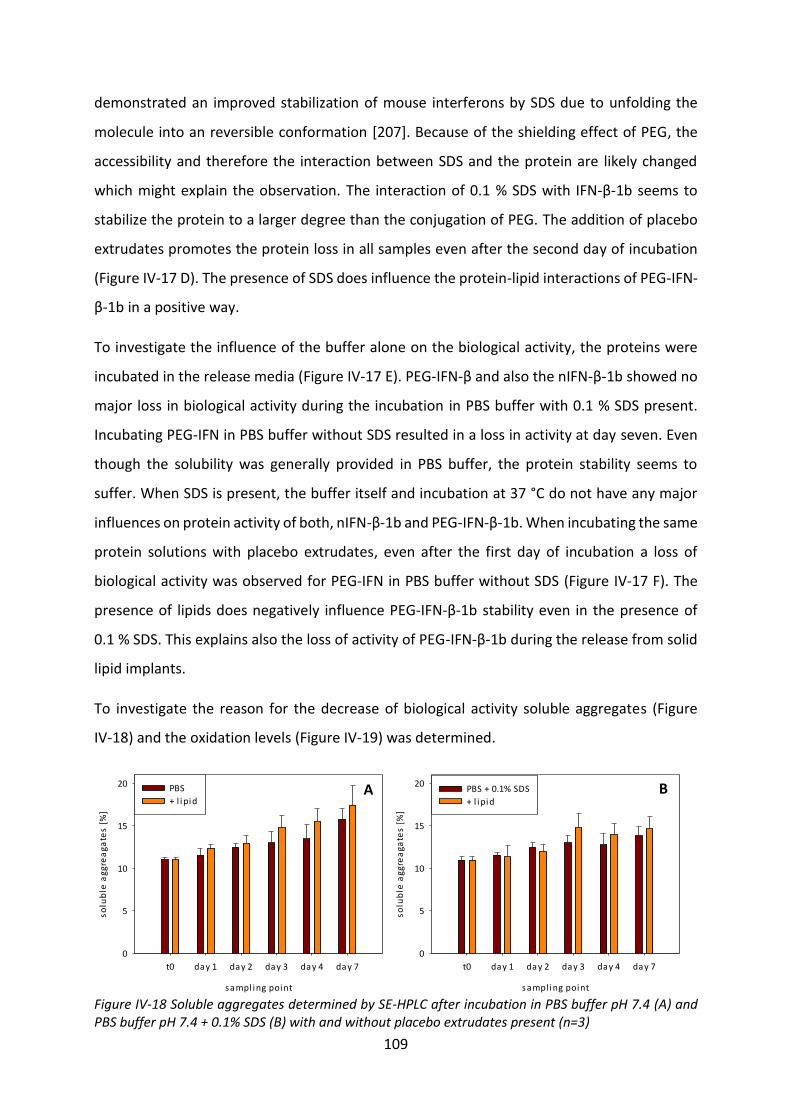
109
demonstrated an improved stabilization of mouse interferons by SDS due to unfolding the
molecule into an reversible conformation [207]. Because of the shielding effect of PEG, the
accessibility and therefore the interaction between SDS and the protein are likely changed
which might explain the observation. The interaction of 0.1 % SDS with IFN-β-1b seems to
stabilize the protein to a larger degree than the conjugation of PEG. The addition of placebo
extrudates promotes the protein loss in all samples even after the second day of incubation
(Figure IV-17 D). The presence of SDS does influence the protein-lipid interactions of PEG-IFN-
β-1b in a positive way.
To investigate the influence of the buffer alone on the biological activity, the proteins were
incubated in the release media (Figure IV-17 E). PEG-IFN-β and also the nIFN-β-1b showed no
major loss in biological activity during the incubation in PBS buffer with 0.1 % SDS present.
Incubating PEG-IFN in PBS buffer without SDS resulted in a loss in activity at day seven. Even
though the solubility was generally provided in PBS buffer, the protein stability seems to
suffer. When SDS is present, the buffer itself and incubation at 37 °C do not have any major
influences on protein activity of both, nIFN-β-1b and PEG-IFN-β-1b. When incubating the same
protein solutions with placebo extrudates, even after the first day of incubation a loss of
biological activity was observed for PEG-IFN in PBS buffer without SDS (Figure IV-17 F). The
presence of lipids does negatively influence PEG-IFN-β-1b stability even in the presence of
0.1 % SDS. This explains also the loss of activity of PEG-IFN-β-1b during the release from solid
lipid implants.
To investigate the reason for the decrease of biological activity soluble aggregates (Figure
IV-18) and the oxidation levels (Figure IV-19) was determined.
sampl ing point
t0 day 1 day 2 day 3 day 4 day 7
so
lub
le a
gg
rea
ga
tes
[%
]
0
5
10
15
20PBS + 0.1% SDS
+ l ipid
sampl ing point
t0 day 1 day 2 day 3 day 4 day 7
so
lub
le a
gg
rea
ga
tes
[%
]
0
5
10
15
20 PBS
+ l ipid
Figure IV-18 Soluble aggregates determined by SE-HPLC after incubation in PBS buffer pH 7.4 (A) and PBS buffer pH 7.4 + 0.1% SDS (B) with and without placebo extrudates present (n=3)
A B
110
In PBS buffer, an increase in soluble aggregates of PEG-IFN-β-1b was detected with and
without lipids being present. The high amount of “aggregates” is due to the fact that the peak
eluting before the main peak which represents higher molecular weight species consists of
multiple PEGylated species and aggregates. The formation of aggregates is slightly more
pronounced in the presence of lipids in comparison with the pure buffer (Figure IV-18 A). In
PBS buffer pH 7.4 + 0.1% SDS a slight trend towards the formation of soluble aggregates is
visible with increased incubation time. Also the presence of placebo extrudates slightly
promotes the formation of aggregates (Figure IV-18 B). The formation of soluble aggregates
does not explain the huge decrease in biological activity. Another reason for the low amounts
of soluble aggregates might be the presence of 0.1 % SDS in the running buffer.
Since oxidation of the native IFN-β-1b was increased during the incubation with lipids,
oxidation was also investigated for the PEG-IFN-1b (Figure IV-19). The reason for the initially
increased starting “oxidation” levels in comparison with the nIFN can be explained by the
presence of multi-PEGylated species. These more hydrophilic species elute before the
monoPEGylated protein peak. Apart from oxidized protein (which is also more hydrophilic)
multi-PEGylated species do also contribute to this “oxidized” protein peak.
In PBS buffer without placebo extrudates present, the ratio of hydrophilic species increased
over time (Figure IV-19 A). This can mainly be attributed to the fact that the amount of
monoPEGylated protein was decreasing, while the absolute amount of oxidized/multiple-
PEGylated protein did not show any major changes (Figure IV-19 A and B). The presence of
lipids increased this trend even more, resulting in a higher ratio of hydrophilic species. Since
the activity assays were related to the actually determined protein amount, the protein loss
cannot be accounted for the decrease in biological activity.
In PBS buffer pH 7.4 + 0.1% SDS without lipids, the level of hydrophilic species did not change.
The biggest difference was seen in the presence of lipids. While the peak shape and retention
time in the pure buffer did not change fundamentally, in the presence of lipids the observed
shoulder converted into an “individual” peak at day 3 (Figure IV-19 D). Because of the
additional peak, and further decrease of the monoPEGylated protein peak, the amount of
hydrophilic species increases clearly at day three. Furthermore, the retention time of the
monoPEGylated protein and of the peak of the hydrophilic species shifted in the direction of
shorter retention times indicating the formation of more hydrophilic species. While
111
oxidation/formation of hydrophilic species were observed for both nIFN-β-1b and PEG-IFN-β-
1b, no increase in oxidation was reported by Mohl [165] and Herrmann for IFN-α-2a [90] nor
by Sax for lysozyme or mAb [88].
The different shapes of the PEG-IFN-β-1b peaks in PBS buffer (Figure IV-19 B) and PBS buffer
containing SDS (Figure IV-19 D) can be explained by the negative influence of SDS on the
separation efficiency by RP-HPLC. Bosserhoff et al. investigated the separation of bovine
serum albumin fragments and a mixture of synthetic peptides by RP-HPLC and observed that
even traces of SDS can reduce separation efficiency significantly [208]. A decreased separation
efficiency in the presents of SDS was also shown for ribonuclease, insulin, lysozyme, myoglobin
and ovalbumin. The authors stated that peptide separations are seriously affected by the
presence of surfactant [209]. Therefore, a direct comparison of the oxidation levels of proteins
in the two buffers is not reasonable and only a comparison of different time points within one
buffer is viable.
Even though, PEGylation was able to improve the solubility and stability of nIFN-β-1b, it was
not able to completely avoid the detrimental effects of the lipids on protein stability.
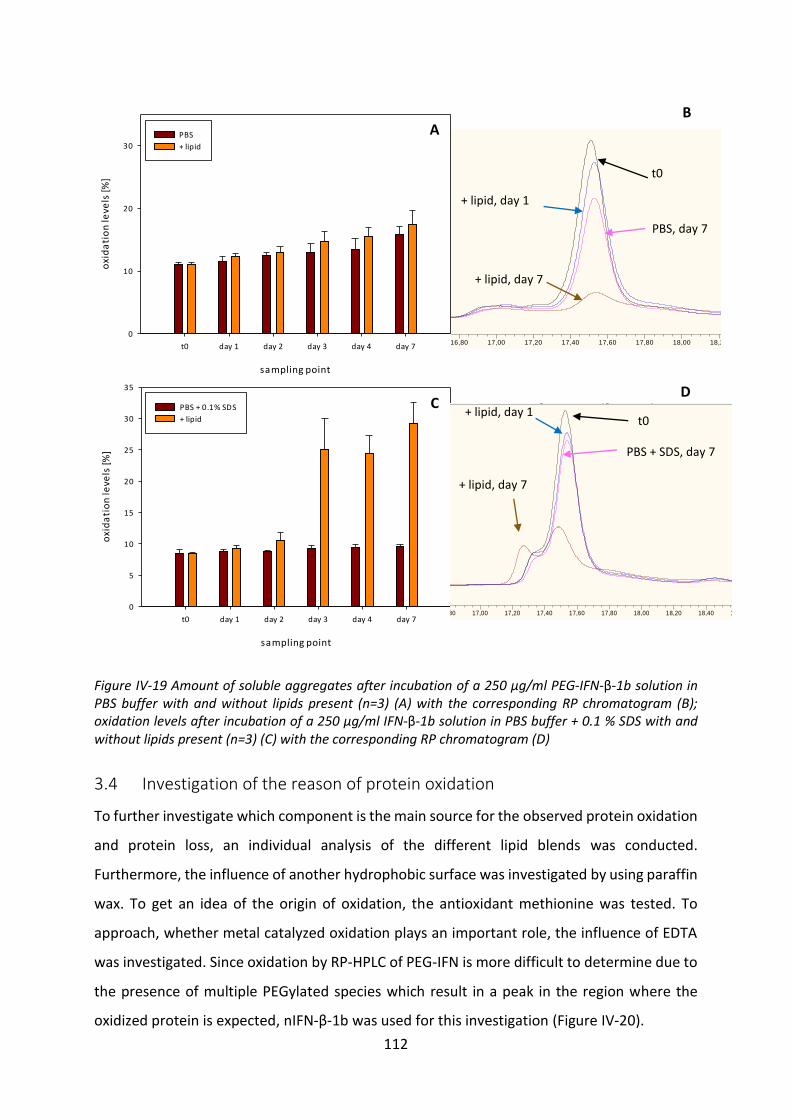
112
sampling point
t0 day 1 day 2 day 3 day 4 day 7
oxi
da
tio
n le
vels
[%]
0
10
20
30
PBS
+ lipid
sampling point
t0 day 1 day 2 day 3 day 4 day 7
oxi
da
tio
n le
vels
[%]
0
5
10
15
20
25
30
35
PBS + 0.1% SDS
+ lipid
Figure IV-19 Amount of soluble aggregates after incubation of a 250 µg/ml PEG-IFN-β-1b solution in PBS buffer with and without lipids present (n=3) (A) with the corresponding RP chromatogram (B); oxidation levels after incubation of a 250 µg/ml IFN-β-1b solution in PBS buffer + 0.1 % SDS with and without lipids present (n=3) (C) with the corresponding RP chromatogram (D)
3.4 Investigation of the reason of protein oxidation
To further investigate which component is the main source for the observed protein oxidation
and protein loss, an individual analysis of the different lipid blends was conducted.
Furthermore, the influence of another hydrophobic surface was investigated by using paraffin
wax. To get an idea of the origin of oxidation, the antioxidant methionine was tested. To
approach, whether metal catalyzed oxidation plays an important role, the influence of EDTA
was investigated. Since oxidation by RP-HPLC of PEG-IFN is more difficult to determine due to
the presence of multiple PEGylated species which result in a peak in the region where the
oxidized protein is expected, nIFN-β-1b was used for this investigation (Figure IV-20).
A
C
B
15,64 16,00 16,20 16,40 16,60 16,80 17,00 17,20 17,40 17,60 17,80 18,00 18,20 18,40 18,60 18,80 19,00 19,20 19,40 19,60 19,93
-4.395.425
10.000.000
20.000.000
30.000.000
40.000.000
56.454.248
1 - AKTIVITÄTSVERLUST NIFN PEG-IFN #19 [modified by user] Tag 1 PEG-IFN beta 250 µg/ml in PBS FLD_Emission
2 - AKTIVITÄTSVERLUST NIFN PEG-IFN #22 [modified by user] Tag 1 PEG-IFN beta 250 µg/ml in PBS + Lipid FLD_Emission
3 - AKTIVITÄTSVERLUST NIFN PEG-IFN #107 [modified by user] Tag 7 PEG-IFN beta 250 µg/ml in PBS FLD_Emission
4 - AKTIVITÄTSVERLUST NIFN PEG-IFN #110 [modified by user] Tag 7 PEG-IFN beta 250 µg/ml in PBS + Lipid FLD_Emissioncounts
min
4321
278 nm /355 nm
t0
PBS, day 7
+ lipid, day 1
+ lipid, day 7
D
15,54 15,80 16,00 16,20 16,40 16,60 16,80 17,00 17,20 17,40 17,60 17,80 18,00 18,20 18,40 18,60 18,80 19,00 19,20 19,40 19,60 19,90
-7.516.340
10.000.000
20.000.000
30.000.000
40.000.000
50.000.000
67.254.902
1 - AKTIVITÄTSVERLUST NIFN PEG-IFN #24 [modified by user] Tag 1 PEG-IFN beta 250 µg/ml in SDS FLD_Emission
2 - AKTIVITÄTSVERLUST NIFN PEG-IFN #30 [modified by user] Tag 1 PEG-IFN beta 250 µg/ml in SDS + Lipid FLD_Emission
3 - AKTIVITÄTSVERLUST NIFN PEG-IFN #113 [modified by user] Tag 7 PEG-IFN beta 250 µg/ml in SDS FLD_Emission
4 - AKTIVITÄTSVERLUST NIFN PEG-IFN #116 [modified by user] Tag 7 PEG-IFN beta 250 µg/ml in SDS + Lipid FLD_Emissioncounts
min
4321
278 nm /355 nm
t0
PBS + SDS, day 7
+ lipid, day 1
+ lipid, day 7
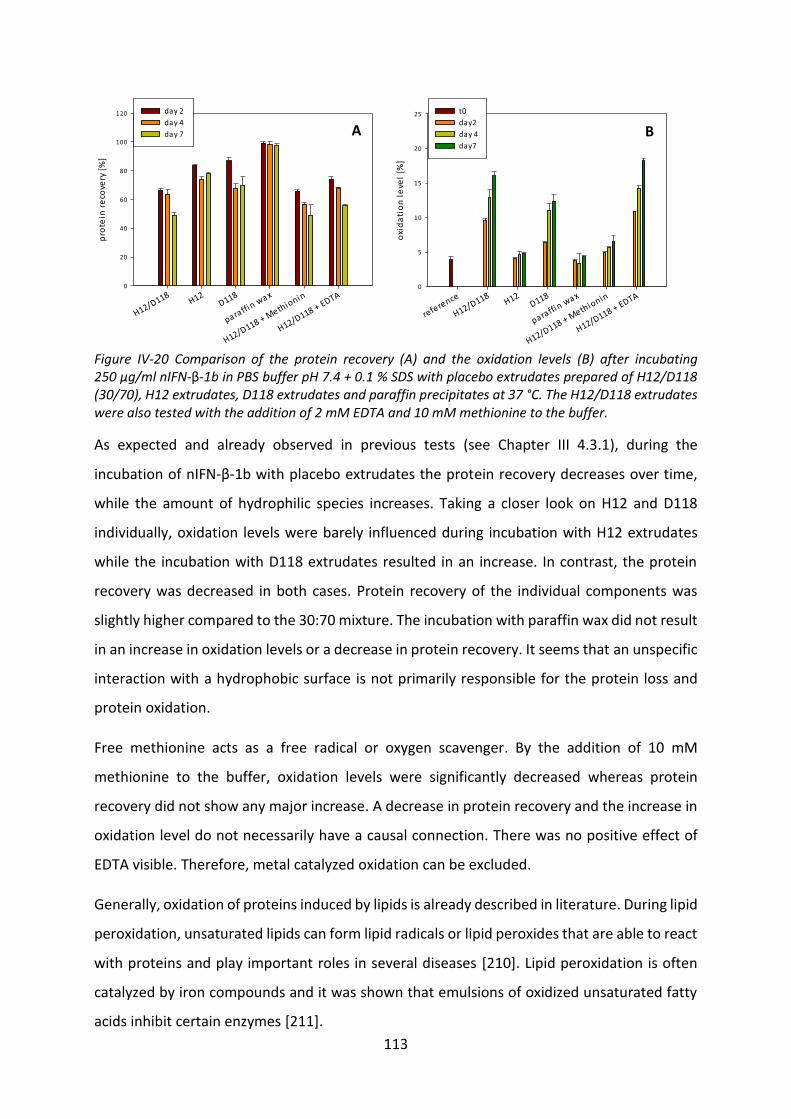
113
H12/D118H12
D118
paraffin wax
H12/D118 + Methionin
H12/D118 + EDTA
pro
tein
re
cove
ry [
%]
0
20
40
60
80
100
120 day 2
day 4
day 7
reference
H12/D118H12
D118
paraffin wax
H12/D118 + Methionin
H12/D118 + EDTA
oxi
da
tio
n l
eve
l [%
]
0
5
10
15
20
25 t0
day2
day 4
day7
Figure IV-20 Comparison of the protein recovery (A) and the oxidation levels (B) after incubating 250 µg/ml nIFN-β-1b in PBS buffer pH 7.4 + 0.1 % SDS with placebo extrudates prepared of H12/D118 (30/70), H12 extrudates, D118 extrudates and paraffin precipitates at 37 °C. The H12/D118 extrudates were also tested with the addition of 2 mM EDTA and 10 mM methionine to the buffer.
As expected and already observed in previous tests (see Chapter III 4.3.1), during the
incubation of nIFN-β-1b with placebo extrudates the protein recovery decreases over time,
while the amount of hydrophilic species increases. Taking a closer look on H12 and D118
individually, oxidation levels were barely influenced during incubation with H12 extrudates
while the incubation with D118 extrudates resulted in an increase. In contrast, the protein
recovery was decreased in both cases. Protein recovery of the individual components was
slightly higher compared to the 30:70 mixture. The incubation with paraffin wax did not result
in an increase in oxidation levels or a decrease in protein recovery. It seems that an unspecific
interaction with a hydrophobic surface is not primarily responsible for the protein loss and
protein oxidation.
Free methionine acts as a free radical or oxygen scavenger. By the addition of 10 mM
methionine to the buffer, oxidation levels were significantly decreased whereas protein
recovery did not show any major increase. A decrease in protein recovery and the increase in
oxidation level do not necessarily have a causal connection. There was no positive effect of
EDTA visible. Therefore, metal catalyzed oxidation can be excluded.
Generally, oxidation of proteins induced by lipids is already described in literature. During lipid
peroxidation, unsaturated lipids can form lipid radicals or lipid peroxides that are able to react
with proteins and play important roles in several diseases [210]. Lipid peroxidation is often
catalyzed by iron compounds and it was shown that emulsions of oxidized unsaturated fatty
acids inhibit certain enzymes [211].
A B
114
In these studies, the used triglycerides are all saturated and are not prone to oxidation.
Dynasan 118 is a glyceryl tristearate and H12 consists of three saturated triglycerides
comprising palmitic, myristic and lauric acid. Even though at elevated temperature (154 °C
under oxygen flow) an oxidation of saturated fatty acids and their corresponding esters is
possible an influence of the chain length (C12-C18) was not observed [212]. Therefore, the
difference on protein oxidation between the two lipids cannot be explained by a theoretical
preferred autoxidation of stearic acid. Furthermore, there is no evidence in literature that
suggests an increased protein oxidation using stearic triglycerides.
Neither hydrophobic surfaces per se, nor H12 alone pose a problem regarding the oxidation
of the protein. Only the presence of D118 resulted in an increase in oxidation levels which
could be prevented by the addition of methionine but not EDTA. The most likely explanation
is the presence of impurities in the used D118.
115
4 Release Studies from VPGs
The preparation of protein loaded VPGs, to be used as a depot system, is rather simple and
straight forward since only the protein solution and the phospholipids are mixed together and
processed with a dual asymmetric centrifuge. The result is a highly concentrated, semisolid,
aqueous phospholipid dispersion. The gel-like consistency is formed by the numerous densely
packed vesicles. Incorporation of native IFN-β-1b in the phosphatidylcholine containing VPGs
resulted in protein-lipid interactions that were expressed by a change in the vesicle size and
also by the inability to extract the protein from the VPGs (Chapter III 3.1). Especially the second
issue hampered the development of a depot formulation. After preparing the first PEG-IFN-β-
1b loaded VPGs based on 350 mg/g Lipoid E80 (Figure IV-21 B), the extraction from those
freshly prepared VPGs was successfully tested and a protein recovery of 97.4 ± 3.4 % was
achieved.
In contrast to solid lipid implants, erosion seems to be the predominant release mechanism
from VPGs [102, 104, 106, 172]. Therefore, the release tests were conducted in flow through
cells made of Teflon®. The VPGs were accurately weighed into the donor compartment of the
cells and the acceptor compartment is placed on top without a filter in-between, in order to
not interfere with the erosion. Thus, the buffer is able to flow over the gel and eroded
liposomes can be drained from the cells without anything holding them back and therefore
influencing the release of the protein. Protein release was quantified using by RP-HPLC and a
fluorescence detector being able to quantify even very small amounts of protein.
Furthermore, the placebo VPG solution gave a rather large fluorescence signal. Since the
phospholipids had a different retention time compared to the protein signal, a quantification
in the presence of phospholipids was possible.
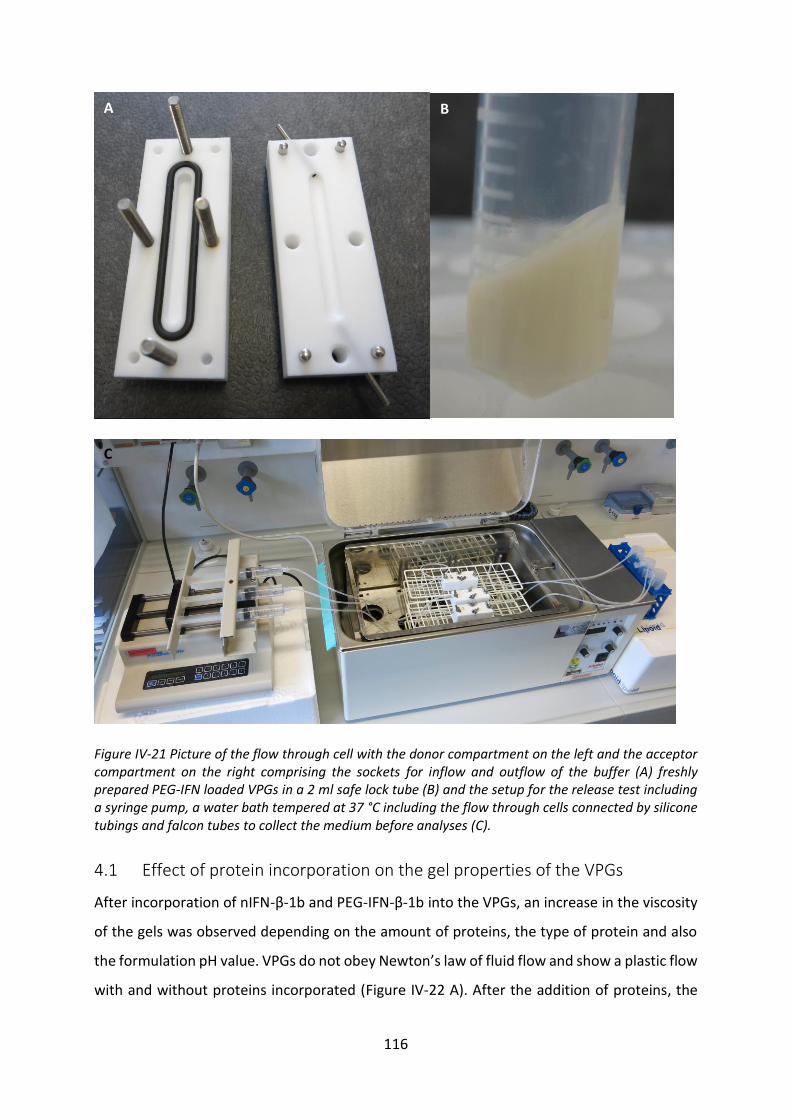
116
Figure IV-21 Picture of the flow through cell with the donor compartment on the left and the acceptor compartment on the right comprising the sockets for inflow and outflow of the buffer (A) freshly prepared PEG-IFN loaded VPGs in a 2 ml safe lock tube (B) and the setup for the release test including a syringe pump, a water bath tempered at 37 °C including the flow through cells connected by silicone tubings and falcon tubes to collect the medium before analyses (C).
4.1 Effect of protein incorporation on the gel properties of the VPGs
After incorporation of nIFN-β-1b and PEG-IFN-β-1b into the VPGs, an increase in the viscosity
of the gels was observed depending on the amount of proteins, the type of protein and also
the formulation pH value. VPGs do not obey Newton’s law of fluid flow and show a plastic flow
with and without proteins incorporated (Figure IV-22 A). After the addition of proteins, the
A B
C
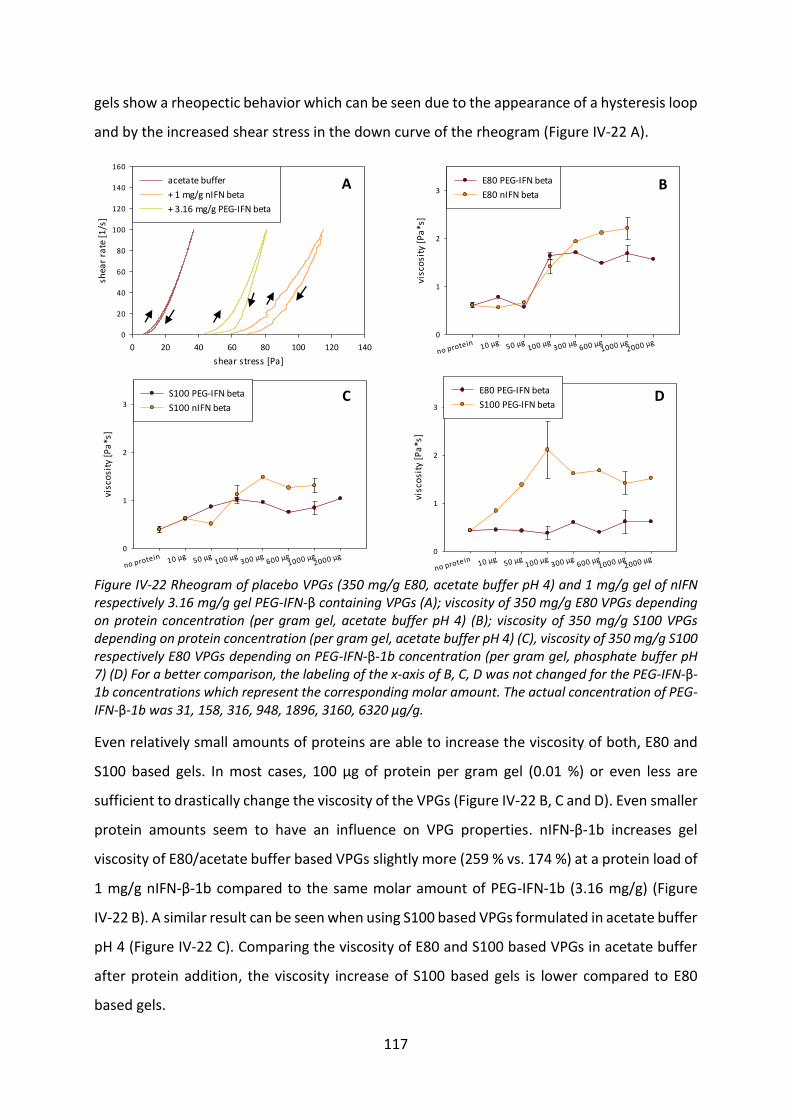
117
gels show a rheopectic behavior which can be seen due to the appearance of a hysteresis loop
and by the increased shear stress in the down curve of the rheogram (Figure IV-22 A).
shear stress [Pa]
0 20 40 60 80 100 120 140
shea
r ra
te [
1/s
]
0
20
40
60
80
100
120
140
160
acetate buffer
+ 1 mg/g nIFN beta
+ 3.16 mg/g PEG-IFN beta
no protein 10 µg 50 µg100 µg
300 µg600 µg
1000 µg2000 µg
visc
osi
ty [
Pa
*s]
0
1
2
3E80 PEG-IFN beta
E80 nIFN beta
no protein 10 µg 50 µg100 µg
300 µg600 µg
1000 µg2000 µg
visc
osi
ty [
Pa
*s]
0
1
2
3
S100 PEG-IFN beta
S100 nIFN beta
no protein 10 µg 50 µg100 µg
300 µg600 µg
1000 µg2000 µg
visc
osi
ty [
Pa
*s]
0
1
2
3
E80 PEG-IFN beta
S100 PEG-IFN beta
Figure IV-22 Rheogram of placebo VPGs (350 mg/g E80, acetate buffer pH 4) and 1 mg/g gel of nIFN respectively 3.16 mg/g gel PEG-IFN-β containing VPGs (A); viscosity of 350 mg/g E80 VPGs depending on protein concentration (per gram gel, acetate buffer pH 4) (B); viscosity of 350 mg/g S100 VPGs depending on protein concentration (per gram gel, acetate buffer pH 4) (C), viscosity of 350 mg/g S100 respectively E80 VPGs depending on PEG-IFN-β-1b concentration (per gram gel, phosphate buffer pH 7) (D) For a better comparison, the labeling of the x-axis of B, C, D was not changed for the PEG-IFN-β-1b concentrations which represent the corresponding molar amount. The actual concentration of PEG-IFN-β-1b was 31, 158, 316, 948, 1896, 3160, 6320 µg/g.
Even relatively small amounts of proteins are able to increase the viscosity of both, E80 and
S100 based gels. In most cases, 100 µg of protein per gram gel (0.01 %) or even less are
sufficient to drastically change the viscosity of the VPGs (Figure IV-22 B, C and D). Even smaller
protein amounts seem to have an influence on VPG properties. nIFN-β-1b increases gel
viscosity of E80/acetate buffer based VPGs slightly more (259 % vs. 174 %) at a protein load of
1 mg/g nIFN-β-1b compared to the same molar amount of PEG-IFN-1b (3.16 mg/g) (Figure
IV-22 B). A similar result can be seen when using S100 based VPGs formulated in acetate buffer
pH 4 (Figure IV-22 C). Comparing the viscosity of E80 and S100 based VPGs in acetate buffer
after protein addition, the viscosity increase of S100 based gels is lower compared to E80
based gels.
A
B
D
C
118
When changing the buffer from 50 mM acetate buffer pH 4 to 50 mM phosphate buffer pH 7,
gel viscosity clearly increases after the incorporation of PEG-IFN-β in S100 based VPGs. Again,
less than a molar amount which equates 100 µg of the native protein seems to be enough to
significantly influence gel viscosity. A further increase of the protein amount does not seem
to have a major influence. Surprisingly, after incorporation of PEG-IFN-β in E80 based VPGs,
the viscosity did not increase and did stay on a similar level independent of the protein amount
incorporated. Interactions of PEG-IFN-β-1b with VPGs formulated in phosphate buffer pH 7
seem to be less compared to the protein formulated in acetate buffer pH 4.
Also a change of the buffer alone without proteins present influenced the viscosity of the
VPGs. 350 mg/g E80 VPGs formulated in 50 mM acetate buffer pH 4 (0.615 ± 0.059 Pa*s) had
a higher viscosity compared to VPGs formulated in 50 mM phosphate buffer pH 7
(0.431 ± 0.072 Pa*s). The effect of buffer on gel viscosities was also reported by Tian et al.
[105]. The influence of the buffer and the type of lipid on gel viscosity can be explained by a
different degree of interaction due to a changed surface charge and charge density of the
protein but also by different charged phospholipids. A more detailed discussion can be found
in Chapter V 3.1.
In contrast to EPO [106] or a monoclonal antibody [105], the incorporation of nIFN-β and PEG-
IFN-β did influence the viscosity of the VPGs. Grohganz et al. observed a change in viscosity
after incorporation of the gonadotropin-releasing hormone antagonist cetrorelix in E80 based
VPGs [103]. Tian et al. reported an increase of gel strength but no change in viscosity after the
incorporation of G-CSF [105]. Both, Grohganz and Tian made protein-lipid interactions
responsible for this observation without doing further studies in this direction.
4.2 Release tests from VPGs
Release tests were performed according to Chapter IV 1.2.6.2. After the PEGylation of IFN-β-
1b, not only the extraction was possible but also a release of the protein from VPGs in PBS
buffer pH 7.4 due to the increased solubility (Figure IV-23 A). Tests with surfactants in the
release medium were not conducted because they can solubilize the liposomes and influence
the erosion behavior negatively [170].
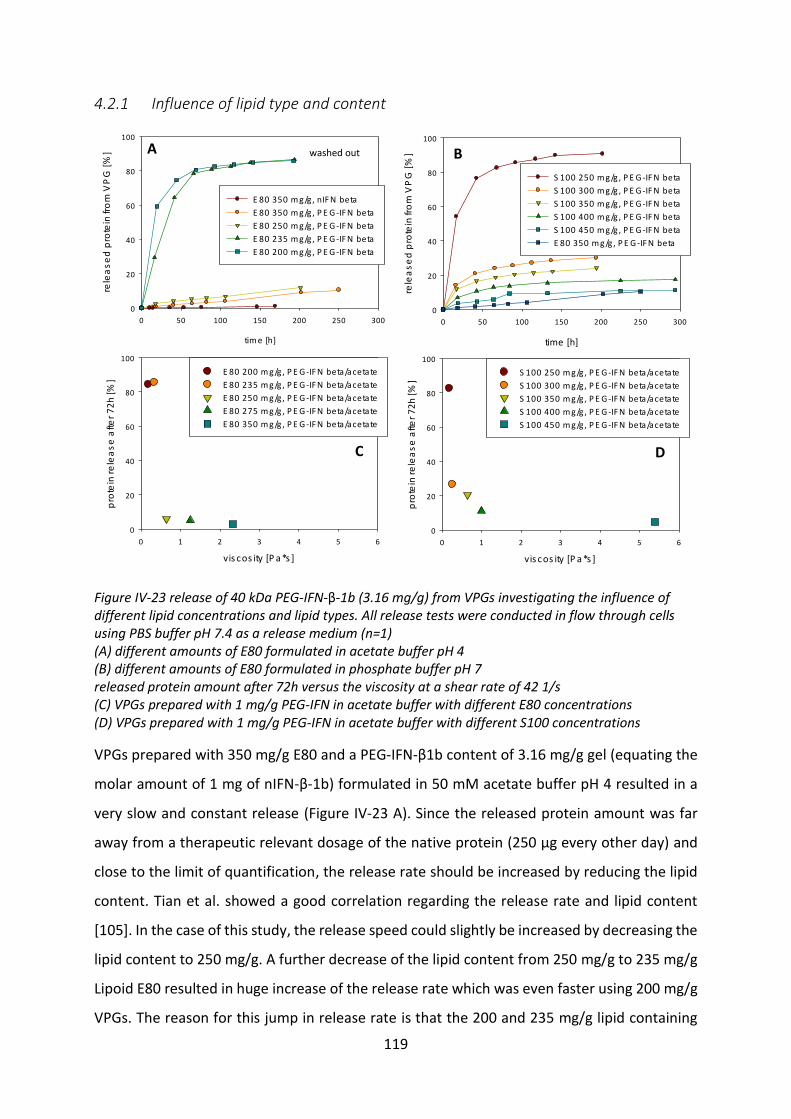
119
4.2.1 Influence of lipid type and content
tim e [h]
0 50 100 150 200 250 300
rele
as
ed
pro
tein
fro
m V
PG
[%
]
0
20
40
60
80
100
E 80 350 m g/g , nIF N beta
E 80 350 m g/g , P E G -IF N beta
E 80 250 m g/g , P E G -IF N beta
E 80 235 m g/g , P E G -IF N beta
E 80 200 m g/g , P E G -IF N beta
time [h]
0 50 100 150 200 250 300
rele
as
ed
pro
tein
fro
m V
PG
[%
]
0
20
40
60
80
100
S 100 250 m g/g , P E G -IF N beta
S 100 300 m g/g , P E G -IF N beta
S 100 350 m g/g , P E G -IF N beta
S 100 400 m g/g , P E G -IF N beta
S 100 450 m g/g , P E G -IF N beta
E 80 350 m g/g , P E G -IF N beta
vis cos ity [P a *s ]
0 1 2 3 4 5 6
pro
tein
re
lea
se
afte
r 7
2h
[%
]
0
20
40
60
80
100
E 80 200 m g/g , P E G -IF N beta/acetate
E 80 235 m g/g , P E G -IF N beta/acetate
E 80 250 m g/g , P E G -IF N beta/acetate
E 80 275 m g/g , P E G -IF N beta/acetate
E 80 350 m g/g , P E G -IF N beta/acetate
vis cos ity [P a *s ]
0 1 2 3 4 5 6
pro
tein
re
lea
se
afte
r 7
2h
[%
]
0
20
40
60
80
100
S 100 250 m g/g , P E G -IF N beta/acetate
S 100 300 m g/g , P E G -IF N beta/acetate
S 100 350 m g/g , P E G -IF N beta/acetate
S 100 400 m g/g , P E G -IF N beta/acetate
S 100 450 m g/g , P E G -IF N beta/acetate
Figure IV-23 release of 40 kDa PEG-IFN-β-1b (3.16 mg/g) from VPGs investigating the influence of different lipid concentrations and lipid types. All release tests were conducted in flow through cells using PBS buffer pH 7.4 as a release medium (n=1) (A) different amounts of E80 formulated in acetate buffer pH 4 (B) different amounts of E80 formulated in phosphate buffer pH 7 released protein amount after 72h versus the viscosity at a shear rate of 42 1/s (C) VPGs prepared with 1 mg/g PEG-IFN in acetate buffer with different E80 concentrations (D) VPGs prepared with 1 mg/g PEG-IFN in acetate buffer with different S100 concentrations
VPGs prepared with 350 mg/g E80 and a PEG-IFN-β1b content of 3.16 mg/g gel (equating the
molar amount of 1 mg of nIFN-β-1b) formulated in 50 mM acetate buffer pH 4 resulted in a
very slow and constant release (Figure IV-23 A). Since the released protein amount was far
away from a therapeutic relevant dosage of the native protein (250 µg every other day) and
close to the limit of quantification, the release rate should be increased by reducing the lipid
content. Tian et al. showed a good correlation regarding the release rate and lipid content
[105]. In the case of this study, the release speed could slightly be increased by decreasing the
lipid content to 250 mg/g. A further decrease of the lipid content from 250 mg/g to 235 mg/g
Lipoid E80 resulted in huge increase of the release rate which was even faster using 200 mg/g
VPGs. The reason for this jump in release rate is that the 200 and 235 mg/g lipid containing
A
B
A
C
D
washed out
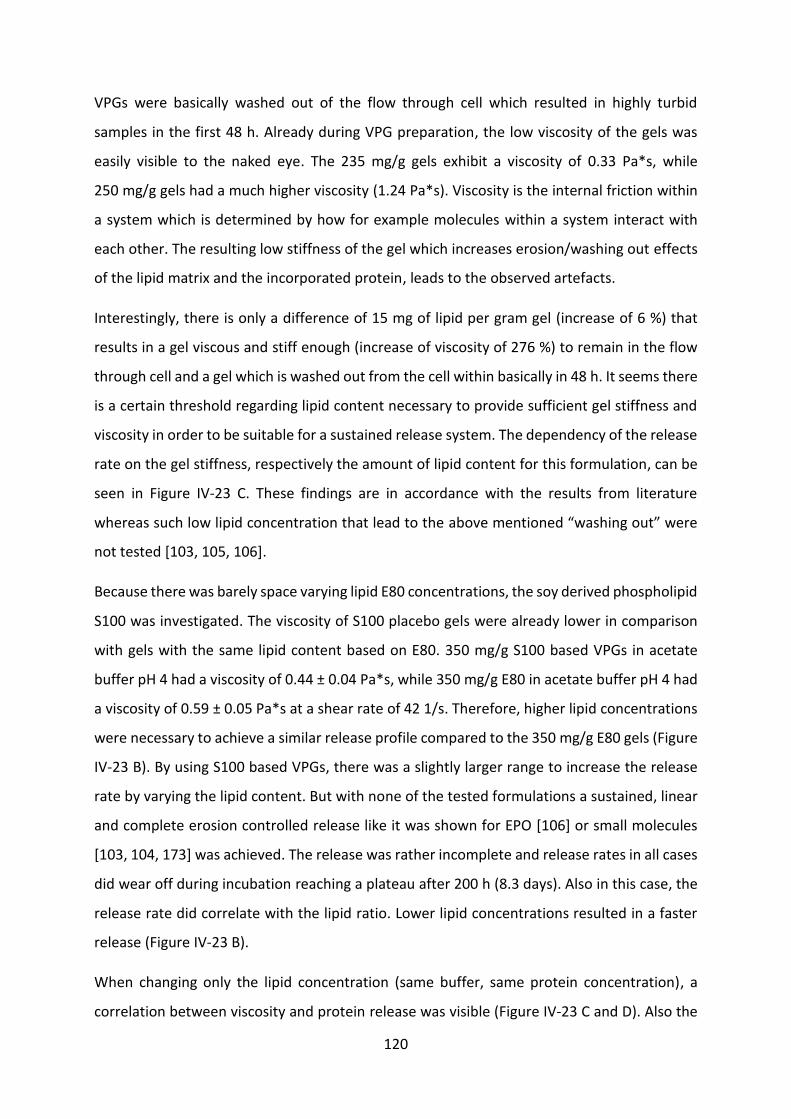
120
VPGs were basically washed out of the flow through cell which resulted in highly turbid
samples in the first 48 h. Already during VPG preparation, the low viscosity of the gels was
easily visible to the naked eye. The 235 mg/g gels exhibit a viscosity of 0.33 Pa*s, while
250 mg/g gels had a much higher viscosity (1.24 Pa*s). Viscosity is the internal friction within
a system which is determined by how for example molecules within a system interact with
each other. The resulting low stiffness of the gel which increases erosion/washing out effects
of the lipid matrix and the incorporated protein, leads to the observed artefacts.
Interestingly, there is only a difference of 15 mg of lipid per gram gel (increase of 6 %) that
results in a gel viscous and stiff enough (increase of viscosity of 276 %) to remain in the flow
through cell and a gel which is washed out from the cell within basically in 48 h. It seems there
is a certain threshold regarding lipid content necessary to provide sufficient gel stiffness and
viscosity in order to be suitable for a sustained release system. The dependency of the release
rate on the gel stiffness, respectively the amount of lipid content for this formulation, can be
seen in Figure IV-23 C. These findings are in accordance with the results from literature
whereas such low lipid concentration that lead to the above mentioned “washing out” were
not tested [103, 105, 106].
Because there was barely space varying lipid E80 concentrations, the soy derived phospholipid
S100 was investigated. The viscosity of S100 placebo gels were already lower in comparison
with gels with the same lipid content based on E80. 350 mg/g S100 based VPGs in acetate
buffer pH 4 had a viscosity of 0.44 ± 0.04 Pa*s, while 350 mg/g E80 in acetate buffer pH 4 had
a viscosity of 0.59 ± 0.05 Pa*s at a shear rate of 42 1/s. Therefore, higher lipid concentrations
were necessary to achieve a similar release profile compared to the 350 mg/g E80 gels (Figure
IV-23 B). By using S100 based VPGs, there was a slightly larger range to increase the release
rate by varying the lipid content. But with none of the tested formulations a sustained, linear
and complete erosion controlled release like it was shown for EPO [106] or small molecules
[103, 104, 173] was achieved. The release was rather incomplete and release rates in all cases
did wear off during incubation reaching a plateau after 200 h (8.3 days). Also in this case, the
release rate did correlate with the lipid ratio. Lower lipid concentrations resulted in a faster
release (Figure IV-23 B).
When changing only the lipid concentration (same buffer, same protein concentration), a
correlation between viscosity and protein release was visible (Figure IV-23 C and D). Also the
121
sudden decrease in viscosity when going below a certain lipid concentration threshold is
visible. This viscosity decrease is accompanied by an increase of the release rate. Both lipid
types show a similar behavior. Whereas S100 based gels release more protein with a higher
viscosity than E80 based gels. 350 mg/g S100 based VPGs with a viscosity of 0.64 Pa*s released
20.4% of the incorporated protein, while E80 based VPGs with a viscosity of 0.64 Pa*s released
only 5.8 %.
Neither with E80 nor with S100 based VPGs, an erosion controlled release like it was described
in literature was achieved. The majority of the gel was still in the flow through cell after the in
vitro experiments were stopped and the surface of the gel was slightly swollen (Figure IV-27
D). Furthermore, the turbidity of the released fraction was analyzed. According to Tian et al.,
who did observe an erosion controlled release, the turbidity of the release fraction reflects
well the erosion of the matrix [105]. Apart from the samples that were washed out from the
cells, in our studies no real correlation between increased turbidity of the release fraction and
released protein was observed (data not shown). In addition to that, the turbidity values we
observed were much lower on average compared to Tian et al. In our case, erosion is not the
only mechanism for protein release.
4.2.2 Comparing the influence of different protein amounts
By varying the lipid content or lipid type, the release rate could not be modified to match the
expectations of a linear and complete protein release. Therefore the effect of a higher protein
loading was tested (Figure IV-24).
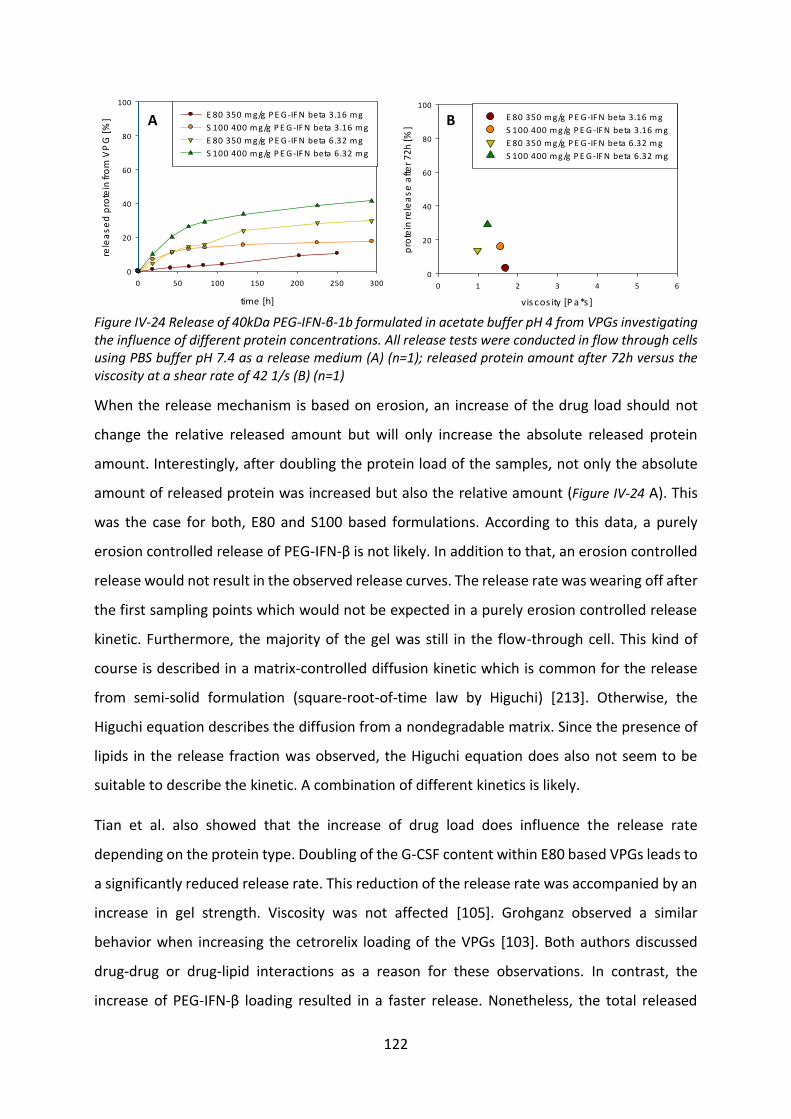
122
time [h]
0 50 100 150 200 250 300
rele
as
ed
pro
tein
fro
m V
PG
[%
]
0
20
40
60
80
100
E 80 350 m g/g P E G -IF N beta 3.16 m g
S 100 400 m g/g P E G -IF N beta 3.16 m g
E 80 350 m g/g P E G -IF N beta 6.32 m g
S 100 400 m g/g P E G -IF N beta 6.32 m g
vis cos ity [P a *s ]
0 1 2 3 4 5 6
pro
tein
re
lea
se
afte
r 7
2h
[%
]
0
20
40
60
80
100
E 80 350 m g/g P E G -IF N beta 3.16 m g
S 100 400 m g/g P E G -IF N beta 3.16 m g
E 80 350 m g/g P E G -IF N beta 6.32 m g
S 100 400 m g/g P E G -IF N beta 6.32 m g
Figure IV-24 Release of 40kDa PEG-IFN-β-1b formulated in acetate buffer pH 4 from VPGs investigating the influence of different protein concentrations. All release tests were conducted in flow through cells using PBS buffer pH 7.4 as a release medium (A) (n=1); released protein amount after 72h versus the viscosity at a shear rate of 42 1/s (B) (n=1)
When the release mechanism is based on erosion, an increase of the drug load should not
change the relative released amount but will only increase the absolute released protein
amount. Interestingly, after doubling the protein load of the samples, not only the absolute
amount of released protein was increased but also the relative amount (Figure IV-24 A). This
was the case for both, E80 and S100 based formulations. According to this data, a purely
erosion controlled release of PEG-IFN-β is not likely. In addition to that, an erosion controlled
release would not result in the observed release curves. The release rate was wearing off after
the first sampling points which would not be expected in a purely erosion controlled release
kinetic. Furthermore, the majority of the gel was still in the flow-through cell. This kind of
course is described in a matrix-controlled diffusion kinetic which is common for the release
from semi-solid formulation (square-root-of-time law by Higuchi) [213]. Otherwise, the
Higuchi equation describes the diffusion from a nondegradable matrix. Since the presence of
lipids in the release fraction was observed, the Higuchi equation does also not seem to be
suitable to describe the kinetic. A combination of different kinetics is likely.
Tian et al. also showed that the increase of drug load does influence the release rate
depending on the protein type. Doubling of the G-CSF content within E80 based VPGs leads to
a significantly reduced release rate. This reduction of the release rate was accompanied by an
increase in gel strength. Viscosity was not affected [105]. Grohganz observed a similar
behavior when increasing the cetrorelix loading of the VPGs [103]. Both authors discussed
drug-drug or drug-lipid interactions as a reason for these observations. In contrast, the
increase of PEG-IFN-β loading resulted in a faster release. Nonetheless, the total released
A
B
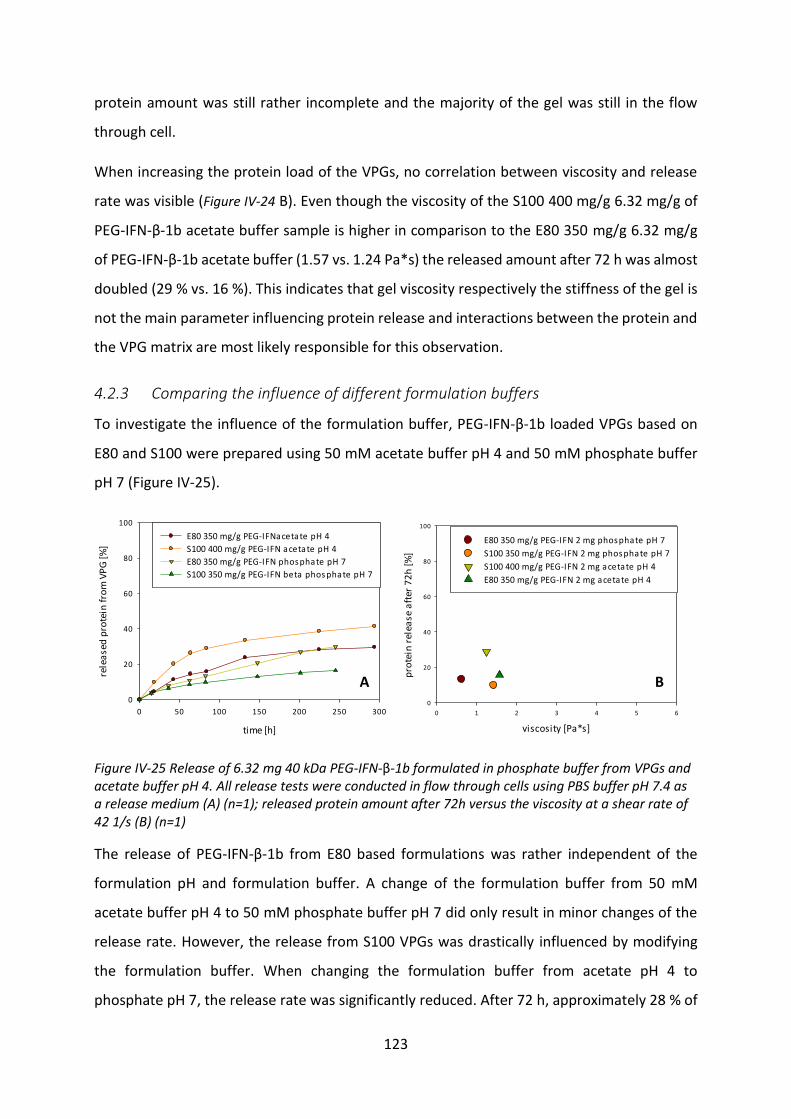
123
protein amount was still rather incomplete and the majority of the gel was still in the flow
through cell.
When increasing the protein load of the VPGs, no correlation between viscosity and release
rate was visible (Figure IV-24 B). Even though the viscosity of the S100 400 mg/g 6.32 mg/g of
PEG-IFN-β-1b acetate buffer sample is higher in comparison to the E80 350 mg/g 6.32 mg/g
of PEG-IFN-β-1b acetate buffer (1.57 vs. 1.24 Pa*s) the released amount after 72 h was almost
doubled (29 % vs. 16 %). This indicates that gel viscosity respectively the stiffness of the gel is
not the main parameter influencing protein release and interactions between the protein and
the VPG matrix are most likely responsible for this observation.
4.2.3 Comparing the influence of different formulation buffers
To investigate the influence of the formulation buffer, PEG-IFN-β-1b loaded VPGs based on
E80 and S100 were prepared using 50 mM acetate buffer pH 4 and 50 mM phosphate buffer
pH 7 (Figure IV-25).
time [h]
0 50 100 150 200 250 300
rele
ase
d p
rote
in f
rom
VP
G [
%]
0
20
40
60
80
100
E80 350 mg/g PEG-IFNacetate pH 4
S100 400 mg/g PEG-IFN acetate pH 4
E80 350 mg/g PEG-IFN phosphate pH 7
S100 350 mg/g PEG-IFN beta phosphate pH 7
viscosity [Pa*s]
0 1 2 3 4 5 6
pro
tein
rel
ease
aft
er 7
2h
[%
]
0
20
40
60
80
100
E80 350 mg/g PEG-IFN 2 mg phosphate pH 7
S100 350 mg/g PEG-IFN 2 mg phosphate pH 7
S100 400 mg/g PEG-IFN 2 mg acetate pH 4
E80 350 mg/g PEG-IFN 2 mg acetate pH 4
Figure IV-25 Release of 6.32 mg 40 kDa PEG-IFN-β-1b formulated in phosphate buffer from VPGs and acetate buffer pH 4. All release tests were conducted in flow through cells using PBS buffer pH 7.4 as a release medium (A) (n=1); released protein amount after 72h versus the viscosity at a shear rate of 42 1/s (B) (n=1)
The release of PEG-IFN-β-1b from E80 based formulations was rather independent of the
formulation pH and formulation buffer. A change of the formulation buffer from 50 mM
acetate buffer pH 4 to 50 mM phosphate buffer pH 7 did only result in minor changes of the
release rate. However, the release from S100 VPGs was drastically influenced by modifying
the formulation buffer. When changing the formulation buffer from acetate pH 4 to
phosphate pH 7, the release rate was significantly reduced. After 72 h, approximately 28 % of
A
B
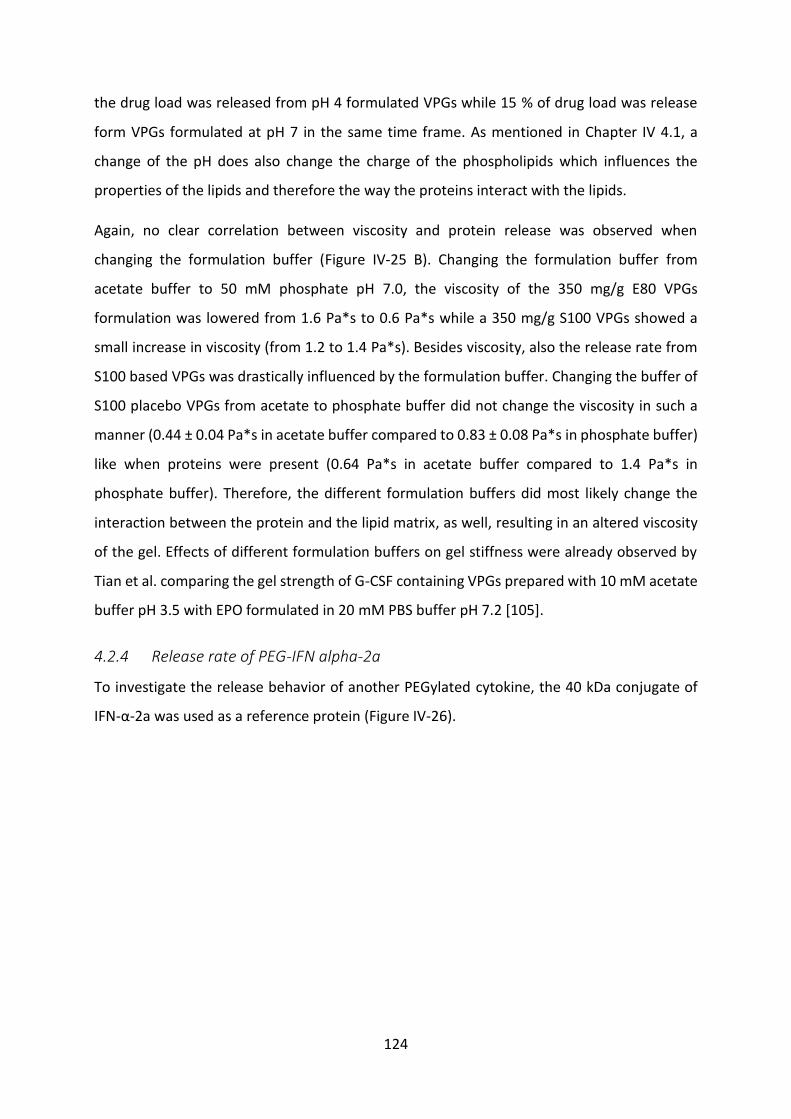
124
the drug load was released from pH 4 formulated VPGs while 15 % of drug load was release
form VPGs formulated at pH 7 in the same time frame. As mentioned in Chapter IV 4.1, a
change of the pH does also change the charge of the phospholipids which influences the
properties of the lipids and therefore the way the proteins interact with the lipids.
Again, no clear correlation between viscosity and protein release was observed when
changing the formulation buffer (Figure IV-25 B). Changing the formulation buffer from
acetate buffer to 50 mM phosphate pH 7.0, the viscosity of the 350 mg/g E80 VPGs
formulation was lowered from 1.6 Pa*s to 0.6 Pa*s while a 350 mg/g S100 VPGs showed a
small increase in viscosity (from 1.2 to 1.4 Pa*s). Besides viscosity, also the release rate from
S100 based VPGs was drastically influenced by the formulation buffer. Changing the buffer of
S100 placebo VPGs from acetate to phosphate buffer did not change the viscosity in such a
manner (0.44 ± 0.04 Pa*s in acetate buffer compared to 0.83 ± 0.08 Pa*s in phosphate buffer)
like when proteins were present (0.64 Pa*s in acetate buffer compared to 1.4 Pa*s in
phosphate buffer). Therefore, the different formulation buffers did most likely change the
interaction between the protein and the lipid matrix, as well, resulting in an altered viscosity
of the gel. Effects of different formulation buffers on gel stiffness were already observed by
Tian et al. comparing the gel strength of G-CSF containing VPGs prepared with 10 mM acetate
buffer pH 3.5 with EPO formulated in 20 mM PBS buffer pH 7.2 [105].
4.2.4 Release rate of PEG-IFN alpha-2a
To investigate the release behavior of another PEGylated cytokine, the 40 kDa conjugate of
IFN-α-2a was used as a reference protein (Figure IV-26).
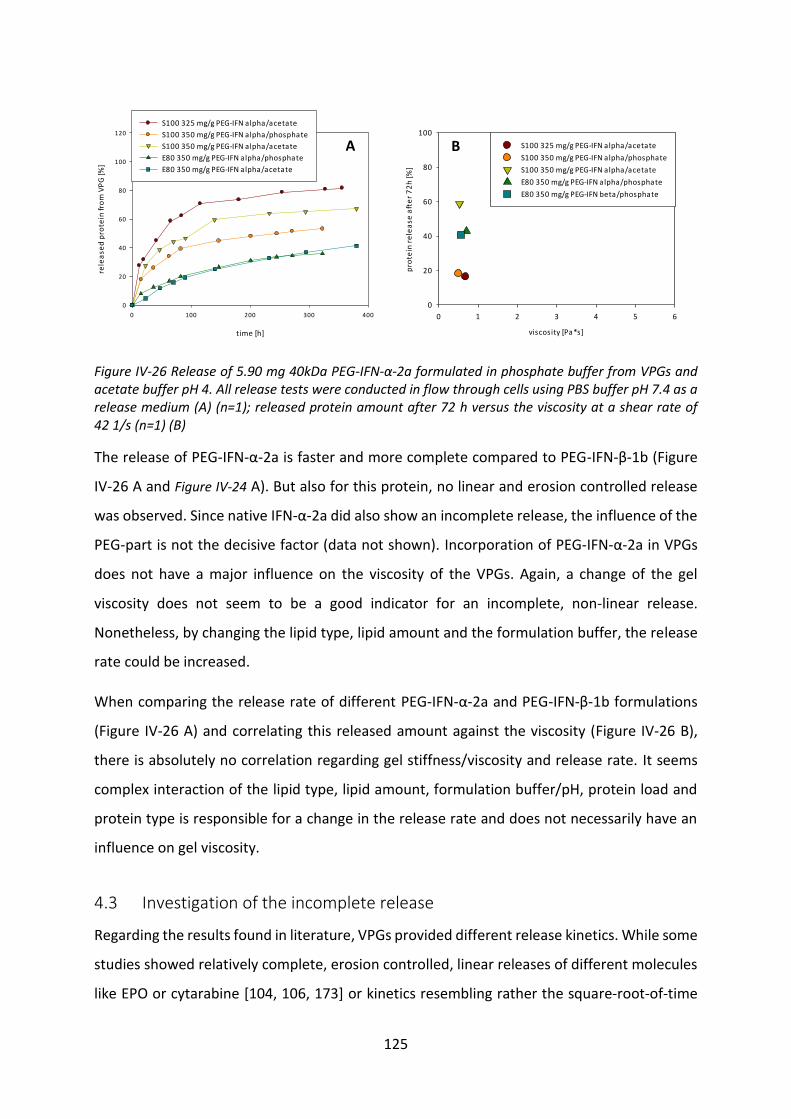
125
viscosity [Pa*s]
0 1 2 3 4 5 6
pro
tein
re
lea
se a
fte
r 7
2h
[%]
0
20
40
60
80
100
S100 325 mg/g PEG-IFN alpha/acetate
S100 350 mg/g PEG-IFN alpha/phosphate
S100 350 mg/g PEG-IFN alpha/acetate
E80 350 mg/g PEG-IFN alpha/phosphate
E80 350 mg/g PEG-IFN beta/phosphate
time [h]
0 100 200 300 400
rele
ase
d p
rote
in fr
om
VP
G [%
]
0
20
40
60
80
100
120
S100 325 mg/g PEG-IFN alpha/acetate
S100 350 mg/g PEG-IFN alpha/phosphate
S100 350 mg/g PEG-IFN alpha/acetate
E80 350 mg/g PEG-IFN alpha/phosphate
E80 350 mg/g PEG-IFN alpha/acetate
Figure IV-26 Release of 5.90 mg 40kDa PEG-IFN-α-2a formulated in phosphate buffer from VPGs and acetate buffer pH 4. All release tests were conducted in flow through cells using PBS buffer pH 7.4 as a release medium (A) (n=1); released protein amount after 72 h versus the viscosity at a shear rate of 42 1/s (n=1) (B)
The release of PEG-IFN-α-2a is faster and more complete compared to PEG-IFN-β-1b (Figure
IV-26 A and Figure IV-24 A). But also for this protein, no linear and erosion controlled release
was observed. Since native IFN-α-2a did also show an incomplete release, the influence of the
PEG-part is not the decisive factor (data not shown). Incorporation of PEG-IFN-α-2a in VPGs
does not have a major influence on the viscosity of the VPGs. Again, a change of the gel
viscosity does not seem to be a good indicator for an incomplete, non-linear release.
Nonetheless, by changing the lipid type, lipid amount and the formulation buffer, the release
rate could be increased.
When comparing the release rate of different PEG-IFN-α-2a and PEG-IFN-β-1b formulations
(Figure IV-26 A) and correlating this released amount against the viscosity (Figure IV-26 B),
there is absolutely no correlation regarding gel stiffness/viscosity and release rate. It seems
complex interaction of the lipid type, lipid amount, formulation buffer/pH, protein load and
protein type is responsible for a change in the release rate and does not necessarily have an
influence on gel viscosity.
4.3 Investigation of the incomplete release
Regarding the results found in literature, VPGs provided different release kinetics. While some
studies showed relatively complete, erosion controlled, linear releases of different molecules
like EPO or cytarabine [104, 106, 173] or kinetics resembling rather the square-root-of-time
A
B
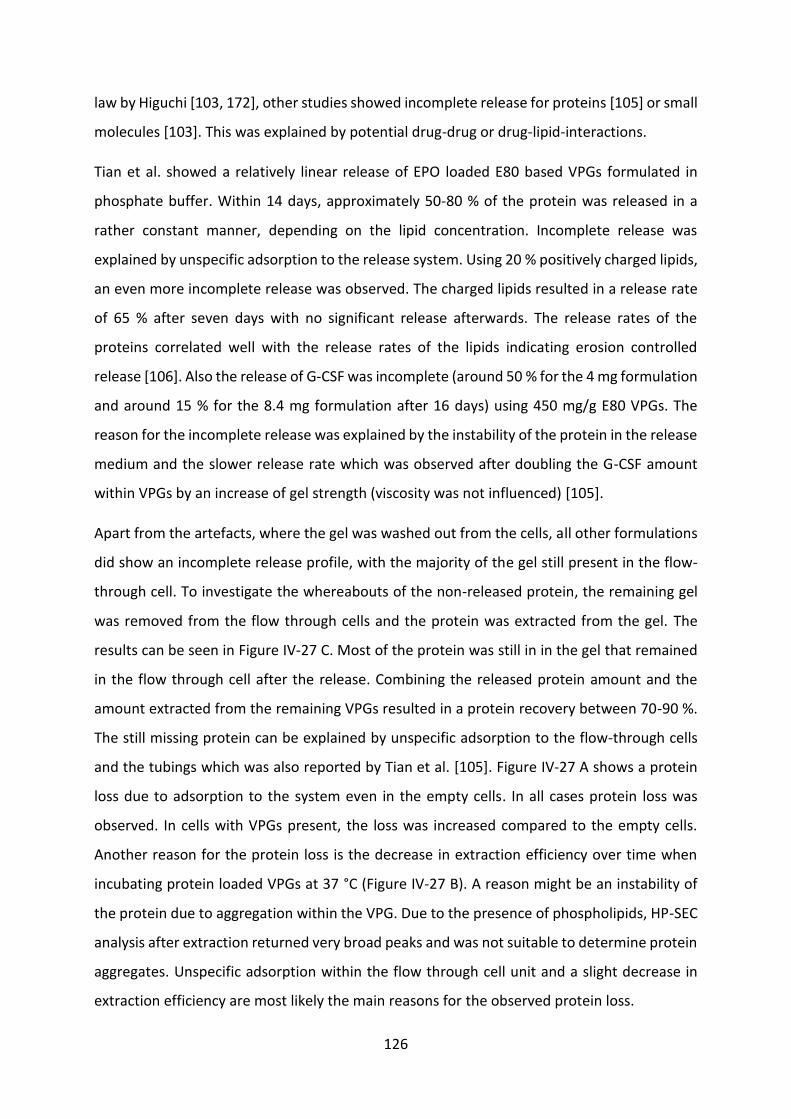
126
law by Higuchi [103, 172], other studies showed incomplete release for proteins [105] or small
molecules [103]. This was explained by potential drug-drug or drug-lipid-interactions.
Tian et al. showed a relatively linear release of EPO loaded E80 based VPGs formulated in
phosphate buffer. Within 14 days, approximately 50-80 % of the protein was released in a
rather constant manner, depending on the lipid concentration. Incomplete release was
explained by unspecific adsorption to the release system. Using 20 % positively charged lipids,
an even more incomplete release was observed. The charged lipids resulted in a release rate
of 65 % after seven days with no significant release afterwards. The release rates of the
proteins correlated well with the release rates of the lipids indicating erosion controlled
release [106]. Also the release of G-CSF was incomplete (around 50 % for the 4 mg formulation
and around 15 % for the 8.4 mg formulation after 16 days) using 450 mg/g E80 VPGs. The
reason for the incomplete release was explained by the instability of the protein in the release
medium and the slower release rate which was observed after doubling the G-CSF amount
within VPGs by an increase of gel strength (viscosity was not influenced) [105].
Apart from the artefacts, where the gel was washed out from the cells, all other formulations
did show an incomplete release profile, with the majority of the gel still present in the flow-
through cell. To investigate the whereabouts of the non-released protein, the remaining gel
was removed from the flow through cells and the protein was extracted from the gel. The
results can be seen in Figure IV-27 C. Most of the protein was still in in the gel that remained
in the flow through cell after the release. Combining the released protein amount and the
amount extracted from the remaining VPGs resulted in a protein recovery between 70-90 %.
The still missing protein can be explained by unspecific adsorption to the flow-through cells
and the tubings which was also reported by Tian et al. [105]. Figure IV-27 A shows a protein
loss due to adsorption to the system even in the empty cells. In all cases protein loss was
observed. In cells with VPGs present, the loss was increased compared to the empty cells.
Another reason for the protein loss is the decrease in extraction efficiency over time when
incubating protein loaded VPGs at 37 °C (Figure IV-27 B). A reason might be an instability of
the protein due to aggregation within the VPG. Due to the presence of phospholipids, HP-SEC
analysis after extraction returned very broad peaks and was not suitable to determine protein
aggregates. Unspecific adsorption within the flow through cell unit and a slight decrease in
extraction efficiency are most likely the main reasons for the observed protein loss.

127
loss
of
pro
tein
[%
]
0
2
4
6
8
10
12
14
16
empty cel l
E80
S100
day 1 day 4 day 7
pro
tein
rec
ove
ry [
%]
0
20
40
60
80
100
120 E80 PEG-IFN beta
S100 PEG-IFN beta
E80 phosphate
S100 phosphate
E80 ace
tate
S100 ace
tate
pro
tein
rec
ove
ry [
%]
0
20
40
60
80
100
120
release
extraction
Figure IV-27 Total loss of protein after pumping a 50 µg/ml PEG-IFN-β-1b solution for six days through an empty flow through cell, a flow through cell containing 400 mg/g E80 placebo VPGs and 400 mg/g S100 placebo VPGs. All cells were incubated at 37 °C during the whole test (A); investigation of the recovery of PEG-IFN-β-1b after extracting the protein from 350 mg/g E80/S100 VPGs. The protein loaded VPGs were stored at 37 °C (B); released amount of protein after 14 days and extraction of the protein from the remaining VPG within the flow through cell for 350 mg/g lipid formulation loaded with 6.32 mg of PEG-IFN-β in acetate respectively phosphate buffer (C); picture of a flow though cell after release for 14 days after opening (D)
4.4 Biological activity after release
In the presence of the phospholipids, only very broad peaks were obtained in HP-SEC analytics.
This made the determination of soluble aggregates with this method impossible. Therefore,
the biological activity was tested after release with iLite™alphabeta Human Type I Interferon
Activity Detection Kit. The tests were conducted for both 350 mg/g E80 and S100 PEG-IFN-β-
1b formulations formulated in phosphate buffer.
A
B
C
D
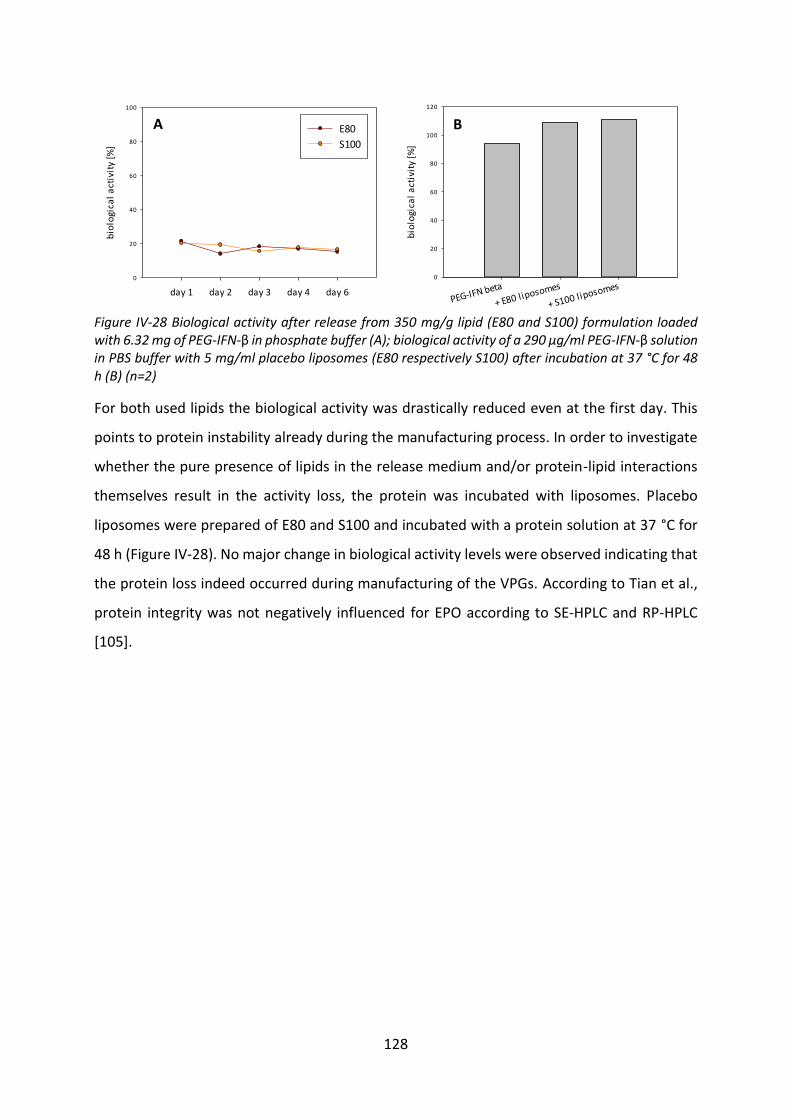
128
day 1 day 2 day 3 day 4 day 6
bio
logi
cal
act
ivit
y [%
]
0
20
40
60
80
100
E80
S100
PEG-IFN beta
+ E80 liposomes
+ S100 liposomes
bio
logi
cal
act
ivit
y [%
]
0
20
40
60
80
100
120
Figure IV-28 Biological activity after release from 350 mg/g lipid (E80 and S100) formulation loaded with 6.32 mg of PEG-IFN-β in phosphate buffer (A); biological activity of a 290 µg/ml PEG-IFN-β solution in PBS buffer with 5 mg/ml placebo liposomes (E80 respectively S100) after incubation at 37 °C for 48 h (B) (n=2)
For both used lipids the biological activity was drastically reduced even at the first day. This
points to protein instability already during the manufacturing process. In order to investigate
whether the pure presence of lipids in the release medium and/or protein-lipid interactions
themselves result in the activity loss, the protein was incubated with liposomes. Placebo
liposomes were prepared of E80 and S100 and incubated with a protein solution at 37 °C for
48 h (Figure IV-28). No major change in biological activity levels were observed indicating that
the protein loss indeed occurred during manufacturing of the VPGs. According to Tian et al.,
protein integrity was not negatively influenced for EPO according to SE-HPLC and RP-HPLC
[105].
A
B
129
4.5 Summary and conclusion
The aim of this chapter was the improvement of the physicochemical characteristics of the
native IFN-β-1b by PEGylation and the development of a lipid based depot system for PEG-
IFN-β-1b.
The PEGylation of nIFN-β-1b was successfully achieved via reductive amination using a 40 kDa
PEG-aldehyde. A monoPEGylated 40 kDa species could be isolated and successfully separated
from unmodified protein and multiPEGylated protein with a monoPEGylated protein content
of up to 95 %. Despite of differences in the β-sheet-region in the FTIR-spectrum in comparison
with the native protein, 64 % of the biological activity was maintained after PEGylation.
Furthermore, the hydrophobicity of nIFN-β-1b could be decreased by PEGylation and
sufficient solubility at pH 7 was finally achieved. According to the biological activity assay
stability in PBS buffer pH 7.4 at 37 °C was maintained for four days with a decrease of activity
at day seven. Stability in solution in the presence of lipids was increased in comparison with
the native protein. However, the negative influence of lipids on protein stability in the buffer
was not completely eliminated and a loss of activity was observed during incubation.
For PEG-IFN-β-1b a lyophilisate as a suitable intermediate for extrudate preparation was
successfully developed. A sustained release from triglyceride based PEG-IFN-β-1b loaded
extrudates was achieved both, in SDS containing release medium and in release medium
without SDS. The latter provided a relatively linear release over seven days. During release,
the formation of fissures in PEG-IFN loaded extrudates partially was observed, leading to
extrudates being cracked open in the worst case. These fissures did also influence the release
rate. By reducing the amount of PEG-IFN, the cracks could be avoided. This indicates, that PEG-
IFN itself is the major reason for the observed phenomenon. The biological activity decreased
during the release. While lyophilisation and extrudate preparation did not have a negative
influence, the activity loss can be attributed to the instability of the protein in the buffer in
the presence of lipids. The presence of one lipid type (D118) led to an increase in oxidized
protein. Generally, solid lipid implants seem a suitable depot system for PEG-IFN-β-1b, even
though the influence of different lipids on protein stability has to be closely investigated.
By PEGylation, the interactions between phospholipids and proteins were reduced which
made a release test from VPGs possible in the first place. Even though a sustained release over
up to 14 days was achieved, the release was incomplete and the release rate was not linear.
130
Unlike in most cases in literature [104, 106, 173], the release kinetics were not purely erosion
controlled. They appear to be a combination between a diffusion controlled and erosion
controlled process. A correlation between the gel viscosities respectively the gel stiffness was
not given. Most likely, the interactions between the protein and the lipids result in different
release scenarios. These interactions are influenced by many different parameters like the
formulation buffer, the type of lipids and the protein-lipid ratio. The changed interactions did
also influence the release rate of the protein and also the properties of the gel. Comparing
these results to literature, it seems that the type of protein or molecule is the major factor
whether a complete and sustained release is possible or not. No change in other parameters
resulted in a complete release. Reasons for the very different behaviors are most likely found
in the degree and type of interactions between the incorporated molecule and the lipids. In
order to find methods to get more and faster information regarding these interactions, these
interactions will be investigated with different analytics in the next chapter.
A test regarding the bioactivity after release from VPGs resulted in a major loss in activity even
after the first release day. Since incubation of the protein with liposomes did not considerably
change the biological activity, the reason for the loss in activity happens most likely during the
manufacturing process. According to our observations VPGs do not seem to be an appropriate
depot system for PEG-IFN-β-1b.
131
Chapter V Protein-lipid-interactions
Looking at the incomplete releases of peptides from polylactid-co-glycolid drug delivery
systems mentioned in literature, protein interactions with the formulation are a relevant
issue. Adsorption phenomena, amongst others, due to hydrophobic or electrostatic forces
have been identified as a reason for these observations [54, 55, 66, 67]. For lipid based depot
systems, interactions with peptides and proteins are reported, was well. Incomplete release
from VPGs were observed for instance for cetrorelix [103] and a therapeutic monoclonal
antibody [105] which are explained by protein-lipid interactions. Unfortunately, no further studies
regarding those interactions have been made in these cases. Also, incomplete releases from solid
lipid implants and protein instabilities within the extrudates have been reported [72, 165]. In the
studies carried out in this thesis, an incomplete release, both from solid lipid implants, and
VPGs was observed. Adsorption might not only result in a loss of protein material leading to
an uncertainty of the administered dose, but bears also the risk of surface induced aggregation
or changes in the higher order structure of the drug [214].
In Chapter III and Chapter IV it was shown that the presence of the matrix material of the
solid lipid implants did lead to different unfavorable effects like decreased solubility in solution
as it was seen during incubation of nIFN-β-1b and PEG-IFN-β-1b with placebo extrudates.
Furthermore, a decrease in the biological activity in combination with an increased oxidation
of the protein during incubation in the buffer in the presence of triglycerides was observed.
Therefore, both, the affinity of the proteins to triglycerides and the influence of PEGylation on
the adsorption on triglyceride surfaces was investigated using a quartz crystal microbalance.
When testing VPG as a depot system, various challenges regarding different protein-
phospholipid interactions had to be taken into account. These interactions went from the not
feasible extraction of the nIFN-β from VPGs to the increased viscosity of VPGs when proteins
were incorporated. Furthermore, a no pure erosion controlled release and consequently a
changed release kinetic from protein loaded VPGs was observed. Viscosity was not a suitable
parameter to predict the release behavior, since the release rate from VPGs did not
necessarily correlate with the viscosity of the gel. Therefore different methods will be
investigated that may be able to characterize those interactions between phospholipids and
the proteins and will hopefully shed some more light on the reason for these observations.
Especially the effect of PEGylation regarding the influence on protein-lipid interactions will be
132
investigated and compared to different proteins like lysozyme, IFN-α-2a and PEG-IFN-α-2a
which are used as reference proteins. Common models to investigate these interactions are
liposomes [128, 215-220] or phospholipid mono layers [221-224].
1 Materials and Methods
1.1 Materials
Interferon-β-1b raw material in aqueous acetate buffer at pH 5-6 with a protein concentration
of about 2 mg/ml containing 0.1 % SDS and EDTA was kindly provided by Bayer Pharma AG
and desalted as already described in Chapter III 2.2.1. Recombinant IFN-α-2a and 40 kDa PEG-
IFN-α-2a were kindly gifted by Roche Diagnostics GmbH (Penzberg, Germany). The mono-acid
triglycerides Dynasan 118 (glycerol tristearin) was kindly gifted by CREMER OLEO GmbH & Co.
KG (Witten, Germany). Phospholipids E80 and S100 were kindly provided by Lipoid GmbH,
Ludwigshafen (Germany). For a comparison of the composition of the lipids see Chapter IV
1.1. All other chemicals and reagents were of analytical grade and purchased either from
Sigma-Aldrich (Steinheim, Germany) or VWR Prolabo (Leuven, Belgium).
1.2 Methods
1.2.1 Liposome preparation
1 g of 350 mg/g VPGs were prepared with the respective lipid according to Chapter III 2.2.13.
The VPGs were redispersed in 7 ml highly purified water. For homogenization the dispersion
was extruded using a polycarbonate syringe filter holder (Sartorius, Germany) with a 0.1 µm
polycarbonate filter (GE Water & Process Technologies, Germany). Extrusion process was
repeated until a z-average of 147 ± 23 µm and a PDI of < 150 was achieved according to
dynamic light scattering (Malvern Zetasizer Nano ZS (Malvern, Germany)). For the interaction
studies the liposomes were added to a 250 µg/ml protein solution in the respective buffer
ending with 96 µg lipid per milliliter. PEG-IFN-β-1b and PEG-IFN-α-2a were used in a
concentration of 790 µg/ml respectively 770 µg/ml to provide the same molar ratio compared
to their non-PEGylated counterparts, which were used in a concentration of 250 µg/ml, each.
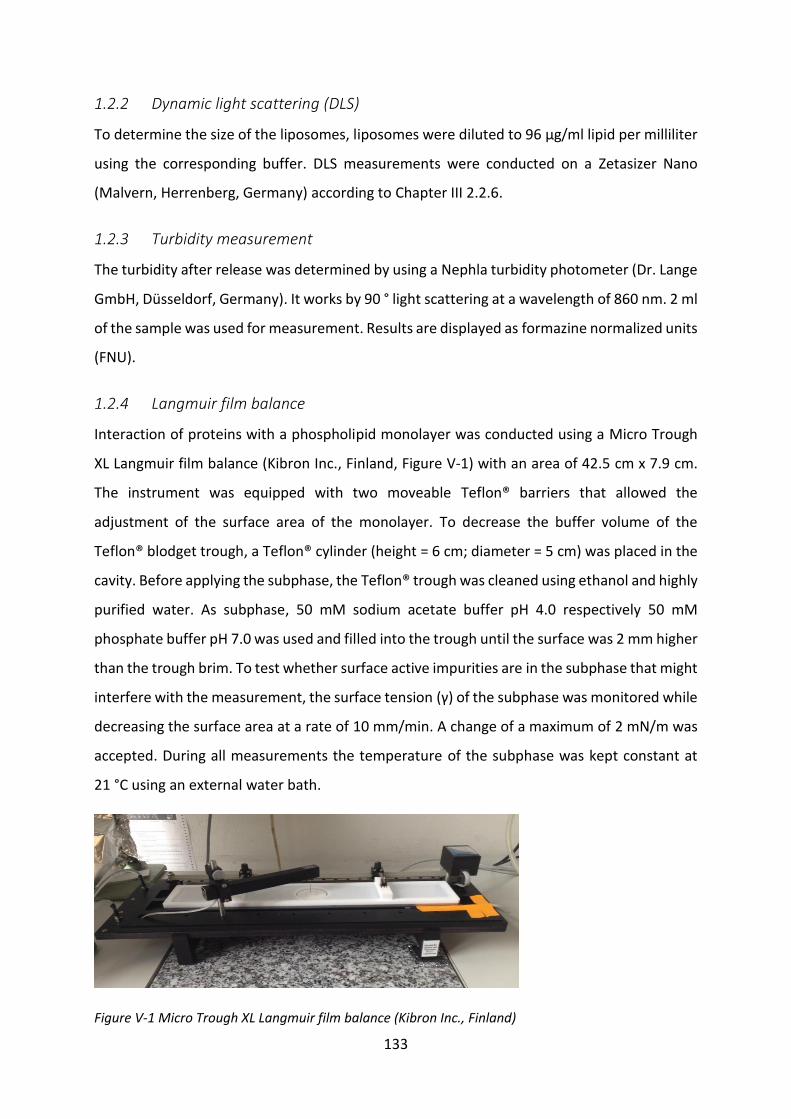
133
1.2.2 Dynamic light scattering (DLS)
To determine the size of the liposomes, liposomes were diluted to 96 µg/ml lipid per milliliter
using the corresponding buffer. DLS measurements were conducted on a Zetasizer Nano
(Malvern, Herrenberg, Germany) according to Chapter III 2.2.6.
1.2.3 Turbidity measurement
The turbidity after release was determined by using a Nephla turbidity photometer (Dr. Lange
GmbH, Düsseldorf, Germany). It works by 90 ° light scattering at a wavelength of 860 nm. 2 ml
of the sample was used for measurement. Results are displayed as formazine normalized units
(FNU).
1.2.4 Langmuir film balance
Interaction of proteins with a phospholipid monolayer was conducted using a Micro Trough
XL Langmuir film balance (Kibron Inc., Finland, Figure V-1) with an area of 42.5 cm x 7.9 cm.
The instrument was equipped with two moveable Teflon® barriers that allowed the
adjustment of the surface area of the monolayer. To decrease the buffer volume of the
Teflon® blodget trough, a Teflon® cylinder (height = 6 cm; diameter = 5 cm) was placed in the
cavity. Before applying the subphase, the Teflon® trough was cleaned using ethanol and highly
purified water. As subphase, 50 mM sodium acetate buffer pH 4.0 respectively 50 mM
phosphate buffer pH 7.0 was used and filled into the trough until the surface was 2 mm higher
than the trough brim. To test whether surface active impurities are in the subphase that might
interfere with the measurement, the surface tension (γ) of the subphase was monitored while
decreasing the surface area at a rate of 10 mm/min. A change of a maximum of 2 mN/m was
accepted. During all measurements the temperature of the subphase was kept constant at
21 °C using an external water bath.
Figure V-1 Micro Trough XL Langmuir film balance (Kibron Inc., Finland)
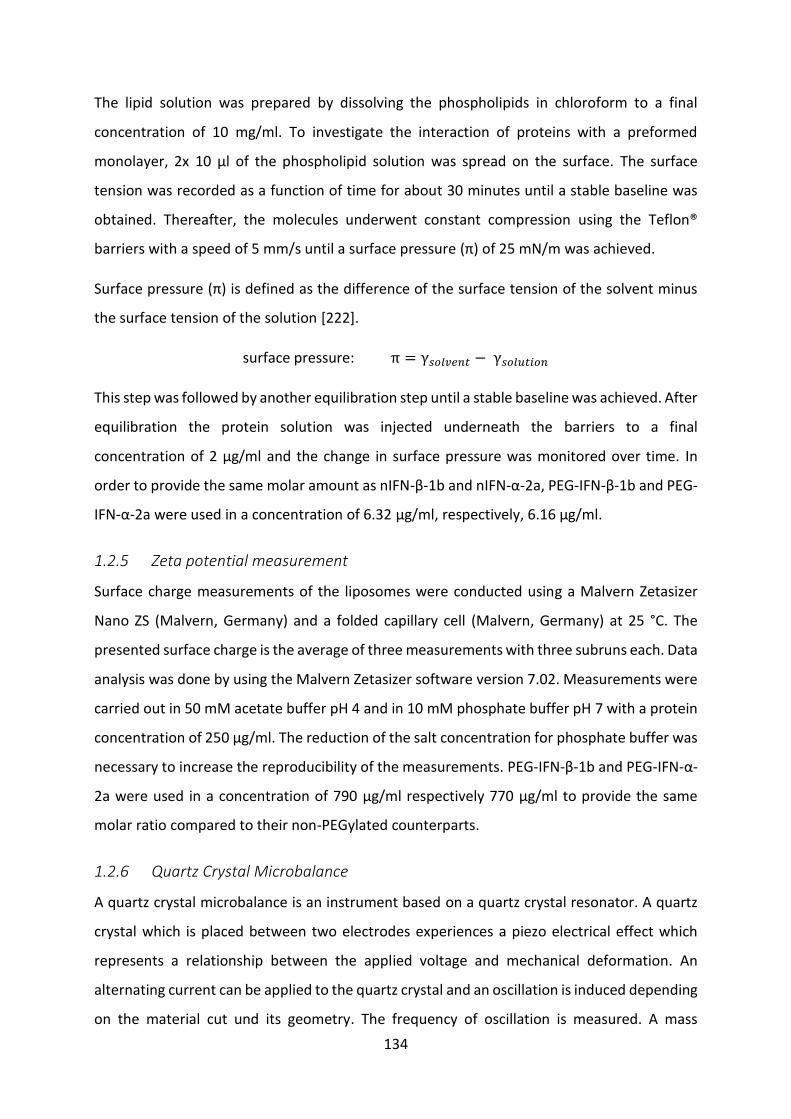
134
The lipid solution was prepared by dissolving the phospholipids in chloroform to a final
concentration of 10 mg/ml. To investigate the interaction of proteins with a preformed
monolayer, 2x 10 µl of the phospholipid solution was spread on the surface. The surface
tension was recorded as a function of time for about 30 minutes until a stable baseline was
obtained. Thereafter, the molecules underwent constant compression using the Teflon®
barriers with a speed of 5 mm/s until a surface pressure (π) of 25 mN/m was achieved.
Surface pressure (π) is defined as the difference of the surface tension of the solvent minus
the surface tension of the solution [222].
surface pressure: π = γ𝑠𝑜𝑙𝑣𝑒𝑛𝑡 − γ𝑠𝑜𝑙𝑢𝑡𝑖𝑜𝑛
This step was followed by another equilibration step until a stable baseline was achieved. After
equilibration the protein solution was injected underneath the barriers to a final
concentration of 2 µg/ml and the change in surface pressure was monitored over time. In
order to provide the same molar amount as nIFN-β-1b and nIFN-α-2a, PEG-IFN-β-1b and PEG-
IFN-α-2a were used in a concentration of 6.32 µg/ml, respectively, 6.16 µg/ml.
1.2.5 Zeta potential measurement
Surface charge measurements of the liposomes were conducted using a Malvern Zetasizer
Nano ZS (Malvern, Germany) and a folded capillary cell (Malvern, Germany) at 25 °C. The
presented surface charge is the average of three measurements with three subruns each. Data
analysis was done by using the Malvern Zetasizer software version 7.02. Measurements were
carried out in 50 mM acetate buffer pH 4 and in 10 mM phosphate buffer pH 7 with a protein
concentration of 250 µg/ml. The reduction of the salt concentration for phosphate buffer was
necessary to increase the reproducibility of the measurements. PEG-IFN-β-1b and PEG-IFN-α-
2a were used in a concentration of 790 µg/ml respectively 770 µg/ml to provide the same
molar ratio compared to their non-PEGylated counterparts.
1.2.6 Quartz Crystal Microbalance
A quartz crystal microbalance is an instrument based on a quartz crystal resonator. A quartz
crystal which is placed between two electrodes experiences a piezo electrical effect which
represents a relationship between the applied voltage and mechanical deformation. An
alternating current can be applied to the quartz crystal and an oscillation is induced depending
on the material cut und its geometry. The frequency of oscillation is measured. A mass
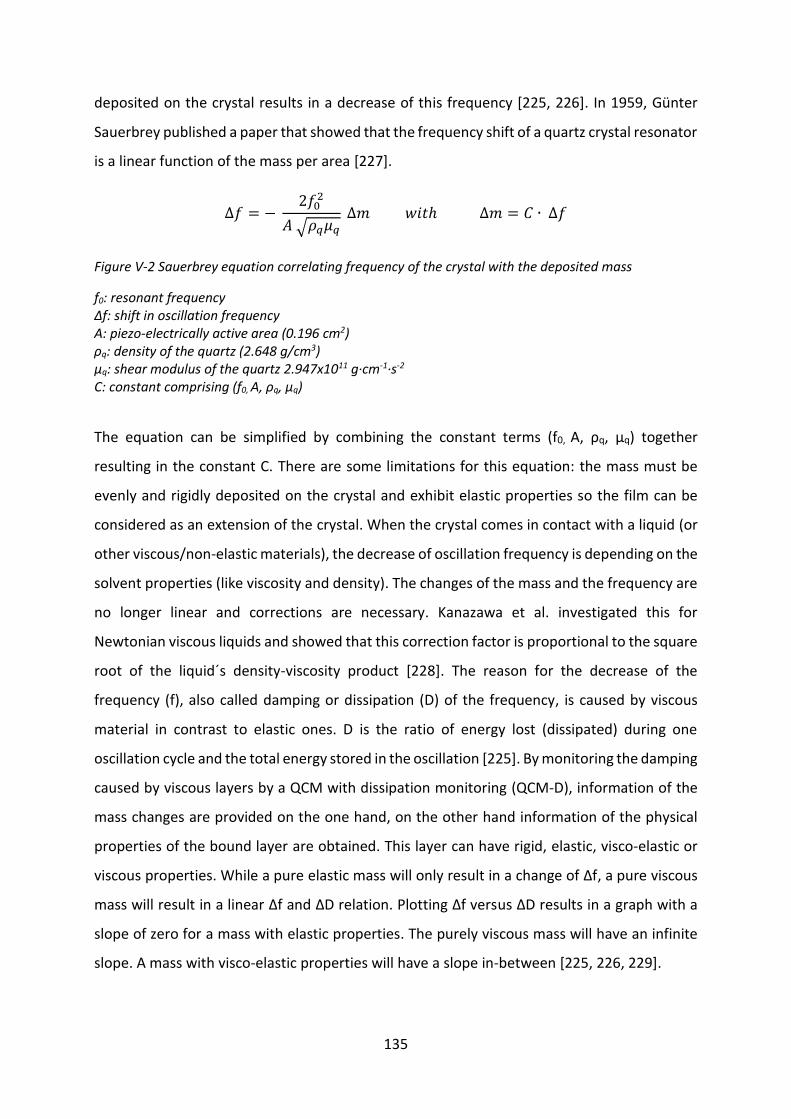
135
deposited on the crystal results in a decrease of this frequency [225, 226]. In 1959, Günter
Sauerbrey published a paper that showed that the frequency shift of a quartz crystal resonator
is a linear function of the mass per area [227].
∆𝑓 = − 2𝑓0
2
𝐴 √𝜌𝑞𝜇𝑞
∆𝑚 𝑤𝑖𝑡ℎ ∆𝑚 = 𝐶 ∙ ∆𝑓
Figure V-2 Sauerbrey equation correlating frequency of the crystal with the deposited mass
f0: resonant frequency ∆f: shift in oscillation frequency A: piezo-electrically active area (0.196 cm2) ρq: density of the quartz (2.648 g/cm3) µq: shear modulus of the quartz 2.947x10¹¹ g·cm-1·s-2 C: constant comprising (f0, A, ρq, µq)
The equation can be simplified by combining the constant terms (f0, A, ρq, µq) together
resulting in the constant C. There are some limitations for this equation: the mass must be
evenly and rigidly deposited on the crystal and exhibit elastic properties so the film can be
considered as an extension of the crystal. When the crystal comes in contact with a liquid (or
other viscous/non-elastic materials), the decrease of oscillation frequency is depending on the
solvent properties (like viscosity and density). The changes of the mass and the frequency are
no longer linear and corrections are necessary. Kanazawa et al. investigated this for
Newtonian viscous liquids and showed that this correction factor is proportional to the square
root of the liquid´s density-viscosity product [228]. The reason for the decrease of the
frequency (f), also called damping or dissipation (D) of the frequency, is caused by viscous
material in contrast to elastic ones. D is the ratio of energy lost (dissipated) during one
oscillation cycle and the total energy stored in the oscillation [225]. By monitoring the damping
caused by viscous layers by a QCM with dissipation monitoring (QCM-D), information of the
mass changes are provided on the one hand, on the other hand information of the physical
properties of the bound layer are obtained. This layer can have rigid, elastic, visco-elastic or
viscous properties. While a pure elastic mass will only result in a change of Δf, a pure viscous
mass will result in a linear Δf and ΔD relation. Plotting Δf versus ΔD results in a graph with a
slope of zero for a mass with elastic properties. The purely viscous mass will have an infinite
slope. A mass with visco-elastic properties will have a slope in-between [225, 226, 229].
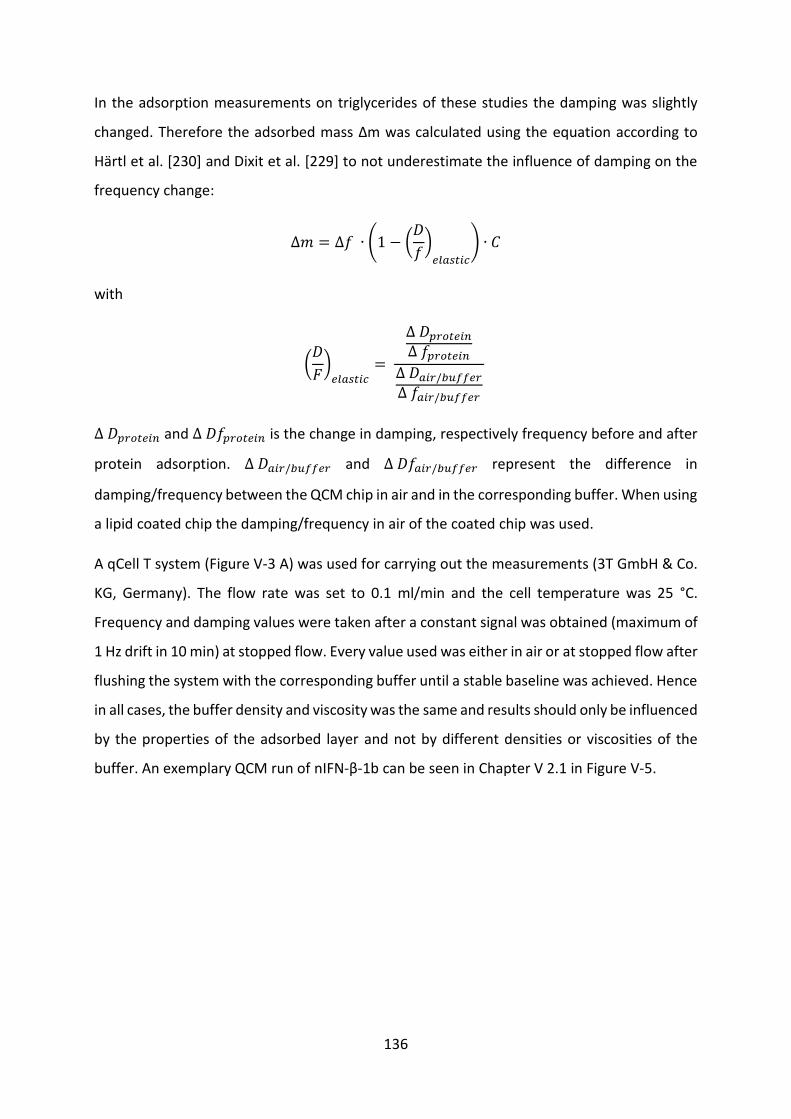
136
In the adsorption measurements on triglycerides of these studies the damping was slightly
changed. Therefore the adsorbed mass Δm was calculated using the equation according to
Härtl et al. [230] and Dixit et al. [229] to not underestimate the influence of damping on the
frequency change:
∆𝑚 = ∆𝑓 ∙ (1 − (𝐷
𝑓)
𝑒𝑙𝑎𝑠𝑡𝑖𝑐
) ∙ 𝐶
with
(𝐷
𝐹)
𝑒𝑙𝑎𝑠𝑡𝑖𝑐=
∆ 𝐷𝑝𝑟𝑜𝑡𝑒𝑖𝑛
∆ 𝑓𝑝𝑟𝑜𝑡𝑒𝑖𝑛
∆ 𝐷𝑎𝑖𝑟/𝑏𝑢𝑓𝑓𝑒𝑟
∆ 𝑓𝑎𝑖𝑟/𝑏𝑢𝑓𝑓𝑒𝑟
∆ 𝐷𝑝𝑟𝑜𝑡𝑒𝑖𝑛 and ∆ 𝐷𝑓𝑝𝑟𝑜𝑡𝑒𝑖𝑛 is the change in damping, respectively frequency before and after
protein adsorption. ∆ 𝐷𝑎𝑖𝑟/𝑏𝑢𝑓𝑓𝑒𝑟 and ∆ 𝐷𝑓𝑎𝑖𝑟/𝑏𝑢𝑓𝑓𝑒𝑟 represent the difference in
damping/frequency between the QCM chip in air and in the corresponding buffer. When using
a lipid coated chip the damping/frequency in air of the coated chip was used.
A qCell T system (Figure V-3 A) was used for carrying out the measurements (3T GmbH & Co.
KG, Germany). The flow rate was set to 0.1 ml/min and the cell temperature was 25 °C.
Frequency and damping values were taken after a constant signal was obtained (maximum of
1 Hz drift in 10 min) at stopped flow. Every value used was either in air or at stopped flow after
flushing the system with the corresponding buffer until a stable baseline was achieved. Hence
in all cases, the buffer density and viscosity was the same and results should only be influenced
by the properties of the adsorbed layer and not by different densities or viscosities of the
buffer. An exemplary QCM run of nIFN-β-1b can be seen in Chapter V 2.1 in Figure V-5.
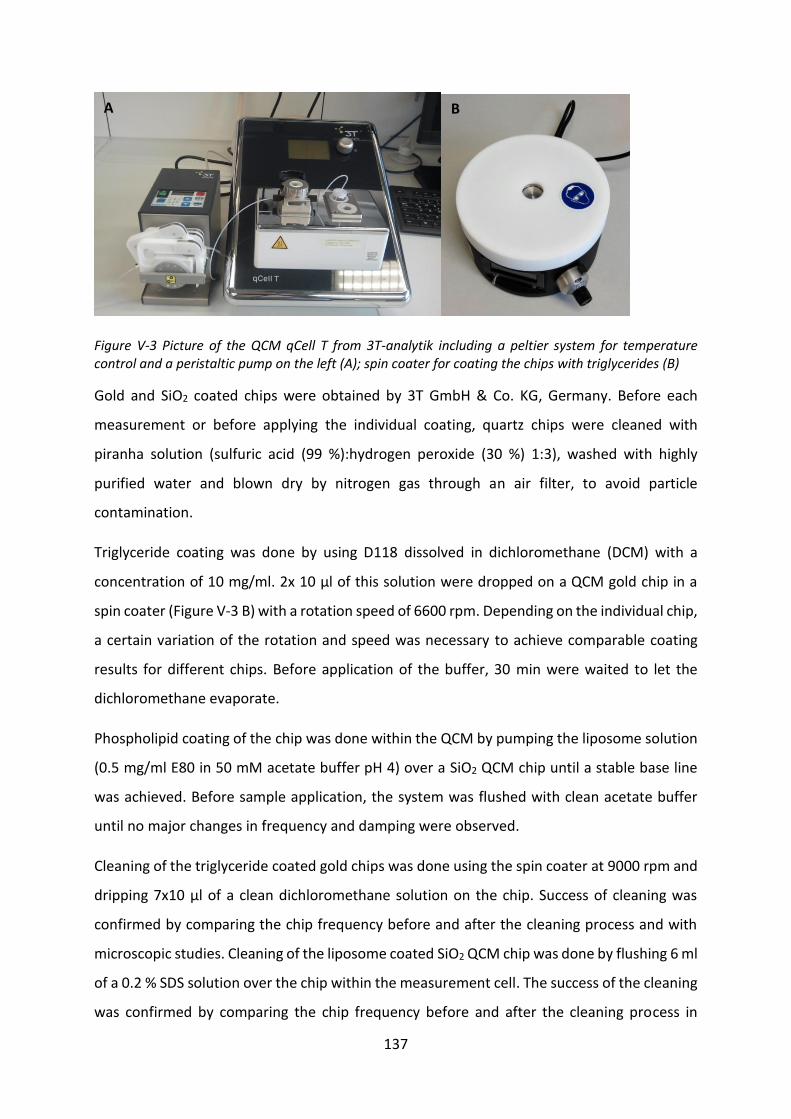
137
Figure V-3 Picture of the QCM qCell T from 3T-analytik including a peltier system for temperature control and a peristaltic pump on the left (A); spin coater for coating the chips with triglycerides (B)
Gold and SiO2 coated chips were obtained by 3T GmbH & Co. KG, Germany. Before each
measurement or before applying the individual coating, quartz chips were cleaned with
piranha solution (sulfuric acid (99 %):hydrogen peroxide (30 %) 1:3), washed with highly
purified water and blown dry by nitrogen gas through an air filter, to avoid particle
contamination.
Triglyceride coating was done by using D118 dissolved in dichloromethane (DCM) with a
concentration of 10 mg/ml. 2x 10 µl of this solution were dropped on a QCM gold chip in a
spin coater (Figure V-3 B) with a rotation speed of 6600 rpm. Depending on the individual chip,
a certain variation of the rotation and speed was necessary to achieve comparable coating
results for different chips. Before application of the buffer, 30 min were waited to let the
dichloromethane evaporate.
Phospholipid coating of the chip was done within the QCM by pumping the liposome solution
(0.5 mg/ml E80 in 50 mM acetate buffer pH 4) over a SiO2 QCM chip until a stable base line
was achieved. Before sample application, the system was flushed with clean acetate buffer
until no major changes in frequency and damping were observed.
Cleaning of the triglyceride coated gold chips was done using the spin coater at 9000 rpm and
dripping 7x10 µl of a clean dichloromethane solution on the chip. Success of cleaning was
confirmed by comparing the chip frequency before and after the cleaning process and with
microscopic studies. Cleaning of the liposome coated SiO2 QCM chip was done by flushing 6 ml
of a 0.2 % SDS solution over the chip within the measurement cell. The success of the cleaning
was confirmed by comparing the chip frequency before and after the cleaning process in
A B
138
water. Data processing was done using the software qGraph 1.2 provided by the manufacturer
(3T GmbH & Co. KG, Germany).
1.2.7 Liposome leakage test
E80 and S100 based liposomes were prepared using the film method. Phospholipids were
dissolved in chloroform to a final concentration of 100 mg/ml. 10 ml of this solution were
added in a 500 ml rotary evaporator flask. The organic solvent was removed during constant
rotation of the flask at 40 °C under reduced pressure in a rotary evaporator. After drying, the
phospholipid film was rehydrated with 10 ml of a calcein solution containing 50 mM calcein in
acetate buffer pH 4 or respectively in phosphate buffer pH 7 in the presence of glass beads for
1 h.
To remove the nonencapsulated calcein (622 kDa), the liposomal solution was filtered in
Sephadex G-50 medium with a fractionation range of 1500 – 30000 Da (GE Healthcare,
Germany). Triton® X-100 was added to a final concentration of 5 % to an aliquot of the purified
liposomes and the fluorescence signal was measured using a Varian Cary Eclipse fluorescence
spectrophotometer (Varian Deutschland GmbH, Germany) in a 96 well plate at 20 °C at
different time points. The excitation and emission wavelength were 280 nm and 543 nm. Only
those fractions were used that showed a signal to noise ratio of at least 10 regarding the
measured fluorescence before and after 100 % leakage (Triton® X-100).
To investigate the influence of the proteins on the calcein leakage, the proteins were added
to the liposomes in a final concentration of 0.100 and 1.00 mg/ml in 50 mM acetate buffer pH
4 and 50 mM phosphate buffer pH 7. For the PEGylated proteins, concentrations of 0.316 and
3.16 mg/ml (PEG-IFN-β-1b) and 0.308 and 3.08 mg/ml (PEG-IFN-α-2a) were used to provide
the same molar amount of protein compared to the non-PEGylated counterparts.
The percentage of the leakage was determined with the following formula:
𝐿𝑒𝑎𝑘𝑎𝑔𝑒 [%] = 100 ∙𝐹𝑝𝑟𝑜𝑡𝑒𝑖𝑛 − 𝐹𝑏𝑎𝑠𝑒
𝐹𝑇𝑟𝑖𝑡𝑜𝑛 − 𝐹𝑏𝑎𝑠𝑒
Fbase: fluorescence intensity after the removal of nonencapsulated calcein FTriton: fluorescence intensity after the addition of Triton® X-100 Fprotein: fluorescence intensity after protein interaction
139
2 Results of the protein-triglyceride interaction
Due to the decreased stability in solution when incubating nIFN-β-1b and PEG-IFN-β-1b with
placebo extrudates, as well as the tendency to the formation of aggregates and hydrophilic
species, a more detailed investigation of protein-lipid interactions necessary. The positive
effect of PEGylation on protein stability in solution at 37 °C in buffers containing surfactants
in comparison to the native protein was shown in Chapter IV 2.2.4. Even in PBS buffer without
any additives, PEG-IFN-β was rather stable over a certain time frame. Also the bioactivity did
not change during the incubation in PBS buffer (Chapter IV 4.4). Nonetheless, during the
incubation with lipids, not only the biological activity was decreased for both protein species
but also the protein recovery (Chapter IV 4.4). Therefore, a more detailed investigation
regarding the protein loss will be done in this chapter. The aim was to investigate the affinity
of IFN-β-1b to the triglyceride surfaces and the influence of PEGylation on these drug-lipid-
interactions. Furthermore, nIFN-α-2a and PEG-IFN-α-2a were used as non-PEGylated and
PEGylated reference proteins while lysozyme was used as a more hydrophilic protein
reference.
2.1 Protein adsorption determined by quartz crystal microbalance (QCM)
Several attempts and techniques were investigated to quantify protein adsorption on the
placebo extrudates. After incubation of the extrudates in the protein solution, the extrudates
were incubated in different buffers to desorb the proteins. The buffers ranged from pH 2
glycine buffer to 0.1-0.2 % SDS containing buffers of different pH values. In no buffer a
quantifiable amount of protein was detected with RP-HPLC and a fluorescence detector (data
not shown). Either the adsorbed protein amount was too small or the desorption process was
insufficient. Other attempts involved IR-microscopy and front face fluorescence. Again, no
adsorbed protein was detected on the surface of the extrudates most likely due to too small
amounts (data not shown). QCM is a method to measure adsorption of molecules on surfaces
and is able to detect very small masses (low nanogram per square centimeter range [225]). It
has been used for numerous adsorption studies of proteins on different surfaces like titanium
and gold [231], polymers [232-234] or silicone oil [229]. In this case, QCM is tested for protein
adsorption on triglyceride coated chips.
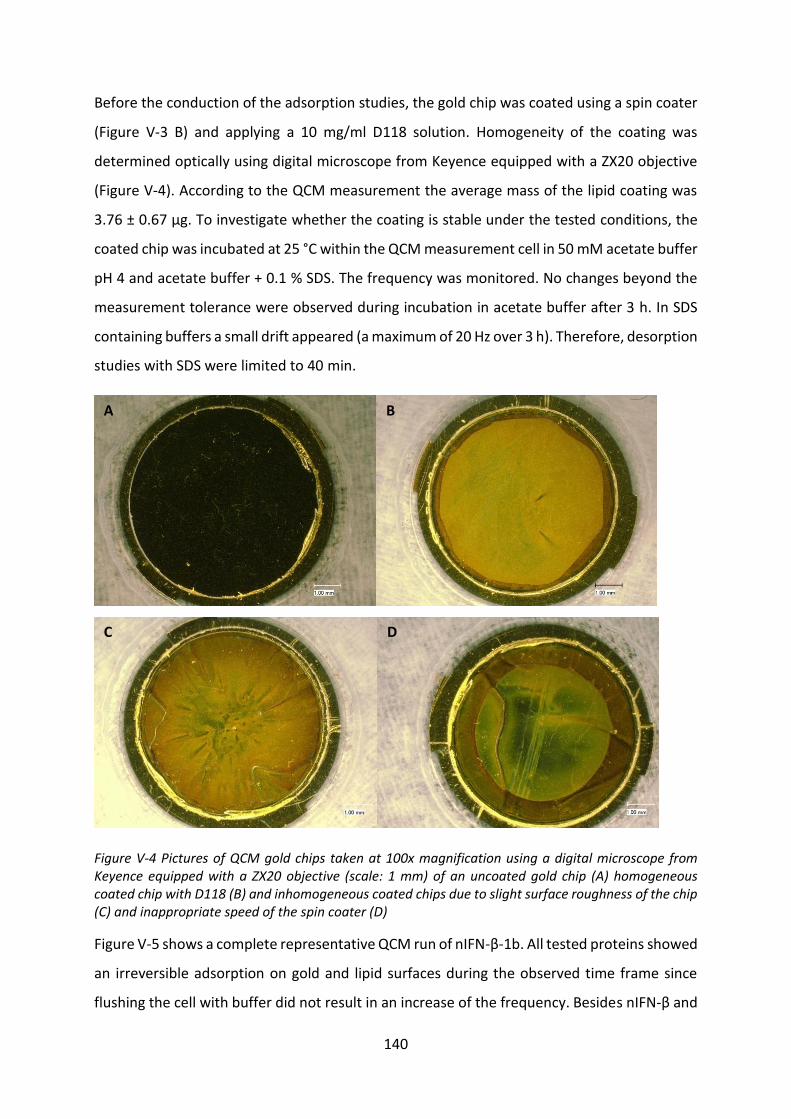
140
Before the conduction of the adsorption studies, the gold chip was coated using a spin coater
(Figure V-3 B) and applying a 10 mg/ml D118 solution. Homogeneity of the coating was
determined optically using digital microscope from Keyence equipped with a ZX20 objective
(Figure V-4). According to the QCM measurement the average mass of the lipid coating was
3.76 ± 0.67 µg. To investigate whether the coating is stable under the tested conditions, the
coated chip was incubated at 25 °C within the QCM measurement cell in 50 mM acetate buffer
pH 4 and acetate buffer + 0.1 % SDS. The frequency was monitored. No changes beyond the
measurement tolerance were observed during incubation in acetate buffer after 3 h. In SDS
containing buffers a small drift appeared (a maximum of 20 Hz over 3 h). Therefore, desorption
studies with SDS were limited to 40 min.
Figure V-4 Pictures of QCM gold chips taken at 100x magnification using a digital microscope from Keyence equipped with a ZX20 objective (scale: 1 mm) of an uncoated gold chip (A) homogeneous coated chip with D118 (B) and inhomogeneous coated chips due to slight surface roughness of the chip (C) and inappropriate speed of the spin coater (D)
Figure V-5 shows a complete representative QCM run of nIFN-β-1b. All tested proteins showed
an irreversible adsorption on gold and lipid surfaces during the observed time frame since
flushing the cell with buffer did not result in an increase of the frequency. Besides nIFN-β and
A B
C D
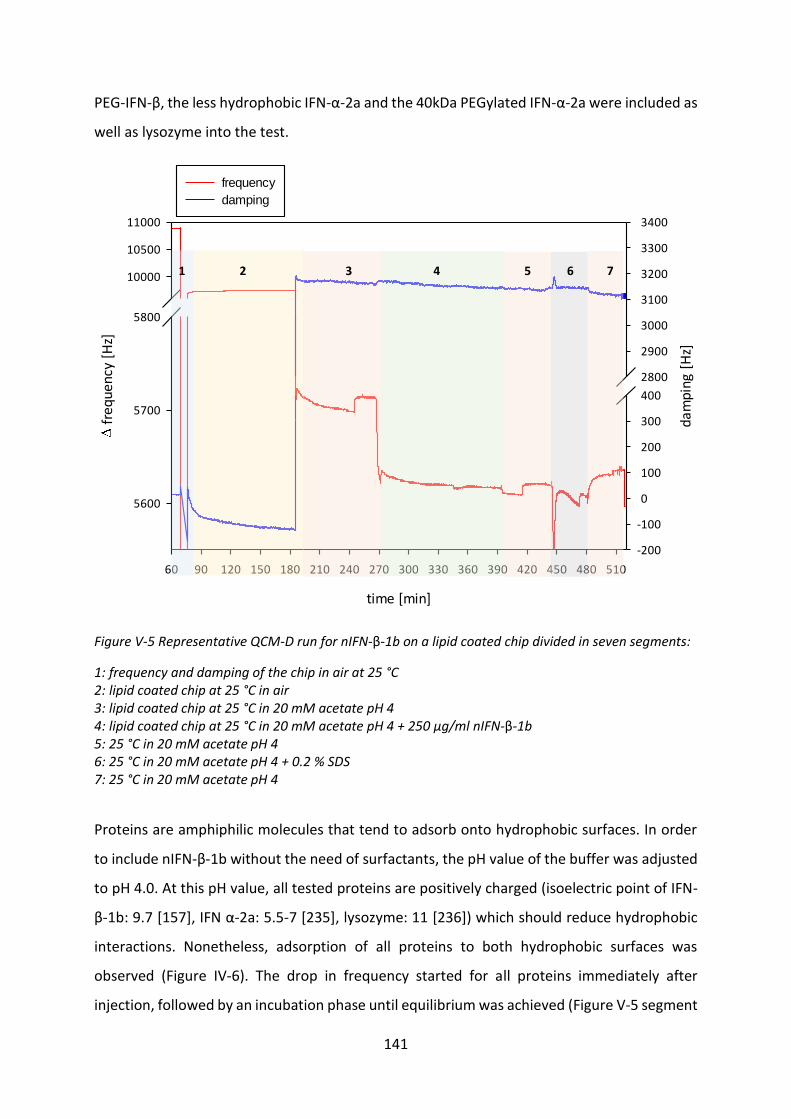
141
PEG-IFN-β, the less hydrophobic IFN-α-2a and the 40kDa PEGylated IFN-α-2a were included as
well as lysozyme into the test.
time [min]
60 90 120 150 180 210 240 270 300 330 360 390 420 450 480 510
freq
uen
cy [
Hz]
5600
5700
5800
10000
10500
11000
dam
pin
g [H
z]
-200
-100
0
100
200
300
400
2800
2900
3000
3100
3200
3300
3400
frequency
damping
Figure V-5 Representative QCM-D run for nIFN-β-1b on a lipid coated chip divided in seven segments:
1: frequency and damping of the chip in air at 25 °C 2: lipid coated chip at 25 °C in air 3: lipid coated chip at 25 °C in 20 mM acetate pH 4 4: lipid coated chip at 25 °C in 20 mM acetate pH 4 + 250 µg/ml nIFN-β-1b 5: 25 °C in 20 mM acetate pH 4 6: 25 °C in 20 mM acetate pH 4 + 0.2 % SDS 7: 25 °C in 20 mM acetate pH 4
Proteins are amphiphilic molecules that tend to adsorb onto hydrophobic surfaces. In order
to include nIFN-β-1b without the need of surfactants, the pH value of the buffer was adjusted
to pH 4.0. At this pH value, all tested proteins are positively charged (isoelectric point of IFN-
β-1b: 9.7 [157], IFN α-2a: 5.5-7 [235], lysozyme: 11 [236]) which should reduce hydrophobic
interactions. Nonetheless, adsorption of all proteins to both hydrophobic surfaces was
observed (Figure IV-6). The drop in frequency started for all proteins immediately after
injection, followed by an incubation phase until equilibrium was achieved (Figure V-5 segment
1 2 3 4 5 6 7
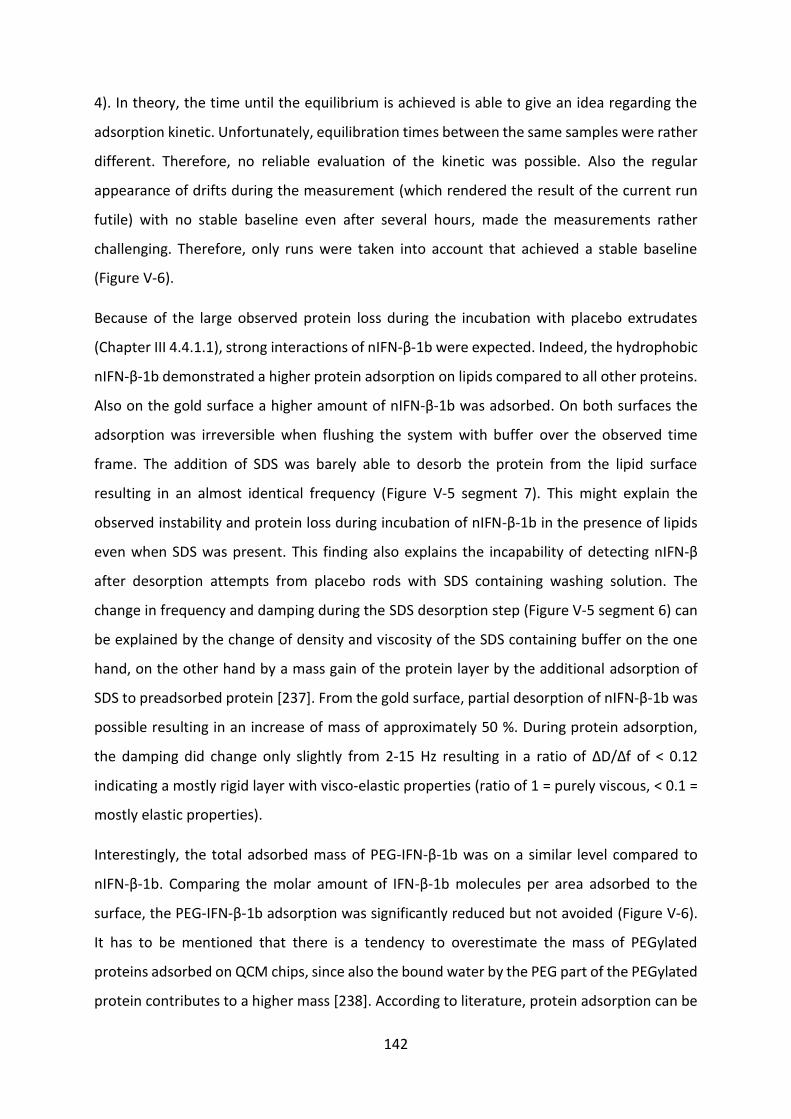
142
4). In theory, the time until the equilibrium is achieved is able to give an idea regarding the
adsorption kinetic. Unfortunately, equilibration times between the same samples were rather
different. Therefore, no reliable evaluation of the kinetic was possible. Also the regular
appearance of drifts during the measurement (which rendered the result of the current run
futile) with no stable baseline even after several hours, made the measurements rather
challenging. Therefore, only runs were taken into account that achieved a stable baseline
(Figure V-6).
Because of the large observed protein loss during the incubation with placebo extrudates
(Chapter III 4.4.1.1), strong interactions of nIFN-β-1b were expected. Indeed, the hydrophobic
nIFN-β-1b demonstrated a higher protein adsorption on lipids compared to all other proteins.
Also on the gold surface a higher amount of nIFN-β-1b was adsorbed. On both surfaces the
adsorption was irreversible when flushing the system with buffer over the observed time
frame. The addition of SDS was barely able to desorb the protein from the lipid surface
resulting in an almost identical frequency (Figure V-5 segment 7). This might explain the
observed instability and protein loss during incubation of nIFN-β-1b in the presence of lipids
even when SDS was present. This finding also explains the incapability of detecting nIFN-β
after desorption attempts from placebo rods with SDS containing washing solution. The
change in frequency and damping during the SDS desorption step (Figure V-5 segment 6) can
be explained by the change of density and viscosity of the SDS containing buffer on the one
hand, on the other hand by a mass gain of the protein layer by the additional adsorption of
SDS to preadsorbed protein [237]. From the gold surface, partial desorption of nIFN-β-1b was
possible resulting in an increase of mass of approximately 50 %. During protein adsorption,
the damping did change only slightly from 2-15 Hz resulting in a ratio of ΔD/Δf of < 0.12
indicating a mostly rigid layer with visco-elastic properties (ratio of 1 = purely viscous, < 0.1 =
mostly elastic properties).
Interestingly, the total adsorbed mass of PEG-IFN-β-1b was on a similar level compared to
nIFN-β-1b. Comparing the molar amount of IFN-β-1b molecules per area adsorbed to the
surface, the PEG-IFN-β-1b adsorption was significantly reduced but not avoided (Figure V-6).
It has to be mentioned that there is a tendency to overestimate the mass of PEGylated
proteins adsorbed on QCM chips, since also the bound water by the PEG part of the PEGylated
protein contributes to a higher mass [238]. According to literature, protein adsorption can be
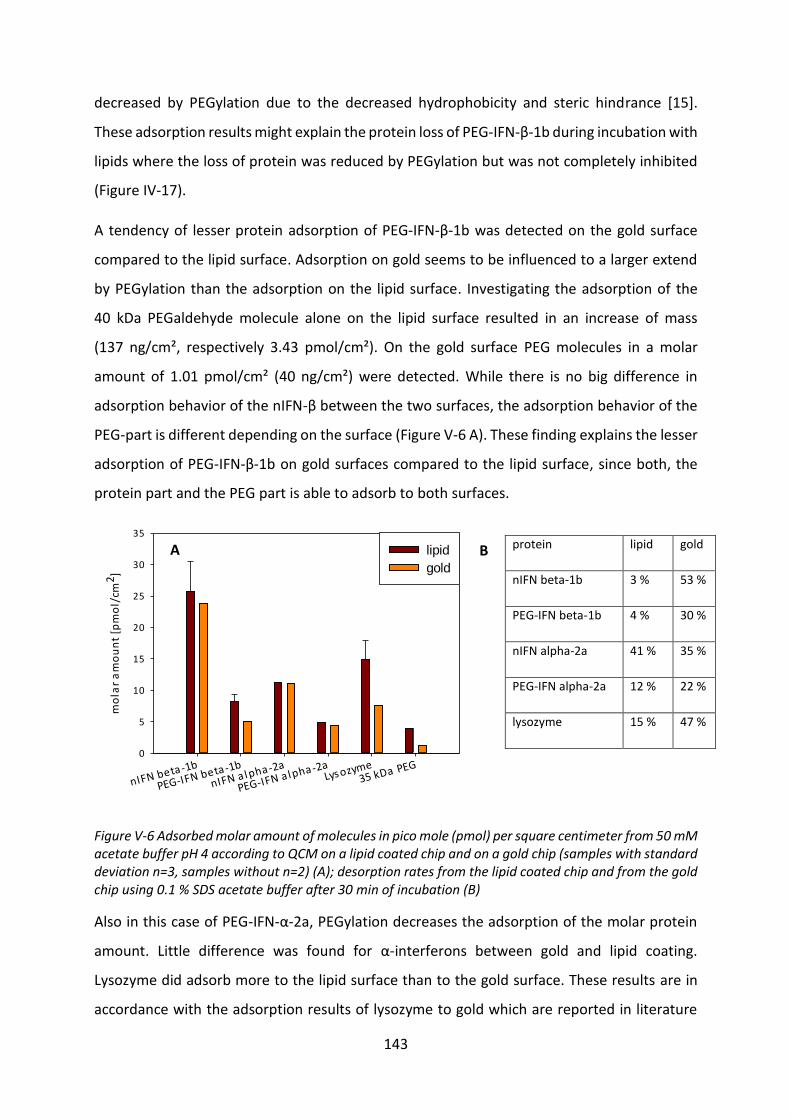
143
decreased by PEGylation due to the decreased hydrophobicity and steric hindrance [15].
These adsorption results might explain the protein loss of PEG-IFN-β-1b during incubation with
lipids where the loss of protein was reduced by PEGylation but was not completely inhibited
(Figure IV-17).
A tendency of lesser protein adsorption of PEG-IFN-β-1b was detected on the gold surface
compared to the lipid surface. Adsorption on gold seems to be influenced to a larger extend
by PEGylation than the adsorption on the lipid surface. Investigating the adsorption of the
40 kDa PEGaldehyde molecule alone on the lipid surface resulted in an increase of mass
(137 ng/cm², respectively 3.43 pmol/cm²). On the gold surface PEG molecules in a molar
amount of 1.01 pmol/cm² (40 ng/cm²) were detected. While there is no big difference in
adsorption behavior of the nIFN-β between the two surfaces, the adsorption behavior of the
PEG-part is different depending on the surface (Figure V-6 A). These finding explains the lesser
adsorption of PEG-IFN-β-1b on gold surfaces compared to the lipid surface, since both, the
protein part and the PEG part is able to adsorb to both surfaces.
nIFN beta-1b
PEG-IFN beta-1b
nIFN a lpha-2a
PEG-IFN a lpha-2aLysozyme
35 kDa PEG
mo
lar
am
ou
nt
[pm
ol/
cm2
]
0
5
10
15
20
25
30
35
lipid
gold
Figure V-6 Adsorbed molar amount of molecules in pico mole (pmol) per square centimeter from 50 mM acetate buffer pH 4 according to QCM on a lipid coated chip and on a gold chip (samples with standard deviation n=3, samples without n=2) (A); desorption rates from the lipid coated chip and from the gold chip using 0.1 % SDS acetate buffer after 30 min of incubation (B)
Also in this case of PEG-IFN-α-2a, PEGylation decreases the adsorption of the molar protein
amount. Little difference was found for α-interferons between gold and lipid coating.
Lysozyme did adsorb more to the lipid surface than to the gold surface. These results are in
accordance with the adsorption results of lysozyme to gold which are reported in literature
protein lipid gold
nIFN beta-1b 3 % 53 %
PEG-IFN beta-1b 4 % 30 %
nIFN alpha-2a 41 % 35 %
PEG-IFN alpha-2a 12 % 22 %
lysozyme 15 % 47 %
A B
144
[239]. Apart from nIFN-α-2a, all proteins were barely desorbed from the lipid surface (Figure
V-6 B). On gold surfaces, a larger degree of desorption with 0.1 % SDS was observed. In
comparison with the other proteins, both IFN-β-1b species show a stronger affinity to lipid
surfaces which can be explained by the higher hydrophobicity.
3 Interaction with phospholipids
In Chapter IV 3.4, the influence of different parameters on the viscosity of the VPGs was
demonstrated. Due to protein-lipid interactions, VPGs loaded with PEG-IFN-β-1b and nIFN-β-
1b had a higher viscosity than their placebo counterparts. Also the effect on the release rate
was investigated. Whether a molecule can be released in linear, erosion controlled manner
from VPGs depends on the physicochemical properties of the molecule and the derived
interaction between the molecules and the phospholipids. On the one hand, an increase in
viscosity, as it was observed for both IFN-β species, indicates such an interaction. On the other
hand, an unchanged viscosity does not necessarily mean that no interactions take place and a
linear release is possible. PEG-IFN-α-2a did not influence the viscosity of the gels (Chapter IV
4.2.4) but resulted also in a non-linear and incomplete release. Also in literature, a non-linear
release was observed without a change of gel viscosity [105]. Therefore, the change in
viscosity of the gels is no suitable indicator for protein-lipid interactions that influence the
release from VPGs. Thus, other analytics were tested which might give some easy obtainable
and fast accessible information whether interactions influence the release rate or not. In
addition to that, these methods should give some more knowledge of the type of interaction.
Several studies in different areas have investigated the interactions of phospholipids with
proteins in regards of membrane proteins [123, 127, 240, 241]. Also the adsorption of blood
proteins on liposomes influencing the clearance of the liposomes have been examined [242].
To investigate interactions between phospholipids and proteins, liposomes or lipid vesicles
[132, 217, 219, 220, 242], supported bilayers [243, 244] or mono molecular films [222, 245,
246] are generally used as models. Zhao et al. gives a nice overview of different models and
techniques used to analyze protein-phospholipid interactions [247].
Mono molecular films have the advantage that the arrangement of the molecules can be
controlled by changing the molecular area and the surface pressure of the monolayer by using
for example a Langmuir trough [222, 224, 246]. The investigation of monolayers with a
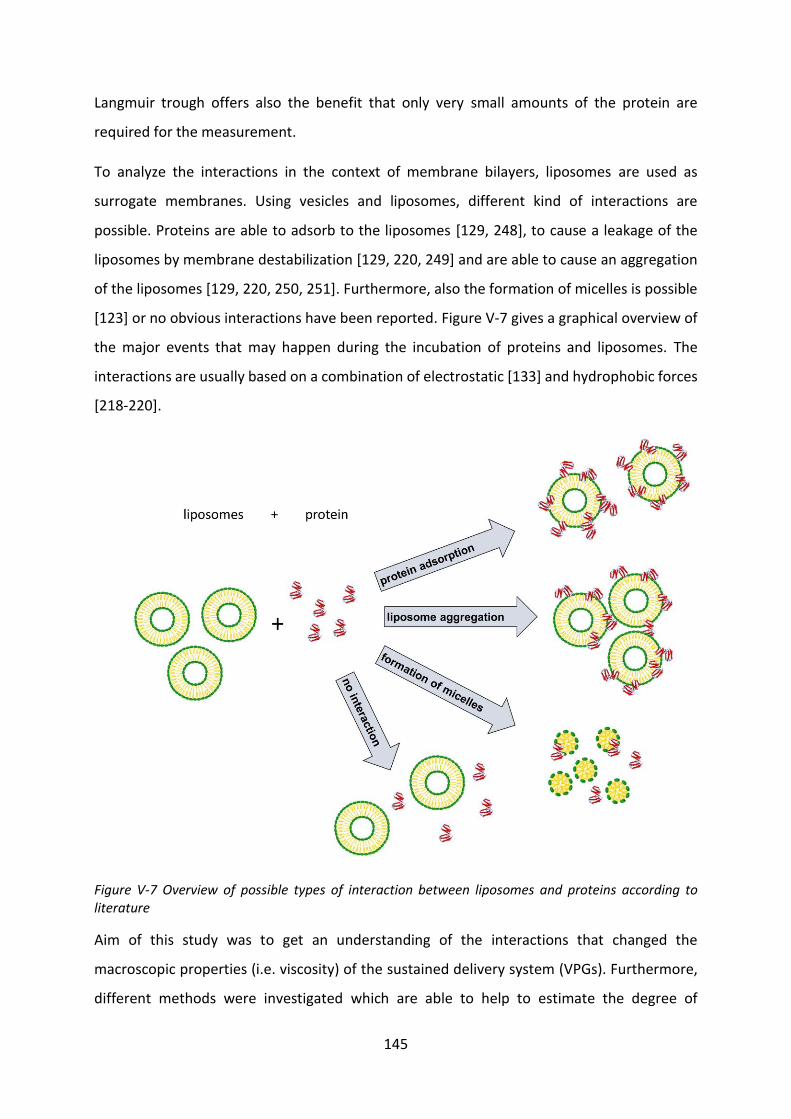
145
Langmuir trough offers also the benefit that only very small amounts of the protein are
required for the measurement.
To analyze the interactions in the context of membrane bilayers, liposomes are used as
surrogate membranes. Using vesicles and liposomes, different kind of interactions are
possible. Proteins are able to adsorb to the liposomes [129, 248], to cause a leakage of the
liposomes by membrane destabilization [129, 220, 249] and are able to cause an aggregation
of the liposomes [129, 220, 250, 251]. Furthermore, also the formation of micelles is possible
[123] or no obvious interactions have been reported. Figure V-7 gives a graphical overview of
the major events that may happen during the incubation of proteins and liposomes. The
interactions are usually based on a combination of electrostatic [133] and hydrophobic forces
[218-220].
Figure V-7 Overview of possible types of interaction between liposomes and proteins according to literature
Aim of this study was to get an understanding of the interactions that changed the
macroscopic properties (i.e. viscosity) of the sustained delivery system (VPGs). Furthermore,
different methods were investigated which are able to help to estimate the degree of
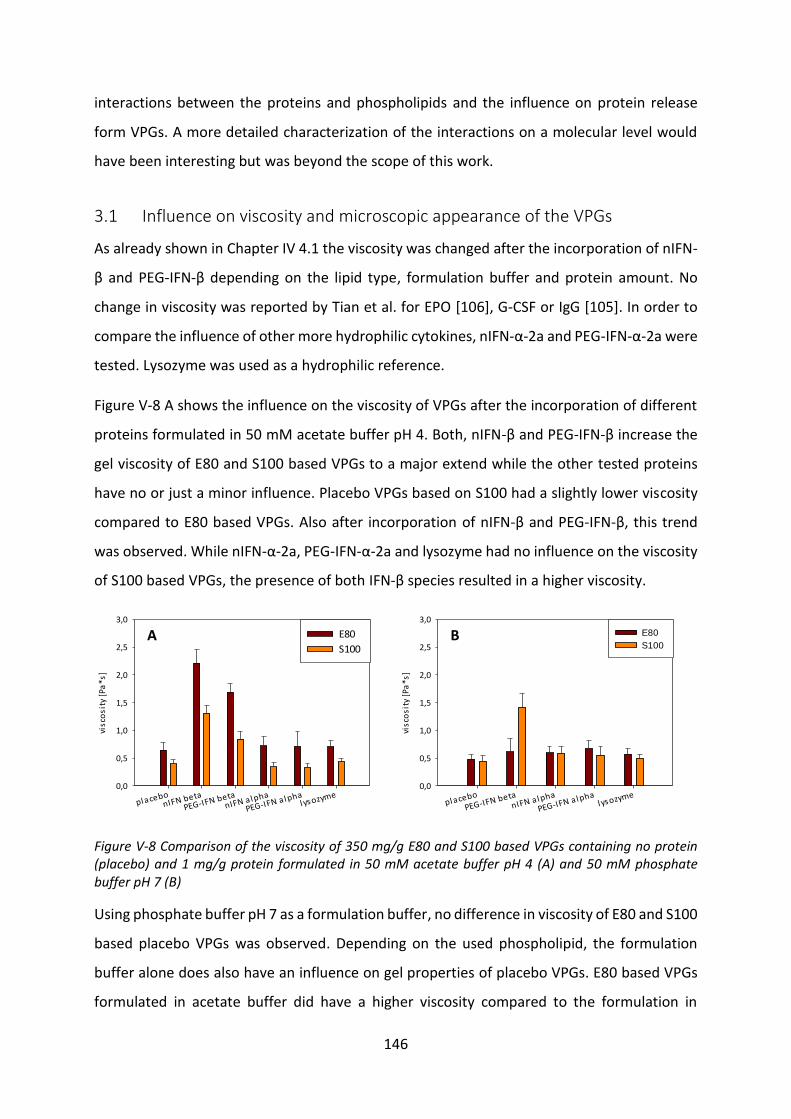
146
interactions between the proteins and phospholipids and the influence on protein release
form VPGs. A more detailed characterization of the interactions on a molecular level would
have been interesting but was beyond the scope of this work.
3.1 Influence on viscosity and microscopic appearance of the VPGs
As already shown in Chapter IV 4.1 the viscosity was changed after the incorporation of nIFN-
β and PEG-IFN-β depending on the lipid type, formulation buffer and protein amount. No
change in viscosity was reported by Tian et al. for EPO [106], G-CSF or IgG [105]. In order to
compare the influence of other more hydrophilic cytokines, nIFN-α-2a and PEG-IFN-α-2a were
tested. Lysozyme was used as a hydrophilic reference.
Figure V-8 A shows the influence on the viscosity of VPGs after the incorporation of different
proteins formulated in 50 mM acetate buffer pH 4. Both, nIFN-β and PEG-IFN-β increase the
gel viscosity of E80 and S100 based VPGs to a major extend while the other tested proteins
have no or just a minor influence. Placebo VPGs based on S100 had a slightly lower viscosity
compared to E80 based VPGs. Also after incorporation of nIFN-β and PEG-IFN-β, this trend
was observed. While nIFN-α-2a, PEG-IFN-α-2a and lysozyme had no influence on the viscosity
of S100 based VPGs, the presence of both IFN-β species resulted in a higher viscosity.
placebo
PEG-IFN betanIFN a lpha
PEG-IFN a lphalysozyme
visc
osi
ty [
Pa*s
]
0,0
0,5
1,0
1,5
2,0
2,5
3,0
E80
S100
placebonIFN beta
PEG-IFN betanIFN a lpha
PEG-IFN a lphalysozyme
visc
osi
ty [
Pa*s
]
0,0
0,5
1,0
1,5
2,0
2,5
3,0
E80
S100
Figure V-8 Comparison of the viscosity of 350 mg/g E80 and S100 based VPGs containing no protein (placebo) and 1 mg/g protein formulated in 50 mM acetate buffer pH 4 (A) and 50 mM phosphate buffer pH 7 (B)
Using phosphate buffer pH 7 as a formulation buffer, no difference in viscosity of E80 and S100
based placebo VPGs was observed. Depending on the used phospholipid, the formulation
buffer alone does also have an influence on gel properties of placebo VPGs. E80 based VPGs
formulated in acetate buffer did have a higher viscosity compared to the formulation in
A B
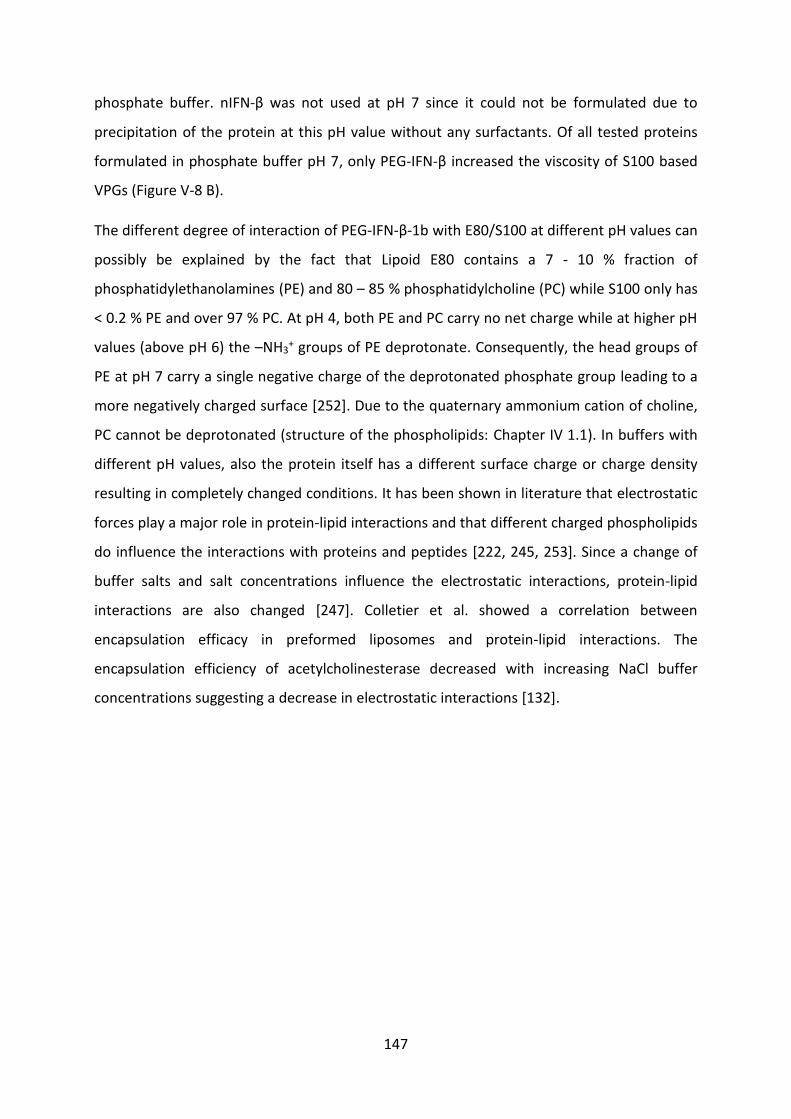
147
phosphate buffer. nIFN-β was not used at pH 7 since it could not be formulated due to
precipitation of the protein at this pH value without any surfactants. Of all tested proteins
formulated in phosphate buffer pH 7, only PEG-IFN-β increased the viscosity of S100 based
VPGs (Figure V-8 B).
The different degree of interaction of PEG-IFN-β-1b with E80/S100 at different pH values can
possibly be explained by the fact that Lipoid E80 contains a 7 - 10 % fraction of
phosphatidylethanolamines (PE) and 80 – 85 % phosphatidylcholine (PC) while S100 only has
< 0.2 % PE and over 97 % PC. At pH 4, both PE and PC carry no net charge while at higher pH
values (above pH 6) the –NH3+ groups of PE deprotonate. Consequently, the head groups of
PE at pH 7 carry a single negative charge of the deprotonated phosphate group leading to a
more negatively charged surface [252]. Due to the quaternary ammonium cation of choline,
PC cannot be deprotonated (structure of the phospholipids: Chapter IV 1.1). In buffers with
different pH values, also the protein itself has a different surface charge or charge density
resulting in completely changed conditions. It has been shown in literature that electrostatic
forces play a major role in protein-lipid interactions and that different charged phospholipids
do influence the interactions with proteins and peptides [222, 245, 253]. Since a change of
buffer salts and salt concentrations influence the electrostatic interactions, protein-lipid
interactions are also changed [247]. Colletier et al. showed a correlation between
encapsulation efficacy in preformed liposomes and protein-lipid interactions. The
encapsulation efficiency of acetylcholinesterase decreased with increasing NaCl buffer
concentrations suggesting a decrease in electrostatic interactions [132].
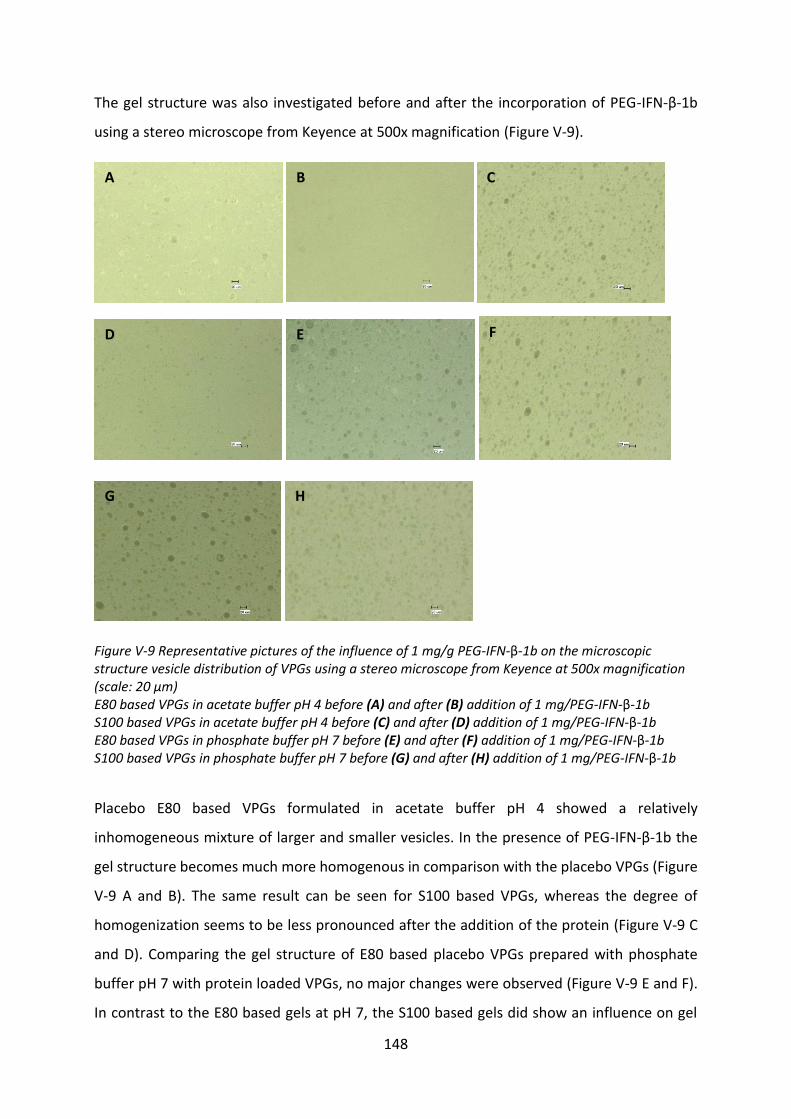
148
The gel structure was also investigated before and after the incorporation of PEG-IFN-β-1b
using a stereo microscope from Keyence at 500x magnification (Figure V-9).
Figure V-9 Representative pictures of the influence of 1 mg/g PEG-IFN-β-1b on the microscopic structure vesicle distribution of VPGs using a stereo microscope from Keyence at 500x magnification (scale: 20 µm) E80 based VPGs in acetate buffer pH 4 before (A) and after (B) addition of 1 mg/PEG-IFN-β-1b S100 based VPGs in acetate buffer pH 4 before (C) and after (D) addition of 1 mg/PEG-IFN-β-1b E80 based VPGs in phosphate buffer pH 7 before (E) and after (F) addition of 1 mg/PEG-IFN-β-1b S100 based VPGs in phosphate buffer pH 7 before (G) and after (H) addition of 1 mg/PEG-IFN-β-1b
Placebo E80 based VPGs formulated in acetate buffer pH 4 showed a relatively
inhomogeneous mixture of larger and smaller vesicles. In the presence of PEG-IFN-β-1b the
gel structure becomes much more homogenous in comparison with the placebo VPGs (Figure
V-9 A and B). The same result can be seen for S100 based VPGs, whereas the degree of
homogenization seems to be less pronounced after the addition of the protein (Figure V-9 C
and D). Comparing the gel structure of E80 based placebo VPGs prepared with phosphate
buffer pH 7 with protein loaded VPGs, no major changes were observed (Figure V-9 E and F).
In contrast to the E80 based gels at pH 7, the S100 based gels did show an influence on gel
A B C
D E F
G H
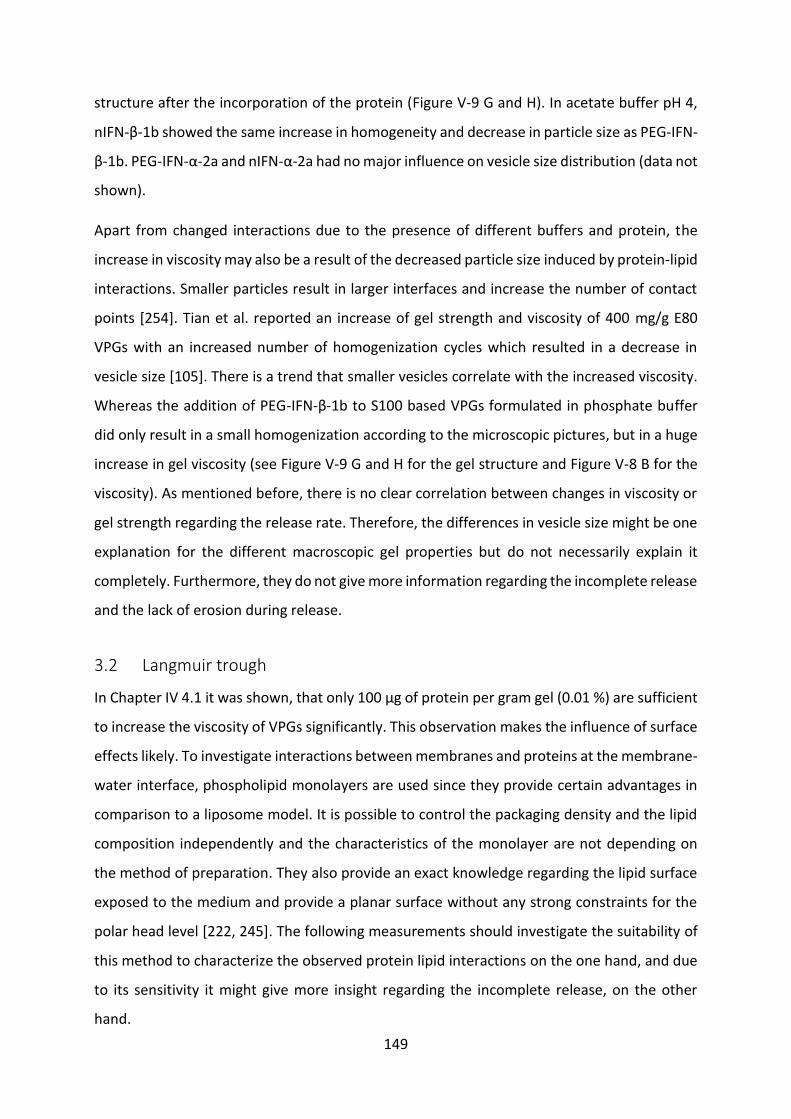
149
structure after the incorporation of the protein (Figure V-9 G and H). In acetate buffer pH 4,
nIFN-β-1b showed the same increase in homogeneity and decrease in particle size as PEG-IFN-
β-1b. PEG-IFN-α-2a and nIFN-α-2a had no major influence on vesicle size distribution (data not
shown).
Apart from changed interactions due to the presence of different buffers and protein, the
increase in viscosity may also be a result of the decreased particle size induced by protein-lipid
interactions. Smaller particles result in larger interfaces and increase the number of contact
points [254]. Tian et al. reported an increase of gel strength and viscosity of 400 mg/g E80
VPGs with an increased number of homogenization cycles which resulted in a decrease in
vesicle size [105]. There is a trend that smaller vesicles correlate with the increased viscosity.
Whereas the addition of PEG-IFN-β-1b to S100 based VPGs formulated in phosphate buffer
did only result in a small homogenization according to the microscopic pictures, but in a huge
increase in gel viscosity (see Figure V-9 G and H for the gel structure and Figure V-8 B for the
viscosity). As mentioned before, there is no clear correlation between changes in viscosity or
gel strength regarding the release rate. Therefore, the differences in vesicle size might be one
explanation for the different macroscopic gel properties but do not necessarily explain it
completely. Furthermore, they do not give more information regarding the incomplete release
and the lack of erosion during release.
3.2 Langmuir trough
In Chapter IV 4.1 it was shown, that only 100 µg of protein per gram gel (0.01 %) are sufficient
to increase the viscosity of VPGs significantly. This observation makes the influence of surface
effects likely. To investigate interactions between membranes and proteins at the membrane-
water interface, phospholipid monolayers are used since they provide certain advantages in
comparison to a liposome model. It is possible to control the packaging density and the lipid
composition independently and the characteristics of the monolayer are not depending on
the method of preparation. They also provide an exact knowledge regarding the lipid surface
exposed to the medium and provide a planar surface without any strong constraints for the
polar head level [222, 245]. The following measurements should investigate the suitability of
this method to characterize the observed protein lipid interactions on the one hand, and due
to its sensitivity it might give more insight regarding the incomplete release, on the other
hand.
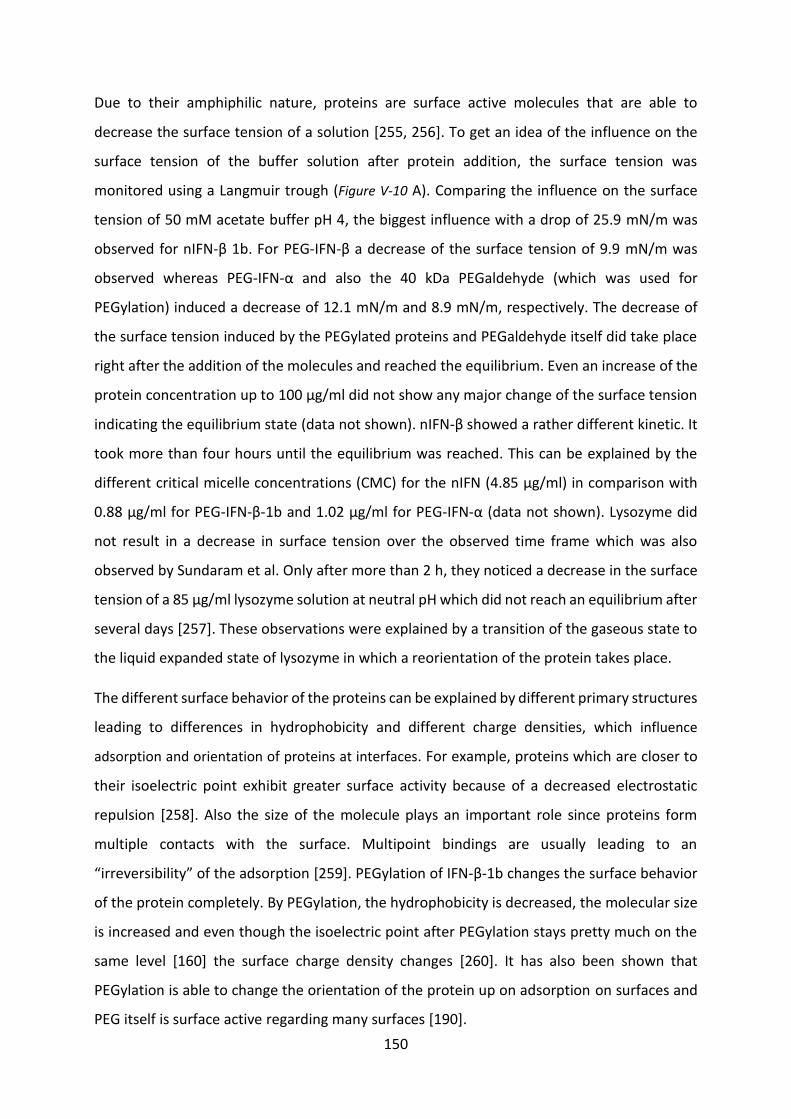
150
Due to their amphiphilic nature, proteins are surface active molecules that are able to
decrease the surface tension of a solution [255, 256]. To get an idea of the influence on the
surface tension of the buffer solution after protein addition, the surface tension was
monitored using a Langmuir trough (Figure V-10 A). Comparing the influence on the surface
tension of 50 mM acetate buffer pH 4, the biggest influence with a drop of 25.9 mN/m was
observed for nIFN-β 1b. For PEG-IFN-β a decrease of the surface tension of 9.9 mN/m was
observed whereas PEG-IFN-α and also the 40 kDa PEGaldehyde (which was used for
PEGylation) induced a decrease of 12.1 mN/m and 8.9 mN/m, respectively. The decrease of
the surface tension induced by the PEGylated proteins and PEGaldehyde itself did take place
right after the addition of the molecules and reached the equilibrium. Even an increase of the
protein concentration up to 100 µg/ml did not show any major change of the surface tension
indicating the equilibrium state (data not shown). nIFN-β showed a rather different kinetic. It
took more than four hours until the equilibrium was reached. This can be explained by the
different critical micelle concentrations (CMC) for the nIFN (4.85 µg/ml) in comparison with
0.88 µg/ml for PEG-IFN-β-1b and 1.02 µg/ml for PEG-IFN-α (data not shown). Lysozyme did
not result in a decrease in surface tension over the observed time frame which was also
observed by Sundaram et al. Only after more than 2 h, they noticed a decrease in the surface
tension of a 85 µg/ml lysozyme solution at neutral pH which did not reach an equilibrium after
several days [257]. These observations were explained by a transition of the gaseous state to
the liquid expanded state of lysozyme in which a reorientation of the protein takes place.
The different surface behavior of the proteins can be explained by different primary structures
leading to differences in hydrophobicity and different charge densities, which influence
adsorption and orientation of proteins at interfaces. For example, proteins which are closer to
their isoelectric point exhibit greater surface activity because of a decreased electrostatic
repulsion [258]. Also the size of the molecule plays an important role since proteins form
multiple contacts with the surface. Multipoint bindings are usually leading to an
“irreversibility” of the adsorption [259]. PEGylation of IFN-β-1b changes the surface behavior
of the protein completely. By PEGylation, the hydrophobicity is decreased, the molecular size
is increased and even though the isoelectric point after PEGylation stays pretty much on the
same level [160] the surface charge density changes [260]. It has also been shown that
PEGylation is able to change the orientation of the protein up on adsorption on surfaces and
PEG itself is surface active regarding many surfaces [190].
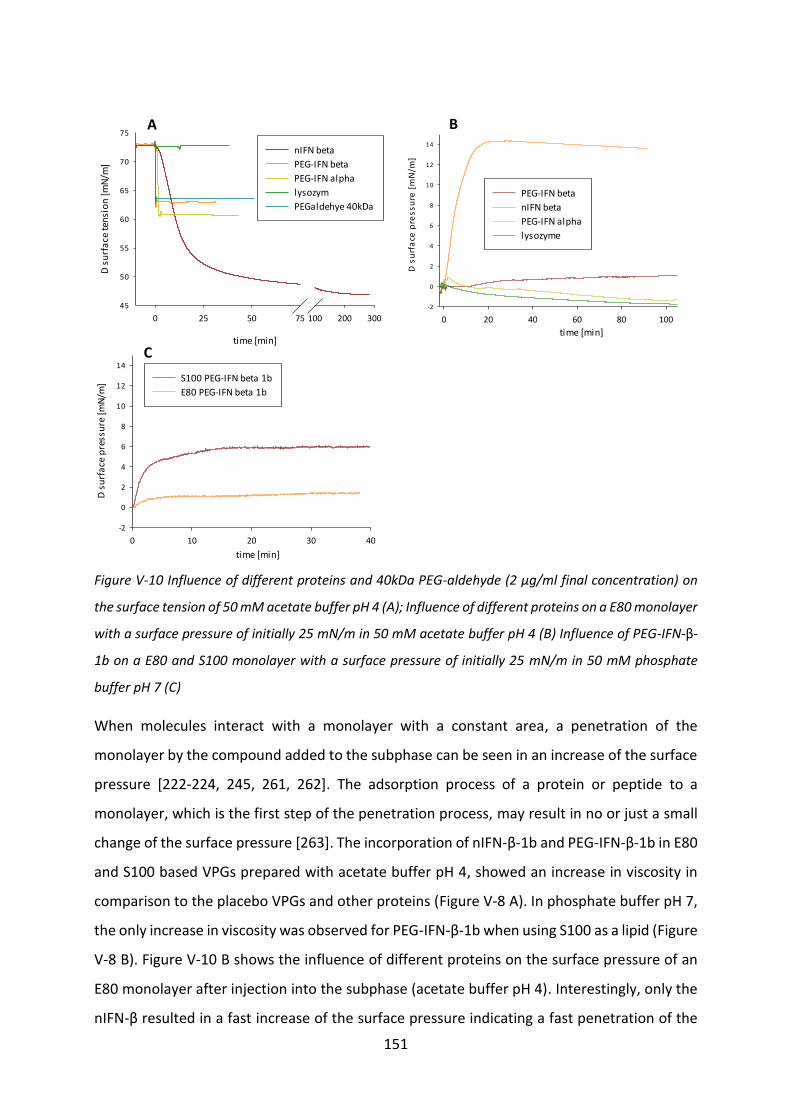
151
time [min]
0 10 20 30 40
D s
urf
ace
pre
ssu
re [
mN
/m]
-2
0
2
4
6
8
10
12
14
S100 PEG-IFN beta 1b
E80 PEG-IFN beta 1b
time [min]
0 20 40 60 80 100
D s
urf
ace
pre
ss
ure
[m
N/m
]
-2
0
2
4
6
8
10
12
14
PEG-IFN beta
nIFN beta
PEG-IFN alpha
lysozyme
time [min]
0 25 50 75 100 200 300
D s
urf
ace
ten
sio
n [
mN
/m]
45
50
55
60
65
70
75
nIFN beta
PEG-IFN beta
PEG-IFN alpha
lysozym
PEGaldehye 40kDa
Figure V-10 Influence of different proteins and 40kDa PEG-aldehyde (2 µg/ml final concentration) on
the surface tension of 50 mM acetate buffer pH 4 (A); Influence of different proteins on a E80 monolayer
with a surface pressure of initially 25 mN/m in 50 mM acetate buffer pH 4 (B) Influence of PEG-IFN-β-
1b on a E80 and S100 monolayer with a surface pressure of initially 25 mN/m in 50 mM phosphate
buffer pH 7 (C)
When molecules interact with a monolayer with a constant area, a penetration of the
monolayer by the compound added to the subphase can be seen in an increase of the surface
pressure [222-224, 245, 261, 262]. The adsorption process of a protein or peptide to a
monolayer, which is the first step of the penetration process, may result in no or just a small
change of the surface pressure [263]. The incorporation of nIFN-β-1b and PEG-IFN-β-1b in E80
and S100 based VPGs prepared with acetate buffer pH 4, showed an increase in viscosity in
comparison to the placebo VPGs and other proteins (Figure V-8 A). In phosphate buffer pH 7,
the only increase in viscosity was observed for PEG-IFN-β-1b when using S100 as a lipid (Figure
V-8 B). Figure V-10 B shows the influence of different proteins on the surface pressure of an
E80 monolayer after injection into the subphase (acetate buffer pH 4). Interestingly, only the
nIFN-β resulted in a fast increase of the surface pressure indicating a fast penetration of the
A B
C
152
protein through the monolayer. Only a minor increase was observed for PEG-IFN-β over the
monitored time frame. PEGylation decreases the penetration of the monolayer in comparison
to the native IFN-β-1b. This can be explained by the changed physicochemical properties of
the protein by PEGylation. Besides electrostatic interactions [224], hydrophobic interactions
play an important role for the interaction between proteins and phospholipids [263, 264].
Both are influenced by PEGylation [15]. PEGylation of phospholipids generally reduces the
interaction of the lipid layers [265, 266] and also liposomes [267, 268] with proteins. Still, the
effect of PEGylation on the protein-lipid interactions depends on the charge of the lipids and
the type of protein and cannot be generalized [269]. When no interactions are visible in the
monolayer studies, it does not necessarily mean that no interactions like adsorption take
place. This can be explained by the fact that the pressure of the monolayer was above the
exclusion pressure of e.g. PEG-IFN-β-1b and PEG-IFN-α-2a and the penetration force of the
proteins was not high enough to see an effect [222].
According to Sundaram et al. lysozyme does penetrate a dipalmitoylphosphatidylcholine
monolayer in a buffered saline solution at pH 7.4 and 0.15 M NaCl. This penetration resulted
in a constant increase of the surface pressure of 3 mN/m over more than 18 h [257]. An
increase of the surface pressure by lysozyme during the analyzed timeframe was not observed
in the studies of this thesis. In contrast, even a small decrease of surface pressure was
monitored which might indicate a destabilization of the monolayer. PEG-IFN-α-2a did show a
similar result as lysozyme.
To get more insight regarding the increased viscosity of S100 based VPGs in phosphate buffer
pH 7 and the difference to E80 based VPGs after the incorporation of PEG-IFN-β-1b, S100 and
E80 monolayers were prepared in phosphate buffer and the surface pressure was measured
(Figure V-10 C). After the injection of PEG-IFN-β-1b into the subphase, the surface pressure of
a S100 monolayer increases to a larger extend in comparison with an E80 monolayer. This
indicates a lesser pronounced penetration of E80 monolayers by the protein. These findings
correlate with the observations made regarding the viscosity. As already discussed in Chapter
V 3.1, electrostatic and hydrophobic interactions are decisive factors for the interactions
between phospholipids and proteins. Because the charge density of the protein and the lipid
are changed at different pH values, also the interaction between these two components is
altered. Before penetration, the proteins are adsorbed to the monolayer. Buijs et al. showed
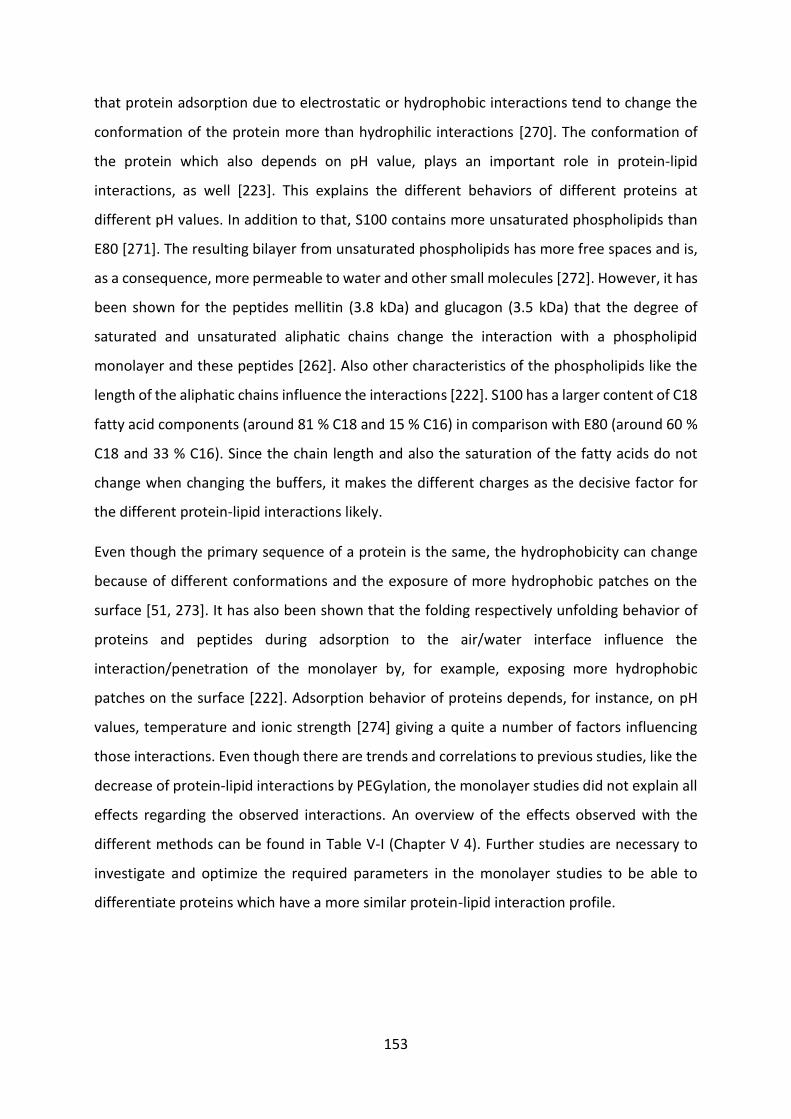
153
that protein adsorption due to electrostatic or hydrophobic interactions tend to change the
conformation of the protein more than hydrophilic interactions [270]. The conformation of
the protein which also depends on pH value, plays an important role in protein-lipid
interactions, as well [223]. This explains the different behaviors of different proteins at
different pH values. In addition to that, S100 contains more unsaturated phospholipids than
E80 [271]. The resulting bilayer from unsaturated phospholipids has more free spaces and is,
as a consequence, more permeable to water and other small molecules [272]. However, it has
been shown for the peptides mellitin (3.8 kDa) and glucagon (3.5 kDa) that the degree of
saturated and unsaturated aliphatic chains change the interaction with a phospholipid
monolayer and these peptides [262]. Also other characteristics of the phospholipids like the
length of the aliphatic chains influence the interactions [222]. S100 has a larger content of C18
fatty acid components (around 81 % C18 and 15 % C16) in comparison with E80 (around 60 %
C18 and 33 % C16). Since the chain length and also the saturation of the fatty acids do not
change when changing the buffers, it makes the different charges as the decisive factor for
the different protein-lipid interactions likely.
Even though the primary sequence of a protein is the same, the hydrophobicity can change
because of different conformations and the exposure of more hydrophobic patches on the
surface [51, 273]. It has also been shown that the folding respectively unfolding behavior of
proteins and peptides during adsorption to the air/water interface influence the
interaction/penetration of the monolayer by, for example, exposing more hydrophobic
patches on the surface [222]. Adsorption behavior of proteins depends, for instance, on pH
values, temperature and ionic strength [274] giving a quite a number of factors influencing
those interactions. Even though there are trends and correlations to previous studies, like the
decrease of protein-lipid interactions by PEGylation, the monolayer studies did not explain all
effects regarding the observed interactions. An overview of the effects observed with the
different methods can be found in Table V-I (Chapter V 4). Further studies are necessary to
investigate and optimize the required parameters in the monolayer studies to be able to
differentiate proteins which have a more similar protein-lipid interaction profile.
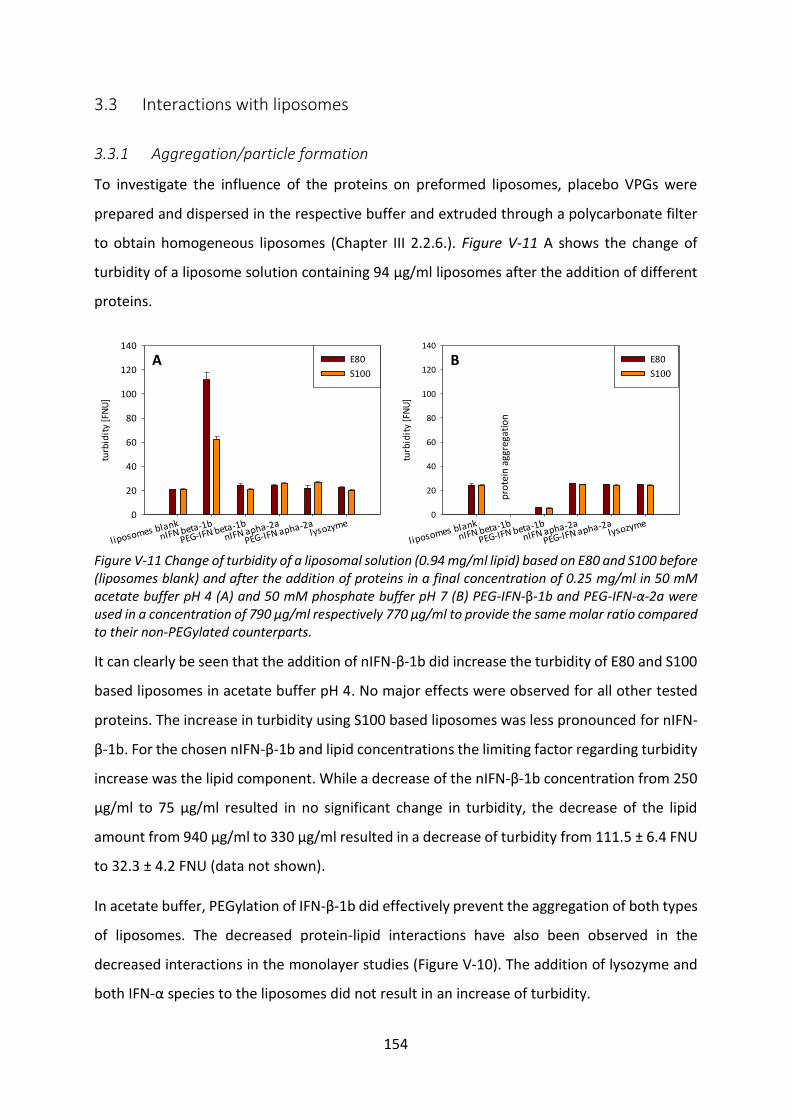
154
3.3 Interactions with liposomes
3.3.1 Aggregation/particle formation
To investigate the influence of the proteins on preformed liposomes, placebo VPGs were
prepared and dispersed in the respective buffer and extruded through a polycarbonate filter
to obtain homogeneous liposomes (Chapter III 2.2.6.). Figure V-11 A shows the change of
turbidity of a liposome solution containing 94 µg/ml liposomes after the addition of different
proteins.
l iposomes blanknIFN beta-1b
PEG-IFN beta-1b
nIFN apha-2a
PEG-IFN apha-2alysozyme
turb
idit
y [F
NU
]
0
20
40
60
80
100
120
140
E80
S100
liposomes blanknIFN beta-1b
PEG-IFN beta-1b
nIFN apha-2a
PEG-IFN apha-2alysozyme
turb
idit
y [F
NU
]
0
20
40
60
80
100
120
140
E80
S100
Figure V-11 Change of turbidity of a liposomal solution (0.94 mg/ml lipid) based on E80 and S100 before (liposomes blank) and after the addition of proteins in a final concentration of 0.25 mg/ml in 50 mM acetate buffer pH 4 (A) and 50 mM phosphate buffer pH 7 (B) PEG-IFN-β-1b and PEG-IFN-α-2a were used in a concentration of 790 µg/ml respectively 770 µg/ml to provide the same molar ratio compared to their non-PEGylated counterparts.
It can clearly be seen that the addition of nIFN-β-1b did increase the turbidity of E80 and S100
based liposomes in acetate buffer pH 4. No major effects were observed for all other tested
proteins. The increase in turbidity using S100 based liposomes was less pronounced for nIFN-
β-1b. For the chosen nIFN-β-1b and lipid concentrations the limiting factor regarding turbidity
increase was the lipid component. While a decrease of the nIFN-β-1b concentration from 250
µg/ml to 75 µg/ml resulted in no significant change in turbidity, the decrease of the lipid
amount from 940 µg/ml to 330 µg/ml resulted in a decrease of turbidity from 111.5 ± 6.4 FNU
to 32.3 ± 4.2 FNU (data not shown).
In acetate buffer, PEGylation of IFN-β-1b did effectively prevent the aggregation of both types
of liposomes. The decreased protein-lipid interactions have also been observed in the
decreased interactions in the monolayer studies (Figure V-10). The addition of lysozyme and
both IFN-α species to the liposomes did not result in an increase of turbidity.
A B
pro
tein
agg
rega
tio
n
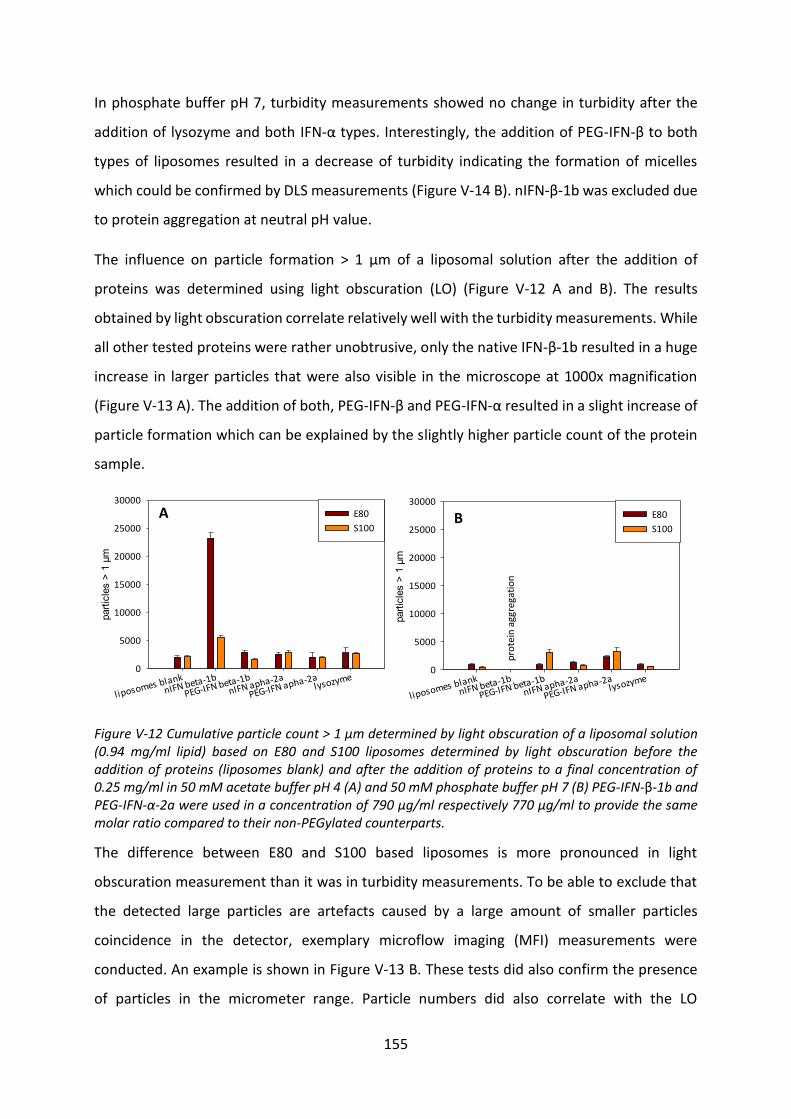
155
In phosphate buffer pH 7, turbidity measurements showed no change in turbidity after the
addition of lysozyme and both IFN-α types. Interestingly, the addition of PEG-IFN-β to both
types of liposomes resulted in a decrease of turbidity indicating the formation of micelles
which could be confirmed by DLS measurements (Figure V-14 B). nIFN-β-1b was excluded due
to protein aggregation at neutral pH value.
The influence on particle formation > 1 µm of a liposomal solution after the addition of
proteins was determined using light obscuration (LO) (Figure V-12 A and B). The results
obtained by light obscuration correlate relatively well with the turbidity measurements. While
all other tested proteins were rather unobtrusive, only the native IFN-β-1b resulted in a huge
increase in larger particles that were also visible in the microscope at 1000x magnification
(Figure V-13 A). The addition of both, PEG-IFN-β and PEG-IFN-α resulted in a slight increase of
particle formation which can be explained by the slightly higher particle count of the protein
sample.
l iposomes blanknIFN beta-1b
PEG-IFN beta-1b
nIFN apha-2a
PEG-IFN apha-2alysozyme
part
icle
s >
1 µ
m
0
5000
10000
15000
20000
25000
30000
E80
S100
liposomes blanknIFN beta-1b
PEG-IFN beta-1b
nIFN apha-2a
PEG-IFN apha-2alysozyme
part
icle
s >
1 µ
m
0
5000
10000
15000
20000
25000
30000
E80
S100
Figure V-12 Cumulative particle count > 1 µm determined by light obscuration of a liposomal solution (0.94 mg/ml lipid) based on E80 and S100 liposomes determined by light obscuration before the addition of proteins (liposomes blank) and after the addition of proteins to a final concentration of 0.25 mg/ml in 50 mM acetate buffer pH 4 (A) and 50 mM phosphate buffer pH 7 (B) PEG-IFN-β-1b and PEG-IFN-α-2a were used in a concentration of 790 µg/ml respectively 770 µg/ml to provide the same molar ratio compared to their non-PEGylated counterparts.
The difference between E80 and S100 based liposomes is more pronounced in light
obscuration measurement than it was in turbidity measurements. To be able to exclude that
the detected large particles are artefacts caused by a large amount of smaller particles
coincidence in the detector, exemplary microflow imaging (MFI) measurements were
conducted. An example is shown in Figure V-13 B. These tests did also confirm the presence
of particles in the micrometer range. Particle numbers did also correlate with the LO
A B p
rote
in a
ggre
gati
on
156
measurements even though a trend to slightly higher numbers were observed in these
exemplary MFI measurements (data not shown).
Figure V-13 Representative microscopic picture of liposomal aggregates in a liposomal solution containing 2.5 mg lipids and 250 µg/ml nIFN-β-1b using a microscope from Keyence at 1000x magnification (A) and exemplary picture taken from the microflow imaging measurements using a micro-flow imaging system from Brightwell Inc. (Ottawa, Canada) (B)
In literature, interactions between smaller PEG molecules (molecular weight of 8000-
10000 Da) and phospholipids are described. They are able to cause aggregation and fusion of
the vesicles due to the existence of an attractive osmotic force due to polymer depletion at
the vesicle surface [275]. This effect was not seen in the studies of this thesis because of the
use of a 40 kDa PEG molecule. Higher molecular weight PEG molecules are able to adsorb to
the surface resulting in a steric barrier [275]. Only nIFN-β-1b showed an increase in turbidity,
viscosity and aggregation of liposomes. While PEG-IFN-β-1b did show an influence on gel
viscosity and an incomplete release from VPGs, no protein induced liposome aggregation was
observed. Therefore, liposome aggregation is not a suitable surrogate marker for lipid-protein
interactions, which influence the release rate and gel viscosity.
To investigate particle formation < 1 µm, dynamic light scattering was used. Figure V-14 A to
E shows the results of the DLS measurements of E80 based lipids in the presence of proteins
at different pH values. Measurements of S100 based liposomes in both buffers and with all
investigated proteins showed absolutely comparable results and trends as E80 based
liposomes. Therefore, only the E80 results are presented.
A B
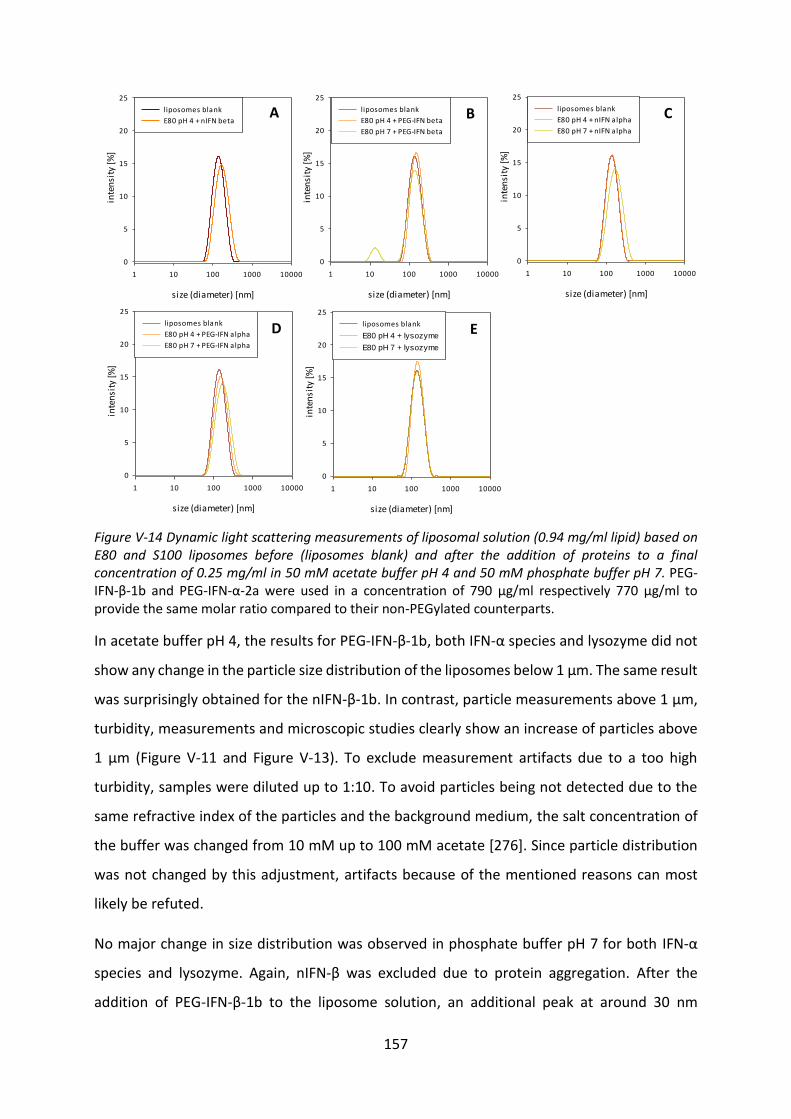
157
size (diameter) [nm]
1 10 100 1000 10000
inte
nsi
ty [
%]
0
5
10
15
20
25
liposomes blank
E80 pH 4 + nIFN beta
size (diameter) [nm]
1 10 100 1000 10000
inte
nsi
ty [
%]
0
5
10
15
20
25
liposomes blank
E80 pH 4 + PEG-IFN beta
E80 pH 7 + PEG-IFN beta
size (diameter) [nm]
1 10 100 1000 10000
inte
nsi
ty [
%]
0
5
10
15
20
25
liposomes blank
E80 pH 4 + nIFN alpha
E80 pH 7 + nIFN alpha
size (diameter) [nm]
1 10 100 1000 10000
inte
nsi
ty [
%]
0
5
10
15
20
25
liposomes blank
E80 pH 4 + PEG-IFN alpha
E80 pH 7 + PEG-IFN alpha
size (diameter) [nm]
1 10 100 1000 10000
inte
nsi
ty [
%]
0
5
10
15
20
25
liposomes blank
E80 pH 4 + lysozyme
E80 pH 7 + lysozyme
Figure V-14 Dynamic light scattering measurements of liposomal solution (0.94 mg/ml lipid) based on E80 and S100 liposomes before (liposomes blank) and after the addition of proteins to a final concentration of 0.25 mg/ml in 50 mM acetate buffer pH 4 and 50 mM phosphate buffer pH 7. PEG-IFN-β-1b and PEG-IFN-α-2a were used in a concentration of 790 µg/ml respectively 770 µg/ml to provide the same molar ratio compared to their non-PEGylated counterparts.
In acetate buffer pH 4, the results for PEG-IFN-β-1b, both IFN-α species and lysozyme did not
show any change in the particle size distribution of the liposomes below 1 µm. The same result
was surprisingly obtained for the nIFN-β-1b. In contrast, particle measurements above 1 µm,
turbidity, measurements and microscopic studies clearly show an increase of particles above
1 µm (Figure V-11 and Figure V-13). To exclude measurement artifacts due to a too high
turbidity, samples were diluted up to 1:10. To avoid particles being not detected due to the
same refractive index of the particles and the background medium, the salt concentration of
the buffer was changed from 10 mM up to 100 mM acetate [276]. Since particle distribution
was not changed by this adjustment, artifacts because of the mentioned reasons can most
likely be refuted.
No major change in size distribution was observed in phosphate buffer pH 7 for both IFN-α
species and lysozyme. Again, nIFN-β was excluded due to protein aggregation. After the
addition of PEG-IFN-β-1b to the liposome solution, an additional peak at around 30 nm
A B C
D E
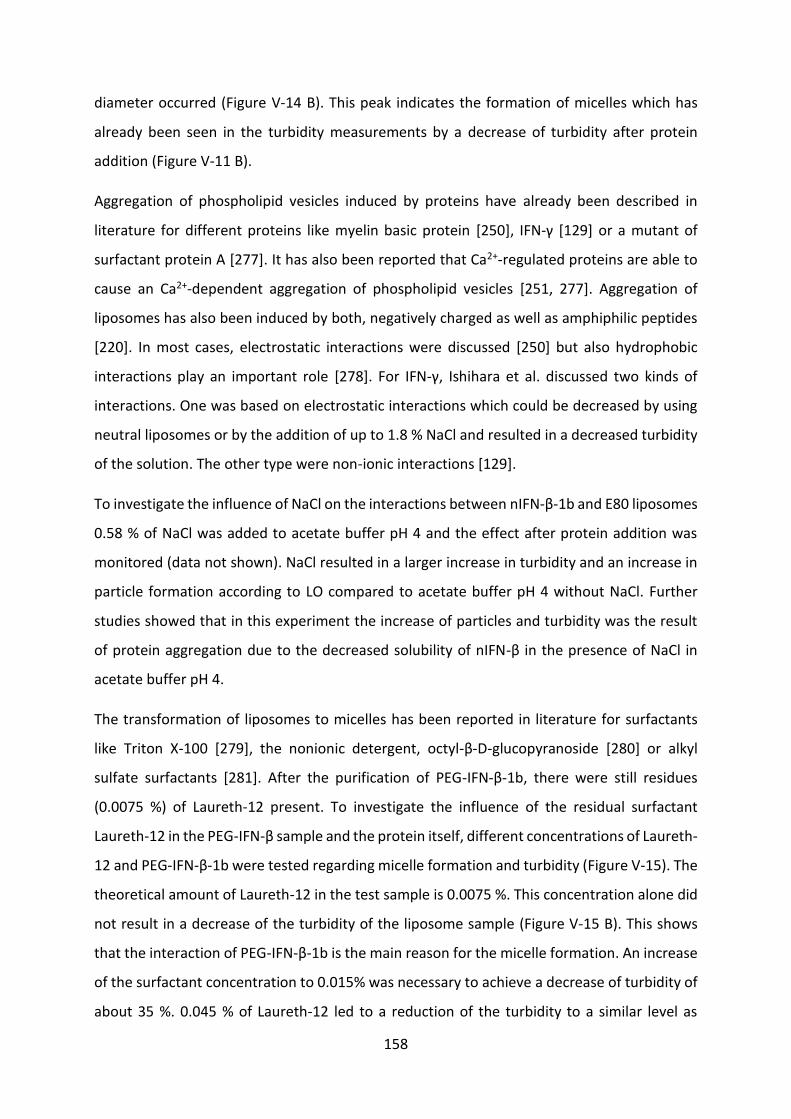
158
diameter occurred (Figure V-14 B). This peak indicates the formation of micelles which has
already been seen in the turbidity measurements by a decrease of turbidity after protein
addition (Figure V-11 B).
Aggregation of phospholipid vesicles induced by proteins have already been described in
literature for different proteins like myelin basic protein [250], IFN-γ [129] or a mutant of
surfactant protein A [277]. It has also been reported that Ca2+-regulated proteins are able to
cause an Ca2+-dependent aggregation of phospholipid vesicles [251, 277]. Aggregation of
liposomes has also been induced by both, negatively charged as well as amphiphilic peptides
[220]. In most cases, electrostatic interactions were discussed [250] but also hydrophobic
interactions play an important role [278]. For IFN-γ, Ishihara et al. discussed two kinds of
interactions. One was based on electrostatic interactions which could be decreased by using
neutral liposomes or by the addition of up to 1.8 % NaCl and resulted in a decreased turbidity
of the solution. The other type were non-ionic interactions [129].
To investigate the influence of NaCl on the interactions between nIFN-β-1b and E80 liposomes
0.58 % of NaCl was added to acetate buffer pH 4 and the effect after protein addition was
monitored (data not shown). NaCl resulted in a larger increase in turbidity and an increase in
particle formation according to LO compared to acetate buffer pH 4 without NaCl. Further
studies showed that in this experiment the increase of particles and turbidity was the result
of protein aggregation due to the decreased solubility of nIFN-β in the presence of NaCl in
acetate buffer pH 4.
The transformation of liposomes to micelles has been reported in literature for surfactants
like Triton X-100 [279], the nonionic detergent, octyl-β-D-glucopyranoside [280] or alkyl
sulfate surfactants [281]. After the purification of PEG-IFN-β-1b, there were still residues
(0.0075 %) of Laureth-12 present. To investigate the influence of the residual surfactant
Laureth-12 in the PEG-IFN-β sample and the protein itself, different concentrations of Laureth-
12 and PEG-IFN-β-1b were tested regarding micelle formation and turbidity (Figure V-15). The
theoretical amount of Laureth-12 in the test sample is 0.0075 %. This concentration alone did
not result in a decrease of the turbidity of the liposome sample (Figure V-15 B). This shows
that the interaction of PEG-IFN-β-1b is the main reason for the micelle formation. An increase
of the surfactant concentration to 0.015% was necessary to achieve a decrease of turbidity of
about 35 %. 0.045 % of Laureth-12 led to a reduction of the turbidity to a similar level as
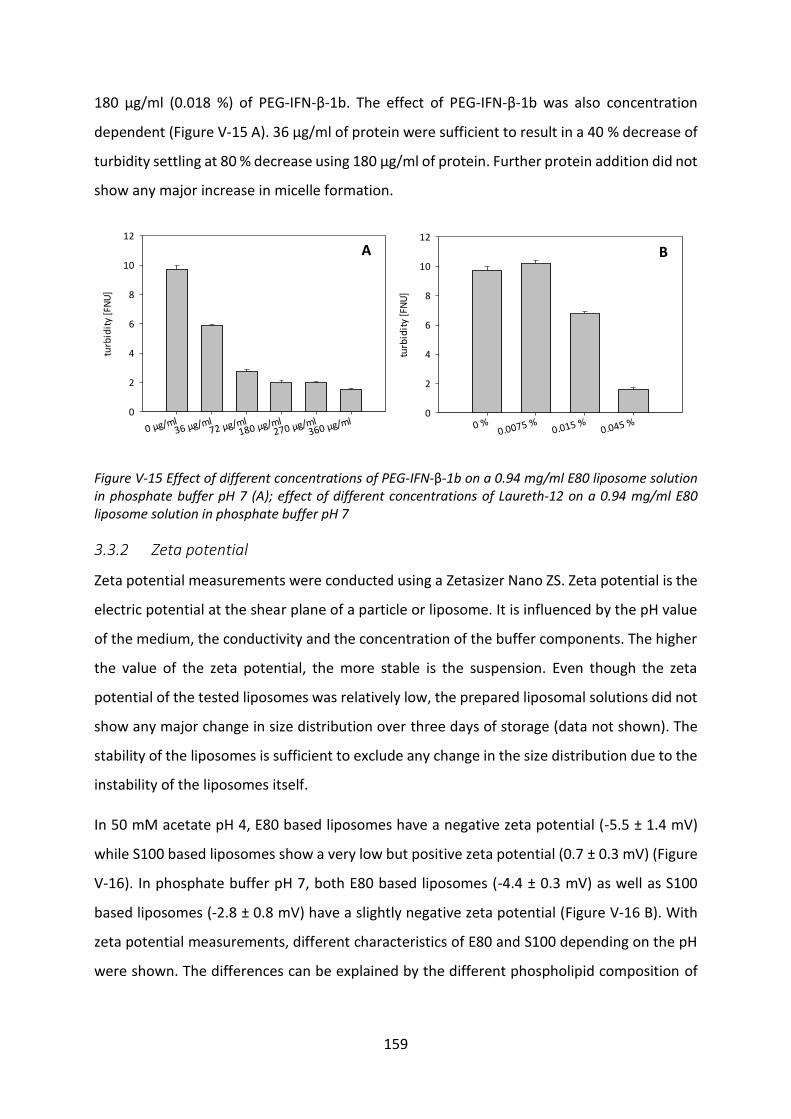
159
180 µg/ml (0.018 %) of PEG-IFN-β-1b. The effect of PEG-IFN-β-1b was also concentration
dependent (Figure V-15 A). 36 µg/ml of protein were sufficient to result in a 40 % decrease of
turbidity settling at 80 % decrease using 180 µg/ml of protein. Further protein addition did not
show any major increase in micelle formation.
0 µg/ml36 µg/ml
72 µg/ml180 µg/ml
270 µg/ml360 µg/ml
turb
idit
y [F
NU
]
0
2
4
6
8
10
12
0 %0.0075 %
0.015 %0.045 %
turb
idit
y [F
NU
]0
2
4
6
8
10
12
Figure V-15 Effect of different concentrations of PEG-IFN-β-1b on a 0.94 mg/ml E80 liposome solution in phosphate buffer pH 7 (A); effect of different concentrations of Laureth-12 on a 0.94 mg/ml E80 liposome solution in phosphate buffer pH 7
3.3.2 Zeta potential
Zeta potential measurements were conducted using a Zetasizer Nano ZS. Zeta potential is the
electric potential at the shear plane of a particle or liposome. It is influenced by the pH value
of the medium, the conductivity and the concentration of the buffer components. The higher
the value of the zeta potential, the more stable is the suspension. Even though the zeta
potential of the tested liposomes was relatively low, the prepared liposomal solutions did not
show any major change in size distribution over three days of storage (data not shown). The
stability of the liposomes is sufficient to exclude any change in the size distribution due to the
instability of the liposomes itself.
In 50 mM acetate pH 4, E80 based liposomes have a negative zeta potential (-5.5 ± 1.4 mV)
while S100 based liposomes show a very low but positive zeta potential (0.7 ± 0.3 mV) (Figure
V-16). In phosphate buffer pH 7, both E80 based liposomes (-4.4 ± 0.3 mV) as well as S100
based liposomes (-2.8 ± 0.8 mV) have a slightly negative zeta potential (Figure V-16 B). With
zeta potential measurements, different characteristics of E80 and S100 depending on the pH
were shown. The differences can be explained by the different phospholipid composition of
A B
160
E80 and S100 and consequently by the different orientations of the phosphatidylcholine
molecules [282].
l iposomes blanknIFN beta-1b
PEG-IFN beta-1b
nIFN apha-2a
PEG-IFN apha-2alysozyme
zeta
po
ten
tia
l [m
v]
-10
0
10
20E80
S100
liposomes blanknIFN beta-1b
PEG-IFN beta-1b
nIFN apha-2a
PEG-IFN apha-2alysozyme
zeta
po
ten
tia
l [m
v]
-10
0
10
20E80
S100
Figure V-16 Zeta potential measurements of liposomal solutions (0.94 mg/ml lipid) based on E80 and S100 liposomes before (liposomes blank) and after the addition of proteins to a final concentration of 0.25 mg/ml in 50 mM acetate buffer pH 4 (A) and 10 mM phosphate buffer pH 7 (B). PEG-IFN-β-1b and PEG-IFN-α-2a were used in a concentration of 790 µg/ml respectively 770 µg/ml to provide the same molar ratio compared to their non-PEGylated counterparts.
All used proteins have a positive charge at pH 4 (isoelectric point of nIFN-β-1b and PEG-IFN-β-
1b: 9.7 [157], nIFN-α-2a and PEG-IFN-α-2a: around 6 [145] and lysozyme: 11 [236]). Therefore,
the negative zeta potential of E80 based liposomes should be reduced upon interaction. After
the addition of nIFN-β-1b, the zeta potential even adopted distinct positive values
(9.7 ± 0.4 mV) indicating an interaction between the liposomes and the proteins (Figure V-16
A). The addition of PEG-IFN-β resulted in a decrease of the zeta potential of the liposomes and
the values adopted even slightly positive values (1.8 ± 0.3 mV). This can be explained by either
weaker interactions between the liposomes and the PEG-IFN-β-1b or by the shielding effect
of PEG. It has been shown that the zeta potential of PEGylated liposomes was decreased in
comparison with non-PEGylated liposomes [283]. A decrease of the zeta potential of E80
based liposomes was seen for both IFN-α species and lysozyme (Figure V-16 A). Lysozyme is
known to interact with negatively charged lipids. In literature, a change of the electrophoretic
mobility (which can be linked to the zeta potential [284]) of negatively charged
phosphatidylserine vesicles were described after interactions with lysozyme [249, 285]. For
phosphatidylcholine vesicles no major influence on the zeta potential after the addition of
lysozyme was observed [249]. A change of the zeta potential of S100 based liposomes was not
observed for both IFN-α species and lysozyme. Again, nIFN-β led to a distinct increase of the
zeta potential while PEG-IFN-β did also influence the zeta potential but to a lesser extent.
pro
tein
agg
rega
tio
n
A B
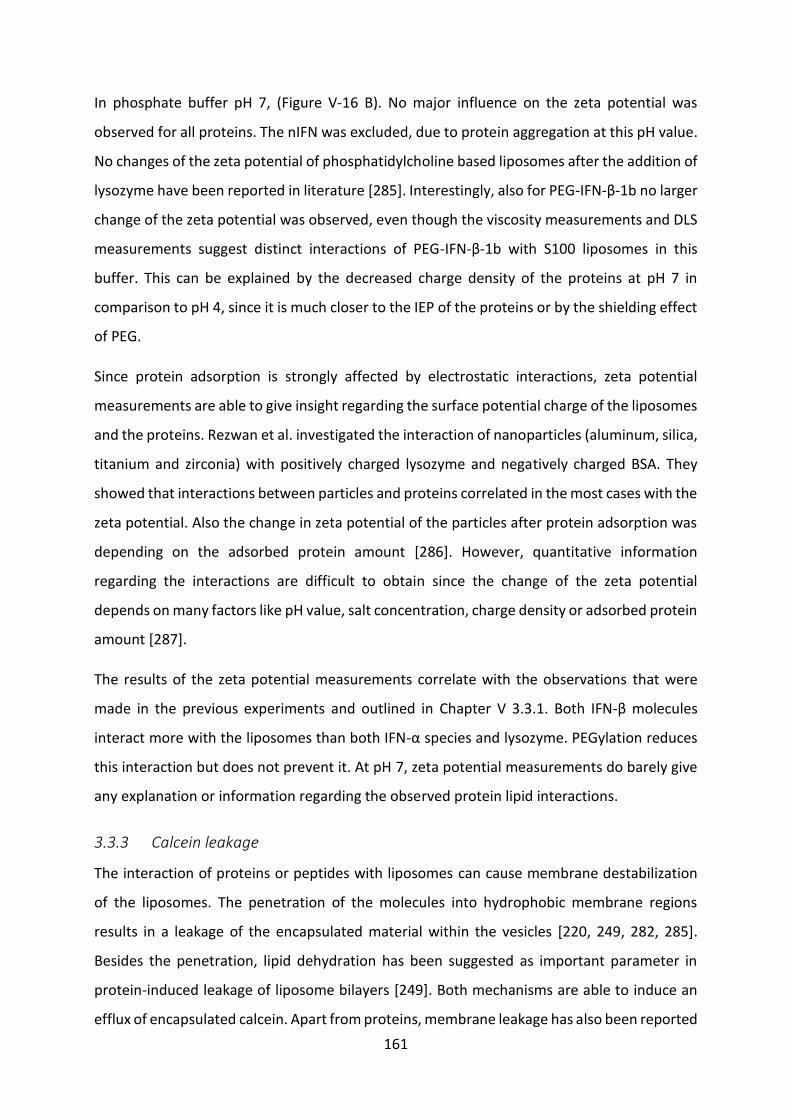
161
In phosphate buffer pH 7, (Figure V-16 B). No major influence on the zeta potential was
observed for all proteins. The nIFN was excluded, due to protein aggregation at this pH value.
No changes of the zeta potential of phosphatidylcholine based liposomes after the addition of
lysozyme have been reported in literature [285]. Interestingly, also for PEG-IFN-β-1b no larger
change of the zeta potential was observed, even though the viscosity measurements and DLS
measurements suggest distinct interactions of PEG-IFN-β-1b with S100 liposomes in this
buffer. This can be explained by the decreased charge density of the proteins at pH 7 in
comparison to pH 4, since it is much closer to the IEP of the proteins or by the shielding effect
of PEG.
Since protein adsorption is strongly affected by electrostatic interactions, zeta potential
measurements are able to give insight regarding the surface potential charge of the liposomes
and the proteins. Rezwan et al. investigated the interaction of nanoparticles (aluminum, silica,
titanium and zirconia) with positively charged lysozyme and negatively charged BSA. They
showed that interactions between particles and proteins correlated in the most cases with the
zeta potential. Also the change in zeta potential of the particles after protein adsorption was
depending on the adsorbed protein amount [286]. However, quantitative information
regarding the interactions are difficult to obtain since the change of the zeta potential
depends on many factors like pH value, salt concentration, charge density or adsorbed protein
amount [287].
The results of the zeta potential measurements correlate with the observations that were
made in the previous experiments and outlined in Chapter V 3.3.1. Both IFN-β molecules
interact more with the liposomes than both IFN-α species and lysozyme. PEGylation reduces
this interaction but does not prevent it. At pH 7, zeta potential measurements do barely give
any explanation or information regarding the observed protein lipid interactions.
3.3.3 Calcein leakage
The interaction of proteins or peptides with liposomes can cause membrane destabilization
of the liposomes. The penetration of the molecules into hydrophobic membrane regions
results in a leakage of the encapsulated material within the vesicles [220, 249, 282, 285].
Besides the penetration, lipid dehydration has been suggested as important parameter in
protein-induced leakage of liposome bilayers [249]. Both mechanisms are able to induce an
efflux of encapsulated calcein. Apart from proteins, membrane leakage has also been reported
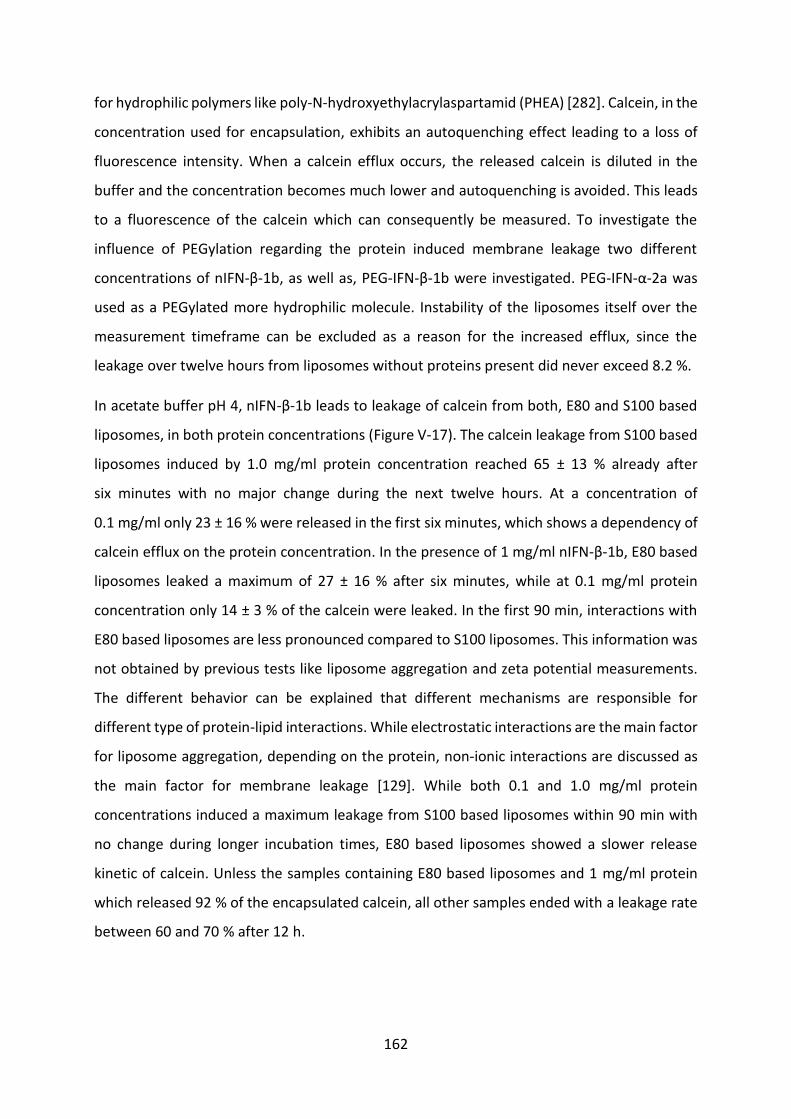
162
for hydrophilic polymers like poly-N-hydroxyethylacrylaspartamid (PHEA) [282]. Calcein, in the
concentration used for encapsulation, exhibits an autoquenching effect leading to a loss of
fluorescence intensity. When a calcein efflux occurs, the released calcein is diluted in the
buffer and the concentration becomes much lower and autoquenching is avoided. This leads
to a fluorescence of the calcein which can consequently be measured. To investigate the
influence of PEGylation regarding the protein induced membrane leakage two different
concentrations of nIFN-β-1b, as well as, PEG-IFN-β-1b were investigated. PEG-IFN-α-2a was
used as a PEGylated more hydrophilic molecule. Instability of the liposomes itself over the
measurement timeframe can be excluded as a reason for the increased efflux, since the
leakage over twelve hours from liposomes without proteins present did never exceed 8.2 %.
In acetate buffer pH 4, nIFN-β-1b leads to leakage of calcein from both, E80 and S100 based
liposomes, in both protein concentrations (Figure V-17). The calcein leakage from S100 based
liposomes induced by 1.0 mg/ml protein concentration reached 65 ± 13 % already after
six minutes with no major change during the next twelve hours. At a concentration of
0.1 mg/ml only 23 ± 16 % were released in the first six minutes, which shows a dependency of
calcein efflux on the protein concentration. In the presence of 1 mg/ml nIFN-β-1b, E80 based
liposomes leaked a maximum of 27 ± 16 % after six minutes, while at 0.1 mg/ml protein
concentration only 14 ± 3 % of the calcein were leaked. In the first 90 min, interactions with
E80 based liposomes are less pronounced compared to S100 liposomes. This information was
not obtained by previous tests like liposome aggregation and zeta potential measurements.
The different behavior can be explained that different mechanisms are responsible for
different type of protein-lipid interactions. While electrostatic interactions are the main factor
for liposome aggregation, depending on the protein, non-ionic interactions are discussed as
the main factor for membrane leakage [129]. While both 0.1 and 1.0 mg/ml protein
concentrations induced a maximum leakage from S100 based liposomes within 90 min with
no change during longer incubation times, E80 based liposomes showed a slower release
kinetic of calcein. Unless the samples containing E80 based liposomes and 1 mg/ml protein
which released 92 % of the encapsulated calcein, all other samples ended with a leakage rate
between 60 and 70 % after 12 h.
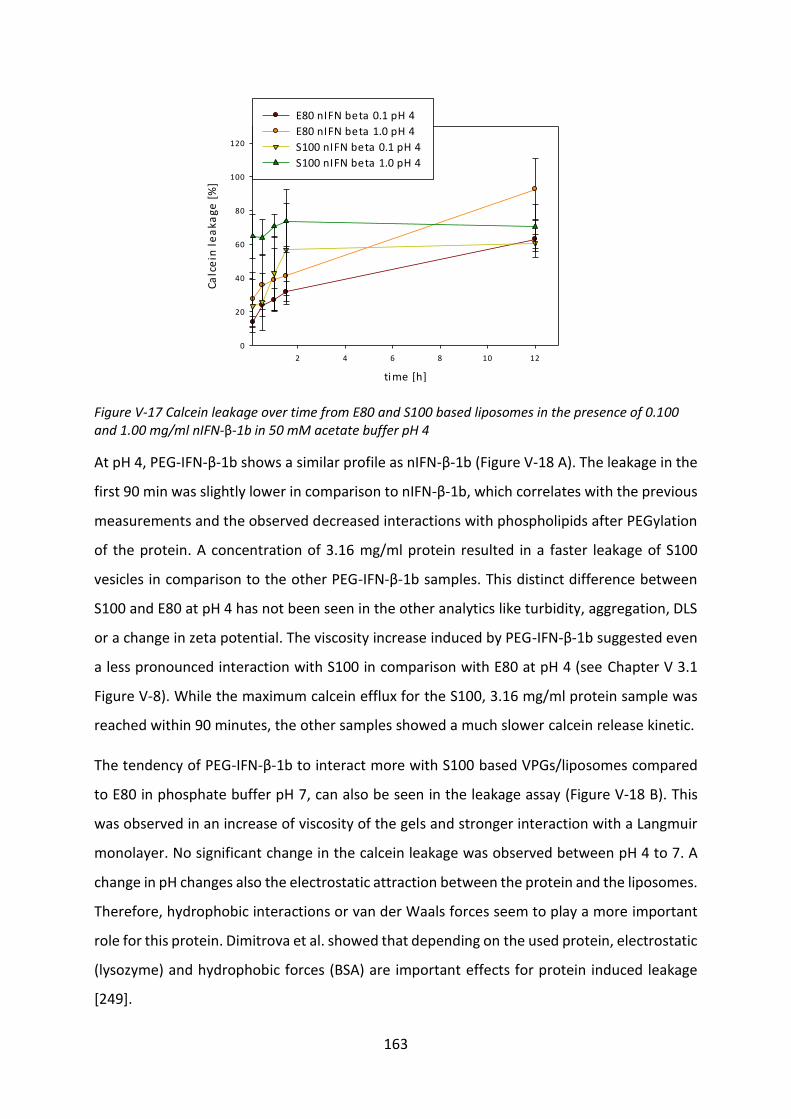
163
time [h]
2 4 6 8 10 12
Ca
lce
in l
ea
ka
ge
[%
]
0
20
40
60
80
100
120
E80 nIFN beta 0.1 pH 4
E80 nIFN beta 1.0 pH 4
S100 nIFN beta 0.1 pH 4
S100 nIFN beta 1.0 pH 4
Figure V-17 Calcein leakage over time from E80 and S100 based liposomes in the presence of 0.100 and 1.00 mg/ml nIFN-β-1b in 50 mM acetate buffer pH 4
At pH 4, PEG-IFN-β-1b shows a similar profile as nIFN-β-1b (Figure V-18 A). The leakage in the
first 90 min was slightly lower in comparison to nIFN-β-1b, which correlates with the previous
measurements and the observed decreased interactions with phospholipids after PEGylation
of the protein. A concentration of 3.16 mg/ml protein resulted in a faster leakage of S100
vesicles in comparison to the other PEG-IFN-β-1b samples. This distinct difference between
S100 and E80 at pH 4 has not been seen in the other analytics like turbidity, aggregation, DLS
or a change in zeta potential. The viscosity increase induced by PEG-IFN-β-1b suggested even
a less pronounced interaction with S100 in comparison with E80 at pH 4 (see Chapter V 3.1
Figure V-8). While the maximum calcein efflux for the S100, 3.16 mg/ml protein sample was
reached within 90 minutes, the other samples showed a much slower calcein release kinetic.
The tendency of PEG-IFN-β-1b to interact more with S100 based VPGs/liposomes compared
to E80 in phosphate buffer pH 7, can also be seen in the leakage assay (Figure V-18 B). This
was observed in an increase of viscosity of the gels and stronger interaction with a Langmuir
monolayer. No significant change in the calcein leakage was observed between pH 4 to 7. A
change in pH changes also the electrostatic attraction between the protein and the liposomes.
Therefore, hydrophobic interactions or van der Waals forces seem to play a more important
role for this protein. Dimitrova et al. showed that depending on the used protein, electrostatic
(lysozyme) and hydrophobic forces (BSA) are important effects for protein induced leakage
[249].
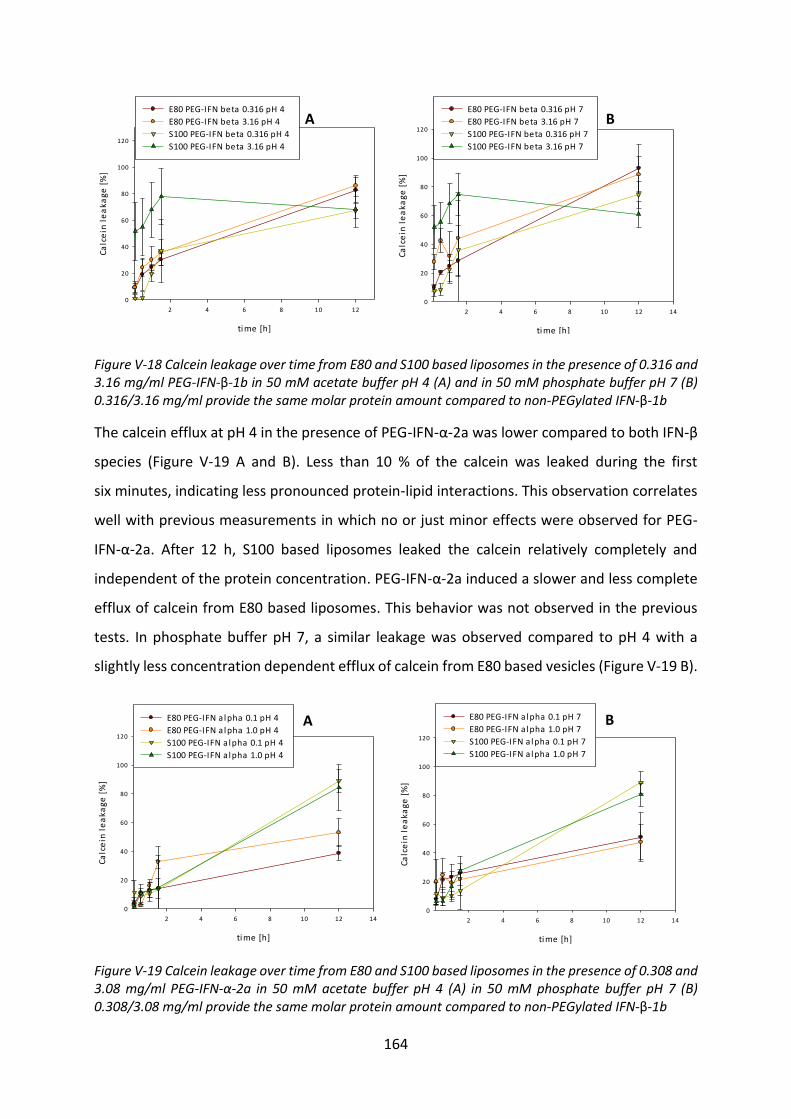
164
time [h]
2 4 6 8 10 12
Ca
lce
in l
ea
ka
ge
[%
]
0
20
40
60
80
100
120
E80 PEG-IFN beta 0.316 pH 4
E80 PEG-IFN beta 3.16 pH 4
S100 PEG-IFN beta 0.316 pH 4
S100 PEG-IFN beta 3.16 pH 4
time [h]
2 4 6 8 10 12 14
Ca
lce
in l
ea
ka
ge
[%
]
0
20
40
60
80
100
120
E80 PEG-IFN beta 0.316 pH 7
E80 PEG-IFN beta 3.16 pH 7
S100 PEG-IFN beta 0.316 pH 7
S100 PEG-IFN beta 3.16 pH 7
Figure V-18 Calcein leakage over time from E80 and S100 based liposomes in the presence of 0.316 and 3.16 mg/ml PEG-IFN-β-1b in 50 mM acetate buffer pH 4 (A) and in 50 mM phosphate buffer pH 7 (B) 0.316/3.16 mg/ml provide the same molar protein amount compared to non-PEGylated IFN-β-1b
The calcein efflux at pH 4 in the presence of PEG-IFN-α-2a was lower compared to both IFN-β
species (Figure V-19 A and B). Less than 10 % of the calcein was leaked during the first
six minutes, indicating less pronounced protein-lipid interactions. This observation correlates
well with previous measurements in which no or just minor effects were observed for PEG-
IFN-α-2a. After 12 h, S100 based liposomes leaked the calcein relatively completely and
independent of the protein concentration. PEG-IFN-α-2a induced a slower and less complete
efflux of calcein from E80 based liposomes. This behavior was not observed in the previous
tests. In phosphate buffer pH 7, a similar leakage was observed compared to pH 4 with a
slightly less concentration dependent efflux of calcein from E80 based vesicles (Figure V-19 B).
time [h]
2 4 6 8 10 12 14
Ca
lce
in l
ea
ka
ge
[%
]
0
20
40
60
80
100
120
E80 PEG-IFN a lpha 0.1 pH 4
E80 PEG-IFN a lpha 1.0 pH 4
S100 PEG-IFN a lpha 0.1 pH 4
S100 PEG-IFN a lpha 1.0 pH 4
time [h]
2 4 6 8 10 12 14
Ca
lce
in l
ea
ka
ge
[%
]
0
20
40
60
80
100
120
E80 PEG-IFN a lpha 0.1 pH 7
E80 PEG-IFN a lpha 1.0 pH 7
S100 PEG-IFN a lpha 0.1 pH 7
S100 PEG-IFN a lpha 1.0 pH 7
Figure V-19 Calcein leakage over time from E80 and S100 based liposomes in the presence of 0.308 and 3.08 mg/ml PEG-IFN-α-2a in 50 mM acetate buffer pH 4 (A) in 50 mM phosphate buffer pH 7 (B) 0.308/3.08 mg/ml provide the same molar protein amount compared to non-PEGylated IFN-β-1b
A B
A B
165
According to the leakage assay, all tested proteins in both pH values interacted with the
liposomes independent of the lipid type and induced a leakage of calcein form the vesicles.
Only the degree of interaction differs. These differences in interaction levels had not been
seen in other tests like vesicle aggregation, zeta potential and monolayer studies. Only nIFN-
β-1b had a massive influence on vesicle aggregation or a huge increase of the surface pressure
in the monolayer studies.
This can be explained that different mechanisms like electrostatic, hydrophobic interactions
or van der Waals forces are responsible for the different types of interactions like liposome
aggregation. A correlation between the leakage assay and the monolayer studies was
expected, since leakage goes along with protein penetration and/or membrane destabilization
[249]. An explanation for the lack of correlation might be that the used membrane pressure
in the monolayer studies was too high for PEG-IFN-α-2a to see an effect. Interestingly, S100
based liposomes showed a faster and more complete efflux of calcein for all proteins
compared to E80 based liposomes. The relatively high standard deviations that were obtained
during the leakage tests, made the interpretation of small differences difficult.
3.4 Investigation of protein adsorption to phospholipids
Besides the type of interaction (penetration, adsorption, aggregation) also the adsorbed
amount of protein on phospholipid vesicles plays an important role regarding the degree of
interaction [249]. Apart from getting more information concerning the affinity of the protein
to the phospholipids, the adsorbed amount of protein is also interesting regarding the possible
protein loss. QCM measurements are able to give some insight regarding pure adsorption
phenomena and give the option to quantify the adsorbed amount.
3.4.1 Phospholipid coating of the QCM chip
First of all, the QCM chip had to be coated with phospholipid vesicles interact with different
surfaces in a specific manner. When a silicon dioxide (SiO2) coated chip is used, intact vesicles
adsorb on the surface. After a short time (approx. 10 min), the adsorption is followed by a
spontaneous rupture of the vesicles and a formation of a phospholipid bilayer [288-290].
During the adsorption of the vesicles, the resonance frequency decreases and the damping of
the oscillation increases due to the addition of mass of the phospholipids of the vesicles and
the water trapped inside and between the vesicles. The increase of the dissipation indicates

166
the presence of a nonrigid layer (viscoelastic layer). After the rupture, an increase of the
resonance frequency is observed. Depending on the used vesicle size, the dissipation value
returns to almost zero showing the rigidity of the supported bilayer and a low amount of
bound solvent [288]. Glasmästar et al. also showed that the exposure of a SiO2 coated QCM
chip to phosphatidylserine and phosphatidylethanolamine vesicles leads to an adsorption of
the intact vesicles followed by spontaneous transformation into a phospholipid bilayer [291].
Using a titanium dioxide (TiO2) coated chip, the adsorption of the intact vesicles were
observed as well, but no eruption occurred [288, 290]. This effect was explained by the
different strength of vesicle-surface interactions (based on van der Waals interactions or local
charges), which are more pronounced on SiO2 in comparison to TiO2 [288]. Vesicle adsorption
on oxidized gold follows a similar pattern like on TiO2 [289, 292]. By modifying the gold surface
with alkane thiols, a supported monolayer is formed by first-order kinetics [289].
Because of promising results in literature and also because no TiO2 or oxidized gold coated
chips were provided by the manufacturer of the QCM, SiO2 coated chips were chosen.
Furthermore, the bilayer which is formed on SiO2 coated chips is rigid which makes the
calculation of the mass much easier and accurate [288].
In contrast to the results in literature, a vesicle rupture after vesicle adsorption was not
observed (Figure V-20 A). Neither a change in the liposome concentration from 500 µg/ml to
100 µg/ml nor a change of the buffer from 50 mM acetate buffer pH 4 to 10 mM Tris pH 8
[289] did influence the adsorption/rupture. Even though Reimhult et al. did not see an
influence of vesicles size (25 nm – 200 nm) on the quality of vesicle rupture [288], Jing et al.
observed that vesicles larger than 160 nm do not rupture after adsorption on SiO2, while
vesicles smaller than 100 nm do [293]. The vesicles used in this study had a size between 130
and 160 nm. Vesicle size might be an explanation for this observation but also the usage of
different type of lipids and lipid compositions compared to literature. Whereas S100 and E80
are mixtures of different phospholipids (phosphatidylcholine, phosphatidylethanolamine,
lyso-phosphatidylcholine) the other authors used just a single pure phospholipid [288, 289,
293]. Cho et al. showed that the rupture depends on the type of lipid and the lipid
composition, as well, and is also influenced by the lipid charge [290]. Furthermore, the
adsorption and stability of intact vesicles itself depends on many different parameters like
167
lipid composition, surface charge, vesicle size and concentration, as well as on the
temperature and the osmotic pressure of the buffer [292].
3.4.2 Protein adsorption on phospholipid vesicles
The adsorption of intact phospholipid vesicles to the SiO2 coated chips led to a vesicle layer
with viscoelastic properties (ΔF/ΔD = 3.2) (Figure V-20 A). Therefore, the Sauerbrey equation
[227] for the determination of the mass is not applicable, because dissipation is not
considered. The used qGraph software offers an option to calculate the mass of a viscoelastic
layer by estimating the density and thickness, as well as the ratio of the elastic and viscous
property of the layer. This option also assumes an infinite Newtonian fluid above the layer.
When both IFN-β species were adsorbed on the immobilized vesicles, an additional change of
damping was observed (Figure V-20 B and C) which indicates a viscoelastic protein layer on a
viscoelastic liposome layer. To receive masses as exact as possible, all the before mentioned
parameters have to be estimated for the first layer (liposome layer) and for an additional
second layer (protein layer) of each sample individually. The combination of these many
uncertainties and estimations may lead to a rather big mistake, when calculating the exact
masses. Using the same estimated parameters for all samples gives a mass value in the end,
which is only a very rough approximation of the actual mass. Therefore, only a semi-
quantitative comparison is possible. This relative and semi-quantitative comparison is also
possible by comparing only the frequency shifts and the damping which is why the data is
presented without calculating actual masses.
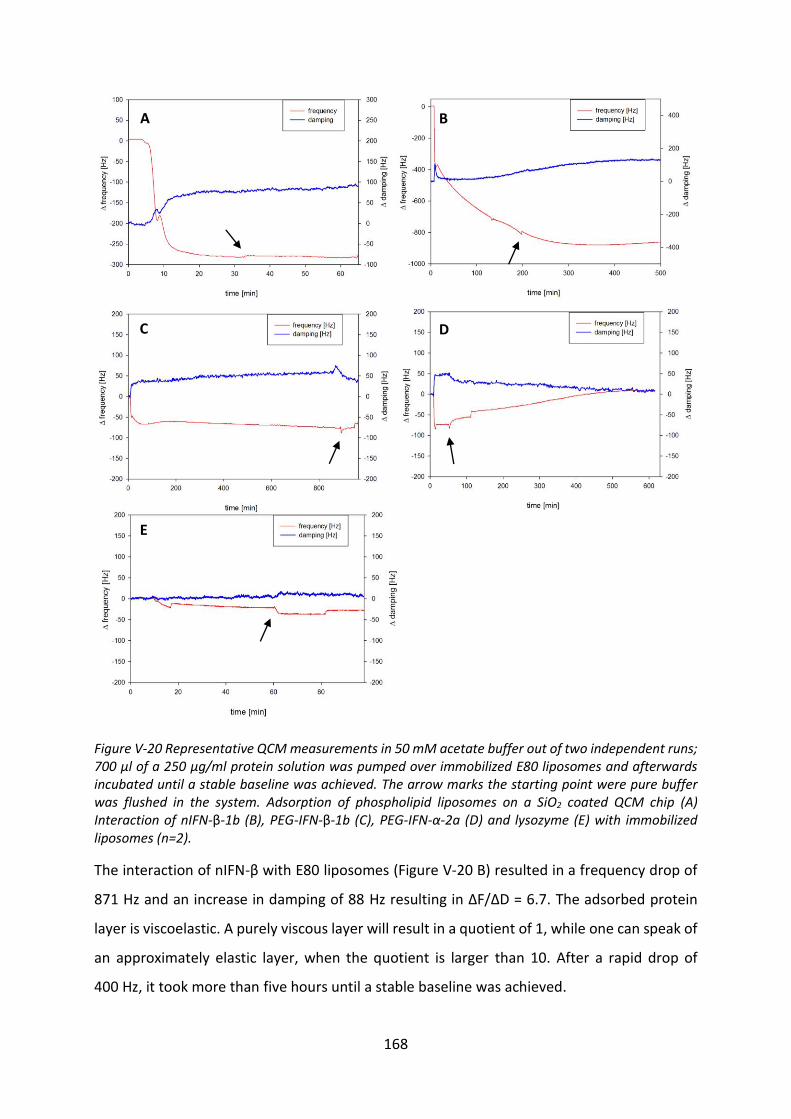
168
Figure V-20 Representative QCM measurements in 50 mM acetate buffer out of two independent runs; 700 µl of a 250 µg/ml protein solution was pumped over immobilized E80 liposomes and afterwards incubated until a stable baseline was achieved. The arrow marks the starting point were pure buffer was flushed in the system. Adsorption of phospholipid liposomes on a SiO2 coated QCM chip (A) Interaction of nIFN-β-1b (B), PEG-IFN-β-1b (C), PEG-IFN-α-2a (D) and lysozyme (E) with immobilized liposomes (n=2).
The interaction of nIFN-β with E80 liposomes (Figure V-20 B) resulted in a frequency drop of
871 Hz and an increase in damping of 88 Hz resulting in ΔF/ΔD = 6.7. The adsorbed protein
layer is viscoelastic. A purely viscous layer will result in a quotient of 1, while one can speak of
an approximately elastic layer, when the quotient is larger than 10. After a rapid drop of
400 Hz, it took more than five hours until a stable baseline was achieved.
A B
C D
E
169
PEGylation of nIFN-β-1b resulted in a significantly decreased drop in frequency (Figure V-20
C). Only a drop of 58 Hz was observed. The damping increased 37 Hz which is proportionally a
larger increase in damping in comparison to the value for native protein. ΔF/ΔD = 1.6 implies
a much more viscous layer in comparison to the layer of the native protein. This can be
explained by the fact that especially branched PEG molecules increase the hydrodynamic
volume due to a strong coordination of water molecules [20, 197].
PEG-IFN-α has also a low ΔF/ΔD-value (1.2) and a fast initial drop in frequency (74 Hz) and
increase in damping (23 Hz) was observed (Figure V-20 D). Interestingly, while flushing the
system with clean buffer (black arrow), the frequency started to increase and the damping to
decrease ending at 12 Hz/10 Hz. Since the liposome coating was stable during the
measurement time frame, the loss in mass can be explained because PEG-IFN-α does not
couple completely to the vesicles and is washed out while flushing the system with clean
buffer. This indicates a weaker and reversible interactions with phospholipids compared to
both beta IFNs which correlates with previous results.
The interaction of lysozyme with the adsorbed vesicles resulted in a decrease in frequency of
27 Hz and an increase in damping of 10 Hz (Figure V-20 E). The resulting ΔF/ΔD-value of 2.7
indicates a viscoelastic layer. In contrast to PEG-IFN-α, the interaction was not reversible
during the washing step.
QCM measurement showed an interaction of all proteins with the phospholipids. QCM-D
measurements usually result in a higher mass uptake in comparison to other methods, since
also the bound water, specifically the hydration shell and the trapped water in the protein
adsorption layer, is measured [291]. In this study, the determination of the mass was rather
difficult due to two viscoelastic layers being present which leads to a very complex calculation
including the estimation of different parameters.
The reduction of the interactions by PEGylation was seen in the QCM measurement. In
comparison with the adsorption on triglycerides (Chapter V 2.1), PEGylation of IFN-β-1b does
not only decrease the adsorbed molar protein amount but also the absolute adsorbed mass.
The layer property is also changed by PEGylation. The adsorbed nIFN-β-1b layer is more rigid
than the adsorbed PEG-IFN-β-1b layer. Besides QCM measurements, signs of interactions
between PEG-IFN-α and E80 based liposomes were observed during the zeta potential
measurements in acetate buffer (Figure V-16) and during the calcein leakage (Figure V-19 A)
170
test. According to the QCM measurements, PEG-IFN-α seems to reversibly adsorb to the
immobilized liposomes. After the incubation of the protein and the adsorbed vesicles in the
QCM measurement cell, the measurement cell is flushed with fresh buffer. This shifts the
equilibrium in the direction of solubilized protein leading to desorption of the adsorbed
protein. No signs of reversibility of protein-lipid interactions were observed in zeta potential
measurements and the calcein leakage assay, which do were conducted in closed systems.
QCM has the advantage, to show pure adsorption phenomena. Since an adsorption process
to phospholipids does not necessarily result in a change in the surface pressure of a monolayer
[263] or vesicle aggregation [129, 248], different behaviors between the monolayer ,
aggregation studies and the QCM-studies can be explained.
4 Summary and conclusion
Interactions of the proteins with the lipid materials of the formulation accompanied the
project during all stages. In order to get more and fast and easily obtainable information
regarding these protein-lipid interactions, different analytics were investigated.
In order to investigate the observed interactions regarding SLIs, interactions between proteins
and a triglyceride surface were investigated using a quartz crystal microbalance (QCM).
The quartz chip was successfully coated with triglycerides. IFN-α-2, PEG-IFN-α-2 and lysozyme
were used to compare the two IFN-β-1b species to more hydrophilic proteins. As expected,
nIFN-β-1b adsorbs strongly to the lipid surfaces. For both, IFN-β-1b and PEG-IFN-β-1b, a similar
mass adsorption to triglyceride surfaces was observed. Moreover, it was higher compared to
the two IFN-α-2 species and lysozyme. By PEGylation, the totally adsorbed mass is on a similar
level compared to the native protein. The adsorbed molar protein amount, however, is
significantly smaller since the PEG part represents about two-thirds of the molecules mass.
The same behavior was observed for nIFN-α-2a and PEG-IFN-α-2a. The amount of molecules
being adsorbed to triglycerides can be reduced but the interaction with the surface cannot be
completely avoided by PEGylation. This effect can be explained because the molecule PEG
itself does also show adsorption on the lipid surface and by the larger amount of water bound
to the PEG part of the PEGylated protein. The QCM studies also correlate with the findings
regarding the stability in solution in the presence of lipids.
171
After the incorporation of nIFN-β-1b and PEG-IFN-β-1b into VPGs, the increase in viscosity and
the changed gel structure was easily visible. The incomplete release of PEG-IFN-β-1b and PEG-
IFN-α-2a from VPGs indicated an influence of protein-lipid interaction on the release. In order
to understand and to characterize the observed macroscopic changes of the VPGs and the
influence on the release kinetic due to protein-phospholipid interactions, different models
and methods were investigated. The intention of the experiments was to fast and easily
correlate and predict the influence of the protein-lipid interactions and get some deeper
understanding for those interactions.
Liposomes can easily and reproducibly be prepared and the setup is rather straight forward.
The interaction with vesicles as a model did show strong interactions between nIFN-β-1b and
the vesicles in most cases. This observation correlates with the changed viscosities and the
inability to extract the protein from the VPGs.
Also the adsorption to immobilized vesicles which were measured by QCM, and the
interactions with a preformed phospholipid Langmuir monolayer were distinctly more
pronounced for nIFN-β-1b in comparison with all other tested proteins. PEGylation of IFN-β-
1b was able to reduce these interactions but was not able to completely avoid it. In addition
to the less pronounced effects, PEG-IFN-β-1b showed also different effects on liposomes, like
the formation of micelles.
It is clearly shown that PEG-IFN-β-1b is a new molecule with unique properties.
The effect of the interaction of PEG-IFN-β-1b and PEG-IFN-α-2 with phospholipids was clearly
visible during the release studies. PEG-IFN-α-2a did not show a major effect on liposomes,
apart from the calcein leakage test, where all tested proteins caused an efflux. Whether the
calcein leakage assay might be an indicator regarding the influence on the release from VPGs
should be evaluated in further studies with different proteins. However, a correlation between
amount of leaked calcein as an indicator of protein lipid interactions and the decreased
release rate of protein from VPGs was not observed (Table V-I).
The calcein leakage assay does not give insight regarding the increased viscosity of the gels.
Also other models and the investigated analytical tools do not seem to be an appropriate
indicator for the changed viscosity (Table V-I). The same was observed during the QCM studies
with immobilized liposomes. No big difference between PEG-IFN-β-1b and PEG-IFN-α-2a was
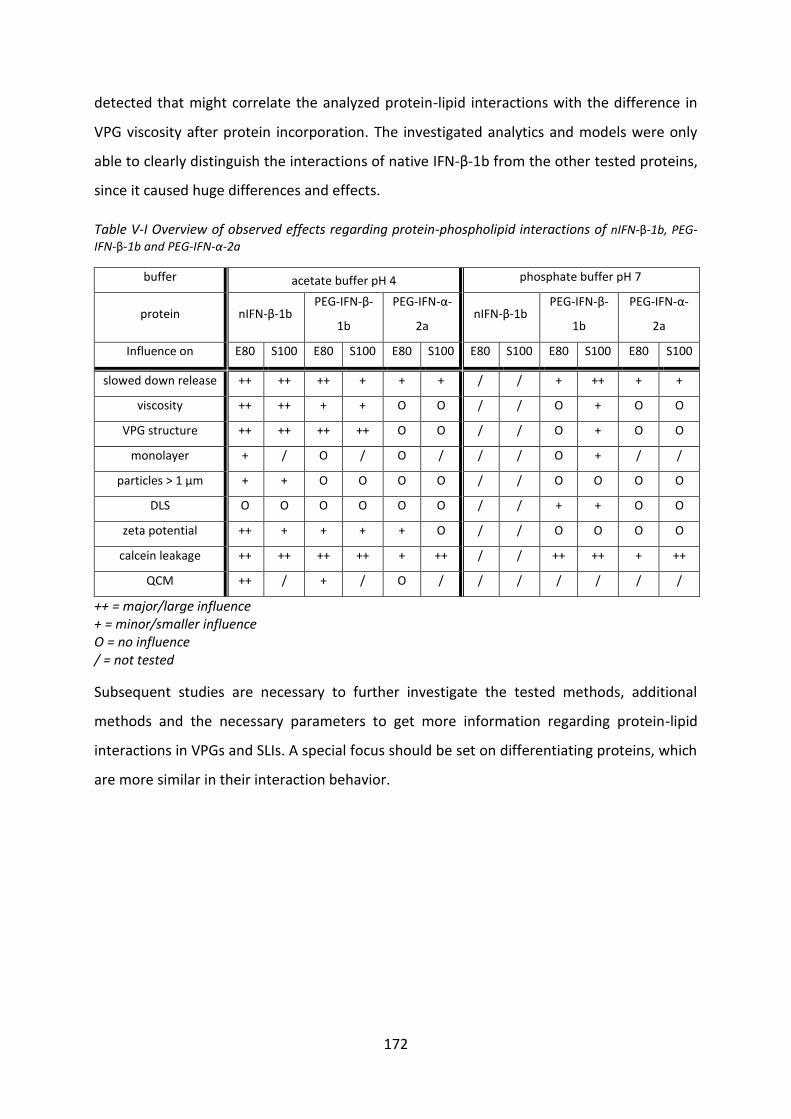
172
detected that might correlate the analyzed protein-lipid interactions with the difference in
VPG viscosity after protein incorporation. The investigated analytics and models were only
able to clearly distinguish the interactions of native IFN-β-1b from the other tested proteins,
since it caused huge differences and effects.
Table V-I Overview of observed effects regarding protein-phospholipid interactions of nIFN-β-1b, PEG-
IFN-β-1b and PEG-IFN-α-2a
buffer acetate buffer pH 4 phosphate buffer pH 7
protein nIFN-β-1b PEG-IFN-β-
1b
PEG-IFN-α-
2a nIFN-β-1b
PEG-IFN-β-
1b
PEG-IFN-α-
2a
Influence on E80 S100 E80 S100 E80 S100 E80 S100 E80 S100 E80 S100
slowed down release ++ ++ ++ + + + / / + ++ + +
viscosity ++ ++ + + O O / / O + O O
VPG structure ++ ++ ++ ++ O O / / O + O O
monolayer + / O / O / / / O + / /
particles > 1 µm + + O O O O / / O O O O
DLS O O O O O O / / + + O O
zeta potential ++ + + + + O / / O O O O
calcein leakage ++ ++ ++ ++ + ++ / / ++ ++ + ++
QCM ++ / + / O / / / / / / /
++ = major/large influence + = minor/smaller influence O = no influence / = not tested
Subsequent studies are necessary to further investigate the tested methods, additional
methods and the necessary parameters to get more information regarding protein-lipid
interactions in VPGs and SLIs. A special focus should be set on differentiating proteins, which
are more similar in their interaction behavior.
173
Chapter VI Final summary
The aim of this thesis was the investigation of the suitability of solid lipid implants (SLIs) and
vesicular phospholipid gels (VPGs) for the very hydrophobic and labile model protein IFN-β-1b
in order to develop a human serum albumin (HSA) free lipid based depot system for this
protein. To improve the physicochemical properties, IFN-β-1b was chemically modified by site
specific PEGylation and the effect of PEGylation was investigated on protein release. Protein-
lipid interactions were investigated with different methods and models to examine the
influence of these interactions on the release kinetic and the effect of PEGylation on protein-
lipid interactions.
Chapter I and II include the introduction and the objective of the thesis.
In chapter III, preliminary tests of the native IFN-β-1b with VPGs are described. VPGs were
prepared by mixing the protein buffer with phospholipids and the mixture was processed with
a dual asymmetric centrifuge (DAC). Interestingly, the viscosity of the VPGs changed after
protein incorporation. The bad solubility of IFN-β-1b at neutral pH values and the occurrence
of strong protein-lipid interactions made the release of this protein and even the extraction
from VPGs not possible.
In order to prepare SLIs, a HSA-free lyophilisate as an intermediate was needed. The
lyophilisate was successfully developed with a suitable protein:sugar-ratio to deliver a
therapeutic dose over ten days. No increase of oxidation, particle formation or deviations of
the secondary structure were observed after lyophilisation. SLIs were prepared by mixing the
lyophilized protein with a mixture of lipids with a high melting point and lipids with a low
melting point. The blend was eventually extruded with a twin-screw extruder according to Sax
[88]. The protein stability was not affected by the extrusion process. In order to conduct a
release test at a neutral pH value and at a physiological temperature and salt concentrations,
different surfactants were investigated. The presence of triglycerides decreased the solubility
of IFN-β-1b, indicating protein-lipid interactions. Only 0.1 % sodium dodecyl sulfate (SDS) was
able to provide sufficient protein solubility and stability in solution in the presence of lipids.
While SDS increased the stability of the protein in solution very well, it did also solubilize the
matrix material of the extrudates. Nonetheless, a sustained release over seven days was
achieved without any burst effect using PEG 6000 as a precipitation agent and pore forming
agent. By the addition of PEG, the release rate was slightly decreased and the total released
174
protein amount was increased ending at around 85 % after seven days. The observed
discrepancy can be explained by a fraction of the non-released protein still being in the
extrudate on the one hand, on the other hand, protein is lost due to protein instability
promoted by protein-lipid interactions. The biological activity of IFN-β-1b directly after release
was maintained indicating no major protein instability during lyophilisation or extrudate
preparation. During the further release tests, a drop of activity was observed.
In chapter IV, PEGylation of IFN-β-1b and the release tests of PEG-IFN-β-1b from SLIs and VPGs
were in the focus. The development of the PEGylation and purification process is described.
IFN-β-1b was successfully PEGylated using a 40 kDa branched PEGaldehyde. The products
were purified by using IEX chromatography resulting in 95 % of monoPEGylated species. The
monoPEGylation was proved by SEC-MALS measurements. The biological activity by
PEGylation was decreased due to the steric hindrance of the PEG conjugate, as expected, but
still maintained on a level making the conjugate suitable for therapeutic use. By PEGylation,
the solubility of IFN-β-1b was greatly improved resulting in a solubility in PBS buffer pH 7.4
over four days at 37 °C without a loss of biological activity. Also the stability in solution in the
presence of triglycerides was improved in comparison to nIFN-β-1b. However, a loss of protein
was observed for PEG-IFN-β-1b, was well.
In order to prepare the extrudates, a HSA-free PEG-IFN-β-1b lyophilisate was developed. No
changes regarding oxidation, formation of aggregates or deviations of the secondary structure
were observed after lyophilisation. Extrudates were prepared according to chapter III. Due to
the improved solubility, a release in PBS buffer pH 7.4 was finally possible over seven days
with totally released amount of 74 % after one week. Again, the incomplete release can be
explained by PEG-IFN-β-1b still being enclaved in the matrix and protein loss because of
protein-lipid interactions. In the presence of 0.1 % SDS the released amount could slightly be
improved. While the biological activity was maintained during the first two days in 0.1 % SDS
medium, a drop of activity was observed during the further release. Lyophilisation and
extrudate preparation did not affect the biological activity in a major way, again. The loss of
activity can be explained by an instability of PEG-IFN-β-1b in the release medium in the
presence of the lipids which was even more pronounced in pure PBS buffer + lipids with a loss
of activity even at the first day. Without lipids present, the biological activity was maintained
with no major decrease over seven days in buffers with and without SDS. A more detailed
175
investigation narrowed the reason for the loss of activity down to an increase of oxidized
species due to the presence of Dynasan 118, most likely impurities in the lipid.
By PEGylation, the investigation of VPGs as a depot formulation was possible, since the
protein-phospholipid interactions were reduced by the shielding effect and the changed
physicochemical properties. An extraction of PEG-IFN-β-1b from VPGs was possible. PEG-IFN-
β-1b was incorporated in Lipoid E80 and Lipoid S100 based VPGs using a DAC. Again, the
viscosity changed after protein incorporation indicating protein-lipid interactions also for
PEGylated protein. For the release studies, a Teflon® flow through cell was used. A release of
PEG-IFN-β-1b from VPGs in PBS buffer without SDS was possible but the release rate was very
slow and incomplete with most of the protein still being in the formulation. The release rate
and the completeness of the release could be slightly improved by changing the type of lipid,
the lipid concentration and the formulation pH values. Still the release wore off at around
50 %. The release curves resemble more a Higuchi kinetic than the linear erosion controlled
zero order kinetic described in literature [106]. Interestingly, also the protein amount,
respectively the protein-lipid ratio has an influence on the release rate. By increasing the
protein loading, not only the absolute amount of released protein is increased, but also the
relative amount. This indicates the occurrence of protein-phospholipid interactions. The
release rate could only be increased by decreasing the lipid content to a certain degree. The
biological activity was tested during the release. In VPGs based on both lipids, the biological
activity was significantly decreased already at the first release day. Since the incubation in
buffer in the presence of preformed liposomes did not show a loss of activity, a degeneration
of the protein during the manufacturing process is likely.
In chapter V, a closer look on protein-lipid interactions is taken in order to get a better
understanding regarding the observed interactions. In addition to that, also methods to easily
analyze and predict those interactions are investigated to receive a quick overview of possible
effects that might influence the release. In order to determine the adsorbed mass and the
affinity of different proteins to a triglyceride surface, a quartz crystal microbalance (QCM) was
used. The chip was successfully coated with a triglyceride. Besides nIFN-β-1b and PEG-IFN-β-
1b being tested, IFN-α-2, PEG-IFN-α-2 and lysozyme were used as more hydrophilic proteins
as a comparison. The highest adsorption was observed for both IFN-β-1b species which
adsorbed with a similar mass. Since the PEG part of both PEGylated IFNs (α and β) represents
176
almost two-thirds of the mass of the molecule, the total adsorbed protein amount is smaller
in comparison with the native proteins. In addition to that, the larger amount of water bound
to the PEG part of the PEGylated protein does also increase the mass measured by QCM. The
adsorption to triglycerides cannot be completely avoided by PEGylation but the number of
adsorbed molecules can be decreased. This observation correlates also with our findings
regarding the solubility in the presence of lipids.
The interactions between proteins and phospholipids are rather complex. The increase in
viscosity and the changed gel structure after incorporation of both IFN-β-1b and PEG-IFN-β-
1b into VPGs were easily visible. IFN-α-2a and PEG-IFN-α-2a do not show these effects on
viscosity and gel structure but do also show a non-linear and incomplete release. Different
models like liposomes and monolayers were tested and analyzed with different analytical
tools like QCM and Langmuir film balance to get more understanding regarding these
interactions. Among all tested proteins, IFN-β-1b showed the strongest interactions and
behaved differently in comparison to the other proteins. The addition of IFN-β-1b to
preformed liposomes resulted in the largest change of the zeta potential of all tested proteins
and resulted in a huge increase in vesicle aggregation, which was determined by turbidity
measurements and light obscuration. Moreover, nIFN-β-1b had also a big influence on the
structure of a phospholipid layer, determined by the protein induced leakage of encapsulated
calcein from liposomes and an increase of the surface pressure of a phospholipid monolayer,
determined with a Langmuir trough. In addition to that, the largest drop in frequency during
QCM measurements after adsorption to immobilized liposomes was observed for IFN-β-1b.
PEGylation decreased and changed these interactions significantly. While no aggregation of
liposomes was observed at neutral pH values in the presence of PEG-IFN-β-1b, the formation
of micelles was detected. Also a change of the zeta potential was observed. The other tested
proteins (nIFN-α-2a, PEG-IFN-α-2a and lysozyme) did not show a major effect on liposomes.
During the investigation of the influence on a phospholipid monolayer, using a Langmuir
trough, only small differences were observed between PEG-IFN-β-1b, PEG-IFN-α-2 and
lysozyme. PEG-IFN-β-1b a tendency to show a larger increase in surface pressure. The same
was observed during the QCM studies with immobilized liposomes. The small effects, which
were observed with the different models, are in contrast to the large PEG-IFN-β-1b induced
effects on VPGs which were already visible to the naked eye like the increase of viscosity.
177
In conclusion, two different lipid based drug delivery systems, namely VPGs and SLIs, were
investigated for the hydrophobic and labile IFN-β-1b and its PEGylated counterpart which was
prepared in the scope of this thesis. A sustained release of IFN-β-1b from SLIs is possible after
adjusting the release medium. Due to the improved characteristics, PEG-IFN-β-1b can even be
released under physiological conditions. However, for both IFN-β-1b species instability in the
release medium in the presence of lipids was detected. PEGylation of IFN-β-1b does
significantly improve, but also changes the physicochemical properties, resulting in a new
molecule with completely different characteristics. Protein-lipid interactions were reduced
and changed by PEGylation but could not completely be avoided. Stability problems for both
protein species in the presence of lipids were still observed and led to decrease in biological
activity. Even after PEGylation, IFN beta-1b is a very challenging protein. Due to the complexity
of the interactions with phospholipids, different methods and models were necessary to
monitor them and still no prediction regarding the release behavior could be made. Therefore,
further studies to characterize these protein-lipid interactions are necessary.
178
Chapter VII References
1. Philippidis, A. The Top 25 Best-Selling Drugs of 2013. 2014 [cited 2014; Available from: http://www.genengnews.com/insight-and-intelligenceand153/the-top-25-best-selling-drugs-of-2013/77900053/?page=1.
2. Walsh, G., Biopharmaceutical benchmarks 2014. Nat Biotech, 2014. 32(10): p. 992-1000. 3. Caravella, J. and A. Lugovskoy, Design of next-generation protein therapeutics. Current Opinion
in Chemical Biology, 2010. 14(4): p. 520-528. 4. Wang, W., Instability, stabilization, and formulation of liquid protein pharmaceuticals.
International Journal of Pharmaceutics, 1999. 185(2): p. 129-188. 5. Park, K., I.C. Kwon, and K. Park, Oral protein delivery: Current status and future prospect.
Reactive and Functional Polymers, 2011. 71(3): p. 280-287. 6. Aungst, B.J., Intestinal permeation enhancers. Journal of Pharmaceutical Sciences, 2000. 89(4):
p. 429-442. 7. Moeller, E.H. and L. Jorgensen, Alternative routes of administration for systemic delivery of
protein pharmaceuticals. Drug Discovery Today: Technologies, 2008. 5(2–3): p. e89-e94. 8. Kontermann, R.E., Strategies for extended serum half-life of protein therapeutics. Current
Opinion in Biotechnology, 2011. 22(6): p. 868-876. 9. Fu, K., A.M. Klibanov, and R. Langer, Protein stability in controlled-release systems. Nat Biotech,
2000. 18(1): p. 24-25. 10. Veronese, F.M., Peptide and protein PEGylation: a review of problems and solutions.
Biomaterials, 2001. 22(5): p. 405-417. 11. Gombotz, W.R. and D.K. Pettit, Biodegradable Polymers for Protein and Peptide Drug Delivery.
Bioconjugate Chemistry, 1995. 6(4): p. 332-351. 12. Roberts, M.J., M.D. Bentley, and J.M. Harris, Chemistry for peptide and protein PEGylation.
Advanced Drug Delivery Reviews, 2002. 54(4): p. 459-476. 13. Schwendeman, S.P., et al., Injectable controlled release depots for large molecules. Journal of
Controlled Release, 2014. 190(0): p. 240-253. 14. Zhang, L. and G. Bulaj, Converting peptides into drug leads by lipidation. Curr Med Chem, 2012.
19(11): p. 1602-18. 15. Harris, J.M. and R.B. Chess, Effect of pegylation on pharmaceuticals. Nat Rev Drug Discov, 2003.
2(3): p. 214-221. 16. Jevsevar, S., M. Kunstelj, and V.G. Porekar, PEGylation of therapeutic proteins. Biotechnol J,
2010. 5(1): p. 113-28. 17. Abuchowski, A., et al., Effect of covalent attachment of polyethylene glycol on immunogenicity
and circulating life of bovine liver catalase. Journal of Biological Chemistry, 1977. 252(11): p. 3582-6.
18. Abuchowski, A., et al., Alteration of immunological properties of bovine serum albumin by covalent attachment of polyethylene glycol. Journal of Biological Chemistry, 1977. 252(11): p. 3578-81.
19. Pelegri-O’Day, E.M., E.-W. Lin, and H.D. Maynard, Therapeutic Protein–Polymer Conjugates: Advancing Beyond PEGylation. Journal of the American Chemical Society, 2014. 136(41): p. 14323-14332.
20. Veronese, F.M., P. Caliceti, and O. Schiavon, Branched and Linear Poly(Ethylene Glycol): Influence of the Polymer Structure on Enzymological, Pharmacokinetic, and Immunological Properties of Protein Conjugates. Journal of Bioactive and Compatible Polymers, 1997. 12(3): p. 196-207.
21. Kozlowski, A. and J. Milton Harris, Improvements in protein PEGylation: pegylated interferons for treatment of hepatitis C. Journal of Controlled Release, 2001. 72(1–3): p. 217-224.
22. Pasut, G. and F. Veronese, PEGylation of Proteins as Tailored Chemistry for Optimized Bioconjugates, in Polymer Therapeutics I, R. Satchi-Fainaro and R. Duncan, Editors. 2006, Springer Berlin Heidelberg. p. 95-134.
179
23. Graham, M.L., Pegaspargase: a review of clinical studies. Advanced Drug Delivery Reviews, 2003. 55(10): p. 1293-1302.
24. Levy, Y., et al., Adenosine deaminase deficiency with late onset of recurrent infections: response to treatment with polyethylene glycol-modified adenosine deaminase. J Pediatr, 1988. 113(2): p. 312-7.
25. Wang, Y.S., et al., Structural and biological characterization of pegylated recombinant interferon alpha-2b and its therapeutic implications. Adv Drug Deliv Rev, 2002. 54(4): p. 547-70.
26. Bailon, P., et al., Rational design of a potent, long-lasting form of interferon: a 40 kDa branched polyethylene glycol-conjugated interferon alpha-2a for the treatment of hepatitis C. Bioconjug Chem, 2001. 12(2): p. 195-202.
27. Trainer, P.J., et al., Treatment of acromegaly with the growth hormone-receptor antagonist pegvisomant. N Engl J Med, 2000. 342(16): p. 1171-7.
28. Wong, S.S., Chemistry of protein conjugation and cross-linking. 1991: CRC press. 29. Banerjee, J. and M. Nilsen-Hamilton, Aptamers: multifunctional molecules for biomedical
research. J Mol Med (Berl), 2013. 91(12): p. 1333-42. 30. Alconcel, S.N.S., A.S. Baas, and H.D. Maynard, FDA-approved poly(ethylene glycol)-protein
conjugate drugs. Polymer Chemistry, 2011. 2(7): p. 1442-1448. 31. Baker, D.P., et al., N-Terminally PEGylated Human Interferon-β-1a with Improved
Pharmacokinetic Properties and in Vivo Efficacy in a Melanoma Angiogenesis Model§. Bioconjugate Chemistry, 2005. 17(1): p. 179-188.
32. Jevševar, S. and M. Kunstelj, Half-Life Extension through PEGylation, in Therapeutic Proteins. 2012, Wiley-VCH Verlag GmbH & Co. KGaA. p. 39-61.
33. Bennett, C.L., et al., Anaphylaxis and Hypotension after Administration of Peginesatide. New England Journal of Medicine, 2014. 370(21): p. 2055-2056.
34. Weber, F. and G. Sedelmeier, Top 200 Drugs by Worldwide Sales 2013. 2014: Nachrichten aus der Chemie. p. 997.
35. Schellekens, H., W. Hennink, and V. Brinks, The Immunogenicity of Polyethylene Glycol: Facts and Fiction. Pharmaceutical Research, 2013. 30(7): p. 1729-1734.
36. Armstrong, J., The occurrence, induction, specificity and potential effect of antibodies against poly(ethylene glycol), in PEGylated Protein Drugs: Basic Science and Clinical Applications, F. Veronese, Editor. 2009, Birkhäuser Basel. p. 147-168.
37. Richter, A.W. and E. Akerblom, Polyethylene glycol reactive antibodies in man: titer distribution in allergic patients treated with monomethoxy polyethylene glycol modified allergens or placebo, and in healthy blood donors. Int Arch Allergy Appl Immunol, 1984. 74(1): p. 36-9.
38. Garratty, G., Modulating the red cell membrane to produce universal/stealth donor red cells suitable for transfusion. Vox Sang, 2008. 94(2): p. 87-95.
39. Garratty, G., Progress in modulating the RBC membrane to produce transfusable universal/stealth donor RBCs. Transfus Med Rev, 2004. 18(4): p. 245-56.
40. Liu, Y., et al., A double antigen bridging immunogenicity ELISA for the detection of antibodies to polyethylene glycol polymers. Journal of Pharmacological and Toxicological Methods, 2011. 64(3): p. 238-245.
41. Armstrong, J.K., et al., Antibody against poly(ethylene glycol) adversely affects PEG-asparaginase therapy in acute lymphoblastic leukemia patients. Cancer, 2007. 110(1): p. 103-11.
42. Wang, X., T. Ishida, and H. Kiwada, Anti-PEG IgM elicited by injection of liposomes is involved in the enhanced blood clearance of a subsequent dose of PEGylated liposomes. Journal of Controlled Release, 2007. 119(2): p. 236-244.
43. Tillmann, H., et al., 307 HIGH PREVALENCE OF PRE-EXISTING ANTIBODIES AGAINST POLYETHYLENE GLYCOL (PEG) IN HEPATITIS C (HCV) PATIENTS WHICH IS NOT ASSOCIATED WITH IMPAIRED RESPONSE TO PEG-INTERFERON. Journal of Hepatology. 52: p. S129.
180
44. Zhang, Y., H.F. Chan, and K.W. Leong, Advanced materials and processing for drug delivery: The past and the future. Advanced Drug Delivery Reviews, 2013. 65(1): p. 104-120.
45. Hoffman, A.S., The origins and evolution of “controlled” drug delivery systems. Journal of Controlled Release, 2008. 132(3): p. 153-163.
46. Reddy, K.R., Controlled-Release, Pegylation, Liposomal Formulations: New Mechanisms in the Delivery of Injectable Drugs. Annals of Pharmacotherapy, 2000. 34(7-8): p. 915-923.
47. Roy, S., Current status of NORPLANT subdermal implants for contraception, in Future Aspects in Contraception, B. Runnebaum, T. Rabe, and L. Kiesel, Editors. 1985, Springer Netherlands. p. 95-106.
48. Graesslin, O. and T. Korver, The contraceptive efficacy of Implanon®: A review of clinical trials and marketing experience. The European Journal of Contraception and Reproductive Health Care, 2008. 13(s1): p. 4-12.
49. Segers, V.F.M. and R.T. Lee, Local delivery of proteins and the use of self-assembling peptides. Drug Discovery Today, 2007. 12(13–14): p. 561-568.
50. Pisal, D.S., M.P. Kosloski, and S.V. Balu-Iyer, Delivery of therapeutic proteins. Journal of Pharmaceutical Sciences, 2010. 99(6): p. 2557-2575.
51. Wang, W., Protein aggregation and its inhibition in biopharmaceutics. International Journal of Pharmaceutics, 2005. 289(1-2): p. 1-30.
52. Makadia, H.K. and S.J. Siegel, Poly lactic-co-glycolic acid (PLGA) as biodegradable controlled drug delivery carrier. Polymers, 2011. 3(3): p. 1377-1397.
53. Yoon, S.J., et al., Reduction of inflammatory reaction of poly(d,l-lactic-co-glycolic Acid) using demineralized bone particles. Tissue Eng Part A, 2008. 14(4): p. 539-47.
54. Wu, F. and T. Jin, Polymer-Based Sustained-Release Dosage Forms for Protein Drugs, Challenges, and Recent Advances. AAPS PharmSciTech, 2008. 9(4): p. 1218-1229.
55. Danhier, F., et al., PLGA-based nanoparticles: An overview of biomedical applications. Journal of Controlled Release, 2012. 161(2): p. 505-522.
56. Anselmo, A.C. and S. Mitragotri, An overview of clinical and commercial impact of drug delivery systems. Journal of Controlled Release, 2014. 190(0): p. 15-28.
57. van de Weert, M., et al., Factors of importance for a successful delivery system for proteins. Expert Opinion on Drug Delivery, 2005. 2(6): p. 1029-1037.
58. Sandor, M., et al., Effect of protein molecular weight on release from micron-sized PLGA microspheres. Journal of Controlled Release, 2001. 76(3): p. 297-311.
59. Mundargi, R.C., et al., Nano/micro technologies for delivering macromolecular therapeutics using poly(d,l-lactide-co-glycolide) and its derivatives. Journal of Controlled Release, 2008. 125(3): p. 193-209.
60. Gu, H., et al., Controlled release of recombinant human nerve growth factor (rhNGF) from poly[(lactic acid)-co-(glycolic acid)] microspheres for the treatment of neurodegenerative disorders. Polymer International, 2007. 56(10): p. 1272-1280.
61. Sánchez, A., et al., Biodegradable micro- and nanoparticles as long-term delivery vehicles for interferon-alpha. European Journal of Pharmaceutical Sciences, 2003. 18(3–4): p. 221-229.
62. Kumar, P.S., et al., Influence of microencapsulation method and peptide loading on formulation of poly(lactide-co-glycolide) insulin nanoparticles. Pharmazie, 2006. 61(7): p. 613-7.
63. Jain, R.A., The manufacturing techniques of various drug loaded biodegradable poly(lactide-co-glycolide) (PLGA) devices. Biomaterials, 2000. 21(23): p. 2475-2490.
64. Iyer, S.S., W.H. Barr, and H.T. Karnes, Profiling in vitro drug release from subcutaneous implants: a review of current status and potential implications on drug product development. Biopharmaceutics & Drug Disposition, 2006. 27(4): p. 157-170.
65. Kaufmann, M., et al., Goserelin, a depot gonadotrophin-releasing hormone agonist in the treatment of premenopausal patients with metastatic breast cancer. German Zoladex Trial Group. Journal of Clinical Oncology, 1989. 7(8): p. 1113-9.
66. van de Weert, M., W. Hennink, and W. Jiskoot, Protein Instability in Poly(Lactic-co-Glycolic Acid) Microparticles. Pharmaceutical Research, 2000. 17(10): p. 1159-1167.
181
67. Anderson, J.M. and M.S. Shive, Biodegradation and biocompatibility of PLA and PLGA microspheres. Advanced Drug Delivery Reviews, 1997. 28(1): p. 5-24.
68. Kim, H.K. and T.G. Park, Microencapsulation of human growth hormone within biodegradable polyester microspheres: protein aggregation stability and incomplete release mechanism. Biotechnology and bioengineering, 1999. 65(6): p. 659-667.
69. Crotts, G. and T.G. Park, Protein delivery from poly (lactic-co-glycolic acid) biodegradable microspheres: release kinetics and stability issues. Journal of microencapsulation, 1998. 15(6): p. 699-713.
70. Fahy, E., et al., A comprehensive classification system for lipids. Journal of Lipid Research, 2005. 46(5): p. 839-862.
71. Walduck, A.K., et al., Biodegradable implants for the delivery of veterinary vaccines: design, manufacture and antibody responses in sheep. Journal of Controlled Release, 1998. 51(2-3): p. 269-280.
72. Reithmeier, H., J. Herrmann, and A. Gopferich, Lipid microparticles as a parenteral controlled release device for peptides. Journal of Controlled Release, 2001. 73(2-3): p. 339-350.
73. Wissing, S.A., O. Kayser, and R.H. Müller, Solid lipid nanoparticles for parenteral drug delivery. Advanced Drug Delivery Reviews, 2004. 56(9): p. 1257-1272.
74. Koennings, S., Lipid implants for controlled release of proteins. 2006. p. No pp. 75. Khan, M.Z.I., I.G. Tucker, and J.P. Opdebeeck, Cholesterol and lecithin implants for sustained
release of antigen: release and erosion in vitro, and antibody response in mice. International Journal of Pharmaceutics, 1991. 76(1-2): p. 161-170.
76. Guse, C., et al., Drug release from lipid-based implants: Elucidation of the underlying mass transport mechanisms. International Journal of Pharmaceutics, 2006. 314(2): p. 137-144.
77. Appel, B., et al., Lipidic implants for controlled release of bioactive insulin: Effects on cartilage engineered in vitro. International Journal of Pharmaceutics, 2006. 314(2): p. 170-178.
78. Schwab, M., et al., Studies on the lipase induced degradation of lipid based drug delivery systems. Journal of Controlled Release, 2009. 140(1): p. 27-33.
79. Mohl, S. and G. Winter, Continuous Release of rh-Interferon &agr;-2a from Triglyceride Implants: Storage Stability of the Dosage Forms. Pharmaceutical Development and Technology, 2006. 11(1): p. 103 - 110.
80. Sax, G. and G. Winter, Mechanistic studies on the release of lysozyme from twin-screw extruded lipid implants. Journal of Controlled Release, 2012. 163(2): p. 187-194.
81. Cortesi, R., et al., Production of lipospheres as carriers for bioactive compounds. Biomaterials, 2002. 23(11): p. 2283-94.
82. Reithmeier, H., J. Herrmann, and A. Göpferich, Development and characterization of lipid microparticles as a drug carrier for somatostatin. International Journal of Pharmaceutics, 2001. 218(1-2): p. 133-143.
83. Del Curto, M.D., et al., Lipid microparticles as sustained release system for a GnRH antagonist (Antide). J Control Release, 2003. 89(2): p. 297-310.
84. Müller, R.H., D. Rühl, and S.A. Runge, Biodegradation of solid lipid nanoparticles as a function of lipase incubation time. International Journal of Pharmaceutics, 1996. 144(1): p. 115-121.
85. Olbrich, C., O. Kayser, and R. Müller, Enzymatic Degradation of Dynasan 114 SLN – Effect of Surfactants and Particle Size. Journal of Nanoparticle Research, 2002. 4(1-2): p. 121-129.
86. Almeida, A.J. and E. Souto, Solid lipid nanoparticles as a drug delivery system for peptides and proteins. Advanced Drug Delivery Reviews, 2007. 59(6): p. 478-490.
87. Li, S., et al., Yak interferon-alpha loaded solid lipid nanoparticles for controlled release. Res Vet Sci, 2010. 88(1): p. 148-53.
88. Sax, G.L., Twin-screw extruded lipid implants for controlled drug delivery. 2012. 89. Kreye, F., F. Siepmann, and J. Siepmann, Lipid implants as drug delivery systems. Expert
Opinion on Drug Delivery, 2008. 5(3): p. 291-307. 90. Herrmann, S., Lipidic Implants for Pharmaceutical Proteins. 2007.
182
91. Mohl, S. and G. Winter, Continuous release of rh-interferon [alpha]-2a from triglyceride matrices. Journal of Controlled Release, 2004. 97(1): p. 67-78.
92. Herrmann, S., et al., New Insight into the Role of Polyethylene Glycol Acting as Protein Release Modifier in Lipidic Implants. Pharmaceutical Research, 2007. 24(8): p. 1527-1537.
93. Shulgin, I.L. and E. Ruckenstein, Preferential hydration and solubility of proteins in aqueous solutions of polyethylene glycol. Biophys Chem, 2006. 120(3): p. 188-98.
94. Atha, D.H. and K.C. Ingham, Mechanism of precipitation of proteins by polyethylene glycols. Analysis in terms of excluded volume. J Biol Chem, 1981. 256(23): p. 12108-17.
95. Schwab, M., et al., Correlation of in vivo and in vitro release data for rh-INF[alpha] lipid implants. European Journal of Pharmaceutics and Biopharmaceutics, 2008. 70(2): p. 690-694.
96. Siepmann, F., et al., A novel mathematical model quantifying drug release from lipid implants. Journal of Controlled Release, 2008. 128(3): p. 233-240.
97. Herrmann, S., et al., Mechanisms controlling protein release from lipidic implants: Effects of PEG addition. Journal of Controlled Release, 2007. 118(2): p. 161-168.
98. Brandl, M., Vesicular Phospholipid Gels. 2009. p. 205-212. 99. Brandl, M., Vesicular Phospholipid Gels: A Technology Platform. Journal of Liposome Research,
2007. 17(1): p. 15 - 26. 100. Massing, U., S. Cicko, and V. Ziroli, Dual asymmetric centrifugation (DAC)--A new technique for
liposome preparation. Journal of Controlled Release, 2008. 125(1): p. 16-24. 101. Moog, et al., Change in pharmacokinetic and pharmacodynamic behavior of gemcitabine in
human tumor xenografts upon entrapment in vesicular phospholipid gels. Cancer Chemotherapy and Pharmacology, 2002. 49(5): p. 356-366.
102. Güthlein, F., et al., Pharmacokinetics and antitumor activity of vincristine entrapped in vesicular phospholipid gels. Anti-Cancer Drugs, 2002. 13(8): p. 797-805.
103. Grohganz, H., I. Tho, and M. Brandl, Development and in vitro evaluation of a liposome based implant formulation for the decapeptide cetrorelix. European Journal of Pharmaceutics and Biopharmaceutics, 2005. 59(3): p. 439-448.
104. Tardi, C., M. Brandl, and R. Schubert, Erosion and controlled release properties of semisolid vesicular phospholipid dispersions. Journal of Controlled Release, 1998. 55(2-3): p. 261-270.
105. Tian, W., The Development of Sustained Release Formulation for Pharmaceutical Proteins based on Vesicular Phospholipid Gels. 2010.
106. Tian, W., et al., Vesicular phospholipid gel-based depot formulations for pharmaceutical proteins: Development and in vitro evaluation. Journal of Controlled Release, 2010. 142(3): p. 319-325.
107. Collier, J.H. and P.B. Messersmith, Phospholipid strategies in biomineralization and biomaterials research. Annual Review of Materials Research, 2001. 31(1): p. 237-263.
108. van Rooijen, N. and R. van Nieuwmegen, Liposomes in Immunology: Multilamellar Phosphatidylcholine Liposomes as a Simple, Biodegradable and Harmless Adjuvant Without any Immunogenic Activity of its own. Immunological Investigations, 1980. 9(3): p. 243-256.
109. van Rooijen, N. and R. van Nieuwmegen, [6] Use of liposomes as biodegradable and harmless adjuvants, in Methods in Enzymology, H.V.V. John J. Langone, Editor. 1983, Academic Press. p. 83-95.
110. Mufamadi, M.S., et al., A review on composite liposomal technologies for specialized drug delivery. J Drug Deliv, 2011. 2011: p. 939851.
111. Müller, R.H., K. Mäder, and S. Gohla, Solid lipid nanoparticles (SLN) for controlled drug delivery – a review of the state of the art. European Journal of Pharmaceutics and Biopharmaceutics, 2000. 50(1): p. 161-177.
112. Vogelhuber, W., et al., Monolithic Triglyceride Matrices: A Controlled-Release System for Proteins. Pharmaceutical Development and Technology, 2003. 8(1): p. 71 - 79.
113. Sax, G., et al., In-vivo biodegradation of extruded lipid implants in rabbits. Journal of Controlled Release, 2012. 163(2): p. 195-202.
183
114. Oliveira, A.C., et al., Arc Repressor will not Denature Under Pressure in the Absence of Water. Journal of Molecular Biology, 1994. 240(3): p. 184-187.
115. Maschke, A., et al., Lipids: An Alternative Material for Protein and Peptide Release, in Carrier-Based Drug Delivery. 2004, American Chemical Society. p. 176-196.
116. Maschke, A., et al., Development of a spray congealing process for the preparation of insulin-loaded lipid microparticles and characterization thereof. European Journal of Pharmaceutics and Biopharmaceutics, 2007. 65(2): p. 175-187.
117. Smith, L., P. Fantozzlb, and R. Crevelinga, Study of triglyceride- protein interaction using a microemulsion- filtration method. Journal of the American Oil Chemists’ Society, 1983. 60(5): p. 960-967.
118. Fernandez-Lafuente, R., et al., Immobilization of lipases by selective adsorption on hydrophobic supports. Chemistry and Physics of Lipids, 1998. 93(1–2): p. 185-197.
119. Damodaran, S., Food proteins and their applications. Vol. 80. 1997: CRC Press. 120. Gualbert, J., P. Shahgaldian, and A.W. Coleman, Interactions of amphiphilic calix[4]arene-based
Solid Lipid Nanoparticles with bovine serum albumin. International Journal of Pharmaceutics, 2003. 257(1–2): p. 69-73.
121. Cavalli, R., et al., Albumin adsorption on stealth and non-stealth solid lipid nanoparticles. STP pharma sciences, 1999. 9(2): p. 183-189.
122. Garcia-Fuentes, M., D. Torres, and M.J. Alonso, New surface-modified lipid nanoparticles as delivery vehicles for salmon calcitonin. International Journal of Pharmaceutics, 2005. 296(1–2): p. 122-132.
123. Seddon, A.M., P. Curnow, and P.J. Booth, Membrane proteins, lipids and detergents: not just a soap opera. Biochimica et Biophysica Acta (BBA) - Biomembranes, 2004. 1666(1–2): p. 105-117.
124. Lee, A.G., Lipid–protein interactions in biological membranes: a structural perspective. Biochimica et Biophysica Acta (BBA) - Biomembranes, 2003. 1612(1): p. 1-40.
125. Kobayashi, T., F. Gu, and J. Gruenberg, Lipids, lipid domains and lipid–protein interactions in endocytic membrane traffic. Seminars in Cell & Developmental Biology, 1998. 9(5): p. 517-526.
126. Haberkant, P. and G. van Meer, Protein-lipid interactions: paparazzi hunting for snap-shots, in Biological Chemistry. 2009. p. 795.
127. Jensen, M.Ø. and O.G. Mouritsen, Lipids do influence protein function—the hydrophobic matching hypothesis revisited. Biochimica et Biophysica Acta (BBA) - Biomembranes, 2004. 1666(1–2): p. 205-226.
128. Collins, D. and Y. Cha, Interaction of Recombinant Granulocyte Colony Stimulating Factor with Lipid Membranes: Enhanced Stability of a Water-Soluble Protein after Membrane Insertion. Biochemistry, 1994. 33(15): p. 4521-4526.
129. Ishihara, H., et al., Interaction of recombinant human interferon-gamma with liposomes. Chem Pharm Bull (Tokyo), 1991. 39(6): p. 1536-9.
130. Hwang, S., et al., Remote loading of diclofenac, insulin and fluorescein isothiocyanate labeled insulin into liposomes by pH and acetate gradient methods. International Journal of Pharmaceutics, 1999. 179(1): p. 85-95.
131. Kirby, C. and G. Gregoriadis, Preparation of liposomes containing factor VII for oral treatment of hemophilia. J Microencapsul, 1984. 1: p. 33 - 45.
132. Colletier, J.-P., et al., Protein encapsulation in liposomes: efficiency depends on interactions between protein and phospholipid bilayer. BMC Biotechnology, 2002. 2(1): p. 9.
133. Bergers, J., et al., Interleukin-2-Containing Liposomes: Interaction of Interleukin-2 with Liposomal Bilayers and Preliminary Studies on Application in Cancer Vaccines. Pharmaceutical Research, 1993. 10(12): p. 1715-1721.
134. Kanaoka, E., S. Nagata, and K. Hirano, Stabilization of aerosolized IFN-γ by liposomes. International Journal of Pharmaceutics, 1999. 188(2): p. 165-172.
184
135. Hernández-Caselles, T., J. Villalaín, and J. Gómez-Fernández, Influence of liposome charge and composition on their interaction with human blood serum proteins. Molecular and Cellular Biochemistry, 1993. 120(2): p. 119-126.
136. Bonté, F. and R.L. Juliano, Interactions of liposomes with serum proteins. Chemistry and Physics of Lipids, 1986. 40(2–4): p. 359-372.
137. Semple, S.C., A. Chonn, and P.R. Cullis, Interactions of liposomes and lipid-based carrier systems with blood proteins: Relation to clearance behaviour in vivo. Advanced Drug Delivery Reviews, 1998. 32(1–2): p. 3-17.
138. Eldem, T., P. Speiser, and A. Hincal, Optimization of Spray-Dried and -Congealed Lipid Micropellets and Characterization of Their Surface Morphology by Scanning Electron Microscopy. Pharmaceutical Research, 1991. 8(1): p. 47-54.
139. Grit, M., et al., Hydrolysis of phosphatidylcholine in aqueous liposome dispersions. International Journal of Pharmaceutics, 1989. 50(1): p. 1-6.
140. Allen Zhang, J.-a. and J. Pawelchak, Effect of pH, ionic strength and oxygen burden on the chemical stability of EPC/cholesterol liposomes under accelerated conditions: Part 1: Lipid hydrolysis. European Journal of Pharmaceutics and Biopharmaceutics, 2000. 50(3): p. 357-364.
141. Isaacs, A. and J. Lindenmann, Virus Interference. I. The Interferon. Proceedings of the Royal Society of London. Series B - Biological Sciences, 1957. 147(927): p. 258-267.
142. Vilcek, J. and M. Feldmann, Historical review: Cytokines as therapeutics and targets of therapeutics. Trends in Pharmacological Sciences, 2004. 25(4): p. 201-209.
143. van Boxel-Dezaire, A.H.H., M.R.S. Rani, and G.R. Stark, Complex Modulation of Cell Type-Specific Signaling in Response to Type I Interferons. Immunity, 2006. 25(3): p. 361-372.
144. Pestka, S., C.D. Krause, and M.R. Walter, Interferons, interferon-like cytokines, and their receptors. Immunological Reviews, 2004. 202(1): p. 8-32.
145. Lipiäinen, T., et al., Formulation and Stability of Cytokine Therapeutics. Journal of Pharmaceutical Sciences, 2015. 104(2): p. 307-326.
146. Vilcek, J., Fifty Years of Interferon Research: Aiming at a Moving Target. Immunity, 2006. 25(3): p. 343-348.
147. Sandberg-Wollheim, M., Interferon-β1a treatment for multiple sclerosis. Expert Review of Neurotherapeutics, 2005. 5(1): p. 25-34.
148. FDA Documents Avonex. FDA AVONEX®(Interferon beta-1a) ]. Available from: http://www.fda.gov/downloads/Drugs/DevelopmentApprovalProcess/HowDrugsareDevelopedandApproved/ApprovalApplications/TherapeuticBiologicApplications/ucm086064.pdf.
149. Hu, X., et al., A novel PEGylated interferon beta-1a for multiple sclerosis: safety, pharmacology, and biology. J Clin Pharmacol, 2012. 52(6): p. 798-808.
150. EMA Documents Plegridy. EMA - Annex I - Summary of product characteristic]. Available from: http://www.ema.europa.eu/docs/en_GB/document_library/EPAR_-_Product_Information/human/002827/WC500170302.pdf.
151. Dhib-Jalbut, S. and S. Marks, Interferon-β mechanisms of action in multiple sclerosis. Neurology, 2010. 74(1 Supplement 1): p. S17-S24.
152. Lin, L., M. Kunitani, and M. Hora, Interferon-β-1b (Betaseron®): A Model for Hydrophobic Therapeutic Proteins, in Formulation, Characterization, and Stability of Protein Drugs, R. Pearlman and Y.J. Wang, Editors. 2002, Springer US. p. 275-301.
153. EMA. EMA - Betaferon -SCIENTIFIC DISCUSSION. 2003 [cited 2014; Available from: http://www.ema.europa.eu/docs/en_GB/document_library/EPAR_-_Scientific_Discussion/human/000081/WC500053087.pdf.
154. Walsh, G., Biopharmaceutical benchmarks 2010. Nat Biotech, 2010. 28(9): p. 917-924. 155. JOHN GEIGERT, B.M.P., STANLEY FONG, HOLLY N. HUSTON, DANA E. WONG, DAVID Y. WONG,
CAROL TAFORO, MARK PEMBERTON, The Long-Term Stability of Recombinant (Serine-17) Human Interferon-β. Journal of Interferon Research, 1988. 8: p. 539-547.
185
156. Runkel, L., et al., Structural and Functional Differences Between Glycosylated and Non-glycosylated Forms of Human Interferon-β (IFN-β). Pharmaceutical Research, 1998. 15(4): p. 641-649.
157. Hershenson, S. and T. J., Isoelectric focusing of recombinant interferon-beta. Appl Theor Electrophor., 1989. 1.
158. Shaked, Z., et al., Formulation processes for pharmaceutical compositions of recombinant β. 1993, Google Patents.
159. Russell-Harde, D., M. Knauf, and E. Croze, The use of Zwittergent 3-14 in the purification of recombinant human interferon-beta Ser17 (Betaseron). J Interferon Cytokine Res, 1995. 15(1): p. 31-7.
160. Basu, A., et al., Structure−Function Engineering of Interferon-β-1b for Improving Stability, Solubility, Potency, Immunogenicity, and Pharmacokinetic Properties by Site-Selective Mono-PEGylation. Bioconjugate Chemistry, 2006. 17(3): p. 618-630.
161. Tarelli, E., et al., Recombinant Human Albumin as a Stabilizer for Biological Materials and for the Preparation of International Reference Reagents. Biologicals, 1998. 26(4): p. 331-346.
162. Braun, A., et al., Protein Aggregates Seem to Play a Key Role Among the Parameters Influencing the Antigenicity of Interferon Alpha (IFN-α) in Normal and Transgenic Mice. Pharmaceutical Research, 1997. 14(10): p. 1472-1478.
163. Hawe, A. and W. Frieß, Formulation Development for Hydrophobic Therapeutic Proteins. Pharmaceutical Development and Technology, 2007. 12(3): p. 223-237.
164. Schwab, M., Degradation of lipid based drug delivery systems and characterization of semi-synthetic spider silk proteins for the application in pharmaceutical technology. 2009.
165. Mohl, S., The development of a sustained and controlled release device for pharmaceutical proteins based on lipid implants. 2004, lmu.
166. Greenwald, R.B., et al., Effective drug delivery by PEGylated drug conjugates. Advanced Drug Delivery Reviews, 2003. 55(2): p. 217-250.
167. Wang, W., Lyophilization and development of solid protein pharmaceuticals. International Journal of Pharmaceutics, 2000. 203(1–2): p. 1-60.
168. Schulze, S. and G. Winter, Lipid extrudates as novel sustained release systems for pharmaceutical proteins. Journal of Controlled Release, 2009. 134(3): p. 177-185.
169. Hu, X., et al., In Vivo Pharmacology and Toxicology Evaluation of Polyethylene Glycol-Conjugated Interferon β-1a. Journal of Pharmacology and Experimental Therapeutics, 2011. 338(3): p. 984-996.
170. Deo, N. and P. Somasundaran, Effects of Sodium Dodecyl Sulfate on Mixed Liposome Solubilization. Langmuir, 2003. 19(18): p. 7271-7275.
171. van de Weert, M., et al., Fourier Transform Infrared Spectrometric Analysis of Protein Conformation: Effect of Sampling Method and Stress Factors. Analytical Biochemistry, 2001. 297(2): p. 160-169.
172. Kaiser, N., et al., 5-Fluorouracil in vesicular phospholipid gels for anticancer treatment: entrapment and release properties. International Journal of Pharmaceutics, 2003. 256(1-2): p. 123-131.
173. Qi, N., et al., Sustained delivery of cytarabine-loaded vesicular phospholipid gels for treatment of xenografted glioma. Int J Pharm, 2014. 472(1-2): p. 48-55.
174. Franks, F., Freeze-drying of bioproducts: putting principles into practice. European Journal of Pharmaceutics and Biopharmaceutics, 1998. 45(3): p. 221-229.
175. Shirley, B.A., et al., HSA-free formulations of interferon-Beta. 2012, Google Patents. 176. McCaman, M., S. Ottoboni, and E. Pungor, Human interferon-beta formulations. 2005, Google
Patents. 177. Hawe, A. and W. Friess, Development of HSA-free formulations for a hydrophobic cytokine with
improved stability. European Journal of Pharmaceutics and Biopharmaceutics, 2008. 68(2): p. 169-182.
186
178. Shalaev, E.Y., et al., Acid-catalyzed inversion of sucrose in the amorphous state at very low levels of residual water. Pharm Res, 2000. 17(3): p. 366-70.
179. Schersch, K.B., Effect of collapse on pharmaceutical protein lyophilizates. 2009. 180. Bosch, T., Aggressive Freeze-Drying. 2014. 181. Jiskoot, W. and D. Crommelin, Methods for structural analysis of protein pharmaceuticals. Vol.
3. 2005: Springer. 182. Yang, T.-H., et al., Use of infrared spectroscopy to assess secondary structure of human growth
hormone within biodegradable microspheres. Journal of Pharmaceutical Sciences, 1999. 88(2): p. 161-165.
183. Levy, G., J.R. Leonards, and J.A. Procknal, Development of in vitro dissolution tests which correlate quantitatively with dissolution rate‐limited drug absorption in man. Journal of Pharmaceutical Sciences, 1965. 54(12): p. 1719-1722.
184. Vogelhuber, W., et al., Monolithic glyceryl trimyristate matrices for parenteral drug release applications. European Journal of Pharmaceutics and Biopharmaceutics, 2003. 55(1): p. 133-138.
185. Utsumi, J., et al., Stability of human interferon-ß1: oligomeric human interferon-ß1 is inactive but is reactivated by monomerization. Biochimica et Biophysica Acta (BBA) - Protein Structure and Molecular Enzymology, 1989. 998(2): p. 167-172.
186. Klaus, A., Solubility of triglycerides in water using an extended surfactant. 2011. 187. Tungsubutra, T., Solubilization-emulsification processes in nonionic surfactant-water-liquid
triglyceride systems. 1994, PhD Thesis, Rice University, Houston, Texas. 188. Koennings, S., et al., In vitro investigation of lipid implants as a controlled release system for
interleukin-18. International Journal of Pharmaceutics, 2006. 314(2): p. 145-152. 189. Hawe, A. and W. Friess, Stabilization of a hydrophobic recombinant cytokine by human serum
albumin. Journal of Pharmaceutical Sciences, 2007. 96(11): p. 2987-2999. 190. Daly, S.M., T.M. Przybycien, and R.D. Tilton, Adsorption of poly(ethylene glycol)-modified
ribonuclease A to a poly(lactide-co-glycolide) surface. Biotechnology and Bioengineering, 2005. 90(7): p. 856-868.
191. Diwan, M. and T.G. Park, Stabilization of recombinant interferon-α by pegylation for encapsulation in PLGA microspheres. International Journal of Pharmaceutics, 2003. 252(1–2): p. 111-122.
192. Hinds, K.D., et al., PEGylated insulin in PLGA microparticles. In vivo and in vitro analysis. Journal of Controlled Release, 2005. 104(3): p. 447-460.
193. Diwan, M. and T.G. Park, Pegylation enhances protein stability during encapsulation in PLGA microspheres. J Control Release, 2001. 73(2-3): p. 233-44.
194. Vyas, S.P., et al., Pegylated protein encapsulated multivesicular liposomes: a novel approach for sustained release of interferon alpha. Drug Dev Ind Pharm, 2006. 32(6): p. 699-707.
195. Zhou, Z., et al., Comparison of Site-Specific PEGylations of the N-Terminus of Interferon Beta-1b: Selectivity, Efficiency, and in Vivo/Vitro Activity. Bioconjugate Chemistry, 2013. 25(1): p. 138-146.
196. Veronese, F.M., et al., Site-Specific Pegylation of G-CSF by Reversible Denaturation. Bioconjugate Chemistry, 2007. 18(6): p. 1824-1830.
197. Gokarn, Y.R., M. McLean, and T.M. Laue, Effect of PEGylation on protein hydrodynamics. Mol Pharm, 2012. 9(4): p. 762-73.
198. Dong, A., et al., Infrared spectroscopic studies of lyophilization- and temperature-induced protein aggregation. Journal of Pharmaceutical Sciences, 1995. 84(4): p. 415-424.
199. Ahmed, B., et al., Challenges for PEGylated Proteins and Alternative Half-Life Extension Technologies Based on Biodegradable Polymers, in Tailored Polymer Architectures for Pharmaceutical and Biomedical Applications. 2013, American Chemical Society. p. 215-233.
200. Bhatnagar, B.S., et al., Investigation of PEG crystallization in frozen and freeze-dried PEGylated recombinant human growth hormone–sucrose systems: Implications on storage stability. Journal of Pharmaceutical Sciences, 2011. 100(8): p. 3062-3075.
187
201. Heller, M.C., J.F. Carpenter, and T.W. Randolph, Conformational stability of lyophilized PEGylated proteins in a phase-separating system. Journal of Pharmaceutical Sciences, 1999. 88(1): p. 58-64.
202. Mi, Y. and G. Wood, The application and mechanisms of polyethylene glycol 8000 on stabilizing lactate dehydrogenase during lyophilization. PDA journal of pharmaceutical science and technology / PDA, 2004. 58(4): p. 192-202.
203. Mosharraf, M., M. Malmberg, and J. Fransson, Formulation, lyophilization and solid-state properties of a pegylated protein. International Journal of Pharmaceutics, 2007. 336(2): p. 215-232.
204. Kumar, V. and D.S. Kalonia, Removal of peroxides in polyethylene glycols by vacuum drying: implications in the stability of biotech and pharmaceutical formulations. Aaps Pharmscitech, 2006. 7(3): p. E47-E53.
205. Nichols, M.D., E.A. Scott, and D.L. Elbert, Factors affecting size and swelling of poly(ethylene glycol) microspheres formed in aqueous sodium sulfate solutions without surfactants. Biomaterials, 2009. 30(29): p. 5283-91.
206. Park, B.-D. and Y.-S. Lee, The effect of PEG groups on swelling properties of PEG-grafted-polystyrene resins in various solvents. Reactive and Functional Polymers, 2000. 44(1): p. 41-46.
207. Braude, I.A. and E. De Clercq, Mechanism of interaction of sodium dodecyl sulfate with mouse interferon. J Biol Chem, 1979. 254(16): p. 7758-64.
208. Bosserhoff, A., J. Wallach, and R.W. Frank, Micropreparative separation of peptides derived from sodium dodecyl sulphate-solubilized proteins. J Chromatogr, 1989. 473(1): p. 71-7.
209. Gracevydac. The Handbook of Analysis and Purification ofPeptides and Proteins by Reversed-Phase HPLC. 2002 25.11.2014]; Available from: http://wolfson.huji.ac.il/purification/PDF/ReversePhase/VYDAChandbookRPC.pdf.
210. Negre-Salvayre, A., et al., Advanced lipid peroxidation end products in oxidative damage to proteins. Potential role in diseases and therapeutic prospects for the inhibitors. British Journal of Pharmacology, 2008. 153(1): p. 6-20.
211. Wills, E.D., Effect of unsaturated fatty acids and their peroxides on enzymes. Biochemical Pharmacology, 1961. 7(1): p. 7-16.
212. Litwinienko, G., A. Daniluk, and T. Kasprzycka-Guttman, A differential scanning calorimetry study on the oxidation of C12-C18 saturated fatty acids and their esters. Journal of the American Oil Chemists' Society, 1999. 76(6): p. 655-657.
213. Higuchi, T., Physical chemical analysis of percutaneous absorption process from creams and ointments. J. Soc. Cosmet. Chem, 1960. 11: p. 85-97.
214. Norde, W., et al., Protein adsorption at solid-liquid interfaces: Reversibility and conformation aspects. Journal of Colloid and Interface Science, 1986. 112(2): p. 447-456.
215. Lo, Y.-L. and Y.-E. Rahman, Protein location in liposomes, a drug carrier: A prediction by differential scanning calorimetry. Journal of Pharmaceutical Sciences, 1995. 84(7): p. 805-814.
216. Koppenhagen, F.J., et al., Interaction of recombinant interleukin-2 with liposomal bilayers. Journal of Pharmaceutical Sciences, 1998. 87(6): p. 707-714.
217. Jorgensen, L., et al., Protein adsorption and displacement at lipid layers determined by total internal reflection fluorescence (TIRF). Journal of Liposome Research, 2009. 19(2): p. 99-104.
218. Al Kayal, T., et al., Lysozyme interaction with negatively charged lipid bilayers: protein aggregation and membrane fusion. Soft Matter, 2012. 8(16): p. 4524-4534.
219. Saliba, A.-E., et al., A quantitative liposome microarray to systematically characterize protein-lipid interactions. Nat Meth, 2014. 11(1): p. 47-50.
220. Xia, Y., J. Sun, and D. Liang, Aggregation, Fusion, and Leakage of Liposomes Induced by Peptides. Langmuir, 2014. 30(25): p. 7334-7342.
221. Cornell, D.G. and D.L. Patterson, Interaction of phospholipids in monolayers with .beta.-lactoglobulin adsorbed from solution. Journal of Agricultural and Food Chemistry, 1989. 37(6): p. 1455-1459.

188
222. Maget-Dana, R., The monolayer technique: a potent tool for studying the interfacial properties of antimicrobial and membrane-lytic peptides and their interactions with lipid membranes. Biochimica et Biophysica Acta (BBA) - Biomembranes, 1999. 1462(1–2): p. 109-140.
223. A. Bos, M. and T. van Vliet, Interfacial rheological properties of adsorbed protein layers and surfactants: a review. Advances in Colloid and Interface Science, 2001. 91(3): p. 437-471.
224. Moghaddam, B., et al., The application of monolayer studies in the understanding of liposomal formulations. International Journal of Pharmaceutics, 2011. 417(1–2): p. 235-244.
225. Cooper, M.A. and V.T. Singleton, A survey of the 2001 to 2005 quartz crystal microbalance biosensor literature: applications of acoustic physics to the analysis of biomolecular interactions. Journal of Molecular Recognition, 2007. 20(3): p. 154-184.
226. O’Sullivan, C.K. and G.G. Guilbault, Commercial quartz crystal microbalances – theory and applications. Biosensors and Bioelectronics, 1999. 14(8–9): p. 663-670.
227. Sauerbrey, G., Verwendung von Schwingquarzen zur Wägung dünner Schichten und zur Mikrowägung. Zeitschrift für Physik, 1959. 155(2): p. 206-222.
228. Keiji Kanazawa, K. and J.G. Gordon Ii, The oscillation frequency of a quartz resonator in contact with liquid. Analytica Chimica Acta, 1985. 175(0): p. 99-105.
229. Dixit, N., K.M. Maloney, and D.S. Kalonia, Application of quartz crystal microbalance to study the impact of pH and ionic strength on protein–silicone oil interactions. International Journal of Pharmaceutics, 2011. 412(1–2): p. 20-27.
230. Härtl, E., et al., Weak antibody–cyclodextrin interactions determined by quartz crystal microbalance and dynamic/static light scattering. European Journal of Pharmaceutics and Biopharmaceutics, 2013. 85(3, Part A): p. 781-789.
231. Galli Marxer, C., M. Collaud Coen, and L. Schlapbach, Study of adsorption and viscoelastic properties of proteins with a quartz crystal microbalance by measuring the oscillation amplitude. Journal of Colloid and Interface Science, 2003. 261(2): p. 291-298.
232. Briseno, A.L., et al., Studies of potential-dependent metallothionein adsorptions using a low-volume electrochemical quartz crystal microbalance flow cell. Journal of Electroanalytical Chemistry, 2001. 513(1): p. 16-24.
233. Zhou, A. and J. Muthuswamy, Acoustic biosensor for monitoring antibody immobilization and neurotransmitter GABA in real-time. Sensors and Actuators B: Chemical, 2004. 101(1): p. 8-19.
234. Sai, V.V.R., et al., Immobilization of Antibodies on Polyaniline Films and Its Application in a Piezoelectric Immunosensor. Analytical Chemistry, 2006. 78(24): p. 8368-8373.
235. Aguiar, F.A., A.R. Moraes de Oliveira, and C. Masetto de Gaitani, Development, validation, and application of a capillary electrophoresis method for analysis of cytokine interferon alpha-2a in pharmaceutical formulations. Analytical Methods, 2013. 5(19): p. 5215-5221.
236. Rezwan, K., L.P. Meier, and L.J. Gauckler, A Prediction Method for the Isoelectric Point of Binary Protein Mixtures of Bovine Serum Albumin and Lysozyme Adsorbed on Colloidal Titania and Alumina Particles. Langmuir, 2005. 21(8): p. 3493-3497.
237. Green, R.J., et al., The Interaction between SDS and Lysozyme at the Hydrophilic Solid−Water Interface. The Journal of Physical Chemistry B, 2001. 105(8): p. 1594-1602.
238. Daly, S.M., T.M. Przybycien, and R.D. Tilton, Adsorption of poly (ethylene glycol)-modified lysozyme to silica. Langmuir, 2005. 21(4): p. 1328-1337.
239. Nezu, T., et al., Effect of pH and addition of salt on the adsorption behavior of lysozyme on gold, silica, and titania surfaces observed by quartz crystal microbalance with dissipation monitoring. Dent Mater J, 2008. 27(4): p. 573-80.
240. Glomset, J.A., Protein–lipid interactions on the surfaces of cell membranes. Current Opinion in Structural Biology, 1999. 9: p. 425–427.
241. Marsh, D. and T. Páli, The protein–lipid interface: perspectives from magnetic resonance and crystal structures. Biochimica et Biophysica Acta (BBA) - Biomembranes, 2004. 1666(1–2): p. 118-141.
189
242. Chonn, A., S.C. Semple, and P.R. Cullis, Association of blood proteins with large unilamellar liposomes in vivo. Relation to circulation lifetimes. Journal of Biological Chemistry, 1992. 267(26): p. 18759-18765.
243. de Planque, M.R.R. and J.A. Killian*, Protein–lipid interactions studied with designed transmembrane peptides: role of hydrophobic matching and interfacial anchoring (Review). Molecular Membrane Biology, 2003. 20(4): p. 271-284.
244. Castellana, E.T. and P.S. Cremer, Solid supported lipid bilayers: From biophysical studies to sensor design. Surface Science Reports, 2006. 61(10): p. 429-444.
245. Brockman, H., Lipid monolayers: why use half a membrane to characterize protein-membrane interactions? Current Opinion in Structural Biology, 1999. 9(4): p. 438-443.
246. Verger, R. and F. Pattus, Lipid-protein interactions in monolayers. Chemistry and Physics of Lipids, 1982. 30(2–3): p. 189-227.
247. Zhao, H. and P. Lappalainen, A simple guide to biochemical approaches for analyzing protein–lipid interactions. Molecular Biology of the Cell, 2012. 23(15): p. 2823-2830.
248. Diederichs, J.E., Plasma protein adsorption patterns on liposomes: establishment of analytical procedure. Electrophoresis, 1996. 17(3): p. 607-11.
249. Dimitrova, M.N. and H. Matsumura, Protein-induced leakage and membrane destabilization of phosphatidylcholine and phosphatidylserine liposomes. Colloids and Surfaces B: Biointerfaces, 1997. 8(6): p. 287-294.
250. Walker, A.G. and M.G. Rumsby, The induction of liposome aggregation by myelin basic protein. Neurochemistry International, 1985. 7(3): p. 441-447.
251. Blackwood, R. and J. Ernst, Characterization of Ca2 (+)-dependent phospholipid binding, vesicle aggregation and membrane fusion by annexins. Biochem. j, 1990. 266: p. 195-200.
252. Tsui, F.C., D.M. Ojcius, and W.L. Hubbell, The intrinsic pKa values for phosphatidylserine and phosphatidylethanolamine in phosphatidylcholine host bilayers. Biophysical Journal, 1986. 49(2): p. 459-468.
253. Demel, R.A., et al., Nisin Z, Mutant Nisin Z and Lacticin 481 Interactions with Anionic Lipids Correlate with Antimicrobial Activity. European Journal of Biochemistry, 1996. 235(1-2): p. 267-274.
254. Farkas, E., R. Schubert, and R. Zelkó, Effect of [beta]-sitosterol concentration and high pressure homogenization on the chlorhexidine release from vesicular gels. International Journal of Pharmaceutics, 2006. 307(1): p. 51-55.
255. Johnston, J.H., The Surface Tension of Protein Solutions. Part III. Biochemical Journal, 1927. 21(6): p. 1314-1328.
256. Neurath, H. and H.B. Bull, The Surface Activity of Proteins. Chemical Reviews, 1938. 23(3): p. 391-435.
257. Sundaram, S., et al., Surface Phase Behavior and Surface Tension Evolution for Lysozyme Adsorption onto Clean Interfaces and into DPPC Monolayers: Theory and Experiment. Langmuir, 1998. 14(5): p. 1208-1218.
258. Macritchie, F., Proteins at Interfaces, in Advances in Protein Chemistry, J.T.E. C.B. Anfinsen and M.R. Frederic, Editors. 1978, Academic Press. p. 283-326.
259. Magdassi, S., A. Kamyshny, and S. Magdassi, Surface activity and functional properties of proteins. 1996, Marcel Dekker, New York.
260. Fee, C.J. and J.M. Van Alstine, PEG-proteins: reaction engineering and separation issues. Chemical engineering science, 2006. 61(3): p. 924-939.
261. Cuypers, P.A., et al., The adsorption of prothrombin to phosphatidylserine multilayers quantitated by ellipsometry. Journal of Biological Chemistry, 1983. 258(4): p. 2426-2431.
262. Hendrickson, H.S., et al., The effect of a phase transition on penetration of phospholipid monolayers by melittin and glucagon. Archives of Biochemistry and Biophysics, 1983. 227(1): p. 242-247.
190
263. Ebara, Y. and Y. Okahata, In situ surface-detecting technique by using a quartz-crystal microbalance. Interaction behaviors of proteins onto a phospholipid monolayer at the air-water interface. Langmuir, 1993. 9(2): p. 574-576.
264. Clifton, L.A., et al., The role of protein hydrophobicity in thionin-phospholipid interactions: a comparison of [small alpha]1 and [small alpha]2-purothionin adsorbed anionic phospholipid monolayers. Physical Chemistry Chemical Physics, 2012. 14(39): p. 13569-13579.
265. Stepniewski, M., et al., Study of PEGylated Lipid Layers as a Model for PEGylated Liposome Surfaces: Molecular Dynamics Simulation and Langmuir Monolayer Studies. Langmuir, 2011. 27(12): p. 7788-7798.
266. Winterhalter, M., et al., Interaction of poly(ethylene-glycols) with air-water interfaces and lipid monolayers: investigations on surface pressure and surface potential. Biophys J, 1995. 69(4): p. 1372-81.
267. Du, H., P. Chandaroy, and S.W. Hui, Grafted poly-(ethylene glycol) on lipid surfaces inhibits protein adsorption and cell adhesion. Biochimica et Biophysica Acta (BBA) - Biomembranes, 1997. 1326(2): p. 236-248.
268. Chiu, G.N., M.B. Bally, and L.D. Mayer, Selective protein interactions with phosphatidylserine containing liposomes alter the steric stabilization properties of poly(ethylene glycol). Biochim Biophys Acta, 2001. 1510(1-2): p. 56-69.
269. Price, M.E., R.M. Cornelius, and J.L. Brash, Protein adsorption to polyethylene glycol modified liposomes from fibrinogen solution and from plasma. Biochimica et Biophysica Acta (BBA) - Biomembranes, 2001. 1512(2): p. 191-205.
270. Buijs, J., et al., Conformational Stability of Adsorbed Insulin Studied with Mass Spectrometry and Hydrogen Exchange. Analytical Chemistry, 1999. 71(15): p. 3219-3225.
271. Bunjes, H. and M.H.J. Koch, Saturated phospholipids promote crystallization but slow down polymorphic transitions in triglyceride nanoparticles. Journal of Controlled Release, 2005. 107(2): p. 229-243.
272. Rawicz, W., et al., Effect of chain length and unsaturation on elasticity of lipid bilayers. Biophysical Journal, 2000. 79(1): p. 328-339.
273. Sandelin, E., On Hydrophobicity and Conformational Specificity in Proteins. Biophysical Journal, 2004. 86(1): p. 23-30.
274. Cumper, C. and A. Alexander, The surface chemistry of proteins. Transactions of the Faraday Society, 1950. 46: p. 235-253.
275. Kuhl, T., et al., Direct Measurement of Polyethylene Glycol Induced Depletion Attraction between Lipid Bilayers. Langmuir, 1996. 12(12): p. 3003-3014.
276. Zölls, S., et al., How subvisible particles become invisible—relevance of the refractive index for protein particle analysis. Journal of Pharmaceutical Sciences, 2013. 102(5): p. 1434-1446.
277. McCormack, F.X., et al., Alanine Mutagenesis of Surfactant Protein A Reveals That Lipid Binding and pH-Dependent Liposome Aggregation Are Mediated by the Carbohydrate Recognition Domain. Biochemistry, 1997. 36(45): p. 13963-13971.
278. Hong, K. and V.D. Vacquier, Fusion of liposomes induced by a cationic protein from the acrosome granule of abalone spermatozoa. Biochemistry, 1986. 25(3): p. 543-549.
279. López, O., et al., Direct formation of mixed micelles in the solubilization of phospholipid liposomes by Triton X-100. FEBS Letters, 1998. 426(3): p. 314-318.
280. Paternostre, M., et al., Partition coefficient of a surfactant between aggregates and solution: application to the micelle-vesicle transition of egg phosphatidylcholine and octyl beta-D-glucopyranoside. Biophysical Journal, 1995. 69(6): p. 2476-2488.
281. Silvander, M., G. Karlsson, and K. Edwards, Vesicle Solubilization by Alkyl Sulfate Surfactants: A Cryo-TEM Study of the Vesicle to Micelle Transition. Journal of Colloid and Interface Science, 1996. 179(1): p. 104-113.
282. Zhang, L., et al., Destabilization of Liposomes by Uncharged Hydrophilic and Amphiphilic Polymers. The Journal of Physical Chemistry B, 2004. 108(23): p. 7763-7770.
191
283. The Use of Zeta Potential Measurements to Study Sterically Stabilized Liposomes. 2005; Available from: http://www.atomikateknik.com/pdf/The%20use%20of%20zeta%20potential%20measurements%20to%20study%20sterically%20stabilized%20liposomes%20-%20ZS3000HS.pdf.
284. Lyklema, J., Fundamentals of interface and colloid science: soft colloids. Vol. 5. 2005: Academic press.
285. Zschornig, O., et al., Association of lysozyme with phospholipid vesicles is accompanied by membrane surface dehydration. Gen Physiol Biophys, 2000. 19(1): p. 85-101.
286. Rezwan, K., et al., Change of ζ Potential of Biocompatible Colloidal Oxide Particles upon Adsorption of Bovine Serum Albumin and Lysozyme. The Journal of Physical Chemistry B, 2005. 109(30): p. 14469-14474.
287. Takeuchi, K.-i., et al., Effect of zeta potential of cationic liposomes containing cationic cholesterol derivatives on gene transfection. FEBS Letters, 1996. 397(2–3): p. 207-209.
288. Reimhult, E., F. Hook, and B. Kasemo, Vesicle adsorption on SiO2 and TiO2: Dependence on vesicle size. Journal of chemical physics, 2002. 117(16): p. 7401-7404.
289. Keller, C. and B. Kasemo, Surface specific kinetics of lipid vesicle adsorption measured with a quartz crystal microbalance. Biophysical journal, 1998. 75(3): p. 1397-1402.
290. Cho, N.-J., et al., Quartz crystal microbalance with dissipation monitoring of supported lipid bilayers on various substrates. Nat. Protocols, 2010. 5(6): p. 1096-1106.
291. Glasmästar, K., et al., Protein Adsorption on Supported Phospholipid Bilayers. Journal of Colloid and Interface Science, 2002. 246(1): p. 40-47.
292. Serro, A.P., et al., Formation of an intact liposome layer adsorbed on oxidized gold confirmed by three complementary techniques: QCM-D, AFM and confocal fluorescence microscopy. Surface and Interface Analysis, 2012. 44(4): p. 426-433.
293. Jing, Y., et al., Formation of supported lipid bilayers on silica: relation to lipid phase transition temperature and liposome size. Soft matter, 2014. 10(1): p. 187-195.