DEVELOPMENT OF HIGH PERFORMANCE CONCRETE …
18
DEVELOPMENT OF HIGH PERFORMANCE CONCRETE COMPOSITES USING CLASS F FLY ASH AND BOTTOM ASH Rajnish Puri 1 , Sanjeev Kumar 2 , Vijay K Puri 2 , Prabir K Kolay 2 1. PGIMER Chandigarh, India 2. Southern Illinois University Carbondale (SIUC), USA ABSTRACT. With the rapid industrialization and globalization, the journey from ordinary concrete to high performance concrete (HPC) has been swift and remarkable. The aim of this study was to develop high performance concrete composites having different percentages of Class “F” fly ash and bottom ash by replacing the appropriate proportions of Type 1 portland cement and fine aggregate, respectively. The target was to develop high performance concrete composites that have compressive strength of 8,000 psi (55 MPa) after 28 days of curing in water and air content between 4 and 6 percent. The engineering parameters of the high performance concrete composites and an equivalent control mix were evaluated by conducting a detailed laboratory study which included several tests, e.g., slump, fresh air content, compressive strength, splitting-tensile strength, flexural strength, and resistance to rapid freezing and thawing. Based on the results of this study, it was concluded that the concrete composites have potential to be used on real world projects and thus help the environment by substantially reducing the amount of fly ash and bottom ash going to ash ponds or landfills. Keywords: High Performance Concrete, Sustainability, Coal Combustion By-products Dr Rajnish Puri completed his Ph.D. at SIUC and is a Senior Superintending Engineer at the Postgraduate Institute of Medical Education and Research in Chandigarh, India. He is in charge of the construction of several large projects at PGIMER. Email Id: [email protected] Dr Sanjeev Kumar, P.E., is a Professor and Distinguished Teacher at SIUC. His research interests are large volume use of coal combustion by-products, geopolymer concrete, soil structure interaction, and geotechnical earthquake engineering, Email Id: [email protected] Dr Vijay K Puri, is a Professor at SIUC. His research interests are soil dynamics, liquefaction of silts and sands, machine foundations, utilization of coal combustion by- products, Email Id: [email protected] Dr Prabir K Kolay, P E, is an Associate Professor at SIUC. His research interests are use of recycled aggregates to develop concrete composites, soft and expansive soil stabilization, resilient modulus and long-term durability of recycled aggregates, Email Id: [email protected]
Transcript of DEVELOPMENT OF HIGH PERFORMANCE CONCRETE …

DEVELOPMENT OF HIGH PERFORMANCE CONCRETE
COMPOSITES USING CLASS F FLY ASH AND BOTTOM
ASH
Rajnish Puri1, Sanjeev Kumar2, Vijay K Puri2, Prabir K Kolay2
1. PGIMER Chandigarh, India
2. Southern Illinois University Carbondale (SIUC), USA
ABSTRACT. With the rapid industrialization and globalization, the journey from ordinary
concrete to high performance concrete (HPC) has been swift and remarkable. The aim of this
study was to develop high performance concrete composites having different percentages of
Class “F” fly ash and bottom ash by replacing the appropriate proportions of Type 1 portland
cement and fine aggregate, respectively. The target was to develop high performance
concrete composites that have compressive strength of 8,000 psi (55 MPa) after 28 days of
curing in water and air content between 4 and 6 percent. The engineering parameters of the
high performance concrete composites and an equivalent control mix were evaluated by
conducting a detailed laboratory study which included several tests, e.g., slump, fresh air
content, compressive strength, splitting-tensile strength, flexural strength, and resistance to
rapid freezing and thawing. Based on the results of this study, it was concluded that the
concrete composites have potential to be used on real world projects and thus help the
environment by substantially reducing the amount of fly ash and bottom ash going to ash
ponds or landfills.
Keywords: High Performance Concrete, Sustainability, Coal Combustion By-products
Dr Rajnish Puri completed his Ph.D. at SIUC and is a Senior Superintending Engineer at the
Postgraduate Institute of Medical Education and Research in Chandigarh, India. He is in
charge of the construction of several large projects at PGIMER. Email Id:
Dr Sanjeev Kumar, P.E., is a Professor and Distinguished Teacher at SIUC. His research
interests are large volume use of coal combustion by-products, geopolymer concrete, soil
structure interaction, and geotechnical earthquake engineering, Email Id: [email protected]
Dr Vijay K Puri, is a Professor at SIUC. His research interests are soil dynamics,
liquefaction of silts and sands, machine foundations, utilization of coal combustion by-
products, Email Id: [email protected]
Dr Prabir K Kolay, P E, is an Associate Professor at SIUC. His research interests are use of
recycled aggregates to develop concrete composites, soft and expansive soil stabilization,
resilient modulus and long-term durability of recycled aggregates, Email Id: [email protected]

INTRODUCTION
In the world of concrete composites, efforts are underway to make concrete more economical
and environmentally friendly by using the waste products, such as fly ash and bottom ash
obtained from burning of coal. It is estimated that the annual demand of cement in the world
will exceed 2.4 billion tons in 2020 [1]. As per the report of American Coal Ash Association
ACAA [2], over 130 million tons of coal combustion by-products were produced out of
which only 56.6 million tons were used in various applications, which is just 43.46% of the
production. So, there is still a huge scope for further exploration in this field.
In the past, the basic constituents of cement concrete: portland cement, coarse aggregate and
fine aggregate remained unchanged with the exception that various concrete composites have
been developed using different ingredients to meet the project specific requirements and to
save the environment for the future generations. Portland cement was patented by Joseph
Aspdin in 1824 and was named after the limestone cliffs on the isle of Portland in England
[3]. Portland cement concrete is a simple material in appearance with a very complex internal
nature. Despite its internal complexity, concrete’s versatility, durability and economy have
made it world’s most used construction material. Portland cement concrete is basically a
mixture of aggregates and cement paste, in which cement paste constitutes 25 to 40% and
aggregates constitute 60 to 75% of the total volume of the concrete [3].
Cement based construction materials are used on almost all projects, small or large.
Advanced technological aspects of cement based materials have recently focused on
developing high-performance cementitious composites, which exhibit high compressive
strength. Coal Combustion By-Products (CCBs) are the side effects of burning of coal used
for the production of electricity. Due to its easy availability, coal has been the primary source
for production of electricity in the United States, India and many other countries in the world.
The United States holds the world’s largest estimated recoverable reserves of coal and is a net
exporter of coal. In 2014, the amount of coal produced at U.S. coal mines was 996.6 million
tons [4]. More than 90% of the coal produced in the U.S. is being used by coal burning power
plants to generate electricity. In 2013, total amount of coal combustible products were 114.69
million tons, out of which 51.38 million tons were used for various categories, which is just
44.49% of the total CCB produced [5]. Coal Combustion By-Products have posed a serious
challenge to the planners and environmentalists for its safe disposal. For decades, these by-
products were considered as waste material but slowly and slowly, they have created their
own space in the construction industry. Stringent environment laws deserve credit for this
transformation. Initially, these CCBs were used on less important engineering applications
but lately these by-products are being used extensively on the load bearing engineering
structures.
During the last decade, the use of coal combustion by-products in the normal strength
concrete has definitely attained momentum throughout the globe. Proportions, properties,
methods and procedures of producing normal strength concrete have been evaluated by a
number of researchers. However, development of High performance Concrete Composites
(HPCC) with fly ash and bottom ash has not been adequately studied.
During 2005, Italy, Denmark and Netherland have achieved 100% utilization of the fly ash
whereas U.S.A and Germany have reached 65 and 85%, respectively. China and India has
used between 38 and 45% [6]. American Coal Ash Association (ACAA), along with
American Society of Civil Engineers (ASCE) and American Concrete Institute (ACI), have

taken up the challenge of converting coal combustible by-products from liability to an asset.
They are quite successful in enhancing the utilization of these by-products not only in the
conventional concrete but also in the development of the High Performance Concrete
Composites (HPCC). American Concrete Institute (ACI) also defines high performance
concrete (HPC) as concrete meeting special combinations of performance and uniformity
requirements that cannot always be achieved routinely when using conventional constituents
and normal mixing, placing and curing practices. According to American Concrete Institute
(ACI), concrete having 28 days compressive strength of 6,000 psi (41 MPa) or higher is
considered high strength or high performance concrete [7].
Several investigations have been carried out to develop normal strength concrete utilizing
only bottom ash or only fly ash; however studies analyzing the combined effect of using
bottom ash and fly ash are still very limited, especially for the development of high
performance concrete composites. The goal of this research was to develop high performance
concrete composite using Illinois Class F fly ash, PCC bottom ash, air-entraining agent, and
high-range water reducer.
DESCRIPTION OF MATERIALS
In this study, the bottom ash and fly ash were brought from the City Water Light and Power
(CWLP) in Springfield, Illinois. Type 1 portland cement was used in this study. An air-
entraining agent, DARAVAIR 1400, was used to entrain air. The water-cement (w/c) ratio of
0.3 was maintained throughout the research. Regular municipal water was used for preparing
the mixes. Since the water-cement ratio was too low at 0.3, high range water reducer, ADVA
140M, was used to obtain sufficient workability.
Fly Ash
The fly ash was used to replace Type 1 portland cement in the proportions varying from 0 to
30%. The fineness modulus and specific gravity of the fly ash was found to be 2.6 and 2.47
and absorption was 5%. The physical properties of the fly ash and sand used in this study are
presented in Table 1.
Bottom Ash
The sieve analysis of the bottom ash specimen showed that the bottom ash contained large
portions (more than 30%) of particles greater than 4.75mm. It was then decided to sieve the
bottom ash through Sieve No. 4. After sieving, the fineness modulus of this bottom ash was
calculated to be 3.71 against 4.47 before sieving. Figure 1 shows the grain distribution of the
bottom ash before sieving (BS) and after sieving (AS), along with the particle distribution of
natural sand.

Figure 1 Grain size distribution of bottom ash and natural sand
After the drying process and sieving, the bottom ash was stored in drums. Moisture content of
the bottom ash was checked from time to time and it was taken into account for calculation of
the amount of water required for the mix. The physical properties of the bottom ash is also
presented in Table 1.
Table 1 Physical properties of bottom ash, fly ash and sand
Name of Property Values
Bottom Ash Fly Ash Sand
Specific Gravity (Oven Dry) 2.40 2.47 2.66
Absorption (%) 7.0 5.0 0.5
Fineness Modulus 3.7 2.6 2.7
Water Content (%) 0 0 0
Coarse Aggregate
Two characteristics of coarse aggregates; grading and shape of particles, have an important
influence on proportioning concrete mixtures, because they affect the workability of fresh
concrete. Also, the strength/quality of concrete depends on the aggregate source, particle
shape and grading. The maximum size of crushed limestone coarse aggregate used in this
research was ¾ inches (19 mm) and was brought from Illini Ready Mix Plant in Carbondale,
IL. The physical properties of the coarse aggregate used in this research are presented in
Table 2.
Table 2 Physical properties of coarse aggregate
Property Result
Maximum Size (mm) 19.05
Specific Gravity 2.7
Absorption (%) 2.0
Dry Rodded Unit Weight (kg/m3) 1508.94
Water Content (%) 0
0
20
40
60
80
100
0.1 1 10
PE
RC
EN
T F
INE
R
PARTICLE SIZE (MM)
Sand
BS
AS

CONCRETE MIX DESIGN
All tests were performed in general accordance with the procedures outlined in relevant
ASTM standards. Seven mixes, including a control mix, were prepared and tested in this
study. The mixes were prepared after fixing the quantities of all ingredients needed to obtain
the targeted slump of 4±½ " (102±13 mm) and air content of 4 to 6 percent through
preliminary testing.
After the preliminary testing, final mixes containing varying proportions of fly ash and
bottom ash were prepared and tested. Mixes are designated with alphabet followed by
percentage of bottom ash and fly ash in lieu of sand and cement, respectively. For example,
B25F30 represents 25% of the natural sand replaced with bottom ash and 30% of Type 1
portland cement replaced with Class F fly ash. The word CM represents the control mix. The
proportions of materials used for each mix are presented in Table 3. Table 4 shows the
quantities of materials for a batch of 0.6 ft3 (0.01699 m3).
Table 3 Proportions of material and the mix designations
Name of Material Mix Designation
B25F00 B25F10 B25F20 B25F30 B50F10 B50F20 CM
Fine
Aggregate
Bottom Ash
(%) 25 25 25 25 50 50 0
Sand (%) 75 75 75 75 50 50 100
Binder
Fly Ash (%) 0 10 20 30 10 20 0
Cement (%) 100 90 80 70 90 80 100
Curing of Specimens
It is a proven fact that concrete strength increases with age as long as moisture and favorable
temperature are available for hydration of cement. After de-molding of specimens, each
specimen was marked with date of mix, specimen number and designation of mix. Finally,
the specimen were put in curing tanks with a water heater mounted to maintain the water
temperature of 23±3ºC (73±3ºF) as per ASTM C 31 [8].
CONCRETE TESTING
Slump Test
Slump test is used as a measure of the consistency and workability of fresh concrete. Water-
cement ratio of the concrete influences the slump of the concrete. Low water-cement ratio
gives low slump unless water reducers are added to increase the slump. The test was carried
out in general accordance with ASTM C143/C143M-08 [9].
Air Content Test
Air content test was performed as per the provisions of the ASTM C 231-05 [10]. This test
determines the air content of freshly mixed concrete exclusive of any air that may exist inside
the voids within the aggregate particles. Air content in concrete gives breathing space to
concrete and helps in withstanding the cycles of freezing and thawing. Generally 4 to 6% air

content is considered appropriate for concrete without significantly affecting its compressive
strength.
Unconfined Compressive Strength Test
This test method is used to determine compressive strength of cylindrical specimens prepared
and cured in accordance with the provisions of ASTMC 31/C 31 M, C192/C 192M, C617 and
C 1231/C 1231 M and Test methods C 42/C 42M and C 873. Compressive strength of
concrete can be calculated directly by dividing the failure load by the cross-sectional area of
the sample. The test was performed as per the provisions of ASTM C 39/39M 04a [11].
Splitting-Tensile Strength Test
It is a common knowledge that concrete is strong in compression and weak in tension but
with the placement of reinforcement at appropriate place and spacing, it becomes very useful
engineering material. The testing machine for this test shall conform to the requirements of
Test Method C 39/C 39M, the same as described for the compressive strength test, however,
the method of loading was different. This test was performed as per the provisions of ASTM
C 496/C 496M [12].
Flexural Strength Test
The flexural strength of concrete is important for the design of road and airport concrete
pavements. The flexural strength test was performed in general accordance with ASTM C 78-
02 [13] Standard. The specimens were tested for flexural strength at 3, 7, 28 and 180 days of
curing.
Freezing and Thawing Test
This test method involves determination of the resistance of concrete specimens to repeated
cycles of freezing and thawing which gives an indication of the durability of the concrete.
The test was performed as per the provisions of ASTM C 666/C 666M-03 [14]. The freezing
and thawing cycle for this test method consists of alternatively lowering the temperature from
40 to 0º F (4 to -18ºC) and raising it from 0 to 40ºF (-18 to 4ºC) in not less than 2 hours and
not more than 5 hours.
RESULTS AND DISCUSSION
The detailed experimental testing for this study included performing tests on fresh and
hardened concrete specimens. Results obtained from various tests conducted during this study
are presented in the following sections. Tests on fresh concrete were carried out to evaluate
the effects of bottom ash and Class F fly ash on the workability of the concrete composites
and their ability to entrain air. Slump test and air content test were conducted on the fresh
concrete before preparing specimens for testing on hardened concrete. Slump is an indicator
of workability of the concrete whereas right amount of air-content enhances durability of the
concrete. Therefore, targeted slump of 4±½ (102 ±13 mm) and air-content in the range of 4
to 6% were selected for this study.

Several tests were performed on hardened concrete samples to understand strength and
durability characteristics of the concrete composites. Results were compared with those
obtained from similar tests on an equivalent conventional concrete. Strengths were measured
in terms of compression, splitting-tensile, and flexure strength. Durability of the composites
was measured in terms of freeze-thaw.
Slump and Air Content Test Results
It is a well-known fact that the value of slump is inversely proportional to the compressive
strength of concrete and directly proportional to the water-cement ratio, i.e., as the water-
cement ratio increases the slump increases but the compressive strength of hardened concrete
decreases. Table 4 shows the measured slump and the amount of water needed to obtain the
targeted slump. Table 4 also shows the results of the air content tests on the fresh concrete
composites along with the quantity of air entraining agent used.
Table 4 Slump and air content test results
Name of Mix Slump Water
Air
Content
Air Entrainer
Qty.
mm kg/m3 % kg/m3
Control Mix (CM) 102 128.28 5.3 0.04
B25F00 102 153.52 4.5 0.05
B25F10 102 152.41 4.2 0.05
B25F20 109 152.23 4.5 0.04
B25F30 115 152.07 4.6 0.04
B50F10 109 166.48 4.0 0.05
B50F20 115 166.18 4.0 0.04
From the slump test results, it was concluded that the amount of water needed to obtain the
targeted slump has been affected by the usage of coal combustion by-products (CCBs). The
water requirement for concrete composites is more than that of the control mix. This may be
due to irregular structure and high value of water absorption of bottom ash. The concrete
composites with 50% bottom ash required more water than those with 25% bottom ash,
whereas addition of fly ash reduced the amount of water needed, although the reduction was
observed to be insignificant.
Air entraining agent produce tiny bubbles in the hardened concrete to provide space for water
to expand upon freezing [15]. The air-entraining agent enhances the incorporation of bubbles
of various sizes by lowering the surface tension of the mixing water. The resistance of
hardened concrete to freezing and thawing is significantly improved by the use of entrained
air [3]. In this research, an air entraining agent DARAVAIR1400 was used to achieve the
targeted air content between 4 to 6 percent. The amount of air entraining agent required to
achieve the targeted air content was fixed after conducting preliminary tests and also keeping
in view the relevant literature. Table 4 shows the results of the air content tests on the fresh
concrete composites along with the quantity of air entraining agent used. From the results
presented above, it was concluded that the amount of air entraining agent required was
slightly higher in concrete composites as compared to that required for the equivalent control
mix. The results also show that the dose of the air entraining agent required decreased with
the increase in the fly ash content. The amount of bottom ash in the composites appears to
have an insignificant effect on the dose of air-entraining agent required.
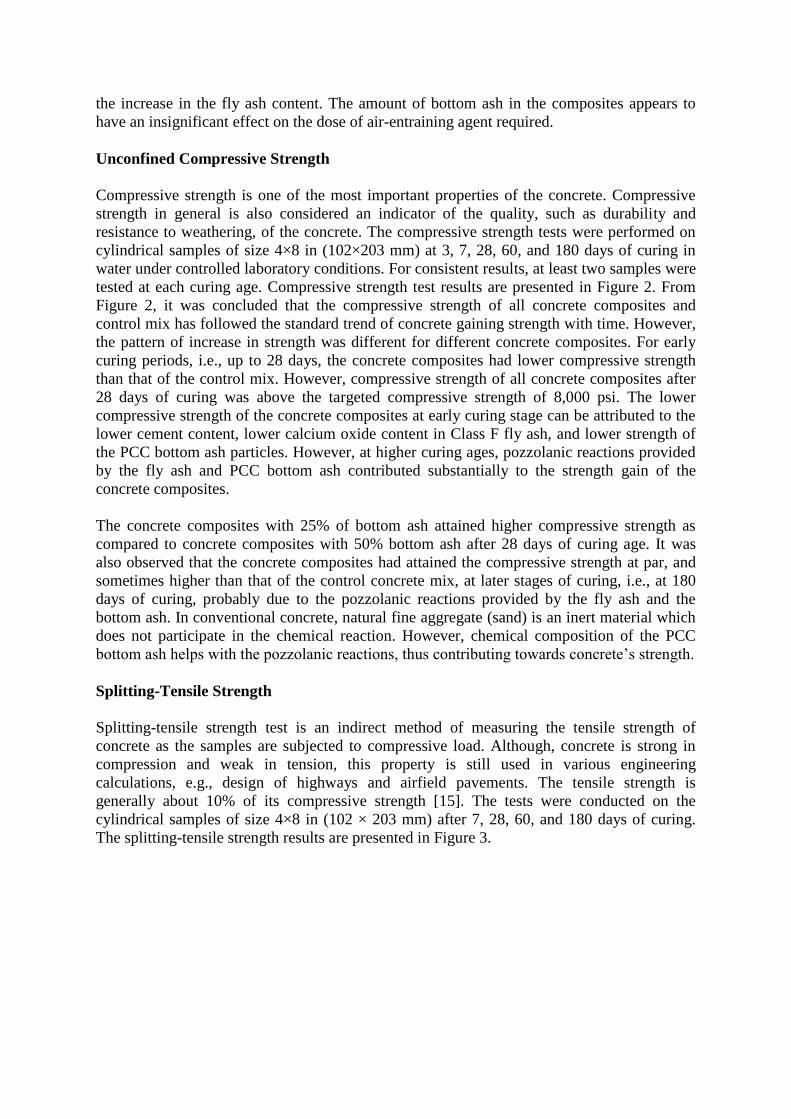
Unconfined Compressive Strength
Compressive strength is one of the most important properties of the concrete. Compressive
strength in general is also considered an indicator of the quality, such as durability and
resistance to weathering, of the concrete. The compressive strength tests were performed on
cylindrical samples of size 4×8 in (102×203 mm) at 3, 7, 28, 60, and 180 days of curing in
water under controlled laboratory conditions. For consistent results, at least two samples were
tested at each curing age. Compressive strength test results are presented in Figure 2. From
Figure 2, it was concluded that the compressive strength of all concrete composites and
control mix has followed the standard trend of concrete gaining strength with time. However,
the pattern of increase in strength was different for different concrete composites. For early
curing periods, i.e., up to 28 days, the concrete composites had lower compressive strength
than that of the control mix. However, compressive strength of all concrete composites after
28 days of curing was above the targeted compressive strength of 8,000 psi. The lower
compressive strength of the concrete composites at early curing stage can be attributed to the
lower cement content, lower calcium oxide content in Class F fly ash, and lower strength of
the PCC bottom ash particles. However, at higher curing ages, pozzolanic reactions provided
by the fly ash and PCC bottom ash contributed substantially to the strength gain of the
concrete composites.
The concrete composites with 25% of bottom ash attained higher compressive strength as
compared to concrete composites with 50% bottom ash after 28 days of curing age. It was
also observed that the concrete composites had attained the compressive strength at par, and
sometimes higher than that of the control concrete mix, at later stages of curing, i.e., at 180
days of curing, probably due to the pozzolanic reactions provided by the fly ash and the
bottom ash. In conventional concrete, natural fine aggregate (sand) is an inert material which
does not participate in the chemical reaction. However, chemical composition of the PCC
bottom ash helps with the pozzolanic reactions, thus contributing towards concrete’s strength.
Splitting-Tensile Strength
Splitting-tensile strength test is an indirect method of measuring the tensile strength of
concrete as the samples are subjected to compressive load. Although, concrete is strong in
compression and weak in tension, this property is still used in various engineering
calculations, e.g., design of highways and airfield pavements. The tensile strength is
generally about 10% of its compressive strength [15]. The tests were conducted on the
cylindrical samples of size 4×8 in (102 × 203 mm) after 7, 28, 60, and 180 days of curing.
The splitting-tensile strength results are presented in Figure 3.

Figure 2 Unconfined compressive strength vs curing time
Figure 3 Splitting-tensile strength vs curing time
The data presented in Figure 3 show that that tensile strength of the composites in general has
also followed the similar engineering pattern as the case of unconfined compressive strength,
i.e., increase in the strength with the curing age. However, the strength gain trends are not as
clear as in the case of unconfined compression strength. This is primarily due to
heterogeneous composition of concrete and inherent difficulty with placing the specimen in
0
10000
20000
30000
40000
50000
60000
70000
80000
90000
100000
3 7 28 60 180
CO
MP
RE
SS
IVE
ST
RE
NG
TH
(K
PA
)
CURING TIME (DAYS)
Control Mix
B25F00
B25F10
B25F20
B25F30
B50F10
B50F20
0
1000
2000
3000
4000
5000
6000
7000
7 28 60 180
SP
LIT
TT
ING
TE
NS
ILE
ST
RE
NG
TH
(K
PA
)
CURING TIME (DAYS)
control mix
B25F00
B25F10
B25F20
B25F30
B50F10
B50F20

this test. It was also observed that the splitting-tensile strength of concrete composites in the
initial curing age was less than that of the equivalent control mix but as the curing progresses
beyond 60 days, the splitting-tensile strength of concrete composites with 25% bottom ash
was almost equal to or greater than the splitting-tensile strength of the control mix. However,
splitting strength of concrete composites with 50% bottom ash was lower than that of the
control mix.
Estimating Splitting-Tensile Strength from Observed Compressive Strength
It is well understood that concrete is strong in compression and weak in tension. Therefore, in
the design and construction of concrete structures, reinforcement is commonly used wherever
tensile stresses are expected. It is not a common practice to test concrete for obtaining tensile
strength. Therefore, indirect methods and mathematical co-relations are commonly used to
estimate tensile strength of concretes. As per Mamlouk and Zaniewski [15], the tensile
strength of concrete is about 10% of its compressive strength. ACI 318 suggests that if
compressive strength of the concrete is known, the splitting-tensile strength can be calculated
using Eqn. 1.
𝑓𝑡 = 6.7√𝑓𝑐′ …………………………………………….(1)
Where,
𝑓𝑡 = Splitting-tensile strength of concrete
𝑓𝑐′ = Compressive strength of concrete
The splitting-tensile strengths observed from the laboratory tests and calculated from Eqn. 1
using the measured compressive strengths are presented in Figure 4.
Comparison of the observed and calculated values presented in Figure 4 show that in
approximately 61% of the cases, the observed values are higher than the values calculated
using the ACI equation. However, in order to better understand the relationship between the
observed values and ACI equation the data was plotted in Figure 4 which shows a
relationship between the splitting-tensile strengths of the composites calculated from the ACI
equation as well as measured from the test specimens. A 45 degree line was drawn to
evaluate the effectiveness of the ACI equation in predicting the splitting-tensile strength of
the concrete composites. Figure 4 shows that some data points, including all data points for
the control mix, are above the 45 degree line indicating that the ACI equation under predicted
the splitting-tensile strength whereas, some data points are below the 45 degree line
indicating that the ACI equation over predicted the splitting tensile strength. However, in
general most of the data points fall close to the 45 degree line indicating that the ACI
equation provides a reasonable estimate of the splitting-tensile strength.
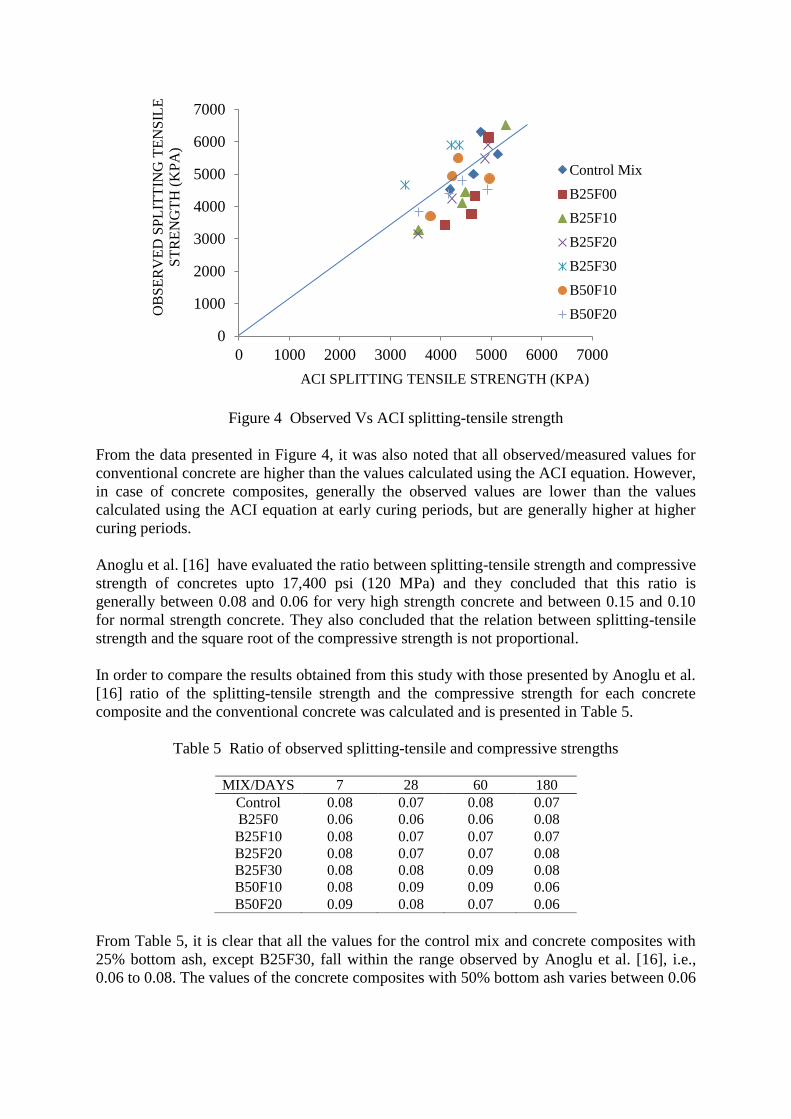
Figure 4 Observed Vs ACI splitting-tensile strength
From the data presented in Figure 4, it was also noted that all observed/measured values for
conventional concrete are higher than the values calculated using the ACI equation. However,
in case of concrete composites, generally the observed values are lower than the values
calculated using the ACI equation at early curing periods, but are generally higher at higher
curing periods.
Anoglu et al. [16] have evaluated the ratio between splitting-tensile strength and compressive
strength of concretes upto 17,400 psi (120 MPa) and they concluded that this ratio is
generally between 0.08 and 0.06 for very high strength concrete and between 0.15 and 0.10
for normal strength concrete. They also concluded that the relation between splitting-tensile
strength and the square root of the compressive strength is not proportional.
In order to compare the results obtained from this study with those presented by Anoglu et al.
[16] ratio of the splitting-tensile strength and the compressive strength for each concrete
composite and the conventional concrete was calculated and is presented in Table 5.
Table 5 Ratio of observed splitting-tensile and compressive strengths
MIX/DAYS 7 28 60 180
Control 0.08 0.07 0.08 0.07
B25F0 0.06 0.06 0.06 0.08
B25F10 0.08 0.07 0.07 0.07
B25F20 0.08 0.07 0.07 0.08
B25F30 0.08 0.08 0.09 0.08
B50F10 0.08 0.09 0.09 0.06
B50F20 0.09 0.08 0.07 0.06
From Table 5, it is clear that all the values for the control mix and concrete composites with
25% bottom ash, except B25F30, fall within the range observed by Anoglu et al. [16], i.e.,
0.06 to 0.08. The values of the concrete composites with 50% bottom ash varies between 0.06
0
1000
2000
3000
4000
5000
6000
7000
0 1000 2000 3000 4000 5000 6000 7000
OB
SE
RV
ED
SP
LIT
TIN
G T
EN
SIL
E
ST
RE
NG
TH
(K
PA
)
ACI SPLITTING TENSILE STRENGTH (KPA)
Control Mix
B25F00
B25F10
B25F20
B25F30
B50F10
B50F20

and 0.09. There does not seem to be any regular trend between the ratios and the in curing
age.
Flexural Strength
Compressive strength is used as an index of flexural strength, tensile strength and shear
strength of concrete. The flexure strength or modulus of rupture of normal strength concrete
is approximately 7.5 to 10 times the square root of the compressive strength [3]. In addition
to compression and splitting-tensile strengths, flexural strength is another important property
of the concrete which plays very crucial role in the design of the engineering structures,
especially for the design and construction of road and airport concrete pavements. The
flexure strength results are presented in Figure 5.
Figure 5 Flexure strength vs curing time
From the results presented in Figure 5, it is clear that the flexural strength of concrete
composites and conventional concrete increased with the increase in the curing period up to
28 days. However, results show decrease in the flexural strength of 4 to 11% of several
composites, including the control mix, beyond 28 days of curing. The reduction in the
flexural strength of concrete with curing does not appear to be related to the quality of
concrete; it is probably due to the heterogeneous nature of concrete and inherent difficulties
in performing flexural strength test.
At initial days of curing, i.e., at 3 days, all the concrete composites have less flexural strength
than the control mix. However, as the curing progressed to 28 days and beyond, the concrete
composites started catching up with the flexural strength of control mix and in some cases
exceeded the strength of control mix.
For concrete composites with 25% bottom ash with 0, 10, 20, and 30% fly ash, at 3 days of
curing, the decrease in flexure strength as compared to that of the conventional concrete was
observed to be 16, 16, 27 and 29%, respectively, whereas at 28 days of curing, the decrease in
strength, as compared to that of the control mix, was observed to be between 1 to 14%. The
0
2000
4000
6000
8000
10000
3 7 28 180
FL
EX
UR
AL
ST
RE
NG
TH
(K
PA
)
CURING TIME (DAYS)
Control Mix
B25F00
B25F10
B25F20
B25F30
B50F10
B50F20
trend shows that with the increase in the fly ash quantity, the flexure strength decreases.
Similar trend was observed in the compressive strength.
Figure 5 also shows the behavior of flexural strength of the concrete composites with 50%
bottom ash (B50). At 3 days of curing, the flexural strength of concrete composites
containing 50% bottom ash and 10 and 20% fly ash was measured to be 26 and 36% lower
than that of the equivalent control mix. However, at 28 days of curing, concrete composite
with 10% fly ash has flexural strength which is almost equal to that of the conventional
concrete and the composite with 20% fly ash has flexural strength 25% lower than that of the
conventional concrete. At 180 days of curing, flexural strength of concrete composites with
10 and 20% fly ash was observed to be 22 and 19% higher than that of the control mix. The
principle behind late gain of strength is the same as explained under compressive strength i.e.
the strength gain due to the pozzolonic reactions provided by the bottom ash and fly ash.
Resistance to Rapid Freezing and Thawing
Durability of concrete is another important property of concrete as it refers to the ability of
the concrete to resist deterioration from the severity of environment. Although, rapid freezing
and thawing test does not have any direct correlation with the ability of the concrete to resist
freezing and thawing temperatures, yet it is considered an acceptable tool to evaluate
durability against freezing and thawing in relative terms. In this research, the specimens were
first subjected to cycles of rapid freezing and thawing after curing them in water for 14 days.
However, all these specimens, including the specimens of the control mix, deteriorated after a
few cycles of rapid freezing and thawing. Therefore, the specimens were re-casted and tested
after curing them in water for 28 days. The specimens were subjected to 30 to 36 cycles of
rapid freezing and thawing every week and the readings for the change in weight, change in
length and transverse frequency were recorded. The test was continued until the specimens
could not be tested for transverse frequency.
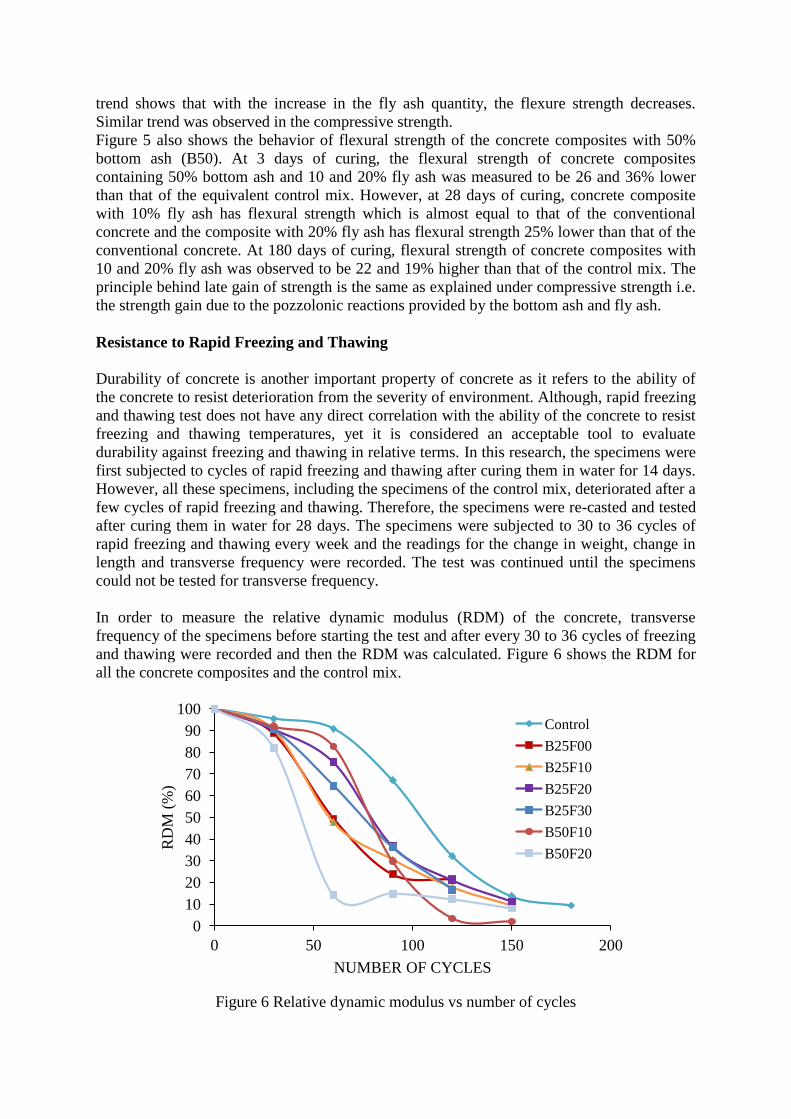
In order to measure the relative dynamic modulus (RDM) of the concrete, transverse
frequency of the specimens before starting the test and after every 30 to 36 cycles of freezing
and thawing were recorded and then the RDM was calculated. Figure 6 shows the RDM for
all the concrete composites and the control mix.
Figure 6 Relative dynamic modulus vs number of cycles
0 50 100 150 200
0
10
20
30
40
50
60
70
80
90
100
NUMBER OF CYCLES
RD
M (
%)
Control
B25F00
B25F10
B25F20
B25F30
B50F10
B50F20

From Figure 6, it is clear that the relative dynamic modulus of the concrete composites and
the control mix decreased with the increase in the number of cycles of rapid freezing and
thawing. As evident from the results, RDM of concrete composites and the control mix
decreased rapidly after approximately 30 cycles of freezing and thawing. Moreover, the RDM
of all concrete composites prepared using fly ash and bottom ash was less than that of the
control mix. After 30 cycles of rapid freezing and thawing, the RDM of concrete composites
ranged between 82 and 91% compared to RDM of 95% for the control mix. After 120 cycles,
the RDM of concrete composites ranged between 3 and 11% compared to RDM of 32% for
the control mix. The RDM of concrete composites with 50% bottom ash at 120 cycles of
rapid freezing and thawing was less than that of the composites containing 25% bottom ash.
The literature suggests that if the aggregate is non-frost-resistant, with large void percentage,
it will cause the concrete to deteriorate faster in freezing and thawing cycles. Therefore,
higher reduction of RDM for concrete composites with 50% bottom ash is justified since the
bottom ash is much more porous and weaker aggregate compared to the natural sand.
Mardani et al. [17] have studied the effect of high-volume fly ash on durability characteristics
of roller compacted concrete (RCC). They reported that in the mixtures where cement was
substituted with fly ash, increasing the fly ash content adversely affected the durability
performance. However, fly ash substitution for a part of the aggregate improved the
durability characteristics of the mixture with the increase in the amount of fly ash.
The reduction in the RDM with number of cycles presented in Figure 6 is not consistent with
the results published by other researches for normal weight and normal strength concrete. The
studies have shown that the concrete specimens, even those prepared by using fly ash and
bottom ash, were able to withstand 300 cycles of rapid freezing and thawing with RDM of
above 60% after 300 cycles. In this study, all specimens, including specimens of the control
mix, failed before reaching 180 cycles. It is not clear whether the rapid reduction of the RDM
in this study is due to the fact that it is high strength concrete, which may be more brittle and
contains substantial amount of superplasticizer, or due to experimental errors.
Figures 7 shows the physical condition of specimens of concrete composite B25F00 after 4
weeks of rapid freezing and thawing whereas Figure 8 shows the physical condition of
specimens of the control mix 6 weeks of rapid freezing and thawing. It is interesting to note
that the concrete composite specimens do not show too much spalling or damage to the
concrete surface. However, the specimens have developed substantial cracking. This is
primarily the reason for substantial reduction in the transverse frequency and RDM. It is
unclear whether the development of cracks was due to the presence of fly ash and bottom or
possibly brittle nature of the high performance concrete. Therefore, further study on this topic
for high strength concrete is needed to determine the reason for substantial decrease in the
RDM.

Figure 7 Condition of B25F00 specimen after 4 weeks (28 day curing)
Figure 8 Condition of Control Mix specimen after 6 week (28 day curing)

CONCLUDING REMARKS
Based on the comprehensive laboratory testing performed in this study, the following
conclusions have been drawn.
1. Addition of Class F fly ash and PCC bottom ash require higher amount of water to
achieve the targeted slump because of high absorption of bottom ash. The concrete
composites with 50% bottom ash require more water than with 25% bottom ash, i.e., the
quantity of water increased with the increase in the quantity of bottom ash.
2. The amount of air-entraining agent required for concrete composites was slightly higher
than that was required for the equivalent control mix to achieve the same air-content
level. The results also show that the dose of the air-entraining agent marginally decreased
with the increase in fly ash content. Whereas, the increase in the amount of bottom ash
from 25 to 50% appears to have an insignificant effect.
3. The compressive strength results show that all of the concrete composites prepared and
tested in this study achieved the targeted compressive strength of 8,000 psi at 28 days of
curing.
4. The compressive strength of the concrete composites was lower than that of an equivalent
conventional concrete (control mix) for early periods of curing, i.e., up to 28 days,
however, after that the compressive strength was almost at par or more than that of an
equivalent conventional concrete.
5. The compressive strengths of the composites, at 28 days curing, were found to be 17-20
percent lower than that of the control mix. At higher curing periods, chemical
composition of the fly ash and bottom ash played role in the strength gain of the
composites. As a result, at 180 days of curing, the compressive strengths of concrete
composites were within 7 percent of the compressive strength of an equivalent
conventional concrete. Therefore, it was concluded that the long term compressive
strength of concrete composites made with Class F fly ash and PCC bottom ash is likely
to be similar to that of an equivalent conventional concrete.
6. For concrete composites containing 25% bottom ash, increased replacement of the
portland cement with Class F fly ash resulted in decreased compressive strength. The total
decrease in the compressive strength of concrete composites when the fly ash percentage
increased from 0 to 30 at 3 day of curing was approximately 36% whereas at 28 days of
curing the compressive strength decrease was approximately 16% when the fly ash
percentage increased from 0 to 30%. At higher curing ages, i.e., 60 and 180 days, the
trend is not as clear as at lower curing ages.
7. The splitting-tensile strength results show that at 180 days of curing, the strength of
concrete composites made with 25% bottom ash was approximately 5 to 15% higher than
that of an equivalent conventional concrete. Whereas, the splitting-tensile strength of the
concrete composites made with 50% bottom ash at 180 days of curing was 13.5 to 19%
lower than that of an equivalent concrete.
8. According to ACI, splitting-tensile strength of concrete can be estimated as 6.7 times the
square root of the compressive strength. Based on the data developed in this study, it was
concluded that a factor, 6.78 (instead of 6.7) is more appropriate for estimating the
splitting-tensile strength of high strength concrete composites at 28 days of curing.
9. The flexural strength of concrete composites made with 25% bottom ash at 180 days of
curing show flexural strength within 3% of the flexural strength of the control mix
whereas, flexural strength of the concrete composites made with 50%t bottom ash was
18-22% more than that of the control mix. The overall trend of change in the flexural
strength with the increase in the fly ash content was similar to that observed for the

compressive strength, i.e., with the increase in the quantity of fly ash from 0 to 30%, there
was decrease in the flexural strength. The total decrease in the flexural strength, when the
fly ash percentage increased from 0 to 30%, at 3 days of curing was 16%, at 7 days of
curing was 23%, at 28 days of curing was 10% and at 180 days of curing was 5.5%. As
the curing progressed, the percentage decrease of flexural strength also decreased except
for 7 days of curing.
10. The behavior of the concrete composites under the rapid freeze-thaw tests observed in the
study is not consistent with the results published by other researches for normal weight
and normal strength concrete. In this study, all specimens, including specimens of the
control mix, failed before reaching 180 cycles. It is not clear whether the rapid reduction
of the RDM in this study is due to the fact that it is high strength concrete, which may be
more brittle and contains substantial amount of superplasticizer, or due to experimental
errors. Therefore, further study on this topic for high strength concrete is needed to
determine the reason for substantial decrease in the RDM.
REFERENCES
1. MAHASENAN N, SMITH S, AND HUMPHREYS K, The Cement Industry and
Global Climate Change: Current and Potential Future Cement Industry CO2
Emissions. 6th International Conference on Greenhouse Gas Control Technologies,
Elsevier Science Limited Oxford UK, 2003, pp. 995-1000.
2. ACAA, Coal Combustion Product CCP Production and Use Survey. 2011, http://
acaa-usa.org/ CCP American Coal Ash Association.
3. KOSMATKA H S, AND PANARESE C W, Design and Control of Concrete
Mixtures. Portland Cement Association (PCA), 1988.
4. www.eia.gov/coal accessed on January 25, 2016.
5. www.acaa-usa.org accessed on March 28, 2017.
6. DHADSE S, KUMARI P, AND BHAGIA J L, Fly Ash Characteristics, Utilization
and Government Initiatives in India-Review. Journal of Scientific and Industrial
Research, 2008, Vol. 67, pp. 11-18.
7. ACI 363R, High Strength Concrete by ACI Committee 363 – High Strength Concrete.
Seventh International Symposium on the Utilization of High-Strength/High-
Performance Concrete, 1992, Vol. I, SP 228, American Concrete Institute,
Farmington Hills, MI, pp. 79-80.
8. ASTM C 31/C 31 M-03a, Standard Practice for Making and Curing and Concrete Test
Specimens in the Field. Annual Book of ASTM Standards, ASTM, 2005, Section 4,
Vol. 04.02, Philadelphia, pp. 5-9.
9. ASTM C 143/C 143 M-05, Standard Test Method for Slump of Hydraulic – Cement
Concrete. Annual Book of ASTM Standards, ASTM, 2005, Section 4, Vol. 04.02,
Philadelphia, pp. 99-102.
10. ASTM C 231-04, Standard Test Method for Air Content of Freshly Mixed Concrete
by the Pressure Method. Annual Book of ASTM Standards, ASTM, 2005, Section 4,
Vol. 04.02, Philadelphia, pp. 150-157.
11. ASTM C 39/C 39 M-04a, Standard Test Method for Compressive Strength of
Cylindrical Concrete Specimen. Annual Book of ASTM Standards, ASTM, 2005,
Section 4, Vol. 04.02, Philadelphia, pp. 21-27.
12. ASTM C 496/C 496 M-04, Standard Test Method for Splitting Tensile Strength of
Cylindrical Concrete Specimens. Annual Book of ASTM Standards, ASTM, 2005,
Section 4, Vol. 04.02, Philadelphia, pp. 287-291.

11. ASTM C 78-02, Standard Test Method for Flexural Strength of Concrete (Using
Simple Beam With Third-Point Loading), Annual Book of ASTM Standards, ASTM,
2005, Section 4, Vol. 04.02, Philadelphia, pp. 39-41.
12. ASTM C 666/C666 M-03, Standard Test Method for Resistance of Concrete to Rapid
Freezing and Thawing. Annual Book of ASTM Standards, ASTM, 2005, Section 4,
Vol. 04.02, Philadelphia, pp. 341-346.
13. MAMLOUK M, AND ZANIEWSKI J, Materials for Civil and Construction
Engineers. 2011, Third Edition, Prentice Hall.
16. ANOGLU N, GIRGIN C Z, AND ANOGLU E, Evaluation of Ratio between Splitting
Tensile Strength and Compressive Strength for Concrete up to 120 MPa and its
Application in Strength Criterion. ACI Materials Journal, 2006, pp 18-24.
17. MARDANI A, ANDIC O, AND RAMYAR K, Freeze-thaw Resistance and Transport
Properties of High-Volume Fly Ash Roller Compacted Concrete Designed by
Maximum Density Method. Cement and Concrete Composites, 2013, Vol. 37, pp 259-
266.