Development of Guidelines for Pedestrian Safety · PDF fileDEVELOPMENT OF GUIDELINES FOR...
126
Technical Report Documentation Page 1. Report No. FHWA/TX-11/0-6402-1 2. Government Accession No. 3. Recipient's Catalog No. 4. Title and Subtitle DEVELOPMENT OF GUIDELINES FOR PEDESTRIAN SAFETY TREATMENTS AT SIGNALIZED INTERSECTIONS 5. Report Date August 2011 Published: January 2012 6. Performing Organization Code 7. Author(s) James Bonneson, Michael Pratt, and Praprut Songchitruksa 8. Performing Organization Report No. Report 0-6402-1 9. Performing Organization Name and Address Texas Transportation Institute The Texas A&M University System College Station, Texas 77843-3135 10. Work Unit No. (TRAIS) 11. Contract or Grant No. Project 0-6402 12. Sponsoring Agency Name and Address Texas Department of Transportation Research and Technology Implementation Office P.O. Box 5080 Austin, Texas 78763-5080 13. Type of Report and Period Covered Technical Report: September 2009-August 2011 14. Sponsoring Agency Code 15. Supplementary Notes Project performed in cooperation with the Texas Department of Transportation and the Federal Highway Administration. Project Title: Development of Pedestrian Safety-Based Warrants for Protected or Protected-Permissive Left-Turn Control URL: http://tti.tamu.edu/documents/0-6402-1.pdf 16. Abstract For intersections with a permissive or protected-permissive left-turn mode, pedestrians cross during the permissive period. This operation requires the left-turn driver to yield to both opposing vehicles and pedestrians, prior to accepting a gap and completing the turn. Pedestrian crash risks are increased in these complicated driving conditions because left-turn drivers sometimes fail to yield to pedestrians. This document summarizes the research conducted and the conclusions reached during the development of guidelines for pedestrian safety treatments at signalized intersections. The guidelines are focused on treatments that alleviate conflicts between left-turning vehicles and pedestrians. One treatment addressed in the document is the use of protected or protected-permissive left-turn operation. The guidelines are based on consideration of pedestrian safety and vehicle operation. These considerations include the road-user costs associated with pedestrian-vehicle crashes and vehicle delay. The guidelines were incorporated in the Traffic Signal Operations Handbook. The guidelines were also incorporated into a spreadsheet that was developed to accompany the Handbook. The Handbook was previously developed for Project 0-5629. It provides guidelines for timing traffic control signals at intersections that operate in isolation or as part of a coordinated signal system. 17. Key Words Signalized Intersections, Intersection Design, Intersection Performance, Traffic Signal Timing, Pedestrian Safety 18. Distribution Statement No restrictions. This document is available to the public through NTIS: National Technical Information Service Alexandria, Virginia 22312 http://www.ntis.gov 19. Security Classif.(of this report) Unclassified 20. Security Classif.(of this page) Unclassified 21. No. of Pages 126 22. Price Form DOT F 1700.7 (8-72) Reproduction of completed page authorized
Transcript of Development of Guidelines for Pedestrian Safety · PDF fileDEVELOPMENT OF GUIDELINES FOR...
Technical Report Documentation Page
1. Report No.
FHWA/TX-11/0-6402-1 2. Government Accession No. 3. Recipient's Catalog No.
4. Title and Subtitle
DEVELOPMENT OF GUIDELINES FOR PEDESTRIAN SAFETYTREATMENTS AT SIGNALIZED INTERSECTIONS
5. Report Date
August 2011Published: January 2012 6. Performing Organization Code
7. Author(s)
James Bonneson, Michael Pratt, and Praprut Songchitruksa 8. Performing Organization Report No.
Report 0-6402-1 9. Performing Organization Name and Address
Texas Transportation InstituteThe Texas A&M University SystemCollege Station, Texas 77843-3135
10. Work Unit No. (TRAIS)
11. Contract or Grant No.
Project 0-640212. Sponsoring Agency Name and Address
Texas Department of TransportationResearch and Technology Implementation OfficeP.O. Box 5080Austin, Texas 78763-5080
13. Type of Report and Period Covered
Technical Report:September 2009-August 201114. Sponsoring Agency Code
15. Supplementary Notes
Project performed in cooperation with the Texas Department of Transportation and the Federal HighwayAdministration.Project Title: Development of Pedestrian Safety-Based Warrants for Protected or Protected-PermissiveLeft-Turn ControlURL: http://tti.tamu.edu/documents/0-6402-1.pdf16. Abstract
For intersections with a permissive or protected-permissive left-turn mode, pedestrians cross during thepermissive period. This operation requires the left-turn driver to yield to both opposing vehicles andpedestrians, prior to accepting a gap and completing the turn. Pedestrian crash risks are increased in thesecomplicated driving conditions because left-turn drivers sometimes fail to yield to pedestrians.
This document summarizes the research conducted and the conclusions reached during the development ofguidelines for pedestrian safety treatments at signalized intersections. The guidelines are focused ontreatments that alleviate conflicts between left-turning vehicles and pedestrians. One treatment addressed inthe document is the use of protected or protected-permissive left-turn operation. The guidelines are based onconsideration of pedestrian safety and vehicle operation. These considerations include the road-user costsassociated with pedestrian-vehicle crashes and vehicle delay. The guidelines were incorporated in the TrafficSignal Operations Handbook. The guidelines were also incorporated into a spreadsheet that was developedto accompany the Handbook. The Handbook was previously developed for Project 0-5629. It providesguidelines for timing traffic control signals at intersections that operate in isolation or as part of acoordinated signal system.17. Key Words
Signalized Intersections, Intersection Design,Intersection Performance, Traffic Signal Timing,Pedestrian Safety
18. Distribution Statement
No restrictions. This document is available to thepublic through NTIS:National Technical Information ServiceAlexandria, Virginia 22312http://www.ntis.gov
19. Security Classif.(of this report)
Unclassified20. Security Classif.(of this page)
Unclassified21. No. of Pages
12622. Price
Form DOT F 1700.7 (8-72) Reproduction of completed page authorized


DEVELOPMENT OF GUIDELINES FOR PEDESTRIAN SAFETYTREATMENTS AT SIGNALIZED INTERSECTIONS
by
James Bonneson, P.E.Senior Research Engineer
Texas Transportation Institute
Michael Pratt, P.E.Assistant Research Engineer
Texas Transportation Institute
and
Praprut Songchitruksa, P.E.Associate Research EngineerTexas Transportation Institute
Report 0-6402-1Project 0-6402
Project Title: Development of Pedestrian Safety-Based Warrants for Protected orProtected-Permissive Left-Turn Control
Performed in cooperation with theTexas Department of Transportation
and theFederal Highway Administration
August 2011Published: January 2012
TEXAS TRANSPORTATION INSTITUTEThe Texas A&M University SystemCollege Station, Texas 77843-3135


v
DISCLAIMER
The contents of this report reflect the views of the authors, who are responsible for the factsand the accuracy of the data published herein. The contents do not necessarily reflect the officialview or policies of the Federal Highway Administration (FHWA) and/or the Texas Department ofTransportation (TxDOT). This report does not constitute a standard, specification, or regulation. Itis not intended for construction, bidding, or permit purposes. The engineer in charge of the projectwas James Bonneson, P.E. #67178.
NOTICE
The United States Government and the State of Texas do not endorse products ormanufacturers. Trade or manufacturers’ names appear herein solely because they are consideredessential to the object of this report.

vi
ACKNOWLEDGMENTS
This research project was sponsored by the Texas Department of Transportation and theFederal Highway Administration. The research was conducted by Dr. James Bonneson, Mr. MichaelPratt, and Dr. Praprut Songchitruksa. All three researchers are with the Texas TransportationInstitute.
The researchers acknowledge the support and guidance provided by the Project MonitoringCommittee:
! Mr. Adam Chodkiewicz, Project Director (TxDOT, Traffic Operations Division).! Mr. James Bailey (TxDOT, Waco District).! Mr. Scott Cunningham (TxDOT, Austin District).! Mr. John Gianotti (TxDOT, San Antonio District).! Mr. Jianming Ma (TxDOT, Traffic Operations Division).! Ms. Wendy Simmons (TxDOT, Tyler District). ! Mr. Wade Odell, Research Engineer (TxDOT, Research and Technology Implementation
Office).
The researchers also acknowledge the contribution of Dr. Kay Fitzpatrick to this project.Dr. Fitzpatrick provided direction in this document’s development and reviewed several of its earlydraft versions.
The researchers are grateful to the practitioners that participated in the state-of-the-practiceinterviews, on the expert panel, and in the pilot workshop that demonstrated the proposed guidelines.They are particularly grateful to Mr. Ali Mozdbar, Traffic Signal System Manager, with theTransportation Department of the City of Austin. He implemented pedestrian safety treatments atseveral intersections in Austin for the purpose of conducting a before-after observational study oftreatment effectiveness.

vii
TABLE OF CONTENTS
Page
LIST OF FIGURES . . . . . . . . . . . . . . . . . . . . . . . . . . . . . . . . . . . . . . . . . . . . . . . . . . . . . . . . . viii
LIST OF TABLES . . . . . . . . . . . . . . . . . . . . . . . . . . . . . . . . . . . . . . . . . . . . . . . . . . . . . . . . . . . ix
CHAPTER 1. INTRODUCTION . . . . . . . . . . . . . . . . . . . . . . . . . . . . . . . . . . . . . . . . . . . . . . 1-1OVERVIEW . . . . . . . . . . . . . . . . . . . . . . . . . . . . . . . . . . . . . . . . . . . . . . . . . . . . . . . . . . . . 1-1OBJECTIVES . . . . . . . . . . . . . . . . . . . . . . . . . . . . . . . . . . . . . . . . . . . . . . . . . . . . . . . . . . . 1-1RESEARCH APPROACH . . . . . . . . . . . . . . . . . . . . . . . . . . . . . . . . . . . . . . . . . . . . . . . . . 1-2TERMINOLOGY . . . . . . . . . . . . . . . . . . . . . . . . . . . . . . . . . . . . . . . . . . . . . . . . . . . . . . . . 1-2REFERENCES . . . . . . . . . . . . . . . . . . . . . . . . . . . . . . . . . . . . . . . . . . . . . . . . . . . . . . . . . . 1-5
CHAPTER 2. LITERATURE REVIEW . . . . . . . . . . . . . . . . . . . . . . . . . . . . . . . . . . . . . . . . 2-1OVERVIEW . . . . . . . . . . . . . . . . . . . . . . . . . . . . . . . . . . . . . . . . . . . . . . . . . . . . . . . . . . . . 2-1PEDESTRIAN SAFETY IN TEXAS . . . . . . . . . . . . . . . . . . . . . . . . . . . . . . . . . . . . . . . . . 2-1INTERSECTION TRAFFIC CONTROL . . . . . . . . . . . . . . . . . . . . . . . . . . . . . . . . . . . . . . 2-2LEFT-TURN-RELATED SAFETY ISSUES . . . . . . . . . . . . . . . . . . . . . . . . . . . . . . . . . . . 2-8CANDIDATE TRAFFIC ENGINEERING TREATMENTS . . . . . . . . . . . . . . . . . . . . . . 2-18REFERENCES . . . . . . . . . . . . . . . . . . . . . . . . . . . . . . . . . . . . . . . . . . . . . . . . . . . . . . . . . 2-19
CHAPTER 3. STATE OF THE PRACTICE REVIEW . . . . . . . . . . . . . . . . . . . . . . . . . . . 3-1OVERVIEW . . . . . . . . . . . . . . . . . . . . . . . . . . . . . . . . . . . . . . . . . . . . . . . . . . . . . . . . . . . . 3-1PRACTITIONER INTERVIEW . . . . . . . . . . . . . . . . . . . . . . . . . . . . . . . . . . . . . . . . . . . . . 3-1EXPERT PANEL DISCUSSION . . . . . . . . . . . . . . . . . . . . . . . . . . . . . . . . . . . . . . . . . . . 3-10
CHAPTER 4. MODEL DEVELOPMENT AND DATA COLLECTION . . . . . . . . . . . . . 4-1OVERVIEW . . . . . . . . . . . . . . . . . . . . . . . . . . . . . . . . . . . . . . . . . . . . . . . . . . . . . . . . . . . . 4-1OPERATIONS MODEL AND DATA COLLECTION PLAN . . . . . . . . . . . . . . . . . . . . . 4-1SAFETY MODEL AND DATA COLLECTION PLAN . . . . . . . . . . . . . . . . . . . . . . . . . . 4-8REFERENCES . . . . . . . . . . . . . . . . . . . . . . . . . . . . . . . . . . . . . . . . . . . . . . . . . . . . . . . . . 4-13
CHAPTER 5. DATA REDUCTION AND SUMMARY . . . . . . . . . . . . . . . . . . . . . . . . . . . 5-1OVERVIEW . . . . . . . . . . . . . . . . . . . . . . . . . . . . . . . . . . . . . . . . . . . . . . . . . . . . . . . . . . . . 5-1OPERATIONS DATA . . . . . . . . . . . . . . . . . . . . . . . . . . . . . . . . . . . . . . . . . . . . . . . . . . . . . 5-1SAFETY DATA . . . . . . . . . . . . . . . . . . . . . . . . . . . . . . . . . . . . . . . . . . . . . . . . . . . . . . . . . 5-3
CHAPTER 6. MODEL CALIBRATION AND GUIDELINE DEVELOPMENT . . . . . . 6-1OVERVIEW . . . . . . . . . . . . . . . . . . . . . . . . . . . . . . . . . . . . . . . . . . . . . . . . . . . . . . . . . . . . 6-1SAFETY PREDICTION MODEL CALIBRATION . . . . . . . . . . . . . . . . . . . . . . . . . . . . . 6-1ROAD-USER COST PREDICTION MODEL DEVELOPMENT . . . . . . . . . . . . . . . . . . 6-14GUIDELINE DEVELOPMENT . . . . . . . . . . . . . . . . . . . . . . . . . . . . . . . . . . . . . . . . . . . . 6-20REFERENCES . . . . . . . . . . . . . . . . . . . . . . . . . . . . . . . . . . . . . . . . . . . . . . . . . . . . . . . . . 6-26
APPENDIX A. STUDY SITE CHARACTERISTICS . . . . . . . . . . . . . . . . . . . . . . . . . . . . A-1
APPENDIX B. BEFORE-AFTER EVALUATION OF SELECTED TREATMENTS . . B-1

viii
LIST OF FIGURES
Figure Page
1-1 Intersection Conflict Areas . . . . . . . . . . . . . . . . . . . . . . . . . . . . . . . . . . . . . . . . . . . . . . 1-42-1 Guidelines for Determining Left-Turn Mode . . . . . . . . . . . . . . . . . . . . . . . . . . . . . . . . 2-42-2 Pedestrian Level of Service Based on Traffic Volume . . . . . . . . . . . . . . . . . . . . . . . . . 2-92-3 Crash Frequency Based on Traffic Volume . . . . . . . . . . . . . . . . . . . . . . . . . . . . . . . . . 2-102-4 Crash and Conflict Frequency for Permissive Operation . . . . . . . . . . . . . . . . . . . . . . 2-122-5 Crash and Conflict Relationship for Permissive Operation . . . . . . . . . . . . . . . . . . . . . 2-132-6 Crash and Conflict Frequency for Unopposed Left-Turn Operation . . . . . . . . . . . . . . 2-132-7 Crash and Conflict Relationship for Unopposed Left-Turn Operation . . . . . . . . . . . . 2-152-8 Relationship between Pedestrian Volume and Vehicle Delay . . . . . . . . . . . . . . . . . . . 2-183-1 Interview Questions for Texas Agencies . . . . . . . . . . . . . . . . . . . . . . . . . . . . . . . . . . . . 3-23-2 Interview Questions for Agencies Outside of Texas . . . . . . . . . . . . . . . . . . . . . . . . . . . 3-33-3 E-Discussion Questions . . . . . . . . . . . . . . . . . . . . . . . . . . . . . . . . . . . . . . . . . . . . . . . . 3-123-4 Factors Contributing to Conflicts . . . . . . . . . . . . . . . . . . . . . . . . . . . . . . . . . . . . . . . . 3-143-5 Rank of Selected Treatments . . . . . . . . . . . . . . . . . . . . . . . . . . . . . . . . . . . . . . . . . . . . 3-154-1 Video Camera Locations . . . . . . . . . . . . . . . . . . . . . . . . . . . . . . . . . . . . . . . . . . . . . . . 4-136-1 Comparison of Observed and Predicted Legal Conflict Frequency . . . . . . . . . . . . . . . 6-56-2 Comparison of Observed and Predicted Illegal Conflict Frequency . . . . . . . . . . . . . . . 6-76-3 Comparison of Observed and Predicted Legal Pedestrian Volume . . . . . . . . . . . . . . . . 6-96-4 Left-Turn Mode Selection Based on Pedestrian Safety . . . . . . . . . . . . . . . . . . . . . . . . 6-21

ix
LIST OF TABLES
Table Page
2-1 Pedestrian Crash Statistics . . . . . . . . . . . . . . . . . . . . . . . . . . . . . . . . . . . . . . . . . . . . . . . . 2-22-2 Pedestrian Clearance Time . . . . . . . . . . . . . . . . . . . . . . . . . . . . . . . . . . . . . . . . . . . . . . . . 2-72-3 Traffic Engineering Treatments for Improving Pedestrian Safety at Intersections . . . . 2-193-1 Public Agencies Represented in the Practitioner Interview . . . . . . . . . . . . . . . . . . . . . . . 3-43-2 Crosswalk Provision Trends at Urban Signalized Intersections . . . . . . . . . . . . . . . . . . . 3-63-3 Classification of High-Pedestrian-Volume Intersections . . . . . . . . . . . . . . . . . . . . . . . . . 3-73-4 Public Agencies Represented in the Expert Panel Discussion . . . . . . . . . . . . . . . . . . . . 3-103-5 Conflict Occurrence Response Analysis . . . . . . . . . . . . . . . . . . . . . . . . . . . . . . . . . . . . 3-164-1 Comparison of Simulation Tool Capabilities . . . . . . . . . . . . . . . . . . . . . . . . . . . . . . . . . . 4-34-2 Test Bed Geometric and Signalization Characteristics . . . . . . . . . . . . . . . . . . . . . . . . . . 4-44-3 Test Bed Traffic Characteristics . . . . . . . . . . . . . . . . . . . . . . . . . . . . . . . . . . . . . . . . . . . . 4-54-4 Test Bed Modifications for Each Pedestrian Treatment . . . . . . . . . . . . . . . . . . . . . . . . . 4-64-5 Variables in Conflict Database . . . . . . . . . . . . . . . . . . . . . . . . . . . . . . . . . . . . . . . . . . . . 4-114-6 Study Site Description . . . . . . . . . . . . . . . . . . . . . . . . . . . . . . . . . . . . . . . . . . . . . . . . . . 4-125-1 Summary of Intersection Delay Statistics by Treatment . . . . . . . . . . . . . . . . . . . . . . . . . 5-25-2 Percent Change in Intersection Delay by Treatment . . . . . . . . . . . . . . . . . . . . . . . . . . . . 5-35-3 Cycle and Pedestrian Counts by Site Category . . . . . . . . . . . . . . . . . . . . . . . . . . . . . . . . 5-45-4 Legal Pedestrian Distribution by Gender and Age Group . . . . . . . . . . . . . . . . . . . . . . . . 5-45-5 Vehicular Volumes by Site Category . . . . . . . . . . . . . . . . . . . . . . . . . . . . . . . . . . . . . . . . 5-55-6 Pedestrian Volumes by Site Category . . . . . . . . . . . . . . . . . . . . . . . . . . . . . . . . . . . . . . . 5-55-7 Pedestrian Volumes and Platoon Patterns . . . . . . . . . . . . . . . . . . . . . . . . . . . . . . . . . . . . 5-65-8 Pedestrian-Based Conflicts by Site Category . . . . . . . . . . . . . . . . . . . . . . . . . . . . . . . . . 5-76-1 Calibrated Model Statistical Description–Legal Pedestrian-Vehicle Conflict Model . . . 6-36-2 Calibrated Model Statistical Description–Illegal Pedestrian-Vehicle Conflict Model . . 6-66-3 Calibrated Model Statistical Description–Legal Pedestrian Volume Model . . . . . . . . . . 6-86-4 Crash Distribution at Urban Signalized Intersections in Texas . . . . . . . . . . . . . . . . . . . 6-106-5 Study Site Left-Turn-Related Pedestrian-Vehicle Safety Statistics . . . . . . . . . . . . . . . . 6-116-6 Left-Turn-Related Pedestrian-Vehicle Conflict Analysis . . . . . . . . . . . . . . . . . . . . . . . 6-136-7 Left-Turn-Related Pedestrian-Vehicle Crash Analysis . . . . . . . . . . . . . . . . . . . . . . . . . 6-136-8 Average Cost of a Left-Turn-Related Pedestrian-Vehicle Crash at an
Urban Signalized Intersection . . . . . . . . . . . . . . . . . . . . . . . . . . . . . . . . . . . . . . . . . . . . 6-156-9 Average Value of Travel Time . . . . . . . . . . . . . . . . . . . . . . . . . . . . . . . . . . . . . . . . . . . . 6-156-10 Effect of Pedestrian Treatments on Delay and Conflicts at Intersections . . . . . . . . . . . 6-25


1-1
CHAPTER 1. INTRODUCTION
OVERVIEW
There are about 6000 pedestrian-involved crashes each year in Texas. This number is smallcompared to the 300,000 vehicle-vehicle crashes in Texas. However, an examination of pedestrian-related crash rates on a nationwide basis indicates that Texas ranks in the top 16 states. This trendsuggests that there is potential for pedestrian safety improvement on Texas highways. Closerexamination of the data indicate that this trend extends to pedestrian safety at signalizedintersections in Texas.
For intersections with a permissive or a protected-permissive left-turn mode, pedestrianscross during the permissive period along with the parallel through vehicular movement. Thisrequires the left-turn driver to yield to both opposing vehicles and pedestrians prior to accepting anappropriate gap. Pedestrian crash risks are increased in these complicated driving conditions becauseleft-turn drivers sometimes make misjudgments and fail to yield to pedestrians.
Existing left-turn mode selection guidelines focus mainly on the vehicular traffic conditionsat the intersection. Few of them include specific consideration of pedestrian safety. For example,existing guidelines for protected-permissive control typically focus on the left-turn and opposingthrough traffic volumes. Very few of these guidelines include a sensitivity to pedestrian volume orother pedestrian safety-related factors (e.g., crossing distance, median presence and width, driversight distance, pedestrian compliance).
OBJECTIVES
The primary objective of this project was to incorporate pedestrian safety considerations intothe guidelines for selecting left-turn operational mode (i.e., protected, protected-permissive, orpermissive). A secondary objective was to develop guidelines addressing a broader range oftreatments that may be used to improve pedestrian safety at signalized intersections. The focus ofthe research was on conflicts between left-turning vehicles and pedestrians.
To achieve these objectives, the research was comprehensive in its consideration ofpedestrian safety issues at signalized intersections in Texas. The guidelines were documented in twoforms. Guidelines to assist in the determination of the appropriate left-turn mode were documentedin the report titled Pedestrian Safety Guidelines and Proposed Left-Turn Phase Warrant. Thisdocument serves as a quick reference guide that identifies conditions where protected or protected-permissive operation is a cost-effective treatment for pedestrian-related safety problems.
Guidelines were also documented in an updated version of the Traffic Signal OperationsHandbook (previously developed for TxDOT in Project 0-5629). The guidelines that were added tothe Handbook address changes to the signal timing, phase sequence, or pedestrian crossing distanceto minimize left-turn-related pedestrian-vehicle conflicts and improve pedestrian safety.

1-2
RESEARCH APPROACH
A two-year program of research was developed to satisfy the project’s research objectives.During the first year of research, city, county, and state engineers were interviewed, and field datawere collected to ascertain the range of pedestrian safety concerns at intersections. The data weresubsequently used to quantify the impacts of alternative left-turn modes (and other treatments) onsafety and efficiency. During the second year, the field data and input from an expert panel wereused to develop guidelines that are sensitive to a wide range of intersection conditions, and areapplicable on a statewide basis.
The research approach consists of eight tasks that represent a logical sequence of review,research, evaluation, and workshop development. These tasks are identified in the following list.
1. Finalize Work Plan.2. Evaluate State-of-the-Practice.3. Develop Data Collection Plan and Collect Data.4. Reduce Data.5. Develop and Evaluate Preliminary Guidelines.6. Conduct Before-After Study.7. Conduct Pilot Workshop and Revise Guidelines.8. Prepare Research Report.
The research conducted in Tasks 1 through 8 is documented in this report.
TERMINOLOGY
This section defines various terms that are used in this report.
Crosswalk Area
The crosswalk area is the area of pavement outlined by the curb line and a line offsetoutwardly from (and parallel to) the crosswalk by 10 ft. Thus, the crosswalk area for a crosswalkthat is 12 ft wide is effectively 32 ft wide (= 10 + 12 + 10). This definition recognizes that somepedestrians crossing at the intersection do not walk fully within the marked crosswalk for some orall of their crossing, but are considered to be compliant with the crosswalk’s intended purpose (1).
Pedestrian-Vehicle Conflict
A pedestrian-vehicle conflict is defined as an event where the projected path of a vehicle anda pedestrian cross and either the pedestrian or the vehicle, or both, make a last-second change intheir path direction, speed, or both to avoid a collision. This definition is consistent with that usedby several researchers (2, 3). Lord (4) compared crash data and conflict data for commonintersections, where conflicts were defined using this definition. He found very good agreement (R2
= 0.59) between the two statistics.

1-3
In their definition of conflict, Carter et al. (5) considered the time span associated with thechange in path direction, speed, or both. They consider the most sudden changes in course to be aconflict and the non-sudden (i.e., slower) changes to be an “avoidance maneuver.” However, duringtheir field studies, they found it difficult to distinguish between these two categories and chose tocombine them for purposes of pedestrian safety assessment. For this reason, the aforementioneddefinition of pedestrian-vehicle conflict is defined to include avoidance maneuvers.
Pedestrian-Based Conflict
A pedestrian-based conflict is a conflict where a pedestrian in the crosswalk changes his orher path direction, speed, or both to avoid a vehicle. The vehicle may, or may not, alter its course.For a given left-turn vehicle, there can be several conflicts if several pedestrians alter their course.In the extreme, the number of pedestrian-based conflicts is equal to the product of the pedestrianvolume and the vehicular volume (i.e., every pedestrian is conflicted by every vehicle). Typicalpedestrian-based conflicts include (5):
! Pedestrian stepped into roadway and then stepped back onto the curb to let vehicle pass.! Pedestrian went around vehicle that was blocking crosswalk.! Pedestrian hurried while crossing to avoid oncoming vehicle.! Pedestrian stopped (or noticeably slowed) while crossing to let vehicle cross.! Pedestrian delayed leaving the origin curb due to a vehicle.! Pedestrian attempted to cross but did not leave the origin curb.
Vehicle-Based Conflict
A vehicle-based conflict is a conflict where one or more vehicles change path direction, speed, orboth to avoid pedestrians and no pedestrians alter their course. A second vehicle may be involvedin this conflict (e.g., same lane, opposing through). In the extreme, the number of vehicle-basedconflicts is equal to the subject vehicle volume.
Pedestrian Signal Violation
A pedestrian signal violation occurs when a pedestrian begins the crossing (i.e., steps frombehind the curb into the crosswalk) during the flashing DON’T WALK or the steady DON’T WALKindications.
Following field measurement of pedestrian signal violations, Kattan et al. (6) observed thatsome pedestrians could enter the crosswalk 2 to 3 s after the end of the WALK indication and stillcomplete the crossing before the end of the flashing DON’T WALK indication. They rationalizedthat, while pedestrians in this group were technically violating the signal, they were not associatedwith as high a safety risk as those pedestrians that started crossing well after the end of the WALKindication.
Pedestrian-Vehicle Conflict Area
When evaluating conflicts between left-turning vehicles and pedestrians, some researchershave found it useful to define the conflict area within which the associated conflicts occur (4, 7).

1-4
Peds
Pedestrian-vehicle conflict zone
Receiving lanes
Opposing lanes
Subject approach
10 ft10 ft
- Crosswalk area
Vehicle-vehicle conflict zone
One benefit to this approach is that it focuses the analysis of turn-related conflicts and minimizesthe potential for non-turn-related conflicts to be included in the conflict count. Figure 1-1 illustratesthe location of the pedestrian-vehicle conflict area for left-turning vehicles. It is shown to be as wideas the crosswalk area and as long as the width of the receiving lanes.
Figure 1-1. Intersection Conflict Areas.
Vehicle-Vehicle Conflict Area
Left-turning vehicles sometimes conflict with vehicles in the opposing traffic stream. Theseconflicts can occur when the left-turn vehicle misjudges the adequacy in a gap in the opposingstream. They can also occur when the gap is judged accurately but pedestrian presence in theconflicting crosswalk was not detected until after committing to the left turn. In this situation, theleft-turning vehicle stops in the path of the opposing traffic stream, which often causes a conflictwith one or more opposing vehicles. These conflicts are relevant to pedestrian safety researchbecause they are indirectly related to pedestrian activity in the crosswalk. Figure 1-1 illustrates thelocation of the vehicle-vehicle conflict area for left-turning vehicles. It is shown to be as wide as theopposing through traffic lanes and as long as the width of the receiving lanes.
Legal Pedestrian
A legal pedestrian is considered to be a pedestrian that: (1) enters the crosswalk area duringthe WALK indication, (2) attempts to enter the crosswalk area during the WALK indication but isprevented from doing so by a turning vehicle, or (3) is present to cross during the WALK indication

1-5
but the pedestrian density is so great that the crossing is delayed until the flashing DON’T WALKis displayed.
REFERENCES
1. Sisiopiku, V., and D. Akin. “Pedestrian Behaviors at and Perceptions Towards VariousPedestrian Facilities: An Examination Based on Observation and Survey Data.” TransportationResearch Part F. Vol. 6. Elsevier Ltd., 2003, p. 249–274.
2. Davis, S., H. Robertson, and L. King. “Pedestrian/Vehicle Conflicts: An Accident PredictionModel. Transportation Research Record 1210. Transportation Research Board, Washington,D.C., 1989, pp. 1–11.
3. Ragland, D., F. Markowitz, and K. MacLeod. “An Intensive Pedestrian Safety EngineeringStudy Using Computerized Crash Analysis.” Institute of Transportation Studies, University ofCalifornia - Berkeley Traffic Safety Center, 2003.
4. Lord, D. “Analysis of Pedestrian Conflicts with Left-Turning Traffic.” Transportation ResearchRecord 1538. Transportation Research Board, Washington, D.C., 1996, pp. 61–67.
5. Carter, D., W. Hunter, C. Zegeer, R. Stewart, and H. Huang. Pedestrian and BicyclistIntersection Safety Indices: Final Report. Report FHWA-HRT-06-125. Federal HighwayAdministration, McLean, Virginia, November 2006.
6. Kattan, L., S. Acharjee, and R. Tay. “Pedestrian Scramble Operations: Pilot Study in Calgary,Alberta, Canada.” Transportation Research Record 2140. Transportation Research Board,Washington, D.C., 2009, pp. 79–84.
7. Akin, D., and V. Sisiopiku. “Modeling Interactions between Pedestrians and Turning-Vehiclesat Signalized Crosswalks Operating Under Combined Pedestrian-Vehicle Interval.” Paper No.07-2710. Presented at the 86th Annual Meeting of the Transportation Research Board,Washington, D.C., January 2007.


2-1
CHAPTER 2. LITERATURE REVIEW
OVERVIEW
For intersections with a permissive or protected-permissive left-turn mode, pedestrians crossduring the permissive period. This period occurs during the phase serving opposing through vehiclessuch that pedestrians cross when the adjacent through vehicles receive a green indication. Thisoperation requires the left-turn driver to yield to both opposing vehicles and pedestrians, prior toaccepting a gap and completing the turn. Pedestrian crash risks are increased in these complicateddriving conditions because left-turn drivers sometimes fail to yield to the pedestrians.
Existing guidelines for the selection of left-turn mode (e.g., permissive, protected, andprotected-permissive) focus mainly on vehicular traffic conditions at the intersection. Very few ofthese guidelines include a sensitivity to pedestrian volume or other pedestrian-safety-related factors.
This chapter documents a review of the literature that addresses the topic of pedestrians atsignalized intersections. The focus of the review is on research that describes the conflict betweenpedestrians and left-turning vehicles.
There are four parts to this chapter that follow this introductory part. The first part providessome background information on pedestrian safety at intersections in Texas. The second partdescribes the traffic control elements at signalized intersections that apply to either left-turnmovements or pedestrian movements. The third part summarizes research that has quantifiedpedestrian safety and service quality at intersections. The fourth part summarizes the findings relatedto traffic engineering treatments that address left-turn-related pedestrian safety at intersections.
PEDESTRIAN SAFETY IN TEXAS
Data maintained by the National Highway Traffic Safety Administration (NHTSA) indicatethat 4654 pedestrian fatalities occurred in the U.S. in 2007, 387 of which occurred in Texas. Thisnumber has gradually declined about 1.5 percent each year during the past seven years. NHTSA alsoestimates that an additional 70,000 pedestrians were injured in 2007, for a total of 74,654 pedestrianinvolvements.
The NHTSA data indicate that 933 pedestrian fatalities occurred at signalized intersectionsin the U.S. in 2007, 78 of which occurred in Texas. These data indicate that about 20 percent ofpedestrian fatalities occur at signalized intersections, which is consistent with the findings reportedby Campbell et al. (1) in their analysis of data from the early 1990s. These statistics are summarizedin Table 2-1.
There are several statistics of note in the data in Table 2-1. The exposure analysis indicatesthat Texas has a higher rate of pedestrian fatalities and involvements than the U.S. average. Acomparison of these rates with those of other states indicates that Texas ranks in the top 16 states.Texas’ over-representation in these rates extends to signalized intersections.

2-2
Table 2-1. Pedestrian Crash Statistics.Location Units Texas U.S.
Crash Frequency
All Pedestrian fatalities/yr 387 4654
Pedestrian involvements/yr 6214 74,654
Vehicle-vehicle crashes/yr 300,000 --
Signalized intersections Pedestrian fatalities/yr 78 933
Pedestrian involvements/yr 1541 18,509
Exposure Analysis
Exposure Million-vehicle-miles (mvm) 24.4 301.9
All Pedestrian fatalities/mvm 15.9 15.4
Signalized intersections Pedestrian fatalities/mvm 3.2 3.1
Crash Cost Analysis (Willingness-to-Pay Basis)
Pedestrian-vehicle crash $200,000/ped. involvement $1.2 billion/yr --
Vehicle-vehicle crash $50,000/veh-veh crash $15 billion/yr --Note:1 - Involvements = number of pedestrians that are injured or killed as a result of pedestrian-vehicle crashes.
The number of pedestrian involvements each year in Texas (6214) is small compared to theannual number of vehicle-vehicle crashes in Texas (300,000). In fact, pedestrian involvementsconstitute only about 2 percent of the state’s total crashes. However, the severity of a pedestriancrash is much greater than that of a typical vehicle-vehicle crash. A crash cost analysis (based onthe willingness-to-pay approach that includes a fatal crash cost estimate of $4 million) indicates thatthe average cost of a pedestrian involvement is about $200,000, compared to a cost of $50,000 forthe average vehicle-vehicle crash. Thus, the estimated cost of pedestrian-related crashes to Texastravelers is $1.2 billion/yr, which is about 8 percent of the total Texas crash cost.
INTERSECTION TRAFFIC CONTROL
This part of the chapter describes the traffic control elements at signalized intersections thatapply to either left-turn movements or pedestrian movements. The first section reviews the variousleft-turn operational modes and phase sequences used. The second section describes pedestriansignal settings and controller operation to accommodate pedestrian movements.
Left-Turn Control
Operational Mode
The left-turn operational mode is described as protected, protected-permissive, or permissive.A variety of guidelines exist that indicate conditions where the benefits provided by one modetypically outweigh those of other modes. Many of these guidelines indicate that a left-turn phase canbe justified based on consideration of several factors that ultimately tie back to the operational orsafety benefits derived from the phase. These factors include:

2-3
! Left-turn and opposing through volumes.! Number of opposing through lanes.! Cycle length.! Speed of opposing traffic.! Sight distance.! Crash history.
Of note about this list is its lack of a factor that reflects pedestrian presence or flow rate.
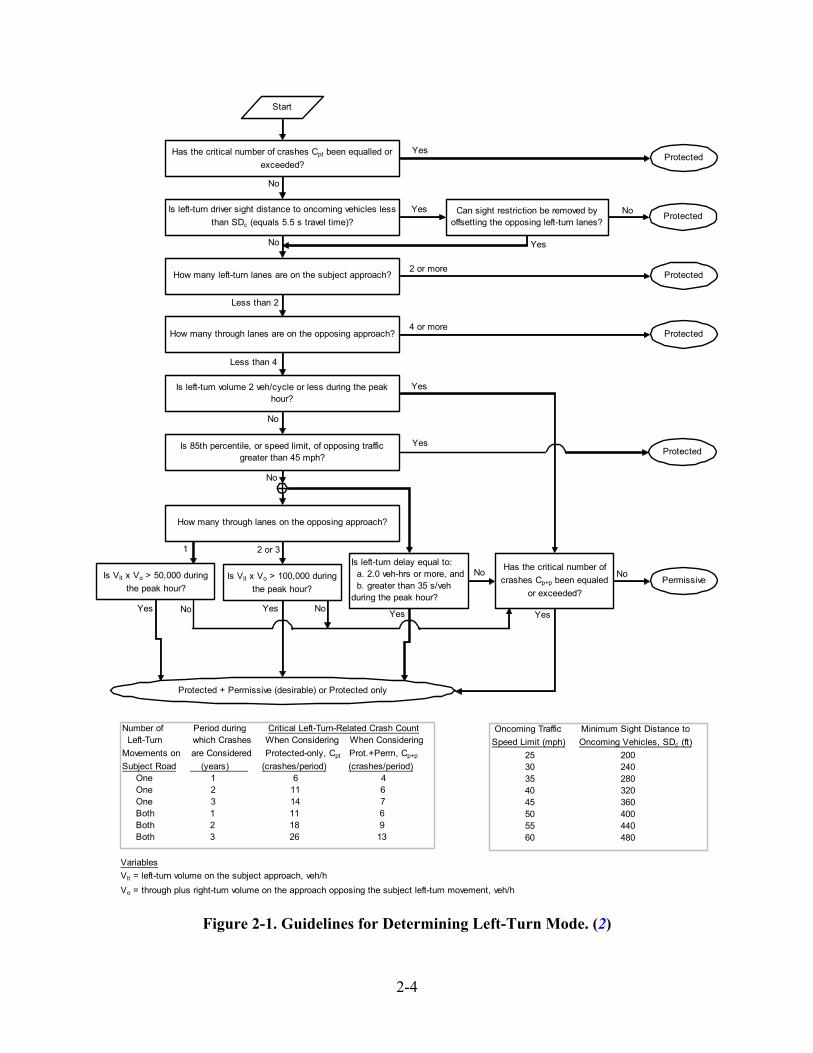
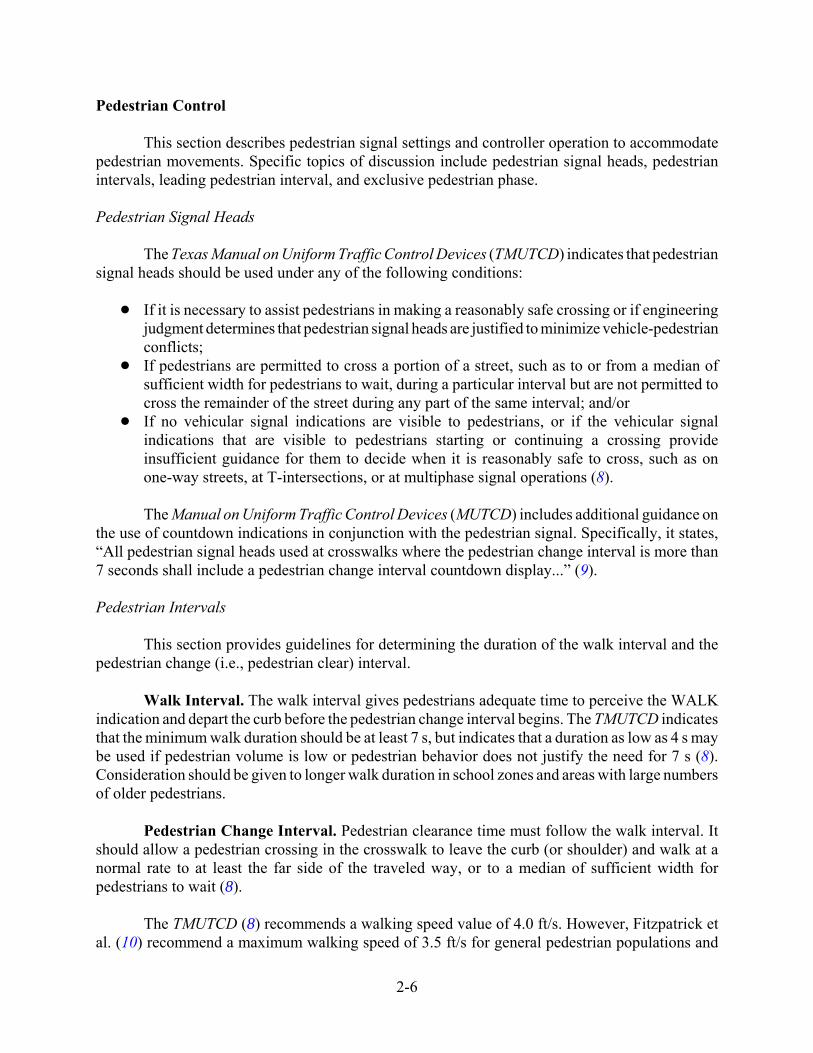
The flowchart shown in Figure 2-1 presents the guidelines provided in the TxDOT TrafficSignal Operations Handbook (2). They are used to assist in the determination of whether a left-turnphase is needed for a given left-turn movement and whether the operational mode should bepermissive, protected, or protected-permissive. These guidelines were derived from a variety ofauthoritative reference documents (3, 4, 5). The criteria used to determine the operational mode areidentified in the various boxes of the flow chart.
Guidelines were more recently developed by Yu et al. (6) to address left-turn mode selection.These guidelines include many of the same considerations represented in Figure 2-1. However, thereis a notable difference in the thresholds used for the Volume Cross Product check.
Phase Sequence
Leading, lagging, or split phasing is used when a left-turn phase operates in the protected orprotected-permissive mode. The terms leading and lagging indicate the order in which the left-turnphase is presented, relative to the phase serving the conflicting through movement. Leading left-turnphasing has the left-turn phase occurring before the phase serving the conflicting through movement.Lagging left-turn phasing has the left-turn phase occurring last. Split phasing allows all movementson one approach to proceed before those on the opposing approach.
For typical intersections, research indicates that lead-lead, lag-lag, and lead-lag phasingprovide about the same operational efficiency and safety. Split phasing tends to be less efficient thanthe other sequences at typical intersections. Thus, the choice between lead-lead, lag-lag, and lead-lagis often based on agency preference or identified benefits to signal coordination. Lag-lag and splitphasing are sometimes beneficial at intersections with atypical geometric configurations or volumeconditions.
2-4
Figure 2-1. Guidelines for Determining Left-Turn Mode. (2)
Has the critical number of crashes Cpt been equalled or
exceeded?
Is left-turn driver sight distance to oncoming vehicles less
than SDc (equals 5.5 s travel time)?
Number of Period during Critical Left-Turn-Related Crash Count Left-Turn which Crashes When Considering When Considering
Movements on are Considered Protected-only, Cpt Prot.+Perm, Cp+p
Subject Road (years) (crashes/period) (crashes/period) One 1 6 4 One 2 11 6 One 3 14 7 Both 1 11 6 Both 2 18 9 Both 3 26 13
Oncoming Traffic Minimum Sight Distance to
Speed Limit (mph) Oncoming Vehicles, SDc (ft)
25 200 30 240 35 280 40 320 45 360 50 400
55 440 60 480
How many left-turn lanes are on the subject approach?
How many through lanes are on the opposing approach?
Is left-turn volume 2 veh/cycle or less during the peak hour?
Is 85th percentile, or speed limit, of opposing traffic greater than 45 mph?
How many through lanes on the opposing approach?
Is Vlt x Vo > 50,000 during
the peak hour?Is Vlt x Vo > 100,000 during
the peak hour?
Is left-turn delay equal to: a. 2.0 veh-hrs or more, and b. greater than 35 s/vehduring the peak hour?
Has the critical number of
crashes Cp+p been equaled
or exceeded?
Protected
ProtectedCan sight restriction be removed by
offsetting the opposing left-turn lanes?
Protected
Protected
Permissive
Start
Protected + Permissive (desirable) or Protected only
No
Yes
Yes
No
No
Yes
2 or more
Less than 2
4 or more
Less than 4
No
Yes
1
ProtectedYes
No
2 or 3
Yes No NoYesYes
No
Yes
No
Variables
Vlt = left-turn volume on the subject approach, veh/h
Vo = through plus right-turn volume on the approach opposing the subject left-turn movement, veh/h
2-5
Lead-Lead Left-Turn Phasing. The most commonly used left-turn phase sequence is thelead-lead sequence, which has both opposing left-turn phases starting at the same time. Theadvantages of this phasing option are:
! It is consistent with driver expectation such that drivers react quickly to the leading greenarrow indication.
! It minimizes conflicts between left-turn and through vehicles on opposing approaches byclearing left-turn vehicles first and, thereby, reducing the number of left-turn drivers thatmust find safe gaps.
! It minimizes conflicts between left-turn and through movements on the same approach whenthe left-turn volume exceeds its available storage length.
Lag-Lag Left-Turn Phasing. This left-turn phase sequence has both opposing left-turnphases ending at the same time. The advantages of the lag-lag phasing option are:
! It ensures that both adjacent through phases start at the same time—a characteristic that isparticularly amenable to efficient signal coordination with pretimed control.
! If used with the protected-permissive mode, it minimizes presentation of the left-turn phaseduring low-volume conditions by clearing left-turn vehicles during the initial through phase.
! If used with the protected-permissive mode for the major road as part of a coordinated signalsystem, then it reduces delay to major-road left-turn movements by serving them soon afterarrival.
The “yellow trap” problem is created when lag-lag phasing is used for opposing left-turnmovements, and the left-turn phases operate in the protected-permissive mode. Flashing-yellow-arrow operation is one technique for eliminating this problem. It retains a permissive indication forleft-turn drivers during the change period for the adjacent through movement phase (7).
Lead-Lag Left-Turn Phasing. The lead-lag left-turn phase sequence is sometimes used toaccommodate through movement progression in a coordinated signal system. The aforementionedyellow trap may occur if the leading left-turn movement operates in the protected-permissive modeand the two through movement phases time concurrently during a portion of the cycle. Thissequence may also be used at intersections where the leading left-turn movement is not provided anexclusive storage bay (or a bay is provided but it does not have adequate storage).
Split Phasing. Split phasing refers to the sequential service of opposing intersectionapproaches in two phases. This phasing is typically less efficient than lead-lead, lead-lag, or lag-lagleft-turn phasing. It often increases the cycle length, or if the cycle length is fixed, it reduces the timeavailable to the intersecting road. Split phasing may be helpful if there is a need to serve left turnsfrom the opposing approaches, but sufficient width is not available to ensure their adequateseparation in the middle of the intersection if served concurrently.
2-6
Pedestrian Control
This section describes pedestrian signal settings and controller operation to accommodatepedestrian movements. Specific topics of discussion include pedestrian signal heads, pedestrianintervals, leading pedestrian interval, and exclusive pedestrian phase.
Pedestrian Signal Heads
The Texas Manual on Uniform Traffic Control Devices (TMUTCD) indicates that pedestriansignal heads should be used under any of the following conditions:
! If it is necessary to assist pedestrians in making a reasonably safe crossing or if engineeringjudgment determines that pedestrian signal heads are justified to minimize vehicle-pedestrianconflicts;
! If pedestrians are permitted to cross a portion of a street, such as to or from a median ofsufficient width for pedestrians to wait, during a particular interval but are not permitted tocross the remainder of the street during any part of the same interval; and/or
! If no vehicular signal indications are visible to pedestrians, or if the vehicular signalindications that are visible to pedestrians starting or continuing a crossing provideinsufficient guidance for them to decide when it is reasonably safe to cross, such as onone-way streets, at T-intersections, or at multiphase signal operations (8).
The Manual on Uniform Traffic Control Devices (MUTCD) includes additional guidance onthe use of countdown indications in conjunction with the pedestrian signal. Specifically, it states,“All pedestrian signal heads used at crosswalks where the pedestrian change interval is more than7 seconds shall include a pedestrian change interval countdown display...” (9).
Pedestrian Intervals
This section provides guidelines for determining the duration of the walk interval and thepedestrian change (i.e., pedestrian clear) interval.
Walk Interval. The walk interval gives pedestrians adequate time to perceive the WALKindication and depart the curb before the pedestrian change interval begins. The TMUTCD indicatesthat the minimum walk duration should be at least 7 s, but indicates that a duration as low as 4 s maybe used if pedestrian volume is low or pedestrian behavior does not justify the need for 7 s (8).Consideration should be given to longer walk duration in school zones and areas with large numbersof older pedestrians.
Pedestrian Change Interval. Pedestrian clearance time must follow the walk interval. Itshould allow a pedestrian crossing in the crosswalk to leave the curb (or shoulder) and walk at anormal rate to at least the far side of the traveled way, or to a median of sufficient width forpedestrians to wait (8).
The TMUTCD (8) recommends a walking speed value of 4.0 ft/s. However, Fitzpatrick etal. (10) recommend a maximum walking speed of 3.5 ft/s for general pedestrian populations and
2-7
3.0 ft/s if older pedestrians are a concern. The MUTCD indicates that a walking speed of 3.5 ft/sshould be used (9). However, it also indicates that “a walking speed of up to 4.0 ft/s may be usedto evaluate the sufficiency of the pedestrian clearance time at locations where an extended pushbutton press function has been installed to provide slower pedestrians an opportunity to request alonger pedestrian clearance time” (9).
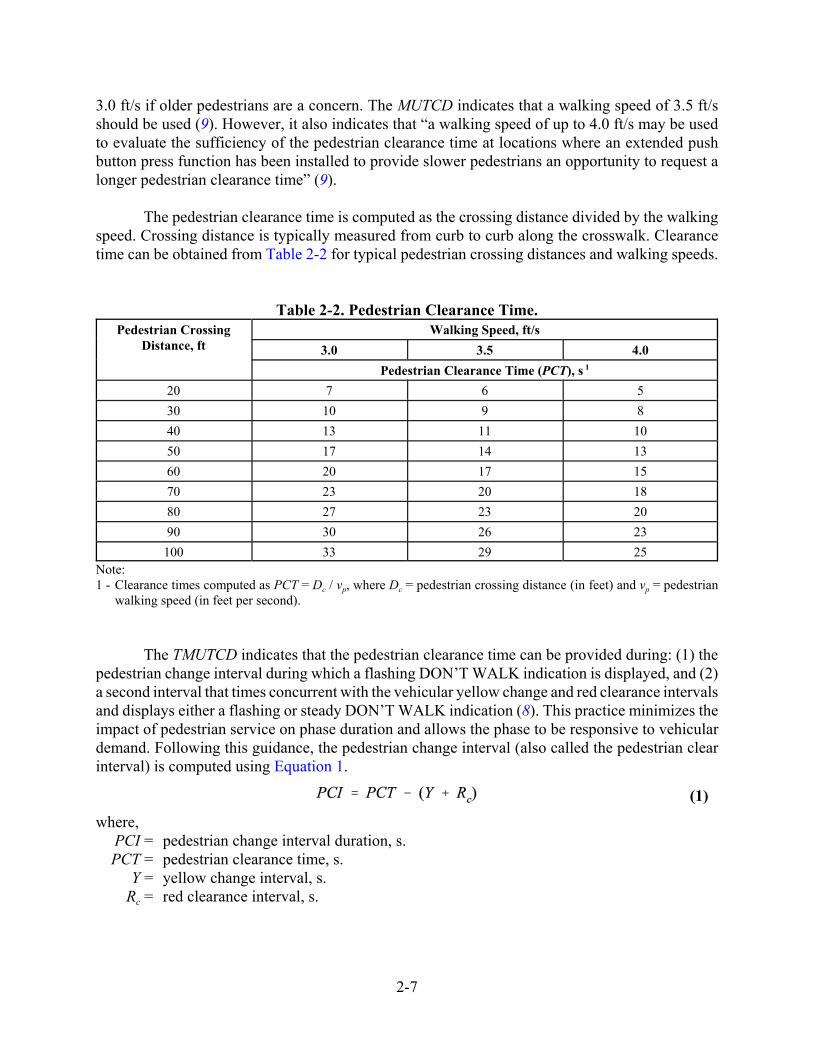
The pedestrian clearance time is computed as the crossing distance divided by the walkingspeed. Crossing distance is typically measured from curb to curb along the crosswalk. Clearancetime can be obtained from Table 2-2 for typical pedestrian crossing distances and walking speeds.
Table 2-2. Pedestrian Clearance Time.Pedestrian Crossing
Distance, ftWalking Speed, ft/s
3.0 3.5 4.0
Pedestrian Clearance Time (PCT), s 1
20 7 6 5
30 10 9 8
40 13 11 10
50 17 14 13
60 20 17 15
70 23 20 18
80 27 23 20
90 30 26 23
100 33 29 25Note:1 - Clearance times computed as PCT = Dc / vp, where Dc = pedestrian crossing distance (in feet) and vp = pedestrian
walking speed (in feet per second).
The TMUTCD indicates that the pedestrian clearance time can be provided during: (1) thepedestrian change interval during which a flashing DON’T WALK indication is displayed, and (2)a second interval that times concurrent with the vehicular yellow change and red clearance intervalsand displays either a flashing or steady DON’T WALK indication (8). This practice minimizes theimpact of pedestrian service on phase duration and allows the phase to be responsive to vehiculardemand. Following this guidance, the pedestrian change interval (also called the pedestrian clearinterval) is computed using Equation 1.
where,PCI = pedestrian change interval duration, s.PCT = pedestrian clearance time, s.
Y = yellow change interval, s.Rc = red clearance interval, s.
(1)
2-8
Leading Pedestrian Interval
The leading pedestrian interval is a feature available in most modern traffic controllers. Itdisplays the WALK indication a few seconds before the green ball indication. In this manner thepedestrians can establish a presence in the crosswalk before turning vehicles receive the permissivegreen indication. A lagging pedestrian interval is also available in most controllers, but it givespreference to vehicular traffic by allowing them to start before the pedestrians.
Exclusive Pedestrian Phase
An exclusive pedestrian phase serves all pedestrian crossing movements simultaneously,while holding all vehicular movements with a red signal indication. The minimum duration of thephase is sufficient to allow the pedestrian to react to the WALK indication and cross one intersectionleg, perpendicular to the direction of traffic flow. This type of phasing is occasionally used in thecentral business district of large cities.
A variation of the exclusive pedestrian phase is the “pedestrian scramble.” It permitspedestrians to cross on a diagonal path through the intersection conflict area. It also allows the moretraditional, perpendicular crossing movements across an intersection leg. The timing of this phaseis sufficient to allow the pedestrian to react and cross the longest diagonal path.
LEFT-TURN-RELATED SAFETY ISSUES
This part of the chapter summarizes the research that has quantified intersection pedestrianservice quality and safety, as influenced by left-turning vehicles. Initially, a model is described forestimating the pedestrian’s perception of service quality provided at an intersection. Then, a seriesof safety prediction models are examined. These models predict the frequency of pedestrian crashesat intersections. Next, the effect of left-turn control on pedestrian safety is examined. Finally,alternative pedestrian controls are examined in the context of their reported ability to improvepedestrian safety.
Pedestrian Service at Signalized Intersections
Dowling et al. (11) developed procedures for quantifying the level of service provided topedestrians at signalized intersections. The procedure consists of a series of calculations that focuson quantifying the service provided by one crosswalk at the intersection; it is repeated as needed foreach crosswalk of interest. The procedure is sensitive to the volume of right-turning and left-turningvehicles crossing the crosswalk. It also considers the delay incurred by pedestrians and the speedof the through traffic stream. Output from the procedure is a numeric score ranging from 1 to 6.Lower values indicate a very good level of service. In fact, values less than or equal to 2.0 representlevel-of-service A, values between 2.0 and 2.75 represent level-of-service B, and so on.
The procedure was used to evaluate the sensitivity of pedestrian level of service to trafficvolume and turn percentage. The intersection used for the evaluation had four legs and two laneson each approach. Two volume scenarios were evaluated. In one scenario, the turn movements wereeach 10 percent of the approach volume. In the other scenario, turn movements were each 20 percent

2-9
1.0
1.5
2.0
2.5
3.0
3.5
4.0
0 500 1000 1500 2000
Major-Street Approach Volume, veh/h
Pe
de
str
ian
Le
ve
l of
Ser
vic
e
Left and right turns = 10% of approach volume
Minor-street volume = major-street volume
A
B
C
D
E
20% turns
of the approach volume. The major-street volume equaled the minor-street volume for bothscenarios. Each phase duration was computed to be in proportion to its flow ratio. The results of theevaluation are shown in Figure 2-2.
Figure 2-2. Pedestrian Level of Service Based on Traffic Volume.
The trends in Figure 2-2 reflect the analysis of one crosswalk at a signalized intersection. Thenumeric scores indicating level of service are reflected on the y-axis on the left side of the figure.The corresponding level-of-service letter is indicated on the right side of the figure. The two trendlines indicate that pedestrian level of service degrades as approach volume increases. The increasein turn percentage is also shown to have a negative effect on service quality. It reflects the increasedconflict between turning vehicles and pedestrians when using the crosswalk.
Pedestrian Safety at Signalized Intersections
Lyon and Persaud (12) examined pedestrian crash frequency for signalized intersections inToronto, Canada. They gathered pedestrian volume and vehicle volume data for 684 four-legintersections and 263 three-leg intersections. Eleven years of pedestrian crash data were obtainedfor each intersection.
Lyon and Persaud used the data to calibrate one crash prediction model for four-legintersections and a second model for three-leg intersections. Both models predicted the expectedannual pedestrian crash frequency at an intersection. They included a sensitivity to the total dailyentering volume, count of pedestrians using each sidewalk during an eight-hour period (totaled forall crosswalks), and total daily left-turning volume entering the intersection. It is noted that themodels predict the annual number of reported crashes for an intersection even though the inputpedestrian volume represents only eight hours of the day.

2-10
0.0
0.2
0.4
0.6
0.8
1.0
1.2
0 5000 10000 15000 20000 25000
Major-Street Daily Volume, veh/d
Pe
de
str
ian
Cra
sh
Fre
qu
en
cy
, c
r/y
r/in
ters
ec
tio
n
4-legs, 20% left turns 4-legs, 10%
3-legs, 10%
3-legs, 20% left turns
3-legs: minor-street volume = 0.5 major-street volume4-legs: minor-street volume = major-street volume50 p/h crossing each leg for 8 hours
The models calibrated by Lyon and Persaud were used to evaluate the sensitivity ofpedestrian crash frequency to daily vehicular volume and left-turn percentage. For four-legintersections, the major-street volume equaled the minor-street volume. For three-leg intersections,the minor-street volume equaled one-half of the major-street volume. The eight-hour pedestrianvolume was based on an assumed 50 p/h in each crosswalk during each of the eight hours. Theresults of the evaluation are shown in Figure 2-3.
Figure 2-3. Crash Frequency Based on Traffic Volume.
The trend lines in Figure 2-3 indicate that pedestrian crash frequency increases with anincrease in vehicular volume. A four-leg intersection with an average daily volume of 20,000 veh/don each street, 20 percent left turns, and 20 percent right turns is likely to have one reportedpedestrian crash each year. The four-leg intersections have more than twice as many crashes as thethree-leg intersections for a given volume and turn percentage. A 15 percent increase in dailyvolume corresponds to about an 8 percent increase in crashes. In contrast, a 15 percent increase inleft-turn volume corresponds to a 4 percent increase in crashes. These trends suggest that left-turnvolume and through volume do not increase crash risk (i.e., that intersections with higher volumehave a lower crash rate). It is possible that, once the first left-turn vehicle initiates its maneuversafely, the remaining left-turn vehicles also proceed safely—regardless of their number. It followsthen, that crash risk may increase more notably with an increase in the number of signal cycles perhour.

2-11
Effect of Left-Turn Control on Pedestrian Safety
Lord (13) reviewed several research reports on the topic of left-turn-related pedestrian-vehicle crashes. He found that left-turn maneuvers account for 20 to 30 percent of all pedestriancrashes at intersections. Left-turn-related pedestrian crashes are exceeded in number only bycollisions between pedestrians and through vehicles (51 percent).
Research indicates that left-turn mode (i.e., permissive, protected-permissive, or protected)and phase sequence have some influence on the safety of the pedestrian crossing maneuver. Eachof these influences is discussed in the following subsections.
Permissive Left-Turn Mode
A driver turning left at a signalized intersection during a permissive period has to monitormultiple information sources during the maneuver. These sources include the signal indication,opposing vehicle stream, and pedestrian activity in the crosswalk that is adjacent to the opposingthrough traffic lanes. These multiple sources make the left-turn maneuver relatively complex andplace a significant demand on the driver workload. Sometimes, when this workload exceeds thedriver’s processing capability, an incorrect decision is made and a left-turn-related crash occurs.
Quaye et al. (14) examined left-turn-related pedestrian crash frequency for individualcrosswalks as a function of the pedestrian volume and left-turn volume in the crosswalk. Theycollected pedestrian and vehicular volume data for 547 crosswalks at 200 intersections in Canada.They combined this data with left-turn-related crash data for a four-year period. The resultingdatabase was used to develop a model for predicting the expected annual number of left-turn-relatedpedestrian crashes during a specified hour of the day. Thus, the model is applied to each of the24 hours during a representative day, and the 24 estimates are then added to obtain an estimate ofthe annual crash frequency for the subject crosswalk.
One of the models calibrated by Quaye et al. applies to crosswalks where the conflicting left-turn movement operated in the permissive mode and was opposed by a through vehicle trafficmovement. The predicted relationship between left-turn-related pedestrian crash frequency, left-turnvolume, and pedestrian volume is shown in Figure 2-4a.
The trends in Figure 2-4a are consistent with those in Figure 2-3 and indicate that crashfrequency increases with increasing left-turn volume. A 15 percent increase in left-turn volumecorresponds to a 5 percent increase in crash frequency. This trend suggests that left-turn volumedoes not increase crash risk—a trend that is consistent with that observed in Figure 2-3. A 15 percentincrease in pedestrian volume corresponds to a 12 percent increase in crash frequency. The nearlyone-to-one ratio of these percentages suggests that pedestrian volume has negligible effect on risk(i.e., crash rate is uninfluenced by pedestrian volume). The trends in Figure 2-4a also suggest thatthere is one pedestrian crash every 6 to 12 years for a given crosswalk, when the conflicting left-turnvolume ranges from 100 to 150 veh/h.

2-12
0.00
0.05
0.10
0.15
0.20
0 50 100 150
Average Left-Turn Volume, veh/h
Pe
de
str
ian
Cra
sh
Fre
qu
en
cy
, c
r/y
r/c
ros
sw
alk
50 p/h crossing each leg for 8 hours;15 p/h thereafter
100 p/h crossing each leg for 8 hours; 30 p/h thereafter
Opposing vehicular volume, permissive-only left-turn operation0
100
200
300
400
0 50 100 150
Average Left-Turn Volume, veh/h
Pe
de
str
ian
-Ve
hic
le C
on
flic
ts,
co
nfl
icts
/da
y/c
ros
sw
alk
50 p/h crossing each leg for 8 hours;15 p/h thereafter
100 p/h crossing each leg for 8 hours; 30 p/h thereafter
Opposing vehicular volume, permissive-only left-turn operation
a. Crash Frequency. b. Conflict Frequency.
Figure 2-4. Crash and Conflict Frequency for Permissive Operation.
Akin and Sisiopiku (15) collected pedestrian-vehicle conflict data at three signalizedintersections in Michigan. One crosswalk at each intersection was videotaped for a period of threeto four hours during one day. Pedestrian volume, left-turn volume, and pedestrian-vehicle conflictswere extracted from the videotape for each 30-minute time period. Two of the intersections hadpermitted left-turn operation with an opposing through vehicle movement. Their examination of thedata indicated that hourly conflict frequency was linearly related to the product of the hourly left-turn volume and the hourly pedestrian volume. The linear relationship shown in Figure 2-4b isderived by the authors of this report using data reported by Akin and Sisiopiku.
The trends in Figure 2-4b indicate that the number of conflicts in a 24-hour period is roughlyequal to the left-turn volume. More specifically, when the left-turn volume averages 100 veh/h, thepedestrian volume averages 50 p/h during eight hours, and 15 p/h during the remaining hours, thenabout 60 conflicts occur each day. If the pedestrian volume doubles, then about 120 conflicts occureach day.
A relationship between conflict and crash frequency can be derived by combining thefunctions represented in Figure 2-4. This relationship is shown in Figure 2-5. The trends in thisfigure give an indication of the large number of conflicts that occur relative to the number ofcrashes. Roughly speaking, if a crosswalk is found to experience conflicts at a rate of 100 per day,then it will experience one crash every 7 to 10 years.
Unopposed Left-Turn Operation
In addition to examining left-turn-related pedestrian crash frequency at intersections withpermitted left-turn operation, Quaye et al. (14) also examined crash frequency at intersections wherethere was no opposing through vehicle movement. This condition is found at: (1) intersections whereone or both intersecting streets serve only one travel direction and (2) three-leg intersections. Theleft turns from a one-way leg or from the terminating leg of a three-leg intersection do not have anopposing through vehicle movement.

2-13
0.00
0.05
0.10
0.15
0.20
0 50 100 150 200 250
Pedestrian-Vehicle Conflicts, conflicts/day/crosswalk
Pe
de
str
ian
Cra
sh
Fre
qu
en
cy
, c
r/y
r/c
ros
sw
alk
50 p/h crossing each leg for 8 hours;15 p/h thereafter
100 p/h crossing each leg for 8 hours; 30 p/h thereafter
Opposing vehicular volume, permissive-only left-turn operation
0.00
0.05
0.10
0.15
0.20
0 50 100 150
Average Left-Turn Volume, veh/h
Pe
de
str
ian
Cra
sh
Fre
qu
en
cy
, c
r/y
r/c
ros
sw
alk
50 p/h crossing each leg for 8 hours;15 p/h thereafter
100 p/h crossing each leg for 8 hours; 30 p/h thereafter
No opposing vehicular volume (e.g., 3-leg intersection) 0
100
200
300
400
0 50 100 150
Average Left-Turn Volume, veh/h
Pe
de
str
ian
-Ve
hic
le C
on
flic
ts,
co
nfl
icts
/da
y/c
ros
sw
alk
50 p/h crossing each leg for 8 hours;15 p/h thereafter
100 p/h crossing each leg for 8 hours; 30 p/h thereafter
No opposing vehicular volume (e.g., 3-leg int.)
Figure 2-5. Crash and Conflict Relationship for Permissive Operation.
Quaye et al. developed a pedestrian-vehicle crash prediction model for crosswalks withunopposed left-turn operation. The relationship between left-turn-related pedestrian crash frequency,left-turn volume, and pedestrian volume is shown in Figure 2-6a.
a. Crash Frequency. b. Conflict Frequency.
Figure 2-6. Crash and Conflict Frequency for Unopposed Left-Turn Operation.
The trends in Figure 2-6a are not fully consistent with those in Figures 2-3 or 2-4a. Theyindicate that crash frequency increases rapidly with increasing left-turn volume. This findingsuggests that pedestrians are less safe in crosswalks where the conflicting left-turn volume is highand the left-turn movement does not have an opposing through vehicle movement to partially“shield” pedestrians at the start of the phase.

2-14
More specifically, the trend lines in Figure 2-6a indicate that a 15 percent increase in left-turn volume corresponds to a 20 percent increase in crash frequency. This trend suggests thatincreasing left-turn volume increases crash risk. On the other hand, a 15 percent increase inpedestrian volume corresponds to a 4 percent increase in crash frequency. This trend suggests thatrisk decreases with increasing pedestrian volume—a trend that was also noted by Leden (16) in asubsequent re-examination of the Quaye et al. data. The trends in Figure 2-6a also suggest that thereis one pedestrian crash every 3 to 8 years for a given crosswalk, when the conflicting left-turnvolume ranges from 100 to 150 veh/h.
One of the intersections studied by Akin and Sisiopiku (15) was a three-leg intersection.They collected conflict data on the left turn from the terminating leg. The linear relationship isderived by the authors of this report using the data reported by Akin and Sisiopiku. It is shown inFigure 2-6b.
The trends in Figure 2-6b indicate that the number of conflicts in a 24-hour period is roughlyequal to twice the left-turn volume. More specifically, when the left-turn volume averages100 veh/h, the pedestrian volume averages 50 p/h during eight hours, and 15 p/h during theremaining hours, then about 155 conflicts occur each day. If the pedestrian volume doubles, thenabout 310 conflicts occur each day.
A relationship between conflict and crash frequency was derived by combining the functionsrepresented in Figure 2-6. This relationship is shown in Figure 2-7. The trend lines in this figureillustrate the large number of conflicts that occur relative to the number of crashes. A comparisonbetween Figures 2-5 and 2-7 indicates that, while conflicts are more frequent at left-turn locationswith unopposed left-turn operation, they tend to result in fewer crashes per year for typicalpedestrian and vehicle volume combinations. Roughly speaking, if a crosswalk is found toexperience conflicts at a rate of 100 per day, then it will experience only one crash every 13 to29 years.
Protected-Permissive Left-Turn Mode
The relationship between pedestrian safety and the protected-permissive mode has not beenestablished through research. It could be rationalized that protected-permissive operation is less safethan a protected left-turn operation and more safe than permissive operation, given that it combinesthe operation of both modes.
A flashing yellow arrow implementation of protected-permissive operation was researchedby Brehmer et al. (7) in terms of its safety and operational benefits. They found that the flashingyellow arrow indication has a lower “fail-critical” rate as compared to the circular green indicationwhen used to indicate the permissive period. A fail-critical response occurs when the left-turningdriver incorrectly interprets the permissive indication as a protected turn indication, thus creatingthe potential for a crash with opposing vehicles or pedestrians. By inference, the flashing-yellow-arrow display would offer some benefit to pedestrian safety through better driver comprehension ofthe signal display; however, there is no research to confirm this inference.

2-15
0.00
0.05
0.10
0.15
0.20
0 100 200 300 400
Pedestrian-Vehicle Conflicts, conflicts/day/crosswalk
Pe
de
str
ian
Cra
sh
Fre
qu
en
cy
, c
r/y
r/c
ros
sw
alk
50 p/h crossing each leg for 8 hours;15 p/h thereafter
100 p/h crossing each leg for 8 hours; 30 p/h thereafter
No opposing vehicular volume (e.g., 3-leg intersection)
Figure 2-7. Crash and Conflict Relationship for Unopposed Left-Turn Operation.
Koonce et al. (17) point out the use of the permissive period omit as a technique to improvepedestrian safety. With this technique, the controller is set up to omit the permissive period duringany cycle in which a detection is received for a conflicting pedestrian movement. However, thistechnique has the possible disadvantage of violating driver expectancy.
One issue that is related to the use of the protected-permissive mode is its possible negativeimpact on pedestrian compliance with the pedestrian signal. One factor that affects pedestriancompliance is waiting time, which is typically increased when permissive operation is replaced byprotected-permissive operation. Studies indicate that pedestrian compliance degrades with waitingtime. Pedestrians are reluctant to wait more than 30 s, and compliance is notably poor if the wait is60 s or more (18).
Protected Left-Turn Mode
Guidance on p. 457 of the Traffic Control Devices Handbook (19) indicates that the choiceof left-turn mode should be based on consideration of the overall safety and efficiency of theintersection. They caution that “protected-only left-turn phases may improve the safety of left-turning vehicles, but this will be accomplished at the expense of other movements and pedestrians.”The implied “expense” is an increase in delay to vehicles and pedestrians. One additional concernis whether the increase in pedestrian delay will lead to a decrease in pedestrian compliance.
Leading vs. Lagging Phase Sequence
Hummer et al. (20) measured conflicts between pedestrians and left-turn vehicles atsignalized intersections. Some of the intersections they evaluated had a leading left-turn phase.Other intersections had a lagging left-turn phase. They found that the leading left-turn phase wasassociated with six times as many conflicts as the lagging left-turn phase. In most instances, the

2-16
leading-left-turn-related conflicts were a result of the pedestrian mistaking the end of the cross streetthrough phase for the start of the through phase in the direction they were traveling (when, in fact,it was the start of the left-turn phase). The pedestrians would not see, or disregard, the DON’TWALK indication and step into the crosswalk and the path of the left-turn vehicle. In contrast, thelagging sequence not only meets pedestrian expectations, but its through-vehicle queue provides anatural left-turn vehicle “shield” for pedestrians at the start of the permissive period.
Effect of Pedestrian Control on Pedestrian Safety
Research indicates that there are several traffic control techniques that can be used to addressleft-turn-related pedestrian-vehicle conflicts and crashes. These techniques include: leadingpedestrian interval, exclusive pedestrian phase, pedestrian clear interval, and selected warning signsor markings. Each of these techniques is described in the following subsections.
Leading Pedestrian Interval
Lalani (21) indicates that agencies have typically implemented a leading pedestrian intervalat locations where 3 to 20 percent of turning vehicles typically violate the pedestrian right-of-way.The leading interval always increases vehicle delay (22) so its safety benefit must outweigh itsadverse impact on vehicle operation. A lagging pedestrian interval is available in most controllersbut it does not reduce left-turn-related pedestrian conflicts, and may even increase them.
Fayish and Gross (23) examined pedestrian crash data at 10 signalized intersections in StateCollege, Pennsylvania, at which a leading pedestrian interval was installed. For each intersection,they gathered crash data for four years before the leading pedestrian interval was installed and forthree years after installation. The leading pedestrian interval was 3.0 s in duration at eachintersection. Their analysis indicated that pedestrian-vehicle crash frequency at intersectionsdecreased by 58.7 percent after the leading pedestrian intervals were implemented. This reductionincludes pedestrian crashes associated with both left-turning and right-turning vehicles.
Exclusive Pedestrian Phase
An exclusive pedestrian phase provides temporal separation between vehicles andpedestrians by providing each travel mode exclusive use of the intersection during a signal phase.Research by Zegeer et al. (24) found that this phasing arrangement is associated with a 50 percentreduction in pedestrian crashes, relative to signalized intersections with concurrent service ofpedestrians during the through vehicle phases and intersections with no pedestrian signals.
A scramble phase is a special type of exclusive pedestrian phase. It was also found to providea similar safety benefit as the exclusive pedestrian phase; however, it is reported to work best whenpedestrian volume exceeds 1200 pedestrians per day, street widths are narrow (e.g., less than 60 ft),and through movement volume is low (22, 24).

2-17
Provide Pedestrian Clear Entirely during Green
Some agencies prefer to minimize the duration of the pedestrian change interval bysubtracting the yellow change interval and red clearance interval (see Equation 1). However, thispractice may cause some conflict between pedestrians and left-turning vehicles that are clearing theintersection following the permissive portion of the phase. A similar conflict can occur if permissiveor protected-permissive left-turn operation is used with the rest-in-walk mode.
If permissive or protected-permissive left-turn operation is used and vehicular volume is lowenough that the phase ends after timing the pedestrian walk and change intervals, then the pedestrianchange interval (also known as pedestrian clear interval) can be set to equal the pedestrian clearancetime, as defined in the text associated with Table 2-2. Under these conditions, the pedestrian cleartimes entirely during the green interval, and some vehicle-pedestrian conflicts that occur at the endof the phase may be alleviated.
Turn Vehicle Warning Signs and Markings
Signs and/or markings with a message such as, “Pedestrians Watch for Turning Vehicles”have been used to increase the awareness of pedestrians at intersections. The marking is placed inthe crosswalk near the curb. The sign is placed on the far-side pole facing pedestrians in thecrosswalk. Research indicates that these treatments reduce left-turn-related pedestrian-vehicleconflicts by 20 to 60 percent (21).
A sign with the message, “Yield to Pedestrians When Turning” was evaluated by Zegeer etal. (24) using a before-after study. They installed the sign at four intersections and used it to informturning drivers of pedestrian presence. They used vehicle-pedestrian conflicts as the measure ofeffectiveness. They found that the sign had no significant effect on left-turn-related conflictfrequency, but total pedestrian-vehicle conflicts were reduced 25 to 37 percent.
Effect of Pedestrian Flow on Vehicle Operation
Chapter 16 of the 2000 Highway Capacity Manual (25) describes a methodology forevaluating vehicle operation at a signalized intersection. The methodology is sensitive to pedestrianvolume. It models the effect of pedestrian presence on discharging left- and right-turn vehicles bydecreasing the vehicle’s saturation flow rate. Higher pedestrian volume in a crosswalk correspondsto lower saturation flow rate and a higher delay.
The Chapter 16 methodology was used to examine the sensitivity of delay to vehicle andpedestrian volume. A four-leg intersection was devised for this examination. Each leg served two-way traffic and provided two lanes in each travel direction. No turn bays or phases were provided.Vehicular demand on each street was the same, 20 percent of the approach traffic turned left, andanother 20 percent turned right. A pedestrian volume of 400 p/h was used, which is typical of anintersection in a central business district (25). The results are shown in Figure 2-8.

2-18
0
10
20
30
40
50
0 200 400 600 800
Major-Street Approach Volume, veh/h
Ma
jor-
Str
ee
t C
on
tro
l Del
ay
, s/v
eh
Minor-street volume = major-street volumeMajor-street left- and right-rurns: 20%Minor-street left- and right-turns: 20%2 lanes on each approach, no turn bays2 phases
0 p/h
400 p/h
Figure 2-8. Relationship between Pedestrian Volume and Vehicle Delay.
The trend lines in Figure 2-8 indicate that pedestrian volume has a minimal effect on vehicledelay when approach volumes are less than 600 veh/h (i.e., 300 veh/h/ln). As the volume increasesabove 600 veh/h, a pedestrian volume of 400 p/h is shown to increase delay by several seconds pervehicle. In fact, at a vehicular volume of 800 veh/h, the increase in delay due to pedestrian presenceis about 10 s/veh.
CANDIDATE TRAFFIC ENGINEERING TREATMENTS
A review of the literature indicates a range of traffic engineering treatments are available toaddress left-turn-related pedestrian-vehicle conflicts. The use of the protected or protected-permissive mode is a commonly cited treatment. However, there were instances where othertreatments were found to provide some safety benefit without increasing vehicle delay or degradingprogression quality as much as the addition of a left-turn phase. These treatments are summarizedin Table 2-3. The effectiveness of each treatment may vary, depending on whether the subject left-turn movement is opposed by a through vehicular movement.

2-19
Table 2-3. Traffic Engineering Treatments for Improving Pedestrian Safety at Intersections.Treatment Description Issues
Treatments Based on Conversion from Permissive Mode
Provide protected-permissivemode
Reduce the number of left-turn vehiclesthat turn during the permissive period byproviding a protected arrow indication.
Permissive period presents opportunityfor some pedestrian-vehicle conflicts. Ifused with lagging left-turn phasesequence, safety problems associatedwith the yellow trap may occur.
Provide protected-permissivemode using flashing yellowsignal display
Reduce the number of left-turn vehiclesthat turn during the permissive period byproviding a protected arrow indication.
Safety benefits of protected-permissivephasing with flashing yellow display notquantified through research.
Provide protected left-turnmode (19, 22)
Separate vehicles and pedestrians onproblem approach by providing each aseparate time in cycle to be served.
Left-turn phase may increase pedestrianwaiting time and decrease theircompliance with the pedestrian signal.
Provide lagging phasesequence (20)
Through phase (and pedestrian service)occur after cross street phase ends and isconsistent with pedestrian expectation.
Treatment is viable with protected mode,and with protected-permissive modeprovided that yellow trap is eliminated.
Treatments Used in Conjunction with Permissive Mode
Provide leading pedestrianinterval (19, 21, 22)
Provide a small amount of time (say, 3 s)to allow pedestrians to start crossingbefore displaying green ball.
Increases delay to vehicles. May requirethe use of accessible pedestrian signalsto provide crossing cues to visuallyimpaired pedestrians.
Provide exclusive pedestrianphase (19,22)
Separate vehicles and pedestrians atintersection by providing each a separatetime in cycle to be served.
Significant delay and waiting time mayresult if used at large intersections. Mayrequire the use of accessible pedestriansignals to provide crossing cues tovisually impaired pedestrians.
Provide pedestrian clearinterval entirely during green(2)
Some agencies time a portion of thepedestrian clearance time during theyellow change and red clearanceintervals to reduce delay.
Increases delay to vehicles. May onlyprovide pedestrian safety benefit if usedwith protected left-turn mode or withpermissive omit when ped. is detected.
Add turning vehicle warningsigns and markings (19, 21)
Add “Pedestrians Watch for TurningVehicles” signs and/or markings toremind pedestrians to look for turningvehicles.
Markings tend to wear away when usedin typical crosswalk locations.
Prohibit pedestrian crossing Redirect pedestrians to alternativecrosswalks or crossing locations.
May shift safety problem to anotherintersection. May cause negative publicreaction unless it is part of a larger trafficmanagement strategy.
REFERENCES
1. Campbell, B., C. Zegeer, H. Huang, and M. Cynecki. A Review of Pedestrian Safety Researchin the United States and Abroad. Report No. FHWA-RD-03-042. Federal HighwayAdministration, U.S. Department of Transportation, Washington, D.C., January 2004.
2-20
2. Bonneson, J., S. Sunkari, and M. Pratt. Traffic Signal Operations Handbook. Report No.FHWA/TX-09/0-5629-P1. Texas Transportation Institute, College Station, Texas, March 2009.
3. Kell, J.H., and I.J. Fullerton. Manual of Traffic Signal Design. 2nd Edition. Institute ofTransportation Engineers, Washington, D.C., 1998.
4. Orcutt, F. The Traffic Signal Book. Prentice-Hall, Inc., Englewood Cliffs, New Jersey, 1993.
5. Traffic Engineering Handbook. 5th Edition. J.L. Pline editor. Institute of TransportationEngineers, Washington, D.C., 1999.
6. Yu, L., Y. Qi, H. Yu, L. Guo, and X. Chen. Development of Left-Turn Operations Guidelinesat Signalized Intersections. Report No. FHWA/TX-09/0-5840-1. Texas Southern University,Houston, Texas, March 2009.
7. Brehmer, C., K. Kacir, D. Noyce, and M. Manser. NCHRP Report 493: Evaluation of TrafficSignal Displays for Protected/Permissive Left-Turn Control. TRB, National Research Council,Washington, D.C., 2003.
8. Texas MUTCD: Manual on Uniform Traffic Control Devices. Texas Department ofTransportation, Austin, Texas, 2006.
9. Manual on Uniform Traffic Control Devices. Federal Highway Administration, U.S.Department of Transportation, Washington, D.C., 2009.
10. Fitzpatrick, K., S. Turner, M. Brewer, P. Carlson, B. Ullman, N. Trout, E. Park, and J. Whitacre.NCHRP Report 562: Improving Pedestrian Safety at Unsignalized Crossings. TRB, NationalResearch Council, Washington, D.C., 2006.
11. Dowling, R., D. Reinke, A. Flannery, P. Ryus, M. Vandehey, T. Petritsch, B. Landis, N.Rouphail, and J. Bonneson. NCHRP Report 616: Multimodal Level of Service Analysis forUrban Streets. NCHRP, National Research Council, Washington, D.C., 2008.
12. Lyon, C., and B. Persaud. “Pedestrian Collision Prediction Models for Urban Intersections.”Transportation Research Record 1818. Transportation Research Board, Washington, D.C.,2002, pp. 102–107.
13. Lord, D. “Analysis of Pedestrian Conflicts with Left-Turning Traffic.” Transportation ResearchRecord 1538. Transportation Research Board, Washington, D.C., 1996, pp. 61–67.
14. Quaye, K., L. Leden, and E. Hauer. Pedestrian Accidents and Left-Turning Traffic at SignalizedIntersections. AAA Foundation for Traffic Safety, Washington, D.C., April 1993.

2-21
15. Akin, D., and V. Sisiopiku. “Modeling Interactions between Pedestrians and Turning-Vehiclesat Signalized Crosswalks Operating Under Combined Pedestrian-Vehicle Interval.” Paper No.07-2710. Presented at the 86th Annual Meeting of the Transportation Research Board,Washington, D.C., January 2007.
16. Leden, L. “Pedestrian Risk Decrease with Pedestrian Flow. A Case Study Based on Data fromSignalized Intersections in Hamilton, Ontario.” Accident Analysis & Prevention. No. 34, pp.457–464.
17. Koonce, P., L. Rodegerdts, K. Lee, S. Quayle, S. Beaird, C. Braud, J. Bonneson, P. Tarnoff, andT. Urbanik. Traffic Signal Timing Manual. Report No. FHWA-HOP-08-024. Federal HighwayAdministration, U.S. Department of Transportation, Washington, D.C., June 2008.
18. Neudorff, L. Candidate Signal Warrants from Gap Data - Technical Report. Report No.FHWA-RD-82/152. Federal Highway Administration, U.S. Department of Transportation,1982.
19. Traffic Control Devices Handbook. Chapter 13 - Pedestrians. Institute of TransportationEngineers, Washington, D.C., 2001.
20. Hummer, J., R. Montgomery, and K. Sinha. “Guidelines for Use of Leading and Lagging Left-Turn Signal Phasing.” Transportation Research Record 1324. Transportation Research Board,National Research Council, Washington, D.C., 1991, pp. 11–20.
21. Lalani, N. Alternative Treatments for At-Grade Pedestrian Crossings. Institute ofTransportation Engineers, Washington, D.C., 2001.
22. Traffic Engineering Technical Committee TENC-5A-5. Design and Safety of PedestrianFacilities. (C. Zegeer, Chair). Institute of Transportation Engineers, Washington, D.C., March1998.
23. Fayish, A., and F. Gross. “Safety Effectiveness of Leading Pedestrian Intervals Evaluated bya Before-After Study with Comparison Groups.” Transportation Research Record 2198.Transportation Research Board, Washington, D.C., 2010, pp. 15–22.
24. Zegeer, C., K. Opiela, and M. Cynecki. Pedestrian Signalization Alternatives. Report No.FHWA/RD-83/102. Federal Highway Administration, U.S. Department of Transportation,1983.
25. Highway Capacity Manual. Transportation Research Board, National Research Council,Washington, D.C., 2000.


3-1
CHAPTER 3. STATE OF THE PRACTICE REVIEW
OVERVIEW
This chapter documents the findings from a survey of practitioners regarding the state-of-the-practice in addressing pedestrian safety at signalized intersections. It consists of two parts. The firstpart documents the information obtained during interviews with practitioners in Texas and severalother states. The second part documents the findings from an electronic discussion (e-discussion)that was conducted with an expert panel comprised of 12 state and city traffic engineers.
PRACTITIONER INTERVIEW
This part of the chapter documents the information obtained during interviews with trafficengineers responsible for signalized intersection operations in various cities and states. Theinterview addressed pedestrian safety at signalized intersections in urban areas, with a focus onconflicts between left-turn vehicles and pedestrians. The interview objectives were as follows:
! Assess the state of the practice regarding control for left turns and pedestrians.! Determine how pedestrian needs are assessed and accommodated.! Identify treatments used to address left-turn-related pedestrian safety concerns.
In addition to providing the aforementioned information, the interviews were also used toidentify people who could serve on an expert panel. The expert panel was used to conduct an in-depth exploration of pedestrian safety problems and potential treatments. The findings from thisactivity are documented in the next part of this chapter.
Background
The researchers conducted interviews with practitioners in several TxDOT districts, Texascities, and public agencies in other states. The interviewees were asked questions about theirleft-turn signalization practices, methods for accommodating pedestrian needs, and use of treatmentsto address pedestrian safety. The Texas interviewees were also asked to assist in identifyingcandidate field data collection sites. The specific questions asked during the interviews are listed inFigures 3-1 and 3-2. The responses to the interview questions are documented in the followingsubsections.
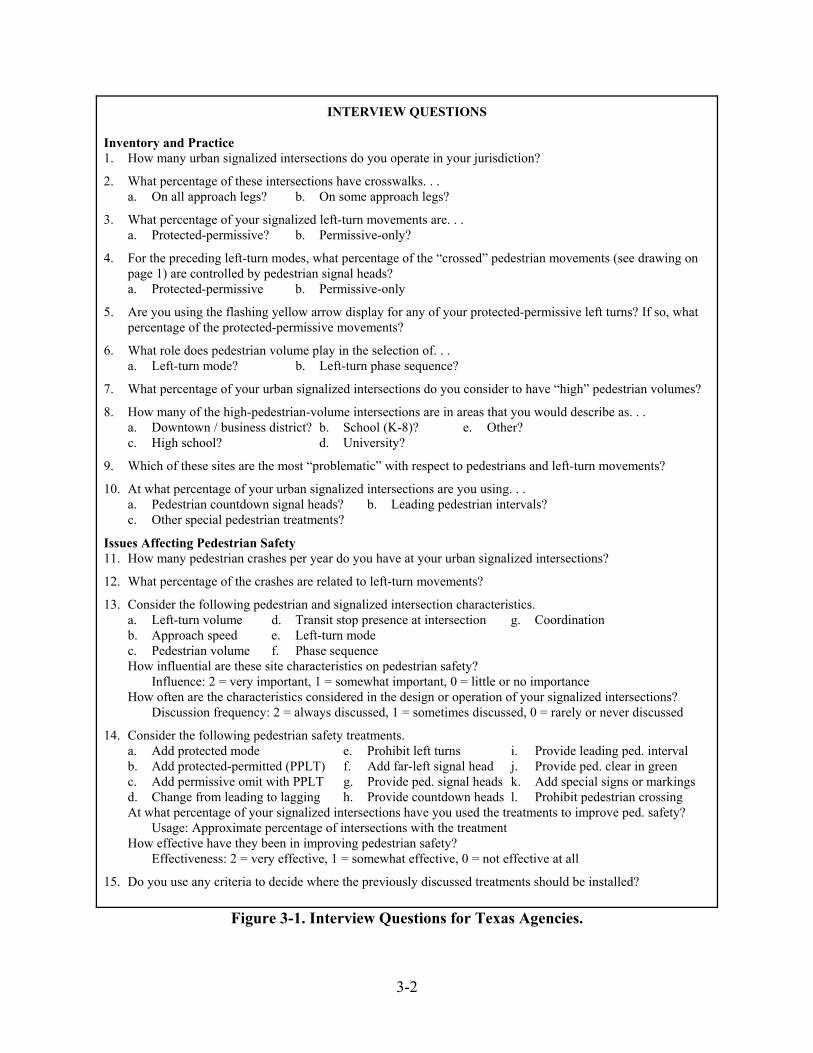
3-2
INTERVIEW QUESTIONS
Inventory and Practice1. How many urban signalized intersections do you operate in your jurisdiction?
2. What percentage of these intersections have crosswalks. . .a. On all approach legs? b. On some approach legs?
3. What percentage of your signalized left-turn movements are. . . a. Protected-permissive? b. Permissive-only?
4. For the preceding left-turn modes, what percentage of the “crossed” pedestrian movements (see drawing onpage 1) are controlled by pedestrian signal heads?a. Protected-permissive b. Permissive-only
5. Are you using the flashing yellow arrow display for any of your protected-permissive left turns? If so, whatpercentage of the protected-permissive movements?
6. What role does pedestrian volume play in the selection of. . .a. Left-turn mode? b. Left-turn phase sequence?
7. What percentage of your urban signalized intersections do you consider to have “high” pedestrian volumes?
8. How many of the high-pedestrian-volume intersections are in areas that you would describe as. . .a. Downtown / business district? b. School (K-8)? e. Other?c. High school? d. University?
9. Which of these sites are the most “problematic” with respect to pedestrians and left-turn movements?
10. At what percentage of your urban signalized intersections are you using. . .a. Pedestrian countdown signal heads? b. Leading pedestrian intervals?c. Other special pedestrian treatments?
Issues Affecting Pedestrian Safety11. How many pedestrian crashes per year do you have at your urban signalized intersections?
12. What percentage of the crashes are related to left-turn movements?
13. Consider the following pedestrian and signalized intersection characteristics.a. Left-turn volume d. Transit stop presence at intersection g. Coordinationb. Approach speed e. Left-turn modec. Pedestrian volume f. Phase sequenceHow influential are these site characteristics on pedestrian safety?
Influence: 2 = very important, 1 = somewhat important, 0 = little or no importanceHow often are the characteristics considered in the design or operation of your signalized intersections?
Discussion frequency: 2 = always discussed, 1 = sometimes discussed, 0 = rarely or never discussed
14. Consider the following pedestrian safety treatments.a. Add protected mode e. Prohibit left turns i. Provide leading ped. intervalb. Add protected-permitted (PPLT) f. Add far-left signal head j. Provide ped. clear in greenc. Add permissive omit with PPLT g. Provide ped. signal heads k. Add special signs or markingsd. Change from leading to lagging h. Provide countdown heads l. Prohibit pedestrian crossingAt what percentage of your signalized intersections have you used the treatments to improve ped. safety?
Usage: Approximate percentage of intersections with the treatmentHow effective have they been in improving pedestrian safety?
Effectiveness: 2 = very effective, 1 = somewhat effective, 0 = not effective at all
15. Do you use any criteria to decide where the previously discussed treatments should be installed?
Figure 3-1. Interview Questions for Texas Agencies.

3-3
INTERVIEW QUESTIONS
Inventory and Practice1. What cities or states are you most familiar with regarding pedestrian practices at signalized intersections?
2. How many urban signalized intersections do you operate in your jurisdiction?
3. What role does pedestrian volume play in the selection of. . .a. Left-turn mode? b. Left-turn phase sequence?
4. What percentage of your urban signalized intersections do you consider to have “high” pedestrian volumes?
5. How many of the high-pedestrian-volume intersections are in areas that you would describe as. . .a. Downtown / business district? b. School (K-8)? e. Other?c. High school? d. University?
6. Which of these sites are the most “problematic” with respect to pedestrians and left-turn movements?
Issues Affecting Pedestrian Safety7. Consider the following pedestrian safety treatments.
a. Add protected mode e. Prohibit left turns i. Provide leading ped. intervalb. Add protected-permitted (PPLT) f. Add far-left signal head j. Provide ped. clear in greenc. Add permissive omit with PPLT g. Provide ped. signal heads k. Add special signs or markingsd. Change from leading to lagging h. Provide countdown heads l. Prohibit pedestrian crossingAt what percentage of your signalized intersections have you used the treatments to improve ped. safety?
Usage: Approximate percentage of intersections with the treatmentHow effective have they been in improving pedestrian safety?
Effectiveness: 2 = very effective, 1 = somewhat effective, 0 = not effective at all
8. Do you use any criteria to decide where the previously discussed treatments should be installed?
Figure 3-2. Interview Questions for Agencies Outside of Texas.
Most of the interviewees were engineers, but a few engineering assistants and signaltechnicians were also interviewed. A total of 27 practitioners in Texas were visited in person, andan additional six in other states were contacted by telephone. The in-person meetings were about anhour in length, and the telephone calls were about a half-hour in length. The agencies representedby the interviewees are listed in Table 3-1.
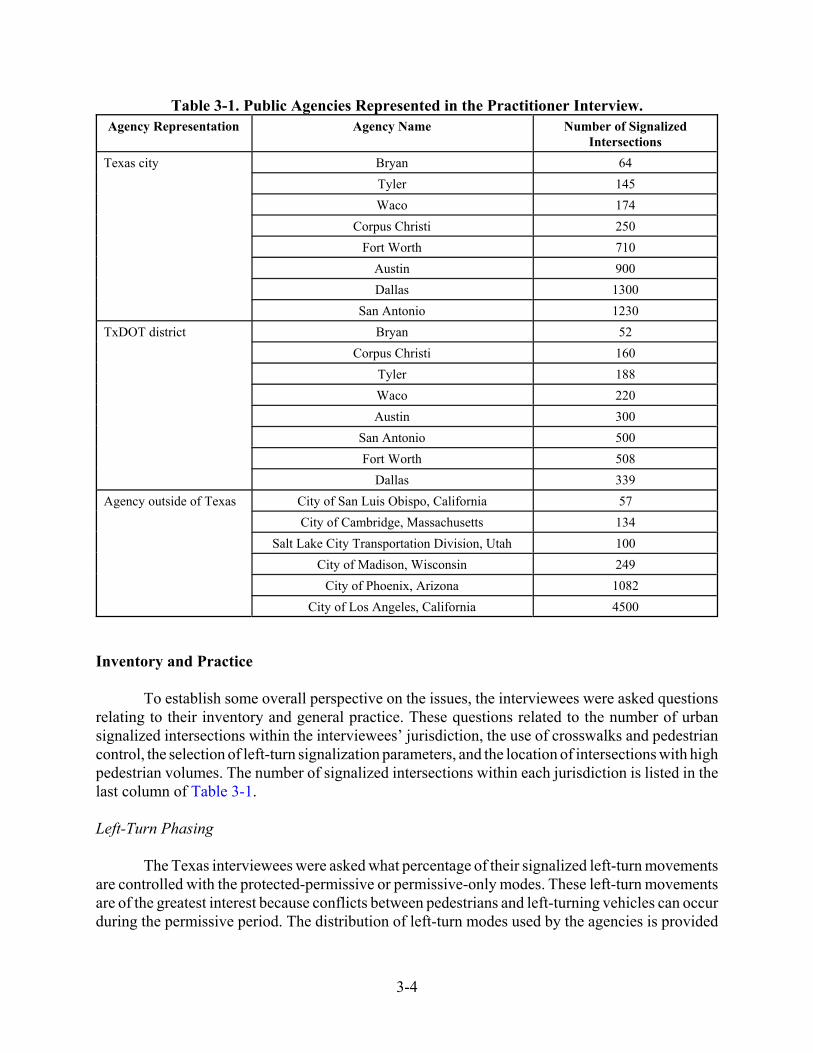
3-4
Table 3-1. Public Agencies Represented in the Practitioner Interview.Agency Representation Agency Name Number of Signalized
Intersections
Texas city Bryan 64
Tyler 145
Waco 174
Corpus Christi 250
Fort Worth 710
Austin 900
Dallas 1300
San Antonio 1230
TxDOT district Bryan 52
Corpus Christi 160
Tyler 188
Waco 220
Austin 300
San Antonio 500
Fort Worth 508
Dallas 339
Agency outside of Texas City of San Luis Obispo, California 57
City of Cambridge, Massachusetts 134
Salt Lake City Transportation Division, Utah 100
City of Madison, Wisconsin 249
City of Phoenix, Arizona 1082
City of Los Angeles, California 4500
Inventory and Practice
To establish some overall perspective on the issues, the interviewees were asked questionsrelating to their inventory and general practice. These questions related to the number of urbansignalized intersections within the interviewees’ jurisdiction, the use of crosswalks and pedestriancontrol, the selection of left-turn signalization parameters, and the location of intersections with highpedestrian volumes. The number of signalized intersections within each jurisdiction is listed in thelast column of Table 3-1.
Left-Turn Phasing
The Texas interviewees were asked what percentage of their signalized left-turn movementsare controlled with the protected-permissive or permissive-only modes. These left-turn movementsare of the greatest interest because conflicts between pedestrians and left-turning vehicles can occurduring the permissive period. The distribution of left-turn modes used by the agencies is provided

3-5
in the following list. As indicated in this list, 75 percent of the left-turn movements are operated withmodes that result in possible conflict between left-turning vehicles and pedestrians.
! Protected-permissive mode – 51 percent.! Protected, split phasing, or other – 25 percent.! Permissive – 24 percent.
All of the Texas interviewees indicated that pedestrian volume is rarely considered in theselection of left-turn mode. The selection of left-turn mode is typically based on vehicular volumeand intersection geometry.
More generally, they indicated that pedestrian safety is considered in two situations. Onesituation is where pedestrian crash data indicate the existence of a safety problem that can beaddressed by protected left-turn operation. A second situation applies to intersections near schools.Several interviewees stated that they consider providing left-turn protection at school intersectionsor intersections near special-event facilities, even if vehicular volumes and intersection geometrydo not justify providing left-turn protection. Two city engineers use the permissive period omit withprotected-permissive mode at school intersections during school hours.
All of the Texas interviewees stated that pedestrian volume plays little or no role in theselection of left-turn phase sequence (i.e., leading versus lagging). Phase sequence is usually choseneither by default (i.e., the agency always uses a certain phase sequence), or based on coordinationissues (i.e., to maximize progression bandwidth). One interviewee stated that he had tried changinga left-turn phase from leading to lagging to improve pedestrian safety, but changed it back to leadingbecause he did not believe it yielded any benefit. Another interviewee stated that he changed aleft-turn phase from leading to lagging at one intersection near a university in response to complaintsfrom the public, and that the complaints stopped after he implemented the change.
Two of the interviewees from other states indicated that they consider pedestrian volume inthe selection of left-turn control. In one city, the protected-permissive mode is used if the left-turncycle failure rate is more than 80 percent and the delay to the opposing through movement is40 s/veh or less. With this guidance, pedestrian volume can indirectly influence the choice ofleft-turn control to the extent that pedestrian timing affects the left-turn cycle failure rate and theopposing through movement delay. In another city, pedestrian volumes are collected and used in asimulation model to quantify performance measures. This city also conducts field visits to assesswhether gaps in the pedestrian stream are sufficiently large to serve left-turning vehicles. They mayconsider the protected-permissive mode if adequate gaps are too infrequent. This assessment is doneon a qualitative basis.
Most of the Texas interviewees responded that their agencies are not using the flashingyellow arrow signal display for left-turn movements. Of all the contacted agencies, only the Citiesof Tyler and San Antonio are using the flashing yellow arrow display. Tyler uses the flashing yellowarrow display for 40 percent of their protected-permissive left-turn movements, while San Antoniouses this display for 2 percent of their protected-permissive movements.

3-6
Pedestrian Control
The Texas interviewees were asked about the provision of crosswalks at their urbansignalized intersections. Specifically, they were asked to indicate what percentage of theirintersections had crosswalks on all, some, or none of their approach legs.
The Texas interviewees’ responses to the questions about crosswalks are summarized inTable 3-2. Their responses indicate that crosswalks are provided more frequently by cities than byTxDOT districts. Cities provide crosswalks on some or all approach legs at 84 percent of theirintersections, while TxDOT districts do so at about 64 percent of their intersections. Crosswalks areprovided more often by cities because more of the city-operated signals are in areas with higherpopulation density and pedestrian demand.
Table 3-2. Crosswalk Provision Trends at Urban Signalized Intersections. Intersection Crosswalks Percentage of Intersections by Texas Agency
City TxDOT Overall
Crosswalks on all legs 61 37 49
Crosswalks on some legs 23 27 25
No crosswalks 16 36 26
Total: 100 100 100
The Texas interviewees indicated that their agencies will occasionally omit crosswalksbecause of lack of pedestrian demand, a desire to avoid conflict with vehicles, or the existence ofsite-specific constraints that prevent the provision of crosswalks. For example, at three-legintersections, it is common to provide only one crosswalk across the major street. This approacheliminates the conflict between pedestrians and vehicles turning left from the minor street.Crosswalks are also usually omitted in the inside of diamond interchanges. All agencies providecrosswalks that are compliant with Americans with Disabilities Act (ADA) requirements. Theysometimes omit crosswalks if pedestrian signal heads are not present.
The Texas interviewees were asked how often they provide pedestrian signal heads for the“crossed” pedestrian movements for the various left-turn modes. The “crossed” pedestrianmovement is the movement that potentially conflicts with left-turning vehicles during the greensignal indication. The provision of pedestrian signal heads for these pedestrian movements indicatesrecognition of the potential conflict and a desire to provide basic pedestrian control. The responsesindicate that about 74 percent of pedestrian movements that are crossed by protected-permissiveleft-turn movement are provided with pedestrian signal heads. About 62 percent of pedestrianmovements that are crossed by permissive-only left-turn movements are provided with signal heads.
Description of Intersections with High Pedestrian Volumes
The interviewees indicated that 10 to 15 percent of their urban signalized intersections havehigh pedestrian volumes. The percentage was slightly higher for cities (15 percent) than for TxDOT

3-7
districts (12 percent). The interviewees were asked to classify their intersections by providing theapproximate number of intersections that are located around downtown areas or business districts,K-8 schools, high schools, universities, or other area types. The total count of intersections withinthese area type categories is shown in Table 3-3. For all area type categories, morehigh-pedestrian-volume signalized intersections are operated by cities than by TxDOT districts.
Table 3-3. Classification of High-Pedestrian-Volume Intersections. Location of High-
Pedestrian-VolumeIntersections
Percentage of Intersections by Agency
City TxDOT Overall
Downtown, business area 474 66 540
K-8 school 236 24 260
High school 70 17 87
University 67 53 120
Other 93 57 150
Total: 940 217 1157
The bulk of the high-pedestrian-volume intersections are located within downtown areas orother business districts. A significant number also exist near K-8 schools. A total of about 150intersections were located in area types that were described as “other.” These intersections includedtourist areas, facilities that host special events, hike and bike trail crossings that occur at signalizedintersections, hospitals, and assisted-living facilities.
The interviewees were asked which intersections are the most problematic in terms ofconflicts between pedestrians and left-turning vehicles. Their responses varied widely, though theygave different reasons for each area type to be problematic. The area type categories are discussedin greater detail in the following paragraphs.
Business District. Six interviewees considered their downtown or business districtintersections to be the most problematic for pedestrians and left-turning vehicles. They explainedthat left-turn movements in downtown areas are often operated in permissive-only mode. At timeswhen pedestrian volumes are high, pedestrians tend to dominate the crosswalks, making it difficultfor drivers to find safe gaps to execute left turns. This condition may cause drivers to attempt leftturns using pedestrian gaps that are too narrow. Other issues include the presence of manydistractions for drivers in downtown areas and the provision of light rail transit service.
School. Eleven interviewees considered intersections near schools to be the mostproblematic. Signalized intersections near schools tend to have safety and operational problemsbecause they experience high volumes of both pedestrians and vehicles simultaneously. Anothercommon problem is that pedestrians at school intersections often do not comply with the pedestriancontrol (i.e., they do not wait for the WALK indication) or they place too much trust in thepedestrian control (i.e., they cross as soon as they are given a WALK indication, without first
3-8
checking for vehicles). These mistakes tend to be most prevalent among younger pedestrians, likestudents at K-8 schools.
Issues Affecting Pedestrian Safety
The Texas interviewees were asked to provide input on which intersection-related factorsthey think have the greatest influence on pedestrian safety at signalized intersections. Theirresponses are summarized in the following subsections.
Characteristics Affecting Pedestrian Safety
The Texas interviewees were asked whether various traffic and signalization characteristicshad an influence on pedestrian safety. Some of the characteristics describe the intersection control,while others describe the users (vehicle traffic or pedestrians). For each characteristic, intervieweesindicated (1) the amount of influence it has on safety and (2) the frequency it is considered as partof intersection design or operation. A numeric score was used to indicate the interviewee’s response.
Pedestrian volume ranks highest in terms of both influence and discussion frequency. TheTexas interviewees believe that approach speed, left-turn volume, and left-turn mode are relativelyinfluential on pedestrian safety. In contrast, left-turn phase sequence and signal coordination wereindicated to have little influence and are rarely discussed.
Use of Pedestrian Safety Treatments
The interviewees were asked if they had used various safety treatments. Most of thetreatments considered are listed in the first column of Table 2-3 in Chapter 2. The followingadditional treatments were added to this list:
! Use permissive period omit with protected-permissive mode.! Prohibit left turns.! Add far-left supplemental signal head.! Provision of conventional pedestrian heads.! Provision of countdown pedestrian signal heads.
The interviewees were asked to indicate the percentage of their urban signalized intersectionsat which they have used these treatments specifically to improve pedestrian safety. Instances wherethe treatment was used for reasons other than pedestrian safety were not considered. For thosetreatments that they have used, the interviewees were asked how they would rate the effectivenessof the treatments in improving pedestrian safety. A numeric score was used to indicate theinterviewee’s response.
The two most commonly used treatments in Texas are (1) providing conventional pedestriansignal heads and (2) providing the pedestrian clear interval entirely during green. These twotreatments are rated between “somewhat effective” and “very effective” in improving pedestriansafety.

3-9
Cities outside of Texas commonly use four treatments. Two of the four treatments are thoseidentified in the previous paragraph. The other two commonly used treatments are (1) add far-leftsupplemental signal head and (2) provide countdown pedestrian signal head. The intervieweesindicated that countdown heads are being used at more intersections each year.
Another common treatment is prohibiting a pedestrian crossing. According to theinterviewees, crossings are often prohibited on one leg of three-leg intersections to avoid conflictwith left-turning vehicles from the minor street, on the inside of diamond interchanges, or at sitesthat do not comply with ADA requirements. This treatment is rated between “somewhat effective”and “very effective” in improving pedestrian safety.
Criteria for Using Safety Treatments
The interviewees were asked whether they use criteria or rules-of-thumb to decide where touse pedestrian safety treatments. The most commonly mentioned consideration regarding thedecision to use a pedestrian safety treatment is citizen feedback and observations made during fieldvisits. Criteria commonly cited include some consideration of pedestrian volume or evidence ofpedestrian demand (e.g., worn footpaths observed on the roadside), visibility and sight distance,ADA requirements, and presence of school facilities. Some agencies provide treatments near schoolswhen requested by the school district. Some of the treatments are used simply as a matter of policyor current practice. For example, some cities or districts provide pedestrian signal heads at all newtraffic signals.
Summary
Interviews with 27 practitioners were conducted regarding their agency’s left-turnsignalization and pedestrian control practices. According to information provided by theinterviewees, about 75 percent of urban signalized left-turn movements are operated inprotected-permissive or permissive-only modes, which result in potential conflicts betweenleft-turning vehicles and pedestrians.
On average, the interviewees indicated that pedestrian volume is the most influentialintersection characteristic on pedestrian safety. Most of the state’s signals with high pedestrianvolume are located in cities, specifically in urban areas or near schools. Other characteristics thatinfluence pedestrian safety include approach speed, left-turn volume, and left-turn mode.
When asked about treatments used to improve pedestrian safety, the most frequentlymentioned options included adding pedestrian signal heads (conventional or countdown), provisionof the pedestrian clear interval entirely during green, and prohibiting crossings.
The interviewees explained that they do have guidance to select left-turn mode, but theguidance does not incorporate pedestrian considerations. The interviewees do not havecomprehensive guidance on when to implement special pedestrian safety treatments, and oftenimplement these treatments in response to citizen feedback.
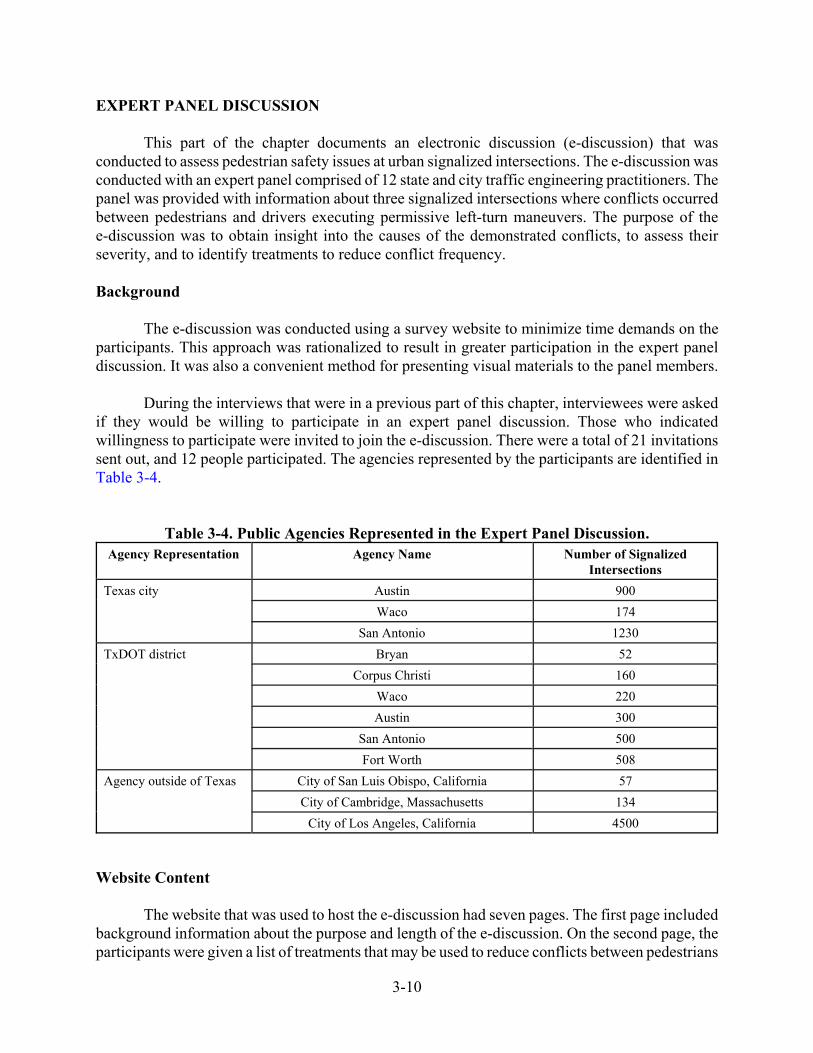
3-10
EXPERT PANEL DISCUSSION
This part of the chapter documents an electronic discussion (e-discussion) that wasconducted to assess pedestrian safety issues at urban signalized intersections. The e-discussion wasconducted with an expert panel comprised of 12 state and city traffic engineering practitioners. Thepanel was provided with information about three signalized intersections where conflicts occurredbetween pedestrians and drivers executing permissive left-turn maneuvers. The purpose of thee-discussion was to obtain insight into the causes of the demonstrated conflicts, to assess theirseverity, and to identify treatments to reduce conflict frequency.
Background
The e-discussion was conducted using a survey website to minimize time demands on theparticipants. This approach was rationalized to result in greater participation in the expert paneldiscussion. It was also a convenient method for presenting visual materials to the panel members.
During the interviews that were in a previous part of this chapter, interviewees were askedif they would be willing to participate in an expert panel discussion. Those who indicatedwillingness to participate were invited to join the e-discussion. There were a total of 21 invitationssent out, and 12 people participated. The agencies represented by the participants are identified inTable 3-4.
Table 3-4. Public Agencies Represented in the Expert Panel Discussion.Agency Representation Agency Name Number of Signalized
Intersections
Texas city Austin 900
Waco 174
San Antonio 1230
TxDOT district Bryan 52
Corpus Christi 160
Waco 220
Austin 300
San Antonio 500
Fort Worth 508
Agency outside of Texas City of San Luis Obispo, California 57
City of Cambridge, Massachusetts 134
City of Los Angeles, California 4500
Website Content
The website that was used to host the e-discussion had seven pages. The first page includedbackground information about the purpose and length of the e-discussion. On the second page, theparticipants were given a list of treatments that may be used to reduce conflicts between pedestrians

3-11
and left-turning vehicles. On the next three pages, the participants were shown three differentscenarios where conflicts occurred at signalized intersections. Each scenario consisted of sitedescription information, video clips of a conflict event observed from two angles, and questionsabout the contributing factors to the demonstrated conflict and possible treatments. On the last twopages, the participants were asked to indicate which agency they represented, and then given a briefconcluding statement thanking them for their participation.
On page 2 of the e-discussion website, a list of treatments was provided, along with a graphicimage to illustrate each treatment. These images included signal heads that are used for the differentleft-turn modes, examples of signs, or drawings indicating the type of phasing used. The participantswere given the list of treatments identified in Table 2-3 of Chapter 2.
Conflict event scenarios were shown on pages 3, 4, and 5 of the e-discussion. For each ofthe three scenarios, a conflict event was demonstrated using video clips. Each event was shown fromthe two viewing angles. One view was provided by a tripod-mounted camcorder located on the curbend of the subject crosswalk and pointed toward the crosswalk, along a line parallel to the crosswalk.The second view was provided by a pole-mounted camcorder located on the curb diagonallyopposite from the subject crosswalk. It provided a side view of pedestrians using the subjectcrosswalk.
The expert panel members were also provided with plan-view drawings, street-levelphotographs, and information about the traffic volumes and signalization characteristics of the sites.This information was intended to help the expert panel members understand the nature of theproblems so they could assess the contributing factors and identify treatments to alleviate theproblems.
The expert panel members were asked the questions listed in Figure 3-3 after they reviewedthe site description information and the video clips of the conflict event. The questions wererepeated for each of the three scenarios.
Scenarios
The scenarios are described in greater detail in the following three sections. The expert panelmembers’ responses to the questions about contributing factors and treatments are also provided.The members’ responses to the questions about conflict occurrence frequency is discussed in anaggregated manner in the next section because of the high degree of variability in the responses.
Scenario 1
The intersection is located near a university campus, and experiences moderate pedestrianvolumes and light left-turn volumes. The opposing intersection approach is a campus exit-onlydriveway that experiences light traffic volumes. The subject left-turn movement is operated in thepermissive mode. Conventional pedestrian signal heads are provided, but pedestrian push buttonsare not provided.

3-12
E-DISCUSSION QUESTIONS
Contributing Factors1. Assume that events similar to the one shown in the video clip occur often at this site. What are the
contributing factors to the problem? Choose up to three.a. Inadequate sight distanceb. High vehicular volumec. High pedestrian volumed. Inadequate opportunity for drivers to make a permissive left turn (protected left-turn phase not provided
or not long enough)e. Inadequate time for pedestrians to complete the crossing (walk and/or pedestrian clear intervals are too
short for individual pedestrians, or more time is needed due to high pedestrian volume)f. Left-turn phase sequence violates pedestrians’ expectationsg. Aggressive drivingh. Other (please specify—open-ended)
Treatments2. You have been directed to implement one or more treatments to address this problem. Which of the following
treatments would you use? Choose up to three.a. Change the left-turn mode to protected-permissiveb. Change the left-turn mode to protected-permissive with the flashing yellow arrow displayc. Change the left-turn mode to protectedd. Make the protected left-turn phase lagging instead of leadinge. Provide a leading pedestrian intervalf. Provide an exclusive pedestrian phaseg. Provide the pedestrian clear interval entirely during green (i.e., do not use the yellow change and red
clearance intervals as part of the pedestrian clearance time)h. Add turning vehicle warning signs and markingsi. Remove the crosswalk and prohibit crossing at this locationj. Other (please specify—open-ended)
Conflict Occurrence Frequency3. How often would events like the one in the video clip need to occur before you would deem it necessary to
treat the site? Consider only daytime cycles when pedestrians are present.a. Occurs in 1% of cyclesb. Occurs in 5% of cyclesc. Occurs in 25% of cyclesd. Occurs in $ 50% of cyclese. This problem is never important enough to require treatment
Figure 3-3. E-Discussion Questions.
The video clip shows that, as the pedestrians started to cross, a left-turning driver pulls intothe intersection to wait for a safe gap in the pedestrian stream. The driver starts steering into the turnat a time that there are no opposing through vehicles present, but is delayed because a group ofpedestrians start crossing after the start of the flashing DON’T WALK indication. While theleft-turning driver moves very slowly through the vehicle-vehicle conflict area (see Figure 1-1), aslow-moving opposing through vehicle arrives and is forced to maneuver around the waitingleft-turning vehicle.

3-13
Scenario 2
The intersection is located near a university campus. Both the pedestrian volume and theleft-turn volume are high. The opposing intersection approach is a campus street that experienceslight traffic volume. The subject left-turn movement is operated in protected-permissive mode witha leading sequence. Conventional pedestrian signal heads are provided, but pedestrian push buttonsare not provided.
The video clip shows that a large number of pedestrians are present on both corners. Manyof them start crossing prior to the start of the WALK indication, especially those originating fromthe near-side corner. Some pedestrians also start crossing after the start of the flashing DON’TWALK indication. As the pedestrian platoons from the near-side and far-side corners approach eachother, several left-turning vehicles pass through the closing gap in pedestrians. The gap for the lastvehicle is short enough that several approaching pedestrians slow while the vehicle passes.
Scenario 3
The intersection is located in a downtown grid area, with several restaurants, retail stores,and parking lots nearby. Both the pedestrian volume and the left-turn volume are low. The subjectleft-turn movement is operated in permissive mode. Conventional pedestrian signal heads areprovided, but pedestrian push buttons are not provided.
The video clip shows that, as a single pedestrian is crossing, a fast-moving left-turningvehicle arrives. The left-turning driver apparently does not notice the pedestrian and has to stopabruptly to avoid hitting the pedestrian. The pedestrian stops walking when he sees the left-turningdriver approaching.
Findings
The responses of the expert panel members were aggregated across the three scenariospresented in the e-discussion. Common themes emerging from the aggregated responses aresummarized in the following paragraphs, along with their implications for guideline development.
Contributing Factors
The expert panel members’ aggregated responses regarding contributing factors are shownin Figure 3-4. Overall, the most commonly identified contributing factors for conflicts betweenpedestrians and left-turning vehicles are: “aggressive driving,” “high pedestrian volume,” and“inadequate opportunity to turn.” Turning opportunities decrease with increasing volumes ofpedestrians or opposing through or right-turning vehicles. As turning opportunities become lessfrequent, aggressive driving behaviors on the part of left-turning drivers may increase. Hence,treatment selection guidelines that consider pedestrian and vehicular volumes are likely to accountfor the influence of the most commonly identified contributing factors.
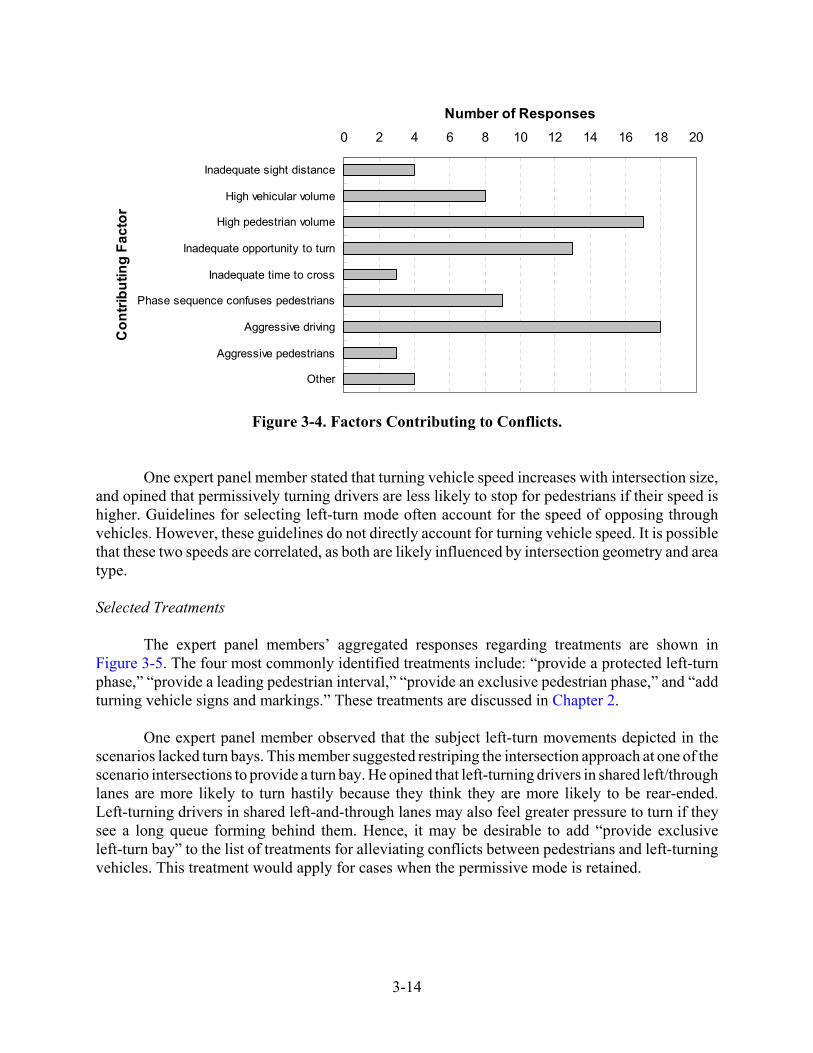
3-14
0 2 4 6 8 10 12 14 16 18 20
Inadequate sight distance
High vehicular volume
High pedestrian volume
Inadequate opportunity to turn
Inadequate time to cross
Phase sequence confuses pedestrians
Aggressive driving
Aggressive pedestrians
Other
Co
ntr
ibu
tin
g F
ac
tor
Number of Responses
Figure 3-4. Factors Contributing to Conflicts.
One expert panel member stated that turning vehicle speed increases with intersection size,and opined that permissively turning drivers are less likely to stop for pedestrians if their speed ishigher. Guidelines for selecting left-turn mode often account for the speed of opposing throughvehicles. However, these guidelines do not directly account for turning vehicle speed. It is possiblethat these two speeds are correlated, as both are likely influenced by intersection geometry and areatype.
Selected Treatments
The expert panel members’ aggregated responses regarding treatments are shown inFigure 3-5. The four most commonly identified treatments include: “provide a protected left-turnphase,” “provide a leading pedestrian interval,” “provide an exclusive pedestrian phase,” and “addturning vehicle signs and markings.” These treatments are discussed in Chapter 2.
One expert panel member observed that the subject left-turn movements depicted in thescenarios lacked turn bays. This member suggested restriping the intersection approach at one of thescenario intersections to provide a turn bay. He opined that left-turning drivers in shared left/throughlanes are more likely to turn hastily because they think they are more likely to be rear-ended.Left-turning drivers in shared left-and-through lanes may also feel greater pressure to turn if theysee a long queue forming behind them. Hence, it may be desirable to add “provide exclusiveleft-turn bay” to the list of treatments for alleviating conflicts between pedestrians and left-turningvehicles. This treatment would apply for cases when the permissive mode is retained.

3-15
0 2 4 6 8 10 12 14 16 18 20
Protected-permissive mode
Protected left-turn mode
Make left-turn phase lagging
Leading pedestrian interval
Exclusive pedestrian phase
Pedestrian clear within green
Signs and markings
Other
Tre
atm
en
tNumber of Responses
Protected left-turn mode Provide a leading left-turn phase
Protected-permissive mode with permissive-period omit
Figure 3-5. Rank of Selected Treatments.
Another expert panel member opined that a permissive left-turn period should never beallowed to run concurrently with pedestrian service if the street being crossed is six or more lanesin width. This member expressed support for adding curb extensions and reducing lane counts onthe street being crossed to reduce crossing distances. He also generally favored eliminating conflictsbetween pedestrians and left-turning vehicles by providing either protected left-turn mode orexclusive pedestrian phases.
Two treatments that were not commonly supported by the expert panel members includeproviding protected-permissive mode and providing the pedestrian clear interval entirely duringgreen. The expert panel members apparently did not see these treatments as being effective inreducing conflicts between pedestrians and left-turning vehicles.
Conflict Occurrence Frequency
For each of the three scenarios, the expert panel members were asked to indicate how oftenthe demonstrated conflict would need to occur before they would consider the problem significantenough to justify treatment. They were asked to consider only daytime cycles with pedestrianspresent. In other words, cycles occurring during periods of negligible pedestrian demand (e.g.,nighttime cycles) were not considered. The choices allowed are listed at the bottom of Figure 3-3.
The expert panel members’ responses varied significantly for each specific scenario.However, when the responses were aggregated across the three scenarios, a useful thresholdemerged. To compute this threshold, the five discrete choices listed at the bottom of Figure 3-3 wereregarded as ranked intervals indicating the probability of conflict occurrence. The width of aninterval was based on splitting the difference between the percentages of each adjacent choice. Theexpert panel members’ responses were counted for each choice and scenario. Then, the average

3-16
(2)
threshold conflict frequency was computed for each scenario using Equation 2. These thresholdsrepresent the frequency at which the scenario’s conflict would need to occur (in terms of percent ofsignal cycles) before the average expert panel member would deem it necessary to treat the site.
where,Tj = threshold conflict frequency for scenario j ( j = 1, 2, 3), percent of cycles.
ci, j = response count for scenario j and interval i (i = 1, 2,..., 5).w = probability interval width, percent.
Equation 2 was used to compute the averages shown in the last row of Table 3-5. Thethreshold conflict frequencies are 25, 20, and 25 percent of cycles, respectively, for the conflictsshown in scenarios 1, 2, and 3. The consistency of this percentage among scenarios suggests thattreatments should generally be considered for a site if conflicts between pedestrians and left-turningvehicles can be observed in 25 percent or more of the signal cycles.
Table 3-5. Conflict Occurrence Response Analysis.Interval
(i)Description Interval
Width (w), %Response Count by Scenario (c)
Scenario 1 Scenario 2 Scenario 3
1 Occurs in 1% of cycles 3.0 4 3 2
2 Occurs in 5% of cycles 12.0 1 5 5
3 Occurs in 25% of cycles 23.0 4 2 1
4 Occurs in $ 50% of cycles 63.0 3 2 3
5 Never important 0.0 0 0 1
Average Threshold Conflict Frequency (T), %: 25 20 25
Summary
In addition to the exposure variables of pedestrian and vehicular volumes, the expert panelresponses suggest that turning vehicle speed may be an appropriate consideration when selectingleft-turn mode. Based on the expert panel responses shown in Figure 3-5, the provision of aprotected-permissive left-turn mode and the provision of the pedestrian clear interval entirely duringgreen do not appear to be highly regarded options to reduce conflicts between pedestrians andleft-turning vehicles. The expert panel responses suggest that treatments should be considered ifconflicts between pedestrians and left-turning vehicles occur in 25 percent or more of signal cycles.

4-1
CHAPTER 4. MODEL DEVELOPMENT AND DATA COLLECTION
OVERVIEW
This chapter describes the development of a data collection plan. The data elements to becollected were identified through the examination of models used to represent pedestrian and vehiclebehavior. There are two components of the data collection plan. One component is focused on theplan for collecting vehicle operations data. The data collected will be used to quantify the effect ofalternative pedestrian-safety-related treatments on vehicle operations. The second component isfocused on the plan for collecting pedestrian safety data. The data collected will be used to quantifythe effect of alternative pedestrian-safety-related treatments on pedestrian safety.
This chapter consists of two parts. The first part describes the operations model and datacollection plan. The second part describes the safety model and data collection plan.
OPERATIONS MODEL AND DATA COLLECTION PLAN
This part of the chapter describes the steps taken to develop a data collection plan to quantifythe effect of alternative pedestrian-safety-related treatments on vehicle operations at signalizedintersections. A simulation model is used to obtain the data. The first section summarizes therationale for selecting a specific simulation model. The second section describes the elements of thedata collection plan.
Evaluation of Alternative Simulation Models
This section summarizes the findings from an evaluation of two candidate simulation tools.The evaluation separately considered each tool’s ability to quantify the effect of pedestriantreatments on vehicular performance. The features and capabilities discussed in this section arereferenced to the specific versions of the tools evaluated (i.e., VISSIM 5.10 and Synchro 6.0). Thesefindings may not be applicable to newer versions of these tools.
Pedestrian Models
There are two levels of pedestrian modeling in VISSIM. The first level is a standardpedestrian model which treats pedestrians as one type of vehicle. In the standard model, VISSIMallows users to create their own “pedestrian” vehicles. Users can modify the pedestrian vehicles’characteristics to replicate pedestrian attributes. These characteristics include pedestrian volume,walking speed, critical gap, and “pedestrian” car-following logic. The “pedestrian” car-followinglogic allows pedestrians to follow each other with much less restriction than vehicular traffic.
The second level is an advanced implementation of pedestrian modeling in VISSIM wherethe movement of pedestrians is based on the Social Force Model (SFM). Under SFM, pedestriansare able to move in all directions (including counter-flow situations), and the trips are based ondesignated origin-destination patterns. The main advantage of the SFM is the ability to modelinteractions among pedestrians. While the SFM module is much more realistic than the standard

4-2
pedestrian level model, it is not a standard add-on in the VISSIM version used. Based on thisexamination, the standard pedestrian model was rationalized to be appropriate for the evaluation ofthe pedestrian safety treatments identified in Chapter 2.
Synchro does not explicitly treat pedestrians as separate objects. Pedestrian characteristicsthat are provided as input to the models include: pedestrian calls per hour and pedestrian crosswalkvolume. The former input represents the number of pedestrian push button calls for the phase. Thelatter input represents the number of pedestrians per hour that conflict with the right-turn movementduring permitted operation.
Pedestrian-Vehicle Interactions
VISSIM provides two alternative methods for modeling pedestrian-vehicle interactions. Theyare the “priority-rules method” and the “conflict-area method.” Both methods have uniqueadvantages. With the priority-rules method, priority rules are used to define the right of way fornon-signal-protected conflicting movements. Vehicles and pedestrians recognize the presence ofeach other, even if they are on different links or connectors.
The conflict-area method is based on a defined conflict area at the intersection of two links.For each conflict area, the user can select which of the conflicting links has right of way (if any).As they approach a conflict area, drivers and pedestrians plan how to cross the conflict area. Ayielding driver (or pedestrian) observes the approaching vehicles (or pedestrians) in the main streamand identifies an acceptable gap. Then, the driver (or pedestrian) plans an acceleration profile forthe next few seconds that will allow him or her to cross the conflict area.
Realistic representation of pedestrian-vehicle interactions is more critical to the evaluationof pedestrian treatments because it will influence the accuracy to which VISSIM can estimate theeffect of pedestrians and various treatments on vehicle performance. The most appropriate methodmay depend on the treatment being evaluated.
In Synchro, pedestrian-vehicle interactions are incorporated into the calculation of saturationflow rate for the conflicting vehicle traffic stream. It is based on the model used in the 2000Highway Capacity Manual (1), which is discussed in Chapter 2.
Modeling Pedestrian Treatments
Table 4-1 summarizes the options for modeling pedestrian treatments with VISSIM andSynchro. Both simulation tools are shown to possess the features required for evaluating pedestriantreatments.

4-3
Table 4-1. Comparison of Simulation Tool Capabilities.Treatment VISSIM Synchro
Treatments Based on Conversion from Permissive Mode
Provide protected-permissive mode Yes Yes
Provide protected-permissive mode using flashingyellow signal display
Right-of-way rules must bedefined
Yes
Provide protected left-turn mode Yes Yes
Provide lagging phase sequence Yes Yes
Treatments Used in Conjunction with Permissive Mode
Provide leading pedestrian interval No, for ring-based control No
Provide exclusive pedestrian phase Yes Yes
Provide pedestrian clear interval entirely during green Yes Yes
Add turning vehicle warning signs and markings not applicable not applicable
Prohibit pedestrian crossing Yes Yes
Measures of Effectiveness
Both VISSIM and Synchro are capable of reporting operational performance measures suchas vehicle delay, queue length, and stop rate. However, VISSIM features data collection points thatcan be strategically placed in the network to log event-based data. These event data can bepost-processed to extract useful surrogate safety measures. This capability gives VISSIM a majoradvantage over Synchro because it can be used to evaluate both vehicle performance and pedestriansafety.
Summary
Both software tools were found to be capable of modeling pedestrian treatments that involvechanging the left-turn operational mode and phase sequence. However, VISSIM uses moresophisticated pedestrian models, and it is slightly more capable at modeling some complexpedestrian safety treatments. Therefore, VISSIM was determined to be the more viable optionrelative to the objectives of the research.
Data Collection Plan
The operations data collection plan was designed to produce data that could be used toquantify the effect of alternative pedestrian-safety-related treatments on vehicle operations.Specifically, these data would be used to develop a quantitative method for predicting the changein intersection delay due to the implementation of a single or a combination of pedestrian treatments.Intersection delay is defined as the weighted average delay of all vehicular traffic movements at theintersection. The weight used in computing this average is the vehicular volume for thecorresponding movement. Pedestrian delay was not considered in this analysis.
This section describes the data collection plan based on the use of VISSIM. The planconsisted of three tasks. The first task was the development of test bed intersections for simulation
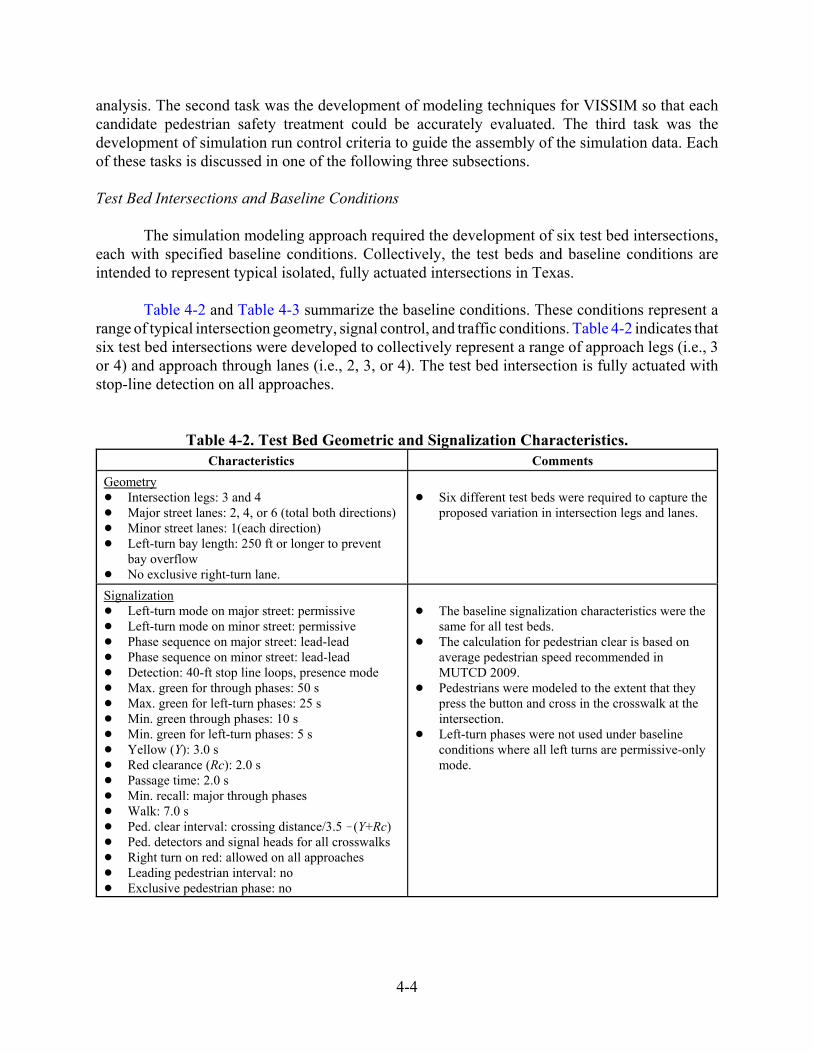
4-4
analysis. The second task was the development of modeling techniques for VISSIM so that eachcandidate pedestrian safety treatment could be accurately evaluated. The third task was thedevelopment of simulation run control criteria to guide the assembly of the simulation data. Eachof these tasks is discussed in one of the following three subsections.
Test Bed Intersections and Baseline Conditions
The simulation modeling approach required the development of six test bed intersections,each with specified baseline conditions. Collectively, the test beds and baseline conditions areintended to represent typical isolated, fully actuated intersections in Texas.
Table 4-2 and Table 4-3 summarize the baseline conditions. These conditions represent arange of typical intersection geometry, signal control, and traffic conditions. Table 4-2 indicates thatsix test bed intersections were developed to collectively represent a range of approach legs (i.e., 3or 4) and approach through lanes (i.e., 2, 3, or 4). The test bed intersection is fully actuated withstop-line detection on all approaches.
Table 4-2. Test Bed Geometric and Signalization Characteristics.Characteristics Comments
Geometry! Intersection legs: 3 and 4! Major street lanes: 2, 4, or 6 (total both directions)! Minor street lanes: 1(each direction)! Left-turn bay length: 250 ft or longer to prevent
bay overflow! No exclusive right-turn lane.
! Six different test beds were required to capture theproposed variation in intersection legs and lanes.
Signalization! Left-turn mode on major street: permissive! Left-turn mode on minor street: permissive! Phase sequence on major street: lead-lead! Phase sequence on minor street: lead-lead! Detection: 40-ft stop line loops, presence mode! Max. green for through phases: 50 s! Max. green for left-turn phases: 25 s! Min. green through phases: 10 s! Min. green for left-turn phases: 5 s! Yellow (Y): 3.0 s! Red clearance (Rc): 2.0 s! Passage time: 2.0 s! Min. recall: major through phases! Walk: 7.0 s! Ped. clear interval: crossing distance/3.5 !(Y+Rc)! Ped. detectors and signal heads for all crosswalks! Right turn on red: allowed on all approaches! Leading pedestrian interval: no! Exclusive pedestrian phase: no
! The baseline signalization characteristics were thesame for all test beds.
! The calculation for pedestrian clear is based onaverage pedestrian speed recommended inMUTCD 2009.
! Pedestrians were modeled to the extent that theypress the button and cross in the crosswalk at theintersection.
! Left-turn phases were not used under baselineconditions where all left turns are permissive-onlymode.

4-5
Table 4-3. Test Bed Traffic Characteristics.Characteristics Comments
Traffic Characteristics! Major approach volume (veh/h/ln): 400, 600, and
800! Minor approach volume: 30% and 50% of major
approach volume! Turn percentages for four-leg intersection:
" Left turn: 10%" Right turn: 10%
! Turn percentages for three-leg intersection:" Left-turn from minor approach: 45%" Right-turn from minor approach: 55%" Left-turn from major approach: 10%" Right-turn from major approach: 10%
! 2-way pedestrian crosswalk volume(p/h/crosswalk): 0, 100, and 400
! Average pedestrian speed: 3.5 ft/s! Approach speed: 35 mi/h! Left- and right-turn speeds: 15 mi/h! Percent trucks: 0%
! The delay difference between non-zero andzero-pedestrian scenarios determines the amountof delay incurred by pedestrians.
! The saturation flow rate is a result of acombination of parameters specified in thecar-following models and cannot be explicitlydefined in VISSIM.
! Standard pedestrian feature in VISSIM does notallow bidirectional movements for the link.Therefore, the 2-way pedestrian volumes arecoded as two separate directional links with the2-way volume split in half for each direction.
Yielding Characteristics! Front and rear gaps for permissive lefts and
opposing through: 0.5 s! Front and rear gaps for permissive lefts and
pedestrians: 0.5 s! Front and rear gaps for permissive rights and
pedestrians: 0.5 s
! Conflict zones in VISSIM were used to modelvehicle and pedestrian interactions.
! Front Gap: Minimum gap in seconds between therear end of a vehicle/pedestrian on the prioritymovement and the front end of a vehicle on theyielding movement.
! Rear Gap: Minimum gap in seconds between therear end of a vehicle on the yielding movementand the front end of a vehicle/pedestrian on thepriority movement.
Table 4-3 indicates that there are three levels of major approach volume, two levels of minorapproach volume, and three levels of pedestrian volume. These variations produce 18 unique levelsof traffic and pedestrian volume.
The full factorial design represents a total of 108 unique combinations (= 6 test beds ×18 volume levels) for simulation analysis. The 108 combinations described in this section representthe “base” conditions. These conditions were established to provide a basis for estimating the effectof each pedestrian treatment identified in Table 2-3 of Chapter 2.
Pedestrian Treatments
Each pedestrian treatment listed in Table 2-3 of Chapter 2 was simulated in VISSIM bymodifying the base conditions. Table 4-4 describes these modifications as well as the changes madeto the test beds for each treatment. All of the pedestrian treatments were implemented usingVISSIM’s ring-barrier control mode, which is very similar to the dual-ring signal control logic usedin U.S. controllers.

4-6
Table 4-4. Test Bed Modifications for Each Pedestrian Treatment.Treatment Modifications Changes to VISSIM Test Beds
Treatments Based on Conversion from Permissive Mode
1. Provide protected-permissive mode
! Left-turn mode on major street:protected-permissive
! Left-turn mode on minor street:protected-permissive
! Adding left-turn phases in the controller.! Map the left-turn detector to the
corresponding left-turn phase.! Permissive (circular) green for left turns is
driven by the concurrent through phase.
2. Provide protected-permissive mode usingflashing yellow (FY)signal display
! Left-turn mode on major street:protected-permissive (FY operation)
! Left-turn mode on minor street:protected-permissive (FY operation)
! Same as treatment 1 but permissive(circular) green for left turns is driven byan overlap of opposing through and left.
3. Provide protected left-turn mode
! Left-turn mode on major street:protected-only
! Left-turn mode on minor street:protected-only
! Same as treatment 1 but no permissivegreen indication is provided.
4. Provide lagging phasesequence
! Phase sequence on major street: lag-lag! Phase sequence on minor street: lag-lag! Left-turn mode on major street: lag-lag! Left-turn mode on minor street: lag-lag
! Apply the changes as in treatment 1 andthen modify the phase sequence in thecontroller from lead-lead to lag-lag.
! The effect of this treatment will be acombination of treatments 1 and 4.
Treatments Used in Conjunction with Permissive Mode
5. Provide leadingpedestrian interval (LPI)
! Leading pedestrian interval: 3 s for allcrosswalks.
! LPI is not directly implemented in theVISSIM ring-barrier controller.
! To simulate LPI, the through phase isdefined to have a delayed green overlapdriven by its own phase. The standardthrough phases (2, 4, 6, 8) will drive boththe pedestrian heads and the delayed greenoverlap. As a result, the green for eachthrough phase will be delayed by thespecified LPI.
6. Provide exclusivepedestrian phase
! Add exclusive pedestrian phase.! Prohibit RTOR on all approaches.! Pedestrian clear on all crossings: crossing
distance divided by 3.5 ft/s! All red: 0 s
! Remove pedestrian phases from concurrentvehicle phases.
! Remove RTOR on all approaches.! Add exclusive pedestrian phase after the
barrier of the major street phases.! Invoke the scramble phase option in the
controller.! Use walk interval of 7 s.
7. Provide pedestrian clearinterval entirely duringgreen
! Pedestrian clear on all crossings: crossingdistance divided by 3.5 ft/s
! Update the pedestrian clear setting in thecontroller.
8. Add turning vehiclewarning signs andmarkings
not applicable not applicable
9. Prohibit pedestriancrossing
not applicable not applicable

4-7
Simulation Approach
Run Control. A total of 864 simulation runs were completed. This total represented 108 runsto define the performance of the base conditions and an additional 756 runs (= 7 treatments x 108combinations) to define the performance of the treatments. One replication was used for eachcombination. Each simulation run consisted of a 5-minute warm-up period and then a 60-minute datacollection period.
The results from each set of 108 simulation runs for a treatment were paired with thecorresponding 108 runs for the base conditions. A one-to-one pairing of the performance estimatesfor each combination was used to determine the effect of the treatment. This approach allowed theresearchers to quantify the effect of a treatment on delay, in isolation of the effect of other changesor treatments.
Intersection Delay. The delay measurement obtained from VISSIM is equivalent to controldelay. It is computed as the difference between the actual travel time and the ideal travel time. Theideal travel time represents the travel time when there are no other vehicles present, and controldevices have no influence on vehicle speed. Intersection delay is a volume-weighted average controldelay for the intersection, where the delay to each intersection movement is weighted by its volume.
In VISSIM, delay is based on one or more “travel time sections.” Delay is measured for allvehicles that pass through these travel time sections, independently of the vehicle classes selectedin these travel time sections.
To collect intersection delay in VISSIM, 12 travel time sections (three movements per leg)were placed in the test bed for the four-leg intersections while six sections (two movements per leg)were used in the case of three-leg intersections. Each travel time section logs the average vehicletravel time and the number of vehicles traversing the section. The delay for the segment wascalculated based on individual or a group of travel time sections.
A post-processing tool was developed to help with extracting and reducing the simulatedtravel time data. This tool was designed to extract travel time and other key data elements from thesimulation output files. It was also designed to perform any necessary calculations. The results fromthe simulation runs were reported in a spreadsheet with the output for each run placed in one rowof the spreadsheet.
Issues That Prevented Use of Some Combinations. VISSIM does not directly model theleading pedestrian interval (LPI) operation. In modern controllers, pedestrian signal heads areactuated, and LPI is activated only when there are pedestrian calls. However, in VISSIM ring-barriercontrol, LPI is active every phase, regardless of whether a pedestrian is present. This limitation wasovercome by not simulating the cases of zero pedestrian volume with the LPI treatment.
The results from a series of initial simulation runs indicated that the permissive-only modeused in several of the treatments was unable to accommodate heavy left-turn volumes, particularlyin combinations that included 800 veh/h/ln and six lanes on the major street. This caused the queued
4-8
(3)
(4)
vehicles in the left-turn bay to grow indefinitely with the simulation time (i.e., an unsteady state).Such cases were identified and excluded from subsequent analyses.
SAFETY MODEL AND DATA COLLECTION PLAN
This part of the chapter describes the steps taken to develop a data collection plan to supportthe development of a pedestrian-vehicle conflict prediction model. This model would be applicableto conflicts at signalized intersections. It would be used to evaluate the safety benefits of alternativepedestrian treatments. The data are collected during field studies at several intersections. The firstsection describes the development of predictive models to guide the formulation of the datacollection plan. The second section describes the elements of the data collection plan.
Model Development
Two models are described in this section. One model predicts the frequency of pedestrian-vehicle conflicts based on the legal pedestrian volume. The second model predicts the legalpedestrian volume based on the total pedestrian volume. One variable that was included in thesecond model is pedestrian delay. Thus, this section also describes a model for predicting pedestriandelay.
Pedestrian Delay
Pedestrians crossing the street at a signalized intersection can experience delay due to thesignal operation. If this delay is excessive, some pedestrians may choose to cross illegally (i.e.,jaywalk). The average pedestrian delay is computed using Equation 3. This equation is obtainedfrom Chapter 18 - Pedestrians of the Highway Capacity Manual (1).
where,dp = pedestrian delay due to signal, s/p.C = cycle length, s.
gped = pedestrian service time (= Walk + 4.0), s.Walk = walk interval duration, s.
Pedestrian-Vehicle Conflict Model
The model for predicting conflicts between legally crossing pedestrians and left-turn vehiclesis shown as Equation 4. A similar model form is used for conflicts between left-turn vehicles andpedestrians crossing illegally.
where,Nco,L = frequency of pedestrian-vehicle conflicts involving legal pedestrians, conflicts/h.
vlt = conflicting left-turn volume, veh/h.

4-9
(5)
(6)
vped,L = legal pedestrian volume in the crosswalk (walking in either direction), p/h.Xi = independent variable i.bi = calibration coefficients, i = 0, 1, 2,....
The first two terms in parentheses represent the left-turn volume term and the pedestrianvolume term, respectively. Their product represents the combined exposure to pedestrian-vehicleconflict. The legal pedestrian volume represents the count of legal pedestrians divided by the countperiod duration. The third term in the equation represents the risk of conflict, given this exposure.
The independent variables Xi in the third term represent any variables that are found duringmodel calibration to have some influence on the risk of conflict. Example variables includecrosswalk length, vehicle travel time to conflict area, phase sequence, left-turn mode, cycle length,pedestrian delay, portion of the yellow interval used for pedestrian clearance, and queue clearancetime for the opposing through movement.
Legal Pedestrian Volume Model
The preceding section described a model that is based on the legal pedestrian volume. Amodel for estimating this volume is described in Equation 5.
with
where,vped,L = legal pedestrian volume in the crosswalk (walking in either direction), p/h.vped,t = pedestrian volume in the crosswalk (walking in either direction), p/h.
pp = probability that the WALK indication is presented (= 1.0 if pretimed or on ped. recall).Pb = probability of a pedestrian pressing the detector button.C = cycle length, s.ci = calibration coefficients, i = 0, 1, 2,....
The first term in Equation 5 represents total pedestrian volume for the crosswalk during theanalysis period. It is considered to be an exposure term for this model.
The second term represents the probability that the WALK indication is presented. It is alsoconsidered to be an exposure term for this model. This probability is 1.0 if the signal operates underpretimed control or the phase is set for pedestrian recall. Equation 6 is used to compute thisprobability for pedestrian actuated operation. The probability of a single pedestrian pressing thedetector button reflects the tendency of some pedestrians not to use the detector button beforecrossing a street. Research indicates that about 51 percent of crossing pedestrians will push thebutton to place a call for pedestrian service (2).

4-10
The third term represents the probability that a pedestrian using the crosswalk is “legal,” asdefined in Chapter 1, given that the phase was called. It is a logistic regression model, similar to thatused by Hubbard et al. (3) to estimate the probability of conflict.
The independent variables Xi in the third term represent any variables that are found to havesome influence on pedestrian compliance with the signal. Example variables include crosswalklength, median presence, average pedestrian age, pedestrian delay, conflicting vehicle flow rate, andtype of pedestrian signal display (i.e., symbol or countdown). The variable for pedestrian delay wasconsidered because it is rationalized that the probability of a legal crossing will decrease with anincrease in delay due to the signal.
Data Collection Plan
This section describes the data collection plan. It consists of three subsections. The firstsubsection identifies the variables collected. The second subsection identifies the study sites. Thethird subsection describes the data collection procedures followed during each field study.
Database Elements
The data collected during this study were used to calibrate the models described in theprevious section. Table 4-5 lists the types of data that were needed for model calibration. Thecharacteristics and conflict measures listed were counted each cycle and summarized for each 15-min count period. The cycle length was measured each cycle and similarly summarized. The othervariables listed were quantified during a site survey conducted prior to the start of the study period.

4-11
Table 4-5. Variables in Conflict Database. Category Variable
Vehiclecharacteristics
• Count of left-turn vehicles crossing subject crosswalk• Count of left-turn vehicles crossing subject crosswalk during opposing through green interval• Count of through and right-turn vehicles opposing subject left-turn movement• Count of vehicles crossing crosswalk during steady DON’T WALK indication
Pedestriancharacteristics
• Count of pedestrians in subject crosswalk (walking in either direction) by age group1
• Count of pedestrians that enter crosswalk (or attempted to enter it) during the WALKindication by age group1
• Count of pedestrians that enter the crosswalk during the flashing or steady DON’T WALKindication
Intersectiongeometry
• Length of subject crosswalk (curb face to curb face)• Width of subject crosswalk (center of marking to center of marking)• Number of lanes serving subject left-turn movement• Number of receiving lanes for subject left-turn movement• Number of opposing through lanes• Skew angle• Distance from left-turn stop line to representative crosswalk conflict point• Presence of a median and its width
Signalization • Cycle length• Walk interval duration for subject crosswalk• Pedestrian clear interval duration for subject crosswalk• Left-turn mode (permissive or protected-permissive)• Phase sequence (permissive, leading, lagging, split)• Use of a leading or lagging pedestrian interval• Allowance of right-turn-on-red• Control type (pretimed, full-actuated, semi-actuated, coordinated-actuated)
Traffic controldevices
• Speed limit of traffic crossing subject crosswalk• Presence of count-down pedestrian display
Conflictmeasures
• Count of legal pedestrian-vehicle conflicts in conflict area of subject crosswalk• Count of illegal pedestrian-vehicle conflicts in conflict area of subject crosswalk
Note:1 - Age groups: Child (less than 12 years), Teen (12 - 17), Young (17-25), Adult (25-60), Senior (60 or more).
Study Sites
At total of 20 study sites were chosen from among those available in the cities of CollegeStation and Austin. A “site” is defined to be one crosswalk. Each site is associated with one left-turning movement. This is the movement that crosses the crosswalk as it exits the intersection. TheCollege Station sites are located close to the Texas A&M University campus. The Austin sites werechosen from the downtown city grid and the area surrounding the University of Texas campus. Thesites are identified in Table 4-6. A more detailed description of these sites is provided inAppendix A. Collectively, these sites represent a range of vehicular and pedestrian volumes.

4-12
Table 4-6. Study Site Description.City Intersecting Street by Direction Subject Left-
TurnMovement
PhaseSequence
Left-TurnVolume,
veh/h
PedestrianVolume,
p/hNorth-South East-West
Austin Congress Ave. 4th Street Northbound Perm. only 25 179
Eastbound Perm. only 21 84
Southbound Perm. only 15 109
Westbound Perm. only 74 53
Congress Ave. 5th Street Eastbound Perm. only 78 84
Congress Ave. 6th Street Northbound Lagging 196 123
Westbound Perm. only 165 253
Congress Ave. 7th Street Southbound Lagging 64 113
Guadalupe St. 21st Street Eastbound Perm. only 18 198
Westbound Perm. only 50 234
Guadalupe St. 22st Street Eastbound Perm. only 12 162
Guadalupe St. 24st Street Eastbound Leading 214 232
Guadalupe St. Dean Keeton St. Southbound Leading 202 96
Guadalupe St. 27st Street Westbound Perm. only 55 60
San Jacinto Blvd. Dean Keeton St. Northbound Perm. only 62 30
Southbound Perm. only 146 45
Medical Arts St./Robert Dedman Dr.
Dean Keeton St. Northbound Perm. only 103 43
Southbound Perm. only 42 21
College Station Spence Street University Drive Northbound Perm. only 33 155
Southbound Perm. only 49 357
Data Collection Procedure
The data collection at each site consisted of a site survey followed by a video recording ofvehicle and pedestrian activity. The recordings took place during the two-hour period that spans thepeak hour of pedestrian demand at the site. Data were not collected during rain events.
Pedestrian-vehicle conflicts were recorded by video camera during each field study. Twovideo cameras were used at each site to ensure full coverage of the intersection. Figure 4-1 illustratesa typical two-camera setup for evaluating the northbound left-turn movement and associated conflictarea. One camera was located in line with the subject crosswalk. This camera monitored thepedestrian signal head, left-turn signal head, and crosswalk area. The second video camera was usedto monitor the left-turn stop line, left-turn vehicle travel path, vehicle brake lights, and crosswalk.Together, the two cameras were able to provide three-dimensional coverage of pedestrian activityin the conflict area.

4-13
a. Plan View of Video Camera Locations.
b. Camera 1 Location. c. Camera 2 Location.
Figure 4-1. Video Camera Locations.
REFERENCES
1. Highway Capacity Manual. Transportation Research Board, National Research Council,Washington, D.C., 2000.
2. Zegeer, C., K. Opiela, and M. Cynecki. Pedestrian Signalization Alternatives. ReportFHWA/RD-83/102. Federal Highway Administration, Washington, D.C., 1983.

4-14
3. Hubbard, S., R. Awwad, and D. Bullock. “Assessing the Impact of Turning Vehicles onPedestrian Level of Service at Signalized Intersections.” Transportation Research Record 2027.Transportation Research Board, Washington, D.C., 2007, pp. 27–36.

5-1
CHAPTER 5. DATA REDUCTION AND SUMMARY
OVERVIEW
This chapter describes the data reduction process and summarizes the data collected. Thereare two databases assembled for this project. One database describes the effect of alternativepedestrian-safety-related treatments on vehicle operations. The second database describes the effectof alternative pedestrian-safety-related treatments on pedestrian safety.
This chapter consists of two parts. The first part describes the operations data that wereobtained from a simulation tool. The second part describes the safety data that were collected atseveral intersections in Texas.
OPERATIONS DATA
This part of the chapter describes the findings from an evaluation of seven pedestriantreatments using traffic simulation. These treatments were identified in Table 4-4 of Chapter 4. Theevaluation quantified the operational impact of each treatment in terms of the resulting change inintersection delay. The impacts were used to develop predictive models for estimating the changein delay due to the treatment and other factors. These models are described in Chapter 6.
Delay Summary by Treatment
Table 5-1 summarizes the intersection delay statistics for each treatment. As noted inChapter 4, the results from a series of initial simulation runs indicated that the permissive-only modeused in several of the treatments was unable to accommodate heavy left-turn volumes. This causedthe queued vehicles in the left-turn bay to grow indefinitely with the simulation time (i.e., anunsteady state). Such cases were identified and excluded from subsequent analyses.
The use of leading pedestrian interval also presented some issues and required theelimination of combinations that had zero pedestrian volume. The run combinations excluded were:
! Those combinations where the queue grows indefinitely with the simulation due to the useof the permissive left-turn mode with high through volume.
! Those combinations with leading pedestrian interval treatment and zero pedestrian volume.
Columns 2, 3, and 4 in Table 5-1 list the simulation results before the aforementionedcombinations were removed. Columns 5, 6, and 7 list the results after the invalid combinations wereremoved. A comparison of these columns shows that the average and standard deviation of the delaydata are significantly lower when the invalid combinations are excluded. The effects of invalid delaydata are more pronounced in the base case, leading pedestrian interval, exclusive pedestrian phase,and pedestrian clear treatments. When these invalid cases are excluded, the mean delay values rangefrom 18 to 26 s/veh for all the treatments evaluated.

5-2
Table 5-1. Summary of Intersection Delay Statistics by Treatment.
Treatment DescriptionAll Delay Data 1 Selected Delay Data 1
Average,s/veh
StandardDeviation,
s/veh
Obser-vations
Average,s/veh
StandardDeviation,
s/veh
Obser-vations
Base condition 28.1 32.7 108 18.0 7.1 98
Provide protected-permissive mode 23.1 10.0 108 23.1 10.0 108
Provide protected-permissive modeusing flashing yellow signal display
23.0 10.3 108 23.0 10.3 108
Provide protected left-turn mode 28.3 14.9 108 26.0 9.1 104
Provide lagging phase sequence 22.0 7.5 108 22.0 7.5 108
Provide leading pedestrian interval 33.4 35.6 108 23.6 8.9 63
Provide exclusive pedestrian phase 47.7 50.9 108 24.2 10.7 86
Provide pedestrian clear intervalentirely during green
31.4 33.1 108 20.8 10.0 96
Note:1 - Only the delay data from valid simulation cases were retained for subsequent analysis.
Change in Intersection Delay
The percent change in intersection delay due to a treatment was used as the basis fortreatment evaluation. This statistic compares the delay due to the treatment with that found for thebase condition. A positive percentage signifies an increase in intersection delay associated with thetreatment and a negative percentage signifies a decrease in intersection delay.
A paired-observation approach was used to control for (i.e., eliminate) changes in delay dueto influences not tied to the change in treatment. This approach required pairing the delay estimatefor each combination of the base conditions with the delay estimate for the exact same combinationfor the treatment. Given that there is only one replication for each combination, the maximumpossible number of observation pairs for a given treatment is 108 (i.e., one pair for eachcombination).
The distribution of percent change in intersection delay for each treatment is shown inTable 5-2. All of the treatments increased delay relative to the base condition. The negative valuesshown are primarily from the treatments where the base condition has exceptionally high delayvalues (e.g., from a combination of heavy left-turn volumes and permissive-only mode operation).
Four treatments have large negative percentages for their minimum observed values. Thecommon characteristic for these treatments is that they utilize either a protected orprotected-permissive mode which helps reduce their delay (under certain volume levels) relative tothe base condition (which has the permissive mode).

5-3
Table 5-2. Percent Change in Intersection Delay by Treatment.
Treatment DescriptionPercent Change in Intersection Delay
Minimum,%
Average, %
Maximum,%
StandardDeviation, %
Obser-vations
Base condition 98
Provide protected-permissive mode !69.4 19.7 56.9 17.3 98
Provide protected-permissive modeusing flashing yellow signal display
!68.2 18.1 53.7 16.9 98
Provide protected left-turn mode !65.4 42.2 87.5 24.5 98
Provide lagging phase sequence !65.2 18.7 72.3 20.7 98
Provide leading pedestrian interval 3.1 20.9 116.7 22.7 63
Provide exclusive pedestrian phase 0.0 42.8 144.7 32.1 86
Provide pedestrian clear intervalentirely during green
!3.6 15.4 132.9 24.7 96
The last column of Table 5-2 indicates the number of observation pairs for each treatment.The combinations are less than 108 in all cases. This reduction reflects the need to reduce the basecondition treatment combinations from108 to 98 because 10 combinations resulted in a high delayvalue from unsteady queue conditions. This reduction translated into a 10-observation reduction forthe other treatments because the base combinations were used to form data pairs for each treatment.The LPI treatment has only 63 observation pairs because the combinations with zero pedestrianvolume were excluded from the analysis (for reasons described in a previous section).
SAFETY DATA
This section summarizes the safety data collected at 20 field study sites in Texas. The safetydata collection plan was described in Chapter 4. The safety database will be used to calibrate modelsto predict the effects of pedestrian safety treatments on pedestrian-vehicle conflict frequency. Thesemodels are described in Chapter 6.
Pedestrian Demographics
More than 1400 cycles were observed at the collective set of study sites. During these cycles,approximately 7600 pedestrians were observed in the subject crosswalks. About 5200 of thesepedestrians were legal pedestrians (as defined in Chapter 1). The distributions of cycle andpedestrian counts are provided in Table 5-3.
The gender and age group of each legal pedestrian were determined using visual appearance.The count of legal pedestrians for each combination of gender and age group is given in Table 5-4.Most of the pedestrians at the university campus sites were in the “young” category, while most ofthe pedestrians at the downtown grid sites were in the “adult” category.

5-4
Table 5-3. Cycle and Pedestrian Counts by Site Category.Conflict Area
Length 1Cycle and Pedestrian Counts by Left-Turn Mode
Permissive Protected-Permissive
Cycles Legal Pedestrians Cycles Legal Pedestrians
Long 487 1950 178 465
Short 598 2132 110 652Note:1 - Conflict area length is equal to the combined width of the receiving lanes. It is “short” if the site has two or fewer
receiving lanes. It is “long” if the site has three or more receiving lanes.
Table 5-4. Legal Pedestrian Distribution by Gender and Age Group.Age Group Gender Total
Female Male Undetermined
Child (less than 12 years) 10 6 0 16
Teen (12 to 17) 2 1 0 2
Young (17 to 25) 1427 1817 1 3245
Adult (25 to 60) 738 1176 1 1915
Senior (60 or more) 3 26 0 29
Total: 2180 3026 2 5208
Signalization Characteristics
A cycle length of 80 s was observed at the downtown sites, while the university campus siteshad cycle lengths that ranged from 110 to 150 s. The walk intervals at the sites ranged from 4 to30 s, and the pedestrian clear intervals ranged from 14 to 28 s.
Vehicular Volumes
The following vehicular counts were extracted from the videotape recordings on acycle-by-cycle basis:
! Left-turning vehicles crossing the subject crosswalk during the protected left-turn phase.! Left-turning vehicles crossing the subject crosswalk during the opposing through green
interval.! Through and right-turning vehicles opposing the subject left-turn movement.! Cross-street vehicles crossing the subject crosswalk.
The cross-street vehicles were counted during the cross-street phases preceding the subjectcrosswalk’s WALK indication. Hence, the cross-street volume serves as a surrogate measure for the“busyness” of the site as observed by pedestrians waiting to cross. Vehicles turning left during thepermissive period and opposing through and right-turning vehicles were counted during the phasesrunning concurrently with the subject crosswalk’s WALK indication. Vehicles turning left duringthe protected period were counted during the phases immediately preceding or following the subject

5-5
crosswalk’s WALK indication. These counts were used to compute the hourly flow rates providedin Table 5-5. For each site category, the observed ranges and averages across sites are provided.
Table 5-5. Vehicular Volumes by Site Category.Left-Turn
ModeConflict
AreaLength
Vehicular Volume, veh/h
Left Turns DuringProtected Period
Left-Turns DuringPermissive Period
Opposing Throughand Right Turns
All Cross StreetMovements
Average Range Average Range Average Range1 Average Range
Permissive Long 70 20–165 55 0–185 1640 900–2800
Short 55 10–145 175 0–575 1190 230–1935
Protected-permissive
Long 35 15–55 95 45–140 400 305–490 590 560–625
Short 140 140–170 50 30–75 490 75–900 1040 450–1620Note:1 - Zero volume was recorded for a movement that did not exist due to intersection geometry or lane assignment.
Pedestrian Volumes
Counts of total and legal pedestrians were extracted from the videotape recordings on acycle-by-cycle basis. Directional counts were conducted for pedestrians originating from the nearand far corners of the subject crosswalk, and then summed to obtain aggregated counts. A range ofvalues for these volumes was observed for each site category. These volumes are provided inTable 5-6. The pedestrians that cross legally range from 66 to 79 percent, with the higherpercentages in this range found at the sites with a permissive left-turn mode.
Table 5-6. Pedestrian Volumes by Site Category.Left-Turn
ModeConflict Area
LengthTotal Volume, p/h Legal Volume, p/h Total Volume, p/cycle
Average Range Average Range Average Range
Permissive Long 210 70–465 165 55–360 5 2–14
Short 145 45–265 110 20–235 5 2–11
Protected-permissive
Long 160 160–160 115 110–125 4 4–4
Short 250 135–370 165 95–235 9 5–13
A more detailed analysis of the directional pedestrian counts revealed that when thepedestrian demand was high on a per-cycle basis, the pedestrians tended to simultaneously cross thecrosswalk in both travel directions. Specifically, when pedestrian volume exceeded five pedestriansper cycle, about 91 percent of the cycles had pedestrians originating from both corners. Thisdistribution is shown in Table 5-7. This trend is of interest because when pedestrians originate fromboth corners, there are likely to be two separate pedestrian platoons that pass through the conflictarea at different times, such that left-turning vehicles are blocked by pedestrians for a longer periodof time. Thus, intersections with long cycle lengths due to the use of protected-permissive left-turnphases may have a larger exposure to pedestrian conflict.

5-6
Table 5-7. Pedestrian Volumes and Platoon Patterns.Pedestrian Platoon Pattern Number of Cycles by Pedestrian Count
$ 5 p/cycle # 4 p/cycle Total
No pedestrians -- 158 158
Originating from far corner only 25 223 248
Originating from near corner only 26 156 182
Originating from both corners 530 255 785
Total: 581 792 1373
Conflict Measures
Pedestrian-based conflicts were counted during the data reduction process. These conflictswere separately counted for legal pedestrians (as defined in Chapter 1) and illegal pedestrians. Thediscussion in this section is focused on conflicts involving legal pedestrians.
A pedestrian-based conflict is considered to have occurred if a pedestrian performs any ofthe following actions:
! Slows down due to a vehicle.! Stops and waits for a vehicle in the crosswalk.! Steps sideways to avoid a vehicle.! Runs or speeds up to avoid a vehicle.! Runs or speeds up to clear the crosswalk after starting the crossing late due to a vehicle.! Turns back to the origin curb to avoid a vehicle.! Turns back to the origin curb to clear the crosswalk after starting the crossing late due to a
vehicle.! Delays leaving the origin curb due to a vehicle.! Attempts to cross but does not leave the origin curb.
If an interaction occurred between one vehicle and multiple pedestrians, and all of thepedestrians were observed performing one of these actions, the number of pedestrian-based conflictsoccurring was taken as the number of pedestrians present. For example, if a vehicle encroached onthe crosswalk and four pedestrians stopped and waited for the vehicle to pass, the event would becounted as four pedestrian-based conflicts.
The numbers of pedestrian-based conflicts observed for each of the site categories areprovided in Table 5-8. The pedestrian volumes listed in Table 5-3 were used to compute conflictrates. These rates are also shown in Table 5-8.

5-7
Table 5-8. Pedestrian-Based Conflicts by Site Category.
ConflictArea
Length
Conflicts by Left-Turn Mode Total Conflicts
Permissive Protected-Permissive
Count,conflicts
Rate,conflicts/1000 p
Count,conflicts
Rate,conflicts/1000 p
Count,conflicts
Rate,conflicts/1000 p
Long 21 10.8 3 6.4 24 9.9
Short 15 7.0 30 46.0 45 16.2
Total: 36 8.8 33 29.5 69 13.3
A total of 24 pedestrian-based conflicts were observed at sites with long conflict areas (i.e.,sites with three or more receiving lanes). Almost twice as many conflicts (45) were observed at siteswith short conflict areas (i.e., two or fewer receiving lanes). This trend is also found in the conflictrates shown in Table 5-8. It suggests that a larger number of receiving lanes allows left-turningdrivers more flexibility to find gaps in the pedestrian stream.
Further examination of the aforementioned trend suggests that there is an interaction betweenleft-turn mode and conflict area length. Specifically, the trend in conflict rates suggests that thecombination of protected-permissive left-turn mode and short conflict area produces a significantlylarger potential for conflict.


6-1
(7)
CHAPTER 6. MODEL CALIBRATION AND GUIDELINE DEVELOPMENT
OVERVIEW
This chapter describes the process used to develop guidelines for selecting alternativepedestrian-safety-related treatments for signalized intersections. These guidelines are based onconsideration of road-user costs associated with pedestrian-vehicle crashes and vehicle delay.Threshold conditions for which a change in mode or sequence result in a reduction in road-user costsprovide the basis for the guidelines.
The chapter consists of three parts. The first part describes the calibration of severalpedestrian safety prediction models. The second part describes the use of these models to developa model for predicting road-user costs based on estimates of predicted crash frequency and predictedaverage intersection delay. The third part describes the development of guidelines for using thecalibrated models to evaluate alternative treatments and determine the most appropriate treatmentfor a given crosswalk.
SAFETY PREDICTION MODEL CALIBRATION
This section describes the procedure used to calibrate a series of predictive models. It alsodescribes the results from the model calibration process. Initially, the calibration procedure isdescribed. Then, the calibrated models are presented.
Calibration Procedure
A preliminary analysis of the conflict data indicated that they have a random distributioncharacterized by the Poisson distribution. When count data are Poisson distributed at a site ofinterest, then data for a collection of sites with similar attributes can be described by the negativebinomial distribution. The variance of this distribution is:
where, x = count frequency for a given site having an expected frequency of E(m).k = dispersion parameter.
The first term of Equation 7 accounts for the Poisson variability in the count data at each site.The second term accounts for the additional variability that occurs among sites. This distributionwas used in the regression analysis to model the error distribution of the dependent variable.
The Nonlinear Mixed Regression procedure (NLMIXED) in the SAS program was used toestimate the model coefficients (1). The benefits of using this procedure are: (1) nonlinear modelforms can be evaluated, and (2) the dispersion parameter k can be held fixed during the modelbuilding process (as described in the next paragraph). The “loss” function associated with

6-2
(8)
(9)
NLMIXED was specified to equal the log likelihood function for the negative binomial distribution.The procedure was set up to estimate model coefficients based on maximum-likelihood methods.
The goal of the regression model development was to build a parsimonious model. This typeof model explains as much of the systematic variability as possible using the fewest number ofvariables. A modified version of the procedure described by Sawalha and Sayed (2) was used toachieve this goal.
The first step of the model development procedure is based on a forward-building procedurewhere the candidate explanatory variables are added to the base model one at a time and individuallyevaluated. The dispersion parameter is held fixed at the base-model value to properly assess thecontribution of the candidate variable (2). Those variables that are illogical in sign and have a t-statistic between !2.0 and +2.0 are considered for removal. Based on this evaluation, a list of viableexplanatory variables is identified. The second step is based on a backward-building procedurewhere all viable variables are combined with the base model to create a full model. The variablesin the full model are then individually evaluated and removed from the model based on (1) the logicof their sign, (2) the value of their t-statistic, and (3) their impact on the overall fit of the model. Thisstep produced the final model form.
Alternative model structures were hypothesized using theoretic constructs and latentvariables. The Akaike information criterion (AIC) is a useful statistic for evaluating the overall fitof each model, with the model producing the smallest AIC value providing the better fit.
Legal Pedestrian-Vehicle Conflict Model Calibration
The regression analysis revealed that conflict frequency is correlated with left-turn volume,legal pedestrian volume, crosswalk length, median width, cycle length, and presence of a leadingleft-turn phase. Several alternative model forms and variables were evaluated. The best-fit predictionmodel was specified using the following equation:
with
where,Nco,L = frequency of pedestrian-vehicle conflicts involving legal pedestrians, conflicts/h.
vlt = conflicting left-turn volume, veh/h.vped,L = legal pedestrian volume in the crosswalk (walking in either direction), p/h.
t = vehicle travel time to conflict area, s.Lcw = crosswalk length (curb to curb), ft.Wm = median width (inclusive of any left-turn bay that may be present), ft.
C = cycle length, s.Ilead = indicator variable for leading left-turn phase (= 1.0 if leading, 0.0 otherwise).
bi = calibration coefficients, i = 0, 1, 2,....

6-3
The variable for vehicle travel time is based on the distance from the left-turn stop line tothe conflict area, as measured along the crosswalk. The value of “20” in Equation 9 represents anaverage left-turn vehicle speed. The exponent “2” that is attached to the travel time variable inEquation 8 represents an empirically based adjustment to improve model fit to the data.
The statistics related to the calibrated model are shown in Table 6-1. The calibrationcoefficient values shown can be used with Equation 8 to estimate the pedestrian-vehicle conflictfrequency for a given left-turn movement and its associated conflicting crosswalk.
Table 6-1. Calibrated Model Statistical Description–Legal Pedestrian-Vehicle Conflict Model.Model Statistics Value
R2 (RK2): 0.70 (0.81)
Scaled Pearson χ2: 1.03
Pearson χ2: 41.2 (χ20.05, 35 = 49.8)
Dispersion Parameter k: 3.69
Observations no: 41 hours (120 conflicts at 20 sites)
Standard Error: ±2.2 conflicts/h
Range of Model Variables
Variable Variable Name Units Minimum Maximum
vlt Left-turn volume veh/h 9 226
vped,L Legal pedestrian volume p/h 14 422
Lcw Crosswalk length ft 41 107
Wm Median width ft 0 27
C Cycle length s 80 150
Ilead Indicator for leading left-turn phase none 0 1
Calibrated Coefficient Values
Variable Definition Value Std. Dev. t-statistic
b0 Intercept -6.13 1.58 -3.9
b1 Effect of left-turn volume 0.444 0.191 2.3
b2 Effect of legal pedestrian volume 0.756 0.177 4.3
b3 Effect of vehicle travel time 0.144 0.041 3.5
b4 Effect of cycle length 0.0094 0.0061 1.5
b5 Effect of leading left-turn phase -0.630 0.520 -1.2
The Pearson χ2 statistic for the model is 41.2, and the degrees of freedom are 35 (= n ! p !1= 41!5!1). As this statistic is less than χ2 0.05, 35 (= 49.8), the hypothesis that the model fits the datacannot be rejected. The R2 for the model is 0.70. An alternative measure of model fit that is bettersuited to negative binomial error distributions is RK
2, as developed by Miaou (3). The RK2 for the
calibrated model is 0.81.
The regression coefficients for the calibrated model are listed in the last rows of Table 6-1.The t-statistics shown indicate that, with two exceptions, all coefficients are significant at a 5 percent

6-4
(10)
level. A positive coefficient indicates that conflicts increase with an increase in the associatedvariable value. Thus, conflicts increase with increasing left-turn volume.
The coefficient value associated with vehicle travel time indicates that wider intersectionsare associated with more conflicts. In fact, for the same curb-to-curb width, those intersections withwider medians are associated with more conflicts. These findings suggest that longer travel distancescreate a situation where the left-turning vehicle and pedestrians are more likely to arrive to theconflict area at the same time. In contrast, narrower intersections without medians are likely to havethe left-turn vehicle clear the conflict area before the pedestrians arrive.
The coefficient value associated with cycle length indicates that longer cycle lengths areassociated with more frequent conflicts. This trend is logical because a longer cycle length is likelyto lead to a larger number of pedestrians (and vehicles) in queue just prior to the start of the walkinterval (and permissive left-turn period). The pedestrians and drivers will also have incurred alonger delay and will be more anxious to get through the intersection. The t-statistic associated withthe effect of cycle length corresponds to a 94 percent level of confidence (one-tail). There is aprobability of 0.06 that the stated trend is incorrect. Nevertheless, the effect is logical in sign andmagnitude and so it is retained in the model.
The coefficient value associated with leading left-turn phase suggests that a leading left-turnphase reduces the conflict rate by 47 percent [= 100 (1 ! e -0.630)]. The t-statistic associated with theeffect of leading left-turn phase presence corresponds to an 89 percent level of confidence (one-tail).There is a probability of 0.11 that a leading left-turn phase does not reduce the conflict rate.Nevertheless, the effect is logical in sign and magnitude so it was retained in the model.
The calibrated coefficients were inserted into Equation 8 to yield the following model:
This model can be used with Equation 9 to estimate the legal pedestrian-vehicle conflict frequencyfor an intersection approach.
One means of assessing a model’s fit is through the graphical comparison of the observedand predicted conflict frequencies. This comparison is provided in Figure 6-1. The trend line in thisfigure does not represent the line of best fit; rather, it is a “y = x” line. The data would lie on this lineif the model predictions exactly equaled the observed data. The clustering of the data around thisline indicates that the model is able to predict conflict frequency without bias.

6-5
(11)
0
5
10
15
20
25
0 5 10 15 20 25 30
Predicted Ped-Veh Conflict Frequency, conflicts/h
Ob
se
rve
d P
ed
es
tria
n-V
eh
icle
C
on
flic
t F
req
ue
nc
y, c
on
flic
ts/h
1
1
Figure 6-1. Comparison of Observed and Predicted Legal Conflict Frequency.
Illegal Pedestrian-Vehicle Conflict Model Calibration
The regression analysis revealed that conflict frequency is correlated with left-turn volumeand illegal pedestrian volume. Several alternative model forms and variables were evaluated. Thebest-fit prediction model was specified using the following equation:
where,Nco,I = frequency of pedestrian-vehicle conflicts involving illegal pedestrians, conflicts/h.
vlt = conflicting left-turn volume, veh/h.vped,I = illegal pedestrian volume in the crosswalk (walking in either direction), p/h.
bi = calibration coefficients, i = 0, 1, 2,....
The statistics related to the calibrated model are shown in Table 6-2. The calibrationcoefficient values shown can be used with Equation 11 to estimate the pedestrian-vehicle conflictfrequency for a given left-turn movement and its associated conflicting crosswalk.
The Pearson χ2 statistic for the model is 43.9, and the degrees of freedom are 38 (= n ! p !1= 41!2!1). As this statistic is less than χ2 0.05, 38 (= 53.4), the hypothesis that the model fits the datacannot be rejected. The R2 for the model is 0.61. The RK
2 for the calibrated model is 0.94.
The regression coefficients for the calibrated model are listed in the last rows of Table 6-2.The t-statistics shown indicate that, with one exception, all coefficients are significant at a 5 percentlevel. A positive coefficient indicates that conflicts increase with an increase in the associatedvariable value. Thus, conflicts increase with increasing left-turn volume.

6-6
(12)
Table 6-2. Calibrated Model Statistical Description–Illegal Pedestrian-Vehicle Conflict Model.
Model Statistics Value
R2 (RK2): 0.61 (0.94)
Scaled Pearson χ2: 1.10
Pearson χ2: 43.9 (χ20.05, 38 = 53.4)
Dispersion Parameter k: 11.2
Observations no: 41 hours (77 conflicts at 20 sites)
Standard Error: ±1.5 conflicts/h
Range of Model Variables
Variable Variable Name Units Minimum Maximum
vlt Left-turn volume veh/h 9 226
vped,L Illegal pedestrian volume p/h 6 146
Calibrated Coefficient Values
Variable Definition Value Std. Dev. t-statistic
b0 Intercept -5.38 1.01 -5.3
b1 Effect of left-turn volume 1.134 0.199 5.7
b2 Effect of illegal pedestrian volume 0.266 0.204 1.3
The coefficient value associated with pedestrian volume corresponds to an 81 percentconfidence interval. There is a probability of 0.095 that pedestrian volume does not increase theconflict rate. Nevertheless, the effect is logical in sign and magnitude so it was retained in the model.
The calibrated coefficients were inserted into Equation 11 to yield the following model:
This model can be used to estimate the illegal pedestrian-vehicle conflict frequency for anintersection approach.
One means of assessing a model’s fit is through the graphical comparison of the observedand predicted conflict frequencies. This comparison is provided in Figure 6-2. The clustering of thedata around the “y = x” line indicates that the model is able to predict conflict frequency withoutbias.

6-7
(13)
(14)
0
2
4
6
8
0 2 4 6 8 10
Predicted Ped-Veh Conflict Frequency, conflicts/h
Ob
se
rve
d P
ed
es
tria
n-V
eh
icle
C
on
flic
t F
req
ue
nc
y, c
on
flic
ts/h
1
1
Figure 6-2. Comparison of Observed and Predicted Illegal Conflict Frequency.
Legal Pedestrian Volume Model Calibration
The regression analysis revealed that legal pedestrian volume is correlated with pedestriandelay, the conflicting vehicle flow rate, and the probability that the WALK indication is presented.Several alternative model forms and variables were evaluated. The best-fit prediction model wasspecified using the following equation:
with
where,vped,L = legal pedestrian volume in the crosswalk (walking in either direction), p/h.vped,t = pedestrian volume in the crosswalk (walking in either direction), p/h.
pp = probability that the WALK indication is displayed (= 1.0 if pretimed or on ped. recall).Pb = probability of a pedestrian pressing the detector button (= 0.66).C = cycle length, s.dp = pedestrian delay due to signal, s/p.vc = conflicting (cross street) vehicular traffic volume (both directions), veh/h.ci = calibration coefficients, i = 0, 1, 2,....
An analysis of the site data indicated that the probability of a pedestrian pressing the detectorbutton is effectively equal to 0.66. This value is slightly larger than the value of 0.51 reported byZegeer et al. (4).

6-8
The statistics related to the calibrated model are shown in Table 6-3. The calibrationcoefficient values shown can be used with Equation 13 to estimate the legal pedestrian volume fora given crosswalk. Equation 13 can also be used with Equation 10 to estimate the legal pedestrian-vehicle conflict frequency. It can also be used with Equation 12 to estimate the illegal pedestrian-vehicle conflict frequency, where the illegal pedestrian volume equals the total pedestrian volumeminus the legal pedestrian volume.
Table 6-3. Calibrated Model Statistical Description–Legal Pedestrian Volume Model.Model Statistics Value
R2 (RK2): 0.96 (0.98)
Scaled Pearson χ2: 1.12
Pearson χ2: 44.6 (χ20.05, 37 = 52.2)
Dispersion Parameter k: 109
Observations no: 41 hours (120 conflicts at 20 sites)
Standard Error: ±17.7 p/h
Range of Model Variables
Variable Variable Name Units Minimum Maximum
vped,t Pedestrian volume p/h 30 559
dp Pedestrian delay due to signal s/p 13 66
vc Conflicting vehicular traffic volume veh/h 230 3,061
pp Prob. that the WALK indication is presented none 0.54 1.00
Calibrated Coefficient Values
Variable Definition Value Std. Dev. t-statistic
c0 Intercept 1.32 0.23 5.7
c1 Effect of pedestrian delay -0.020 0.007 -3.0
c2 Effect of conflicting vehicle flow rate 1.493 0.608 2.5
c3 Effect of probability WALK is presented 0.310 0.216 1.4
The Pearson χ2 statistic for the model is 44.6, and the degrees of freedom are 37 (= n ! p !1= 41!3!1). As this statistic is less than χ2 0.05, 37 (= 52.2), the hypothesis that the model fits the datacannot be rejected. The R2 for the model is 0.96. The RK
2 for the calibrated model is 0.98.
The regression coefficients for the calibrated model are listed in the last rows of Table 6-3.The t-statistics shown indicate that, with one exception, all coefficients are significant at a 5 percentlevel. A positive coefficient indicates that the proportion of pedestrians that cross legally increaseswith an increase in the associated variable value. Thus, the proportion of crossings that are legalincreases with an increase in the conflicting vehicle flow rate. The coefficient value associated withpedestrian delay indicates that the proportion of pedestrians that cross legally decreases with anincrease in delay.
The coefficient value associated with the probability that the WALK indication is displayedsuggests that the proportion of pedestrians that cross legally increases with an increase in theprobability that the WALK indication is displayed. The t-statistic associated with the effect of

6-9
(15)
0
100
200
300
400
500
0 100 200 300 400 500 600
Predicted Legal Pedestrian Volume, p/h
Ob
se
rve
d L
eg
al P
ed
es
tria
n
Vo
lum
e, p
/h
1
1
leading left-turn phase presence corresponds to an 85 percent level of confidence. There is aprobability of 0.075 that an increase in this probability does not correspond to an increase in theproportion of legal pedestrians. Nevertheless, the effect is logical in sign and magnitude so it wasretained in the model.
The calibrated coefficients were inserted into Equation 13 to yield the following model:
This model can be used with Equation 14 to estimate the legal pedestrian volume for a crosswalk.
One means of assessing a model’s fit is through the graphical comparison of the observedand predicted conflict frequencies. This comparison is provided in Figure 6-3. The clustering of thedata around the “y = x” line indicates that the model is able to predict legal pedestrian volumewithout bias.
Figure 6-3. Comparison of Observed and Predicted Legal Pedestrian Volume.
Pedestrian Crash Prediction Model
Crash data were obtained from TxDOT’s crash record information system (CRIS) for themost recent available seven-year period (i.e., 2003 to 2009). The database was screened to includeonly crashes that occurred at signalized intersections in urban areas. The subset data are summarizedin Table 6-4 by crash severity. The data in the table indicate that there were 393 left-turn-relatedpedestrian-vehicle crashes during the seven-year period, or about 56 crashes per year.

6-10
Table 6-4. Crash Distribution at Urban Signalized Intersections in Texas.Crash Severity
CategoryPedestrian-Vehicle Crash Frequency by Crash
Type, cr/7yearsVehicle-Vehicle PlusPed.-Vehicle Crash
Frequency, cr/7 yearsLeft-Turn-Related Other
Fatal 10 51 697
Incapacitating injury 50 151 6,126
Non-incapacitating injury 146 335 29,833
Possible injury 173 342 73,901
Property damage only 13 44 136,682
Unknown 1 7 1,827
Total: 393 930 249,066
One characteristic that is important to this research is whether the pedestrian involved in thecrash was crossing legally. A preliminary examination of the CRIS data indicated that thischaracteristic could not be reliably determined for many of the 1323 crashes. However, thisinformation is reported by Habib (5) based on his examination of 455 pedestrian-vehicle crashreports for 43 intersections in New York City. He found that 62 percent of the left-turn-relatedcrashes were associated with a driver that failed to yield the right-of-way to the pedestrian.
The crash data for the intersections listed in Table 4-6 of Chapter 4 were also obtained forthe most recent five-year period for which they were available. The data for the Austin intersectionswere obtained from the City of Austin for the period from 9/2005 to 9/2010. The data for the CollegeStation intersection were obtained from TxDOT for the years 2005 to 2009. The narratives providedby the investigating officer were also obtained for each pedestrian-vehicle crash. The data werescreened to identify those crashes associated with each of the crosswalk study sites identified in thetable. These data are summarized in Table 6-5. The table indicates that there were 12 crashes duringthe five-year period, or about 0.12 left-turn related crashes per year for each crosswalk studied.
A total of 120 left-turn-related legal pedestrian-vehicle conflicts were observed at the studysites identified in Table 4-6 of Chapter 4. The study period at each site was effectively two hoursin duration; however, the data were collected for complete signal cycles so some time was lost atthe start and end of each study period. Table 6-5 shows the conflict frequency for each site for anequivalent two-hour period, and a total of 122.2 left-turn-related legal pedestrian-vehicle conflicts.The non-integer values shown reflect the few minutes lost during each two-hour study period. Asimilar calculation for illegal pedestrian-vehicle conflicts indicated a total of 77.6 left-turn-relatedillegal pedestrian-vehicle conflicts at the study sites.

6-11
(16)
Table 6-5. Study Site Left-Turn-Related Pedestrian-Vehicle Safety Statistics.City Intersecting Street by Direction Subject
Left-TurnMovement
ReportedCrashes 1,
cr/5 yr
ConflictFrequency 2,conflicts/2 h
ExpectedCrashFreq. 1,
cr/yr/2 h
ExpectedTotal Crash
Freq. 1, cr/5 yr
North-South East-West
Austin Congress Ave. 4th Street Northbound 2 6.1 0.000094 0.64
Eastbound 0 0.0 0.000046 0.31
Southbound 0 1.0 0.000051 0.35
Westbound 1 3.0 0.000048 0.32
Congress Ave. 5th Street Eastbound 1 0.0 0.000054 0.47
Congress Ave. 6th Street Northbound 0 9.0 0.000125 0.85
Westbound 1 3.0 0.000213 1.88
Congress Ave. 7th Street Southbound 0 2.0 0.000085 0.58
Guadalupe St. 21st Street Eastbound 1 6.4 0.000085 0.58
Westbound 1 8.2 0.000131 0.89
Guadalupe St. 22st Street Eastbound 0 1.0 0.000069 0.47
Guadalupe St. 24st Street Eastbound 1 7.1 0.000204 1.38
Guadalupe St. Dean Keeton St. Southbound 0 6.0 0.000059 0.40
Guadalupe St. 27st Street Westbound 0 7.3 0.000046 0.27
San Jacinto Blvd. Dean Keeton St. Northbound 0 2.1 0.000036 0.25
Southbound 1 0.0 0.000077 0.52
Medical Arts St./Robert Dedman Dr.
Dean Keeton St. Northbound 1 10.0 0.000061 0.41
Southbound 0 5.0 0.000027 0.19
CollegeStation
Spence Street University Drive Northbound 1 9.1 0.000096 0.65
Southbound 1 35.8 0.000213 1.45
Total: 12 122.2 0.001820 12.86Notes:1 - Left-turn-related pedestrian-vehicle crashes for the identified subject left-turn movement and associated crosswalk.2 - Conflicts between subject left-turning vehicles and pedestrians that are crossing legally.
Models developed by Quaye et al. (6) were used to estimate the expected number of left-turnrelated pedestrian-vehicle crashes at each of the study sites. These models are based on four yearsof crash data for 306 signalized intersection crosswalks in Ontario, Canada. Two model types weredeveloped. One model type applies to crosswalks where the conflicting left-turn movement does notface an opposing vehicular traffic stream (e.g., the left-turn movement from a one-way street or fromthe terminating leg of a three-leg intersection). The form of this model is:
where,Ncr = expected left-turn-related pedestrian-vehicle crash frequency during the analysis hour, cr/yr.vlt = left-turn volume, veh/h.
vped,t = pedestrian volume in the crosswalk (walking in either direction), p/h.

6-12
(17)
A second model type was developed by Quaye et al. (6) for crosswalks where the conflictingleft-turn movement faces an opposing queue (e.g., the left-turn movement from a two-way street).The form of this model is:
where all variables are defined previously.
Equation 16 or 17, as appropriate, was used to estimate the expected annual crash frequencyfor each hour of study at each study site. Each hourly estimate was then summed for the two-hourstudy period at each site to obtain the expected annual crash frequency for the study period. Thesevalues are shown in the second-to-last column of Table 6-5. They are quite small because theanalysis period is only two hours in duration and because pedestrian-vehicle crashes are relativelyrare.
Equations 16 and 17 each predict the expected crash frequency for the analysis hour over aone-year period. Thus, an estimate of the expected total crash frequency at a crosswalk during a one-year period would require the separate application of the appropriate equation for each hour in theaverage day. The sum of these 24 values would represent the expected total annual crash frequencyfor the crosswalk.
The aforementioned technique was applied to each of the study sites to estimate the expectedtotal annual crash frequency for each crosswalk study site. The pedestrian volume for each of the24 hours was estimated by using the distribution of hourly pedestrian volumes reported by Zegeeret al. (4, Table 28). The observed pedestrian volume was assumed to occur during the peakpedestrian demand hour, and the volume during the other hours was determined by distribution ratio.The left-turn volume for each of the 24 hours was estimated in a similar manner using continuouscount recorder data collected by TxDOT for an arterial street near to each study site.
The expected total annual crash frequency for each study site crosswalk was multiplied by5 to obtain a five-year crash frequency estimate. This estimate is shown in the last column ofTable 6-5. The last row of Table 6-5 indicates that the expected total crash frequency for all 20crosswalks studied is 12.86 cr/5 yr. This value compares favorably with the reported 12 cr/5 yr forthese same crosswalks.
Table 6-6 lists the left-turn-related conflict frequency for legal and illegal pedestrians at thestudy sites. This table also lists the observed pedestrian count for the same two categories. A totalof 7051 pedestrians were observed to cross at the collective set of study sites during the two-hourstudy period. Of this total, 5199 pedestrians (74 percent) were observed to cross legally. Thesevalues are combined in the last column to determine the conflict rate for legal and illegal pedestrians.The conflict rate for legal pedestrian crossings is 23.5 conflicts per 1000 pedestrians. It is almosttwice this amount for illegal pedestrian crossings, which is logical given the inherent risk associatedwith illegal crossings.

6-13
(18)
Table 6-6. Left-Turn-Related Pedestrian-Vehicle Conflict Analysis.Pedestrian Crossing
CategoryConflict Frequency,
conflicts/2 hObserved Pedestrian
Count, p/2hConflict Rate,
conflicts/1000 p
Legal crossing 122.2 5199 23.5
Illegal crossing 77.6 1852 41.9
Total: 199.8 7051 28.3
Table 6-7 shows the estimated distribution of left-turn-related crashes at the study sites. Thedistribution of left-turn-related pedestrian-vehicle crashes reported by Habib (5) was used to developthe distribution shown. Thus, the expected crash frequency involving legal pedestrians is estimatedas 0.00113 (= 0.00182 × 0.62). This value is combined with the observed conflict frequency todetermine the crash rate for legal pedestrians as 0.92 cr/yr/100,000 conflicts (= 0.00113/122.2 ×100,000). The crash rate for illegal crossings is computed in a similar manner, which yields0.89 cr/yr/100,000 conflicts. It is about the same as that for legal crossings. This result is logicalgiven that the crash rate represents the ratio of crashes per conflict. Thus, it reflects the probabilityof a crash given that a conflict occurs, regardless of how it occurs. The higher risk that is inherentto the illegal crossing is appropriately reflected in its conflict rate.
Table 6-7. Left-Turn-Related Pedestrian-Vehicle Crash Analysis .Pedestrian Crossing
CategoryExpected Crash
Frequency, cr/yr/2 hConflict Frequency,
conflicts/2 hCrash Rate,
cr/yr/100,000 conflicts
Legal crossing 0.00113 122.2 0.92
Illegal crossing 0.00069 77.6 0.89
Total: 0.00182 199.8 0.91
Based on the results in Table 6-7, the annual number of crashes during the analysis periodis computed using the following equation.
where,ncr = annual number of pedestrian-vehicle crashes, cr/yr.
Nco, I = frequency of pedestrian-vehicle conflicts involving illegal pedestrians, conflicts/h.Nco, L = frequency of pedestrian-vehicle conflicts involving legal pedestrians, conflicts/h.
The estimates of legal and illegal pedestrian-conflicts used in this equation are obtained fromEquations 10 and 12, respectively.
6-14
ROAD-USER COST PREDICTION MODEL DEVELOPMENT
This part of the chapter describes the development of a road-user cost prediction model. Infact, two separate models are developed and combined for this purpose. One model is used to predictthe change in road-user cost due a change in pedestrian-vehicle crash frequency. The second modelis used to predict the change in road-user cost due to a change in intersection delay. The changes incrash frequency and delay are related to various pedestrian safety treatments, including the use ofa protected left-turn mode.
This part of the chapter consists of two sections. This section describes the process used tocalculate road-user costs associated with pedestrian-vehicle crashes and intersection delay. Thesecond section describes the use of these costs, and the models described in the previous section, todevelop road-user cost prediction models.
Road-User Costs
This section describes the procedure used to determine the average road-user cost associatedwith a pedestrian-vehicle crash and the average value of travel time.
Pedestrian-Vehicle Crash Costs
The cost of a left-turn-related pedestrian-vehicle crash was computed using the crash costestimates by Council et al. (7). They developed estimates for each crash severity category based oncrash location, speed limit, and crash type. They also categorized the crash cost into human capitaland non-human-capital categories. The human capital costs represent monetary loses associated withmedical care, vehicle damage, legal fees, and lost wages. Non-human-capital costs reflect the crash’simpact to the person’s quality of life. Comprehensive costs represent the sum of these two categoriesand are recommended by Council et al. for evaluation of alternative transportation projects basedon road user costs.
The costs reported by Council et al. were based on prices in 2001. They described aprocedure for updating the crash costs to current values by using the Consumer Price Index (CPI)and the Employment Cost Index. These indices were obtained from the sources cited and used toupdate the reported crash costs to 2009 dollars.
The 2009 crash cost estimates are shown in Table 6-8 for crashes at intersections on roadswith a speed limit of 45 mph or less and involving a vehicle and pedestrian. Also shown is thedistribution of left-turn-related pedestrian-vehicle crashes that occurred at urban intersections inTexas for the period 2003 to 2009 (shown previously in Table 6-4). The last row of the tableindicates the weighted average comprehensive cost of a left-turn-related pedestrian-vehicle crashbased on the crash severity distribution shown in column 3.

6-15
Table 6-8. Average Cost of a Left-Turn-Related Pedestrian-Vehicle Crashat an Urban Signalized Intersection.
Crash SeverityCategory
CrashFreq.,
cr/7years
CrashSeverity
Distribution
HumanCapital
Cost 1, $/cr
Non-Human-Capital Cost 1,
$/cr
ComprehensiveCost 1, $/cr
Fatal 10 0.03 1,181,883 2,857,322 4,039,205
Incapacitating injury 50 0.13 197,647 193,860 391,507
Non-incapacitating injury 146 0.37 40,423 34,115 74,538
Possible injury 173 0.44 40,423 34,115 74,538
Property damage only 13 0.03 10,311 2,198 12,509
Total: 392 1.00 Average Crash Cost, $/cr: 214,050Note:1 - Based on 2009 dollars.
A similar calculation was undertaken to estimate the average cost of a crash at an urbanintersection. The distribution in the last column of Table 6-4 was used for this purpose. Theappropriate severity costs were obtained from the report by Council et al. The weighted averagecomprehensive cost of an urban intersection crash was computed as $47,455. This cost is about22 percent of that shown in Table 6-8 and is a reflection of the lower severity of vehicle-vehiclecrashes, relative to pedestrian-vehicle crashes.
Intersection Delay Costs
The cost of intersection delay was computed using the value-of-time estimation proceduredocumented in User Benefit Analysis for Highways (8). This document provides wage andcompensation estimates for automobile travelers and truck drivers, respectively, by trip purpose.Wages refer to the after-tax, direct income of the traveler. Total compensation includes base wagesand employment benefits.
The costs reported in User Benefit Analysis for Highways were based on prices in 2000. TheCPI was used to update the reported wage and compensation estimates to 2009 dollars.
The 2009 value-of-time estimate is shown in Table 6-9 for typical trip purposes andemployment. It is based on the assumption that trucks represent 3 percent of the traffic stream aturban intersections.
Table 6-9. Average Value of Travel Time.Vehicle Type Traffic
DistributionAverage
Earning 1, $/hTime-Value-to-Earnings Ratio
Occupancy,person/veh
Value of Time 1, $/h
Automobile 0.97 23.24 0.50 1.50 17.43
Commercial Truck 0.03 25.20 1.00 1.05 26.46
Total: 1.00 Average Value of Time, $/h: 17.70Note:1 - Based on 2009 dollars.

6-16
Road-User Cost Prediction Model
This section consists of four subsections. The first subsection describes the data that wereassembled for model development. The second subsection describes how the critical movementanalysis technique was used to characterize the quality of service provided to vehicles at theintersection. The third subsection describes the development of an equation to predict the changein pedestrian-vehicle crash cost associated with a change in left-turn mode or sequence. The fourthsubsection describes the development of an equation to predict the change in intersection delay costassociated with a change in left-turn mode or sequence.
Data Assembly
The data used to calibrate the predictive equations were obtained from two sources. Thedelay data were obtained from simulation analysis of a large number of signalized intersections.These intersections were developed to ensure that the calibration data represented a wide range ofintersection geometrics, vehicle volumes, pedestrian volumes, left-turn modes, and left-turnsequences. They are described in more detail in Chapter 4.
Identified in Chapter 4 are 108 base intersection configurations. Each of these baseconfigurations have permissive left-turn operation. These base intersections were then modified toproduce 108 identical intersection configurations with the exception that they have protected-permissive left-turn operation and a leading sequence. They were modified again to produce 108intersection configurations with protected left-turn operation and a leading sequence. They weremodified again to produce 108 configurations with protected-permissive left-turn operation and alagging sequence. A total of 432 intersection configurations were developed and simulated.
The simulation results for the 108 base intersection configurations were individually matchedto the results for each of the 108 configurations with protected-permissive operation and a leadingsequence. The matched data formed a “paired” database with 108 observations. Each observationhad the same volume, geometry, and signalization with the exception of the change in left-turn modeand sequence. In a similar manner, a paired database was developed for protected operation and aleading sequence. A paired database was also developed for protected-permissive operation with alagging sequence. The combined paired database represented 324 configurations (= 3 × 10⁸).
Each configuration in the database has two delay values. One value represents permissiveleft-turn operation and the second represents a specified change to the left-turn operation and phasesequence. Each delay value was used to estimate an associated annual road-user delay cost. Thechange in these costs represents the net benefit of the change. The cost change was used as thedependent variable for equation calibration.
Some of the intersection configurations with permissive operation were found to have oneor more traffic movements with inadequate capacity and excessively large delays. The simulationresults for these configurations were eliminated from database. This reduced the combined paireddatabase to 288 observations.

6-17
(19)
A similar process was followed in the development of a paired database for pedestrian safety.The 432 intersections developed for the simulation analysis were also used to develop the safetydatabase. The safety prediction models described previously in this chapter were used to estimatethe expected frequency of left-turn-related pedestrian-vehicle crashes for each of the 432configurations. These data were then combined to develop a paired database with 324configurations. The overcapacity configurations were eliminated to yield 288 configurations. Thecrash costs were used to estimate the change in road user cost associated with each treatment, andthis value was used as the dependent variable for equation calibration.
Critical Movement Analysis
Critical movement analysis is a useful technique for characterizing the utilization ofsignalized intersection capacity. It produces a critical flow ratio that varies from 0.0 to 1.0, wherevalues near 0.0 represent low volumes (relative to the available capacity). In contrast, values near1.0 represent high volumes (relative to the available capacity). The critical flow ratio calculationconsiders left-turn volume, through volume, number of lanes, saturation flow rate, left-turn mode,and phase sequence. For these reasons, it provides a desirable sensitivity to the key factors thatinfluence the choice of left-turn mode and phase sequence.
The critical movement analysis technique is described in Chapter 16 of the HighwayCapacity Manual (9). The ability to implement this technique is not a requirement for correct useof the guidelines developed for this project (and described in the next part of this chapter).
A preliminary analysis of the data indicated that the change in delay cost was influenced bythe critical flow ratio. The following construct was found to provide the best fit to the data.
where,Cy = critical flow ratio factor, s.tL = total phase lost time (= 4.0), s.np = number of critical phases (= 2 for base mode, 3 or 4 for proposed mode and sequence).
(v/s)ci = flow ratio for critical phase i (i = 1, 2, 3, ..., 8).vci = volume served by critical phase i, veh/h.sci = saturation flow rate for critical phase i, veh/h.
There are two terms in Equation 19. The first term corresponds to the base configuration. Allvariables in this term apply to the base mode. The second term corresponds to the proposed modeand phase sequence. All variables in this term apply to the proposed configuration.
A negative value for the critical flow ratio factor Cy corresponds to an increase in cyclelength and delay as a result of the change from the base configuration to the proposed configuration.

6-18
(20)
(21)
(22)
(23)
Prediction of Change in Pedestrian Safety
This section describes the development of an equation to predict the change in pedestrian-vehicle crash cost associated with a change in left-turn mode or sequence. This equation has alogical boundary condition such that it should predict zero change in cost when the baseconfiguration is a match to the proposed configuration. It also predicts zero change in cost whenthere are no pedestrians or when there are no left-turn vehicles. It is based on the assumption thatthere is no change in vehicle or pedestrian volume as a result of the change in left-turn mode orsequence.
Several equation forms were evaluated using the assembled database. The form that providedthe best fit to the data is shown in the following equation.
with
where,Δccr = change in annual crash cost (positive change = cost increase) in 2009 dollars, $/yr.
Pp,prot = change in product of left-turn and pedestrian volume served by protected mode,expressed as a proportion of the total product for all left-turn and pedestrian volumepairs.
Pp,pplt,lead = change in product of left-turn and pedestrian volume served by protected-permissivemode with leading phase sequence, expressed as a proportion of the total product for allleft-turn and pedestrian volume pairs.
Pp,pplt,lag = change in product of left-turn and pedestrian volume served by protected-permissivemode with lagging phase sequence, expressed as a proportion of the total product forall left-turn and pedestrian volume pairs.
Iprot = indicator variable (= 1 if left-turn volume is served by protected mode, 0 otherwise).Ipplt, lead = indicator variable (= 1 if left-turn volume is served by protected-permissive mode with
leading phase sequence, 0 otherwise).Ipplt, lag = indicator variable (= 1 if left-turn volume is served by protected-permissive mode with
lagging phase sequence, 0 otherwise).vlt = conflicting left-turn volume, veh/h.
vped,t = pedestrian volume in the crosswalk (walking in either direction), p/h.

6-19
(24)
(25)
(26)
(27)
The second term in parentheses in Equation 20 is the sum of the product of the left-turnvolume and the pedestrian volume for each crosswalk. The left-turn volume associated with acrosswalk is for the left-turn movement that conflicts with the crosswalk. A crosswalk’s conflictingleft-turn movement follows a path that (1) starts from the street that is parallel to the crosswalk and(2) ends by crossing the subject crosswalk. For example, the westbound left-turn movement conflictswith the eastbound crosswalk (i.e., the crosswalk on the south leg).
The numerator of Equations 21, 22, and 23 has two summation terms. The first termcorresponds to the proposed configuration. All variables in this term apply to the proposedconfiguration. The second term corresponds to the base configuration. All variables in this termapply to the base configuration.
A positive value for the proportions computed by Equations 21, 22, or 23 corresponds to anincrease in the proportion of conflicting left-turn vehicles and pedestrians that are served byprotected or protected-permissive mode, as a result of the change from the base configuration to theproposed configuration.
The fit of Equation 20 is indicated by its coefficient of determination R2 of 0.97. All of theconstants in this equation are regression coefficients. These coefficients are significant at a95 percent level (i.e., the probability that a coefficient is not different from zero is less than 0.05).The standard deviation of the predicted value is estimated as 0.129 times the predicted value.
Prediction of Change in Intersection Delay
This section describes the development of an equation to predict the change in intersectiondelay cost associated with a change in left-turn mode or sequence. This equation has a logicalboundary condition such that it should predict zero change in cost when the base configuration isa match to the proposed configuration. It also predicts zero change in cost when there are no vehiclesat the intersection. It is based on the assumption that there is no change in vehicle or pedestrianvolume as a result of the change in left-turn mode or sequence.
Several equation forms were evaluated using the assembled database. The form that providedthe best fit to the data is shown in the following equation.
with
6-20
where,Δcd = change in annual delay cost (positive change = cost increase) in 2009 dollars, $/yr.
Pv,prot = change in left-turn volume served by protected mode, expressed as a proportion of thetotal left-turn volume.
Pv,pplt,lead = change in left-turn volume served by protected-permissive mode with leading phasesequence, expressed as a proportion of the total left-turn volume.
Pv,pplt,lag = change in left-turn volume served by protected-permissive mode with lagging phasesequence, expressed as a proportion of the total left-turn volume.
vi = vehicle volume for movement i (i = 1, 2, 3, ..., 8), veh/h.
The second term in parentheses in Equation 24 is the sum of the vehicle volume entering theintersection. All traffic movements and all intersection approaches are included in this sum.
The numerator of Equations 25, 26, and 27 has two summation terms. The first termcorresponds to the proposed configuration. All variables in this term apply to the proposedconfiguration. The second term corresponds to the base configuration. All variables in this termapply to the base configuration.
A positive value for the proportions computed by Equation 25, 26, or 27 corresponds to anincrease in the proportion of left-turn vehicles that are served by protected or protected-permissivemode, as a result of the change from the base configuration to the proposed configuration.
The fit of Equation 24 is indicated by its coefficient of determination R2 of 0.89. All of theconstants in this equation represent regression coefficients. These coefficients are significant at a95 percent level of confidence or higher (i.e., the probability that a coefficient is not different fromzero is less than 0.05). The standard deviation of the predicted value is estimated as 0.269 times thepredicted value.
GUIDELINE DEVELOPMENT
This part of the chapter describes the process used to develop guidelines for selecting theappropriate pedestrian safety treatment for a signalized intersection. The first section describes thedevelopment of guidelines for determining the appropriate left-turn mode based on pedestrian safetyconsiderations. The second section describes the development of guidelines for evaluating a widerange of pedestrian safety treatments (including left-turn mode).
Left-Turn Mode Guideline Development
This section describes the process used to develop guidelines for selecting the appropriateleft-turn mode and phase sequence at a signalized intersection. These guidelines are described in areport by Bonneson et al. (10), and are referred to therein as “pedestrian safety guidelines.” Theyare based on the use of Figure 6-4.

6-21
a. Three-Leg Intersection.
b. Four-Leg Intersection.
Figure 6-4. Left-Turn Mode Selection Based on Pedestrian Safety.
Guideline Overview
Figure 6-4 is used to determine the appropriate left-turn mode for each left-turn movementand crosswalk of interest. Figure 6-4a applies to three-leg intersections. Figure 6-4b applies to four-leg intersections. The total volume entering the intersection during the analysis hour and the product
0
50
100
150
200
500 1000 1500 2000 2500 3000
Total Entering Vehicle Volume, veh/h
Min
imu
m T
ota
l Pe
d. x
Le
ft-T
urn
V
olu
me
(1
00
0s
), p
-ve
h/h
Consider protected mode
Three-Leg Intersection
Consider permissive mode w ith pedestrian treatments
Consider protected mode or prot.-perm. mode w ith leading left
Consider site-specif ic evaluation
Not likely to satisfy signal w arrants.
0
50
100
150
200
250
300
500 1000 1500 2000 2500 3000
Total Entering Vehicle Volume, veh/h
Min
imu
m T
ota
l Pe
d. x
Le
ft-T
urn
V
olu
me
(1
00
0s
), p
-ve
h/h Consider protected mode or prot.-
perm. mode w ith leading left
Four-Leg Intersection
Consider protected mode
Consider permissive mode w ith pedestrian treatments
Consider site-specif ic evaluation
Not likely to satisfy signal w arrants.

6-22
of the conflicting pedestrian and left-turn volume is used with the appropriate figure to make thisdetermination. Specifically, a vertical line is visualized extending upward from the x-axis valueassociated with the total entering volume. Similarly, a horizontal line is visualized extending to theright from the y-axis value associated with the volume product. The appropriate left-turn mode isidentified by the point on the figure where these two lines intersect.
Figure 6-4 is based on consideration of road-user costs associated with pedestrian-vehiclecrashes and vehicle delay. Threshold conditions for which a change in mode or sequence result ina reduction in road-user costs provide the basis for the guidelines.
The process considered intersection delay and crash frequency so an overall road-user costcould be the basis for guideline development. The delay cost is based on the value of travel time andreflects the delay to all vehicles traveling through the intersection. This approach recognizes thatmany signal-related pedestrian treatments for a crosswalk can change the signal operation andindirectly impact the service provided to most vehicles entering the intersection.
Road-User Cost Calculation
This subsection describes how the predictive equations described in the previous sectionswere used for guideline development. The objective of this development was to identify volume andgeometry conditions where the reduction in pedestrian-vehicle crash costs associated with a changein left-turn mode or phase sequence is very likely to offset any increase in delay costs.
The research findings indicated that the total vehicular volume entering the intersection, left-turn volume, and pedestrian volume have the most significant effect on road-user costs. However,other factors were also found to influence road-user costs, but to a lower degree. These other factorsinclude number of lanes, cycle length, walk interval duration, progression quality, and pedestriancrossing distance.
The research findings also indicated that the protected mode or the protected-permissivemode typically provide a road-user benefit (relative to the permissive mode) when vehicle andpedestrian volumes are high. However, there are some moderate volume combinations where it isuncertain whether the change in mode or phase sequence will provide a benefit. In these situations,the influence of other factors (as noted in the previous paragraph) will dictate whether road-usercosts increase or decrease.
Protected, protected-permissive, and permissive modes were considered in the guidelinedevelopment process. Leading and lagging phase sequence variations were considered for theprotected-permissive mode; however, the protected-permissive mode with a lagging sequence wasnot found to provide significant pedestrian safety benefit.
Based on these findings, guideline development focused on the use of the protected modeor the protected-permissive mode with a leading phase sequence. It also focused on addressing themost influential variables (i.e,. total entering volume, the product of left-turn volume and pedestrianvolume, and number of left-turn phases) and identifying conditions where each mode is very likely(or not very likely) to result in a benefit to road users. Conditions where the benefits are uncertain
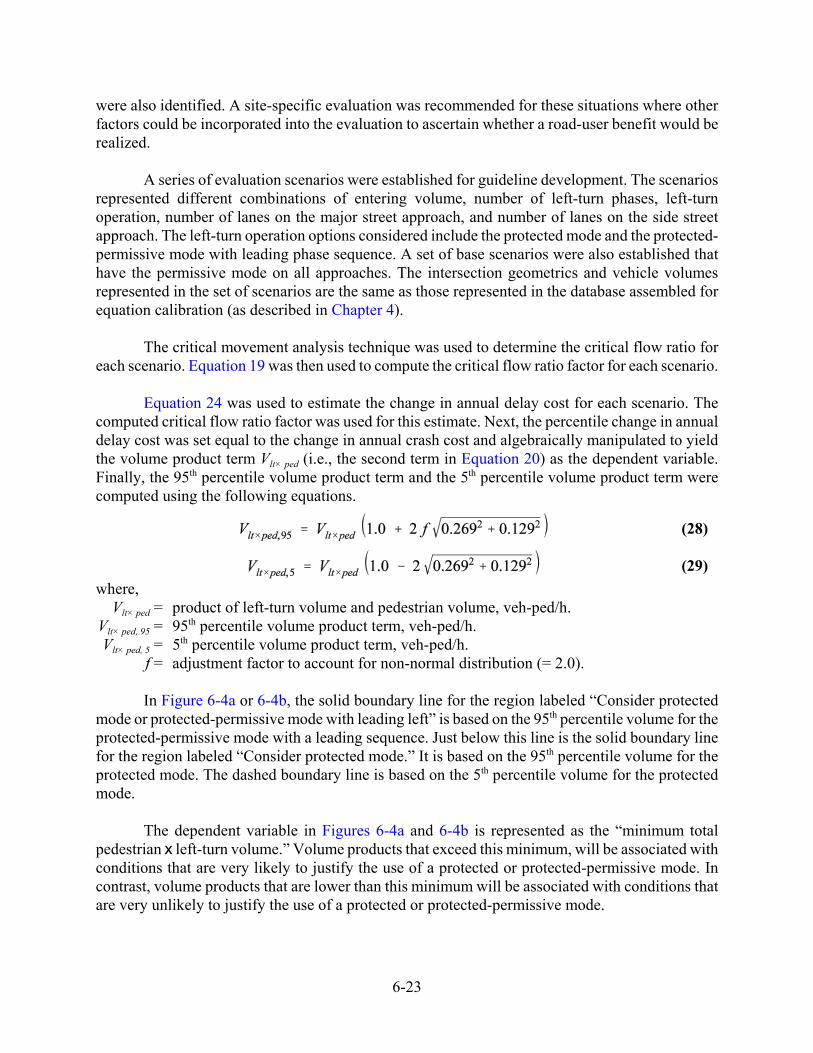
6-23
(28)
(29)
were also identified. A site-specific evaluation was recommended for these situations where otherfactors could be incorporated into the evaluation to ascertain whether a road-user benefit would berealized.
A series of evaluation scenarios were established for guideline development. The scenariosrepresented different combinations of entering volume, number of left-turn phases, left-turnoperation, number of lanes on the major street approach, and number of lanes on the side streetapproach. The left-turn operation options considered include the protected mode and the protected-permissive mode with leading phase sequence. A set of base scenarios were also established thathave the permissive mode on all approaches. The intersection geometrics and vehicle volumesrepresented in the set of scenarios are the same as those represented in the database assembled forequation calibration (as described in Chapter 4).
The critical movement analysis technique was used to determine the critical flow ratio foreach scenario. Equation 19 was then used to compute the critical flow ratio factor for each scenario.
Equation 24 was used to estimate the change in annual delay cost for each scenario. Thecomputed critical flow ratio factor was used for this estimate. Next, the percentile change in annualdelay cost was set equal to the change in annual crash cost and algebraically manipulated to yieldthe volume product term Vlt× ped (i.e., the second term in Equation 20) as the dependent variable.Finally, the 95th percentile volume product term and the 5th percentile volume product term werecomputed using the following equations.
where,Vlt× ped = product of left-turn volume and pedestrian volume, veh-ped/h.
Vlt× ped, 95 = 95th percentile volume product term, veh-ped/h.Vlt× ped, 5 = 5th percentile volume product term, veh-ped/h.
f = adjustment factor to account for non-normal distribution (= 2.0).
In Figure 6-4a or 6-4b, the solid boundary line for the region labeled “Consider protectedmode or protected-permissive mode with leading left” is based on the 95th percentile volume for theprotected-permissive mode with a leading sequence. Just below this line is the solid boundary linefor the region labeled “Consider protected mode.” It is based on the 95th percentile volume for theprotected mode. The dashed boundary line is based on the 5th percentile volume for the protectedmode.
The dependent variable in Figures 6-4a and 6-4b is represented as the “minimum totalpedestrian x left-turn volume.” Volume products that exceed this minimum, will be associated withconditions that are very likely to justify the use of a protected or protected-permissive mode. Incontrast, volume products that are lower than this minimum will be associated with conditions thatare very unlikely to justify the use of a protected or protected-permissive mode.

6-24
The region between the dashed line and the solid lines represents conditions where thereduction in pedestrian-vehicle crash costs may be sufficient to offset any increase in delay costs.However, the answer to the question of whether the proposed left-turn operation results in a netbenefit will depend on other signal timing and geometric factors. For these conditions, the analystis encouraged to conduct a site-specific evaluation that considers all relevant factors in thedetermination of the appropriate left-turn mode.
Basis for Crash Experience Threshold
The left-turn mode guidelines include a crash experience check based on the threshold offour or more reported left-turn-related pedestrian-vehicle crashes in a three-year period. Thisthreshold is based on the crash threshold of 14 total left-turn-related crashes in a three-year periodthat is used to determine the need for protected operation (“total” in this context is the sum ofvehicle-vehicle and pedestrian-vehicle crashes) cited in the Traffic Signal Operations Handbook(11). The threshold value of “four” is computed by multiplying 14 by the ratio of average crash costto average vehicle-pedestrian crash cost (both for urban intersections) and rounding up. These costswere identified as $47,455 and $214,050, respectively, in Table 6-8 and its related discussion.
Alternative Treatment Guide Development
This section describes the development of guidelines for evaluating alternative pedestriansafety treatments for signalized intersections (not including the use of protected or protected-permissive left-turn mode). These guidelines are described in Appendix E of the Traffic SignalOperations Handbook: Second Edition (12). A before-after observational study was conducted toevaluate four of the treatments. The findings of this study are documented in Appendix B.
Summary of Treatment Effectiveness
This subsection summarizes the findings from the separate analyses of treatment effect onintersection delay and left-turn-related pedestrian-vehicle conflicts. The description of the conflictanalysis is described in a previous part of this chapter. The treatments that are the focus of thissubsection are identified in Table 2-3 of Chapter 2.
A simulation model was used to quantify the intersection delay for 108 unique, widely variedcombinations of intersection volume and geometry. Treatment effect was quantified by re-simulatingeach of the 108 combinations with the treatment implemented at the simulated intersection. Theanalysis of the resulting data indicated that treatment effect varied significantly among the variouscombinations. The more influential factors included major-street through volume, major-street left-turn volume, number of major-street lanes, minor-street left-turn volume, and pedestrian volume.
The general trend in the change in intersection delay is summarized in Table 6-10. Whenaveraged over all 108 combinations, the change in delay exhibited a trend toward an increase indelay for each treatment. However, treatments numbered 1, 2, 3, 4, and 7 in Table 6-10 were foundto reduce delay under specific combinations of volume and geometry.

6-25
Table 6-10. Effect of Pedestrian Treatments on Delay and Conflicts at Intersections.Treatment Intersection Delay Left-Turn-Related Conflicts
Treatments Based on Conversion from Permissive Mode
1. Provide protected-permissive mode withleading phase sequence
10 to 40 percent reduction in delay forlarge intersections with high volume. Allother intersections experience a 10 to30 percent increase in delay.
47 percent reduction in conflicts to legalpedestrians. Increase in cycle length mayincrease number of illegal pedestriansand related conflicts.
2. Provide protected-permissive mode withleading phase sequence andflashing yellow display
15 to 45 percent reduction in delay forlarge intersections with high volume. Allother intersections experience a 5 to25 percent increase in delay.
Safety effect unknown. Increase in cyclelength may increase number of illegalpedestrians and related conflicts.
3. Provide protected left-turnmode
10 to 40 percent reduction in delay forlarge intersections with high volume. Allother intersections experience a 15 to55 percent increase in delay.
100 percent reduction in conflicts tolegal pedestrians. Increase in cyclelength may increase number of illegalpedestrians and related conflicts.
4. Provide protected-permissive mode withlagging phase sequence
5 to 30 percent reduction in delay forlarge intersections with high volume. Allother intersections experience a 15 to40 percent increase in delay.
Negligible reduction in conflicts to legalpedestrians. Increase in cycle length mayincrease number of illegal pedestriansand related conflicts.
Treatments Used in Conjunction with Permissive Mode
5. Provide leadingpedestrian interval
10 to 70 percent increase in delay forlarge intersections. 0 to 10 percentincrease in delay for small intersections.
Previous research indicates a 59 percentreduction in pedestrian-related crashes atintersections (13).
6. Provide exclusivepedestrian phase
20 to 40 percent increase in delay for lowpedestrian volume. 40 to 80 percentincrease in delay for high pedestrianvolume.
Previous research indicates a 50 percentreduction in pedestrian-related crashes atintersections (4). Increase in cycle lengthmay increase number of illegalpedestrians and related conflicts.
7. Provide pedestrian clearinterval entirely duringgreen
0 to 15 percent reduction in delay forsmall intersections with low volume. Allother intersections experience a 0 to40 percent increase in delay.
Negligible reduction in conflicts to legalpedestrians. Increase in cycle length mayincrease number of illegal pedestriansand related conflicts.
8. Add turning vehiclewarning signs and markingsfor pedestrians
0 percent change in intersection delay. Previous research indicates sign andmarking treatments reduce conflicts, butthe amount varies widely (4, 14).
9. Prohibit pedestriancrossing
Varies. May reduce delay if pedestrianaccommodations in current signalizationincrease the cycle length.
100 percent reduction in conflicts tolegal pedestrians. Increase in traveldistance may increase number of illegalpedestrians and related conflicts.
The pedestrian-vehicle conflict model and the legal pedestrian volume model were used toevaluate the effect of several treatments on conflict frequency. The estimated effect of thesetreatments is summarized in Table 6-10.
The use of a protected-permitted mode with a leading phase sequence was found to reduceconflicts by 47 percent. In contrast, the protected-permitted mode with a lagging phase sequence wasnot found to reduce conflicts. None of the sites with the protected-permitted left-turn mode had aflashing yellow display, so this display could not be evaluated on the basis of conflicts.

6-26
The use of a protected left-turn mode, exclusive pedestrian phase, or pedestrian crossingprohibition is rationalized to eliminate left-turn-related conflicts. The use of a leading pedestrianinterval and the use of warning signs (or markings) for pedestrians were not available to beevaluated at the study sites.
Supplemental Treatments
The calibrated pedestrian-vehicle conflict models (i.e., Equations 10 and 12) and the legalpedestrian volume model (i.e., Equation 15) were examined to determine if additional treatmentswere evident in the model terms. The findings from this examination revealed the following viabletreatments:
! Reduce signal cycle length – reduces pedestrian delay which reduces conflict frequency; alsoincreases the legal pedestrian volume which reduces conflicts due to illegal crossings.
! Reduce crossing distance – reduces vehicle travel time to the conflict area which reducesconflicts.
! Invoke pedestrian recall (when phase is actuated) – increases the legal pedestrian volumewhich reduces conflicts due to illegal crossings.
! Increase walk interval duration (without increasing cycle length) – reduces pedestrian delaywhich reduces conflict frequency.
One technique for reducing the crossing distance at an intersection is the use of curbextensions (or bulb-outs). A curb extension can be installed on any number of corners at anintersection. It is a viable treatment when on-street parking is provided and, if bicycle traffic issignificant, a bicycle lane is provided. The corner radius and curb edge should be designed toaccommodate trucks turning at a slow speed.
If crossing distance is reduced, it may also be possible to reduce the pedestrian clear interval.In some instances, a reduction in the pedestrian clear interval will correspond to a reduction in phaseduration, which could reduce cycle length and further reduce conflicts.
The aforementioned models were combined with the crash prediction model (i.e.,Equation 18), the pedestrian-vehicle crash cost in Table 6-8, and the value of travel time inTable 6-9, to develop an analytic procedure for estimating the road-user costs associated with thesupplemental treatments identified in this subsection. This procedure is described in Appendix E ofthe Traffic Signal Operations Handbook: Second Edition (12).
REFERENCES
1. SAS/STAT User’s Guide, Version 9.2, SAS Institute, Inc., Cary, North Carolina, 2008.
2. Sawalha, Z., and T. Sayed. “Statistical Issues in Traffic Accident Modeling.” Paper No. 03-2137. Presented at the 82nd Annual Meeting of the Transportation Research Board,Washington, D.C., 2003.
6-27
3. Miaou, S.P. Measuring the Goodness-of-Fit of Accident Prediction Models. Report No. FHWA-RD-96-040. Federal Highway Administration, Washington, D.C., 1996.
4. Zegeer, C., K. Opiela, and M. Cynecki. Pedestrian Signalization Alternatives. ReportFHWA/RD-83/102. Federal Highway Administration, Washington, D.C., 1983.
5. Habib, P. “Pedestrian Safety: The Hazards of Left-Turning Vehicles.” ITE Journal. Institute ofTransportation Engineers, Washington, D.C., April 1980, pp. 33–37.
6. Quaye, K., L. Leden, and E. Hauer. Pedestrian Accidents and Left-Turning Traffic at SignalizedIntersections. AAA Foundation for Traffic Safety, Washington, D.C., April 1993.
7. Council, F., E. Zaloshnja, T. Miller, and B. Persaud. Crash Cost Estimates by Maximum Police-Reported Injury Severity Within Selected Crash Geometrics. Report FHWA-HRT-05-051.Federal Highway Administration, McLean, Virginia, October 2005.
8. User Benefit Analysis for Highways. American Association of State Highway andTransportation Officials, August 2003.
9. Highway Capacity Manual. Transportation Research Board, National Research Council,Washington, D.C., 2000.
10. Bonneson, J., M. Pratt, and P. Songchitruksa. Pedestrian Safety Guidelines and Proposed Left-Turn Phase Warrant. Report No. FHWA/TX-11/0-6402-P3. Texas Transportation Institute,College Station, Texas, 2011.
11. Bonneson, J., S. Sunkari, and M. Pratt. Traffic Signal Operations Handbook. Report No.FHWA/TX-09/0-5629-P1. Texas Transportation Institute, College Station, Texas, March 2009.
12. Bonneson, J., S. Sunkari, M. Pratt, and P. Songchitruksa. Traffic Signal Operations Handbook:Second Edition. Report No. FHWA/TX-11/0-6402-P1. Texas Transportation Institute, CollegeStation, Texas, 2011.
13. Fayish, A., and F. Gross. “Safety Effectiveness of Leading Pedestrian Intervals Evaluated bya Before-After Study with Comparison Groups.” Transportation Research Record 2198.Transportation Research Board, Washington, D.C., 2010, pp. 15–22.
14. Lalani, N. Alternative Treatments for At-Grade Pedestrian Crossings. Institute ofTransportation Engineers, Washington, D.C., 2001.


A-1
APPENDIX A
STUDY SITE CHARACTERISTICS


A-3
Crossing street
Subject left-turn movement
Crossing-street right-turn movement
Subject-street right-turn
movementS
ubje
ct s
tree
t
Su
bjec
t cr
ossw
alk
APPENDIX A. STUDY SITE CHARACTERISTICS
OVERVIEW
This appendix describes the safety data collection sites. A “site” is defined as one crosswalkand the left-turn movement that crosses the crosswalk of interest. Hence, one intersection can yieldup to four sites. Figure A-1 illustrates the naming conventions for a site, including its two streets,subject left-turn movement, and subject crosswalk. In this appendix, sites are identified by theirintersection number and the approach direction from which the subject left-turn movementoriginates.
Figure A-1. Study Site Naming Conventions.
This appendix consists of four sections. The first section describes the distribution of thestudy sites in terms of their geographic location and key characteristics. The second and thirdsections provide more detailed information about the traffic control and geometric characteristicsof the sites as measured in the field or from aerial photography. The last section explains thecategorization of sites for data analysis.
SITE LOCATIONS
The site selection process began with interviews that were conducted in an earlier task of thisresearch project. The interviewees included members of the Project Monitoring Committee andpractitioners in various Texas cities and TxDOT districts. Each interviewee named a few candidatedata collection sites. To obtain additional information about the candidate sites’ geometry and traffic

A-4
control, a review of aerial and street-level photographs was conducted using Google Earth®. Theinterviewees’ responses and the knowledge obtained through the photograph review were combinedto yield the list of study sites provided in Table A-1.
Table A-1. Study Site Locations.City Area Type North/South Street East/West Street Intersection
NumberSubject Left-Turn
Movement
Austin Downtowngrid
Congress Avenue 4th Street 4 Northbound
4 Eastbound
4 Southbound
4 Westbound
Congress Avenue 5th Street 5 Eastbound
Congress Avenue 6th Street 6 Northbound
6 Westbound
Congress Avenue 7th Street 24 Southbound
Universitycampus
Guadalupe Street 21st Street 7 Eastbound
7 Westbound
Guadalupe Street 22nd Street 8 Eastbound
Guadalupe Street 24th Street 9 Eastbound
Guadalupe Street Dean Keeton Street 10 Southbound
Guadalupe Street 27th Street 12 Westbound
San Jacinto Boulevard Dean Keeton Street 15 Northbound
15 Southbound
Medical Arts Street /Robert Dedman Drive
Dean Keeton Street 16 Northbound
16 Southbound
CollegeStation
Universitycampus
Spence Street University Drive 13 Northbound
13 Southbound
Study sites were chosen from among the cities of College Station and Austin. The CollegeStation sites are located close to the Texas A&M University campus. The Austin sites were chosenfrom the downtown city grid and the area surrounding the University of Texas at Austin campus.Collectively, these sites represented a range of vehicular and pedestrian volumes.
The study of each site was a minimum of two hours in duration. During each study,pedestrian and vehicle operations for the subject site were recorded on videotape using discreetlylocated camcorders. All studies occurred during the hours of peak pedestrian travel. At the sites inthe Austin downtown grid, the time periods coinciding with lunch, dinner, and the afternoon peakcommute period yielded significant pedestrian volumes. At the sites near the universities, pedestrianvolumes were significant throughout most of the day, with noticeable peaks during the lunch hour.A survey was conducted at each site to record its traffic control and geometric characteristics.

A-5
TRAFFIC CONTROL CHARACTERISTICS
During the site surveys, the following traffic control characteristics were noted for the studysites: speed limit, pedestrian control type, and use of other special treatments. The following threespecial treatments were observed at some study sites:
! Audible pedestrian signals (blind pedestrian treatment).! Prohibition of right-turn-on-red when pedestrians are present.! Posting of the R10-15 sign (“TURNING TRAFFIC MUST YIELD TO PEDESTRIANS”).
The sites’ traffic control characteristics are listed in Table A-2. As shown, a range of speedlimits and pedestrian control types are represented among the sites. Some of the streets did not havea posted speed limit in the immediate vicinity of a study site. The streets without posted speed limitstended to be driveways, campus streets, or streets within the Austin downtown grid.
Table A-2. Study Site Traffic Control Characteristics.Intersection
NumberSubject
Left-TurnMovement
Speed Limit, mph PedestrianSignal Type
Push ButtonPresence
SpecialTreatments
Used 1SubjectStreet
CrossingStreet
4 Northbound 30 not posted Countdown No None
4 Eastbound not posted 30 Countdown No None
4 Southbound 30 not posted Countdown No None
4 Westbound not posted 30 Countdown No None
5 Eastbound not posted 30 Countdown No None
6 Northbound 30 not posted Countdown No None
6 Westbound not posted 30 Countdown No None
24 Southbound 30 not posted Countdown No R10-15
7 Eastbound not posted 30 Conventional No R10-15
7 Westbound not posted 30 Conventional No R10-15
8 Eastbound not posted 30 Conventional No R10-15
9 Eastbound not posted 30 Conventional No None
10 Southbound 30 30 Conventional No Aud, RTOR,R10-15
12 Westbound not posted 30 Conventional Yes None
15 Northbound 15 30 Conventional Yes None
15 Southbound not posted 30 Conventional Yes None
16 Northbound 15 30 Conventional No Aud
16 Southbound 30 30 Conventional No Aud
13 Northbound 20 35 Countdown Yes None
13 Southbound not posted 35 Countdown Yes NoneNote:1 - “Aud” = audible pedestrian signal, “RTOR” = right-turn-on-red prohibited when pedestrians are present, “R10-15”
= posting of R10-15 sign
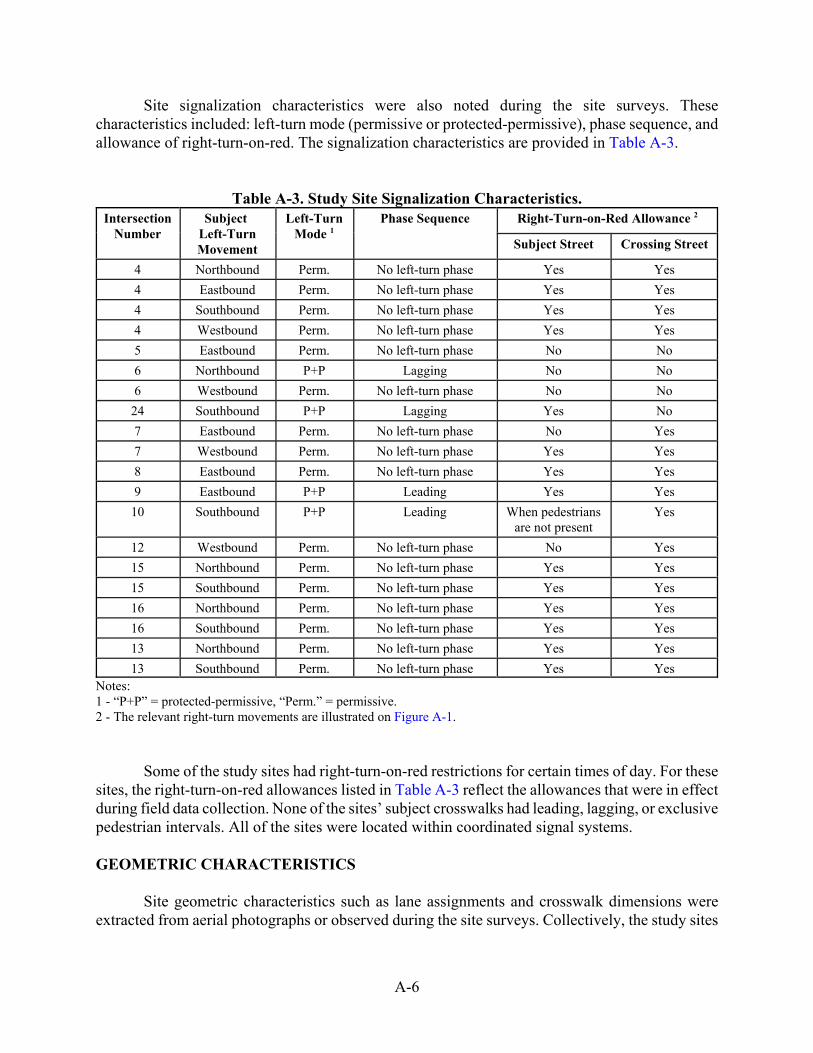
A-6
Site signalization characteristics were also noted during the site surveys. Thesecharacteristics included: left-turn mode (permissive or protected-permissive), phase sequence, andallowance of right-turn-on-red. The signalization characteristics are provided in Table A-3.
Table A-3. Study Site Signalization Characteristics.Intersection
NumberSubject
Left-TurnMovement
Left-TurnMode 1
Phase Sequence Right-Turn-on-Red Allowance 2
Subject Street Crossing Street
4 Northbound Perm. No left-turn phase Yes Yes
4 Eastbound Perm. No left-turn phase Yes Yes
4 Southbound Perm. No left-turn phase Yes Yes
4 Westbound Perm. No left-turn phase Yes Yes
5 Eastbound Perm. No left-turn phase No No
6 Northbound P+P Lagging No No
6 Westbound Perm. No left-turn phase No No
24 Southbound P+P Lagging Yes No
7 Eastbound Perm. No left-turn phase No Yes
7 Westbound Perm. No left-turn phase Yes Yes
8 Eastbound Perm. No left-turn phase Yes Yes
9 Eastbound P+P Leading Yes Yes
10 Southbound P+P Leading When pedestriansare not present
Yes
12 Westbound Perm. No left-turn phase No Yes
15 Northbound Perm. No left-turn phase Yes Yes
15 Southbound Perm. No left-turn phase Yes Yes
16 Northbound Perm. No left-turn phase Yes Yes
16 Southbound Perm. No left-turn phase Yes Yes
13 Northbound Perm. No left-turn phase Yes Yes
13 Southbound Perm. No left-turn phase Yes YesNotes:1 - “P+P” = protected-permissive, “Perm.” = permissive.2 - The relevant right-turn movements are illustrated on Figure A-1.
Some of the study sites had right-turn-on-red restrictions for certain times of day. For thesesites, the right-turn-on-red allowances listed in Table A-3 reflect the allowances that were in effectduring field data collection. None of the sites’ subject crosswalks had leading, lagging, or exclusivepedestrian intervals. All of the sites were located within coordinated signal systems.
GEOMETRIC CHARACTERISTICS
Site geometric characteristics such as lane assignments and crosswalk dimensions wereextracted from aerial photographs or observed during the site surveys. Collectively, the study sites

A-7
represent a range in key geometric variables like crosswalk length and number of lanes. Geometriccharacteristics for the study sites are provided in Table A-4.
Table A-4. Study Site Geometric Characteristics.Intersection
NumberSubject
Left-TurnMovement
Number of Lanes Number of Travel Directions
Receiving SubjectLeft-Turn Movement
Opposing Throughand Right
SubjectStreet
CrossingStreet
4 Northbound 1 3 2 2
4 Eastbound 3 1 2 2
4 Southbound 1 3 2 2
4 Westbound 3 2 2 2
5 Eastbound 3 0 1 2
6 Northbound 4 3 2 1
6 Westbound 3 0 1 2
24 Southbound 4 3 2 1
7 Eastbound 2 2 2 2
7 Westbound 2 1 2 2
8 Eastbound 2 1 2 2
9 Eastbound 2 1 2 2
10 Southbound 2 2 2 2
12 Westbound 2 0 1 2
15 Northbound 2 1 2 2
15 Southbound 2 3 2 2
16 Northbound 2 2 2 2
16 Southbound 2 3 2 2
13 Northbound 3 1 2 2
13 Southbound 3 2 2 2
All of the subject left-turn movements were served by single left-turn lanes. At the siteswhere the subject street was two-way, the left-turn movement was served by a single exclusive lane.At the sites where the subject street was one-way, the left-turn movement was served by a singleshared left/through lane. All but one of the intersections were four-leg intersections, the exceptionbeing intersection 10. The crosswalks at the study sites varied from 8 to 16 ft in width and 40 to110 ft in length.
SITE CATEGORIZATION
One of the goals of site selection was to obtain sites that collectively offered both thepermissive and protected-permissive left-turn modes. However, sites with the permissive left-turnmode were favored in the selection process because they provided more exposure to interactionbetween pedestrians and left-turning vehicles. Another site selection goal was to obtain a balancebetween sites with short and long crosswalks. It was rationalized that sites with longer crosswalks

A-8
provided left-turning drivers with more flexibility to find gaps in the pedestrian streams. The longercrosswalks were associated with sites that had a larger number of receiving lanes. Each receivinglane represents an alternative exit path from which the left-turn driver can choose when avoidingpedestrian platoons.
The study sites were categorized based on the following two characteristics:
! Left-turn mode for subject left-turn movement (permissive or protected-permissive).! Crosswalk conflict area length (short or long).
The crosswalk conflict area is the portion of the crosswalk that left-turning vehicles mustcross. Its length is equal to the combined width of the receiving lanes. This length is equal to thecrosswalk length at sites where the crossing street serves one-way vehicular travel. A conflict areais considered “short” if the site has two or fewer receiving lanes available for the subject left-turnmovement. It is considered “long” if the site has three or more receiving lanes. The number of siteswithin these categories is shown in Table A-5.
Table A-5. Study Site Categories.Conflict Area Length Number of Sites by Left-Turn Mode
Permissive Protected-Permissive
Long 6 2
Short 10 2

B-1
APPENDIX B
BEFORE-AFTER EVALUATIONOF SELECTED TREATMENTS


B-3
APPENDIX B. BEFORE-AFTER EVALUATION OF SELECTED TREATMENTS
OVERVIEW
This appendix documents before-after evaluations that were conducted on selected pedestriansafety treatments. The before-after evaluations were conducted to evaluate the safety benefits ofthese treatments, and to confirm that the level of safety improvement was consistent with thatindicated by the guidelines developed in Chapter 6.
This appendix consists of three parts. The first part describes the study experimental designand identifies the treatments that were implemented at the study sites. The second part documentsthe data analysis for the before-after evaluation. The third part summarizes the findings.
EXPERIMENTAL DESIGN
The before-after evaluation included the identification of candidate treatments, identificationof treatment implementation sites, and collection of conflict data. These activities are summarizedin the following paragraphs.
Candidate Treatments
The candidate pedestrian safety treatments considered for the before-after evaluation areidentified in the following list. The first nine treatments were identified during the literature reviewand are described in Table 2-3 of Chapter 2. The last four treatments were identified as a result ofthe examination of data collected and evaluated during the course of the research project. They aredescribed in Chapter 6.
! Provide protected-permissive mode.! Provide protected-permissive mode using flashing yellow signal display.! Provide protected left-turn mode.! Provide lagging phase sequence.! Provide leading pedestrian interval.! Provide exclusive pedestrian phase.! Provide pedestrian clear interval entirely during green.! Add turning vehicle warning signs and markings.! Prohibit pedestrian crossing.! Reduce signal cycle length.! Reduce crossing distance (by installing curb extensions at the corners).! Invoke pedestrian recall (when phase is actuated).! Increase walk interval duration (without increasing cycle length).

B-4
Treatment Implementation Sites
The approach used to identify treatment sites was to draw from the pool of sites included inthe initial data collection task, as described in Chapter 4. These sites were evaluated using theguidelines described in Chapter 6. Then, those sites with the most potential for pedestrian safetyimprovement were identified. These sites were labeled the “before” sites. The data previouslycollected (and summarized in Chapter 5) were labeled the “before” data. This process led to theidentification of six sites in the vicinity of the University of Texas-Austin campus.
The selected sites and their corresponding treatments are listed in Table B-1. Additionalinformation about each site is provided in Appendix A.
Table B-1. Before Study Sites and Associated Treatments.Intersection Intersection
NumberSubject Left-
Turn Movement Treatment
Guadalupe Street &21st Street
7 Eastbound andWestbound
Add a leading protected-permissive left-turnphase.
Guadalupe Street &24th Street
9 Eastbound Change the left-turn operational mode fromprotected-permissive leading to split.
Guadalupe Street &27th Street
12 Westbound Implement a pedestrian recall on all throughphases.
Dean Keeton Street &Medical Arts Street
16 Northbound andSouthbound
Increase the walk intervals on Medical Arts Streetby 5 s without changing the cycle length.
The City of Austin implemented the treatments between November 2010 and January 2011.None of the sites’ cycle lengths were changed when the treatments were implemented.
Data Collection
Following treatment implementation, data were collected at each of the treated sites. The datacollection procedure was the same as that used to collect the “before” data, as described inChapter 4.
The data were collected in February 2011. They were labeled the “after” data. Two hoursof data were collected at each site. In all cases, at least one month of acclimation occurred betweentreatment implementation and data collection. At every site, the “after” data were collected on thesame day of the week and during the same hours of the day as when the “before” data werecollected. No data collection occurred on holidays. Data were collected only when classes at theUniversity of Texas-Austin were in session.
DATA ANALYSIS
This part of the appendix describes the data reduction and analysis. The first sectiondescribes the sample size for each treated site. The second section describes the statistical analysisof the reduced data. The last section summarizes the analysis results.

B-5
Sample Size
The following data elements were tabulated for each site for both the “before” and “after”study periods:
! Data collection time period.! Left-turning vehicle volume.! Number of legal pedestrians.! Number of illegal pedestrians.! Total number of pedestrians.! Number of legal pedestrian-vehicle conflicts.! Number of illegal pedestrian-vehicle conflicts.! Number of total pedestrian-vehicle conflicts.
The counts of pedestrians and pedestrian-vehicle conflicts are provided in Table B-2.
Table B-2. Counts of Pedestrians and Pedestrian-Vehicle Conflicts.Data
PeriodIntersection
NumberSubject
Left-TurnMovement
Number of Pedestrians (Nped) Number of Pedestrian-VehicleConflicts (Nco)
Legal Illegal Total Legal Illegal Total
Before 7 Eastbound 377 80 457 6 0 6
Westbound 461 54 515 8 3 11
Both 838 134 972 14 3 17
9 Eastbound 459 283 742 7 13 20
12 Westbound 140 46 186 7 2 9
16 Northbound 85 71 156 10 2 12
Southbound 41 50 91 5 0 5
Both 126 121 247 15 2 17
Total: 1563 584 2147 43 20 63
After 7 Eastbound 262 215 477 3 1 4
Westbound 389 178 567 2 8 10
Both 653 393 1046 5 9 14
9 Eastbound 590 200 790 0 1 1
12 Westbound 129 43 172 1 0 1
16 Northbound 59 69 128 11 3 14
Southbound 32 15 47 4 0 4
Both 91 84 175 15 3 18
Total: 1461 720 2181 21 13 34
The left-turn volumes and data collection time periods are provided in Table B-3. In caseswhere the same treatment was applied at multiple sites, data are provided both for the individualsites and for the aggregation of sites with the same treatment.

B-6
Table B-3. Left-Turn Volumes and Data Collection Time Periods.Data Period Intersection
NumberSubject Left-Turn
MovementLeft-Turn Volume
(vlt), veh/hData Collection
Time Period (t), h
Before 7 Eastbound 18 1.91
Westbound 50 1.96
Both 68 3.87
9 Eastbound 214 1.99
12 Westbound 53 2.33
16 Northbound 103 2.00
Southbound 42 1.99
Both 145 3.99
Total: 480 12.18
After 7 Eastbound 20 1.99
Westbound 61 2.00
Both 81 3.99
9 Eastbound 191 1.95
12 Westbound 69 2.01
16 Northbound 103 1.92
Southbound 36 1.99
Both 139 3.90
Total: 480 11.85
In most cases, the left-turn and pedestrian volumes were similar between the “before” and“after” evaluation periods. The exceptions are the crosswalks at intersection 16, which had roughlytwo-thirds the number of pedestrians in the “after” period as in the “before” period. This change maybe attributed to the closing of a popular restaurant and coffee shop at the intersection between thetwo data collection time periods.
Statistical Analysis
The following measures of effectiveness were used to evaluate the treatments:
! Legal pedestrian-vehicle conflict rate.! Illegal pedestrian-vehicle conflict rate.! Total pedestrian-vehicle conflict rate.! Pedestrian compliance percentage (percentage of total pedestrians crossing legally).! Early pedestrian percentage (percentage of pedestrians starting to cross as much as five
seconds prior to the start of the WALK indication).
The pedestrian-vehicle conflict rates were computed per 1000 pedestrians per left-turningvehicle volume. Conflict rates were preferred over conflict frequencies because they account forchanges in exposure between the two evaluation periods. Reductions in pedestrian-vehicle conflictrates or increases in the pedestrian compliance percentage can be regarded as positive safetyimpacts.

B-7
Conflict Rates
Table B-4 shows the legal, illegal, and total pedestrian-vehicle conflict rates for the “before”and “after” evaluation periods. These rates were computed using the following equation.
where,Vco, i = conflict rate for pedestrian type i (i = L: legal, I: illegal), conflicts/1000 p/veh.Nco, i = number of pedestrian-vehicle conflicts involving pedestrian type i, conflicts.
vlt = conflicting left-turn volume, veh/h.t = study duration, h.
Nped, i = number of pedestrians of type i crossing the crosswalk, p.
Table B-4. Pedestrian-Vehicle Conflict Rates.Intersection
NumberSubject
Left-TurnMovement
Pedestrian-Vehicle Conflict Rate (Vco),conflicts/1000 p/veh
Legal Illegal Total
Before After Before After Before After
7 Eastbound 1.69 1.14 0.00 0.46 1.40 0.83
Westbound 0.68 0.17 2.18 1.47 0.84 0.58
Both 0.95 0.38 1.28 1.13 1.00 0.66
9 Eastbound 0.14 0.00 0.43 0.05 0.25 0.01
12 Westbound 2.20 0.23 1.91 0.00 2.13 0.17
16 Northbound 2.28 3.47 0.55 0.81 1.49 2.04
Southbound 5.77 6.90 0.00 0.00 2.60 4.70
Both 3.27 4.63 0.45 1.00 1.89 2.89
Average: 0.70 0.35 0.87 0.45 0.74 0.38
Inspection of the trends in Table B-4 reveals that in most cases, the conflict rates for legalpedestrians were lower in the “after” period than in the “before” period. One exception isintersection 16, where the walk interval duration was increased from 5 to 10 s. The trends for legalpedestrians and total pedestrians were similar.
With respect to the illegal pedestrian-vehicle conflict rate, the effects of the treatments weremixed. Two of the sites (the eastbound left-turn movement at intersection 7 and the northboundleft-turn movement at intersection 16) experienced an increase in conflict rate, three of the sitesexperienced a decrease, and one site experienced no change.
The effect of a pedestrian safety treatment can be considered “positive” if the treatmentreduces the legal pedestrian-vehicle conflict rate. However, if the treatment also tends to reduce thepedestrian compliance percentage while increasing the illegal pedestrian-vehicle conflict rate, the
(30)

B-8
overall result may be an increase in conflicts. Hence, total pedestrian-vehicle conflict rate is a moreinformative measure of treatment effectiveness; however, the compliance percentage is a measurethat should also be considered.
Total pedestrian-vehicle conflict rate was analyzed to determine whether the changes inconflict rate at the treated sites were statistically significant. To address concerns about illegalpedestrians, a statistical analysis was conducted on pedestrian compliance percentage. The analysisof compliance percentage is presented in the next subsection.
The statistical analysis method used for the evaluation of conflict rate is that documented byGriffin and Flowers (1, Chapter 2). The method requires conflict counts and an exposure variableas inputs. It produces a Z-score that follows the standardized normal distribution. It indicates thestatistical significance of conflict rate changes. The method is described by the following equation.
(31)
where,A = total pedestrian-vehicle conflict count in the “after” period (from Table B-2), conflicts.B = total pedestrian-vehicle conflict count in the “before” period (from Table B-2), conflicts.
EA = exposure in the “after” period, 1000 p-veh.EB = exposure in the “before” period, 1000 p-veh.
The exposure variable in each data collection period was computed with the followingequation.
(32)
where,Ej = exposure in period j ( j = A: after, B: before), 1000 p-veh.
vlt, j = conflicting left-turn volume in period j, veh/h.tj = study duration in period j, h.
Nped, i, j = number of pedestrians of type i crossing the crosswalk in period j, p.
The data used to compute exposure are provided in Table B-2 and Table B-3. The nullhypothesis of this test is that the conflict rates in the two periods are equal. It is shown in thefollowing equation.
(33)
The results of the statistical analysis are provided in the two rightmost columns of Table B-5.Changes having p-values less than 0.05 are considered statistically significant.

B-9
Table B-5. Statistical Analysis Results for Total Conflict Rates.Intersection
NumberSubject Left-Turn
MovementZ 1 p-value Percent Change
in RateStatistically
Significant Change?
7 Eastbound -0.49 0.62 -40 No
Westbound -0.64 0.52 -31 No
Both -0.97 0.33 -34 No
9 Eastbound -3.85 < 0.01 -95 Yes
12 Westbound -2.77 0.01 -92 Yes
16 Northbound 0.99 0.32 36 No
Southbound 1.26 0.21 81 No
Both 1.43 0.15 53 NoNotes:1 – The Z-scores were computed using Equation 31.
The statistical analysis revealed that the conflict rate reductions at intersections 9 and 12were statistically significant. The conflict rate reductions at intersection 7 were positive butstatistically insignificant. The statistically insignificant increases in conflict rates at intersection 16are more likely attributable to the low pedestrian and vehicle volumes than to effects of thetreatment. The total number of conflicts increased by just one at the intersection 16 sites (17 in the“before” period and 18 in the “after” period). Hence, the conflict rate increases at intersection 16 areneither statistically nor practically significant.
Compliance Percentages
Table B-6 provides a summary of compliance percentages observed in the two datacollection periods. This percentage was computed using the following equation.
where,PL, j = percent of pedestrians crossing legally during period j ( j = A: after, B: before), percent.
The two sites that experienced increases in illegal pedestrian-vehicle conflict rate (i.e.,eastbound left turn at intersection 7, northbound left turn at intersection 16) also experienceddecreases in the pedestrian compliance percentage. At these sites, there was an increase in the totalnumber of illegal pedestrians and the conflict rate associated with these pedestrians.
(34)

B-10
Table B-6. Pedestrian Compliance Percentages.Intersection
NumberSubject Left-Turn
MovementCompliance Percentage (PL), % Statistically
Significant Change?Before After
7 Eastbound 82.5 54.9 Yes
Westbound 89.5 68.7 Yes
Both 86.2 62.4 Yes
9 Eastbound 61.9 74.7 Yes
12 Westbound 75.3 75.0 No
16 Northbound 54.5 46.1 No
Southbound 45.1 68.1 Yes
Both 51.0 52.0 No
Average: 68.3 61.8 Yes
An odds-ratio test was conducted on the pedestrian compliance percentages. This test isdescribed by Ott and Longnecker (2, Chapter 10). The use of odds accounts for differences in samplesizes and exposure between the “before” and “after” periods. To conduct this test, the compliancepercentages in Table B-6 were converted to odds as follows:
(35)
where,Oj = compliance odds for period j ( j = A: after, B: before).
PL, j = percent of pedestrians crossing legally during period j.
The 95th-percentile confidence intervals were determined for the odds ratios using thefollowing equation.
(36)
with,
(37)
where,se = standard error.Z = standard score (use 1.96).
An odds ratio of 1.0 would indicate no change between the “before” and “after” time periods.If the 95th-percentile confidence interval excludes 1.0, the change would be considered statisticallysignificant. Hence, the null hypothesis for this test is that the 95th-percentile confidence intervalcontains 1.0.
The results of this test are provided in the rightmost column of Table B-6. As shown, thepedestrian compliance percentages decreased significantly at the two sites at intersection 7. After

B-11
the leading protected left-turn phase was implemented at these sites, many pedestrians began to crossduring the protected left-turn phase, particularly the pedestrians originating from the near corner.Pedestrian compliance percentages were found to increase significantly at intersection 9 and at oneof the sites at intersection 16.
Early Pedestrian Percentages
Observations during the field data collection suggested that the percentage of pedestrianscrossing early (i.e., starting the crossing movement as much as five seconds before the start of theWALK indication) may have changed at several of the sites. These pedestrians represent a subsetof the illegal pedestrians. To explore this trend, the early-crossing pedestrians were counted, andpercentages were computed in a similar manner to the pedestrian compliance percentages. Thesepercentages are provided in Table B-7.
Table B-7. Early Pedestrian Percentages.Intersection
NumberSubject Left-Turn
MovementEarly Pedestrian Percentage, % Statistically
Significant Change?Before After
7 Eastbound 5.7 14.9 Yes
Westbound 0.6 9.8 Yes
Both 3.0 12.1 Yes
9 Eastbound 12.0 0.5 Yes
12 Westbound 2.7 7.6 Yes
16 Northbound 5.8 10.9 No
Southbound 4.4 2.1 No
Both 5.3 8.6 No
Average: 6.3 7.3 No
An odds-ratio test was conducted on the early pedestrian percentages provided in Table B-7.The results show that the number of early pedestrians increased significantly for the two sites atintersection 7 and also for the site at intersection 12. The magnitude of the increase for intersection7 was roughly double that of the increase for intersection 12. It is not clear why the pedestrian recalltreatment at the intersection 12 site would be associated with a larger percentage of earlypedestrians. At the intersection 9 site, the percentage of early pedestrians decreased significantly.At this site, the signal phasing was changed from protected-permissive leading to split, with thepedestrians being served immediately after the crossing-street service was ended.
Analysis Results
Two of the treatments had statistically significant, positive effects on pedestrian safety.Protected-permissive operation was changed to split phasing at intersection 9. This change wasassociated with a 95 percent reduction in conflicts. Pedestrian recall was invoked at intersection 12.This change was associated with a 92 percent reduction in conflicts. These treatments had positiveor neutral effects on pedestrian compliance percentage. As shown in Table B-7, the early pedestrian

B-12
percentage increased significantly at intersection 12, but none of the early pedestrians experiencedconflicts.
The change from permissive to a leading protected-permissive operation at intersection 7 wasassociated with a 34 percent decrease in the conflict rate. However, the pedestrian compliancepercentage dropped by almost 25 percent, and the early pedestrian percentage increased by about9 percent.
Increasing the walk interval duration at intersection 16 was accompanied by a 53 percentincrease in the conflict rate. It is not certain why this treatment would have increased the conflictrate, but it is likely that the pedestrian volumes at intersection 16 were insufficient to allow thepotential benefit of the treatment to emerge. This treatment is most commonly considered whenpedestrian volumes are sufficiently high that some waiting pedestrians do not have time to enter thecrosswalk before the start of the pedestrian clearance interval. Additionally, the presence of lowvehicle volumes at intersection 16 made it possible for many pedestrians to cross illegally. Somepedestrians even used the narrow (4 to 5 ft) raised-curb median as a refuge area, crossing one sideof the crossing street at a time as traffic gaps allowed.
SUMMARY
The following four treatments were implemented and evaluated:
! Provide protected-permissive mode (leading phase sequence).! Provide protected left-turn mode (using a split phase sequence).! Invoke pedestrian recall.! Increase walk interval duration.
Based on a comparison of total pedestrian-vehicle conflict rate between the “before” and“after” evaluation periods, the first three treatments were found to be beneficial. For some of thesetreatments, there was a tradeoff between reduced legal pedestrian-vehicle conflict rates andincreased illegal pedestrian-vehicle conflict rates. However, the overall result was a reduction intotal pedestrian-vehicle conflict rate.
The analysis of conflict rate showed that implementing the fourth treatment, increasing thewalk interval, coincided with an increase in total pedestrian-vehicle conflict rate. It is not believedthat the increase was caused by the treatment. Rather, the low volumes of pedestrians and vehiclesat the evaluation sites for this treatment likely did not justify the treatment. The benefit of anincreased walk interval is likely to emerge only when pedestrian volumes are sufficiently high thatthe large initial group of waiting pedestrians needs more time to begin crossing. Hence, anevaluation of this treatment should include a check of pedestrian volumes and possibly pedestriandelay.
B-13
REFERENCES
1. Griffin, L., III, and R. Flowers. A Discussion of Six Procedures for Evaluating Highway SafetyProjects. Report No. FHWA-RD-99-040. Texas Transportation Institute, College Station,Texas, 1997.
2. Ott, R., and M. Longnecker. An Introduction to Statistical Methods and Data Analysis. FifthEdition. Duxbury, Pacific Grove, California, 2001.