Development of Gel Dosimetry for Radiotherapy · Shaun Smith Supervisors: Dr. Jamie Trapp ......
158
Development of Gel Dosimetry for Radiotherapy A THESIS SUBMITTED TO THE SCIENCE AND ENGINEERING FACULTY OF QUEENSLAND UNIVERSITY OF TECHNOLOGY IN FULFILMENT OF THE REQUIREMENTS FOR THE DEGREE OF DOCTOR OF PHILOSOPHY Shaun Smith Supervisors: Dr. Jamie Trapp Dr. Kye Masters Dr. Scott Crowe School of Chemistry, Physics and Mechanical Engineering Science and Engineering Faculty Queensland University of Technology 2017
Transcript of Development of Gel Dosimetry for Radiotherapy · Shaun Smith Supervisors: Dr. Jamie Trapp ......

Development of Gel Dosimetry for Radiotherapy
A THESIS SUBMITTED TO
THE SCIENCE AND ENGINEERING FACULTY
OF QUEENSLAND UNIVERSITY OF TECHNOLOGY
IN FULFILMENT OF THE REQUIREMENTS FOR THE DEGREE OF
DOCTOR OF PHILOSOPHY
Shaun Smith
Supervisors:
Dr. Jamie Trapp
Dr. Kye Masters
Dr. Scott Crowe
School of Chemistry, Physics and Mechanical Engineering
Science and Engineering Faculty
Queensland University of Technology
2017

2

3
Abstract
Gel dosimeters are three-dimensional radiation detectors, potentially applicable as dose
verification tools for use in radiotherapy. Despite extensive research over the last three
decades, gel dosimeters have yet to achieve widespread clinical acceptance, mainly because
of three major practical concerns; toxicity of active materials, oxygen sensitivity of dose
response, and spatial instability of dose information. A number of gel dosimetry systems have
been developed over the years with differing mechanisms of operation and varying degrees of
success in alleviating the practical issues inhibiting clinical uptake. The oldest and best
understood of these systems is the Fricke gel dosimeter. Fricke gels are non-toxic and have a
strong response to radiation; however, these systems are subject to diffusion of dose
information which is their primary drawback. In the pursuit of a more clinically feasible
three-dimensional dosimeter, this work aimed to reduce diffusion of dose information in
Fricke gels via chemical manipulation of ingredients.
Fricke gels contain ferrous sulphate in an acidic, aqueous solution with a gelling agent (i.e.
gelatine, agarose, poly(vinyl alcohol) (PVA) etc.) and a reporter molecule (xylenol orange).
Upon irradiation, a dose-dependent transformation of ferrous ions (Fe2+
) into ferric ions
(Fe3+
) occurs. Upon this transformation, the ferric ions are chelated by xylenol orange,
inducing a colour change in the gel. It is hypothesised that by covalently bonding the Fricke
gel reporter molecule, xylenol orange, with a gelling agent, PVA, that post-irradiation colour
changes would be less able to diffuse. To test this, the initial gel modifications in this thesis
involved simple methods that altered commercially sourced xylenol orange and PVA to

4
induce bonding. These methods yielded some success and a synthesis route to PVA partially
functionalised with xylenol orange was developed. Integrating this molecule into a Fricke gel
resulted in a diffusion coefficient of 0.129 mm2
h-1
; an 8% reduction in diffusion compared to
a gel with the same PVA concentration. It was concluded that to improve these results, more
efficient methods of synthesising the functionalised polymer would need to be developed.
To achieve this, a vastly different synthesis approach was undertaken; small modifications to
PVA and xylenol orange were made to couple the compounds via a ‘click’ reaction. Specific
synthesis methods are defined as ‘click’ chemistry when they are reliable, high yielding,
simple to perform, and create by-products which only require simple filtration to be removed.
These techniques had proven effective at functionalising polymers in the past, and applied to
this system was also successful. PVA with azide functionality was produced via
modifications to published methodology. Xylenol orange was produced in house with
selective modifications to add an alkyne group. Xylenol orange-substituted PVA was attained
by bonding the two intermediates via the Huisgen 1, 3-Dipolar Cycloaddition of alkynes and
azides, and unlike the previous synthesis attempt, achieved complete functionalisation with
no unbound xylenol orange in the final compound.
The final investigation, to complete this work, incorporated xylenol orange-substituted PVA
into Fricke gels. Comparing formulations with varied gelling agents and additives showed
that a gel with good dosimetric properties could be made with a mixture of 10% (w/v) gelatin
in a 50 mM H2SO4 aqueous solution, with 10 mM glyoxal, 0.1 mM ferrous sulphate, and 0.1
mM xylenol orange – substituted PVA. Using gelatine as opposed to PVA in the final gel
offers great practical benefit, as the time and effort required to mix and set gelatine is

5
significantly lower than for PVA. The gels optical density was measured to have a linear dose
response (r2 = 0.9983) from 0 to 32 Gy with an sensitivity of 0.0031 Gy
-1, an auto-oxidation
rate of 0.00023 h-1
, and a diffusion coefficient of 0.132 mm2
h-1
. Incorporating the new
functionalised polymer provided a considerable improvement to spatial stability, with a
diffusion rate 56% lower than the previously lowest figure for gelatine Fricke gels. The gel
also demonstrated a continued linear response when reused, with only a 10% reduction in
dose sensitivity. This new gel dosimeter represent a considerable development as it marries
the low diffusion of a PVA gel, with the ease of preparation and reliability typical of gelatin
based Fricke gels. Although producing xylenol orange – substituted PVA would not be
practical in a clinical environment due to the laborious synthesis, the availability of the
functionalised polymer from commercial suppliers would allow for an easy to use, low-
diffusing, reusable three-dimensional dosimeter. This new gel dosimeter realises the aim of
the project and represents the final product of this work.

6

7
List of Publications and Manuscripts
Refereed papers
Chapter 4
1. S.T. Smith, K.-S. Masters, K. Hosokawa, J.P. Blinco, S.B. Crowe, T. Kairn, & J.V.
Trapp, Preliminary investigations into the use of a functionalised polymer to reduce
diffusion in Fricke gel dosimeters. Medical physics, 2015. 42: p. 6798-6803.
Chapter 5
2. S.T. Smith, K.-S. Masters, K. Hosokawa, & J.V. Trapp, Synthesis of Xylenol Orange-
Substituted Poly(vinyl alcohol) via ‘Click’ Chemistry. In preparation, 2017.
Chapter 6
3. S.T. Smith, K.-S. Masters, K. Hosokawa, A. Asena, S.B. Crowe, T. Kairn, & J.V. Trapp,
Characterisation of the xylenol orange substituted–PVA based gel dosimeter – a new
Fricke gel incorporating a functionalised polymer. In preparation, 2017.
Conference presentations
1. S.T. Smith, P.H. Charles, S.B. Crowe, A. Asena, & J.V. Trapp (2014) Monte Carlo
simulations of small field output factors in solid phantoms. Australasian Physical and
Engineering Sciences in Medicine, Perth, Australia, 37(1), p. 190. Oral Presentation.
2. S.T. Smith, K.-S. Masters, K. Hosokawa, J.P. Blinco, S.B. Crowe, T. Kairn, & J.V. Trapp
(2014) A reduction of diffusion in PVA Fricke hydrogels. IC3DDose: 8th
International

8
Conference on 3D Radiation Dosimetry, Ystad, Sweden. Oral Presentation. Published
2015: Journal of Physics: Conference Series, 573(1), 012046.
3. S.T. Smith, T. Kairn, S.B. Crowe, A. Asena, & J.V. Trapp (2014) Characterisation of the
half-field beam penumbra for a variety of blocking set-ups. IC3DDose: 8th International
Conference on 3D Radiation Dosimetry, Ystad, Sweden. Poster Presentation. Published
2015: Journal of Physics: Conference Series, 573(1), 012073. (Included: Chapter 3)
Other contributions throughout candidature
A. Asena, T. Kairn, S.B Crowe, S.T. Smith, & J.V. Trapp (2015) PAGAT gel dosimeters
for dose distribution measurements in the vicinity of high-density implants : a preliminary
study. Journal of Physics: Conference Series, 573(1), 012061.
A. Asena, S.B. Crowe, T. Kairn, L. Dunn, M. Cyster, I. Williams, P.H. Charles, S.T.
Smith & J.V. Trapp (2014) Response variation of optically stimulated luminescence
dosimeters. Radiation Measurements, 61, p. 21-24. Presented (2013) Perth, Australia,
Australasian Physical and Engineering Sciences in Medicine, 37(1), p. 244-245.
A. Asena, S.T. Smith, T. Kairn, S.B Crowe, S. Sylvander, & J.V. Trapp (2016) Dose
distributions in the vicinity of high-density implants using 3D gel dosimeters. Submitted
to Medical Physics.
A. Asena, S. Nillson, S.T. Smith, T. Kairn, S.B Crowe, & J.V. Trapp (2016)
Methodology for verifying HDR Brachytherapy distributions using 3D Fricke gel
dosimeters. Submitted to Medical Physics.

9
Statement of Original Authorship
The work contained in this thesis has not been previously submitted to meet requirements for
an award at this or any other higher education institution. To the best of my knowledge and
belief, the thesis contains no material previously published or written by another person
except where due reference is made.
Signature:
Date: 4/01/17
QUT Verified Signature

10

11
Acknowledgements
I would like to express my gratitude and appreciation to my supervisors and support team, Dr
Jamie Trapp, Dr Kye Masters, Dr Scott Crowe, and Dr Tanya Kairn for their support, advice,
and guidance throughout my entire PhD candidature.
I wish to thank various technical staff, and researchers, all of whom have taken hours out of
their days to help me analyse samples and train me on instruments: Dr Mark Wellard, Dr
Chris Carvalho, Dr David Marshall, Dr Peggy Williams, Dr Berwyck Poad, Dr Llew Rintoul,
and Prof Stephen Blanskby.
Many thanks to the staff of the Royal Brisbane and Women’s Hospital’s, and the Wesley
Hospital’s radiation oncology departments who have been extremely accommodating with
the numerous irradiations I performed using their equipment over the last 3 years.
I would like to thank colleagues and friends, past and present, at QUT from the physics group
and the M6 chemistry lab. In particular, to Pabhon Poonpatana, Sarah Fletcher, and Colin
Schiemer for the countless hours they spent away from their own work to teach me and help
me get through my chemistry. To Kazuyuki Hosokawa who actually came up with the idea
for my project and to Andre Asena for ideas, support, and assistance at every stage of my
PhD.
Finally, I thank my family; Mum, Dad, Emma and Jess for their enduring support and
patience.

12

13
Table of Contents
Abstract 3
List of Publications and Manuscripts 7
Statement of Original Authorship 9
Acknowledgements 11
List of Figures and Schemes 17
List of Tables 21
1. Introduction 23
1.1. Research Problem 23
1.2. Project Aim 25
1.3. Thesis Structure and Overview 25
2. Background and Literature Review 27
2.1. Radiotherapy 27
2.1.1. External Beam Radiotherapy 28
2.1.2. Dose Verification Methods 29
2.2. Gel Dosimetry 31
2.2.1. Fricke gel dosimeters 32
2.2.2. Polymer gel dosimeters 35
2.2.3. Other Radiochromic 3D dosimeters 38
2.2.4. Dose Read-out Methods 38
3. Optimization of half field penumbra for diffusion measurements 41
3.1. Methodology 42
3.1.1. Half-field blocking set-ups 42
3.1.2. Penumbra measurements 43

14
3.2. Results and discussion 44
3.3. Conclusions 46
4. Initial investigations of functionalised PVA in Fricke dosimeters 47
4.1. Methods 49
4.1.1. Xylenol orange functionalised PVA preparation 49
4.1.2. XO–PVA gel production 50
4.1.3. PVAFX hydrogel production 51
4.1.4. Dose response measurements 52
4.1.5. Reaction rate measurements 52
4.1.6. Gel stability measurements 52
4.1.7. Diffusion measurements 53
4.2. Results and Discussion 53
4.2.1. Reaction Rate 53
4.2.2. Dose Sensitivity 54
4.2.3. Auto–oxidation rates 57
4.2.4. Diffusion rates 59
4.2.5. Manufacturing Considerations 62
4.3. Conclusion 63
5. Total synthesis of xylenol orange – substituted PVA 65
5.1. Experimental Section 68
5.1.1. General 68
5.1.2. 4-nitro-2-sulfobenzoic acid (5.1) 69
5.1.3. 4-amino-2-sulfobenzoic acid (5.2) 71
5.1.4. 4-iodo-2-sulfobenzoic acid (5.3) 73
5.1.5. 4-iodo-2-sulfobenzoic anhydride (5.4) 75
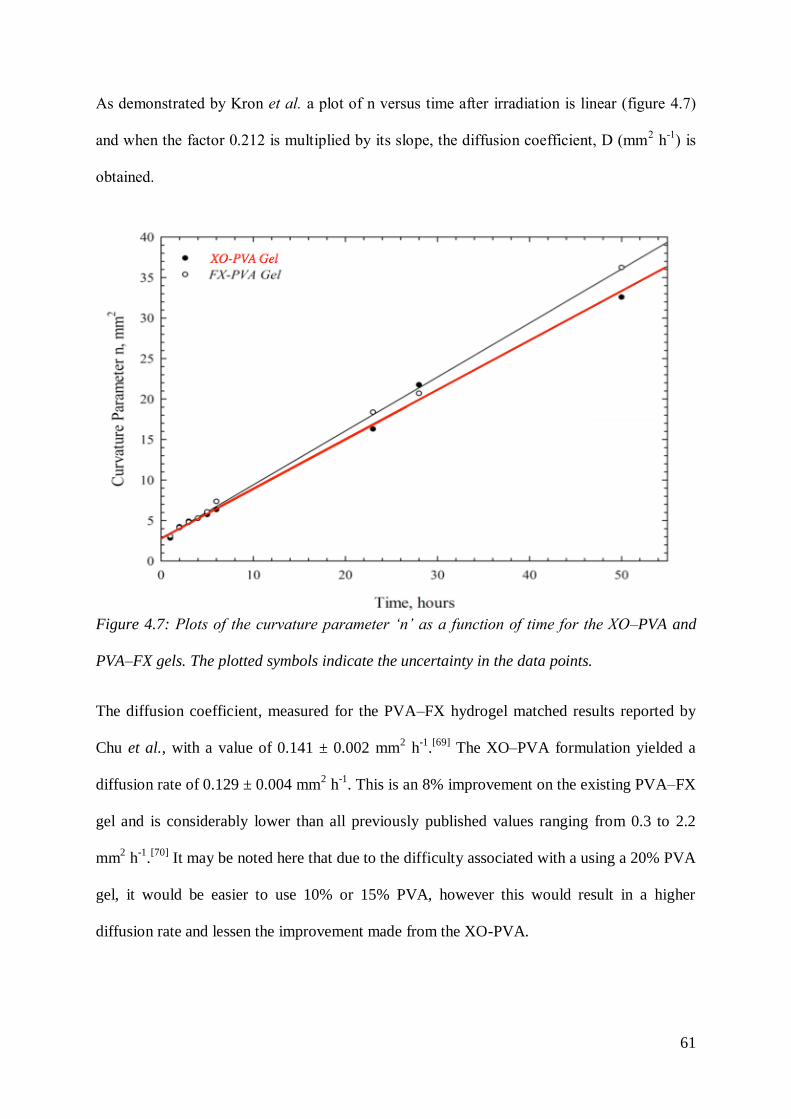
5.1.6. 3,3-bis(4-hydroxy-3-methylphenyl)-5-iodo-3H-benzo[c][1,2]oxathiole
1,1-dioxide (5.5) 77

15
5.1.7. 3,3-bis(4-hydroxy-3-methylphenyl)-5-((trimethylsilyl)ethynyl)-3H-
benzo[c][1,2]oxathiole 1,1-dioxide (5.6) 81
5.1.8. 5-ethynyl-3,3-bis(4-hydroxy-3-methylphenyl)-3H-
benzo[c][1,2]oxathiole 1,1-dioxide (5.7) 85
5.1.9. Alkyne-xylenol orange (5.8) 89
5.1.10. 2-azidoethylamine-substituted PVA (5.9) 93
5.1.11. Xylenol orange-substituted PVA (5.10) 97
5.2. Conclusions 101
6. Characterisation of xylenol orange substituted –PVA based gel
dosimeter 103
6.1. Methods 103
6.1.1. Xylenol Orange – Substituted PVA 103
6.1.2. Inter-comparison of formulations 104
6.1.3. Gel Production 105
6.1.4. Dose response measurements 106
6.1.5. Auto–oxidation measurements 107
6.1.6. Diffusion measurements 107
6.1.7. Further Dosimetric Characterisation of Optimal Formulation 107
6.1.8. Three-dimensional measurements 108
6.1.9. Gel Reusability 108
6.2. Results 109
6.2.1. Dose response comparison 109
6.2.2. Auto-oxidation comparison 111
6.2.3. Diffusion rate comparison 112
6.2.4. Characterisation of Optimal Formula 114
6.2.4.1. Dose response beyond linear range 114
6.2.4.2. Reaction Rate 115
6.2.4.3. Energy and dose rate dependence 117
6.2.4.4. Three-dimensional measurements 118

16
6.2.4.5. Gel Reusability 120
6.3. Discussion 123
6.3.1. Practical considerations and effects of gelling agent 123
6.3.2. Effect of glyoxal 124
6.3.3. Diffusion rate 124
6.3.4. Energy and dose rate dependence 126
6.3.5. Reusability 126
6.4. Conclusion 127
7. Conclusion and recommendations 129
References 135
Appendix A: Initial Synthesis Methods 147

17
List of Figures and Schemes
Figure 2.1: A comparison of treatment plan dose maps from Varian for IMRT and Arc
Therapy.
29
Figure 2.2: Schematic representation of the interaction between different chemicals in
a polymer gel dosimeter.
36
Figure 3.1: A schematic of the five half-field blocking techniques, which were
investigated.
43
Figure 3.2: A typical noise reduced half-field profile obtained from the EBT2 film. The
penumbra is obtained between points, 10% of the range of OD values from the
maximum and minimum.
44
Figure 4.1: Reaction scheme to produce xylenol orange functionalised PVA. 50
Figure 4.2: Images of half-field irradiated cuvettes (20 Gy) to demonstrate how each
gel appears with and without irradiation. Note that for XO-PVA, the unirradiated gel
is darker yet the contrast achieved post irradiation is lower than PVA-FX gel.
51
Figure 4.3: OD of XO-PVA as a function of time after irradiation to 20 Gy. Note that
for this measurement, the gel was stored at room temperature between scans.
54
Figure 4.4: The response in OD of the XO–PVA and PVA–FX gels in cuvettes to
various levels of dose. Inset: The optical dose response of the XO-PVA gel until
saturation is reached.
55
Figure 4.5: The increase in OD of non-irradiated gels as a function of time due to
auto–oxidation. The plotted symbols indicate the uncertainty in the data points.
58
Figure 4.6: Typical OD line profiles taken 1, 3, 6, 23 and 50 hours post-irradiation
from the: A PVA-FX gel and B XO–PVA gel. Part C shows a scaled comparison of the
60

18
diffusion curves for both gels at 1 and 6 hours.
Figure 4.7: Plots of the curvature parameter ‘n’ as a function of time for the XO–PVA
and PVA–FX gels. The plotted symbols indicate the uncertainty in the data points.
61
Scheme 5.1: Preparation of alkyne-xylenol orange. 67
Scheme 5.2: Preparation of xylenol orange-substituted PVA. 68
Figure 6.1: Xylenol orange – substituted PVA structure. 104
Figure 6.2: Dose response comparison of the six gel formulations from 0 to 32 Gy. 110
Figure 6.3: The increase in O.D. of the six gel formulations as a function of time due
to auto–oxidation.
112
Figure 6.4: Plots of the curvature parameter ‘n’ as a function of time for the various
gel formulations. Inset: Curvature parameter ‘n’ plotted for the first 10 hours post-
irradiation.
113
Figure 6.5: The optical dose response of gel formulation 6 beyond the linear response
range from 0 – 107 Gy. Inset: Optical dose response highlighted for the 0 to 10 Gy
range.
115
Figure 6.6: O.D. of formulation 6 as a function of time after irradiation to 20 Gy. 116
Figure 6.7: O.D. Response of gel formulation 6 from 0 to 32 Gy comparing 6 MV and
10 MV beam energies along with dose rates of 400 MU/min and 600 MU/min.
118
Figure 6.8: Transmission images taken in the Vista Optical CT scanner of jars filled
with gel formulation F irradiated with approximately 13 Gy in a 3 × 3 cm beam.
119
Figure 6.9: Cross-beam slices from reconstructed 3D scans of gel formulation 6 taken
1 hour and 18 hours after irradiation along with corresponding dose profiles taken
through these slices. The location of each slice is indicated by the dashed line as in
figure 6.8. The location of the profiles is indicated by the solid lines.
120
Figure 6.10: O.D. Response of gel formulation 6 from 0 to 32 Gy comparing fresh gel 121

19
and gel reused by melting, stirring and resetting.
Figure 6.11: Cross-beam slices from reconstructed 3D scans of reused gel formulation
6 taken 1 hour and 18 hours after irradiation along with corresponding dose profiles
taken through these slices. The location of each slice is indicated by the dashed lines
as in figure 6.8. The location of the profiles is indicated by the solid lines.
122
Figure A.1: Comparison of 1–Butanol and Poly(vinyl alcohol) molecules. 147
Scheme A.1: Production of Xylenol Orange monobutyl−ester from Xylenol Orange
Disodium Salt with 1−Butanol and Hydrochloric Acid.
149
Scheme A.2: Production of Xylenol Orange Cyclic Anhydride from Xylenol Orange
Disodium Salt with DIC, DCM and DMF.
151
Scheme A.3: Formation of Xylenol Orange Tetra−Acid for Xylenol Orange Disodium
Salt and HCl.
152
Scheme A.4: Esterification of XO TA through a Cyclic Anhydride Reaction
Intermediate using DIC and 1−Butanol in DMF.
154
Figure A.2: NMR spectrum of XO TA. 154
Figure A.3: NMR spectrum taken on the product of Reaction A.4. 155
Scheme A.5: Esterification of XO TA/DS through a Benzotriazole Reaction
Intermediate using DIC and HOBT in DMF.
157
Figure A.4: NMR spectra comparison from ≈ 6.5 – 7.9 ppm for Reaction 6 product,
and Xylenol Orange Disodium Salt.
158

20

21
List of Tables
Table 3.1: 10-90% penumbra measurements (cm) for the various half-field blocking
set-ups investigated. The highlighted data points are the most important for analysis as
this depth is where most half-field measurements are performed.
45
Table 4.1: The OD sensitivity, optical attenuation coefficient, and respective linearity
quality for the XO–PVA and PVA–FX gels.
56
Table 6.1: Summary of gel dosimeters incorporating xylenol orange – substituted
PVA.
105
Table 6.2: The O.D. sensitivity, background O.D., and respective linearity quality for
all gel formulations.
111
Table 7.1: The O.D. sensitivity, auto-oxidation rate, and diffusion rate for key Fricke
gels from this thesis and the literature. *Note that properties of the FX-G gel have
been measured using different experimental set-ups to the other gels listed.
132

22

23
Chapter 1
Introduction
1.1. Research Problem
Cancer is one of the world’s leading causes of death, accounting for 8.2 million deaths in
2012.[2]
As such, extensive research and resources have been devoted to develop techniques
to fight cancer. Due to the ever-growing understanding of the impact of radiation to the
body, radiotherapy has become an increasingly reliable means of controlling tumours in both
the palliative and curative role. The most recent radiotherapy techniques, such as
tomotherapy and arc therapy are capable of delivering highly conformal doses with steep
field gradients. This effectively minimizes the amount of normal tissue being irradiated in
the treatment field, sparing sensitive tissue from overly large doses.
To verify the accuracy of such techniques, it is advantageous to measure the radiation dose
distribution in three dimensions. Dose verification is an important part of the planning
process as it provides an independent confirmation that the treatment plan is delivering its
dose accurately to the target. Dosimeters such as ionization chambers, thermoluminescent
detectors (TLD’s) and radiochromic film are effective at quantifying dose but are limited to
measurements at either a point or in two dimensions.[3]
One possible candidate for 3D dose
measurement is gel dosimeters.

24
Gel dosimeters are comprised of a gel matrix (usually a polymer) permeated with radiation
sensitive materials. Upon irradiation, a measurable chemical change is induced in these
active materials that are held in position by the gel matrix, hence retaining a 3D spatial record
of the delivered dose. There are several potential advantages of gel dosimeters over other
dosimetry techniques. On top of having the ability to score dose in three dimensions, the gel
itself can act as the humanoid phantom, and consequently does not result in dose
perturbations behind the point of measurement. Additionally, most gel dosimeter
formulations show a significant degree of radiological tissue equivalence and can be moulded
into containers of varying shape allowing the creation of anthropomorphic phantoms and
accurate modelling of radiation dose distributions.
Over the last three decades of gel dosimetry, the clinical need for 3D dosimeters has changed
as new radiotherapy technologies and practices have been developed. Today, 3D dosimetry
has potential application in dose verification of the most complex dose deliveries, as well as
in the evaluation of positioning errors. Despite their numerous benefits, there are a number
of complications associated with gel dosimetry that remain to be addressed, and that are
inhibiting the routine use of gels in the clinic. These include:
1. Issues with diffusion of the active material through the gel matrix in Fricke gels.[4]
2. Problems arise due to the oxygen sensitivity of polymer gels causing inconsistencies in
their radio sensitivity.[5-8]
3. One of gel dosimeters’ biggest limitations is a lack of convenience as clinical use can be
time consuming and hazardous, with some active materials being highly toxic.[9]

25
1.2. Project Aim
Currently, gel dosimetry requires time and specialized manufacturing facilities for users who
intend to undertake all steps from gel manufacture to evaluation. However, this may not be
necessary and potentially a ‘standard’ dosimeter could be shipped from manufacturers to
users. Commercial suppliers of gel dosimeters do exist, however each product is still subject
to one or more of the aforementioned limitations. The development of gels, which are non-
toxic, immune to the concentration of oxygen and are not affected by diffusion, will aid in
their implementation and make gel dosimetry more widely accessible. As such, the aim of
this project is to develop a novel gel dosimeter that conforms to the above criteria.
1.3. Thesis Structure and Overview
The thesis is organised in the following structure:
Chapter 1 provides a brief introduction to the research problem, outlines the overall
aim of the work, and lays out the thesis structure, identifying the content of each
chapter.
Chapter 2 reviews the relevant literature, firstly with a broad discussion of
radiotherapy to establish the role of gel dosimetry in the clinic. Then, the various gel
dosimetry systems are detailed, along with the strengths and limitations of each as
practical, clinical, dosimeters.
Chapter 3 details a brief investigation aimed at optimising the measurement of
diffusion in gels. The work compares half-field blocking techniques to minimize the
beam penumbra. The optimal blocking technique is used to perform gel diffusion
measurements in subsequent chapters.

26
Chapter 4 identifies an avenue to improve on the practicality of the PVA-Fricke
hydrogel by reducing diffusion of dose information. The paper acts as a proof of
concept that functionalising polymers with reporter molecules in gels can reduce
diffusion, laying the groundwork for future studies.
Chapter 5 expands on the work in the previous chapter by developing a method of
synthesising a new molecule which covalently bonds the Fricke gel reporter molecule
to PVA.
Chapter 6 incorporates the molecule synthesised in the previous chapter into a Fricke
gel system. A number of gel formulations are evaluated to optimise the dosimetric
properties of the system. Upon identifying the optimal formulation, a more
comprehensive characterisation of the gel is performed. The gel developed here
represents the final product of this work.
Chapter 7 concludes the thesis, identifying key outcomes of the work and issues for
future research.

27
Chapter 2
Background and Literature Review
The following chapter encompasses the relevant work already completed in this field together
with fundamental physical and chemical processes at the basis of this investigation. It is
separated into 2 primary focus topics. Section 2.1 gives a general outline of radiotherapy, and
highlights the necessity of three-dimensional dosimetry techniques for dose verification.
Section 2.2 focuses specifically on the various types of gel dosimeters being researched. This
includes a discussion of their strengths, limitations, mechanisms of operation, and various
employed methods of dose read-out.
2.1. Radiotherapy
Radiotherapy is the medical technique of controlling or killing cells with ionizing radiation,
and is used in the management of cancer. Particles (including photons, electrons, protons and
neutrons of sufficient energies) are used to treat cancer by damaging the DNA within the
tumour cells, making them unable to divide and grow. There are three main modes of
radiotherapy, each distinguished by the position of the radiation source with respect to the
body; external beam radiotherapy (EBRT) uses a radiation beam incident from outside the
body (eg. linear accelerator, 60
Co source), brachytherapy uses sealed radioactive sources
placed precisely in the area requiring treatment, and radioisotope therapy[10]
utilizes

28
radioisotopes delivered by infusion in the bloodstream or oral ingestion. The focus of this
work is the underlying principles of EBRT.
2.1.1. External Beam Radiotherapy
A conventional course of EBRT delivers a prescribed radiation dose to a given volume of
tissue via one or more radiation fields from a linear accelerator (linac). To accomplish this,
treatment planning systems (TPS) generate dose maps (see Figure 2.1) detailing the intended
delivery using information regarding the target volume contained in CT scans, along with
user specified minimum and maximum dose requirements. As computing power has
advanced over the last few decades, more sophisticated and precise techniques have been
developed to deliver the dose to a more highly defined volume.
Compared to initial EBRT methods, significant improvements have been achieved using
modern techniques including image-guided radiation therapy (IGRT), intensity modulated
radiation therapy (IMRT), volumetric modulated arc therapy (VMAT), helical tomotherapy,
stereotactic body radiation therapy (SBRT) and radiosurgery (SRS), and particle therapy. To
demonstrate the highly conformal dose delivery of some of these techniques, Figure 2.1
compares IMRT and VMAT treatment plans around the head and neck. Relative to
conventional EBRT methods, the IMRT plan provides a significant reduction in dose to
healthy tissue; however the dose map obtained through VMAT shows further improvements,
almost completely eliminating any dose to the cervical spine cord (dark area near the centre
of the cross-section).

29
Despite this, the field of radiation oncology has reached a critical point in its development
whereby the planning systems and treatment units are capable of delivering highly conformal
doses with steep field gradients, yet dosimetry systems have not been developed to a
sufficient level to allow accurate 3D verification which is routine and easy to use.[11]
Inaccuracies in dose delivery along with geometric uncertainties (which in radiotherapy
translates to dosimetric uncertainties) can be detrimental to patient health; e.g. a 5%
difference in the delivered dose may result in changes in the order of 10-20% in tumour
control probability and 20-30% in normal tissue complication probability.[12, 13]
It therefore
follows that dose verification is an imperative quality assurance component of the treatment
planning process.
2.1.2. Dose Verification Methods
There are a number of techniques used for dose verification of radiotherapy treatments
employing a variety of dosimeters including ion chambers, thermoluminescent dosimeters
Figure 2.1: A comparison of treatment plan dose maps from Varian for IMRT and Arc
Therapy.[1]

30
(TLDs), radiochromic film, Monte Carlo modelling (computational dosimetry) and gel
dosimetry.
The use of ion chambers is prevalent in radiation oncology as they provide accurate
dosimetric measurements stemming from the well-understood relationship between ionization
and dose. For treatment verification, an array of small ion chambers can be manufactured
allowing a 2D map of the dose to be acquired.[14, 15]
However, this is limited in practice as the
resolution of the array is restricted by the relatively large size of the ion chamber (i.e. ~1 cm
diameter), in addition to issues of high cost and time-consuming data collection.
Like ion chambers, TLDs can be arranged in a water equivalent phantom to produce a 2D
post irradiation dose distribution. Despite being easy to calibrate for quicker measurements,
TLDs are prone to fading responses over time and as with ion chamber arrays are limited to
point by point, low spatial resolution dose recording.[16]
Conversely, radiochromic film provides a continuous 2D dose distribution and is
exceptionally useful in relative dosimetry but despite this, it can be difficult to extract
absolute dose values from the film. It has been shown that a quasi-3D dose distribution can
be obtained by stacking film inserted between slices of a water equivalent phantom material.
Measurements of an IMRT dose distribution using film separated by 1 mm sheets of water
equivalent material had a 98% agreement with treatment planning calculations; however
performing such measurements is very costly using multiple slices of film which cannot be
reused.[17, 18]

31
Monte Carlo (MC) simulations employ random numbers to sample outcomes of stochastic
processes. This allows the simulation of particle transport in a radiation beam by sampling
particle interaction cross-sections. With the development of faster computational systems and
more efficient MC algorithms, the use, accuracy, and versatility of Monte Carlo modelling in
treatment plan verification has increased dramatically.[19, 20]
However, due to the complexity
of IMRT and VMAT treatment plans, excessive computational times are often required to
simulate with adequate accuracy. MC simulations, being computational by nature, do not
provide experimental verification of a treatment, and are unable to capture the myriad issues
unique to a real-world treatment such as positional errors etc..
A theoretical verification of a practical treatment is fundamentally deficient and as such, a
suitable 3D method of verifying dose delivered during complex treatments such as IMRT and
VMAT is desired which can reliably reproduce the dose delivered to a target area cheaply
and quickly. It is considered that radiosensitive gels are an appropriate candidate for this
application.
2.2. Gel Dosimetry
The first step towards the development of gel dosimetry came in 1927 when Hugo Fricke and
Stern Morse created a ferrous sulphate solution which when irradiated would oxidise Fe2+
to
Fe3+
.[21]
This would later become known as the Fricke solution; the basis of the Fricke gel
dosimeters and a chemical dosimetry system still used in primary standards labs due to its
high accuracy. Radiochromic gels for chemical dosimetry of ionizing radiation were reported
in 1951 using spectrophotometer measurements to determine radiation induced colour

32
changes,[22]
but without the advent of digital computers and optical computed tomography,
3D readout was not possible. Modern gel dosimetry started with the suggestion of using
hydrogels to measure dose distributions in 3D by Gore and Kang in 1984, which used
magnetic resonance imaging (MRI) to measure the post-irradiation oxidation of ions in the
Fricke solution.[23]
Gore et al. then proposed that the solution be infused into a gel to record
spatial distribution of radiation doses, initiating a widespread proliferation of research into
gel dosimetry. Since then, research has yielded a variety of gel dosimetry systems, which can
be categorized into three main groups; Fricke (as above),[4, 23-33]
Polymer,[5-8, 34-40]
and
Radiochromic gel dosimeters.[41-47]
2.2.1. Fricke gel dosimeters
Fricke gels are based on adding gelling agents (such as gelatin, agarose or PVA) to the Fricke
solution; an acidic oxygenated aqueous solution of ferrous ion (Fe2+
). The dosimetric basis
of the Fricke solution is provided by the dose dependent transformation of ferrous (Fe2+
) ions
into ferric (Fe3+
) ions.[48]
When the solution is irradiated, water decomposition occurs:
H2O → H• + HO•
Hydrogen atoms produced react with oxygen to produce the hydroperoxy radical:
H• + O2 → HO2•
A number of subsequent reaction pathways lead to the conversion of ferrous to ferric ions, as
below:
Fe2+
+ HO• → Fe3+
+ OH−
Fe2+
+ HO2• → Fe3+
+ HO2−

33
HO2− + H3O
+ → H2O2 + H2O, and
Fe2+
+ H2O2 → Fe3+
+ OH• + OH−
The change in ferric ion concentration is related to the radiation dose by:[48]
Δ[𝐹𝑒3+] =𝐷. 𝐺(𝐹𝑒3+). 10𝜌
𝑁𝐴. 𝑒
Where:
D is the dose,
G (Fe3+
) is the chemical yield of Fe3+
(expressed in ions produced per 100 eV),
ρ is the density in kg L-1
,
NA is Avogadro’s number and
e is the number of Joules per electron volt.
In order for 3D dose measurements to be extrapolated, an effective method of determining
the concentration of ferric ions must be utilized. The first reported systems employed MRI to
detect and quantify ferric ion concentrations within the gel matrix.[23]
Unfortunately, the poor
spatial stability of Fricke gels due to diffusion of Fe3+
ions constrains the permissible time
between irradiation and measurements,[4]
causing the method to be significantly more
difficult for employment by hospital staff. Limited success in reducing diffusion rates is
obtained using different gelling agents (gelatin, agarose, sephadex and polyvinyl-alcohol) and
chelating agents such as xylenol orange, which induces colour changes that permit optical
imaging.[6, 26]

34
Chelators are organic chemicals that form two or more coordination bonds with a central
metal ion. The xylenol orange indicator is well suited for Fricke gel dosimetry, offering a
number of advantages as a method of detecting ferric ions in these dosimeters. As the Fe2+
ion is oxidized into the Fe3+
ion, there is an inherent increase in the electropositivity of the
ion allowing the co-ordination of the Fe3+
ion by the xylenol orange molecule. This results in
an oxidative ring opening/closing, which changes the absorption spectrum of visible light and
an evident colour change at the frequency of visible light.[27-31, 49]
The first major benefit of
this is the allowance of optical computed tomography imaging, eliminating the need for
impractical and expensive MRI equipment. On top of this, they improve the stability of the
spatial dose information by reducing the diffusion coefficients of the iron ions,[32]
which is
one of the main limitations for Fricke gel dosimetry. Best results have been obtained by the
PVA xylenol orange Fricke dosimeters proposed by Chu et al.[24, 25]
Their work reports a
diffusion coefficient of 1.4 × 10⁻³
cm2
h-1
, about one order of magnitude less than that of
conventional Fricke gels and about half of that of the agarose and gelatin gels with chelating
agents.[4]
Thus, with PVA gels the experiment has a 10 hour window in which to probe the
dose distribution.
Fricke gels are attractive for 3D dosimetry as they are easy to prepare and readout, are tissue
equivalent over a very large photon energy range, and give reproducible results.[4]
However,
like other gels used in dosimetry, Fricke gels are sensitive to conditions during preparation,
irradiation and read-out (for example, impurities and temperature).[4]
The chemical yield (G
value) of Fricke solutions is influenced by oxygen, as it is required to produce the
hydroperoxy radical (i.e. G= 15.5 ±0.2 ions/100 eV for a dosimeter in equilibrium with air
and G= 8.2±0.3 for an oxygen-free dosimeter).[33, 48, 50, 51]
The development of more stable
Fricke systems together with the advent of techniques that enable determination of the

35
radiation dose more quickly, clearly indicate that Fricke gel dosimetry has a continuing role
in radiation therapy in the clinic.
2.2.2. Polymer gel dosimeters
Polymer gel dosimeters are another widely researched set of 3D gel dosimeters. They contain
water and gelatin, along with monomers and crosslinkers that polymerize in response to free
radicals generated by water radiolysis.[6]
The first polymer gel dosimeters emerged in 1993 as
Maryanski et al. published two papers reporting investigation of a gel infused with radiation-
sensitive polymers which give rise to an MRI signal after irradiation, and which does not
suffer the diffusion problems of Fricke gel dosimeters.[52, 53]
Subsequently, a variety of
different monomers and crosslinkers have been tested for use in polymer gel dosimeters all of
which operate on a well-understood dosimetric basis (See figure 2.2).[6]
This begins with the
decomposition of reactive intermediates (R•) via radiolysis of water molecules in the gel:
H2O 𝑖𝑟𝑟𝑎𝑑𝑖𝑎𝑡𝑖𝑜𝑛→ 2R•
The radicals initiate the polymerization of monomers (M) by reacting with the monomer. The
initiation step can be written as follows:
R• + M → M1•
The growth of the polymer continues by chain propagation reactions in which the polymeric
radicals react further by adding monomers or bonding via crosslinking groups that are present
on other polymer chains. The general case in which a polymer radical with n monomer units
reacts with a monomer or a dead polymer chain containing m monomer units is shown below:
Mm• + Mn → Mn+m•

36
Termination of the polymerization reaction occurs by the reaction of two radicals by either
combination or disproportionation, or by the reaction of reactive intermediates (R•) with
growing polymer chains.
Figure 2.2: Schematic representation of the interaction between different chemicals in a
polymer gel dosimeter.[8]
The amount of free radicals released during the radiolysis of the water within the gel is
proportional to the dose received by the gel dosimeter. Consequently, the resultant amount of
polymer formed is also proportional to dose until an upper limit is reached. After the upper
dose limit is reached, consumption of monomers results in a saturation effect and the amount
of polymerization plateaus after the optimum range is exceeded.[34]

37
One of the major difficulties encountered by researchers when making polymer gel
dosimeters is oxygen contamination. Oxygen consumes primary free radicals produced by
water radiolysis and inhibits the growth of polymer radicals.[5, 7]
Traditional polymer gel
dosimeters were manufactured in oxygen-free glove boxes to inhibit oxygen contamination.[5]
An innovation on these systems that responded well in normal atmospheric conditions was
the MAGIC gel (Methacrylic and Ascorbic acid in Gelatin Initiated by Copper) developed by
Fong et al.[54]
Contrary to previous polymer gels, the ascorbic acid-metal complex in MAGIC
gels utilised oxygen to generate free radicals which in turn initiated polymerization.
Following this development, most polymer gel dosimeters are ‘normoxic’ dosimeters that are
manufactured in the presence of air. The most recent systems use an oxygen scavenger such
as tetrakis hydroxymethyl phosphonium chloride (THPC) to remove oxygen that is initially
dissolved in the gel solution.[35-37]
Further issues arise when considering the convenience and safety of clinical polymer gel
dosimetry. The monomers required to manufacture polymer gels are extremely hazardous.
Converse to the PVA used in some Fricke gels, acrylamide (which is the most studied due to
practical concerns; namely dose-rate sensitivity and temperature sensitivity) is a neurotoxin
and suspected carcinogen. In some recent dosimetry studies, acrylamide has been replaced
with N–isopropyl acrylamide (NIPAM), which has lower toxicity than acrylamide, is less
likely to be ingested via inhalation due to its lower volatility and is less able to pass through
human skin.[35, 38-40]
Despite this, proper safety precautions (i.e. preparation in a fume hood
and use of gloves and goggles) still need to be used when manufacturing these dosimeters,
complicating their use in a hospital setting or by a non–expert/chemist.
38
Polymer gels have a number of benefits as 3D dose verification tools; they have a good
spatial stability and can easily be read out via several imaging techniques (MRI, Optical CT,
X–ray CT). However, the progress of polymer gel dosimetry is limited by the time
consuming schedule required to take measurements (i.e. post-irradiation development time is
much longer than Fricke gels), the toxicity of monomers used in manufacturing, and the high
oxygen sensitivity (issues B and C).
2.2.3. Other Radiochromic 3D dosimeters
Research into alternate radiochromic 3D dosimeters is a more recent field of study than
polymer or Fricke gels. These dosimeters mostly consist of dyes emulsified in a
hydrogel/polymer matrix. The dye molecules react with free radicals generated by water
radiolysis, changing colour for optical readout. Radiochromic 3D dosimeters are promising
tools within three–dimensional dosimetry since they are easy to make, insensitive to oxygen,
have favourable diffusion rates, and possess good properties for optical readout due to a non-
scattering dose response (unlike polymer type gels). Three promising radiochromic systems
are the Micelle,[41, 42]
PRESAGE,[43, 44]
and Genipin [45-47]
dosimeters, all of which operate by
varying mechanisms. These 3D dosimetry systems are in relative infancy compared to Fricke
or polymer type gels and therefore need further investigation and development before
widespread clinical implementation is possible.
2.2.4. Dose Read-out Methods
Once a gel phantom has been irradiated, an appropriate method is required to extract dose
maps from the induced chemical change in the gel. Three major techniques have been

39
reported successful in this task. The first to be used was MRI, for which a number of gel
compositions presently being evaluated have well understood responses.[5, 23, 32, 35, 52, 53]
Using
a commercial MRI scanner, radiation induced changes in a gel (either oxidation of ferrous
ions in a Fricke gel or polymerization in a PAG gel) can be acquired from a map of the R2
values determined through measurements of the water proton NMR transverse relaxation
time T2 (R2 = 1/T2). Although well researched, the quality of the imaging process is
influenced by several factors, including inconsistencies in temperature, inhomogeneities of
the magnetic field, and the presence of eddy currents.[55-57]
Due to widespread use of MRI
scanners in today’s hospitals and the excessive cost of their operation, justifying the time to
scan gel dosimeters may be difficult for hospital administrators.
X-ray CT has also been investigated for use in scanning polymer gel dosimeters and found as
a viable tool in this capacity. The formation of polymer chains increases the physical density
of the gel, such that the resulting change in attenuation coefficient can be observed by a CT
scanner.[58-60]
Since X-ray CT is such a well-established imaging technique, and nearly all
hospitals practicing radiotherapy have access to a CT scanner, this modality has obvious
advantages. Nevertheless, the process of polymerization has only a small effect on the
attenuation coefficient of the gel yielding low signal to noise ratios (SNRs) in images.
Additionally, the process of taking a CT scan will contribute to the dose in the gel, potentially
voiding the validity of the measurement.[61]
Furthermore, being limited to only polymer gel
measurements eliminates X-ray CT as a feasible modality for read-out of any other gel
dosimeters.

40
Evidently, the aforementioned imaging techniques are quite expensive and their use in a
hospital setting is tightly scheduled to process as many patients as possible. Therefore, a
scanning modality that is independent of normal hospital operations, while having a low cost
to purchase and operate would be optimal for the purpose of gel readout. Optical CT
Scanners match these criteria, exploiting optical density changes in gel dosimeters to obtain
dose maps. Two groups of optical CT scanners have been built; one is based on a single laser
source coupled to a single photodiode detector and the other uses an incoherent broad light
source and a large area detector such as a CCD camera. A number of mechanical
configurations have been designed since the optical CT scanners inception in 1996,[62]
resulting in varying runtimes and image resolutions. Based on availability, the scanner used
in the work of Chapter 4 is the MGS Research IQScan Optical CT Scanner,[63]
a single
laser/photodiode scanning system which required approximately 45 mins to obtain a full 3D
scan with 0.5 mm spatial resolution. The investigations of Chapter 6 utilised a cone
beam/CCD array system; the Vista Optical CT scanner (Modus Medical Devices Inc.,
London, Canada). This system provided a significant reduction in scanner times, taking less
than 5 minutes for 0.5 mm resolution 3D scans.

41
Chapter 3
Optimization of half field penumbra for diffusion
measurements
In the development of new gel dosimeters, several characterisation studies are generally
undertaken, including dose response and stability, manufacturing conditions, calibration
effects and spatial stability.[37, 64-67]
To characterise the rate of diffusion in gel dosimeter
candidates, dose gradients are measured across the edge of a half-blocked field at varying,
post-irradiation intervals. In other words, the experimentally determined diffusion coefficient
is a calculation of the loss of edge sharpness as a function of time after irradiation.[68]
However, when conducting half-field irradiations, it is apparent that scatter from shielding
lead blocks together with beam divergence could contribute to an inherent beam penumbra.
In turn, this penumbra may appear to be diffusion of the dose distribution recorded in a gel.
Thus, to ensure accurate measurements, the width of the penumbra should be minimized.
Across the numerous diffusion studies that have been performed, no consistent irradiation
technique has been used to maximize the sharpness of the half-field edge.[42, 65, 68-73]
And,
although a protocol has been developed which minimizes the effects of initial penumbra,[70]
it
may still be useful to determine how best to produce a half-blocked field using a 6 MV linear
accelerator. This work aims to achieve this by establishing the inherent penumbra shape and
width, for various field-blocking techniques. The work from this chapter has been published
in the Journal of Physics: Conference Series.

42
3.1. Methodology
3.1.1. Half Field Blocking Set-ups
This work involved measurements of the 10-90% beam penumbra from a Varian Clinac 600C
(Varian Medical Systems, Palo Alto, USA) linear accelerator using 20 pieces of EBT2 film.
All irradiations used a 6 MV photon beam with an 11 cm solid water backscatter layer. The
remaining film pieces were evenly separated into two groups to take measurements at 85 cm
and 100 cm SSDs. At each SSD, 100MU were applied for 5 different field-blocking set-ups
with film placed on the surface and at a depth of 4 cm (figure 3.1). The studied techniques of
half-blocking fields were:
1. Upper jaw on the central axis (CAX)
2. Lower jaw on CAX, to provide a reduction in beam divergence from setup 1
3. Lower jaw on CAX, with 10cm lead block placed 1 mm behind light field edge, to clean
up the jaw penumbra
4. 10 cm Lead shield only, as utilised in a number of published diffusion studies[42, 69, 71]
5. Lower jaw on CAX, with 10 cm lead block placed 1 mm over light field edge, so lead
collimates the field and jaw reduces lead transmission and scatter from setup 4.

43
Figure 3.1: A schematic of the five half-field blocking techniques, which were investigated.
3.1.2. Penumbra Measurements
The relative dose to EBT2 film was determined according to the protocol outlined in Kairn et
al.[74]
in order to minimize the effects of film heterogeneity and scanner output variations.
Each piece of irradiated film was scanned before and after irradiation to correct for any film
heterogeneities. To account for overall scanner output variation from one scan to the next, the
ratio of the mean pixel value in an unexposed piece of film was calculated, before and after
the other pieces of film were irradiated. Red channel images for the pre-scan and post- scan
data were obtained and the net optical density change due to dose deposition was calculated.

44
From these corrected images, OD profiles were obtained across the half field dose gradient
using ImageJ. To eliminate noise, a 3-point moving average was applied to each profile. The
penumbra was taken as being 10% from either extent of the range of optical densities covered
by the profile as demonstrated in figure 3.2.
Figure 3.2: A typical noise reduced half-field profile obtained from the EBT2 film. The
penumbra is obtained between points, 10% of the range of OD values from the maximum and
minimum.
3.2. Results and Discussion
Table 3.1 shows the measured 10-90% penumbra (in cm) for the 5 different half-field setups
for SSDs of 85 and 100 cm at both surface and depth. Note that the uncertainty due to
limitations of scanner resolution is ± 0.02 cm for all values.

45
SSD
(cm)
Set-up 1 Set-up 2 Set-up 3 Set-up 4 Set-up 5
Surface Depth Surface Depth Surface Depth Surface Depth Surface Depth
85 0.95 0.67 1.24 0.67 0.56 0.56 0.53 0.53 0.64 0.56
100 1.31 0.71 1.24 0.74 0.99 0.64 0.92 0.53 0.88 0.56
Table 3.1: 10-90% penumbra measurements (cm) for the various half-field blocking set-
ups investigated. The highlighted data points are the most important for analysis as this
depth is where most half-field measurements are performed.
For almost all arrangements, the penumbra at depth is less than that on the surface. This
broadening effect at the surface may be attributed to electron contamination and low-energy,
obliquely-scattered photons which are filtered out within the first couple of cm of water.
Additionally, measurements at the lower SSD of 85 cm all yield lower penumbra widths than
those at the 100 cm SSD. This is clearly a result of beam divergence, widening the field as
distance to the source increases. As almost all measurements involving half-fields are taken at
depth, it is prudent to compare the penumbra widths at depth to evaluate which set-up is best
in practice.
Accordingly, observation of the highlighted cells shows that the blocking systems involving
the lead block (i.e. 3,4, and 5) had clearly lower penumbra widths than those that did not (1
and 2). As beam divergence evidently provides a significant contribution to the penumbra,
these lead blocks act to collimate the divergent photons. Beyond this, set-up 4 provides the
best results for penumbra reduction using lead only with a width of 0.53 ± 0.02 cm. This is
somewhat counterintuitive, as it would seem that the addition of the lower jaw as in system 5,
would reduce lead transmission and scatter therefore minimizing the penumbra. However, the
difference in penumbra width between set-ups 3, 4, and 5 is within the range of the combined

46
uncertainty. Furthermore, this uncertainty cannot account for the inherent noise in OD
profiles of the EBT2 film. Therefore, if further resolution is required for these results, it is
suggested that Monte Carlo measurements should be made to accurately characterize the
penumbra width for these set-ups.
3.3. Conclusions
Measurements of half-field beam penumbra were taken using EBT2 film for a variety of
blocking techniques. It was shown that minimizing the SSD reduces the penumbra as the
effects of beam divergence are diminished. The addition of a lead block directly on the
surface provides optimal results with a 10-90% penumbra of 0.53 ± 0.02 cm. Having attained
this result, subsequent diffusion measurements will incorporate the lead block when
performing the half-field irradiation.

47
Chapter 4
Initial investigations of functionalised PVA in Fricke
dosimeters
Analysing the various existing gel dosimeters, it was decided that the most promising yet still
manipulable system was the Fricke-xylenol orange dosimeter. Unlike other gels, this
dosimeter has no toxic ingredients, while still maintaining a high, linear, dose-rate and energy
independent response with easy read-out via optical CT or MRI. The only drawbacks of the
system are darkening of the gel through auto-oxidation of ferrous ions, limiting the shelf life
after preparation (typically a few days to a week), and the diffusion of dose information
which is detrimental to dosimetric accuracy. A number of additives have been researched in
previous studies to reduce the auto-oxidation effect in Fricke gels.[71, 75]
These efforts have
increased the shelf life to allow use weeks and in some cases over a month after preparation.
The issue of diffusion, however, has yet to be alleviated without adversely impacting other
dosimetric properties of the system.
Prior to this work, the best diffusion results in Fricke gels were obtained by Chu et al. in their
PVA xylenol orange-Fricke dosimeter. Although this system achieved a large reduction in
diffusion, the use of PVA as the gelling agent resulted in difficult gel mixing (due to the high
viscosity of PVA), as well as poor optical properties (as PVA scatters). With this in mind,

48
this work sought to reduce diffusion via a different approach than simply altering the gelling
agent; the incorporation of a functionalised polymer.
As a pilot study for this idea, the work in this chapter aimed to further reduce the diffusion
rates obtained in the PVA xylenol orange-Fricke dosimeter by using simple chemical
synthesis methods to partially or quantitatively bond the xylenol orange compound to the
PVA gel matrix. It was hypothesised that after this modification, the chelating agent (xylenol
orange) would be less able to diffuse through the gel, and dose distributions (measurable by
the colour change of xylenol orange) would be more spatially stable. A number of initial
synthesis experiments were conducted (see Appendix A) which had poor results, however
these lead to the development of a method which partially bound xylenol orange to PVA.
This method was informed by the research of Fan et al. whereby xylenol orange
functionalised silica gel was manufactured using a diazonium compound.[76]
Here, the
method outline by Fan et al. is modified suitably to account for the differing properties of
PVA to silica gel (i.e. molecular weight, solubility, tendency to polymerise etc.). The
synthesis of xylenol orange-functionalised PVA is detailed in this chapter along with a
number of measurements on the resulting gel dosimeter. The work detailed in this chapter has
been published in Medical Physics.

49
4.1. Methods
4.1.1. Xylenol orange functionalised PVA preparation
The process for preparing xylenol orange functionalised PVA is shown in figure 4.1 and was
conducted in accordance with methods described by Fan et al.[76]
Fully hydrolyzed PVA (10
g, molecular weight 89000–98000, Sigma Aldrich, Sydney) was dried under high vacuum for
1 hour at 80 °C to remove any absorbed water. The dried PVA was benzoylated at 50 °C in a
sealed flask under argon with 180 mL of a solution in chloroform containing p–nitrobenzoyl
chloride (6 g, 98%, Aldrich) and triethylamine (6 mL, Aldrich). The reaction was allowed to
run for 48 hours, after which the product (I) was filtered and washed with chloroform (300
mL) under argon, and then dried under vacuum. The dried product (I) was subsequently
mixed with 5% sodium dithionite (240 ml; technical grade, 85%, Aldrich) in a sealed flask
under argon at 45 °C for 24 hours. After filtering, washing with cold water (300 mL), and
drying, the product (II) was diazotized for 1.5 hours at 0–5 ◦C under argon, with aqueous
NaNO2 (400 mL, 2% w/v) in aqueous acetic acid (1% v/v). The resulting diazonium salt (III)
was once again filtered, washed with cold water, and dried. The dried diazonium salt was
mixed with aqueous solution containing xylenol orange (5 g of the disodium salt, in 300 mL
H2O, Aldrich) in a sealed flask at 80 ◦C for 30 minutes. Once a solution was formed, the
vessel was returned to room temperature and allowed to stir for 24 hours. To extract the
xylenol orange functionalised PVA from this solution, ethanol was slowly added to the
mixture while vigorously stirring to form a yellow, fibrous precipitate. This solid phase was
filtered and washed with ethanol and water until the filtrate was clear (showing no
characteristic colour of xylenol orange). The solid was then dried in a lyophiliser for 48 hours
to obtain the xylenol orange functionalised PVA (XO–PVA). The degree of functionalization
achieved using this method is discussed in Section 4.2.5.

50
Figure 4.1: Reaction scheme to produce xylenol orange functionalised PVA.
4.1.2. XO–PVA gel production
The final gel formulation was: XOPVA (20% w/v), sulfuric acid (50 mM) and ferrous
sulfate (0.4 mM). A XOPVA solution (24% w/v) was made in a flask of aqueous sulfuric
acid (50 mM) while being stirred and heated on a hotplate to 65 °C. Once all XOPVA was in
the reaction vessel, the solution was raised to a temperature of 95 °C with a stopper used to

51
minimise evaporation. Meanwhile, a solution containing ferrous sulphate heptahydrate, (2.4
mM Sigma Aldrich, Sydney) in aqueous sulfuric acid (50 mM) was prepared. The XOPVA
was fully dissolved after 3 hours, indicated by a translucent solution, after which the
temperature was dropped to 55 °C. Subsequently, five parts of the XOPVA solution was
mixed with one part of the ferrous sulfate solution to make a final 0.4 mM ferrous ion
concentration in a 20% XOPVA solution. Stirring of this mixture was continued for 30 min
before the gel was poured into 1 cm plastic cuvettes and 4.5 cm diameter PET jars for storage
at 2 °C.
4.1.3. PVAFX hydrogel production
To conduct comparative measurements, the original PVAFX hydrogel was also made using
the method outlined in Chu et al. The gel formulation used had a final concentration of 20%
w/v PVA, 0.4 mM ferrous sulphate and 0.4 mM xylenol orange in 50 mM aqueous sulfuric
acid.
Figure 4.2: Images of half-field irradiated cuvettes (20 Gy) to demonstrate how each gel
appears with and without irradiation. Note that for XO-PVA, the unirradiated gel is darker
yet the contrast achieved post irradiation is lower than PVA-FX gel.
XO-
PVA
Gel
PVA-
FX Gel

52
4.1.4. Dose response measurements
Dose response curves were obtained by irradiating cuvettes, which were placed on top of 11
cm Virtual Water (JRT Associates, Elmsford, USA), covered at a depth of 1.5 cm by Virtual
Water, and positioned between sheets of Virtual Water placed laterally to ensure dose
homogeneity. Irradiations were performed using a 6 MV photon beam from an Elekta Precise
Linac (Elekta, Crawley, UK) and a Varian EX Clinac (Varian Medical Systems, Palo Alto,
USA) with an SSD of 100 cm. For comprehensive dose response measurements of the XO-
PVA gel, cuvettes were irradiated with doses ranging from 0 to 150 Gy. To perform
comparative measurements in the linear region, FX-PVA gel cuvettes were irradiated from 0
to 30 Gy. To maximise signal to noise ratios and scanning resolution, the optical densities
(ODs) of the gels were measured using the green channel of an Epson Perfection V700
flatbed scanner in absorption mode. All OD values were obtained through the 1 cm path
length defined by the cuvette dimensions with an imaging resolution of 266 dpi. The
reference intensity for flatbed scanner measurements were found by performing a blank pre-
scan and measuring the pixel values across the same area as the irradiated gel cuvette.
4.1.5. Reaction rate measurements
One cuvette of each gel was irradiated to 20 Gy using the protocol outline above for the dose
response measurements. The gel samples were scanned at room temperature every 10
minutes from 20 to 100 minutes post-irradiation using the flatbed scanner.
4.1.6. Gel stability measurements
One cuvette of each gel was left un–irradiated and stored at 2 °C, minimising thermal and
optical auto–oxidation. These gel samples were probed every day for 7 days using the flatbed
scanner to determine the gel stability.

53
4.1.7. Diffusion measurements
To perform diffusion measurements, half of each gel container was irradiated with 30 Gy
while the other half was shielded by shutting the lower jaw to the central axis and placing a 3
cm lead block 1 mm over the light field edge; minimising the half field penumbra.[77]
To
ensure a complete diffusion profile could be contained in a single optical CT slice of the jar,
the half field was delivered along the vertical axis of the jar. Read–out of the half–field
irradiated gels was performed with an MGS Research IQScan Optical CT Scanner fitted with
a 1 mW Green Helium–Neon laser (543nm) and operating with a pixel size of 0.5 mm. Using
an empty-tank pre–scan for each gel obtained 2 hours prior to irradiation, 9 OD slices were
reconstructed from 1 – 50 hours after irradiation in order to determine the diffusion
coefficient. The O.D. slices were corrected for the effects of auto-oxidation relative to the 1
hour post-irradiation measurement.
4.2. Results and Discussion
4.2.1. Reaction rate
Figure 4.3 shows the OD of XO-PVA as a function of time after irradiation to 20 Gy. Beyond
the initial development period, the XO-PVA gel shows an increase in OD with time at an
average rate of 0.015 h-1
; a factor of ten times higher than the 0.0015 h-1
obtained by Chu et
al. for the PVA-FX gel. The increase in OD with time during this measurement is primarily
caused by auto-oxidation at room temperature and as demonstrated by Chu et al. is
independent of dose. As seen in figure 4.5, by storing XO-PVA gel samples at 2 °C, there is a
30 fold increase in the stability of the gels (0.00050 h-1
auto oxidation rate). Based on this
measurement, the gel is sufficiently developed for post-irradiation read-out after
approximately 30 mins.

54
Figure 4.3: OD of XO-PVA as a function of time after irradiation to 20 Gy. Note that for this
measurement, the gel was stored at room temperature between scans.
4.2.2. Dose sensitivity
The optical dose response of the XO-PVA gel is displayed in figure 4.4(inset) up to 150 Gy.
A linear response as a function of dose is demonstrated by the gel up to 30 Gy (linearity
quality, r2, in this range is calculated as 0.9978). Additionally, the gel reaches a saturation
point at approximately 60 Gy, similar to many other ferrous sulphate xylenol orange
dosimeters.[4]
The uncertainties displayed in figure 4.4 were calculated by propagating
standard deviations of pre– and post–scan pixel values (from the scanner images) through OD
calculations.

55
Figure 4.4: The response in OD of the XO–PVA and PVA–FX gels in cuvettes to various
levels of dose. The slopes were determined by least-squares linear regression. The plotted
symbols indicate the uncertainty in the data points. Inset: The optical dose response of the
XO-PVA gel until saturation is reached.
Given that the linear range of the XO-PVA gel is approximately from 0 to 30 Gy, a
comparison to FX-PVA in this range is useful. Figure 4.4 shows the optical response of both
gels in the common linear range from 0 to 30 Gy. OD sensitivities and linearity quality (r2)
for 0 to 30 Gy are summarised in table 4.1 along with the optical attenuation coefficient for
each gel (calculating from their respective OD sensitivities).

56
OD sensitivity
(Gy-1
)
Linearity
(r2)
Optical attenuation coefficient
(cm-1
Gy-1
)
XO–PVA 0.014 0.9978 0.032
PVA–FX 0.020 0.9983 0.046
Table 4.1: The OD sensitivity, optical attenuation coefficient, and respective linearity quality
for the XO–PVA and PVA–FX gels.
The dose sensitivity measured with the film scanner in this study for PVA–FX gel (0.020
Gy-1
) is substantially lower than what is measured by Chu et al. for the same gel formulation
using a 543 nm laser and photodiode arrangement (0.046 Gy-1
).[69]
It may be noted that Chu’s
measurements were obtained with a laser wavelength of 543nm; however when measuring
OD with the green channel of the flatbed scanner, there is a range of wavelengths centred at
approximately 532nm. At this lower central wavelength, the absorbance difference between
XO and Ferric-XO is smaller and thus the measured OD sensitivity is lower.[78]
Nevertheless,
this doesn’t limit the scanner’s utility in determining the linearity of the XO–PVA gel’s dose
response or in providing a relative comparison of its sensitivity to the FX–PVA gel.
The measurements in this work showed a 30% reduction in the dose response of the XO–
PVA gel compared to the FX-PVA gel, with an OD dose sensitivity of 0.014 Gy-1
and a
corresponding optical attenuation coefficient of 0.032 cm-1
Gy-1
. Additionally, the dynamic
OD range measured in the linear response region is reduced by 30% from 0.604 for the FX-
PVA gel to 0.415 for the XO-PVA gel. The loss in sensitivity and dynamic range present for
the XO–PVA gel could be attributed to a lower total xylenol orange concentration in the final

57
gel mixture; a consequence of the low degree of PVA functionalisation, whereby any excess
xylenol orange was washed off.
Formation of gel using XO–PVA had a high presence of macroscopic suspended particles (an
image highlighting this is included in figure 4.2). In figure 4.4, this effect is manifest in two
ways: (i) greater uncertainty in OD values stemming from more noise in the XO–PVA gel’s
OD profiles (ii) the initial OD of the XO–PVA is almost three times that of the original
PVA–FX gel. This increased OD has negative implications on the prospect of using the XO–
PVA for larger phantoms as the longer path length will result in extinction of a probing laser
and limit the detection dynamic range.[79]
Despite this, both gels clearly demonstrate a linear
dose response.
4.2.3. Auto–oxidation rates
Figure 4.5 shows OD measurements of the non-irradiated gels are plotted against time.
Uncertainties in the OD values were calculated using the same method as outlined for dose
response measurements. The auto–oxidation rate (h-1
) is taken as the slope of the plot in
figure 4.5.

58
Figure 4.5: The increase in OD of non-irradiated gels as a function of time due to auto–
oxidation. The plotted symbols indicate the uncertainty in the data points.
The OD of unirradiated XO–PVA gel increased by a rate (0.00050 h-1
) ten times greater than
the PVA–FX gel (0.00005 h-1
). The difference between these two values may be attributed to
phase separation of the polymers as the production of XO-PVA produces distinct
hydrophilic/hydrophobic groups that may form microdomains. Regardless, these
measurements of stability indicate that samples of either gel, which are kept refrigerated, can
still be used days or potentially weeks after the gel has been mixed. This is definitely
advantageous, however it must be noted that the increase in background OD when waiting
longer than a few weeks can result in probing laser extinction in large phantoms and reduce
the detection dynamic range.

59
4.2.4. Diffusion rates
To quantify diffusion rates, the standard method outlined by Kron et al. was employed.[70]
Step–shaped OD profiles were collected from the Optical CT slices using ImageJ (figure 4.6).
These diffusion profiles were fit to equation (4.1):
𝑌 = 𝑌0 +1
2(𝑌1 − 𝑌0) [1 +
(𝑋 − 𝑋0)
√(𝑋 − 𝑋0)2 + 𝑛] (4.1)
Where Y is the measured OD at the position X, X0 is the horizontal shift of the inflection
point, Y0 and Y1 are the minimum and maximum values of Y, and n is the curvature
parameter that characterizes the slope of the inflection point.

60
Figure 4.6: Typical OD line profiles taken 1, 3, 6, 23 and 50 hours post-irradiation from the:
A PVA-FX gel and B XO–PVA gel. Part C shows a scaled comparison of the diffusion curves
for both gels at 1 and 6 hours.
61
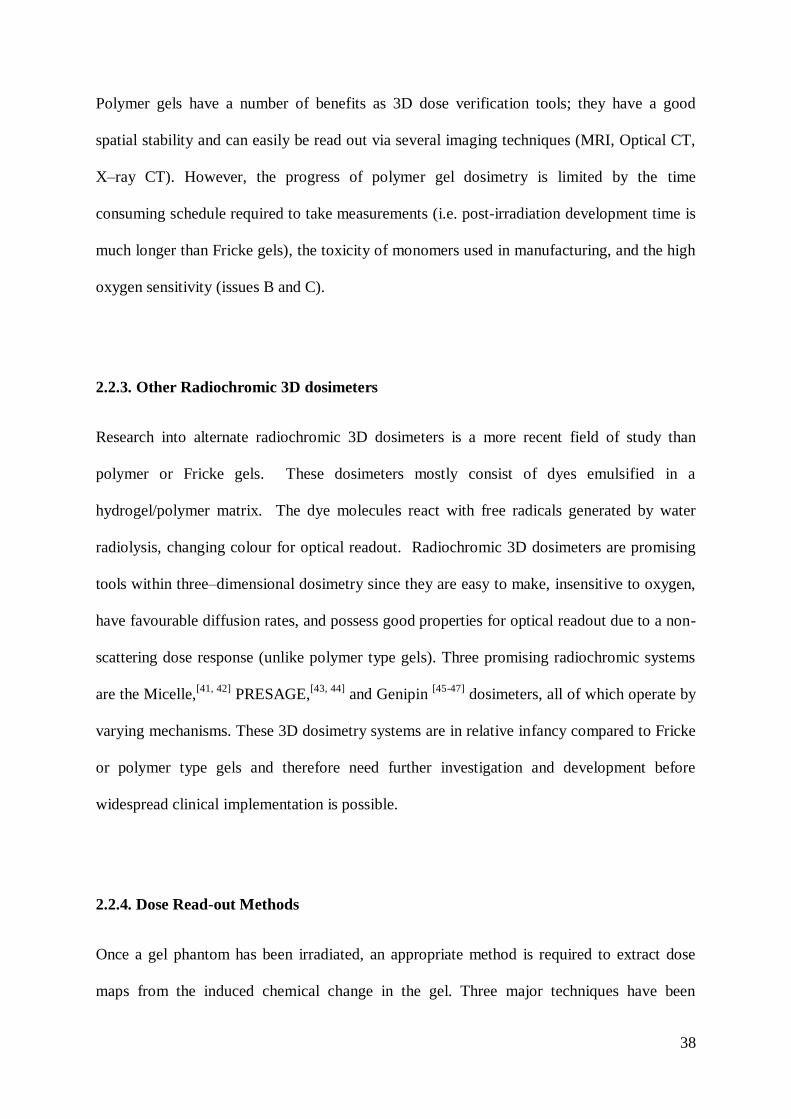
As demonstrated by Kron et al. a plot of n versus time after irradiation is linear (figure 4.7)
and when the factor 0.212 is multiplied by its slope, the diffusion coefficient, D (mm2 h
-1) is
obtained.
Figure 4.7: Plots of the curvature parameter ‘n’ as a function of time for the XO–PVA and
PVA–FX gels. The plotted symbols indicate the uncertainty in the data points.
The diffusion coefficient, measured for the PVA–FX hydrogel matched results reported by
Chu et al., with a value of 0.141 ± 0.002 mm2 h
-1.[69]
The XO–PVA formulation yielded a
diffusion rate of 0.129 ± 0.004 mm2 h
-1. This is an 8% improvement on the existing PVA–FX
gel and is considerably lower than all previously published values ranging from 0.3 to 2.2
mm2 h
-1.[70]
It may be noted here that due to the difficulty associated with a using a 20% PVA
gel, it would be easier to use 10% or 15% PVA, however this would result in a higher
diffusion rate and lessen the improvement made from the XO-PVA.

62
The mechanism governing the decreased diffusion rate in XO–PVA gel is the bonding of
xylenol orange to PVA. The investigated functionalization method has no impact on the
xylenol orange molecules chelation ability as the functionalization site isn’t located near the
carboxylic acid groups responsible for ferric ion trapping. Ferric xylenol orange molecules
bound to the PVA gel matrix are unable to diffuse. However, since the technique used to
synthesise the XO–PVA did not result in high degrees of reporter molecule integration
(compare with Fan et al. which reported bonding of XO on silica gel was 18.26 𝜇mol), there
is inevitably a portion of xylenol orange molecules in the final gel mixture that aren’t bound
to the PVA matrix. Therefore part of the remaining diffusion in this gel can be attributed to
the fraction of xylenol orange molecules, which did not successfully bond to PVA during the
preparation of XO–PVA. To further improve this result, more efficient methods of bonding
xylenol orange to PVA must be explored.
4.2.5. Manufacturing Considerations
The amount of XO-PVA yielded from the method outlined is typically less than 10 grams.
The author notes that when attempting to wash unbound xylenol orange off the final XO-
PVA compound, large PVA molecular clusters can form (with diameters up to approximately
1.5 cm) due to PVA’s strong tendency to aggregate when coming out of solution. Within
these large clusters, unbonded xylenol orange molecules become trapped, which cannot be
removed by simply washing with solvent. To minimise this, a successive
dissolution/precipitation protocol is followed several times, however given the properties of
PVA, there is residual XO present that isn't effectively bonded to the polymer. Because of
this, analytic techniques such as spectroscopic measurements of the eluate and final gel do
not give an accurate indication of the bound/unbound xylenol orange presence in XO-PVA.

63
The same issues do not apply when using silica gel as Fan et al. did;[76]
silica gel precipitates
as small particles that do not have the retention effect that the clusters of PVA do. Therefore
when functionalising the silica gel, the washing process can effectively remove all unbound
XO and their spectroscopic measurements provide an accurate indication of the amount of
bound silica gel.
4.3. Conclusions
This chapter investigated the use of a functionalised polymer to reduce the rate of Fe3+
diffusion in the PVA Fricke hydrogel. Preparing gels using the investigated method of
functionalizing PVA with xylenol orange yields a dosimeter with a linear OD dose response
from 0 to 30 Gy (r2 = 0.9978) with a sensitivity of 0.014 Gy
-1, an auto oxidation rate of
0.0005 h-1
and a diffusion coefficient of 0.129 mm2 h
-1 measured via optical CT. Compared to
the PVA Fricke hydrogel with the same PVA and Ferrous ion concentrations, the XO-PVA
gel suffers a clear reduction in dose sensitivity and dynamic range over the linear dose
response region along with an increased auto oxidation rate. The functionalization method
explored here has produced an 8% reduction in diffusion rate, indicating only a low degree of
xylenol orange integration. Given the added difficulty in manufacturing the gel presented in
this chapter, the improvement in diffusion is not great enough to provide a significant
practical benefit. As such, more efficient functionalization methods must be developed for
this system to gain clinical relevance.

64

65
Chapter 5
Total synthesis of xylenol orange – substituted PVA
The work described in chapter 4 resulted in partial functionalisation of PVA with xylenol
orange and a definite, but limited reduction in diffusion. The next step in the work was to
pursue a lengthier (but more certain) ab initio chemical synthesis to quantitatively produce
the target molecule. The preface of this chapter describes the approach to the synthesis with
Schemes 5.1 and 5.2 providing a visual representation of all novel steps in the synthesis.
Following this, Section 5.1 details the specific methods employed at every step of the
synthesis to xylenol orange – substituted PVA. For each synthesis step, full characterisation
data is listed including 1H NMR,
13C NMR, HR-MS, and FTIR where applicable. The work
presented in this chapter is in preparation for submission to Reactive and Functional
Polymers.
For the synthesis in this chapter, the Huisgen 1, 3-Dipolar Cycloaddition of alkynes and
azides was used – aka the ‘Click’ reaction. ‘Click’ chemistry is a term used to describe a set
of reactions which are reliable, high yielding, simple to perform, and create by-products
which only require simple filtration to be removed. Click reactions have found successful use
in various polymer functionalisations where simple and reliable procedures are required to
eliminate the complications of polymer purification. With such properties, it is an ideal
candidate for bonding the sensitive xylenol orange molecule to PVA.

66
Although this final linking step is relatively simple, the preceding preparation of azide-
functionalised PVA and alkyne-xylenol orange incurs more challenging, less well-
precedented chemistry. Compounds 5.1 to 5.4 are obtained via established literature
methods[80, 81]
and as such their synthesis is not shown in the reaction scheme. Scheme 5.1
shows the developed synthesis route to Alkyne-xylenol orange via modified literature
procedures.[82]
Compound 5.5 is produced by the Mannich condensation of 5.4 and o-
cresol.[80]
A Pd/Cu(I)-catalysed Sonogashira coupling of 5.5 with (trimethylsilyl)acetylene
yields compound 5.6. Subsequently, a TMS deprotection obtains Compound 5.7.
Functionalising the compound with the alkyne group at this point in the synthesis ensures no
interaction of coupling reagents with the free-acid groups present in the final xylenol orange
molecule. Alkyne-xylenol orange 5.8 is then obtained by reacting 5.7 with iminodiacetic acid
and formaldehyde.

67
SCHEME 5.1. Preparation of alkyne-xylenol orange (methods detailed in sections 5.1.2.
to 5.1.9.)
2-azidoethylamine-substituted PVA 5.9 is synthesised similarly to published methods[83]
and
reacted with 5.8 in the presence of the Cu(I)+ catalyst yielding the titular compound 5.10 as
shown in Scheme 5.2. Notably in this step, some excess copper remains bound to 5.10, even

68
after purification by dialysis against EDTA. This is an unavoidable outcome of strong
chelation by xylenol orange and results in significant peak broadening in NMR spectra.
Regardless, the success of the reaction is evident in the removal of azide peak in FTIR
spectra and the addition of triazole proton in 1H NMR.
SCHEME 5.2. Preparation of xylenol orange-substituted PVA (methods detailed in
sections 5.1.10. to 5.1.11.)
5.1. Experimental Section
5.1.1. General
2-Azidoethylamine[84]
was prepared according to literature procedures. All other reagents
were purchased from Sigma Aldrich (Sydney) and used as received. Poly(vinyl alcohol)
(PVA) was purchased with average molecular weight 13000 - 23000 g/mol (degree of
acetylation 98.0 - 98.8 %). All solvents were of analytical quality. Dialysis membrane
(Spectra/Por 1) was selected with MW cut-off of 6000 – 8000 g/mol. 1H NMR experiments

69
were performed on a Varian direct drive spectrometer (AutoX probe), operating at 400 MHz.
13C NMR experiments were performed on a Bruker 600 Advance III D (ATX probe),
operating at 600 MHz. Fourier transform infrared (FTIR) spectra were recorded using a
Nicolet Diamond ATR 5700.
5.1.2. 4-Nitro-2-sulfobenzoic acid (5.1).
A slurry of KMnO4 (150 g, 950 mmols, 3.96 equiv.) in 1.2 L H2O was prepared in a flask. 4-
nitrotoluene-2-sulfonic acid (51.5 g, 240 mmols, 1 equiv.) was dissolved in 300 mL H2O and
added to the flask. A water-cooled condenser was attached and the system was stirred at
reflux overnight. The reaction was cooled on ice and filtered to give a tan solution. The solid
was washed with ~2 L H2O, and the filtrate was subsequently concentrated under vacuum to
give approximately 1 L. The mixture was cooled on ice and acidified with concentrated HCl
until the pH was less than 1. The mixture was heated to dissolve the white precipitate, and
cooled slowly to form crystals. The flask was sealed and stored overnight at 4 °C, the off-
white crystals were filtered, washed with ~50 mL of cold HCl solution (pH – 1) and dried on
a Buchner funnel to give 42.2 g (72%) of 4-nitro-2-sulfobenzoic acid as an off-white solid.
Purity 89% by 1H NMR.
1H NMR: δ (DMSO-d6): 8.47 (1H, d, J = 2.4 Hz); 8.24 (1H, dd, J1 =
8.4 Hz, J2 = 2.4 Hz); 7.70 (1H, d, J = 8.0Hz).
1H NMR Characterisation
Literature compound[81]
Proton Chemical Shift
(ppm)
Multiplicity Coupling constant
(Hz)
1 8.47 d J=2.4
2 8.24 dd J1=8.4, J2=2.4
3 7.70 d J=8.0

70
4-n
itro-2
-sulfo
ben
zoic a
cid (5
.1)
1H N
MR
in D
MS
O - d
6

71
5.1.3. 4-Amino-2-sulfobenzoic acid (5.2).
Compound 5.1 (42.2 g, 173.3 mmols, 1 equiv.) was dissolved in 125 mL of H2O and stirred
in a flask fitted with a reflux condenser. The reaction was heated to boiling and the mixture
became homogenous. 26.7 mL of acetic acid was added followed by Fe (48.7 g, 866.5
mmols, 5 equiv.) in 5 g portions every 10 mins to avoid excess bubbling and ensure mobility
of the magnetic stirring bar. Once the addition was complete, the reaction was refluxed for
one additional hour. The reaction mixture was then transferred to an Erlenmeyer flask, heated
to boiling, and filtered while hot to remove unreacted iron. The solid was washed with
several portions of boiling water (approximately 500 mL total), yielding a pale green filtrate.
This solution was again heated to boiling and filtered through a thin pad of celite® to get a
pale orange solution. The filtrate was concentrated in vacuo, cooled on ice, and acidified with
concentrated HCl until the pH was less than 1 and a yellow precipitate formed. The mixture
was heated to dissolve the precipitate, and cooled slowly. The flask was sealed and stored
overnight at 4 °C, the beige solid was filtered to 8.7 g (24%) of 4-amino-2-sulfobenzoic acid,
pure by 1H NMR.
1H NMR: δ (DMSO-d6): 7.63 (1H, d, J = 8.4 Hz); 7.18 (1H, d, J = 2.0 Hz);
6.65 (1H, d, J = 8.4Hz).
1H NMR Characterisation
Literature compound[81]
Proton Chemical Shift
(ppm)
Multiplicity Coupling constant
(Hz)
1 7.63 d J=8.4
2 7.18 d J=2.0
3 6.65 d J=8.4

72
4-a
min
o-2
-sulfo
ben
zoic a
cid (5
.2)
1H N
MR
in D
MS
O - d
6

73
5.1.4. 4-Iodo-2-sulfobenzoic acid (5.3).
Compound 5.2 (8.7 g, 40.2 mmols, 1 equiv.) was suspended in 80 mL water. Na2CO3 was
added until the pH was 8 (approximately 5 g) and stirring was continued until the solution
was homogenous. This was cooled on ice, before NaNO2 (3.08 g, 45.0 mmols, 1.12 equiv.)
dissolved in 8 mL water was added. After cooling on ice again, HCl (8.7 mL concentrated
HCl diluted in 40 g crushed ice) was added (so the pH~3) and stirring was continued on ice
for 30 minutes. A solution of NaI (7.26 g, 48.2 mmols, 1.2 equiv.) in 8 mL H2O was added
dropwise, the reaction produced gas and went dark. Stirring was maintained for 2 hours on
ice, then 1 hour at room temperature and finally at 50 °C overnight. The following morning,
concentrated HCl was added dropwise until the pH was less than 1. The reaction was
concentrated in vacuo to give a red/orange solid. This was recrystallized from boiling H2O.
The fluffy orange crystals were filtered and washed with ~10 mL of cold HCl solution (pH-1)
to get 6.53 g of 4-iodo-2-sulfobenzoic acid. The mother liquid was concentrated to dryness
and recrystallized again to get an additional 1.07 g (58% yield, total). 1H NMR: δ (DMSO-
d6): 8.07 (1H, d, J = 1.6 Hz); 7.83 (1H, dd, J1 = 8.4 Hz, J2 = 1.6 Hz); 7.38 (1H, d, J = 8.0Hz).
1H NMR Characterisation
Literature compound[81]
Proton Chemical Shift
(ppm)
Multiplicity Coupling constant
(Hz)
1 8.07 d J=1.6
2 7.83 dd J1=8.4, J2=1.6
3 7.38 d J=8.0

74
4-io
do
-2-su
lfob
enzo
ic acid
(5.3
) 1H
NM
R in
DM
SO
- d6

75
5.1.5. 4-Iodo-2-sulfobenzoic anhydride (5.4).
Compound 5.3 (7.6 g, 21.7 mmols, 1 equiv.) was placed in a flask fitted with a water cooled
reflux condenser. Thionyl chloride (15.8 mL, 217 mmols, 10 equiv.) was added and the
mixture was refluxed under Argon overnight. After cooling to room temperature, thionyl
chloride was removed in vacuo. Then toluene (60 mL) was added and stirred while boiling
for one hour. The hot mixture was filtered and washed with ~100 mL of hot toluene. The
filtrate was dried in vacuo to give 1.74 g of 4-iodo-2-sulfobenzoic anhydride as on off-white
solid (26% yield). 1H NMR: δ (CDCl3): 8.34 (1H, s); 8.29 (1H, d, J = 8.0 Hz); 7.84 (1H, dd,
J1 = 8.2 Hz, J2 = 0.6 Hz).
1H NMR Characterisation
Literature compound[80]
Proton Chemical Shift
(ppm)
Multiplicity Coupling constant
(Hz)
1 8.34 s
2 8.29 d J=8.0
3 7.84 dd J1=8.2, J2=0.6

76
4-io
do
-2-su
lfob
enzo
ic an
hyd
ride (5
.4)
1H N
MR
in C
DC
l3

77
5.1.6. 3,3-Bis(4-hydroxy-3-methylphenyl)-5-iodo-3H-benzo[c][1,2]oxathiole 1,1-dioxide
(5.5).
Compound 5.4 (1.74 g, 5.60 mmols, 1 equiv.) and o-cresol (1.21 g, 11.2 mmols, 2 equiv.)
were weighed into a flask. Methanesulfonic acid (11 mL) was added and the mixture was
heated at 90 °C under Argon overnight. After cooling to room temperature, the red solution
was added to a flask of water (70 mL) and filtered. The solid was dissolved in NaOH (35 mL
of a 10% v/v solution) and filtered. The filtrate was carefully acidified with concentrated HCl
until the pH reached 2. A red solid formed which was collected by filtration and dried in
vacuo to give 2.25 g (79% yield). 1H NMR: δ (DMSO-d6): 8.17 (1H, s); 7.71 (1H, d, J = 8.4
Hz); 7.01 (4H, m); 6.75 (1H, d, J = 8.0 Hz); 6.49 (2H, d, J = 9.2 Hz); 1.93 (6H, s). 13
C NMR:
δ (DMSO-d6): 146.46, 138.01, 137.74, 135.95, 135.56, 135.20, 132.42, 129.54, 128.21,
119.62, 95.18, 16.60. HRMS (ESI-TOF) m/z (M-H)- calculated for C21H16O5IS 506.9763,
found 506.9765.

78
1H NMR Characterisation
13C NMR Characterisation
Proton Chemical Shift
(ppm)
Multiplicity Coupling constant
(Hz)
1 8.17 s
2 7.71 d J=8.4
3 6.75 d J=8.0
4 (2H) 6.49 d J=9.2
5 (2H) 7.01 m
6 (2H) 7.01 m
7 (6H) 1.93 s
Carbon Chemical Shift
(ppm)
1 (2C) 16.60
2 (2C) 119.62
3 (2C) 135.56
4 135.95
5 95.18
6 95.18
7 (2C) 129.54
8 128.21
9 (2C) 132.42
10 (2C) 138.01
11 146.46
12 137.74
13 135.20
14 (2C) 129.54

79
3,3
-bis(4
-hyd
roxy
-3-m
ethy
lph
enyl)-5
-iod
o-
3H
-ben
zo[c][1
,2]o
xa
thio
le 1,1
-dio
xid
e (5.5
) 1H
NM
R in
DM
SO
– d
6
80
3,3
-bis(4
-hyd
roxy
-3-m
ethy
lph
enyl)-5
-
iod
o-3
H-b
enzo
[c][1,2
]oxath
iole 1
,1-
dio
xid
e (5.5
) 1
3C N
MR
in D
MS
O –
d6

81
5.1.7. 3,3-Bis(4-hydroxy-3-methylphenyl)-5-((trimethylsilyl)ethynyl)-3H-
benzo[c][1,2]oxathiole 1,1-dioxide (5.6).
Compound 5.5 (1 g, 1.97 mmols, 1 equiv.), Pd(PPH3)2Cl2 (50.7 mg, 0.078 mmols, 0.04
equiv.), and Cu(I) (7.2 mg, 0.038 mmols, 0.02 equiv.) were weighed into a flask and stirred
under argon in dry THF (20 mL) until mostly dissolved. Triethylamine (0.55 mL, 3.94
mmols, 2 equiv.) was added and the solution turned dark and produced gas.
(Trimethylsilyl)Acetylene (0.55 mL, 3.94 mmols, 2 equiv.) was added and the reaction was
stirred overnight at 60 °C under Argon. The flask was cooled to R.T., the solids were filtered
off and the mixture was dried in vacuo. The crude product was purified by silica gel
chromatography using EtOAc/MeOH (v/v 85:15) as eluent. The product was obtained as a
red solid. Yield: 620.3 mg (65.9%). 1H NMR: δ (D2O): 7.81 (1H, s); 7.09 (1H, d, J = 7.6
Hz); 6.81 (4H, m); 6.61 (1H, d, J = 8.0 Hz); 6.36 (2H, d, J = 4.0 Hz); 1.73 (6H, s); 0.16 (9H,
s). 13
C NMR: δ (DMSO-d6): 166.46, 141.56, 138.60, 134.29, 133.21, 132.57, 129.12, 128.88,
126.68, 122.66, 117.63, 103.42, 96.22, 59.53, 15.80, 0.50. HRMS (ESI-TOF) m/z (M-H)-
calculated for C26H25O5SSi 477.1192, found 477.1195.

82
1H NMR Characterisation
13C NMR Characterisation
Proton Chemical Shift
(ppm)
Multiplicity Coupling constant
(Hz)
1 7.81 s
2 7.09 d J=7.6
3 6.61 d J=8.0
4 (2H) 6.36 d J=4.0
5 (2H) 6.81 m
6 (2H) 6.81 m
7 (6H) 1.73 s
8 (2H) 1.87 s
9 (9H) 0.16 s
Carbon Chemical Shift (ppm)
1 (3C) 0.50
2 (2C) 15.80
3 (2C) 134.29
4 103.42
5 96.22
6 (2C) 129.12
7 (2C) 117.63
8 (2C) 133.21
9 (2C) 166.46
10 122.66
11 132.57
12 138.60
13 141.56
14 (2C) 126.68
15 128.88
16 129.43
17 59.53

83
3,3
-bis(4
-hy
dro
xy
-3-m
ethy
lph
eny
l)-5-
((trimeth
ylsily
l)ethyn
yl)-3
H-
ben
zo[c][1
,2]o
xath
iole 1
,1-d
ioxid
e (5.6
) 1H
NM
R in
D2 O

84
3,3
-bis(4
-hyd
roxy
-3-m
ethy
lph
enyl)-5
-
((trimeth
ylsily
l)ethyn
yl)-3
H-
ben
zo[c][1
,2]o
xa
thio
le 1,1
-dio
xid
e (5.6
) 1
3C N
MR
in D
MS
O –
d6

85
5.1.8. 5-Ethynyl-3,3-bis(4-hydroxy-3-methylphenyl)-3H-benzo[c][1,2]oxathiole 1,1-
dioxide (5.7).
Compound 5.6 (620 mg, 1.3 mmols, 1 equiv.) and anhydrous KCO3 (269 mg, 1.95 mmols,
1.5 equiv.) were weighed into a flask and stirred in MeOH (15 mL) overnight. The solution
turned deep purple. The mixture was dried in vacuo before 20 mL of EtOAc:MeOH (v/v
85:15) was added. This was carefully neutralised with concentrated HCl such that the
solution turned orange/yellow and the product dissolved. The mixture was filtered through a
thin pad of celite® and dried in vacuo yielding compound 5.7 as a red/orange solid. Yield:
526.5 mg (100%). 1H NMR: δ (D2O): 7.93 (1H, s); 7.50 (1H, d, J = 8.0 Hz); 7.01 (5H, m);
6.48 (2H, d, J = 8.8 Hz); 3.45 (1H, s); 1.84 (6H, s). 13
C NMR: δ (D2O): 162.24, 142.40,
137.78, 137.30, 136.96, 134.84, 133.27, 131.39, 129.64, 126.40, 123.08, 120.38, 82.01,
80.79, 15.62. HRMS (ESI-TOF) m/z (M-H)- calculated for C23H17O5S 405.0797, found
405.0798.

86
1H NMR Characterisation
13C NMR Characterisation
Proton Chemical Shift
(ppm)
Multiplicity Coupling constant
(Hz)
1 7.93 s
2 7.50 d J=8.0
3 7.01 m
4 (2H) 6.48 d J=8.8
5 (2H) 7.01 m
6 (2H) 7.01 m
7 (6H) 1.84 s
8 3.45 s
Carbon Chemical Shift
(ppm)
1 (2C) 15.62
2 80.79
3 82.01
4 (2C) 120.38
5 123.08
6 (2C) 137.30
7 (2C) 136.96
8 (2C) 129.64
9 (2C) 131.39
10 142.40
11 133.27
12 133.27
13 126.40
14 134.84
15 137.78
16 (2C) 162.24

87
5-eth
yn
yl-3
,3-b
is(4-h
yd
roxy
-3-
meth
ylp
hen
yl)-3
H-b
enzo
[c][1,2
]oxath
iole
1,1
-dio
xid
e (5.7
) 1H
NM
R in
D2 O

88
5-eth
yn
yl-3
,3-b
is(4-h
yd
roxy
-3-
meth
ylp
hen
yl)-3
H-
ben
zo[c][1
,2]o
xath
iole 1
,1-d
ioxid
e (5.7
) 1
3C N
MR
in D
2 O

89
5.1.9. Alkyne-xylenol orange (5.8).
Compound 5.7 (527 mg, 1.3 mmols, 1 equiv.), iminodiacetic acid (690 mg, 5.19 mmols, 4
equiv.), sodium acetate (1.32 g), and formaldehyde (37% Aqueous, 0.61 mL, 7.8 mmols, 6
equiv.) were mixed with 13 mL of glacial acetic acid overnight at 65 °C. All components
were completely dissolved by the next morning. Approximately half the volume was
removed under reduced pressure, the residue was cooled down and precipitated by adding 20
mL EtOH. The precipitate was captured by filtration, washed with EtOH (2 × 20 mL) and
Ether (2 × 20 mL) then air dried. The solid was dissolved in 3 mL of H2O, where after 1 mL
of saturated sodium acetate solution and 100 mL of EtOH was added. After standing for 2
hours, the red liquid was decanted and the residue is mixed with a surplus of EtOH. After
standing overnight, the dark solid was captured with a pad of celite®, washed with EtOH,
flushed through with MeOH and dried yielding 874.6 mg (97%). 1H NMR: δ (D2O): 7.94
(1H, s); 7.54 (1H, d, J = 8.4 Hz); 7.02 (5H, m); 4.02 (4H, s); 3.46 (8H, s); 3.43 (1H, s); 1.83
(6H, s); 1.68 (2H, s). 13
C NMR: δ (D2O): 171.45, 142.71, 140.38, 138.91, 138.18, 133.80,
132.60, 131.17, 130.89, 125.40, 123.41, 121.53, 81.90, 80.57, 57.01, 56.37, 15.83. HRMS
(ESI-TOF) m/z (M-2H)2-
calculated for C33H30O13N2S 347.0734, found 347.0739.

90
1H NMR Characterisation
13C NMR Characterisation
Proton Chemical Shift
(ppm)
Multiplicity Coupling constant
(Hz)
1 7.94 s
2 7.54 d J=8.4
3 7.02 m
4 (4H) 4.02 s
5 (2H) 7.02 m
6 (2H) 7.02 m
7 (6H) 1.83 s
8 (2H) 1.68 s
9 3.43 s
10 (8H) 3.46 s
Carbon Chemical Shift
(ppm)
1 (2C) 15.83
2 (4C) 57.01
3 (2C) 56.37
4 80.59
5 81.89
6 (2C) 130.89
7 (2C) 131.17
8 133.80
9 (2C) 132.60
10 (2C) 125.40
11 (2C) 138.91
12 (2C) 140.38
13 123.41
14 138.18
15 138.92
16 140.38
17 142.71
18 121.53
19 171.44

91
Alk
yn
e-xy
leno
l ora
ng
e (5.8
) 1H
NM
R in
D2 O

92
Alk
yn
e-xy
lenol o
ran
ge (5
.8)
13C
NM
R in
D2 O

93
5.1.10. 2-Azidoethylamine-substituted PVA (5.9).
PVA (4g, 90 mmols of hydroxyl groups, 1 equiv.) was weighed into an oven dried flask, and
purged with Argon. 80 mL of dry DMSO was added and the flask was heated and stirred until
all PVA was dissolved. 1,1’-Carbonyldiimidazole (7.304 g, 45 mmols, 0.5 equiv.) was added
all in one portion and stirring was continued for 45 minutes under Argon at room
temperature. 2-Azidoethylamine (1.161 g, 13.5 mmols, 0.15 equiv.) was dissolved in 8 mL
dry DMSO and added to the reaction. Stirring was continued overnight at room temperature
under Argon. Afterwards, 40 mL of concentrated aqueous NH3 was added and the mixture
was stirred for 1 hour at room temperature. 400 mL of H2O was added to dilute the mixture
and it was filtered until clear. The volume was reduced to approximately 90 mL under
reduced pressure. The polymer was precipitated from the residual DMSO by dropwise
addition to a vigorously stirred solution of EtOH (1 L). Remaining impurities were removed
by a successive dissolution-precipitation protocol. The polymer was freeze dried giving a
white solid. Yield: 4.27 g (95%), DS: 0.032. 1H NMR: δ (D2O): 4.77 ((DS × 1)H, m,
partially overlapped with H2O signal); 4.00-3.50 (1H, m); 3.20-3.10 ((DS × 4)H, 2×m); 2.00-
1.20 (4H, m). 13
C NMR: δ (D2O): 159.22, 70.25, 68.05-64.05, 50.57, 44.80-44.00. FTIR –
N=N=N stretch band – 2100 cm-1
.

94
1H NMR Characterisation
Literature compound[74]
13C NMR characterisation
FTIR
N=N=N stretch band – 2100 cm-1
Proton Chemical Shift
(ppm)
Multiplicity
1 ((DS×1)H 4.77 m
2 (4H) 2.00-1.20 m
3 4.00-3.50 m
4 ((DS×2)H) 3.20-3.10 m
5 ((DS×2)H) 3.20-3.10 m
Carbon Chemical Shift
(ppm)
1 (2C) 44.80-44.00
2 68.05-64.05
3 ((DS×1)H) 70.25
4 ((DS×1)H) 159.22
5 ((DS×1)H) 50.57
6 ((DS×1)H) 50.57

95
2-a
zidoeth
yla
min
e-su
bstitu
ted P
VA
(5.9
) 1H
NM
R in
D2 O

96
2-a
zidoeth
yla
min
e-sub
stituted
PV
A (5
.9)
13C
NM
R in
D2 O

97
5.1.11. Xylenol orange-substituted PVA (5.10).
2-Azidoethylamine-substituted PVA (645 mg, 0.43 mmols of substituted groups, 0.33 equiv.)
was dissolved in 8 mL H2O. Alkyne-xylenol orange (904 mg, 1.30 mmols, 1 equiv.) was
dissolved in 8 mL H2O and added. Sodium ascorbate (1.54 g, 7.79 mmols, 6 equiv.) followed
by copper (II) sulphate pentahydrate (389 mg, 1.56 mmols, 1.2 equiv.) were then dissolved in
H2O and added. The mixture was stirred overnight. Subsequently, the reaction mixture was
dialyzed against EDTA in water for 24 hours, then against water for another 48 hours,
changing and screening the filtrate every 12 hours until the filtrate showed no sign of
unbound xylenol orange by 1H NMR. The dialyzed solution was subsequently freeze dried
yielding a flaky purple solid 837 mg (88% yield). 1H NMR: δ (D2O): 8.21 ((DS × 1)H,
broadened signal); 7.90-6.20 ((DS×1)H, broadened m); 4.00-3.40 (1H, broadened signal);
3.20-3.00 ((DS × 4)H, broadened signal); 2.00-0.70 (4H, broadened signal). 13
C NMR: δ
(D2O): 68.44-63.93, 45.08-40.45, remaining signals unresolvable due to low signal to noise
even with saturated NMR sample. FTIR – Removal of N=N=N stretch band – 2100 cm-1
.

98
1H NMR Characterisation
13C NMR Characterisation
FTIR
Removal of N=N=N stretch band – 2100 cm-1
Proton Chemical Shift
(ppm)
Multiplicity
1 ((DS×1)H Under H2O
2 (4H) 2.00-0.70 Broad s
3 4.00-3.40 Broad s
4 ((DS×2)H) 3.20-3.00 Broad s
5 ((DS×2)H) 3.20-3.00 Broad s
6 ((DS×1)H 8.21 Broad s
R – Xylenol
Orange
7.90-6.20 Broad m
Carbon Chemical Shift
(ppm)
1 (2C) 45.08-40.45
2 68.44-63.93
3 ((DS×1)H) Signal to Noise
is too low to
determine 13C
shifts, even with
a saturated
solution of the
analyte.
4 ((DS×1)H)
5 ((DS×1)H)
6 ((DS×1)H)
7 ((DS×1)H)
8 ((DS×1)H)
R – Xylenol
Orange

99
Xylen
ol o
ran
ge-su
bstitu
ted P
VA
(5.1
0)
1H N
MR
in D
2 O

100
Xylen
ol o
ran
ge-su
bstitu
ted P
VA
(5.1
0)
13C
NM
R in
D2 O

101
5.2. Conclusions
The synthesis presented in this chapter, provides a means of covalently bonding xylenol
orange to PVA which involves minimal chromatography and high yields for most steps.
Modifications to published synthesis methods were applied to obtain alkyne-xylenol orange
5.8 (Scheme 5.1). An azide-functionalised PVA 5.9 was produced and reacted with 5.8
through the Cu(I) catalysed Huisgen [3 + 2] cycloaddition defined as a ‘click’ reaction
(Scheme 5.2). All compounds throughout the synthesis have been confirmed via NMR along
with HR-MS and/or FTIR analysis. Purification of the final compound by dialysis confirmed
that no unbound xylenol orange remains in the product and thus the compound is ready to be
integrated into a gel dosimetry system.

102

103
Chapter 6
Characterisation of xylenol orange substituted –
PVA based gel dosimeter
With the production of xylenol orange substituted –PVA in Chapter 5, the final investigation
of this work was to incorporate this molecule into a Fricke gel dosimeter. Here, unlike the
measurements in Chapter 4, a number of gel formulations were investigated to determine the
optimal gelling agent, the optimal ferrous sulphate/xylenol orange concentration, and the
effects of glyoxal, an additive which has been shown to have positive impacts on dosimetric
properties of Fricke gels.[71, 75]
This optimized gel then had a number of extra characterisation
measurements performed on it to further highlight its viability as a dosimeter. The results
presented here in Chapter 6 represent the final product of this research and is in preparation
for submission to Medical Physics.
6.1. Methods
6.1.1. Xylenol Orange – Substituted PVA
Poly(vinyl alcohol) was functionalised with xylenol orange according to the Cu(I) catalysed
Huisgen [3+2] cycloaddition of alkyne-xylenol Orange and 2-azidoethylamine-substituted
PVA outlined in Chapter 5. The degree of substitution (DS) based on NMR data is estimated
to be 0.032 (i.e. 1 in 31 hydroxyl groups modified). Accordingly, the effective molecular
weight of the polymer for each xylenol orange molecule is 2189 g/mol.

104
Figure 6.1: Xylenol orange – substituted PVA structure.[86]
6.1.2. Inter-comparison of formulations
A variety of gel dosimeter formulations incorporating xylenol orange – substituted PVA were
investigated to optimise dose sensitivity, auto-oxidation, diffusion of dose information, and
general practicality. Impacts of the bifunctional crosslinking agent, glyoxal were also
investigated due to successful results in gelatin based Fricke gels from published
investigations.[71, 75]
The various prepared gels are listed in table 6.1. Once an optimal
formulation was identified, a more in depth characterisation of its dosimetric properties and
practical use was conducted.

105
Formulation Gel
agent
Xylenol orange – substituted PVA
and Fe(SO4)2 concentration [87]
Concentration
of gel agent
(w/v)
Additive
1 Gelatin 0.4 10 -
2 Gelatin 0.4 10 Gyloxal (10mM)
3 PVA 0.4 10 -
4 PVA 0.4 20 -
5 Gelatin 0.2 10 Gyloxal (10mM)
6 Gelatin 0.1 10 Gyloxal (10mM)
Table 6.1: Summary of gel dosimeters incorporating xylenol orange – substituted PVA.
6.1.3. Gel Production
Xylenol orange – substituted PVA (0.1 – 0.4 mM, based on effective MW of 2189 g/mol)
was mixed in a flask of aqueous sulfuric acid (50 mM) while being stirred and heated on a
hotplate at 55 °C. Once this was dissolved the appropriate gelling agent was added and
dissolved.
For formulations 1, 2, 5, and 6, porcine gelatin (10% w/v, 300 bloom, Sigma Aldrich,
Sydney) was added and stirred at 55 °C until dissolved. Upon dissolution, the gel
turned dark due to an increase in the pH of the mixture. Concentrated sulfuric acid
was added dropwise until the pH was 1 – 1.5.
For formulations 3 and 4, PVA (10% and 20% w/v respectively, fully hydrolysed,
MW 89000–98000, Sigma Aldrich, Sydney) was slowly added and stirred at 95 °C,
which took approximately 3 hours.

106
Subsequently, the temperature was reduced to approximately 40 °C and ferrous sulphate
heptahydrate (0.1 – 0.4 mM, Sigma Aldrich, Sydney) dissolved in 50 mM sulfuric acid was
added. Stirring was continued for 20 mins before gel formulations 1, 3, and 4 were poured
into 1 cm plastic cuvettes. For gel formulations 2, 5, and 6, glyoxal (10 mM, 40% w/v in
H2O, Sigma Aldrich, Sydney) was added and stirring was continued for another 10 mins
before the mixture was poured into 1 cm plastic cuvettes. Gel cuvettes were stored at 2 °C.
6.1.4. Dose response measurements
Dose response curves were obtained by irradiating cuvettes, which were placed on top of 9
cm Solid Water, covered at a depth of 1 cm by Bolus and Solid Water. Irradiations were
performed using a 6 MV photon beam from a Varian EX Clinac (Varian Medical Systems,
Palo Alto, USA) with an SSD of 100 cm and a dose rate of 600 MU/min. For comprehensive
dose response measurements of the optimised gel, cuvettes were irradiated with 0 to 107 Gy.
To perform comparative measurements of the various formulations, gel cuvettes were
irradiated from 0 to 32 Gy. To maximise signal to noise ratios and scanning resolution, the
optical densities (ODs) of the gels were measured using the green channel of an Epson
Perfection V700 flatbed scanner (as performed in Chapter 4).[84]
All OD values were obtained
through the 1 cm path length defined by the cuvette dimensions with an imaging resolution of
600 dpi. The reference intensity for flatbed scanner measurements were found by performing
a blank pre-scan and measuring the pixel values across the same area as the irradiated gel
cuvette.

107
6.1.5. Auto–oxidation measurements
One cuvette of each gel was left un–irradiated and stored at 2 °C, minimising thermal and
optical auto–oxidation. These gel samples were probed at frequent intervals over 7 days using
the flatbed scanner to determine the gel stability.
6.1.6. Diffusion measurements
To perform diffusion measurements, half of each gel cuvette was irradiated with 30 Gy while
the other half was shielded by shutting the lower jaw to the central axis and placing a 5 cm
lead block 1 mm over the light field edge; minimising the half field penumbra.[77]
Read–out
of the half–field irradiated gels was performed with the flatbed scanner, obtaining diffusion
profiles from 1 – 105 hours after irradiation. O.D. profiles of the diffusion cuvettes were
collected with ImageJ and auto-oxidation effects were subtracted from each profile relative to
the 1 hour post-irradiation measurement. Using least squares regression, the data was fit to an
approximation of the complementary error function.[70]
Following the methods detailed by
Kron et al., the gradient of a plot of the curvature parameter (n, mm2) against time (t, h
-1) was
determined in order to calculate the diffusion coefficient (D, mm2
h-1
)[70]
:
𝐷 = (√43− 1
4 × ln 2)𝑛
𝑡= 0.212
𝑛
𝑡 (5.1)
6.1.7. Further Dosimetric Characterisation of Optimal Formulation
Upon identification of the optimal formula, a more in depth characterisation of the gel
dosimeter was performed. For reaction rate measurements, one cuvette was irradiated to 20
Gy using the protocol outlined above for the dose response measurements. The irradiated

108
cuvette was scanned at room temperature every 10 minutes from 10 to 70 minutes post-
irradiation using the flatbed scanner.
To determine the effects of varying dose rate and beam energy on the dose response, two sets
of cuvettes were irradiated using the protocol outlined for dose response measurements with a
10 MV photon beam and dose rate of 600 MU/min as well as with a 6 MV photon beam and
dose rate of 400 MU/min. Both gel cuvette sets were irradiated from 0 to 32 Gy. Post-scans
were performed with the flatbed scanner to obtain comparative dose response curves.
6.1.8. Three-dimensional measurements
To ensure the utility of the gel for three-dimensional dosimetry, a measurement was
performed on a 375 mL PET jar containing the gel. The jar was irradiated with a 6 MV
photon beam with an SSD of 100 cm and a dose rate of 600 MU/min. The jar received a dose
of approximately 13 Gy in a 3 × 3 cm beam, horizontally through the centre of the jar.
Readout was performed using a Vista optical CT scanner (Modus Medical Devices Inc.,
London, Canada), with an amber LED source (λ = 590 nm) and a pixel size of 0.5 mm.
6.1.9. Gel Reusability
The jar of gel used for 3D measurements was reused and the variation in its dose response
was evaluated. To ensure uniformity of Fe3+
concentration throughout the gel, the jar was
submerged in a bath of warm water at a temperature of approximately 40 °C for 10 minutes.
Subsequently, a stirring bar was added to the mixture and stirring was continued for 10
minutes until the colour of the gel was completely uniform. The gel was then poured into 10
plastic cuvettes for a dose response evaluation and the remainder was kept in the PET jar to

109
evaluate the utility of the reused gel for 3D measurements. The dose response was evaluated
using an identical method as outlined above for previous dose response measurements. The
PET jar was irradiated and read out according to the protocol for 3D measurements detailed
above.
6.2. Results
6.2.1. Dose response comparison
The dose response of the six gel formulations was evaluated across the typical linear range of
Fricke gel dosimeters.[4, 88]
Figure 6.2 displays a comparison of the dose response of all gel
formulations from 0 to 32 Gy as measured with the flatbed scanner. As has been previously
demonstrated,[89]
a reduction in the observed sensitivity is to be expected when using the
broad spectrum of the flatbed scanner as opposed to the narrow wavelength conditions widely
adopted for optical gel read–out, however this measurement technique is effective at
determining the response linearity and providing a two-dimensional O.D. readout of gel
cuvettes. The uncertainties displayed in figure 6.2 were calculated by propagating standard
deviations of pre– and post–scan pixel values (from the scanner images) through OD
calculations.

110
Figure 6.2: Dose response comparison of the six gel formulations from 0 to 32 Gy measured
using the green channel of an Epson Perfection V700 flatbed scanner in absorption mode.
The slopes were determined by least-squares linear regression. The plotted symbols indicate
the uncertainty in the data points.
O.D. sensitivities and linearity quality (r2) for the dose range 0 to 32 Gy are summarized in
table 6.2 along with the background/baseline optical density for each gel. All gel
formulations gave linear responses within the range tested, matching expectations based on
literature understandings of Fricke gels.[4, 88]
Gels containing PVA as the gelling agent
(formulation 3 and 4), showed significantly lower dose responses than the other formulations
containing gelatin. Additionally, the background O.D. of the PVA gels is much higher than
all other gel formulations. Comparing formulations 1 and 2, it is evident that the addition of
glyoxal results in a small increase in O.D. sensitivity and a small decrease in the background
O.D. of the gel. Based on the results of formulations 2, 5, and 6, reducing the concentration
of xylenol orange - substituted PVA and Fe(SO4)2 significantly reduces the background O.D.
of the gel while maintaining only a small reduction in O.D. sensitivity of the gel. Due to its
H ello……is it me you’re looking fo r?

111
increase in O.D. sensitivity relative to background O.D., it is apparent that formulation 6 has
the optimal dose response properties of the gels compared.
Formulation O.D. sensitivity
(Gy-1
)
Linearity
(r2)
Background O.D.
1 0.0034 0.9963 0.4850
2 0.0035 0.9880 0.4839
3 0.0017 0.9964 0.5830
4 0.0012 0.9991 0.6092
5 0.0033 0.9984 0.3732
6 0.0031 0.9983 0.2592
Table 6.2: The O.D. sensitivity, background O.D., and respective
linearity quality for all gel formulations.
6.2.2. Auto-oxidation comparison
Figure 6.3 shows O.D. measurements of the non-irradiated gels plotted against time.
Uncertainties in the OD values were calculated using the same method as outlined for dose
response measurements.

112
Figure 6.3: The increase in O.D. of the six gel formulations as a function of time due to auto–
oxidation. The plotted symbols indicate the uncertainty in the data points.
The auto–oxidation rate (h-1) is taken as the slope of the plot in figure 6.3. The highest auto-
oxidation rates are present in gels with higher concentrations of xylenol orange - substituted
PVA and Fe(SO4)2 (0.4 mM), as formulations 1 to 4 have auto-oxidation rates of 0.00134 h
-1,
0.00118 h-1
, 0.00115 h-1
, and 0.00123 h-1
respectively. As this concentration reduces in
formulations 5 (0.2 mM) and 6 (0.1 mM), so too does the auto-oxidation rate with values of
0.00058 h-1
and 0.00023 h-1
respectively. Evidently, auto-oxidation is minimized by
formulation 6.
6.2.3. Diffusion rate comparison
The methods outlined for diffusion measurements were carried out for all six gel
formulations, however formulation 3 (i.e. 10% PVA gelling agent) failed to set and as such
diffusion results are not displayed for this mixture. Figure 6.4 shows the plot of the curvature

113
parameter (n) against time (t) for gel formulations 1, 2, 5, and 6 over the period 1 to 105
hours. Data for formulation 4 is only displayed over 50 hours due to limitations arising from
the enhanced effects of auto-oxidation and scatter in this gel. After 50 hours, the effects of
auto-oxidation in formulation 4, relative to its low dose response, result in a small O.D.
variation between the irradiated and unirradiated sections of the gel cuvette. Additionally, the
increased scatter in PVA gels results in a greater uncertainty in the measured O.D. across the
cuvette particularly as the gel gets darker from effects such as auto-oxidation. Combining
these effects, the diffusion profile becomes inefficiently resolvable relative to noise and
measurements of the curvature parameter yield inaccurate results.
Figure 6.4: Plots of the curvature parameter ‘n’ as a function of time for the various gel
formulations. Inset: Curvature parameter ‘n’ plotted for the first 10 hours post-irradiation.

114
The lowest diffusion rate measured across the various gels was 0.103 ± 0.004 mm2 h
-1 for
formulation 4 (i.e. 20% PVA). This measurement was the only one taken for the reduced
period of 50 hours, and despite this diffusion rate being very low, its dosimetric utility is
greatly hindered for the aforementioned reasons. Of the remaining formulations, the gel with
the highest diffusion rate is formulation 1 (i.e. 10% gelatin) with a diffusion rate of 0.239 ±
0.002 mm2 h
-1. The addition of glyoxal in formulation 2, resulted in a 21% reduction in
diffusion with D2 = 0.190 ± 0.002 mm2 h
-1. Similarly to dose response and auto-oxidation
results, the best results were obtained with lower concentrations of xylenol orange -
substituted PVA and Fe(SO4)2; formulation 5 (0.2 mM) yielded a diffusion rate of 0.146 ±
0.001 mm2 h
-1 and formulation 6 had a diffusion rate of 0.132 ± 0.001 mm
2 h
-1.
6.2.4. Characterisation of Optimal Formula
As demonstrated in the comparative results, formulation 6 optimizes the practicality of the
gel for clinical use as an easy to produce gel with the lowest auto-oxidation rate, best
response relative to background optical density and the lowest diffusion rate of all gelatin
based gels. To further investigate its viability for clinical application, a more in depth
characterisation of its dosimetric properties was conducted
6.2.4.1. Dose response beyond linear range
Figure 6.5 displays the dose response of gel formulation 6 from 0 to 107 Gy as measured with
the flatbed scanner. The linear range of the gel doesn’t exceed the measured linear range in
figure 6.2 (i.e. 0 to 32 Gy), in alignment with published investigations into Fricke gel dose
responses.[4, 88]
Unlike other ferrous sulphate xylenol orange dosimeters which have been

115
published as reaching a saturation point at much lower doses,[4, 69, 88, 89]
the saturation point of
the formulation 6 is not reached by the maximum dose of 107 Gy, however this is well
outside the range of common treatment doses and is therefore not of concern to clinical
dosimetry. Figure 6.5 also acts to demonstrates that formulation 6 is capable of resolving
single grey doses.
Figure 6.5: The optical dose response of gel formulation 6 beyond the linear response range
from 0 – 107 Gy. The plotted symbols indicate the uncertainty in the data points. Inset:
Optical dose response highlighted for the 0 to 10 Gy range.
6.2.4.2. Reaction Rate
Figure 6.6 shows the increase in O.D. of formulation 6 over time, immediately after
irradiation to 20 Gy. These measurements were performed without any refrigeration of the

116
irradiated gels, due to the small time between measurements. The average O.D. increase as a
function of time across this period is 0.00257 h-1
and is primarily caused by room temperature
auto-oxidation. Compared to the data obtained from figure 6.4, where gel samples are stored
at 2 °C between measurements (0.00023 h-1
auto-oxidation rate), the O.D. stability of
formulation 6 stored at room temperature is approximately 11 times lower. Figure 6.6
demonstrates that gel formulation 6 is sufficiently developed for read-out approximately 30
mins after irradiation.
Figure 6.6: O.D. of formulation 6 as a function of time after irradiation to 20 Gy.

117
6.2.4.3. Energy and dose rate dependence
A comparison of dose responses of formulation 6 from 0 to 32 Gy for varying beam energy
(6 MV vs 10 MV) and dose rate (400 MU/min and 600 MU/min) is plotted in figure 6.7 to
evaluate the dependence of the gels dose response on these beam parameters. Regardless of
dose rate or beam energy, all dose response curves show good linearity r2 > 0.998, however
discrepancies do exist among measured O.D. sensitivities when varying these irradiation
parameters. Maintaining a constant dose rate of 600 MU/min, while altering the beam energy
from 6 MV (O.D. sensitivity: 0.0031 Gy-1
) to 10 MV (O.D. sensitivity: 0.0023 Gy-1
) reduces
the measured dose sensitivity by approximately 26%. Keeping the beam energy consistent at
6 MV, while changing the dose rate from 600 MU/min (O.D. sensitivity: 0.0031 Gy-1
) to 400
MU/min (O.D. sensitivity: 0.0029 Gy-1
) has less impact, yet still reduces the average
sensitivity over the measured range by 6%. For the varying dose rate measurements, all data
points in the range 0 – 16 Gy have overlapping results, however as the dose increases, the
effects of altering dose rate become more prominent until a distinct separation is evident. It is
clear that some energy and dose rate dependence is present in the response of formulation 6.

118
Figure 6.7: O.D. Response of gel formulation 6 from 0 to 32 Gy comparing 6 MV and 10 MV
beam energies along with dose rates of 400 MU/min and 600 MU/min.
6.2.4.5. Three-dimensional measurements
Qualitative measurements using a jar of gel formulation 6 irradiated with a simple 3 cm × 3
cm beam provide some clarity on how the gel appears in a 3D environment. Figure 6.8 shows
transmission images of the gel taken 1 hour after irradiation. The beam generates a strong,
clearly visible colour change with well-defined field edges.

119
Figure 6.8: Transmission images taken in the Vista Optical CT scanner of jars filled with gel
formulation F irradiated with approximately 13 Gy in a 3 × 3 cm beam. Images taken in
planes perpendicular (A) and parallel (B) to the beam direction. The dashed line indicates
the region in which slices are displayed in figures 6.9 and 6.11.
After reconstruction of optical CT scans, cross beam slices of orthogonal dose planes through
the isocentre were collected and are displayed in figure 6.9. These images give an excellent
indication of the results obtainable using formulation 6 for 3D measurements. An additional
scan of the irradiated gel was taken the following day, 18 hours after irradiation. Comparing
slices across this time difference shows relatively low diffusion with minimal loss in dose
information despite being measured well outside the recommended time period (1.5 hours)
for post-irradiation read-out of commercially available gelatin based Fricke gels.[90]
A B

120
Figure 6.9: Cross-beam slices from reconstructed 3D scans of gel formulation 6 taken 1 hour
and 18 hours after irradiation along with corresponding dose profiles taken through these
slices. The location of each slice is indicated by the dashed line as in figure 6.8. The location
of the profiles is indicated by the solid lines.
6.2.4.6. Gel Reusability
The dose response of the reused gel is compared against that of a new batch from 0 to 32 Gy
in figure 6.10. The reused gel has a 14% increase in its baseline O.D. from 0.2596 to 0.2963.
This increase is due to thermal auto-oxidation of Fe2+
ions when melting and resetting the gel,
1 h
ou
r p
ost
irr
ad
iati
on
18 h
ou
r p
ost
irr
ad
iati
on

121
along with the dose information from the previous irradiation which has become uniformly
distributed through the gel following the reuse procedure. The response of the reused gel
remains linear in the dose range tested with r2 = 0.9982. Comparing the dose sensitivity of the
two gels reveals a small difference, as the response of the reused gel (O.D. sensitivity: 0.0028
Gy-1
) is 10 % lower than the new gel (O.D. sensitivity: 0.0031 Gy-1
).
Figure 6.10: O.D. Response of gel formulation 6 from 0 to 32 Gy comparing fresh gel and gel
reused by melting, stirring and resetting.
Orthogonal cross beam slices taken from 3D measurements of the reused gel irradiated with a
3 cm × 3 cm beam are displayed in figure 6.11. The slice location and measurement
procedure is identical to that used for the results in figures 6.8 and 6.9. Similarly to the 3D
measurements of a new batch of gel, the reused data gives a distinct O.D. change detectable
by the optical C.T. scanner, even with the 10 % reduction in O.D. sensitivity. Once again,

122
comparison of these slices 1 and 18 hours after irradiation shows a minimal loss in dose
information.
Figure 6.11: Cross-beam slices from reconstructed 3D scans of reused gel formulation 6
taken 1 hour and 18 hours after irradiation along with corresponding dose profiles taken
through these slices. The location of each slice is indicated by the dashed lines as in figure
6.8. The location of the profiles is indicated by the solid lines.
1 h
ou
r p
ost
irr
ad
iati
on
18 h
ou
r p
ost
irr
ad
iati
on

123
6.3. Discussion
6.3.1. Practical considerations and effects of gelling agent
It is well established that the gel forming material has a significant impact on the properties
of the 3D Fricke dosimeter. In this study, the use of PVA as opposed to Gelatin results in a
significant reduction in O.D. sensitivity as well as an increase in background O.D. (table 6.2).
As suggested by Hill et al., one possible reason for the reduction in dose sensitivity may be
that the excessive boiling time required to dissolve the PVA reduces the amount of dissolved
O2 in the final gel, in turn reducing the dose response.[25]
Another reason for the reduction in
sensitivity, which is unique to the system investigated here, stems from the incorporation of
xylenol orange – substituted PVA into the PVA gel matrix. As the functionalised molecules
crosslink with the rest of the gel matrix, the effective molecule size increases dramatically.
With this increased molecule size, alterations in the charge distributions become present
which can have adverse effects on xylenol orange’s ability to chelate ferric ions, thus
reducing the sensitivity of the gel. The increase in background O.D. can be attributed to the
higher scatter in PVA gels along with a greater presence of macroscopic suspended particles.
These effects also manifest as greater uncertainty in O.D. values stemming from lower signal
to noise ratios.
Another downside of using PVA as opposed to gelatin as a gelling agent arises from the
manufacturing procedure. While gelatine is easy to work with, dissolving at relatively low
temperatures (< 55 °C) in short periods (< 30 mins), producing gels from PVA is much less
convenient, requiring high temperatures (up to 110 °C) and long dissolution times (up to 3
hours). Additionally, the concentration required to manufacture effective PVA gels (20%
w/v) is significantly higher than gelatin, resulting in a higher viscosity and therefore difficult

124
to manipulate solutions. As discussed by Peppas et al., the degree of crosslinking (and
consequently scatter) present in the final PVA gel, is greatly dependant on the gel production.
The time-temperature history of the preparation impacts the rate of crosslinking in PVA
solutions, and as such it is important that the exact same procedure is followed for each PVA
gel.[91]
6.3.2. Effect of glyoxal
The addition of glyoxal (formulation 2) to the gelatin based dosimeter (formulation 1) has a
number of positive effects; it produces a small reduction in the background O.D. of the gel,
reduces auto-oxidation by 12%, and reduces diffusion by 21%. The effects of glyoxal as an
additive in the ferrous–xylenol orange–gelatin dosimeter have been investigated by Penev et
al. with similar results.[71, 75]
Penev et al. state that the reduction in background O.D. and
auto-oxidation can be attributed to glyoxal hemiacetals. These compounds, which are present
upon the addition of glyoxal, can form colourless complexes with Fe3+
ions. As a result, auto-
oxidation has a lower impact on the O.D. of the gel as only a fraction of Fe3+
is present as a
coloured xylenol orange chelate. Glyoxal also acts as a cross-linker with gelatin, increasing
the density of the gel matrix. For this reason, adding glyoxal to the gelatin based dosimeter in
formulation 2 results in a reduction in diffusion.
6.3.3. Diffusion rate
The diffusion coefficient measured for a 20% PVA gel with the introduction of xylenol
orange – substituted PVA (formulation 4) yielded a diffusion rate of 0.103 mm2 h
-1. This is a
37% improvement on the diffusion rate of a gel with the same PVA and Fricke solution

125
concentration (0.144 mm2
h-1
) and a 20% improvement on the Fricke gel dosimeter
incorporating partially functionalised xylenol orange – PVA (0.129 mm2 h
-1).
[69, 89] Despite
this, the low dose response, high scatter, and manufacturing concerns involving PVA negate
the practical benefits of lower diffusion and render the formulation inappropriate for clinical
use.
The diffusion coefficients of all gelatin based dosimeters tested (formulations 1, 2, 5, and 6)
were lower than all previously published values for gelatin and agarose based Fricke gels
ranging from 0.3 to 2.2 mm2 h
-1.[70, 72]
Formulation 6 yielded the lowest diffusion rate (0.132
mm2 h
-1), with a 56% improvement over the best results of gelatin based gels and an 8%
improvement over the 20% PVA Fricke gel.
This is a significant improvement and is attributable to the integration of xylenol orange –
substituted PVA in the dosimetry system. With this addition, all xylenol orange in the gel is
bound to the much larger PVA molecule and therefore less able to diffuse. Contrary to the
methods previously outlined incorporating xylenol orange functionalised PVA into the Fricke
gel system,[89]
the synthesis method utilised in this work gives a quantitative yield of
indicator molecules bound to the polymer. This was verified by dialysing xylenol orange –
substituted PVA against water and ensuring that the filtrate showed no sign of unbound
xylenol orange. Given that all the formulations tested (including PVA gels where cross-
linking would eliminate any diffusion of xylenol orange – substituted PVA) showed some
degree of diffusion, the remaining instability in these gels can only be credited to dissociation
of Fe3+
ions from xylenol orange which cannot be eliminated through polymer
functionalisation. As such, the results presented in this work establish the maximum

126
reduction in diffusion that is achievable in Fricke hydrogels by chemically bonding polymers
with chelators.
6.3.4. Energy and dose rate dependence
Measurements of the dose response of the optimised gel (formulation 6) with varying energy
indicated some degree of energy dependence of the dosimeter (figure 6.7). This is at odds
with conventional Fricke gel dosimeters which typically have a dose response which is
independent of energy over a large range, from approximately 0.2 to 10 MeV.[4]
The
alteration in this dosimetric property of the gel is unexpected and requires further
investigation to be better understood.
This study also revealed a small, 6% difference in dose sensitivity for photon beams between
the dose rates 600 MU/min and 400 MU/min. Previous studies of agarose and gelatin based
Fricke gel dosimeters showed no significant dose-rate dependence in their linear range of
dose response.[68, 92]
Conversely, studies of polymer gels have found comparable or
significantly higher dose rate dependence from 30 cGy/min to 400 cGy/min with the PAG,
nMAG and nPAG gels showing differences of 12%, 66%, and 5% respectively over the dose-
rates tested.[93]
The existence of dose-rate dependence may provide limitations in the
applications of a potential 3D dosimeter, as some treatments use varying dose-rates across
deliveries/fractions.
6.3.5. Reusability
Using the melting and resetting procedure, the optimised gel (formulation 6) yielded
excellent results upon reuse. Analysis of the dose response (figure 6.10) showed good

127
linearity upon the second irradiation with only a 10% decrease in the dose sensitivity from 0
to 32 Gy. The results obtained here mirror those in an investigation of the impact of glyoxal
on Fricke gels by Penev et al. which showed that adding the compound positively impacts the
linearity of subsequent irradiations.[71, 75]
Additionally, the dose response of the gel presented
here doesn’t reach saturation at high doses, even up to 107 Gy (figure 6.5). This is beneficial
as it not only opens up the use of the dosimeter for high dose applications but also allows
reuse of the gel multiple times and to high cumulative doses.
6.4. Conclusion
In this study, the ferrous sulphate – xylenol orange dosimeter is modified by incorporating
xylenol orange-substituted PVA in order to minimize the diffusion of post-irradiation dose
information. Unlike the initial work on the use of functionalised polymers in Fricke
dosimeters (Chapter 4), the synthesis method applied in this investigation obtains a
quantitative yield of reporter molecule – polymer bonding. As such, the results presented here
represent the maximum attainable reduction of diffusion in Fricke gels using a functionalised
polymer.
The conducted experiments suggest that one formulation with a good compromise in dose
sensitivity, background optical density, auto-oxidation rate, and diffusion coefficient contains
10% (w/v) gelatin in a 50 mM H2SO4 aqueous solution, with 10 mM glyoxal, 0.1 mM ferrous
sulphate, and 0.1 mM xylenol orange – substituted PVA. The optical dose response was
found to be linear (r2 = 0.9983) from 0 to 32 Gy with a sensitivity of 0.0031 Gy
-1 and the
auto-oxidation rate was measured as 0.00023 h-1
. The gel yielded a diffusion coefficient of

128
0.132 mm2
h-1
which is significantly lower than any previously published results for gelatin or
agarose gels and even slightly lower than the result obtained for a 20% PVA Fricke gel. This
is a substantial development as it combines low diffusion comparable to a PVA gel with the
ease of preparation and reliable response of a gelatin Fricke gel. On top of this, melting and
resetting of the gel demonstrated a continued linear response with only a 10% reduction in
dose sensitivity. Although manufacturing the functionalised polymer in a clinical
environment would be unviable, the availability of xylenol orange – substituted PVA from
commercial chemical suppliers would provide a simple means to a low diffusing, reusable gel
dosimeter.

129
Chapter 7
Conclusions and recommendations
This work set out to create a new gel dosimeter which solves the issues preventing these
systems from clinical use; i.e. toxicity, oxygen sensitivity, instability. Based on an analysis of
previously researched gels, it was determined that modifications to existing Fricke gel
systems could provide an avenue to achieving this aim. Fricke gels have the advantage of no
toxic ingredients, while still maintaining a high, linear, dose-rate and energy independent
response with easy read-out via optical CT or MRI. The major issue limiting the practicality
of the Fricke gel is spatial instability due to diffusion of dosimetrically active materials in the
gel. Due to the manipulability of the Fricke dosimeter, this work sought to make
modifications to some ingredients in the gel in an attempt to reduce the effects of diffusion.
Before making modifications to the Fricke dosimeters, the third chapter of this thesis sought
to optimise the accuracy of gel diffusion measurements. Typical measurements of diffusion
involve a half-field irradiation of the gel, after which the ‘blurring’ across the interface of
irradiated and non-irradiated gel is measured. To limit the baseline ‘blurring’ effect,
measurements of half-field beam penumbra were taken using EBT2 film for a variety of
blocking techniques. It was shown that minimizing the SSD reduces the penumbra as the
effects of beam divergence are diminished. The addition of a lead block directly on the
surface provides optimal results with a 10-90% penumbra of 0.53 ± 0.02 cm. Based on this

130
result, all subsequent diffusion measurements throughout the thesis utilised the lead block
when performing the half-field irradiation.
The fourth chapter comprising this thesis employed simple organic synthesis methods to
partially functionalise PVA with the xylenol orange reporter molecule. This modification to
the PVA Fricke gel was the first investigation into the effects of incorporating functionalised
polymers into gel dosimeters. Two gels were prepared for comparative measurements; the
PVA-FX gel as outlined by Chu et al., and a gel using PVA partially functionalised with
xylenol orange. The new gel presented here was measured to have a linear OD dose response
from 0 to 30 Gy (r2 = 0.9978) with a sensitivity of 0.014 Gy
-1, an auto oxidation rate of
0.0005 h-1
and a diffusion coefficient of 0.129 mm2 h
-1 measured via optical CT. Although
many dosimetric properties of this new gel deteriorated relative to the original PVA-FX gel,
the diffusion parameter at the centre of the thesis showed good results, reducing by 8%
compared to the PVA-FX gel. The deterioration of dosimetric properties, along with the
limited reduction in diffusion, indicated that the functionalization method employed in this
work yielded a low degree of xylenol orange integration in a largely impure product.
Regardless, this first paper proved that the integration of functionalised polymers could be
used to reduce diffusion in Fricke gel dosimeters, and with the development of more efficient
functionalization methods, a clinically relevant system could be produced.
Continuing from this initial investigation, the fifth chapter expanded the scope of chemistry
used to more complicated methods in order to produce xylenol orange-substituted PVA as a
pure compound. To achieve the target molecule, azide-functionalised PVA was produced
using a relatively simple, modified literature procedure. Separately, modifications to the

131
production method of xylenol orange yielded alkyne-xylenol orange. Finally, a ‘click’
reaction (the Huisgen 1, 3-Dipolar Cycloaddition of alkynes and azides) was used to bond the
two intermediates, completing the synthesis with a reliable, simple to perform, and easy to
purify step. All compounds were well characterised with high quality 1H and
13C NMR
spectra along with HR-MS or IR where appropriate. The methods here provide a means of
efficiently bonding xylenol orange to PVA in high purity with good yields for most steps. On
top of its use in gel dosimetry, this development may find application in other fields where
the spatial stability of reporter molecules is a necessity.
Using this synthesis, the resulting compound (xylenol orange-substituted PVA) was
integrated into a Fricke gel dosimeter and investigated in the sixth chapter of this thesis. As
the synthesis method obtains a quantitative yield of reporter molecule – polymer bonding, the
results presented here represent the maximum attainable reduction of diffusion in Fricke gels
using a functionalised polymer. Comparing formulations with varied gelling agents and
additives, it was found that a gel with good auto-oxidation rate, strong response relative to
background optical density and low diffusion could be made with a mixture of 10% (w/v)
gelatin in a 50 mM H2SO4 aqueous solution, with 10 mM glyoxal, 0.1 mM ferrous sulphate,
and 0.1 mM xylenol orange – substituted PVA. For summative purposes, table 7.1 (below)
details the properties of this gel along with the best results from Fricke gels in this thesis and
the literature. A major benefit of using gelatine as the gelling agent is the improvement in
ease of use and preparation; while producing dosimeters in a PVA gel can be difficult and
time consuming due to their viscosity, Fricke gelatine dosimeters dissolve and set much
quicker making them significantly more desirable in a clinical setting. For the optimised
system, the optical dose response was found to be linear (r2 = 0.9983) from 0 to 32 Gy with a
sensitivity of 0.0031 Gy-1
, the auto-oxidation rate was measured as 0.00023 h-1
, and the gel

132
yielded a diffusion coefficient of 0.132 mm2
h-1
. This diffusion result is significantly lower
than any previously published results for gelatin or agarose gels and even slightly lower than
the result obtained for a 20% PVA Fricke gel. In practical terms, this allows 2.3 times the
stable scanning period relative to the best gelatine gel results in the literature. A reusability
study of the dosimeter also showed positive results, as melting and resetting of the gel
demonstrated a continued linear response with only a 10% reduction in dose sensitivity after
a 13 Gy irradiation. This new gel dosimeter is a significant progression as it merges the ease
of preparation and reliable response of a gelatin Fricke dosimeter with the benefits of low
diffusion, characteristic of PVA gels. The method established to produce xylenol orange-
substituted PVA is laborious, however the availability of this compound from commercial
sources would deliver a simple means to a low diffusing, reusable gel dosimeter. The 3D
dosimetry system created here represents the final product of this work, and by alleviating the
issues inhibiting gel dosimetry from routine use, the aim of the work has been achieved.
Gel O.D. sensitivity
(Gy-1
)
Auto-oxidation rate
(h-1
)
Diffusion rate
(mm2
h-1
)
PVA-FX
(best literature PVA) 0.0200 0.00005 0.141
FX-G
(best literature gelatine) 0.034* 0.0024* 0.3*
XO-PVA
(Chapter 4 gel) 0.0140 0.00050 0.129
XO-sub PVA (10% gelatine)
(Chapter 6 – formulation 6) 0.0033 0.00023 0.132
XO-sub PVA (20% PVA)
(Chapter 6 – formulation 4) 0.0012 0.00123 0.103
Table 7.1: The O.D. sensitivity, auto-oxidation rate, and diffusion rate for key Fricke gels from
this thesis and the literature. *Note that properties of the FX-G gel have been measured using
different experimental set-ups to the other gels listed.

133
To expand the findings of this thesis and fill in some knowledge gaps, a number of
recommendations for future work are listed below:
The MRI read-out properties of the xylenol orange-substituted PVA gel dosimeter
(optimised gel from chapter 6) are not investigated in this thesis. In some cases, this read-
out modality may be preferable to optical CT, such as when gel containers are non-
cylindrical or made of opaque materials. Filling this knowledge gap would provide a basis
for using the new gel for these applications and further demonstrate its robustness.
This work demonstrates that functionalised polymers can be used to reduce diffusion in
gel dosimeters. In this thesis, Fricke gel systems were the focus of the work, however the
integration of functionalised polymers could be extended to other 3D dosimeters (e.g.
Micelle gels) which are often subject to spatial instability.
The issue of diffusion is addressed to great depth in this thesis, however auto-oxidation is
still an ever-present issue in Fricke gel dosimeters that must be addressed. Work is
constantly underway to solve this using various additives, but more extensive, chemical
manipulation of ingredients (similar to the efforts of this work) has not been attempted in
the pursuit reducing auto-oxidation effects.
Although the modifications present in the xylenol orange-substituted PVA gel dosimeter
don’t significantly alter the density relative to a normal gelatine Fricke gel, the water
equivalency should still be investigated and characterised. Monte Carlo simulations using
the EGSnrc software should be used to calculate its radiological properties, such as mass
and electron density, mass stopping powers, depth doses for kilovoltage x-ray and
megavoltage electron beams etc.

134

135
References
1. I. Varian Medical Systems. RapidArc Plan Comparisons. 1994-2014; Available from:
http://www.varian.com/us/oncology/treatments/treatment_techniques/rapidarc/compar
ison.html.
2. W.H. Organization, World Cancer Report 2014, in World Cancer Report, B.W.
Stewart and C.P. Wild, Editors. 2014, IARC: France.
3. A.L. Boyer, et al., Intensity-modulated radiotherapy: current status and issues of
interest. International Journal of Radiation Oncology Biology Physics, 2001. 51(4): p.
880-914.
4. L.J. Schreiner, Review of Fricke gel dosimeters. Journal of Physics: Conference
Series, 2004. 3: p. 9-21.
5. C. Baldock, et al., Experimental procedure for the manufacture and calibration of
polyacrylamide gel (PAG) for magnetic resonance imaging (MRI) radiation
dosimetry. Physics in medicine and biology, 1998. 43(3): p. 695.
6. C. Baldock, et al., Polymer gel dosimetry. Physics in medicine and biology, 2010. 55:
p. R1-63.
7. V.I. Koeva, Mathematical Modeling of PAG- and NIPAM-Based Polymer Gel
Dosimeters Contaminated by Oxygen and Inhibitor. Macromolecular theory and
simulations, 2009. 18(9): p. 495.
8. K.B. McAuley, Fundamentals of polymer gel gosimeters. Journal of Physics:
Conference Series, 2006. 56: p. 35-44.
9. G.S. Ibbott, Clinical Applications of Gel Dosimeters. Journal of Physics: Conference
Series, 2006. 56: p. 108-131.

136
10. C. Fleischmann, M. Lievenbrück, and H. Ritter, Polymers and dyes: Developments
and applications. Polymers (Basel, Switz.), 2015. 7: p. 717-746.
11. L.J. Schreiner, True 3D chemical dosimetry (gels, plastics): Development and clinical
role. Journal of Physics: Conference Series, 2015. 573: p. 012003.
12. M. Essers and B.J. Mijnheer, In vivo dosimetry during external photon beam
radiotherapy. International journal of radiation oncology, biology, physics, 1999.
43(2): p. 245-59.
13. J. Venselaar, H. Welleweerd, and B.J. Mijnheer, Tolerances for the accuracy of
photon beam dose calculations of treatment planning systems. Radiotherapy and
Oncology, 2001. 60: p. 191-201.
14. B.R. Poppe, et al., Spatial resolution of 2D ionization chamber arrays for IMRT dose
verification: single-detector size and sampling step width. Physics in medicine and
biology, 2007. 52(10): p. 2921.
15. E. Spezi, et al., Characterization of a 2D ion chamber array for the verification of
radiotherapy treatments. Physics in medicine and biology, 2005. 50(14): p. 3361.
16. A. Deda and E. Telhaj, Determination of Radiation Energy Response for
Thermoluminescent Dosimeter TLD-100: Determination of Organ Dose in Diagnostic
Radiology (abstract). AIP Conference Proceedings, 2009. 1119(1): p. 209-209.
17. L.P. Bogner, et al., Verification of IMRT: Techniques and Problems. Strahlentherapie
und Onkologie, 2004. 180(6): p. 340-50.
18. T.J. McCAw, J.A. Micka, and L.A. DeWard, Development and characterization of a
three-dimensional radiochromic film stack dosimeter for megavoltage photon beam
dosimetry. Medical Physics, 2014. 41(5): p. 0521041.

137
19. I.J. Chetty, et al., Report of the AAPM Task Group No. 105: Issues associated with
clinical implementation of Monte Carlo-based photon and electron external beam
treatment planning. Medical physics, 2007. 34(12): p. 4818-4853.
20. C.-M. Ma, et al., Monte Carlo verification of IMRT dose distributions from a
commercial treatment planning optimization system. Physics in medicine and biology,
2000. 45(9): p. 2483.
21. H. Fricke and S. Morse, The chemical action of roentgen rays on dilute ferrosulphate
solutions as a measure of dose. The American journal of roentgenology, radium
therapy, and nuclear medicine, 1927. 18: p. 430–432.
22. M.J. Day and G. Stein, Chemical dosimetry of ionizing radiations. Nucleonics, 1951.
8: p. 34-51.
23. J.C. Gore and Y.S. Kang, Measurement of radiation dose distributions by nuclear
magnetic resonance (NMR) imaging. Physics in medicine and biology, 1984. 29(10):
p. 1189.
24. K.C. Chu, et al., Polyvinyl alcohol-Fricke hydrogel and cryogel : two new gel
dosimetry systems with low Fe3 + diffusion Polyvinyl alcohol – Fricke hydrogel and
cryogel : two new gel dosimetry systems with low Fe 3 + diffusion. Physics in
medicine and biology, 2000. 45: p. 955.
25. B. Hill, et al., Investigation and analysis of ferrous sulfate polyvinyl alcohol (PVA)
gel dosimeter. Physics in medicine and biology, 2002. 47: p. 4233-46.
26. C. Baldock, et al., Experimental determination of the diffusion coefficient in two-
dimensions in ferrous sulphate gels using the finite element method. Australasian
Physical and Engineering Sciences in Medicine, 2001. 24(1): p. 19-30.
27. B.L. Gupta and G.R. Narayan, G(Fe 3+ ) values in the FBX dosemeter. Physics in
medicine and biology, 1985. 30(4): p. 337.

138
28. B.L. Gupta, et al., Use of the FBX dosemeter for the calibration of cobalt-60 and
high-energy teletherapy machines. Physics in medicine and biology, 1982. 27(2): p.
235.
29. R.G. Kelly, K.J. Jordan, and J.J. Battista, Optical CT reconstruction of 3D dose
distributions using the ferrous-benzoic-xylenol (FBX) gel dosimeter. Medical physics,
1998. 25(9): p. 1741-50.
30. A. Appleby and A. Leghrouz, Imaging of radiation dose by visible color development
in ferrous agarose xylenol orange gels. Medical Physics, 1991. 18: p. 309-12.
31. B. Gupta and K. Gomathy, Consistency of ferrous sulphate-benzoic acid-xylenol
orange dosimeter. The International Journal of Applied Radiation and Isotopes, 1974.
26: p. 509-513.
32. W.I.D. Rae, et al., Chelator effect on ion diffusion in ferrous-sulphate doped gelatin
gel dosimeters as analyzed by MRI. Medical Physics, 1996. 23: p. 15-23.
33. R. Meesat, et al., Utilization of the Ferrous Sulfate (Fricke) Dosimeter for Evaluating
the Radioprotective Potential of Cystamine: Experiment and Monte Carlo Simulation.
Radiation Research, 2012. 177(6): p. 813-826.
34. C. Baldock, et al., Fourier transform Raman spectroscopy of polyacrylamide gels
(PAGs) for radiation dosimetry. Physics in medicine and biology, 1998. 43(12): p.
3617.
35. R.J. Senden, et al., Polymer gel dosimeters with reduced toxicity: a preliminary
investigation of the NMR and optical dose response using different monomers.
Physics in medicine and biology, 2006. 51(14): p. 3301.
36. A. Jirasek, et al., Investigation of tetrakis hydroxymethyl phosphonium chloride as an
antioxidant for use in x-ray computed tomography polyacrylamide gel dosimetry.
Physics in medicine and biology, 2006. 51(7): p. 1891.

139
37. Y. De Deene, et al., A basic study of some normoxic polymer gel dosimeters. Physics
in medicine and biology, 2002. 47(19): p. 3441.
38. F. Pak, A. Farajollahi, and Z. Miabi, The Basic Dosimetric Properties of NIPAM
Polymer Gel Dosimeter. Medical Physics, 2012. 39: p. 3737.
39. K.-Y. Chang, et al., Investigation of the dose characteristics of an n-NIPAM gel
dosimeter with computed tomography. Nuclear Instruments and Methods in Physics
Research Section A: Accelerators, Spectrometers, Detectors and Associated
Equipment, 2011. 652(1): p. 775-778.
40. B.T. Hsieh, et al., A study on dose response of NIPAM-based dosimeter used in
radiotherapy. Journal of Radioanalytical and Nuclear Chemistry, 2011. 290(1): p.
141-148.
41. K. Jordan and N. Avvakumov, Radiochromic leuco dye micelle hydrogels: I. Initial
investigation. Physics in medicine and biology, 2009. 54(22): p. 6773.
42. S. Babic, J. Battista, and K. Jordan, Radiochromic leuco dye micelle hydrogels: II.
Low diffusion rate leuco crystal violet gel. Physics in medicine and biology, 2009.
54(22): p. 6791.
43. P.Y. Guo, J.A. Adamovics, and M. Oldham, Characterisation of a new radiochromic
three-dimensional dosimeter. Medical physics, 2006. 33(5): p. 1338-1345.
44. P.Y. Guo, J.A. Adamovics, and M. Oldham, A practical three-dimensional dosimetry
for radiation therapy. Medical physics, 2006. 33(10): p. 3692-3972.
45. J. Kevin, Optical CT scanning of cross-linked radiochromic gel without cylinder wall.
Journal of Physics: Conference Series, 2009. 164(1): p. 012029.
46. T. Gorjiara, et al., Radiological characterization and water equivalency of genipin gel
for x-ray and electron beam dosimetry. Physics in medicine and biology, 2011.
56(15): p. 4685.

140
47. J.B. Davies, S.G. Bosi, and C. Baldock, A genipin-gelatin gel dosimeter for radiation
processing. Radiation Physics and Chemistry, 2012. 81(8): p. 1263-1265.
48. H. Fricke and E. Hart, Chemical Dosimetry In Radiation Dosimetry, vol. 2, Editors F.
Attix, W. Roesch, and E. Tochilin, New York USA: Academic Press, 1966.
49. M.A. Bero, et al., Tissue-equivalent gel for non-invasive spatial radiation dose
measurements. Nuclear Instruments and Methods in Physics Research Section B:
Beam Interactions with Materials and Atoms, 2000. 166(0): p. 820-825.
50. Y. Katsumura, Y. Takeuchi, and K. Ishigure, Radiation chemistry of high temperature
water–I. Degradation products in acid by gamma radiolysis. Radiation Physics and
Chemistry, 1988. 32: p. 259-263.
51. A.O. Allen, The radiation chemistry of water and aqueous solutions, Editor D.V.
Nostrand. 1961: Princeton.
52. M.J. Maryanski, et al., NMR relaxation enhancement in gels polymerized and cross-
linked by ionizing radiation: A new approach to 3D dosimetry by MRI. Magnetic
Resonance Imaging, 1993. 11(2): p. 253-258.
53. M.J. Maryanski, et al., Magnetic resonance imaging of radiation dose distributions
using a polymer-gel dosimeter. Physics in medicine and biology, 1994. 39(9): p.
1437.
54. P.M. Fong, et al., Polymer gels for magnetic resonance imaging of radiation dose
distributions at normal room atmosphere. Physics in medicine and biology, 2001. 46:
p. 3105-3113.
55. Y.D. Deene, et al., Artefacts in multi-echo T 2 imaging for high-precision gel
dosimetry: I. Analysis and compensation of eddy currents. Physics in medicine and
biology, 2000. 45(7): p. 1807.

141
56. Y.D. Deene, et al., Artefacts in multi-echo T 2 imaging for high-precision gel
dosimetry: II. Analysis of B 1 -field inhomogeneity. Physics in medicine and biology,
2000. 45(7): p. 1825.
57. Y.D. Deene and C.D. Wagter, Artefacts in multi-echo T 2 imaging for high-precision
gel dosimetry: III. Effects of temperature drift during scanning. Physics in medicine
and biology, 2001. 46(10): p. 2697.
58. J.V. Trapp, et al., Attenuation of diagnostic energy photons by polymer gel
dosimeters. Physics in medicine and biology, 2002. 47(23): p. 4247.
59. M. Hilts, et al., Polymer gel dosimetry using x-ray computed tomography: a feasibility
study. Physics in medicine and biology, 2000. 45(9): p. 2559.
60. J.V. Trapp, et al., An experimental study of the dose response of polymer gel
dosimeters imaged with x-ray computed tomography. Physics in medicine and
biology, 2001. 46(11): p. 2939.
61. J.V. Trapp, et al., An experimental study of the dose response of polymer gel
dosimeters imaged with x-ray computed tomography. Physics in medicine and
biology, 2001. 46(11): p. 2939.
62. J.C. Gore, et al., Radiation dose distributions in three dimensions from tomographic
optical density scanning of polymer gels: I. Development of an optical scanner.
Physics in medicine and biology, 1996. 41(12): p. 2695.
63. Y. Xu and C.-S. Wuu, Optical computed tomography utilizing a rotating mirror and
Fresnel lenses: operating principles and preliminary results. Physics in medicine and
biology, 2013. 58(3): p. 479.
64. Y. De Deene, et al., An investigation of the chemical stability of a monomer/polymer
gel dosimeter. Physics in medicine and biology, 2000. 45: p. 859-878.

142
65. P.J. Harris, A.R. Piercy, and C. Baldock, A method for determining the diffusion
coefficient in Fe (II/III) radiation dosimetry gels using finite elements. Physics in
medicine and biology, 1996. 41: p. 1745-1753.
66. M.L. Taylor, et al., Systematic variations in polymer gel dosimeter calibration due to
container influence and deviations from water equivalence. Physics in medicine and
biology, 2007. 52: p. 3991-4005.
67. M.L. Taylor, et al., A comparative study of the effect of calibration conditions on the
water equivalence of a range of gel dosimeters. IEEE Transactions on Nuclear
Science, 2009. 56: p. 429-436.
68. R.J. Shulz, et al., Dose-response curves for Fricke-infused agarose gels as obtained
by nuclear magnetic resonance. Physics in medicine and biology, 1990. 35: p. 1611-
1622.
69. K.C. Chu, et al., Polyvinyl alcohol-Fricke hydrogel and cryogel : two new gel
dosimetry systems with low Fe3 + diffusion Polyvinyl alcohol – Fricke hydrogel and
cryogel : two new gel dosimetry systems with low Fe 3 + diffusion. Physics in
medicine and biology, 2000. 955: p. 955-969.
70. T. Kron, D. Jonas, and J.M. Pope, Fast T1 imaging of dual gel samples for diffusion
measurements in NMR dosimetry gels. Magnetic Resonance Imaging, 1997. 15(2): p.
211-221.
71. K. Penev and K. Mequanint, The effect of Mixed Dopants on the Stability of the
Fricke Gel Dosimeters. Journal of Physics: Conference Series, 2013. 444.
72. W.I.D. Rae, et al., Chelator effect on ion diffusion in ferrous-sulphate doped gelatin
gel dosimeters as analyzed by MRI. Medical physics, 1996. 23: p. 15-23.
73. P.S. Skyt, et al., Diffusion properties of a radiochromic hydrogel dosimeter. Journal
of Physics: Conference Series, 2013. 444.

143
74. T. Kairn, T. Aland, and J. Kenny, Local heterogeneities in early batches of EBT2
film: a suggested solution. Physics in medicine and biology, 2010. 55(15): p. L37.
75. K. Penev and K. Mequanint, Controlling sensitivity and stability of ferrous-xylenol
orange-gelatin 3D dosimeters by doping with phenanthroline-type ligands and
glyoxal. Physics in medicine and biology, 2013. 58: p. 1823-1838.
76. J. Fan, et al., Preparation of xylenol orange functionalized silica gel as a selective
solid phase extractor and its application for preconcentration—separation of
mercury from waters. Journal of Hazardous Materials, 2007. 145(1): p. 323-330.
77. S.T. Smith, et al., Characterisation of the half-field beam penumbra for a variety of
blocking set-ups. Journal of Physics: Conference Series, 2015. 573.
78. C. Gay, J. Collins, and J.M. Gebicki, Determination of Iron in solutions with the
Ferric-Xylenol Orange Complex. Analytical Biochemistry, 1999. 273: p. 143-148.
79. B. Gupta and K. Gomathy, Consistency of ferrous sulphate-benzoic acid-xylenol
orange dosimeter. The International Journal of Applied Radiation and Isotopes, 1974.
26: p. 509-513.
80. G.S. Jiao, J.W. Han, and K. Burgess, Syntheses of regioisomerically pure 5-or 6-
halogenated fluoresceins. Journal of Organic Chemistry, 2003. 68: p. 8264-8267.
81. E.W. Miller, et al., Optically monitoring voltage in neurons by photo-induced electron
transfer through molecular wires. Proceedings of the National Academy of Sciences
of the United States of America, 2012. 109: p. 2114-2119.
82. J. Korbl, Phthalein and Fluorescein Derivatives. 1961: United States.
83. D.A. Ossipov and J. Hilborn, Poly (vinyl alcohol)-based hydrogels formed by “click
chemistry”. Macromolecules, 2005. 39: p. 1709-1718.

144
84. A. Benalil, B. Carboni, and M. Vaultier, Synthesis of 1, 2-aminoazides. Conversion to
unsymmetrical vicinal diamines by catalytic hydrogenation or reductive alkylation
with dichloroboranes. Tetrahedron, 1991. 47: p. 8177-8194.
85. F. Nordstrom, et al., Intensity Modulated Radiotherapy dose verification methods; an
intercomparison study. 9th Biennial ESTRO Meeting on Physics and Radiation
Technology for Clinical Radiotherapy. 2007: Barcelona, Spain.
86. S.T. Smith, et al., Synthesis of Xylenol Orange-Substituted Poly(vinyl alcohol) via
‘Click’ Chemistry. In preparation, 2016.
87. A. Goodey, et al., Development of Multianalyte Sensor Arrays Composed of
Chemically Derivatized Polymeric Microspheres Localized in Micromachined
Cavities. Journal of the American Chemical Society, 2001. 123(11): p. 2559-2570.
88. M.A. Bero, W.B. Gilboy, and P.M. Glover, Radiochromic gel dosimeter for three-
dimensional dosimetry. Radiation Physics and Chemistry, 2001. 61: p. 433-435.
89. S.T. Smith, et al., Preliminary investigations into the use of a functionalised polymer
to reduce diffusion in Fricke gel dosimeters. Medical physics, 2015. 42: p. 6798-6803.
90. Truview Radiochromic Gels, in PDS500-1100, M.M.D. Inc., Editor. 2015.
91. N.A. Peppas, Crystalline radiation-crosslinking hydrogels of poly(vinyl alcohol) as
potential biomaterials. 1973, M.I.T.: (Unpublished doctoral thesis). p. 108-127.
92. M.A. Bero, Dosimetric properties of a radiochromic gel detector for diagnostic X-
rays. Nuclear Instruments and Methods in Physics Research Section A: Accelerators,
Spectrometers, Detectors and Associated Equipment, 2007. 580: p. 186-189.
93. Y. De Deene, et al., The fundamental radiation properties of normoxic polymer gel
dosimeters: a comparison between a methacrylic acid based gel and acrylamide
based gels. Physics in medicine and biology, 2006. 51: p. 653-673.

145
94. P. Virta and H. Lönnberg, Solid-Supported Synthesis of Cryptand-like Macrobicyclic
Peptides. The Journal of Organic Chemistry, 2003. 68(22): p. 8534-8538.

146

147
Appendix A
Initial Synthesis Methods
This appendix comprises initial synthesis methods conducted with varying success, which led
to the method in Chapter 4.
Reaction A.1: Esterification of XO DS with 1–Butanol
As shown below in figure A.1, the vinyl alcohol monomer is structurally and therefore
reactively similar to 1–butanol. With this in mind, simplified experiments can be performed
using 1–butanol to model how well a reaction will work when using PVA, without the
complications of polymer crosslinking.
To achieve the desired alteration, methods attempted to utilize the hydroxyl group, shared
between 1–Butanol and PVA. Given the presence of two carboxylic acid groups in XO DS, a
well-established esterification process was undertaken whereby butyl ester groups could be
produced in place of the carboxylic acid groups when heated in the presence of an acid
catalyst (i.e. HCl). The mechanism for the esterification reaction is detailed as follows:
Figure A.1: Comparison of 1–Butanol and Poly(vinyl alcohol) molecules.

148
1. A proton (hydrogen ion) is taken from the concentrated Hydrochloric Acid, leaving
chloride ion. This proton is attached to one of the lone pairs on the oxygen, which is
double-bonded to the carbon. The transfer of the proton to the oxygen gives it a positive
charge; however this charge is delocalized such that the carbon atom can also be charged.
2. The positive carbon atom is attacked by the reacting alcohol, creating a tetrahedral
intermediate, after which a hydrogen ion is lost at the location of the charged oxygen
atom.
3. A free proton then bonds to one of the lone pairs on the oxygen, forming water bonded to
the central carbon atom. This water molecule is subsequently lost along with another
hydrogen atom, as a double bond forms between the lone oxygen and central carbon.
R C
O
O H
H Cl
R C
O
O H
HCl
Protonation at the Carbonyl Oxygen
R C
O
O H
HCl
R C
O
OH
H
O R'
H
R C
O
OH
H
O
R'
H
Tetrahedral Intermediate
R C
O
OH
H
O
R'
H
Attack of Carbonyl by Alcohol
R C
O
OH
H
O
R'
H
R C
O
OH2
H
O
R'
R C
OR'
O
+ H2O
Protonation at hydroxyl and loss of water

149
The esterification of XO DS with 1–Butanol (Scheme A.1 shown below), was completed by
reacting one equivalence each of xylenol orange and 1−Butanol, with 10 equivalents of HCl
in an aqueous solution. The reaction vessel was prepared before being heated to 120 °C with
magnetic stirring overnight. Examination of the product showed poor results with an
inconsistent precipitate that was insoluble in numerous common solvents.
Reaction A.2: Cyclic Anhydride Formation on XO DS
Following similar work completed by Virta et al.,[94]
Reaction A.2 set out to make a cyclic
anhydride on the XO DS molecule with Diisopropylcarbodiimide (DIC), using
Dimethylformamide (DMF) as a solvent. The formation of a cyclic anhydride from two
carboxylic acid groups is as follows:
1. A negatively charged oxygen ion is formed when a carbonyl group is protonated. This
charged ion is then attacked by the other carboxyl group’s hydroxyl oxygen.
Scheme A.1: Production of Xylenol Orange monobutyl−ester from Xylenol Orange
Disodium Salt with 1−Butanol and Hydrochloric Acid.

150
2. A free proton then bonds to one of the lone pairs on the hydroxyl oxygen, forming water
bonded to the central carbon atom. This water molecule is subsequently lost, as a double
bond forms between the lone oxygen ion and carbon.
Cyclic anhydride formation (Scheme A.2 as below) was conducted by reacting XO DS and
DIC in a molar ratio of 1:2, using (at first) DMF as a solvent. However, difficulty was
encountered when trying to dissolve the XO DS in the DMF, so some Dichloromethane
(DCM) was added to encourage solution. The reaction was run overnight with a stirring
magnet, yet the xylenol orange still failed to completely dissolve. To determine if any
desirable constituents were produced from the reaction, column chromatography was
performed on the sample. Silica gel was used as the solid phase while the eluent comprised a
mixture of 1% water, 99% ethanol. In order to dissolve some insoluble fragments, a small
amount of water was used; however this resulted in the sample running through the column
too fast and thus poor separation. A TLC of the fractions obtained compared to XO DS
showed no distinction between the two, indicating the experiment was unsuccessful.
N
C
C
R
OH
HO
O
O
N
C
C
R
HO
O
O
OH+
H2O
N
C
C
R
HO
O
O
O
H+
N
C
C
R
OH2
O
O
O
N
C
C
RO
O
O
+ H2O

151
As a salt, the XO DS’s sodium atoms form an ionic bond with the 𝐶𝑂2⊖
. As a result, these
bonds are highly polar and thus the entire molecule will be inclined to dissolve in polar
solvents like water. It was therefore concluded that the molecule needed to be altered to
dissolve in a more polar solvent (DMF).
Reaction A.3: Xylenol Orange Tetra-Acid
To attain the desired solubility alteration to the XO DS molecule, it was supposed that the
sodium carboxylate groups on the molecule could be replace by carboxylic acids. These
functional groups would replace the ionic bonding Na atoms with covalent bonds between
Oxygen and Hydrogen atoms, developing a less polar molecule capable of better dissolving
in organic solvents (i.e. DMF etc.).
Xylenol Orange Tetra−Acid (XO TA) was produced via a substitution reaction between XO
DS and Hydrochloric Acid (Scheme A.3 above). The process was initiated by dissolving XO
DS in a minimum of water, then adding 2 equivalence of 2M HCl. Next, the sample was
magnetically stirred for 30 minutes before being lyophilised for 2 days. The resultant sample
Scheme A.1: Production of Xylenol Orange Cyclic Anhydride from Xylenol Orange
Disodium Salt with DIC, DCM and DMF.

152
Scheme A.3: Formation of Xylenol Orange Tetra−Acid for Xylenol Orange Disodium Salt
and HCl. Note the opening and closing of the oxidative ring between forms of the
molecule.
was a dry, orange precipitate viable for use in future reactions. It must be noted that this
sample used for experiments also contained a quantity of NaCl (approximately 15% by
mass).
Reaction A.4: Esterification of XO TA through a Cyclic Anhydride Reaction
Intermediate
Following the process outlined for Reaction A.2, formation of cyclic anhydride on XO TA
could be performed. However, with the successful solubility of XO TA in DMF, a second
step could be added, employing 1−Butanol to achieve esterification of the XO cyclic
anhydride compound. While the formation of the cyclic anhydride is outlined in section A.3.,
the mechanism of the subsequent esterification is outlined below:
1. An oxygen atom is protonated via a lone electron pair while its bonded carbon atom is
attacked by the reacting alcohol, creating a tetrahedral intermediate.
N
C
C
RO
O
O
H+ HO R'
N
C
C
RO
O
OHO
R'
H

153
2. The oxygen atom in the ring is then protonated, giving it a positive charge. In the reacting
alcohol, the bonded oxygen ion loses its charge by releasing a hydrogen ion.
3. The oxygen ion in the ring loses its charge by breaking its bond to the tetrahedral
carbinol. The hydroxyl oxygen atom forms a double bond with the carbon atom.
4. The oxygen ion releases a proton to lose its charge.
The esterification of XO TA through a cyclic anhydride intermediate (Scheme A.4 below)
was conducted by reacting XO TA and DIC in a molar ratio of 1:2, using DMF as a solvent.
Once dissolved, one equivalence of 1−butanol was added to the reaction vessel and it was
stirred overnight. Following this time, tetrahydrofuran (THF) and diethyl ether was added to
N
C
C
RO
O
OHO
R'
H
H+
N
C
C
RHO
O
OH
O
R'
N
C
C
R
OH
O
O
OR'
N
C
C
R OH
O
O
OR'
H
N
C
C
RHO
O
OH
O
R'
N
C
C
R
OH
O
HO
OR'

154
Figure A.2: NMR spectrum of XO TA.
the sample to form a precipitate. This product was freeze-dried and NMR spectroscopy was
performed using deuterium oxide (D2O) as a solvent.
Scheme A.2: Esterification of XO TA through a Cyclic Anhydride Reaction
Intermediate using DIC and 1−Butanol in DMF.

155
Figure A.3: NMR spectrum taken on the product of Reaction A.4.
A comparison of the spectra shown in figures A.2 and A.3 shows three new peaks evident in
the product of reaction A.4 at shifts of 2.536, 2.669, and 2.825 ppm. As these peaks are
known to correspond with DMF (the solvent used in the reaction), it was clear that small
amounts of this solvent were not effectively removed post-reaction. With no other changes
present, the desired product is certainly not present and therefore the method was
unsuccessful.
Reaction A.5: Esterification of XO TA/DS through a Benzotriazole Reaction
Intermediate
Similar to Reaction A.4, this reaction endeavoured to make an active ester through an
intermediate. The experiment was derived from work completed by Goodey et al. in which
dyes (including XO) were bonded to polymeric microspheres.[87]
Rather than using cyclic

156
anhydride as a leaving group for esterification, benzotriazole was to be bonded at the location
of carboxylic acid groups in XO via the hydroxyl group in hydroxybenzotriazole (HOBT).
The mechanism of this reaction is mostly similar to those previously outlined (for Reaction
A.2 and A.4). Due to the precedence of dyes being bonded to polymers (in the work of
Goodey et al.), an attempt was made to directly link the XO molecule to the PVA in this
experiment, as opposed to using 1−butanol as a model.
Reaction A.5 was commenced by washing the purchased PVA with DMF, THF, and diethyl
ether while under an atmosphere of argon. Using two separate flasks, XO DS and XO TA
were individually reacted with both DIC and HOBT in a molar ratio of 1:1:1. Both reactions
were conducted under argon using DMF as a solvent. The samples were stirred for 15
minutes in an ice bath, followed by another 15 minute at room temperature. To each flask, 4
grams of washed PVA was added, after which both were allowed to stir for 5 days. The
resulting solid phase was filtered and washed with water until the filtrate showed no
characteristic colour of XO. Each solid was then freeze-dried for 3 days. Without adding any
more XO, the XO DS PVA and XO TA PVA compounds were mixed to make 20% PVA
gels, in 50 mM H2SO4 with 0.4 mM ferrous sulphate.
Optical CT examination of these gels after a 20 Gy irradiation confirmed that no radio-
induced OD difference existed in either of the gels. It was therefore concluded that linking
the PVA to XO through the benzotriazole reaction intermediate resulted in a molecule that no
longer coordinated the ferric ions. As a result, no further investigation of diffusion in this gel
could be conducted and the synthesis method in focus was considered unviable.

157
Reaction A.6: Diazonium Salt Mediated Arene Substitution
Unlike reactions A.1 to A.5, this method doesn’t approach the XO – PVA bond via the
carboxylic acid groups, but rather through a bond to the sulfonylated oxidative ring bonded
benzene. Reaction A.6 follows the research of Fan et al. whereby xylenol orange
functionalized silica gel was manufactured using a diazonium compound.[76]
In this reaction,
para−amino benzoic acid was used as a model for PVA, similar to the use of 1-Butanol in
previous experiments.
The experimental method for Reaction A.6 was initiated by diazotizing 1.4 mmols of para-
amino benzoic acid with NaNO2 (20 mL of 2% (w/v)) in acetic acid (1%). After 1.5 hours,
Scheme A.3: Esterification of XO TA/DS through a Benzotriazole Reaction
Intermediate using DIC and HOBT in DMF. Note that the reaction above is only
shown for XO DS, the esterification follows the same process for XO TA.

158
approximately three quarters of the water was evaporated using a rotary evaporator, while 1.4
mmols of XO DS was dissolved in 50 mL of water. The diazotized para-amino benzoic acid
was cooled below 5 °C until the solution formed a precipitate. The solid was filtered, added
to the XO DS solution and allowed to stir for 2 days. To remove the water solvent, the
solution was run through the rotary evaporator and freeze dried overnight. NMR
spectroscopy was completed on the performed complex using D2O as a solvent. Referring to
Figure A.2, two new doublet peaks (at 6.705 and 6.726 ppm along with 7.599 and 7.621 ppm
respectively) which are only evident in the product’s spectrum correspond to diazotized para-
amino benzoic acid. This does indicate that as desired, this molecule has bonded to XO DS.
The success of this model experiment provides a basis for the method investigated in Paper 1.
Figure A.4: NMR spectra comparison from ≈ 6.5 – 7.9 ppm for (top) Reaction 6 product, (bottom)
Xylenol Orange Disodium Salt.


![The [3+2]Cycloaddition Reaction...Y N X NNN R nitrile oxides azomethine ylides nitrones azides diazoalkanes carbonyl ylides Dipolar cycloaddition ED C B A ED X = electron withdrawing](https://static.fdocuments.us/doc/165x107/5f26b0bf65fc1c21bd4e64db/the-32cycloaddition-reaction-y-n-x-nnn-r-nitrile-oxides-azomethine-ylides.jpg)