Analytical formulation of three-dimensional dynamic homogenization

Integrated Master in Chemical Engineering
Development of formulation-specific analytical methods
Master’s Thesis
By
Mafalda Sofia Pereira Brenha dos Reis
Developed in the course unit of Dissertation
Performed in
Govi Engineered Chemicals
Supervisor at FEUP: Professor Arminda Alves
Supervisor at GOVI: Jan Cocquyt and Chris Van Caneyt
Department of Chemical Engineering
February 2014

Development of formulation-specific analytical methods
ii

Development of formulation-specific analytical methods
iii
CONFIDENTIAL NOTICE – IMPORTANT – PLEASE READ FIRST
This document may contain confidential information proprietary to GOVI NV. It is therefore
strictly forbidden to publish, cite or make public in any way this document or any part thereof
without the express written permission by GOVI NV. Under no circumstance this document
may be communicated to or put at the disposal of third parties; photocopying or duplicating it
in any other way is strictly prohibited. Disregarding the confidential nature of this document
may cause irremediable damage to GOVI NV.
All the work presented in this document is subject to a confidentiality agreement between the
company, the University (FEUP) and the student. All technical information available in the
company on the chemicals and methods used was made available to the author of this thesis.
All the work was revised to ensure that no information pertaining to the company would be
used for other purposes.
NOTA CONFIDENCIAL – IMPORTANTE – POR FAVOR LER PRIMEIRO
Este documento pode conter informação confidencial propriedade da GOVI NV. Portanto é
estritamente proibido publicar, citar ou tornar público de qualquer forma este documento ou
qualquer parte dele sem a expressa permissão escrita pela GOVI NV. Sob nenhuma
circunstância este documento pode ser comunicado a ou posto à disposição de uma terceira
parte; fotocopiar ou duplicar este de qualquer forma é estritamente proibido.
Desconsiderando a natureza confidencial deste documento pode causar danos irremediáveis
para a GOVI NV.
Todo o trabalho apresentado neste documento está sujeito a um acordo de confidencialidade
entre a empresa, a Universidade (FEUP) e o aluno. Todas as informações técnicas disponíveis
na empresa sobre os produtos químicos e os métodos utilizados foram disponibilizados para o
autor desta tese. Todo o trabalho foi revisto para assegurar que nenhuma informação
referente à empresa poderia ser utilizada para outros fins.

Development of formulation-specific analytical methods
iv

Development of formulation-specific analytical methods
v
Acknowledgements
I would like to thank Jan Cocquyt for the support and help during the entire duration of the
internship and for always being available to help with my thesis. I also want to thank Chris Van
Caneyt for the support in the laboratory.
I would like to thank to Professor Arminda Alves for accepting my proposal for being my
supervisor at FEUP and to Professor Miguel Madeira for making this internship possible.
A big thank you for my two friends Catarina Sousa and Luisa Gonçalves for being in Belgium
with me and share great moments during the internship.
A special thanks to my family for being always supportive and for making this journey in
college possible.
Finally, I would like thank to Tiago Marques for the support and patience, for never doubting
that this is possible and for believing in me.

Development of formulation-specific analytical methods
vi
Abstract
Analytical methods are important to Govi since they ensure the quality of their products.
In this work five methods were tested: chloride content in emulsions, polar compounds in oils
and waxes, ester and iodine number in oils and analysis of silicone oil and oil emulsion mixture.
However more methods were searched and found to be possible to execute as methods that
could provide us the content of phosphorus and sulphur in emulsions.
The first one was to test the chloride content in emulsion and it was proved that the best
method was potentiometric with a pump to introduce AgNO3 into the sample. The chloride
content in the emulsion tested was 43.4±1.2 ppm. This is the main method tested since it is
the most important to Govi.
Extractable matter in the DMF and heptane phases was tested using infrared analysis after a
solvent extraction. Main components found, both in waxes and oils, were unsaturated
hydrocarbons, ethers and amides.
Ester and iodine numbers are used to test oils. The ester number is the difference between
saponification value and acid value and both methods are based on titration. Ester number is
0.8±1.0 for Oleic acid. Iodine number method is also based on titration and two different
solvents were tested, CCl4 and CHCl3. Results for palm oil crude sample were 56.4±1.9 and
57.1±0.3 g I2·g-1
sample for the each methods respectively.
The last method tested is very simple and provides us the content of a silicone oil and oil
emulsion mixture. In this method is also used a solvent extraction. The emulsion tested has
0.53 % (m/m) of surfactants, 12.57 % (m/m) of wax and 86.91% (m/m) of silicone.
Keywords: Analytical methods, titration, infrared, solvent extraction.

Development of formulation-specific analytical methods
vii
Resumo
Os métodos analíticos são importantes para Govi uma vez que garantem a qualidade dos seus
produtos.
Neste trabalho, foram testados cinco métodos: teor de cloreto em emulsões, compostos
polares em óleos e ceras, número ésteres e iodo em óleos e a análise de uma mistura de óleo
de silicone e emulsão de cera. No entanto, mais métodos foram pesquisados e conclui-se
serem possíveis de executar como os métodos que podem nos fornecer o conteúdo de fósforo
e enxofre em emulsões.
O primeiro método testado foi o teor de cloreto em emulsão e provou-se que o melhor
método era o potenciométrico utilizando uma bomba para introduzir AgNO3 na amostra. O
teor de cloreto na emulsão foi 43,4±1,2 ppm. Este é o teste principal método pois é o mais
importante para Govi.
A matéria extraída nas fases do DMF e do heptano foi testada usando análise por
infravermelhos depois de se proceder a uma extracção por solventes. Os principais
componentes encontrados tanto nas ceras como nos óleos foram hidrocarbonetos
insaturados, éteres e amidas.
Número de éster e de iodo são utilizados para testar óleos. O número éster é a diferença entre
o valor de saponificação e valor ácido e ambos os métodos baseiam-se em titulação. O número
de éster é de 0,8±1,3 ppm para o ácido oleico. O método para testar o número de iodo é
também baseada na titulação e foram testados dois solventes diferentes, CCI4 e CHCI3. Os
resultados para a amostra de óleo de palma bruto foram 56,4±1,9 e 57,1±0,3 g I2·g-1
amostra. Para
cada método respectivamente.
O último método testado é muito simples e fornece-nos o conteúdo da mistura de óleo de
silicone e emulsão de cera. Neste método também é utilizado uma extracção por solventes. A
emulsão testada tem 0,53% (m/m) de surfactantes, 12,57% (m/m) de cera e 86,91% (m/m) de
silicone.
Palavras-chave: Métodos analíticos, titulação, infravermelhos, extracção por solventes.

Development of formulation-specific analytical methods
viii

Development of formulation-specific analytical methods
ix
Declaração
Declara, sob compromisso de honra, que este trabalho é original e que todas as
contribuições não originais foram devidamente referenciadas com identificação da fonte.
Assinar e datar

Development of formulation-specific analytical methods
x
Table of contents
1 Introduction .......................................................................................................................... 1
1.1 Background and project Presentation .......................................................................... 1
1.2 GOVI Engineered Chemicals .......................................................................................... 1
1.3 Contributes of the work ................................................................................................ 1
1.4 Thesis organization ........................................................................................................ 1
2 Background and state of the art ........................................................................................... 3
2.1 Chloride content in oil mmulsion .................................................................................. 3
2.1.1 Mohr’s method...................................................................................................... 3
2.1.2 Volhard’s method .................................................................................................. 3
2.1.3 Potentiometric method ......................................................................................... 3
2.2 Phosphorus content in emulsion .................................................................................. 4
2.3 Sulphur content in oils and waxes ................................................................................ 5
2.4 Compounds in oils and waxes extractable with a polar solvent ................................... 6
2.5 Ester number in bio-oils ................................................................................................ 6
2.5.1 Saponification value .............................................................................................. 6
2.5.2 Acid value .............................................................................................................. 7
2.6 Iodine number in Bio-oils ............................................................................................. 7
2.7 Easy analysis method of silicone oil and wax emulsion mixture .................................. 7
3 Experimental work ............................................................................................................... 9
3.1 Chloride content in Oil Emulsion ................................................................................... 9
3.1.1 Volhard’s method .................................................................................................. 9
3.1.2 Potentiometric method ....................................................................................... 10
3.2 Compounds in oils and waxes extractable with a polar solvent ................................. 11
3.3 Ester number in bio-oils .............................................................................................. 12
3.3.1 Saponification value ............................................................................................ 12
3.3.2 Acid value ........................................................................................................... 13
3.4 Iodine number in bio-oils ............................................................................................ 14
3.4.1 Carbon Tetrachloride Method ............................................................................ 14
3.4.2 Chloroform Method ............................................................................................ 15
3.5 Easy analysis method of silicone oil and wax emulsion mixture ................................ 16
4. Results and Discussion .................................................................................................... 17
4.1 Chloride content in oil emulsion ................................................................................. 17

Development of formulation-specific analytical methods
xi
4.1.1 Volhard’s method ................................................................................................ 17
4.1.2 Potentiometric method ....................................................................................... 18
4.2 Compounds in oils and waxes extractable with a polar solvent ................................. 19
4.3 Ester number ............................................................................................................... 28
4.3.1 Saponification value ............................................................................................ 28
4.3.2 Acid Value ............................................................................................................ 29
4.4 Iodine Number ............................................................................................................ 29
4.4.1 Carbon tetrachloride method ............................................................................. 29
4.4.2 Chloroform method ............................................................................................ 30
4.5 Easy analysis method of silicone oil and wax emulsion mixture ................................ 31
5 Conclusions ......................................................................................................................... 32
5.1 Chloride content in oil emulsion ................................................................................. 32
5.2 Compounds in oils and waxes extractable with a polar solvent ................................. 32
5.3 Ester number in bio-oils .............................................................................................. 32
5.4 Iodine number in bio-oils ............................................................................................ 33
5.5 Easy analysis method of silicone oil and wax emulsion mixture ................................ 33
5.6 Future Work ................................................................................................................ 33
References ................................................................................................................................... 34
Appendix A – Potentiometric results .......................................................................................... 36
Appendix B – Infrared Spectrums ............................................................................................... 40
Appendix C – Reagents ................................................................................................................ 43

Development of formulation-specific analytical methods
xii
List of Tables
Table 1: Mixtures of emulsion with 0,002 mol·L-1 NaCl and water. ............................................ 11
Table 2: Sample weights.............................................................................................................. 13
Table 3: Guide for selecting sample size ..................................................................................... 14
Table 4: Volhard's method results on standard solutions .......................................................... 17
Table 5: Chloride content of emulsion components in ppm....................................................... 18
Table 6: Extractable matter of oils A and B in both DMF and heptane phases. ......................... 19
Table 7: Extractable matter of oils A and B in both DMF and heptane phases. ......................... 23
Table 8: Saponification values of Oleic acid. ............................................................................... 29
Table 9: Acid values of Oleic acid. ............................................................................................... 29
Table 10: Iodine values of palm oil crude with CCl4 method. ..................................................... 30
Table 11: Iodine value of palm oil crude with CHCl3 method. .................................................... 30
Table 12: Weight of the components of wax/silicone emulsion in grams. ................................. 31
Table 13: Concentrations of Cl- in the standards, volumes of solution titrate and of AgNO3 that
should be spent using a pipette. ................................................................................................. 36
Table 14: Concentrations of Cl- in the standards, volumes of solution titrate and of AgNO3 that
should be spent using a pump. ................................................................................................... 37
Table 15: Titration data and first and second derivate. .............................................................. 38
Table 16: Weights of DMF, middle and heptane phases before and after drying of the oils
samples. ...................................................................................................................................... 40
Table 17: Weights of DMF, middle and heptane phases before and after drying of the oils
samples. ...................................................................................................................................... 41
Table 18: Products codes and suppliers. ..................................................................................... 43

Development of formulation-specific analytical methods
xiii
List of Figures Figure 1: Potentiometric titration ................................................................................................. 4
Figure 2: Silver ring electrode a) Electrode used. b) Scheme of the electrode. ............................ 4
Figure 3: Yellow colour proportional to phosphate concentration (From the lowest to the
highest concentration). ................................................................................................................. 5
Figure 4: (a) Schoniger flask ; (b) Scheme of the Schoniger flask ................................................. 6
Figure 5: FTIR machine outside and inside. ................................................................................... 6
Figure 6: Mixture of emulsion, hexane, acetone and salt. ............................................................ 9
Figure 7: a) Equipment used in the pump method; b) Capillary just above the sample surface.
..................................................................................................................................................... 11
Figure 8: Titration curves, obtained titrating with 0.01 mol·L-1 AgNO3 sample W (green lines)
and sample Y (red lines) using the pump method, potential in mV and chloride concentration in
the sample in ppm. ...................................................................................................................... 18
Figure 9: Infrared bonds according to wavelengths.................................................................... 19
Figure 10: IR spectrum from oil A and both separating phases, DMF and Heptane................... 20
Figure 11: Molecular structure of primary, secondary and tertiary amides. .............................. 20
Figure 12: IF compounds analysis in the DMF phase of the separation of oil A. ........................ 21
Figure 13: IF compounds analysis in the heptane phase of the separation of oil A. .................. 21
Figure 14: IR spectrum from oil B and both separating phases, DMF and Heptane. .................. 21
Figure 15: DMF, middle and heptane phases from oil B before and after drying. ..................... 22
Figure 16: IF compounds analysis in the DMF phase of the separation of oil B. ........................ 22
Figure 17: IF compounds analysis in the heptane phase of the separation of oil B. .................. 22
Figure 18: IR spectrum from wax A and both separating phases, DMF and Heptane. ............... 23
Figure 19: DMF, middle and heptane phases wax A before and after drying. ........................... 23
Figure 20: IF compounds analysis in the DMF phase of the separation of wax A. ..................... 24
Figure 21: IF compounds analysis in the heptane phase of the separation of wax A. ................ 24
Figure 22: IR spectrum from wax B and both separating phases, DMF and Heptane. ............... 24
Figure 23: DMF, middle and heptane phases from wax B before and after drying. ................... 25
Figure 24: IF compounds analysis in the DMF phase of the separation of wax B. ...................... 25
Figure 25: Ether molecular structure. ......................................................................................... 25
Figure 26: IF compounds analysis in the heptane phase of the separation of wax B. ................ 25
Figure 27: IR spectrum from wax C and both separating phases, DMF and Heptane. ............... 26
Figure 28: DMF, middle and heptane phases from wax C before and after drying. ................... 26

Development of formulation-specific analytical methods
xiv
Figure 29: IF compounds analysis in the DMF phase of the separation of wax C. ...................... 26
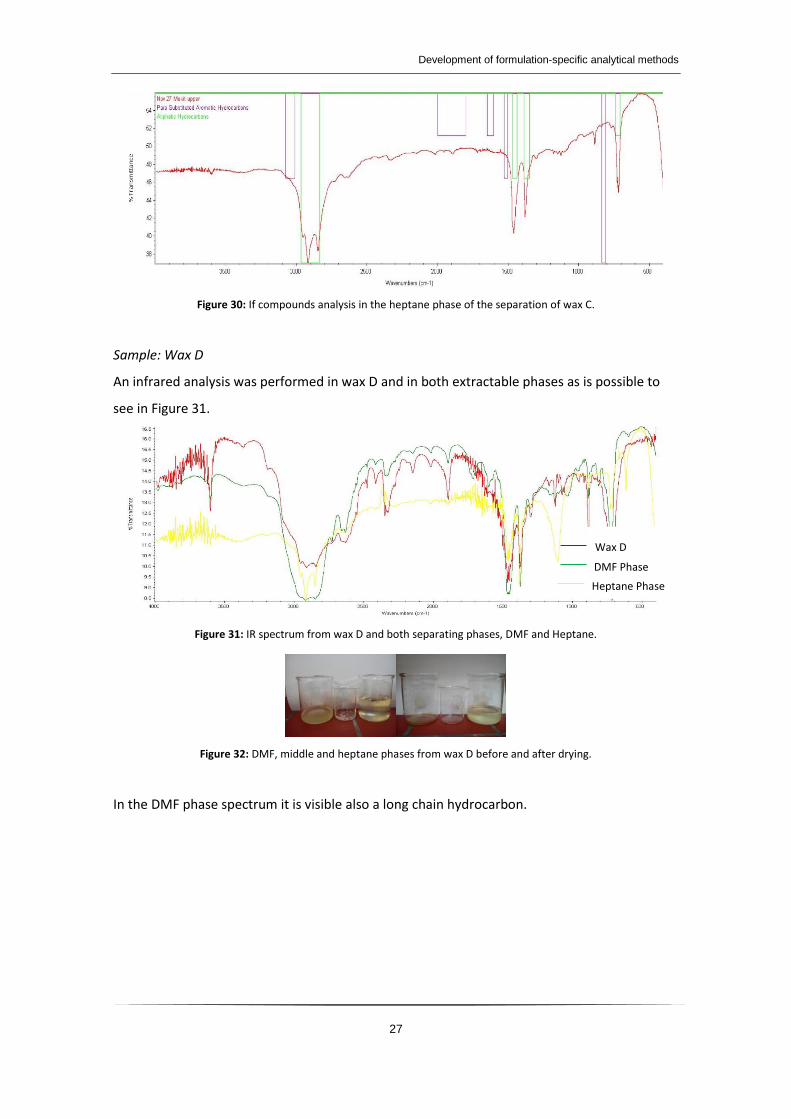
Figure 30: If compounds analysis in the heptane phase of the separation of wax C. ................ 27
Figure 31: IR spectrum from wax D and both separating phases, DMF and Heptane. ............... 27
Figure 32: DMF, middle and heptane phases from wax D before and after drying. .................. 27
Figure 33: IF compounds analysis in the DMF phase of the separation of wax D. ..................... 28
Figure 34: IF compounds analysis in the heptane phase of the separation of wax D................. 28
Figure 35: a) Sample before titration; b) Yellow colour appears; c) After adding starch indicator
solution; d) End point of titration. .............................................................................................. 30
Figure 36: Contents in wax/silicon emulsion in %. ...................................................................... 31
Figure 37: Experimental titration curves (pipette method) from the standards in Table 13
relating the volume of AgNO3 spent and the electrical potential (mV). ..................................... 36
Figure 38: Relationship between the experimental and the theoretical Cl- concentration in ppm
in the pipette method. ................................................................................................................ 37
Figure 39: Titration curves, obtained titrating with 0.01 mol·L-1 AgNO3, of sample W ( green
lines) and sample Y (red lines) using the weight method and chloride concentration in the
sample in ppm. ............................................................................................................................ 37
Figure 40: Titration curves of NaCl standard solutions (E in mV versus V AgNO3 in ml) and
experimental concentration of Cl- in ppm. ................................................................................. 38
Figure 41: Infrared test in Oil A. .................................................................................................. 40
Figure 42: Infrared test in oil B. ................................................................................................... 40
Figure 43: Infrared test in wax A. ................................................................................................ 41
Figure 44: Infrared test in wax B. ................................................................................................ 41
Figure 45: Infrared test in wax C. ................................................................................................ 42
Figure 46: Infrared test in wax D. ................................................................................................ 42
Development of formulation-specific analytical methods
xv
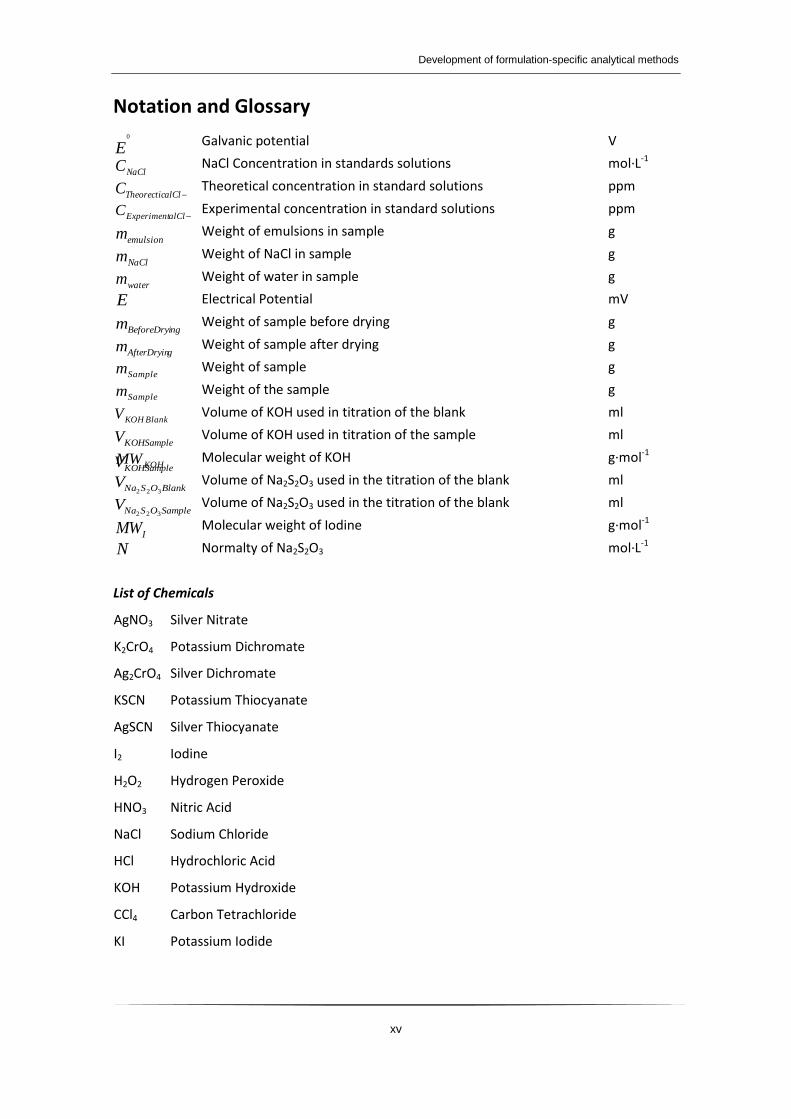
Notation and Glossary
E0
Galvanic potential V
NaClC
NaCl Concentration in standards solutions mol·L-1
alClTheorecticC
Theoretical concentration in standard solutions ppm
alClExperimentC
Experimental concentration in standard solutions ppm
emulsionm
Weight of emulsions in sample g
NaClm
Weight of NaCl in sample g
waterm
Weight of water in sample g
E
Electrical Potential mV
ngBeforeDryim
Weight of sample before drying g
gAfterDryinm
Weight of sample after drying g
Samplem
Weight of sample g
Samplem Weight of the sample g
BlankKOHV Volume of KOH used in titration of the blank
ml
SampleKOHV
SampleKOHV
Volume of KOH used in titration of the sample
ml
KOHMW
Molecular weight of KOH g·mol-1
BlankOSNaV322
Volume of Na2S2O3 used in the titration of the blank ml
SampleOSNaV322
Volume of Na2S2O3 used in the titration of the blank ml
IMW
Molecular weight of Iodine g·mol-1
N Normalty of Na2S2O3 mol·L-1
List of Chemicals
AgNO3 Silver Nitrate
K2CrO4 Potassium Dichromate
Ag2CrO4 Silver Dichromate
KSCN Potassium Thiocyanate
AgSCN Silver Thiocyanate
I2 Iodine
H2O2 Hydrogen Peroxide
HNO3 Nitric Acid
NaCl Sodium Chloride
HCl Hydrochloric Acid
KOH Potassium Hydroxide
CCl4 Carbon Tetrachloride
KI Potassium Iodide

Development of formulation-specific analytical methods
xvi
Na2S2O3 Sodium Thiosulfate
CHCl3 Chloroform
List of Acronyms
EDTA Ethylene Diamine Tetraacetic Acid
DMF Dimethyformamide
IR InfraRed
FTIR Fourier-Transform InfraRed
IPA Isopropanol

Development of formulation-specific analytical methods
1
1 Introduction
1.1 Background and project presentation
Through the years, GOVI has been trying to improve their products in order to make their
clients satisfied. To make sure that they produce the best products it is necessary to test them
and introduce analytical methods that can provide important information to the company and
the clients. The main goals of this thesis is to improve the potential of Govi’s laboratory by
developing methods that are reliable and specific to their products and to analyse and select
raw materials to products production. It is important to determine the method that works
with a certain sample and explain why other methods do not work. All the methods were
implemented for the first time in the company.
The development of accurate and reliable methods that are easy to apply on water-borne
process chemicals produced by Govi is an important advantage to this company.
In this work methods related to the characterization of specific chemicals and compounds will
be described together with the results obtained using these methods.
1.2 GOVI Engineered Chemicals
GOVI is a Belgium company with production facilities in Belgium, Italy and Serbia. 85% of what
Belgium Govi produces is exported outside Belgium. Founded in 1910, GOVI is dedicated to the
manufacturing of process chemicals used in different industries, such as woodworking
industry, printing, insulation products manufacturing, coatings and textile.
1.3 Contributes of the work
This work provides to GOVI the development of time-consuming methods to test their
products. The development of these methods would enable the company engineers to test
samples and raw materials. With the development of this thesis they will be able to just apply
them on a specific product.
1.4 Thesis organization
This thesis is organized in five chapters. In the first chapter are described the objectives of this
work, a brief description of the work and the company and contributes of the work.
The chapter 2 is an introduction of all methods development in the course of the internship
and their fundaments. Chapter 3 is related to the specific procedure of each method

Development of formulation-specific analytical methods
2
developed in order make the methods applicable to materials used in or produced by Govi. In
chapter 4 are provided the results obtained by methods and some remarks relating to the
results. Chapter 5 is about the conclusions of the work as well as the future work
recommended. In this chapter are described the problems faced in the work.

Development of formulation-specific analytical methods
3
2 Background and state of the art
2.1 Chloride content in oil emulsion
This test was performed in order to detect if the chloride content exceeds the 20 ppm that the
customer demands.
2.1.1 Mohr’s method [1]
In the Mohr’s method the solution is titrated with silver nitrate (AgNO3) and a precipitate of
silver chloride (AgCl) is formed.
( ) ( )
( ) ( )
As an indicator is used potassium chromate solution (K2CrO4) that reacts with the chloride ions
which did not react with the AgNO3. A red-brown precipitate of silver chromate (Ag2CrO4) is
formed when the end point is reached (reaction 2).
( ) ( )
( ) ( )
2.1.2 Volhard’s method [2]
This method uses a back titration with potassium thiocyanate (KSCN) to determine the
concentration of chloride ions in a solution. An excess volume of AgNO3 is added to the
solution containing chloride ions, forming a precipitate of AgCl.
( ) ( )
( ) ( )
Before titration, the sample is filtrated. The indicator Fe3+ (iron ion) is then added and the
solution is titrated with potassium thiocyanate solution. Silver ions react with thiocyanate ions
to form silver thiocyanate (AgSCN) precipitate.
( ) ( )
( ) ( )
In the beginning, the titrated is yellow but when it reacts with Fe3+ it forms a red complex.
( ) ( )
( ) ( )
The Volhard’s method is used a titration and the level of chloride is determine by the end
point. The end point of the titration is dark red colour.
2.1.3 Potentiometric method [3]
In a potentiometric method the electrochemical potential between two electrodes is
measured: the indicator electrode (IE) and the reference electrode (RE). Both of them are half-
cells because together they produce a certain potential.

Development of formulation-specific analytical methods
4
Figure 1: Potentiometric titration [4]
.
In this method is used a combined silver ring electrode as shown in Figure 2. This is a
silver/silver chloride reference electrode.
Figure 2: Silver ring electrode a) Electrode used. b) Scheme of the electrode.
A AgNO3 solution is added to the sample and the silver ions reacts with the chloride ions. An
equilibrium is formed at the metal surface of the electrode that depends on the concentration
of the metal ions in the sample. Metal ions are accepted by the silver ring of the electrode and
silver is released into the sample solution. The equilibrium reaction is:
( ) ( )
2.2 Phosphorus content in emulsion [5]
Phosphorus can occur in many forms of phosphates: orthophosphates, condensed phosphates
(pyro, meta and other polyphosphates) and organic phosphates. The first step of the
determination of the phosphorus content is to converse the phosphorus into orthophosphate.
Sensing electrode
a) b)
Reference electrolyte:
1 mol·L-1
KNO3
Reference electrode
Ag/AgCl reference
element
Platinum wire lead-off
Silver ring

Development of formulation-specific analytical methods
5
Phosphorus can appear in combination with organic matter so it is necessary to choose one
digestion method before determine the total phosphorus content. These methods oxidize the
existent organic matter and release the orthophosphate.
There are three possible digestion methods. The perchloric acid method is recommended to
difficult samples such us sediments and is a time-consuming method. The nitric acid-sulphuric
acid is the simplest method and is recommended to most samples. The last possible method is
the persulfate oxidation method that can be coupled with ultraviolet light to make the
digestion more efficient.
The determination of the orthophosphate is done also by one of three methods. These
methods are known as colorimetric method. The vanadomolybdophosphoric acid method is
used for a range of 1 to 20 mg P·L-1. In this method ammonium molybdate reacts with the
sample to form molybdophosphoric acid and a yellow vanadomolybdophosphoric acid is
formed in the presence of vanadium. The yellow colour is proportional to phosphate
concentration as shown in Figure 3.
Figure 3: Yellow colour proportional to phosphate concentration (From the lowest to the highest concentration) [6]
.
The stannous chloride method is based on the formation and reduction of molybdophosphoric
acid using stannous chloride. This method is more sensitive than the
vanadomolybdophosphoric acid method and it is used for a range from 0.01 to 6 mg P·L-1.
The ascorbic acid method ammonium molybdate and the antimony potassium tartrate react
with orthophosphate and form phosphomolybdic acid.
2.3 Sulphur content in oils and waxes
Sulphur is a non-metallic element and is essential to know is content in oils and waxes because
sulphur can change the behaviour on their applications. Most oils contain from 0.1 to 3 % of
sulphur[7].
Classic methods for the determination of sulphur content in many samples involve combustion
of the samples and require special equipment like the Schoniger technique. Schoniger

Development of formulation-specific analytical methods
6
introduced the oxygen combustion flask (Figure 4) that can be used to measure the content of
several elements[8].
Figure 4: (a) Schoniger flask [9]
; (b) Scheme of the Schoniger flask [10]
.
2.4 Compounds in oils and waxes extractable with a polar solvent [11]
Polar compounds in a sample are a good indicator of quality of the oil and the wax. To
separate polar from non-polar compounds is used a solvent extraction, a method to separate
compounds based on their solubility is selected such as dimethylformamide (DMF) for
dissolving more polar compound and heptane for dissolving the more nonpolar compounds.
After the extraction, the layers are separated as both solvents are miscible.
Samples of the two phases are dried and investigated using Fourier-Transform Infrared (FTIR)
analysis. That measures the vibrations of the atoms and bonds of the molecule. Infrared (IR)
radiation passes through the sample and specific wavelengths are absorbed by specific
molecules present in the sample.
Figure 5: FTIR machine outside and inside.
2.5 Ester number in bio-oils [12]
The ester number is the number of milligrams of KOH necessary for saponification of the
glyceryl esters in a fat or oil and it is the difference between saponification value and acid
value.
2.5.1 Saponification value [13]
The saponification value may be defined as the number of milligrams of potassium hydroxide
required to neutralize the fatty acids obtained by complete hydrolysis of one gram of oil or fat.

Development of formulation-specific analytical methods
7
The expected acid value was between 196.0 and 204.0 mg KOH·g-1. These values were
previously determined and are part of the company’s data.
2.5.2 Acid value [14]
The acid value may be defined as the number of milligrams of potassium hydroxide required to
neutralize the free acids obtained in one gram of oil or fat.
The expected acid value was between 195.0 and 203.0 mg KOH·g-1. These values were
previously determined and are part of the company’s data.
2.6 Iodine number in Bio-oils [15]
Iodine number is a measure of the unsaturation of fatty acids and is expressed in grams of
iodine (I2) per 100 grams of sample. The higher the iodine value the more double bonds are
present, which consequently reflects the reactivity of the oil[16].
The determination of this number involves 3 main steps [17]. The first step is the reaction of the
sample with the Wijs solution in excess.
( )
Then the excess of Wijs solution reacts with potassium iodide (KI)
( )
and with titration with sodium thiosulphate (Na2S2O3) solution it is possible to determine the
amount of released iodine
( )
The expected iodine value was between 48.0 and 58.0 g I2·100 g-1 sample. These values were
previously determine and are part of the company data.
2.7 Easy analysis method of silicone oil and wax emulsion mixture
Emulsion is a dispersion of not miscible liquids, wax and silicone. They are used in many
applications like cosmetics, drugs and paints.
The emulsion upon which this method was applied it is a mixture of a hydrocarbon wax
emulsion and a polydimethylsiloxane (silicone) emulsion. To create an emulsion is necessary to
add a surfactant (surface active agent) as a droplet stabilizing agents such as surfactants. In
this analysis are used a nonionic surfactant. The goal of this method is to make a quantitative
analysis of each component of the emulsion. However, it is necessary to use a solvent
extraction. Heptane was used in order to separate the different components.

Development of formulation-specific analytical methods
8

Development of formulation-specific analytical methods
9
3 Experimental work
3.1 Chloride content in Oil Emulsion
Chloride is analysed in an emulsion. It is impossible to analyse the chloride in such a turbid and
colourful sample. So it is important to use a solvent extraction and heat the emulsion to break
it. Then the water phase is used to measure chloride where they are expected to be found.
3.1.1 Volhard’s method [2]
Reagents
All specifications (product code and supplier) of the reagents are in Appendix C – Reagents.
1. Potassium thiocyanate
2. Silver nitrate solution (0.1 mol·L-1)
3. Ferric ammonium sulphate (NH4Fe(SO4)2)
4. Hydrogen peroxide 33 % (H2O2)
5. Nitric acid (HNO3) concentrated
Procedure
a) Solutions preparation
It was necessary to prepare two solutions: KSCN solution and NH4Fe(SO4)2 solutions. To
prepare the first one it was weighted 2.43 g of solid KSCN and add to it 250 ml of distilled
water in a volumetric flask. To the second one it was weighted 8 g of NH4Fe(SO4)2 and added
to it 20 ml of distilled water and a few drops of HNO3.
b) Sample preparation
The oil emulsion was first broken by adding to 70 g of emulsion, 70 g of hexane, 70 g of
acetone, and 1 g of calcium salt of formic acid.
Figure 6: Mixture of emulsion, hexane, acetone and salt.

Development of formulation-specific analytical methods
10
After adding all the components to the emulsion, let it boil for about two hours. The emulsion
is broken the when colour is dark brown.
After breaking the oil emulsion, it is cooled and transferred it to a separating tunnel.
The water phase (lowest phase) collected after breaking the emulsion it is dark. So it is
necessary to make it more transparent with hydrogen peroxide [3] to make sure that when the
titration is done the colour change can be notice.
Weight 6 g of the sample into a 500 ml flask. Add precisely 5 ml of AgNO3 solution (0.1 mol·L-1),
10 ml of water, 2 ml of concentrated HNO3 and a few boiling chips. Boil the mixture in the
fume hood with cooling.
Add to the solution 5 ml of 33% H2O2. Keep it boiling until the colour disappears. Cool the
solution, filter it and wash the solid residue with water. Transfer the sample to a 500 ml
volumetric flask and fill in with water.
c) Titration
Add precisely 100 ml of sample into to a conical flask and 1ml of saturated NH4Fe(SO4)2 as an
indicator. Titrate with 0.1 mol·L-1 KSCN until dark red colour appears. Repeat the titration until
obtaining 3 concordant results (titres agreeing within 0,1 ml).
3.1.2 Potentiometric method
Equipment
1. Silver ring electrode (DM141-SC) from Mettler Toledo.
Reagents
It is used the same AgNO3 as in the Volhard’s method. Dilutions were made to the reagent.
Procedure
a) Samples preparation
Tests were performed in two samples. One is a mixture of the emulsion and water and the
other a mixture of emulsion with sodium chloride (NaCl) solution so that the end emulsion as
contains 10 ppm more than the first one. This will provide a way to verify the reliability of the
test.

Development of formulation-specific analytical methods
11
Table 1: Mixtures of emulsion with 0.002 mol·L-1
NaCl and water.
( ) ( ) ( )
Sample Y 429.34 71.4286 - Sample W 429.34 - 71.4256
A confidential extraction method was used to break the samples and to collect the water
phase for the potentiometric method.
b) Potentiometric procedure
In order to improve the method, different ways of adding the AgNO3 solution into the sample
were used.
In all methods a well-known amount of sample between 20 to 50 ml was added from the
solvent phase, to a small beaker so that the electrode goes under de liquid surface.
Pump method
In this method a pump was used to introduce 0.01 mol ·L-1 AgNO3 into the sample. In the edge
of the pump was placed a syringe with a tube and a capillary placed just above the liquid
surface as is shown in Figure 7.
Figure 7: a) Equipment used in the pump method; b) Capillary just above the sample surface.
3.2 Compounds in oils and waxes extractable with a polar solvent
IR is used after the sample is mixed and boiled with two solvents, heptane and DMF. More
solvents were tried but their separation after boiling was not efficient because they mix after
heating. This is the case of DMF and Exxsol D120, and Acetone and Exxsol D120. Solvent mixing
leads to bad separation of the different compound in oil and wax. The solvents used should be
immiscible both when they are cold and hot.
a) b)

Development of formulation-specific analytical methods
12
Equipment
1. FTIR equipment (Nicolet Avatar 320 FT-IR spectrometer) from Thermo Scientific
Solvents
1. Heptane
2. DMF
Procedure
1. Add, approximately, 50 g of sample and 50 g of each solvent.
2. Boil them for 2 hours.
3. Cool the mixture and poor it into a separating funnel.
4. Separate the lower and upper phase. Take a middle phase to make sure the other
phases are pure.
5. Dry both phases in the oven and after dry in the drying machine.
6. Test both phases in the infrared machine
3.3 Ester number in bio-oils
3.3.1 Saponification value [18]
Reagents
1. Hydrochloric acid (HCl) (5 N)
2. Potassium hydroxide in ethanol (KOH) (0.5 N)
3. Phenolphthalein
4. Ethanol 96% (v/v)
Procedure
1. Weight 4 g of the sample and add 50 ml of the alcoholic KOH with a pipette.
2. Prepare a blank determination and conduct simultaneously with the sample.
3. Connect the air condensers to the flask and boil the solution gently but steadily until
the sample is completely saponifed. This usually requires approximately 1h for normal
samples. Take care that the vapour ring in the condenser does not rise to the top of
the condenser or there may be some loss.

Development of formulation-specific analytical methods
13
4. After the flask and the condenser have cooled somewhat but not sufficiently to jell the
contents, wash the inside of the condenser with a little distilled water. Then
disconnect the flask.
5. Mix 1 g of phenolphthalein and 100 g of ethanol to make phenolphalein indicator. Add
approximately 1 ml of this indicator into the sample.
5. Titrate the solution with diluted solution of 0.5 N HCl until the pink colour has just
disappeared.
3.3.2 Acid value [14]
The acid value may be defined as the number of milligrams of potassium hydroxide required to
neutralize the free acids obtained in one gram of oil or fat.
Reagents
1. Alcoholic Potassium Hydroxide 0.5 N (KOH)
2. Phenolphthalein
3. Isopropanol (IPA)
Procedure
1. Weight the sample according to the following acid values expected:
Table 2: Sample weights. [14]
Acid value (mg KOH·g-1) Sample size (g) Normality KOH (N)
Less than 1.0 4 (±0.1) 0.1 1-25 2 (±0.1) 0.1
25-50 1 (±0.1) 0.1
50-150 3 (±0.1) 0.5
Greater than 150 2.5 (±0.1) 0.5
Put the sample into a 125 ml Erlenmeyer flask.
2. Add 50 ml of IPA using a dispensing device and a stirring bar and mix to dissipate
heating in. Allow the sample to cool.
3. Prepare a reagent blank containing 50 ml of neutralized IPA. (When using 0.5 N KOH
no blank is needed).
4. Add 1g of phenolphthalein and 100 g of ethanol to make phenolphthalein indicator.
Using a pipette, add 1 ml of this indicator into the sample and blank flask.
5. Titrate with KOH solution until the pink colour disappears.

Development of formulation-specific analytical methods
14
3.4 Iodine number in bio-oils
3.4.1 Carbon Tetrachloride Method [15]
Reagents
1. Carbon tetrachloride (CCl4)
2. Wijs solution
3. Potassium iodide (KI)
4. Sodium thiosulfate solution 0,1N (Na2S2O3)
5. Starch indicator solution (1%)
Procedure
a) Solutions preparation
The potassium iodide solution should be kept in a dark bottle or prepared fresh in every
attempt. To prepare 100 g of 15% KI solution weight 15 g of KI and fill with water until 100 g.
b) Titration
1. Weight the sample according to the following table, and put it into a 500 ml flask. The
weight of the sample must be such that there will be an excess of Wijs solution
between 100 to 150% over the amount absorbed.
Table 3: Guide for selecting sample size. [15]
Iodine Value Sample weight (g) Weighting Accuracy (g) 100% Excess 150% Excess
<3 10 10 ±0.001
3 10.5760 8.4613 0.005
5 6.3460 5.0770 0.0005
10 3.1730 2.5384 0.0002
20 1.5865 0.8461 0.0002
40 0.7935 0.6346 0.0002
60 0.5288 0.4231 0.0002
80 0.3966 0.3173 0.0001
100 0.3173 0.2538 0.0001
120 0.2644 0.2115 0.0001
140 0.2266 0.1813 0.0001
160 0.1983 0.1597 0.0001
180 0.1762 0.1410 0.0001
200 0.1586 0.1269 0.0001

Development of formulation-specific analytical methods
15
2. Add 20 ml of CCl4.
3. Pipette 25 ml of Wijs solution into the flask and shake it.
4. Prepare a blank and store the two flasks for 1 hour at 25±5⁰C.
5. After 1 hour add to the flasks 20 ml of KI solution and 100 ml of distilled water.
6. Titrate with Na2S2O3 solution with constant shaking. Continue the titration until the
yellow colour disappears and then add 1 ml of starch indicator solution. Titrate until
the blue colour disappears.
3.4.2 Chloroform Method [19]
Reagents
1. Chloroform (CHCl3)
2. Wijs solution
3. Potassium iodide (KI)
4. Sodium thiosulfate solution 0.1 N (Na2S2O3)
5. Starch indicator solution (1%)
Procedure
a) Solutions preparation
The potassium iodide solution should be kept in a dark bottle or prepared fresh in every
attempt. To prepare 100 g of 15% of KI solution weight 15 g of KI and fill with water until 100 g.
b) Titration
1. Weight 0.5 g of sample.
2. Add 10 ml of CHCl3 and warm slightly and cool for 10 minutes.
3. Pipette 25 ml of Wijs solution into the flask and shake it.
4. Prepare a blank and store the two flasks for 1 hour at 25±5⁰C.
5. After 1 hour add to the flasks 20 ml of KI solution and 100 ml of distilled water.
6. Titrate with Na2S2O3 solution with constant shaking. Continue the titration until the
yellow colour disappear and then add 1 ml of starch indicator solution. Titrate until
the blue colour disappears.

Development of formulation-specific analytical methods
16
3.5 Easy analysis method of silicone oil and wax emulsion mixture
Reagents
1. Hexane
Procedure
1. Before destroying the emulsion, dry it in a big beaker making a thin layer of emulsion.
2. After drying add to 30.63 g of emulsion 50 ml of hexane and mix it well.
3. The wax will not dissolve into the hexane so filter the mixture.
4. Wash the filter and the beaker with hexane to make sure that is clean.
5. Dry the wax that is in the filter.
6. Add to the filtrate 63.38 g of water to separate the silicone from the surfactants.
7. Separate the two phases with a separating funnel.
8. Dry and weight the two phases.

Development of formulation-specific analytical methods
17
4. Results and Discussion
No legal limits of concentration exist for any of the methods/samples mentioned on this thesis
and it was not found detection limits and precision for these methods in the matrices studied.
4.1 Chloride content in oil emulsion
4.1.1 Volhard’s method
Calculations
Equation 10 is the formula of calculating the chloride content in Volhard’s method.
(
)
( )
Results
It was only realized tests in the NaCl standards solutions.
Table 4: Volhard's method results on standard solutions
( ) ( ) ( )
0.0001 3.5 -7353.5 0.0002 7.1 -707.1
0.001 35.5 3114.6
The results of chloride content using the Volhard’s method (in green) are not correct so they
were excluded because it is impossible to achieve negative concentrations. This method could
not be suitable for the sample used or some errors have occurred during the procedure.

Development of formulation-specific analytical methods
18
4.1.2 Potentiometric method
Results
Experimental results from chloride content are presented in Figure 8.
Figure 8: Titration curves, obtained titrating with 0.01 mol·L-1
AgNO3 sample W (green lines) and sample Y (red lines)
using the pump method, potential in mV and chloride concentration in the sample in ppm.
The chloride concentration obtained by the titration curves where calculated by the formulas
on the Appendix A – Potentiometric results (Titration tables) related to the second derivate.
A correction factor of 1.4 is used. This factor takes into account the amount of water present in
the original emulsion (53.78%) and the initial components amounts used in the solvent
extraction.
The corrected values are 52.1±0.8 ppm for sample Y and 43.4±1.2 ppm for sample W. The
chloride content in sample Y is 8.7±2.0 ppm higher than in sample W.
Several components of the emulsion were analysed in order to determine where the chloride
content came from. The same potentiometric procedure and calculations were used. In table
5 it is shown the chloride content of water, emulsifiers and gums in the emulsion. The
emulsion analysed has 50% of water, 2% of emulsifier 1.1 or 1.2 and 1% of emulsifier 2.1. The
emulsion (sample W) has as mentioned before has 43.4±1.2 ppm.
Table 5: Chloride content of emulsion components in ppm.
Component Chloride content in the emulsion (ppm)
Water 15.3±0.9 Emulsifier 1.1 16.5±1.0
Emulsifier 1.2 22.5±0.2
Emulsifier 2.1 2.0±0.2
-70
-20
30
80
130
0 0,5 1 1,5 2 2,5 3 3,5
E (m
V)
V AgNO3 (mL)
30,3 ppm29,9 ppm31,2 ppm31,8 ppm36,8 ppm37,6 ppm36,5 ppm

Development of formulation-specific analytical methods
19
The emulsion tested has 43.4±1.2 ppm. According to this test, if the emulsifier 1.1 was used
the emulsion has 33.8±2.1 ppm and if the emulsifier 1.2 was used than the emulsion should
have 39.8±1.3 ppm. The components mentioned in this test are just 53% of the emulsion. The
missing content of chloride comes probably from other components.
4.2 Compounds in oils and waxes extractable with a polar solvent
Results
This test was carried out in several samples of oil and samples.
The infrared spectrum is from 4000 to 400 cm-1. This is a mid-infrared region that can be
divided into four regions.
However, it is possible to analyse the spectrum, sometimes it is impossible to be sure that a
certain bond exits or not. Certain peaks are difficult to analyse because they are not exactly as
theory of infrared says.
Figure 9: Infrared bonds according to wavelengths. [20]
Oils
The results of extractable matter of both oils A and B are presented in Table 6.
Table 6: Extractable matter of oils A and B in both DMF and heptane phases.
Extractable matter (%)
DMF Phase Heptane Phase Oil A 4.87 95.13
Oil B 0.74 99.26

Development of formulation-specific analytical methods
20
Sample: Oil A
An infrared analysis was performed in oil A and in both extractable phases as is possible to see
in Figure 10.
Figure 10: IR spectrum from oil A and both separating phases, DMF and Heptane.
In the DMF phase of the separation (Figure 12) it is possible to identify hydrocarbons because
the stretch C-H bond is visible between 3000-2850 cm-1. It is a saturated hydrocarbon because
the C-H wavelength is lower than 3000 cm-1. It is also visible the bending C-H bond around
1450-1375 cm-1. The equipment also identifies a tertiary amides existence but the amide
existent is not tertiary because this kind of amide is known for not having an N-H bond as is
possible to see in the spectrum. However, this bond is visible between 3500-3100 cm-1. The
C=O bond is visible around 1670 cm-1.
Figure 11: Molecular structure of primary, secondary and tertiary amides.
In Figure 12, C=C bond is visible around 1600 cm-1. This bond and the C-H bond found around
3000-3100 cm-1 help to identify an alkene.
Heptane Phase
DMF Phase
Oil A

Development of formulation-specific analytical methods
21
Figure 12: IF compounds analysis in the DMF phase of the separation of oil A.
In the heptane phase of the separation, it is also possible to see a saturated hydrocarbon. The
bending and stretch C-H bonds are visible on the same wavelength of the lower phase.
However, as it is possible to see in Figure 13, FTIR analysis is not correct because it identifies
carboxylic acids existence. For it exist, a C=O bond around 1725-1700 cm-1 should be visible.
Figure 13: IF compounds analysis in the heptane phase of the separation of oil A.
Sample: Oil B
An infrared analysis was performed in oil B and in both extractable phases as is possible to see
in Figure 14.
Figure 14: IR spectrum from oil B and both separating phases, DMF and Heptane.
Heptane Phase
DMF Phase
Oil B

Development of formulation-specific analytical methods
22
Figure 15: DMF, middle and heptane phases from oil B before and after drying.
In Figure 16 it is identified an amide but the C=O bond should be more visible between 1670-
1640 cm-1. So it is not possible to found an amide in this phase. It Is possible to identify an
alkene because a C=C above 1600 cm-1. It also exists a stretch and bending C-H bonds between
3000-2850 cm-1 and 1450-1375 cm-1, respectively, characteristics of a saturated hydrocarbon.
Figure 16: IF compounds analysis in the DMF phase of the separation of oil B.
This is a simple spectrum analysis. In Figure 17 it is possible to identify a saturated
hydrocarbon with a stretch and bending C-H bond between 3000-2850 cm-1 and 1450-1375 cm-
1, respectively.
Figure 17: IF compounds analysis in the heptane phase of the separation of oil B.

Development of formulation-specific analytical methods
23
Waxes
The results of extractable matter of waxes A, B, C and D are presented in Table 7.
Table 7: Extractable matter of oils A and B in both DMF and heptane phases.
Extractable matter (%)
DMF Phase Heptane Phase Wax A 0.46 99.54
Wax B 1.86 98.14
Wax C 0.94 99.06
Wax D 0.38 99.02
Sample: Wax A
An infrared analysis was performed in wax A and in both extractable phases, as it is possible to
see in Figure 18.
Figure 18: IR spectrum from wax A and both separating phases, DMF and Heptane.
Figure 19: DMF, middle and heptane phases wax A before and after drying.
In Figure 20 it is also visible a saturated hydrocarbon with a stretch and bending C-H bonds. An
error occurs in the FTIR analysis because sulfoxides bonds are not visible. The S=O bond should
be visible around 1050 cm-1 and should be a stronger and more visible bond. However, this
spectrum has more picks than the normal hydrocarbon spectrums. This could mean that more
compounds exist.
Heptane Phase
DMF Phase
Wax A

Development of formulation-specific analytical methods
24
Figure 20: IF compounds analysis in the DMF phase of the separation of wax A.
Figure 21 is also very easy to analyse because it is a characteristic saturated hydrocarbon bond.
The bonds found are the same as the ones found in the others saturated hydrocarbon
spectrums.
Figure 21: IF compounds analysis in the heptane phase of the separation of wax A.
Sample: Wax B
An infrared analysis was performed in wax B and in both extractable phases as is possible to
see in Figure 22.
Figure 22: IR spectrum from wax B and both separating phases, DMF and Heptane.
Heptane Phase
DMF Phase
Wax B

Development of formulation-specific analytical methods
25
Figure 23: DMF, middle and heptane phases from wax B before and after drying.
In Figure 24 it is also possible to identify a saturated hydrocarbon. This is a long chain
hydrocarbon because it is visible a peak around 720 cm-1. However, this spectrum has some
peaks impossible to identify and this peaks could mean that other compounds exist.
Figure 24: IF compounds analysis in the DMF phase of the separation of wax B.
In Figure 26 it is found a C-O bond around 1115 cm-1 that characterizes ether. As in most
spectrums an unsaturated hydrocarbon is also identified.
Figure 25: Ether molecular structure.
Figure 26: IF compounds analysis in the heptane phase of the separation of wax B.

Development of formulation-specific analytical methods
26
Sample: Wax C
An infrared analysis was performed in wax C and in both extractable phases as is possible to
see in Figure 27.
Figure 27: IR spectrum from wax C and both separating phases, DMF and Heptane.
Figure 28: DMF, middle and heptane phases from wax C before and after drying.
In Figure 29 it is visible a C=O bond around 1715 cm-1 that characterizes a ketone. In this figure
and in Figure 30 it is visible a long chain saturated hydrocarbon.
Figure 29: IF compounds analysis in the DMF phase of the separation of wax C.
Heptane Phase
DMF Phase
Wax C
Development of formulation-specific analytical methods
27
Figure 30: If compounds analysis in the heptane phase of the separation of wax C.
Sample: Wax D
An infrared analysis was performed in wax D and in both extractable phases as is possible to
see in Figure 31.
Figure 31: IR spectrum from wax D and both separating phases, DMF and Heptane.
Figure 32: DMF, middle and heptane phases from wax D before and after drying.
In the DMF phase spectrum it is visible also a long chain hydrocarbon.
Heptane Phase
DMF Phase
Wax D

Development of formulation-specific analytical methods
28
Figure 33: IF compounds analysis in the DMF phase of the separation of wax D.
In this spectrum (Figure 34) it is found a C-O bond around 1115 cm-1 that characterizes ether.
As in most spectrums a saturated hydrocarbon is also identified.
Figure 34: IF compounds analysis in the heptane phase of the separation of wax D.
4.3 Ester number
4.3.1 Saponification value
Calculations
( )
( )
MWKOH = 56.1 g·mol-1
Results
Sample: Oleic acid
The standardization of HCl was made with 0.5 N KOH. The concentration of HCl is 0.4717 mol·L-
1.

Development of formulation-specific analytical methods
29
Table 8: Saponification values of Oleic acid.
( ) ( ) ( ) Saponification value (mg KOH·g-1)
4.05 53.0 21.8 203.9 4.09 53.0 21.7 202.5
4.07 53.0 21.9 202.2
Average ± Standard Deviation 202.9 ± 0.9
4.3.2 Acid Value
Calculations
( )
( )
Using 0.5 N KOH
( )
MWKOH = 56.1 g·mol-1
Results
Sample: Oleic acid
Table 9: Acid values of Oleic acid.
( ) ( ) Acid value (mg KOH·g-1)
2.50 21.8 202.0 2.52 18.2 202.6
2.53 18.2 201.8
Average ± Standard deviation 202.1±0.4
4.4 Iodine Number
4.4.1 Carbon tetrachloride method
Calculation
( )
( )
MWI = 126.9 g·mol-1
Development of formulation-specific analytical methods
30
Results
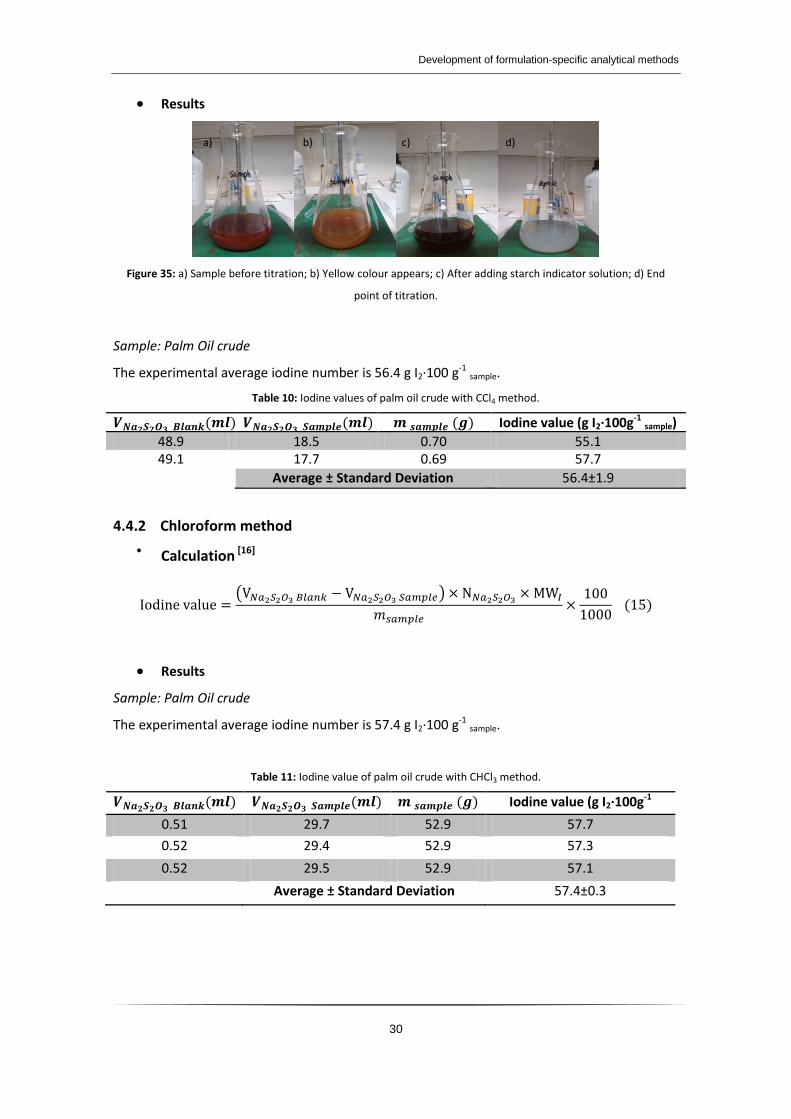
Figure 35: a) Sample before titration; b) Yellow colour appears; c) After adding starch indicator solution; d) End
point of titration.
Sample: Palm Oil crude
The experimental average iodine number is 56.4 g I2·100 g-1 sample.
Table 10: Iodine values of palm oil crude with CCl4 method.
( ) ( ) ( ) Iodine value (g I2·100g-1 sample)
48.9 18.5 0.70 55.1 49.1 17.7 0.69 57.7
Average ± Standard Deviation 56.4±1.9
4.4.2 Chloroform method
Calculation [16]
( )
( )
Results
Sample: Palm Oil crude
The experimental average iodine number is 57.4 g I2·100 g-1 sample.
Table 11: Iodine value of palm oil crude with CHCl3 method.
( ) ( ) ( ) Iodine value (g I2·100g-1
sample) 0.51 29.7 52.9 57.7
0.52 29.4 52.9 57.3
0.52 29.5 52.9 57.1
Average ± Standard Deviation
Standard
Deviation
57.4±0.3
a) b) c) d)
Development of formulation-specific analytical methods
31
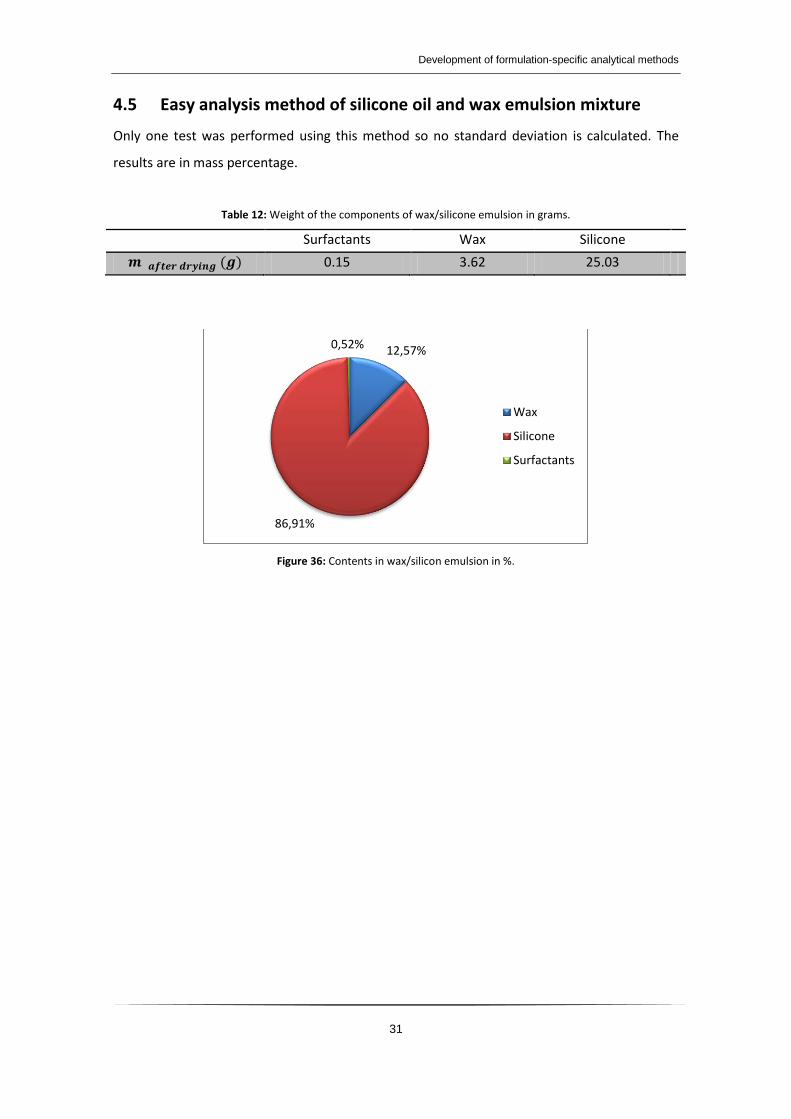
4.5 Easy analysis method of silicone oil and wax emulsion mixture
Only one test was performed using this method so no standard deviation is calculated. The
results are in mass percentage.
Table 12: Weight of the components of wax/silicone emulsion in grams.
Surfactants Wax Silicone
( ) 0.15 3.62 25.03
Figure 36: Contents in wax/silicon emulsion in %.
12,57%
86,91%
0,52%
Wax
Silicone
Surfactants
Development of formulation-specific analytical methods
32
5 Conclusions
All methods tested and implemented were effective and allowed to characterize and test
Govi’s products and raw materials.
5.1 Chloride content in oil emulsion
Different methods were tested to determine chloride content in the oil emulsion selected.
However, only two methods provided good results.
Volhard’s method lacked accuracy and was therefore not suitable for these samples.
The potentiometric method using a silver ring electrode and the syringe pump to transfer the
AgNO3 to the samples was more sensitive and can be applied to coloured even turbid samples.
In one emulsion sample 10 ppm Cl- was added. Then the original sample was compared to this
sample with higher chloride concentration, using the latter method, 8.7 ppm was traced back,
showing that this method is reliable.
5.2 Compounds in oils and waxes extractable with a polar solvent
Both polar and nonpolar solvents were selected and added to the wax or oil. After boiling,
polar compounds are concentrated in the polar phase (DMF phase) spectrum and nonpolar
compounds on the nonpolar phase (heptane phase). Infrared analysis provides mainly
qualitative information of chemical bonds.
Quantitative information on polar compounds can be obtained by weighting the amounts in
each solvent. With this method it is possible to determine the extractable matter in the two
solvent phases. Wax B showed a higher amount of DMF extractable matter than the others.
5.3 Ester number in bio-oils
The ester number is the difference between saponification and acid values. The average
saponification value is 202.9±0.88 mg KOH·g-1and the average acid value is 202.1±0.42 mg
KOH·g-1. So the ester number is 0.8±1.0 mg KOH·g-1.

Development of formulation-specific analytical methods
33
5.4 Iodine number in bio-oils
For the palm oil crude sample the iodine value in the technical data sheet was between 48.0
and 58.0 g I2·100 g-1 sample whereas on the work was found 56.4±1.87 and 57.1±0.31 g I2·100 g-1
sample for CCl4 and CHCl3 methods respectively.
5.5 Easy analysis method of silicone oil and wax emulsion mixture
The emulsion tested has 0.52 % (m/m) of surfactants, 12.57 % (m/m) of wax and 86.91 %
(m/m) of silicone. However this result might not be conclusive because only one test was
performed due to the lack of time.
5.6 Future Work
In the future, the phosphorus and sulphur determination methods should be applied because
they were analysed and their execution is possible. Another possible future work is to apply
the extracted wax in boards in order to see if the performance improved.
One important task is to continue testing emulsion components and test new components in
order to achieve the 20 ppm demanded by the costumers.

Development of formulation-specific analytical methods
34
References
1. University of Canterbury. Determination of Chloride Ion Concentration by Titration
(Mohr’s Method). www.outreach.canterbury.ac.nz. Retrieved September 22, 2013, from:
http://www.outreach.canterbury.ac.nz/chemistry/documents/chloride_mohr.pdf.
2. University of Canterbury. Determination of Chloride Ion Concentration by Titration
(Volhard’s Method). www.outreach.canterbury.ac.nz. Retrieved September 22, 2013, from:
http://www.outreach.canterbury.ac.nz/chemistry/documents/chloride_volhard.pdf.
3. Metrohm. Basics of Potentiometry. www.metrohm.com. Retrieved October 17, 2013,
from:http://www.metrohm.com/com/downloads/Support_pdf/BASICS_OF_POTENTIOMETRY.
pdf.
4. Potentiometric Titration Apparatus. www.clipartist.net. Retrieved December 18, 2013,
from: http://clipartist.net/svg/potentiometric-titration-apparatus-september-2011-clip-art-
svg-openclipart-org-commons-wikimedia-org-clipartist-net/.
5. Clescer, Lenore S.. Standard Methods for the Examination of Water and Wastewater.
20th Edition. American Public Health Association. 1998.
6. Dublin City University. www.dcu.ie. Retrieved October 15, 2013, from:
http://www.dcu.ie/chemistry/asg/mcgrawc/index.shtml.
7. Argonne National Laboratory. Sulphur in heavy oils, oil sands and oil shales.
web.anl.gov. Retrieved January 15, 2014 from:
http://web.anl.gov/PCS/acsfuel/preprint%20archive/Files/22_3_MONTREAL_06-77_0086.pdf .
8. Levaggi,D.A., Feldstein, M.. A rapid method for the determination of sulphur in fuel oil
by the Schoniger oxygen flask method. Journal of air pollution control association. 2012.
9. Virtuellen Museum der Wissenschaft. Schoeniger kolben. www.amuseum.de. Retrived
in October 20, 2013, from:http://www.amuseum.de/chemie/Schoeniger/schoenigerFlask.htm.
10. U.S. Pharmacopeia. Oxygen flask combustion. www.pharmacopeia.cn. Retrieved
October 20, 2013, from: http://www.pharmacopeia.cn/v29240/usp29nf24s0_c471.html.
11. Stuart, B. (2004).Infrared spectroscopy: fundamentals and applications. John Wiley &
Sons, Ltd. p. 1-18.
12. Lookchem. Ester number. www.lookchem.com. Retrieved October 17, 2013, from:
http://www.lookchem.com/Dictionary/Ester_Number/.

Development of formulation-specific analytical methods
35
13. Virtual Amrita laboratories universalizing education. Estimation of saponification value
for fats/oils. amrita.vlab.co.in. Retrieved in October 10, from:
http://amrita.vlab.co.in/?sub=3&brch=63&sim=688&cnt=1.
14. Lubrizol. Acid Value. www.lubrizol.com. Retrieved October 20, 2013, from:
http://www.lubrizol.com/Personal-Care/Documents/Test-Procedures/Emulsifiers/TP-
AATM_109-01.pdf.
15. ASTM Standard D 5554-95, Standard Test Method for Determination of the Iodine
Value of Fats and Oils, ASTM International, West Conshohocken, PA 19428-2959.
16. Seatons. Iodine Value. www.seatons-uk.co.uk. Retrieved October 20, 2013, from:
http://www.seatons-uk.co.uk/home.aspx?s=62&r=109&p=507
17. QuadraChem Laboratories. Iodine Value of Animal and Vegetables Fats and Oils.
www.qclscientific.com. Retrieved November 7, 2013, from:
http://www.qclscientific.com/pdfs/Apps%20Notes/Iodine%20Value%20of%20Animal%20and
%20Vegetable%20Fats%20and%20Oils.pdf.
18. ASTM Standard D 5558-95, Standard Test Method for Determination of the
Saponification Value of Fats and Oils, ASTM International, West Conshohocken, PA 19428-
2959.
19. Classle. Estimation of Iodine Value of Oil. www.classle.net. Retrieved January 5, 2014,
from: https://www.classle.net/book/estimation-iodine-value-oil#.
20. Stuart, B. (2004).Infrared spectroscopy: fundamentals and applications. John Wiley &
Sons, Ltd. p. 115.

Development of formulation-specific analytical methods
36
Appendix A – Potentiometric results
a) Pipette method / Weight method
The potentiometric method was tested using also a pipette to transfer AgNO3 to the sample
and also weighting AgNO3 and transfer into the sample.
Table 13: Concentrations of Cl- in the standards, volumes of solution titrate and of AgNO3 that should be spent using
a pipette.
Standards ( ) ( ) ( ) ( )
1 70.9 0.001 20 40
2 35.5 0.001 50 50
3 17.4 0.001 40 20
4 7.1 0.001 30 6
The use of the second derivate to determine the equivalence point is impossible because the
graphic has a lot of noise. However it is possible to see in Figure 37 that the expected values of
AgNO3 volumes are achieved.
Figure 37: Experimental titration curves (pipette method) from the standards in Table 13 relating the volume of
AgNO3 spent and the electrical potential (mV).
-50
0
50
100
150
200
0 10 20 30 40 50 60 70 80
E(m
V)
V AgNO3 (ml)
1
2
3
4

Development of formulation-specific analytical methods
37
Figure 38: Relationship between the experimental and the theoretical Cl- concentration in ppm in the pipette
method.
Figure 39: Titration curves, obtained titrating with 0.01 mol·L-1
AgNO3, of sample W ( green lines) and sample Y (red
lines) using the weight method and chloride concentration in the sample in ppm.
b) Pump method
Standards solutions of NaCl were prepared by dilution of 0.1 mol·L-1 and tested using a
potentiometric method adding AgNO3 with a pump.
Table 14: Concentrations of Cl- in the standards, volumes of solution titrate and of AgNO3 that should be spent
using a pump.
Standards ( ) ( ) ( ) ( )
1 70.90 0.001 20 40
y = 0,95x + 5,91
0
10
20
30
40
50
60
70
80
0 20 40 60 80
Exp
eri
me
nta
l Co
nce
ntr
atio
n C
l- (p
pm
)
Theoretical concentration Cl- (ppm)
-70
-20
30
80
130
180
0 1 2 3 4 5 6
E (m
V)
m AgNO3 (g)
35 ppm
38 ppm
33 ppm
34 ppm
34 ppm

Development of formulation-specific analytical methods
38
2 35.45 0.001 20 20
3 17.43 0.001 20 10
4 7.09 0.001 30 6
Figure 40: Titration curves of NaCl standard solutions (E in mV versus V AgNO3 in ml) and experimental
concentration of Cl- in ppm.
c) Titration tables
The potential E and the volume of AgNO3 (V) are the data achieved in the titration. ΔE/ΔV
(Equation 16) and Δ2E/ΔV2 (Equation 17) are the first and second derivate. With the second
derivate is possible to determine the V AgNO3 used. Table 15 it is an example of a table
used in all potentiometric procedures. This table has the data of the standard with 35.45
ppm of Cl-.
( )
( )
(
)
( )
Table 15: Titration data and first and second derivate.
( ) ( )
11 0 1
16 5 0
1
21 10 0.2
2
-10
40
90
140
190
0 10 20 30 40 50 60
E (m
V)
V AgNO3 (ml)
73,80 ppm
38,49 ppm
22,16 ppm
13,52 ppm

Development of formulation-specific analytical methods
39
31 15 1.25
4.5
40 17 2.5
7
47 18 1
8
55 19 6
14
69 20 10
24
93 21 -4
20
113 22 -3
17
130 23 -5.5
6
142 25 -0.56
3.2
158 30 -0.16
2.4
170 35 -0.24
1.2
176 40
To calculate de volume of AgNO3 used to in the equivalence point it is necessary to calculate
the point where the second derivate is zero. So an interpolation between the values 10 e -4
was done. With the volume of AgNO3, the volume of initial sample and the concentration of
AgNO3 it is possible to determine the concentration of Cl- in the sample.

Development of formulation-specific analytical methods
40
Appendix B – Infrared Spectrums
Table 16: Weights of DMF, middle and heptane phases before and after drying of the oils samples.
Oil Phase ( ) ( )
A DMF 46.50 2.40
Middle 3.43 1.14
Heptane 94.74 47.09
B DMF 45.14 1.31
Middle 1.34 0.44
Heptane 102.91 51.11
Sample: Oil A
Figure 41: Infrared test in Oil A.
Sample: Oil B
Figure 42: Infrared test in oil B.
Heptane Phase
DMF Phase
Heptane Phase
DMF Phase

Development of formulation-specific analytical methods
41
Table 17: Weights of DMF, middle and heptane phases before and after drying of the oils samples.
Wax Phase ( ) ( )
A DMF 41.83 0.20
Middle 3.60 0.62
Heptane 94.31 44.62
B DMF 42.68 0.58
Middle 1.68 0.52
Heptane 91.75 46.34
C DMF 49.59 0.95
Middle 1.72 0.81
Heptane 97.82 49.33
D DMF 42.11 0.50
Middle 1.64 0.52
Heptane 108.43 53.17
E DMF 40.20 0.20
Middle 1.37 0.17
Heptane 104.47 53.48
Sample: Wax A
Figure 43: Infrared test in wax A.
Sample: Wax B
Figure 44: Infrared test in wax B.
Heptane Phase
DMF Phase
Heptane Phase
DMF Phase

Development of formulation-specific analytical methods
42
Sample: Wax C
Figure 45: Infrared test in wax C.
Sample: Wax D
Figure 46: Infrared test in wax D.
Heptane Phase
DMF Phase
Heptane Phase
DMF Phase

Development of formulation-specific analytical methods
43
Appendix C – Reagents
Table 18: Products codes and suppliers.
Reagent Concentration Code Supplier
KSCN - 27035.230 Prolabo AgNO3 0.1 mol·L-1 1.09081.1000 Merck
NH4Fe(SO4)2 - 1.03776.0500 Merck
H2O2 33% 23613.297 Merck
HNO3 Concentrated 9606-34 J.T. Baker
NaCl 0.1 mol·L-1 35616 Alfa Aesar
Heptane - 24548.367 Prolabo
DMF - 0464-500ML Ambresco
HCl 5 N 30018.320 Prolabo
KOH in ethanol 0.5 N 31308.297 Prolabo
Phenolphthalein - 1.07233.0100 Merck
Ethanol 96% (v/v) 84836.360 Prolabo
CCl4 - 22521.293 Prolabo
Wijs solution - 2812.1000 Prolabo
KI 1.05043.1000 Merck
Na2S2O3 0.1 N 1.09147.1000 Merck
Starch indicator 1% 1085103 Reagecon
CHCl3 - 22706.326 Prolabo
Hexane - 24611.366 Prolabo