Development Of FIAT-Based Thermal Protection System Mass ... · American Institute of Aeronautics...
10
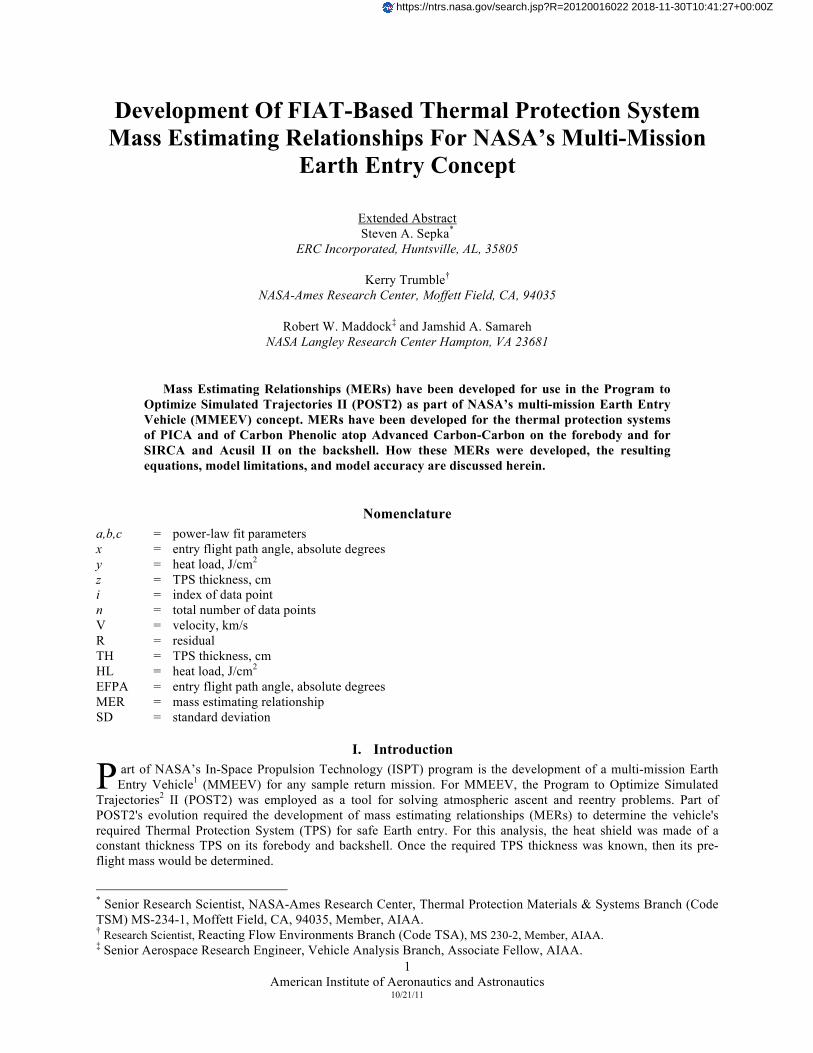
American Institute of Aeronautics and Astronautics 10/21/11 1 Development Of FIAT-Based Thermal Protection System Mass Estimating Relationships For NASA’s Multi-Mission Earth Entry Concept Extended Abstract Steven A. Sepka * ERC Incorporated, Huntsville, AL, 35805 Kerry Trumble † NASA-Ames Research Center, Moffett Field, CA, 94035 Robert W. Maddock ‡ and Jamshid A. Samareh NASA Langley Research Center Hampton, VA 23681 Mass Estimating Relationships (MERs) have been developed for use in the Program to Optimize Simulated Trajectories II (POST2) as part of NASA’s multi-mission Earth Entry Vehicle (MMEEV) concept. MERs have been developed for the thermal protection systems of PICA and of Carbon Phenolic atop Advanced Carbon-Carbon on the forebody and for SIRCA and Acusil II on the backshell. How these MERs were developed, the resulting equations, model limitations, and model accuracy are discussed herein. Nomenclature a,b,c = power-law fit parameters x = entry flight path angle, absolute degrees y = heat load, J/cm 2 z = TPS thickness, cm i = index of data point n = total number of data points V = velocity, km/s R = residual TH = TPS thickness, cm HL = heat load, J/cm 2 EFPA = entry flight path angle, absolute degrees MER = mass estimating relationship SD = standard deviation I. Introduction art of NASA’s In-Space Propulsion Technology (ISPT) program is the development of a multi-mission Earth Entry Vehicle 1 (MMEEV) for any sample return mission. For MMEEV, the Program to Optimize Simulated Trajectories 2 II (POST2) was employed as a tool for solving atmospheric ascent and reentry problems. Part of POST2's evolution required the development of mass estimating relationships (MERs) to determine the vehicle's required Thermal Protection System (TPS) for safe Earth entry. For this analysis, the heat shield was made of a constant thickness TPS on its forebody and backshell. Once the required TPS thickness was known, then its pre- flight mass would be determined. * Senior Research Scientist, NASA-Ames Research Center, Thermal Protection Materials & Systems Branch (Code TSM) MS-234-1, Moffett Field, CA, 94035, Member, AIAA. † Research Scientist, Reacting Flow Environments Branch (Code TSA), MS 230-2, Member, AIAA. ‡ Senior Aerospace Research Engineer, Vehicle Analysis Branch, Associate Fellow, AIAA. P https://ntrs.nasa.gov/search.jsp?R=20120016022 2018-11-30T10:41:27+00:00Z
Transcript of Development Of FIAT-Based Thermal Protection System Mass ... · American Institute of Aeronautics...
American Institute of Aeronautics and Astronautics
10/21/11
1
Development Of FIAT-Based Thermal Protection System Mass Estimating Relationships For NASA’s Multi-Mission
Earth Entry Concept
Extended Abstract Steven A. Sepka*
ERC Incorporated, Huntsville, AL, 35805
Kerry Trumble† NASA-Ames Research Center, Moffett Field, CA, 94035
Robert W. Maddock‡ and Jamshid A. Samareh NASA Langley Research Center Hampton, VA 23681
Mass Estimating Relationships (MERs) have been developed for use in the Program to Optimize Simulated Trajectories II (POST2) as part of NASA’s multi-mission Earth Entry Vehicle (MMEEV) concept. MERs have been developed for the thermal protection systems of PICA and of Carbon Phenolic atop Advanced Carbon-Carbon on the forebody and for SIRCA and Acusil II on the backshell. How these MERs were developed, the resulting equations, model limitations, and model accuracy are discussed herein.
Nomenclature a,b,c = power-law fit parameters x = entry flight path angle, absolute degrees y = heat load, J/cm2 z = TPS thickness, cm i = index of data point n = total number of data points V = velocity, km/s R = residual TH = TPS thickness, cm HL = heat load, J/cm2 EFPA = entry flight path angle, absolute degrees MER = mass estimating relationship SD = standard deviation
I. Introduction art of NASA’s In-Space Propulsion Technology (ISPT) program is the development of a multi-mission Earth Entry Vehicle1 (MMEEV) for any sample return mission. For MMEEV, the Program to Optimize Simulated
Trajectories2 II (POST2) was employed as a tool for solving atmospheric ascent and reentry problems. Part of POST2's evolution required the development of mass estimating relationships (MERs) to determine the vehicle's required Thermal Protection System (TPS) for safe Earth entry. For this analysis, the heat shield was made of a constant thickness TPS on its forebody and backshell. Once the required TPS thickness was known, then its pre-flight mass would be determined.
* Senior Research Scientist, NASA-Ames Research Center, Thermal Protection Materials & Systems Branch (Code TSM) MS-234-1, Moffett Field, CA, 94035, Member, AIAA. † Research Scientist, Reacting Flow Environments Branch (Code TSA), MS 230-2, Member, AIAA. ‡ Senior Aerospace Research Engineer, Vehicle Analysis Branch, Associate Fellow, AIAA.
P
https://ntrs.nasa.gov/search.jsp?R=20120016022 2018-11-30T10:41:27+00:00Z

American Institute of Aeronautics and Astronautics
10/21/11
2
A typical re-entry problem requires computational aerothermodynamics to understand the flow conditions around the vehicle and to determine the convective and radiative heating to its surface. Once the surface heating was known, than a TPS material response model would be used to determine the amount of heat shield material required to keep its bond line temperature below a specified value, and to know the amount of surface recession if heating was high enough to cause ablation. The traditional approach for this coupled problem would be to first use a high fidelity computational code such as DPLR3 or Laura4 for the aerothermal component and then FIAT5, CMA6, or STAB7 for the TPS response. However, this coupled approach usually has a very slow turnaround time and is highly dependent upon analyst availability. To circumvent these issues, POST2 employs correlations to bypass these codes with as minimal loss in accuracy as possible.
To determine the aerothermal environment, POST2 uses the Sutton - Graves8 correlation for the convective heating, and Tauber - Sutton9 for radiative heating. To date, however, no correlations based on high-fidelity FIAT modeling have been determined. The current work was to develop MERs using FIAT-based correlations with as high an accuracy to FIAT prediction as possible. Four MERs have been developed. For the vehicle forebody the ablators were Phenolic Impregnated Carbon Ablator10 (PICA) and Carbon Phenolic11 atop Advanced Carbon-Carbon. For the vehicle backshell the insulators were Silcone Impregnated Reusable Ceramic Ablator12 (SIRCA) and Acusil13 II. Insulators are used on the backshell because the aerothermal environment was so mild to warrant the use of an insulative material. As will be shown, the MERs were accurate to FIAT prediction within 6 to 13% at one standard deviation.
With the development of these MERs, MMEEV can now use POST2 to perform trade studies involving entry velocity, ballistic coefficient, vehicle geometry, entry flight path angle, etc. and now include TPS thickness as an output variable. Design turnaround times for a possible Earth entry configuration have been reduced from weeks to minutes for a set of proposed flight conditions. For these MERs, no margins were added to the calculated TPS thickness requirement.
II. Comparison of DPLR and POST2 Aerothermal Environment Calculations Before developing the MERs, it was decided to compare POST2 aerothermal environment predictions to those of
the high-fidelity DPLR. This was done using the Mars Sample Return14 (MSR) flight conditions§ given in Table 1, for the forebody stagnation point. The results are shown below for surface pressure (Fig. 1) and heat flux (Fig. 2). The CFD DPLR point considered was at peak pressure along the trajectory. As shown in the figures, the difference in pressure was 0.3% and in heat flux was 15%. Both values confirmed good agreement between POST2 and DPLR.
Table 1. MSR flight conditions.
Item Value MSR EEV Diameter 0.9 meter
Entry mass 44 kg Hypersonic ballistic coefficient: 46.7 kg/m2
Ballistic coefficient at terminal velocity with the lower drag coefficient
94.57kg/m2
Entry velocity 11.56 km/s Entry flight path angle -25 deg
§ Data given through private communications with Robert Dillman, NASA-Langley Research Center.

American Institute of Aeronautics and Astronautics
10/21/11
3
Figure 1. Comparison of POST2-derived pressure pulse and DPLR stagnation point peak pressure. The difference is about 0.3%.
Figure 2. Comparison of POST2-derived convective heat pulse and DPLR stagnation point peak heating. The difference is ~15%.
III. MER Model Development
A. Concern Regarding the Application of MERs The MERs presented in this paper are statistical correlations developed to predict FIAT output. Each MER has
with it a listed accuracy to FIAT prediction, which was found by taking the standard deviation of the MER/FIAT value for all the trajectories. These correlations are only valid only for the FIAT TPS thickness range that is given with each MER. If the MER were to predict a required TPS thickness greater than this range, then the model is not appropriate and FIAT or some other high-fidelity material response code should be used to do the proper analysis. It is emphasized that the MER TPS maximum thickness is not the manufacturing limit of the material’s thickness or the limit to a TPS material’s applicability for a proposed flight path. For example, Stardust flew with a PICA thickness15 of 5.816 cm (2.29 inch), which is much greater than the 4.445 cm allowed by the PICA MER (to be shown below). POST2 has correctly implemented the MER TPS prediction limits into its code.
Finally, it should also be noted that as for any statistical analysis, there exist trajectories for which the ratio of MER/FIAT prediction can far exceed the listed MER accuracy. It is for this reason that full datasets are presented showing MER/FIAT data with FIAT predicted thickness. POST2 utilizes these MERs as a “rough approximation” to determine flight trajectories of interest, but always maintains that a true high-fidelity analysis is a requirement as proposed sample return mission moves forward in its development.
B. Flight Trajectory Found in Table 2 is the flight trajectory range that was considered for the present study.

American Institute of Aeronautics and Astronautics
10/21/11
4
Table 2. Flight trajectory space considered for the MERs
Flight Trajectory Parameter Range of Values Resolution Entry Velocity [km/s] 10-16 1 Entry Flight Path Angle [abs. deg.] 5-25 5 Ballistic Coefficient [kg/m2] 41.95 – 128.74 15.5 (max) Total number of trajectories 840 -
C. FIAT modeling constraints FIAT was run for each trajectory with the following constraints that were common for each developed MER:
1. The maximum temperature at the bottom face of the top material was 250°C. 2. An adiabatic back face of the material stack up. 3. A surrounding environment temperature of 21.3°C (for radiation from the spacecraft surface). 4. 1D planar geometry 5. FIAT v2.6.1
It should be noted that FIAT, being a 1D code, was most applicable for regions on the heat shield that did not change shape quickly, such as along the flank or any other acreage location. For regions that do change shape quickly, like at the shoulder, the material response code TITAN16 would be more appropriate because it includes 2D effects. In addition, PICA’s heat conduction was orthotropic, which also necessitates the use of TITAN along regions of the heat shield that change shape quickly. Shown in Table 3 are the range of heating rates, heat loads, and surface pressure that were found from the FIAT analysis of the 840 flight trajectories.
Table 3. Surface heating and pressures ranges found by running FIAT over the 840 trajectories.
FIAT Range Forebody Backshell Maximum heat flux [W/cm2] 151 – 3767 2.3 – 58.1 Heat Load [J/cm2] 3855 – 34453 59.4 – 531.0 Maximum pressure, atm 0.03 – 3.182 0.005 – 3.182
D. Vehicle Forebody: MERs for PICA and Carbon Phenolic Sensitivity studies were conducted by plotting required TPS thickness against a variable of interest and looking
to see if any correlation existed. Variables of interest included: peak heat flux, peak surface pressure, heat load, ballistic coefficient, entry velocity, and entry flight path angle. Of these, heat load and entry flight path angle showed the greatest sensitivity to required TPS thickness and were chosen as the variables to use in a power-law correlation.
The results given in this section are listed by material stack up. Each MER correlations was a power-law fit to the following equation, with the required TPS thickness, TH, (given in centimeters):
€
TH = a HLb × EFPAc( ) (1)
No margins were added to the thickness. Goodness of fit (GoF) was defined as the ratio of MER prediction to FIAT output.
When FIAT ran all 840 trajectories, 123 of them that were so mild as to produce little or no recession/ablation for either PICA or Carbon Phenolic. For such mild, non-ablating environments, the proper heat shield material would be an insulator rather than an ablator. However, the lower limit of the MER TPS thickness range can be used as a bound for the minimum thickness needed to keep the bond line temperature below 250°C, with the following exception. Three of the mild trajectories (entry velocity = 11 km/s, EFPA = 5° (absolute), ballistic coefficient 97.8 – 128.7 kg/m2) required a slightly higher MER minimum thickness (PICA = 2.1437 cm and Carbon Phenolic = 1.458 cm). The FIAT-predicted heat load for these three cases was 13.32 – 13.95 kJ/cm2, nearly twice the amount (or more) as the other 120 mild trajectories.
The upper limit of the MER thickness range was chosen to give as small an error as possible to FIAT prediction while having as large a range of flight trajectories as possible.

American Institute of Aeronautics and Astronautics
10/21/11
5
1. PICA MER The material stack up for this MER consisted of PICA with an adiabatic back wall. This MER had an accuracy to
FIAT prediction of 13.1% at one standard deviation subject to the constraints given in Section IIIA. Specifics of the flight trajectory space and correlation model are given in Table 4. Scatter plots of GoF with heat load, entry flight path angle, and FIAT predicted TPS thickness are given in Figure 3. The correlation shows generally good agreement. Scatter increases with EFPA and required TPS thickness and decreases with heat load. This MER was good for the FIAT prediction range of 1.919 cm (0.755 inch) to 4.445 cm (1.75 inch), after which the model diverges rapidly.
Table 4. Flight trajectory space and correlation details for the PICA-only MER
Variable Values Recession [cm] 0.468 – 3.620 a 1.993062 b 0.13189 c -0.34152 Accuracy to FIAT at one SD 9.7% Trajectories with TPS thickness greater than 4.445 cm 48 Number of FIAT non-convergent trajectories 8 Trajectories with recession less than 0.1778 cm 123 Trajectories used for correlation 661 FIAT TPS thickness range, cm 1.919-4.445
Figure 3. PICA-only MER goodness of fit versus FIAT-predicted PICA thickness. Goodness of fit is given as the ratio of FIAT to correlation prediction. A GoF value of 1.0 indicates a perfect fit. 2. Carbon Phenolic Atop Advanced Carbon-Carbon 6 MER The material stackup is given in Table 3. The ACC6 was the carrier structure. Table 5. Material stackup
Material Thickness, cm Carbon Phenolic variable HT-424 (adhesive) 0.0381 Advanced Carbon-Carbon (ACC) version 6 0.250

American Institute of Aeronautics and Astronautics
10/21/11
6
This MER had accuracy to FIAT prediction of 8.6% at one standard deviation subject to the constraints given in Section IIIA. No margins have been added to the thickness. Specifics of the flight trajectory space and correlation model are given in Table 5. A scatter plots of GoF with FIAT predicted TPS thickness are given in Figure 4. This MER was good for the FIAT prediction range of 1.245 cm (0.490 inch) to 4.304 cm (1.694 inch).
Table 6. Flight trajectory space and correlation details for the Carbon Phenolic atop ACC MER
Variable Values Recession [cm] 0.458 – 2.713 a 2.366755 b 0.107048 c -0.374326 Accuracy to FIAT at one SD 8.6% Trajectories with TPS thickness greater than 4.304 cm 5 Number of FIAT non-convergent trajectories 8 Trajectories with no recession 123 Trajectories used for correlation 712 FIAT TPS thickness range, cm 1.245-4.304
Figure 4. Carbon Phenolic over ACC6 MER, goodness of fit versus FIAT-predicted PICA thickness.
E. Vehicle Backshell TPS: SIRCA and Acusil II For the backshell, each MER correlation had a power-law fit given in Eqn. 19, with the required TPS thickness,
TH, (given in centimeters):
€
TH = a HLV 2
⎛
⎝ ⎜
⎞
⎠ ⎟ b
(2)
No margins were added to the thickness. Goodness of fit (GoF) was defined as the ratio of MER prediction to FIAT output. Out of the 840 trajectories considered, only six cases occurred where the surface energy balance in FIAT did not converge. There were no MER modeling cutoffs based on FIAT predicted TPS thickness like those found for MER forebodies.
American Institute of Aeronautics and Astronautics
10/21/11
7
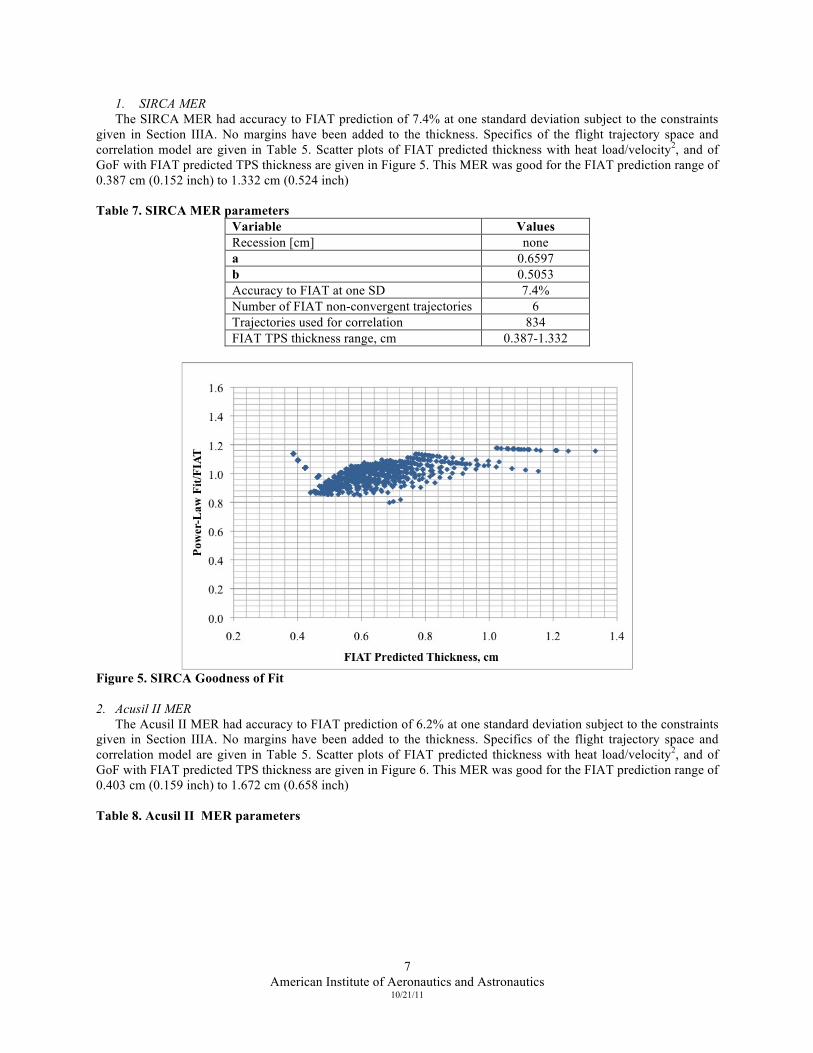
1. SIRCA MER The SIRCA MER had accuracy to FIAT prediction of 7.4% at one standard deviation subject to the constraints
given in Section IIIA. No margins have been added to the thickness. Specifics of the flight trajectory space and correlation model are given in Table 5. Scatter plots of FIAT predicted thickness with heat load/velocity2, and of GoF with FIAT predicted TPS thickness are given in Figure 5. This MER was good for the FIAT prediction range of 0.387 cm (0.152 inch) to 1.332 cm (0.524 inch)
Table 7. SIRCA MER parameters
Variable Values Recession [cm] none a 0.6597 b 0.5053 Accuracy to FIAT at one SD 7.4% Number of FIAT non-convergent trajectories 6 Trajectories used for correlation 834 FIAT TPS thickness range, cm 0.387-1.332
Figure 5. SIRCA Goodness of Fit 2. Acusil II MER
The Acusil II MER had accuracy to FIAT prediction of 6.2% at one standard deviation subject to the constraints given in Section IIIA. No margins have been added to the thickness. Specifics of the flight trajectory space and correlation model are given in Table 5. Scatter plots of FIAT predicted thickness with heat load/velocity2, and of GoF with FIAT predicted TPS thickness are given in Figure 6. This MER was good for the FIAT prediction range of 0.403 cm (0.159 inch) to 1.672 cm (0.658 inch)
Table 8. Acusil II MER parameters

American Institute of Aeronautics and Astronautics
10/21/11
8
Variable Values Recession [cm] none a 0.8159 b 0.5886 Accuracy to FIAT at one SD 6.6% Number of FIAT non-convergent trajectories 6 Trajectories used for correlation 834 FIAT TPS thickness range, cm 0.403-1.672
Figure 6. Acusil II Goodness of fit
IV. PICA Arcjet Testing Database The PICA correlations that have been developed are for a trajectory space that includes a peak heat flux of over
3700 W/cm2 as part of its applicability range. PICA has never been tested under such high heating, and it is unlikely to be able to withstand such conditions, so caution must be used when considering a trajectory for use with a PICA MER. It was estimated that a peak heat flux of about 1220 W/cm2 was experienced on the PICA heat shield of the Stardust17 capsule. A summary of arcjet tests form 2007-2010 is shown in Figure 7. For these tests, no material failure (spallation) was observed.
American Institute of Aeronautics and Astronautics
10/21/11
9
Figure 7. Stagnation tests of PICA in which no spallation was observed. Heat flux values are cold-wall.
V. Conclusion MERs have been presented for PICA, Carbon Phenolic atop Advanced Carbon-Carbon, SIRCA, and Acusil II
with accuracies ranging from 6 – 13% at one standard deviation. These MERs will be into POST2 in a first-generation process to estimate TPS mass. With subsequent revisions, it is likely that these MERs will be replaced with FIAT embedded into POST2.
Acknowledgments The authors gratefully acknowledge the support provided by the Thermal Protection Materials and Systems
Branch and the Reacting Flow Environments Branch of NASA Ames Research Center, through NASA Contract No. NNA10DE12C to the ERC Corporation.
American Institute of Aeronautics and Astronautics
10/21/11
10
References
1 Anderson, David J.; Dankanich, John; Munk, Michelle M.; Pencil, Eric; Liou, Larry “The NASA In-Space Propulsion Technology Project's Current Products and Future Directions” IEEE/AIAA Aerospace Conference; 6-13 Mar. 2010; Big Sky, MT; United States.
2 Striepe, S.A., Aguirre, J.T., Fisher, J.L., et al, “Program to Optimize Simulated Trajectories (POSTII), Vol. 1 Guide for New Users,” Version 1.1.6.G, November 2003, NASA Langley Research Center, Hampton, VA.
3 Wright, M.W., White, T., and Mangini, N., Data Parallel Line Relaxation (DPLR) Code User Manual Acadia Version 4.01.1, NASA/TM-2009-215388, October 2009.
4 Gnoffo, P. A., “An Upwind-Biased, Point-Implicit Relaxation Algorithm for Viscous, Compressible Perfect-Gas Flows,” NASA TP 2953, 1990
5 Chen, Y.-K., and Milos, F. S., “Fully Implicit Ablation and Thermal Analysis Program (FIAT),” Journal of Spacecraft and Rockets,Vol. 36, No. 3, pp 475-483, May–June 1999
6 Moyer, C. B., and Rindal, R. A., “An Analysis of the Coupled Chemically Reacting Boundary Layer and Charring Ablator – Part II. Finite Difference Solution for the In-Depth Response of Charring Materials Considering Surface Chemical and Energy Balances”, NASA CR-1061, 1968.
7 Curry, D. M., “An Analysis of a Charring Ablation Thermal Protection System”, NASA TN D-3150, November 1, 1965. 8 Sutton, K., Graves, R.A., “A General Stagnation-Point Convective Heating Equation For Arbitrary Gas Mixtures” NASA
TR R-376, November 1971. 9 Tauber, M.E., Sutton, K., “Stagnation-Point Radiation Heating Relations for Earth and Mars Entries” AIAA Journal of
Spacecraft, Vol. 28, No. 1. 10 Hui, T., Johnson, C., Rasky, D., Hui, F., Hsu, M., Chen, Y-K., “Phenolic Impregnated Carbon Ablators (PICA) For
Discovery Class Mission”,NASA Tech Briefs AIAA paper 1996-1911, presented at 31st AIAA Thermophysics Conference, New Orleans, LA, June, 1996.
11 Clements, H.R. and Ward, G.T., “Fabrication of Ablative Liners for Large Solid Booster Nozzles”, J. SPACECRAFT VOL. 3, NO. 4, April 1966
12 Tran, H.; Johnson, C.; Rasky, D.; and Hui, F. "Silicone Impregnated Reusable Ceramic Ablators for Mars Follow-on Missions", AIAA Paper 96-1819, June 1996.
13 Edquist, Karl T.; Dyakonov, Artem A.; Wright, Michael J.; Tang, Chun Y., “Aerothermodynamic Design of the Mars Science Laboratory Backshell and Parachute Cone” 41st AIAA Thermophysics Conference; 22-25 Jun. 2009; San Antonio, Texas; United States, AIAA Paper 2009-4078.
14 Amundsen, R.M., Dec, J.A., Mitcheltree, R.A., Lindell, M.C., Dillman, R.A. “Preliminary Thermal Analysis of a Mars Sample Return Earth Entry Vehicle” AIAA paper 2000-2584, 34th AIAA Thermophysics Conference, June 2000, Denver, CO.
15 Squire, T., Milos, F., Agrawal, P., “Analytical Predictions of Thermal Stress in the Stardust PICA Heatshield Under Reentry Flight Conditions”, National Space and Missile Materials Symposium, 28 Jun. - 1 Jul. 2009, Scottsdale, AZ, USA
16 Milos, F.S., Chen, Y.K., “Two-Dimensional Ablation, Thermal Response, and Sizing Program for Pyrolyzing Ablators”, AIAA paper 2008-1223, 46th AIAA Aerospace Sciences Meeting and Exhibit, 7 - 10 January 2008, Reno, Nevada.
17 Park, C., “Calculation of Stagnation-Point Heating Rates Associated with Stardust Vehicle” AIAA paper 2005-190, 43rd AIAA Aerospace Sciences Meeting and Exhibit, January 2005, Reno, Nevada