DEVELOPMENT OF FACET5 - maximumperformance.co.uk · • The 16PF • The Eysenck Personality...
43
Section 3 - Development of Facet5 Page 1 D EVELOPMENT OF F ACET 5 Page Development of Facet ............................................................................................... 3 Rationale............................................................................................................ 3 Item Generation ................................................................................................. 3 Format ............................................................................................................... 3 Item Analysis...................................................................................................... 4 Distributions/Biases ............................................................................................ 4 Extraction of Sub-factors ....................................................................................... 6 Interrelationships between the Five Factors ........................................................... 7 The Role of Emotionality........................................................................................ 7 Seeking a Balanced Sample .................................................................................. 8 Sources of Bias .................................................................................................. 8 Creating the Sample........................................................................................... 9 What does this mean?........................................................................................ 9 Are these differences unique to Facet5?........................................................... 10 Norms.................................................................................................................. 11 Original Development Sample.......................................................................... 11 Additional Norms .............................................................................................. 11 Selecting which norms to use ........................................................................... 11 Reliability ............................................................................................................. 12 Doing it again (Re-test reliability or Stability) .................................................... 12 Creating the Sample......................................................................................... 13 Is this good or bad? .......................................................................................... 13 Internal Consistency (Cronbach’s α) ................................................................ 14 Validity................................................................................................................. 15 Face Validity .................................................................................................... 15 Construct Validity ............................................................................................. 15 Content Validity ................................................................................................ 15 Concurrent or Predictive Validity ...................................................................... 16 Comparison with other models............................................................................. 17 Facet5 vs. 16PF ............................................................................................... 17 Computer/web based administration .................................................................... 19 Response Pattern ............................................................................................. 19 Response Pattern and Personality .................................................................... 20 Energy and Response Pattern .......................................................................... 22 Impression Management ...................................................................................... 24
Transcript of DEVELOPMENT OF FACET5 - maximumperformance.co.uk · • The 16PF • The Eysenck Personality...

Section 3 - Development of Facet5 Page 1
DEVELOPMENT OF FACET5 Page
Development of Facet ............................................................................................... 3 Rationale............................................................................................................ 3 Item Generation ................................................................................................. 3 Format ............................................................................................................... 3 Item Analysis...................................................................................................... 4 Distributions/Biases............................................................................................ 4
Extraction of Sub-factors ....................................................................................... 6 Interrelationships between the Five Factors ........................................................... 7 The Role of Emotionality........................................................................................ 7 Seeking a Balanced Sample .................................................................................. 8
Sources of Bias .................................................................................................. 8 Creating the Sample........................................................................................... 9 What does this mean?........................................................................................ 9 Are these differences unique to Facet5?........................................................... 10
Norms.................................................................................................................. 11 Original Development Sample.......................................................................... 11 Additional Norms.............................................................................................. 11 Selecting which norms to use ........................................................................... 11
Reliability............................................................................................................. 12 Doing it again (Re-test reliability or Stability) .................................................... 12 Creating the Sample......................................................................................... 13 Is this good or bad? .......................................................................................... 13
Internal Consistency (Cronbach’s α)................................................................ 14
Validity................................................................................................................. 15 Face Validity .................................................................................................... 15 Construct Validity ............................................................................................. 15 Content Validity ................................................................................................ 15 Concurrent or Predictive Validity ...................................................................... 16
Comparison with other models............................................................................. 17 Facet5 vs. 16PF............................................................................................... 17
Computer/web based administration .................................................................... 19 Response Pattern............................................................................................. 19 Response Pattern and Personality.................................................................... 20 Energy and Response Pattern .......................................................................... 22
Impression Management...................................................................................... 24

Section 3 - Development of Facet5 Page 2
Facet5 and Response Latency............................................................................. 27 Response Latency and Personality ...................................................................... 28
Speed of decision making ................................................................................ 28 Facet5 Scores and IM ...................................................................................... 30
The Effect of Valence .......................................................................................... 31 Valence and Facet5 scores .............................................................................. 31 Valence and Response Latencies..................................................................... 32
Reporting and Interpreting Response Latency...................................................... 33 1. Response Pattern .................................................................................. 33 2. Response Latency.................................................................................. 34 3. Response Distortion............................................................................... 35 4. List of Slowest Items.............................................................................. 37
Response Latency - Case 1 ................................................................................. 38 Response Latency - Case 2 ................................................................................. 40 Summary............................................................................................................. 42 References & Notes............................................................................................. 43

Section 3 - Development of Facet5 Page 3
DEVELOPMENT OF FACET
Rationale
Facet5 was designed in response to requests from companies for an instrument
that combined the ease of use and utility of some of the widely used management
tools and the psychometric integrity of the mainstream personality questionnaires.
Item Generation
The first step was to thoroughly review the relevant literature in order to define
the domains to be covered. In addition we reviewed a number of well-established
(and some less established) questionnaires. Included in these were:-
• The Humm-Wadsworth Temperament Scale (the first "criterion keyed"
personality questionnaire and fore-runner of the California Personality
Inventory and MMPI).
• The California Personality Inventory (CPI).
• The 16PF
• The Eysenck Personality Inventory.
• The Myers-Briggs Type Indicator.
• OPQ
In addition a database of over 200 items generated by repertory grid studies with
managers in industries ranging from airlines to cosmetics were sifted for content
and modified for inclusion where appropriate. These were all items which previous
research had proven were related to performance.
This produced a large selection of items that were repeatedly culled, refined and
assigned. Item assignment was tested by retranslation by psychologists and non-
psychologists. This resulted in 106 items, upon which there was general
agreement, being assembled for trial.
Format
When making judgements about personality, people often use an implicit opposite
to help define the scale. For example, if trying to rate how "friendly" someone is,
they will think of an implicit "hostile" as being the opposite end of the scale. This
then serves to "anchor" the ends of the scale and makes judgements easier.
The semantic differential technique developed by Osgood embodies this principle
by identifying antonymous adjectives, phrases or statements and placing them at
opposite ends of the scale. Such antonymous pairs emerge naturally as elements
in repertory grid analysis e.g., "this person is organised whereas these two are
disorganised!" The Facet5 Questionnaire takes this style. The 106 items are
arranged as antonymous phrases with a five point scale between them.1 Items
are presented one at a time and people have the opportunity to answer the
question or to skip it and come back to it later. This is very different from the

Section 3 - Development of Facet5 Page 4
earlier paper version where a person was presented with approximately 20 items
on a page.
One effect of this should be to make the item response times quicker and we have
evidence that this has happened. For example, experience with many thousands
of paper based questionnaires indicates that a total response time of about 20-25
minutes to complete the questionnaire is normal. This obviously varies from
person to person but in general a response time of more than 30 minutes was
thought to be quite long. People completing Facet5 as part of a selection process
tend to take a little longer than those completing it as part of a development plan.
This is in keeping with general experience of the use of psychometric instruments.
However early evidence from web-based completion is that the response time is
much faster, around 10 seconds per item.2 The chart below indicates the
response times for 7564 respondents who completed Facet5 on-line. From this
chart it is apparent that most items are responded to in less than 10 (average
response latency=8.8) seconds giving an overall test time of about 15 minutes.
Therefore the combination of sophisticated item format and web-administration
leads to a significant decrease in test taking time.
Mean Response Latency for Facet5 items
0
2
4
6
8
10
12
14
16
18
1 4 7 10
13
16
19
22
25
28
31
34
37
40
43
46
49
52
55
58
61
64
67
70
73
76
79
82
85
88
91
94
97
100
103
106
Facet5 item number
Tim
e in
sec
on
ds
n=7564
Item Analysis
Of the 106 variables trialled, 83 were felt to be sufficiently well distributed to
warrant inclusion in the scale. The mean scores, standard deviations and range
were checked to eliminate those items that were unsuitable. These items were
then analysed by correlating the items with the total scores to ensure that items
clearly loaded on one factor. This helped to clarify how items should load on each
scale. 3
Distributions/Biases
The items and scores on each of the dimensions assessed by The Facet5
Questionnaire have been selected in such a way as to give outcomes which, when

Section 3 - Development of Facet5 Page 5
tested on sufficient members of the management population, will spread along the
scale according to the normal distribution curve, or Gaussian distribution. This
should be taken into account when interpreting scores from The Facet5
Questionnaire.
The Facet5 Questionnaire is normative, in that results are expressed by
comparison with a particular reference group or "norm". The scores obtained are
of value when comparing individuals with one another. They provide a statement
of how each individual scores on each of the factors. This can be set against a
similar statement obtained from other people who have answered the same
questionnaire, so that people can be compared with one another, as in say, the
assessment of two candidates for the same job.
The Facet5 Questionnaire must be computer scored. This is because the final
scores are complex linear sums in which many items must be reversed and then
standardised (converted to Stens). This is a daunting task manually. A computer
can do this in seconds. The scores which emerge are not highly correlated so it is
perfectly possible for a candidate to be equally high (or low) on all the factors or to
achieve any other combination of scores.
The scoring programme automatically converts the scores to "Sten" scores.
"Sten" stands for "Standard Ten" and refers to a set of scores that have a
minimum of 1, a maximum of 10, a mean of 5.5 and a standard deviation of 2.4
Scores of below 4 or above 7 are unusual and can genuinely be described as "Low"
or "High". As individual scores reach these extremes, so the typical behaviour will
more obviously reflect the core elements of the factor.
People who obtain “medium” scores that fall in the mid-range of the scale, should
be considered to have a balanced personality with respect to that particular
dimension. This represents those individuals whose scores occur in the middle of
the possible range of scores. Those in the upper section of the scoring range
would be considered to be "high" scores on that dimension, while those in the
lower part of the scoring range are considered to be "low" scores on that
dimension. These upper and lower bands are described in the User Manual as "+"
or "-". A person whose score on the "Control" dimension is in the top 15% (above
7), would be described as "C+" whereas a person who is in the lower 15% (below
4) on the "Energy" dimension would be described as "E-".

Section 3 - Development of Facet5 Page 6
Extraction of Sub-factors
Although the items loading on each scale were selected to reflect the relevant
domain, clearly there are different aspects of these domains. For example Will
covers Determination, Confrontation and Independence and all the items go
together to form the total score on Will. However it is also likely that some
people will select the items relating to Confrontation for example more heavily
than the ones relating to Independence. To check this, the items which score on
each Facet5 factor were analysed to see whether they could be grouped into the
sub-factors (or facets) of the domain.
We selected a sample of 1000 cases of data and analysed each set of items in
turn. We used a method of factor analysis to see which items tended to correlate
with each other. We used principle components method to extract the factors
and then a Varimax rotation to clarify the meaning of the factors. This process
was repeated for each of the five main factors.
These sub-factors extracted are a very valuable guide to interpretation of Facet5
profiles. Very high scores can only occur when the respondent has marked almost
every item from the domain in the expected way. Therefore the sub-factors will
also be very high. The same is true for very low scores where the sub-factors will
be consistently low. However, more moderate scores may be achieved by a
number of different scores on the sub-factors and this can result in quite varied
combinations of sub-factor scores. This is seen by the differences in correlations
at different score levels. This is shown in the following table.
Correlations between sub-factors (facets)
0.00
0.10
0.20
0.30
0.40
0.50
0.60
0.70
Sten Scores <=4 Sten Scores >4<7 Sten Scores >=7
Averagecorrelationbetweenscales
Will
Affection
Control
Energy
This shows that at both the low and high ends of the scales, the sub-factor scores
are more highly correlated that they are for mid-range scores. All the lines have
a "dip" in the middle.

Section 3 - Development of Facet5 Page 7
Interrelationships between the Five Factors
For a personality questionnaire to be effective, it is not only important that it has
sufficient factors to account for most of the variation between people but also that
the factors which it produces are not heavily overlapping. There is little point in
measuring the same thing a number of times over. The degree to which a
questionnaire does this is demonstrated by the correlations between the factors.
In general terms, a correlation of less than 0.35 would be considered low enough
to suggest that the factors are not duplicated. The correlations between Facet5
factors are shown below.5
FACET5- CORRELATIONS Energy Affection Control Emotionality
Will 0.25 -0.25 0.09 -0.18 Energy 0.03 0.01 -0.30
Affection 0.11 -0.10 Control 0.01
Average absolute correlation: 0.03
From this it can be seen that the Facet5 factors are largely independent although
there are small negative correlations between Will and Affection and between
Energy and Emotionality.
The Role of Emotionality
Most trait models treat all the factors as roughly equal. However, the high
proportion of the variance accounted for by Emotionality leads some (e.g. Brand)
to suggest a more complex interactive model. Brand's model is operationalised in
Facet5. The main advantage that this approach confers is that Emotionality is
viewed as an interpreting factor on a different plane from the others and its main
function is to affect the interpretation of the picture portrayed by the other four
factors.
In this model Will and Affection tend to pull in opposite directions as do Energy
and Control. Readers familiar with Osgood's work6 on Semantic Differentials will
recognise his elements of Potency (Will vs. Affection) and Surgency (Energy vs.
Control). Emotionality however has a complex effect on the observed behaviour,
tending to blur the picture by introducing emotional responses into an otherwise
stable and reliable picture. The higher the level of Emotionality, the more difficult
it is to be certain how a person will react and the more likely it is that negative
aspects of behaviour will be seen.7

Section 3 - Development of Facet5 Page 8
Seeking a Balanced Sample
The original sample on which the Facet5 norms were based was collected
somewhat opportunistically and was designed to provide a broad representation of
the working population. Therefore there were more men than women
(67%:33%), there were more young people (87% < 40 years old) and they were
in general well educated (83% had at least finished 12 years of schooling).8 In
the original research we found few differences in the overall scores gained by men
and women. The only scale to show a reliable and consistent difference between
men and women was Emotionality where men scored slightly lower than women.
Although this difference was significant statistically it was not large enough
warrant a different interpretation strategy. More recently we have been asked
about these differences and whether the position had changed over the 10 years
since we first started collecting data.
This should have been a simple question to answer since we had access to a large
amount of data. We have thousands of cases of our own collected during
assessment and development programmes. We also had large amounts of data
collected by other people who were using Facet5 in a commercial setting. It
should be a simple exercise to calculate the statistics and see how they had
moved. However each time we tried it we got a different answer. Why was this?
The answer probably lies in the inconsistent and serendipitous way in which the
data was collected. Our database was supplied from, by definition, our own
clients, and therefore the composition will reflect the source of the data. We had
one organisation that used it extensively for recruitment of call centre staff
(mostly female) and their data showed a marked shift from the population norm.
Another company used Facet5 extensively for selection of finance staff (mostly
male) while a third focused on recruitment of field sales support staff (female).
Our own data on the other hand was largely from development centres so this
introduced a different bias again. We then added 2000 cases of Australian data
which introduced a third possible source of bias.
Sources of Bias
The fact that each of these sub-samples is biased is not surprising. In fact ASA
(Attraction-Selection-Attrition) theory suggests that this is exactly what we should
expect. This theory states that an applicant group will be pre-selected and that
this pre-selection will be shaped by the demands of the organisation. The
organisation's culture will define the way in which it represents itself to the world
and therefore its attractiveness to different people. For example a very stable
business with a long history of customer service will emphasise this in its
recruitment advertisements. People who like the idea of a job serving customers
will be attracted (the "A" part of ASA) to such an organisation. People who are
more interested in an aggressive, commercial operation may find the role (as
described) uninspiring and walk on by.

Section 3 - Development of Facet5 Page 9
Such an organisation will then set up a selection process designed to bring forward
those people who it feels share its corporate values (Service) and weed out those
who don't (the "S" part of ASA).
Finally, if the "wrong" people do slip through in spite of the selection process it will
not take long before they realise that they and the organisation are not "getting
along" and they will be the first to leave (or be pushed out - "the face doesn't fit").
This is the final "A" from ASA.
It is this ASA process which is claimed to be responsible for the long term success
of people in organisations. In the short term, success depends on how good they
are at the job (how "Competent") but in the long term it's more about the degree
to which they share the corporate values and vision. Technically this is the
difference between Person-Job (P-J) fit and Person-Organisation (P-O) fit.9
So what does this mean to us. It is clear that ASA theory is affecting the
composition of the database and therefore we need to find a way of balancing (or
removing) the effects as much as possible. One solution is to take a "balanced"
sample. Such a sample would select cases from the data but in such a way as to
make sure that different organisations and job functions are equally represented.
Given that some functions are heavily sex biased (there are far more female call
centre operators) we should also balance for sex.
Creating the Sample
To do this we identified the cases in the database where the function was known
and where there was a sufficient number of both males and females. This was
laborious but in the end we identified 12 such job functions which would give us 10
males and 10 females in each function. We then calculated the significance of the
differences between the two sets of scores on the five main Facet5 factors (we
assumed equal variances - no Fs were significant so it seems reasonable to make
this assumption). The results are shown in the table below.
Will Energy Affection Control Emotionality
Male 4.96 5.93 6.37 6.15 4.82
Female 4.58 5.69 6.49 6.16 5.32
T 1.54 .916 -.483 -.008 -2.14
Sig. .125 .361 .630 .994 .034
This shows that, as with the original sample, the only factor where there is a
significant difference is Emotionality. Women scored slightly higher than Men
(5.32 vs. 4.82), which is in keeping with the original research. It is also in
keeping with most other research, which shows Women to be a little more
"Emotional" than Men.
What does this mean?
This research suggests that, while there may be suspicions that women score
differently from men (higher on affection etc) this feeling may only be due to
selective sampling. Experience with Facet5 in a specific environment can easily

Section 3 - Development of Facet5 Page 10
leave a user with the feeling (and indeed the fact) that there is a consistent
pattern appearing in the profiles he/she is seeing. However when the data is
looked at more carefully and the effects of pre-selection and function specific
differences is ruled out, these differences disappear except for Emotionality where
a small difference will remain.
Are these differences unique to Facet5?
It is helpful to note that the original 16PF showed significant sex differences on 14
of the 16 factors (only factor B - Intelligence and Q2 - Self-sufficiency showed no
difference). 10 In the new 16PF5, 13 of the 16 factors show a sex bias (all except
F - Liveliness, Q1 - Openness to change and Q4 - Tension).11 The OPQ Concept 5
cites significant sex differences on 6 of the 30 scales12 and the MBTI, while not
citing specific studies looking at the significance of sex differences, does produce
separate Norm tables for Males and Females13.

Section 3 - Development of Facet5 Page 11
Norms
The Facet5 questionnaire was developed for the "Managerial and Professional"
groups. The norms therefore relate specifically to that group. The database is a
dynamic and rapidly growing one and currently contains in excess of 14000
profiles. For demonstration purposes we have chosen some representative
samples of cases to show the way in which the database is made up. The details
are:
Original Development Sample
AGE NUMBER %
20 110 18.8%
25 218 37.3%
30 74 12.7%
35 52 8.9%
40 55 9.4%
45 50 8.6%
50 9 1.05%
55 1 0.01%
60 3 0.05%
GENDER FREQUENCY PERCENT
Female 226 32.6%
Male 467 67.4%
EDUCATION FREQUENCY PERCENT
Unknown 51 8.2%
Below O's 9 1.5%
O' Levels 44 7.1%
A' Levels 68 11.0%
Degree 399 64.4%
Higher Degree 49 7.9%
Additional Norms
Additional norm groups are regularly added to the system and are available to all
users. Recently a range of Gender, Function and Industry Sector norms have
been made available. For details please go to the Facet5 web-site.
Selecting which norms to use
You have the opportunity to decide which norms to use whenever you print a
report. Profiles can be re-normed “on-the-fly”

Section 3 - Development of Facet5 Page 12
Reliability
A profile like Facet5 is only useful if the information it gives is generally reliable.
If a person completes the questionnaire a second time will they come up with
broadly the same scores? More importantly will the results be interpreted in
broadly the same way and would similar conclusions be drawn?
There are many technical definitions of reliability each of which is subtly different
from the others. For example we can divide the test into two halves and calculate
scores for each scale based on only half the items - are they similar? This tells us
whether the important items are evenly spread throughout the questionnaire.
This is "Split-Half" reliability. (If there is an odd number of items in each half
there are adjustments to be made to balance them up.)
A different type of reliability is calculated by sequentially deleting each item in turn
and seeing what the effect on the overall score is. This is referred to as
Cronbach's α and is a favourite of psychometricians.
Finally there is the one which most people would think of which is to look at two
sets of scores on two different occasions. This may appear to be the most
intuitively obvious measure but is frequently sneered at by psychometricians.
There are after all a number of factors that can influence things.
The most obvious and significant is the time between the first and second
administration. If the time delay is very short (say a week or two) then you
would expect the person to be in a similar frame of mind and not to have changed
his/her core views very much. Therefore the results should be quite similar. This
has therefore been called "dependability" rather than reliability. Reliability (or
Stability) is generally retained for longer re-test intervals.
Each of these approaches to evaluating Reliability yields a statistic that is a type of
correlation co-efficient. Therefore the figures produced can range from 0 to 1.
(Negative reliability statistics are conceivable but would make for interesting
interpretation.)
Doing it again (Re-test reliability or Stability)
People complete Facet5 twice for any number of reasons including:
• Mistake - they forgot that they had done it before. This is not uncommon with
selection candidates.
• Deception - they just want to see if they can sneak a "better" set of scores.
Again selection candidates are more likely to try this especially if they were not
appointed the first time - they may believe that the Facet5 profile influenced
the decision.
• Interest - they want to see if they've changed in some way since the first time.

Section 3 - Development of Facet5 Page 13
• Time - it has been a long time since they did it the first time and we wanted to
work with more up-to-date information. This would normally be the case if
we knew that a person had completed it more than 3 years previously.
• Mischief - they want to see if they can move the scores in a specific direction.
This is often the case with observers on assessment and development
programmes where Facet5 is being used and they have a little spare time.
In an ideal world we would like to see a sample of people who completed the
questionnaire and then had nothing to do with Facet5 until they were asked to
complete it again at least year later. This doesn't happen. Again in a perfect
world we would like to have nobody who was "playing" with the data or attempting
to deliberately distort it. In our sample we knew we had people from each of these
groups - we were not always sure who was who.
Creating the Sample
When we amalgamated the databases that we had collected we were able to
identify 107 people who had completed the questionnaire twice. Since we
actually knew the circumstances of most of these we could say with confidence
that the time delay was at least 3 months in all cases and as long as 3 years in
some. We were also able to identify some people from the last group who had
deliberately tried to distort the data (we knew because they told us).
We removed these "mischief-makers" and re-ran the re-test reliability on the new
sample of 68. Both sets of results are shown in Table 1.
Table 1
Will Energy Affection Control Emotionality
Original data .84 .85 .81 .85 .92
Reduced sample .86 .81 .84 .79 .85
Is this good or bad?
Good question! Statisticians are the worst people to ask about this since they will
always say the results need more data, more analysis or more time. However we
need to draw a line somewhere. In the social sciences re-test reliability figures
(which are correlations and can therefore range from -1.00 to +1.00) are usually
expected to be in excess of 0.6 and if they are too high then the data may be held
to be suspect. Out of interest we can compare some other well-known and highly
reputable instruments which publish their figures. They are shown in Table 2
below.

Section 3 - Development of Facet5 Page 14
Table 2
Source Range Average
Facet5 5.0 (reduced sample) .79 - .86 .83
MBTI 14 .60 - .75 .71
MBTI 15 .64 - .78 .70
16PF16 .28 - .63 .47
16PF17 .21 - .64 .47
Internal Consistency (Cronbach’s α)
α‘s are useful for both test users and developers. The test user needs to know
that the items that are used to measure a particular domain are consistent in that
they are all measuring the same concept to a broad degree. However there’s not
much point in asking exactly the same question 10 times. This would yield a very
consistent score but would be very narrow in its application. A better approach is
to define the whole domain you are interested in and then create items which
probe into all aspects of the domain. So although the questions are broadly
similar, they are not exactly the same.
Test developers use α’s to decide which items to include when they construct a
scale. The full calculation of α for a scale also shows how the individual items
contribute to the scale and what would happen if it was removed. They are an
essential part of the continuing review of any psychometric instrument.
So what value should we aim for? Psychometricians have to decide where to draw
the line between being very Consistent (high α) but missing part of the domain or
being very broad-brush (low α) but losing focus on the key aspects. There is no
exact rule for this but there are “rules of thumb” that have developed. α’s are a
type of correlation but they can only range from 0 to 1. An α value of about 0.7
is generally held to be desirable, giving the required balance of breadth of cover
and depth of analysis.
α’s have been calculated on the original development sample and are shown in
the table below.
Will Energy Affection Control Emotionality
Coefficient α .75 .71 .80 .78 .81
Section 3 - Development of Facet5 Page 15
Validity
It is not sufficient for a test to be reliable. For example it is conceivable that a test
could consistently report that a person was stunningly attractive to the opposite
sex but without some independent corroboration it may be dangerous to proceed
to implement a plan based on it. To determine whether a set of results will be of
use they must also be valid i.e. they must actually mean what they imply.
As with reliability, there are many ways of telling whether a test is valid.18
However those that would appear to be most important for practitioners are:
Face Validity
Face validity refers to the external view of the process or model, i.e. Does it look
as if it is going to give the information required. While this is a non-statistical
measure, it is still vitally important for personality measures. This is because
personality measures rely on the integrity of the respondent and if the person has
no faith in the process, then it is unlikely they will take it seriously.
Facet5 has attempted to ensure face validity in three ways:
1. to only use work based language
2. to avoid the use of idiom or slang as far as possible
3. to use an item structure which is not obvious thereby making it difficult to
identify so-called “correct” responses.
Construct Validity
Construct validity refers to the degree to which the model is felt to measure the
theoretical characteristic (or “construct”) which it says it is measuring. Facet5
has attempted to ensure construct validity by thorough research into the field of
personality theory and other people’s findings. For example if Facet5 attempts to
measure the construct of “Will”, does it seem to exist as a factor in other people’s
work?
Content Validity
Content validity is a very important concept since it demands that a personality
model should make sure it is covering the whole domain of the factors it claims it
is measuring. A good example would be “Will” where it is known that
stubbornness, commitment and independence are all aspects of “Will”. Content
validity is the degree to which the model covers the domain or “content” of the
factor under discussion. For example, some questionnaires measure Emotionality
entirely by the element of “Confidence”. While Confidence is certainly an element
within the domain of Emotionality, it is by no means the whole domain. Such
issues as anxiety, optimism, and physical reactions are also part of the domain
and must be measured. Facet5 attempts to cover this important domain very
Section 3 - Development of Facet5 Page 16
broadly. The domains covered by Facet5 can be seen in the description of the
sub-factors or “facets” measured by the model.
Concurrent or Predictive Validity
These are similar concepts in that they both ask whether the model predicts some
specific outcome. For example if Facet5 states that a person has scored very
high on “Will” then this should be recognised in some other, independent way.
For example a third party could be asked to give independent ratings of the
respondent on behaviours which are known to relate to Will. If the ratings agree
then the construct can be said to have predictive or concurrent validity.
More often people use the term to mean the degree to which test scores can
predict a particular outcome. If, for example, sales performance is measured and
then compared to Facet5 profiles, this would be a measure of concurrent validity.
If the profiles were collected but no action taken until data on job performance
was available this would be referred to as predictive. The two terms are very
similar but the subtle difference is important.
Predictive and Concurrent validity can only be established through studies where a
specific outcome was required. This outcome may be a reduction in staff
turnover, increased sales success or something similar. For examples of Facet5
in this type of application users should refer to the authors where such studies are
available or to the Facet5 Live section of the Facet5 web site. Studies are
continuing on a regular basis and are published as they become available.

Section 3 - Development of Facet5 Page 17
Comparison with other models
The comparison table shown previously indicates some of the relationships
between Facet5 and other personality measures. For the development of Facet5
we used the 16PF to see how Facet5 compares.
Facet5 vs. 16PF
The 16PF was created by Raymond Cattell after much research and still stands
proud as a respected measure. It measures, as its name implies, 16 Personality
Factors. The relationship between Facet5 and these 16 factors is shown in the
following table. The figures shown are correlation coefficients and as such can vary
from 1.00 meaning there is a perfect relationship between the Facet5 scores and
the 16PF scores through to -1.00 meaning that there is a perfect but inverse
relationship. Correlations of around 0.0 indicate that there is no link between the
two sets of scores at all.
Correlations between Facet5 and 16PF 16PF Primary Factor Ê Wil Ene Aff Con Emo A COOL <-> WARM 0.34
B INTELLIGENCE
C EMOTIONAL <-> CALM -0.35
E SUBMISSIVE<->DOMINANCE 0.33 0.28
F SOBER<->ENTHUSED 0.33 0.54
G EXPEDIENT<->CONSCIENTIOUS 0.44
H SHY<->BOLD 0.54 -0.37
I TOUGH <-> TENDER
L TRUSTING<->SUSPICIOUS -0.40
M PRACTICAL<->IMAGINATIVE -0.33
N NATURAL<->CALCULATING 0.35
O ASSURED<->APPREHENSIVE 0.42
Q1 CONSERVATIVE<->LIBERAL
Q2 GROUP<->INDIVIDUAL -0.39
Q3 UNDISCIPLINED<->CONTROLLED 0.36
Q4 RELAXED<->TENSE 0.33
We have only printed the highest loading correlations (i.e. greater than 0.3) to
show the flavour more clearly. From this table the meaning of the Facet5 factors
can be easily extracted.
• W+ people are Dominant and Positive,
• E+ people are Warm, Outgoing, Group Oriented but also quite Dominant and Enthusiastic.
• A+ people are trusting
• C+ people are Conscientious, Practical, Controlled and Calculating (in a social sense).
• Em+ people are Tense, Apprehensive, Emotional and socially awkward.
Clearly Facet5 and the 16PF are measuring largely similar characteristics. To
further assess the similarity between Facet5 and the 16PF we subjected the latter

Section 3 - Development of Facet5 Page 18
to a Factor Analysis of the 16 Primary Factors. The first step is to correlate the 16
factors among themselves and to see which are related. Factor analysis then
groups the items according to this interrelationship. This analysis clearly
indicated that five factors would seem to be a good solution for this 16PF data.
(For the statisticians among you there were five factors with eigenvalues greater
than 1.00 and the scree curve takes a marked break at that point. Therefore
"little jiffy" says 5!) The meaning of these factors is shown in the table below.
FACTOR ANALYSIS OF 16 PF Factor Items Loading Description Facet5 factor
Factor 1
Q4 0.78
O 0.74
H 0.65
C 0.76
TENSE
APPREHENSIVE
SHY
EMOTIONAL
EMOTIONALITY
Factor 2
A 0.79
F 0.60
Q2 -0.66
WARM
ENTHUSED
GROUP ENERGY
Factor 3
E 0.79
Q1 0.66
L 0.49
DOMINANT
LIBERAL
SUSPICIOUS WILL
Factor 4
G 0.63
Q3 0.60
N 0.48
CONSCIENTIOUS
CONTROLLED
CALCULATING CONTROL
Factor 5
M 0.38
I 0.87
IMAGINATIVE
TENDER AFFECTION
This table shows that the relationship between Facet5 and the 16PF is very clear
and all in the expected direction.

Section 3 - Development of Facet5 Page 19
Computer/web based administration
Moving from paper based to computer based and then to web-based
administration has raised a number of questions. One aspect concerns veracity.
Web-based testing allows remote data collection but opens the possibility that the
respondent may be receiving help when completing the items. They may have a
team of mathematicians, an array of dictionaries or a set of on-line encyclopaedias
at hand. Are we even sure that it is the person we expect it to be? Can we use
retina scanning, key-press analysis or finger printing to be certain who it is at the
other end of the line? A relatively simple solution to this problem and one that
meets all the best practice guidelines for test administration is proctored testing.
Here the test is administered under controlled conditions in the same way that
testing has been for generations. This solves all the problems – and immediately
eliminates one of the most powerful benefits – remote data capture. However
many users have stated that remote data capture is probably the most important
single benefit which web-based testing offers.
Resolution of this problem therefore would appear to be critical to the success of
web-based testing. So what can we do about it? First we need to differentiate
between different aspects of the problem. It would appear that the risks posed to
cognitive tests are very serious and, at this point, the only solution appears to be
proctored testing. However, what about non-cognitive tests? In volume terms
personality, work preference or similar tests are likely to be the main application of
remote testing. What can we do about them? Facet5 uses Response Pattern
Analysis and Response Latency Analysis to identify those responses that
might suggest some form of Impression Management is occurring.
Response Pattern
For the most part, since the late 1980s, Facet5 has been used in a traditional,
paper and pencil format. Although un-timed, experience has shown that most
people take about 20-25 minutes to complete the questionnaire. During 2000
and 2001 we web-enabled Facet5 in response to demand from clients. Web
administration is considered to offer advantages in terms of increased efficiency,
centralised management of the database, ease of updating of libraries and,
perhaps most importantly, remote data capture.
However, when data is collected by computer as opposed to on paper, questions
arise about comparability of results. It is important to determine whether that
the results are comparable or, if they are not, to know what the effect is.
We have a large amount of data from paper-based responses that has allowed us
to identify a “typical” response pattern to the 106 items in Facet5. Items use a 5-
point scale and instructions include:
For example:
In business most people are prepared to help others
<1> <2> <3> <4> <5> In business most people are motivated by personal gain

Section 3 - Development of Facet5 Page 20
If the statement on the left is most representative of your views, you should circle the figure <1>. If you feel the statement on the right is most typical, you should circle the figure <5>. Try not to fall back on the middle answer (<3>) unless all other answers are completely impossible for you.
Therefore we would expect that we would have a bimodal distribution with most
answers falling onto 2 and 4. If web-based administration was going to have a
significant impact on the response pattern it seems likely it would show up first
here with a pattern which was significantly different. The figure below shows the
actual Response Distribution for both paper and web based questionnaires. It can
be seen that the patterns are broadly identical - none of the differences are
statistically significant.
Response Patterns and Method of Administration
18 18
3033
11
6
3033
17 17
0
5
10
15
20
25
30
35
40
Paper Web Paper Web Paper Web Paper Web Paper Web
Ones Twoes Threes Fours Fives
Method of AdministrationResponse Item
Mean
Nu
mber
of
Resp
on
ses
Paper N=12213 Web N=7564
Note that with web administration there is a check to ensure that the number of
3s is not excessive. If the respondent replies with more than 18 3s then the
system re-presents those items and give him/her the chance to check their
answer.
From this we can be reasonably certain that the shift to web-based administration
has not changed the way in which people respond to any significant degree. A
second question however was whether a tendency to respond in a particular way
was associated with certain personality factors. This was tested next.
Response Pattern and Personality
From the previous analysis it is clear that most people respond with a bimodal
distribution of Facet5 answers. Most are 2s and 4s with fewer 1s and 5s and even
fewer 3s. However it would seem possible that some personality styles are more
likely to be more extreme in their answers (produce proportionally more 1s and
5s) while others would be more cautious and produce more 3s.

Section 3 - Development of Facet5 Page 21
We tested this by sorting a large database according to how similar their response
patterns were to the theoretical ideal pattern shown in the chart above. We then
grouped them into 20% bands from Band 1 - “most similar to perfect” through to
Band 5 “most dissimilar from perfect”. Finally we looked at the mean differences
for each factor within each band. This table is shown below:
Mean Facet5 scores for Response Pattern bands (see above)
Response pattern bands
N=17797 Will Energy Affection Control Emotionality
1 – ideal Mean 4.89 5.90 6.74 6.15 5.00
Std. Dev. 1.84 1.94 1.88 1.91 1.73
2 Mean 4.89 5.80 6.67 6.10 5.07
Std. Dev. 1.88 1.92 1.86 1.88 1.73
3 Mean 4.89 5.74 6.66 6.10 5.19
Std. Dev. 1.83 1.91 1.80 1.81 1.73
4 Mean 4.82 5.51 6.59 6.02 5.18
Std. Dev. 1.76 1.94 1.83 1.85 1.74
5 – less ideal Mean 4.78 5.58 6.80 6.27 5.07
Std. Dev. 1.93 2.08 2.09 1.99 1.90
An Analysis of Variance was computed to see whether any of these mean
differences were significant enough to suggest that the degree to which a person
responded with extreme answers was related to their personality style. In fact for
all five factors there was a “significant” relationship. However such a large sample
base is likely to yield results which though they might appear statistically
significant are in fact of little practical use. An example of this can be seen below
in the data for Energy.

Section 3 - Development of Facet5 Page 22
Energy and Response Pattern
The mean scores for Energy for each of the 5 bands are shown in the following
chart:
31713923392939283931N =
Perf ect pattern bands
54321
95%
CI E
nerg
y -
resc
ored
to d
efau
lt no
rms
6.0
5.9
5.8
5.7
5.6
5.5
5.4
This chart shows the Mean Score for each Pattern Band and the 95% confidence
limits (the points that are the limits for 95% of the scores) for each Band.
From this chart is appears that there is a relationship. People whose response
pattern is close to “ideal” (Band 1) seem to score slightly higher on Energy than
those who are less “ideal”. In fact the Anova is significant at the 0.000 level (df 4
and 18877, F=24.463). But when we look more closely at the figures we can see
that it isn’t anywhere near as significant as it might at first seem. For a start, the
chart above has a very compressed vertical scale from Energy scores of 5.4 to 6.
If we change the scale to give the complete Sten score range of 1 to 10 we get
the chart shown below.
Perf ect pattern bands
54321
95%
CI E
nerg
y -
resc
ored
to d
efau
lt no
rms
10.0
9.0
8.0
7.0
6.0
5.0
4.0
3.0
2.0
1.0

Section 3 - Development of Facet5 Page 23
This looks very different and shows that, regardless of what the statistics say,
there’s not very much difference across the 5 bands. In fact if we check the actual
proportion of the variance in the Energy scores that is linked to how “ideal” the
respondent’s pattern is, there is very little. Coefficient ETA is designed to do this.
Eta and eta squared are measures of association. Eta squared is the proportion of
variance in the dependent variable that is explained by differences among groups.
The value of ETA squared for Energy across these pattern bands is 0.005 which
means that only 0.5% of the variation in Energy scores can be attributed to how
the person used the available responses on the scale. And Energy is the most
significant of the relationships!

Section 3 - Development of Facet5 Page 24
Impression Management
Impression Management (IM) is an attempt (not necessarily deliberate) to answer
questions in a way that will produce a profile that is different from the
respondent's "true" or "natural" profile. There are three broad types of IM that
might occur:
Denial, Defensiveness or Suppression
This is an attempt to suppress anything that might be perceived as negative.
This can sometimes be identified by specific "marker" questions (16PF, OPQ etc)
or by the proportion of "No" responses (Humm-Wadsworth, MMPI etc) or by some
combination of the two. It can be argued that a candidate for a job would be
expected to try to present the best possible self-portrait. Indeed there may be
some concern about a candidate who did not try to do this. It is therefore likely
that this type of IM is more prevalent in selection than development.
Indicators of this type of IM may be called Social Desirability, Motivational
Distortion or Defensiveness. High scores on these scales are supposed to act as
warning bells suggesting caution in interpreting the results. The person may not
be being "open" or "honest"
Suggestibility, Faking Bad
This is the diametric and logical opposite of the first. Here a person tends to
exaggerate faults or over-admit to possible problems. Such reactions are not
uncommon in clinical cases (a cry for help?) but can also be seen in areas such as
Career Counselling.
Such a response pattern is rarely picked up by marker questions. Very low Social
Desirability or Motivational Distortion scales are usually seen as being "open" or
"honest". Scales using an "Yes" or "No" format can identify such Suggestibility by
a disproportionate number of "Yes" responses. Again caution is urged in
interpretation.
Templating
Where a respondent has a mental image of "what is required" or the "ideal" profile
and tries to adjust responses in such a way as to match this supposed "ideal".
This is by far the most likely type of IM in selection cases and yet typical Social
Desirability or Motivational distortion Scales do little to identify it. Psychometric
folklore is littered with statements from people who claim to be able to manipulate
questionnaires to be able to present any picture they want.
Over the years test developers have adopted a number of strategies to minimise
the likelihood of IM and to identify it if it does occur. Some techniques include:
• Item ambiguity - word the items so it is not obvious which factor it loads on.
• Neutral or balanced valence - make it hard to identify which response,
representing opposite aspects of a scale, is more desirable. This is not the

Section 3 - Development of Facet5 Page 25
same as Ipsativity where the respondent is required to choose between
statements representing different domains (some OPQ versions, DISC etc).
Balanced valence uses pairs of statements that tend to be opposite in meaning
and thereby represent opposite ends of a single scale. They may be arranged
as separate statements (MBTI) or semantic differentials (Facet5).
• Marker items - a group of items is included, which, it is assumed, represent
the behaviour of "normal" people. These items will include some that admit
negative characteristics on the assumption that most people have some "bad"
elements in their make-up. Over denial of these items is seen as an attempt
to appear unrealistically "good".
• Selective norming - some may suggest that the responses only be compared
to other people in a similar position e.g. applying for a job in retail sales. In
this way all applicants are expected to have the same degree of motivation to
distort and so the effect of IM will be cancelled out. However this assumes
that all respondents will apply the same IM strategies to the same degree. It
also raises the spectre of having to re-norm the profile when the person is
hired. How do you then explain that the score on a scale was 7 when an
applicant but it is now 9 as an employee?
Most test developers will use the first two methods to reduce the effect of IM.
Some include the third but the fourth tends to be the domain of people with too
much reliance on computer technology. The collection of multiple norm tables is
technically very simple but psychometrically questionable and practically
problematic.
When we first developed Facet5 in the late 1980s we attempted to address IM in
the traditional ways. We created a set of items that, though work related,
produced highly biased response patterns suggesting that people felt there was
only one way to answer the question. These included such items as "I believe in
democratic leadership". Virtually everybody agreed with this as a premise and
when we created a scale including this and 11 other items, we had a well-balanced
sten scale that had excellent psychometric properties. This putative IM scale
correlated positively with Control and Affection suggesting that people responding
in a “Socially Desirable” way were attempting to portray themselves as kinder,
more responsible and self disciplined. Perhaps they actually are that “good” and
it is not a distortion. It is known for example that MD and SD scores tend to
correlate with elements of conscientiousness and empathy. In the 16PF the MD
scores correlate with A+, C+,F+, G+ H+ L- M- O- Q2+ Q3+ and Q4-. Therefore
people with high MD scores are seen as Warm-hearted, Happy-go-lucky,
Venturesome, Emotionally Stable, Unperturbed, Relaxed, Conscientious, Practical,
Self-sufficient, Controlled, and Trusting. In terms of second order factors broadly
aligned with the Big5, these are Extravert, Conscientious and Stable. People who
happen to score high on these scales will tend to have elevated MD scores as well.
Cattell19 in his extensive discussion of the impact of Motivational Distortion urges
great caution in interpreting measures of distortion describing them as a
“Temporary Compromise” while “more basic research proceeds.” (p55.) He warns

Section 3 - Development of Facet5 Page 26
that automatic adjustment using such measures will by definition “take out real
personality variance as well as motivational shift”. (p56) The manual for the
15FQ 20 describes in detail the steps taken to measure MD/SD but then gives little
advice as to what to do with it other than to explore more thoroughly at interview.
It can be seen that traditional approaches to IM are limited. It may be possible to
say that a person is trying hard to look good, but perhaps you would expect this
anyway. Apart from further exploration at interview there is little guidance as to
what to do with the information. Do we infer that the person is lying/ faking or
are they just “like that”? If they are faking, are they faking all the scales or just
certain scales? It seems likely that people trying to present themselves as more
outgoing and forceful will respond to those items which they perceive to be related
to Outgoingness and Forcefulness. Items relating to Empathy, which they do not
see as important, are likely to be subject to much less IM. Traditional approaches
to identifying IM will not help much at all.
However there is encouragement from the research in to deliberate lying.
Although this is an area in which folklore abounds (looking shifty, hesitant speech,
fidgeting, avoiding eye contact, heightened GSR etc) some real evidence has come
to light. A recent report21 noted that under controlled conditions, a key indicator
of a "lying" response was the delay in producing the response. Therefore a
measure of an attempt to lie could be obtained from the latency of responses to
questions. With web-based administration this becomes possible.
Let us take an example. A candidate for a sales role is keen to get the job and
therefore wants to give a good impression. These are ideal circumstances for IM
to occur. She has read the job advertisement, knows something about the
company and has formed an opinion from the premises and the way that she's
been received. Then she is faced with a series of questions that under normal
circumstances, would appear to have neutral valence. However the situation is
not neutral and therefore she will interpret each response against her in-built
"ideal" and will adjust her response accordingly. When she finds an item that she
interprets as "important" she will think a little more about it and what answer she
should give. She may not "lie" but may easily decide to soften an otherwise
strong response.
This decision process may be quite quick but will still be a little slower than her
responses to other questions that she does not perceive as "loaded". There will
be a delay and it can be captured.
Facet5 is, to our knowledge, the only model that adopts this approach to IM. The
concept was first presented to the International Test User’s Conference on
Internet Based Testing in June 2002.22
In addition to item ambiguity and neutral valence, it also uses response latency.
The first two are designed to minimise the likelihood of IM and the third is
intended to identify its effect if it does occur. By decomposing the responses into
the Facet5 domains, we can tell not only if IM is present but also which domains
are most affected.

Section 3 - Development of Facet5 Page 27
Facet5 and Response Latency
Facet5 captures the latency from the moment the item is presented to the time a
response is given. The average response latency for all items is shown below.
Mean Response Latency for Facet5 items
0
2
4
6
8
10
12
14
16
18
1 4 7 10
13
16
19
22
25
28
31
34
37
40
43
46
49
52
55
58
61
64
67
70
73
76
79
82
85
88
91
94
97
100
103
106
Facet5 item number
Tim
e in
sec
on
ds
n=7564
As can be seen the median response latency was a little under 10 seconds. (We
chose the median as opposed to the mean because web based administration is
often accompanied by interruptions or distractions which lead to delays on
occasional items.) There is a spike on the first item which we interpret as people
getting used to the format, organising coffee etc. Such spikes also occur on
individual records where the respondent is interrupted for some reason. A typical
individual response pattern is shown below. As can be seen there are a number of
spikes in the distribution of responses indicating interruptions or breaks.
Response Latencies for an individual
0
5
10
15
20
25
30
1 4 7 10
13
16
19
22
25
28
31
34
37
40
43
46
49
52
55
58
61
64
67
70
73
76
79
82
85
88
91
94
97
100
103
106
Facet5 item
Res
po
nse
Lat
ency
in s
eco
nd
s
For any individual there will be a range of response times. Some people will be
quick suggesting almost an immediate commitment. Others will be more
deliberate and considered. If there is no attempt at IM the quick and the slow

Section 3 - Development of Facet5 Page 28
items will be evenly distributed across each of the domains being measured. If
on the other hand there is attempted IM then the distribution will be uneven, with
longer responses for those domains which are deemed to be "loaded".
Response Latency and Personality
A number of Facet5 users have asked whether the tendency to hesitate over some
questions (i.e. to generate a distorted Latency chart) is in itself a personality trait.
If so then it should be related to the main Facet5 factors. We looked at this in two
stages:
• Are some people just naturally slower to make decisions and
• Do some people naturally have a tendency to try to present in a particular
light.
Speed of decision making
The following table shows the relationship between response latencies and the
Facet5 main factor raw scores. To get these values we first calculated the average
response latencies across all 106 items for each person. We then searched for
outliers whose average response times were distorted by extreme latencies. We
excluded the 2.5% of people whose average latency was more than 1.96 Standard
Deviations above the mean.
Mean Raw Score Differences
Raw Score for
Average Response time (in
seconds)
N Mean
Latency
Std.
Deviation
Will >= 9.53 3546 46.35 7.18
< 9.53 3605 47.11 7.51
Energy >= 9.53 3546 52.28 7.68
< 9.53 3605 52.75 8.11
Affection >= 9.53 3546 65.09 8.38
< 9.53 3605 64.93 8.91
Control >= 9.53 3546 60.17 9.22
< 9.53 3605 57.97 9.90
Emotionality >= 9.53 3546 46.93 9.60
< 9.53 3605 46.93 9.78
Section 3 - Development of Facet5 Page 29
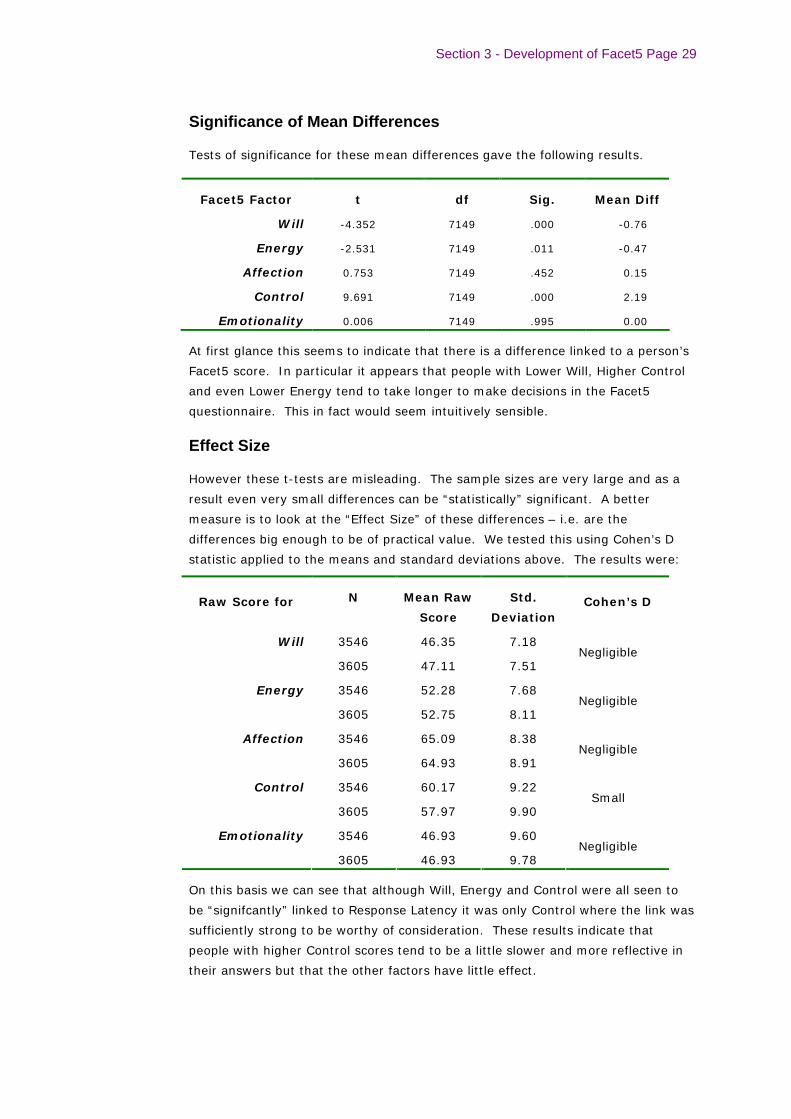
Significance of Mean Differences
Tests of significance for these mean differences gave the following results.
Facet5 Factor t df Sig. Mean Diff
Will -4.352 7149 .000 -0.76
Energy -2.531 7149 .011 -0.47
Affection 0.753 7149 .452 0.15
Control 9.691 7149 .000 2.19
Emotionality 0.006 7149 .995 0.00
At first glance this seems to indicate that there is a difference linked to a person’s
Facet5 score. In particular it appears that people with Lower Will, Higher Control
and even Lower Energy tend to take longer to make decisions in the Facet5
questionnaire. This in fact would seem intuitively sensible.
Effect Size
However these t-tests are misleading. The sample sizes are very large and as a
result even very small differences can be “statistically” significant. A better
measure is to look at the “Effect Size” of these differences – i.e. are the
differences big enough to be of practical value. We tested this using Cohen’s D
statistic applied to the means and standard deviations above. The results were:
Raw Score for N Mean Raw
Score
Std.
Deviation Cohen’s D
Will 3546 46.35 7.18
3605 47.11 7.51 Negligible
Energy 3546 52.28 7.68
3605 52.75 8.11 Negligible
Affection 3546 65.09 8.38
3605 64.93 8.91 Negligible
Control 3546 60.17 9.22
3605 57.97 9.90 Small
Emotionality 3546 46.93 9.60
3605 46.93 9.78 Negligible
On this basis we can see that although Will, Energy and Control were all seen to
be “signifcantly” linked to Response Latency it was only Control where the link was
sufficiently strong to be worthy of consideration. These results indicate that
people with higher Control scores tend to be a little slower and more reflective in
their answers but that the other factors have little effect.

Section 3 - Development of Facet5 Page 30
Facet5 Scores and IM
It is also possible that some people naturally try harder to present themselves in a
“good” light. If this is true then it will be reflected in a link between individual
personality factors and the measure of Response Distortion. These correlations
are shown in the table below.
Correlation between Facet5 and amount of
distortion in the responses
Facet5 Factor Correlation
(Significance)
Will 0.064 (.118)
Energy 0.069 (.091)
Affection -0.060 (.146)
Control -0.010 (.802)
Emotionality -0.053 (.200)
N=596
From this table it is clear that there is no relationship between a respondent’s
Facet5 scores and how distorted the response latencies are.

Section 3 - Development of Facet5 Page 31
The Effect of Valence
As has been mentioned the situation a person finds themselves in when they are
asked to complete Facet5 can vary in its “valence”. A high Valence situation is one
where there is a lot of importance attached to the results of the Facet5 profile. A
low Valence situation is one where the results of the Facet5 profile have little real
effect on the person. Recruitment would be high valence, completing it out of
interest would be low valence. It is known that valence can affect the scores that
a respondent gets as they try to present in a particular way.
We tested two aspects of this. First we looked to see whether actual Facet5
scores were different depending on the situation and second, we checked to see
whether the Response Latencies were different in different situations.
Valence and Facet5 scores
Within a large db of over 19000 cases there were a number of people who were
known to have completed Facet5 as part of a recruitment exercise. There was a
similar number who completed it as part of some development process such as
team building or some other development programme. We calculated the mean
Facet5 scores for the two groups as follows:
Reason for
profile
N Mean Std.
Dev.
T
Sig
Cohen’s
D
Selection 1693 45.47 7.01 Will
Development 1828 47.61 7.39
-8.8 0.000
0.3 – small effect
Selection 1693 54.63 7.12 Energy
Development 1828 50.89 8.21
14.4 0.000
0.49 – medium effect
Selection 1693 67.30 8.74 Affection
Development 1828 64.91 8.01
8.5 0.000
0.29 – small effect
Selection 1693 63.27 8.80 Control
Development 1828 56.11 9.59
23 0.000
0.78 – large effect
Selection 1693 43.93 8.65 Emotionality
Development 1828 47.95 9.86
-12.8 0.000
0.43 – medium effect
Note that in this analysis we used raw scores rather than Sten scores. In each
case there was a significant difference between the two sets of mean scores.
However this was partly an illusion due to the large sample sizes. Cohen’s D tells
us that the biggest effect was for Control where people who are applying for jobs
tend to represent themselves as more Disciplined and Responsible. They also
claim they are somewhat more Outgoing (Energy) and less Anxious and Intense
(Emotionality). The impact on Will and Affection was less significant.
It should be noted that this effect has been seen in other questionnaires.

Section 3 - Development of Facet5 Page 32
Valence and Response Latencies
If Response Latency Analysis is measuring what we think it is then it should be
able to differentiate between high and low valence situations.
We tested this by dividing a sample of people according to the reason that they
completed the profile. One group (Group A) completed it as part of a recruitment
process and therefore were labelled as “High” valence. The other group (Group B)
completed it as part of an investigation into Facet5 itself and were classed as “low
valence”. The measure we used was the DSQ calculated to tell us how much
distortion is in the profile.
Group A would be expected to show “slow item distributions” that were uneven
across all five domains as they searched for meaning and salience in the
questions. Group B should have slow item distributions that are more even since
they are less concerned with the outcome of the questionnaire. A simple way of
assessing this would be to calculate D2 distributions for the two groups and see if
they differ. D2 was calculated in the traditional way as follows:
( )2
1
2 3∑−=
−=ni
iXD
where X is the number of items related to each factor for person X and 3 is the
expected value for a “perfect distribution”. You can see from this that if each
factor had 3 items associated with it then this value would be 0 indicating there is
no attempt to Impression Manage. The results were as follows:
Group A (Hi IM) Group B (Lo IM) N 18 17
Mean D2 10.47 7.05
SD of D2 3.57 4.19
T = 0.01 df=33
The t-value tested the significance of the difference between these mean scores
and although the sample size is quite small the differences are highly significant.
In fact Cohen’s test for Effect Size (Cohen’s D) is 0.91 which is declared to be a
“large effect”.
So RLA seems to work. When you have a strong desire to present in a particular
way or “look good”, your RLA’s become uneven. We believe that this is because a
greater amount of “cognitive load” is being applied to items “perceived” to be
salient.

Section 3 - Development of Facet5 Page 33
Reporting and Interpreting Response Latency
Facet5 reports Impression Management graphically on the “Statistics Page”. This
page presents three analyses:
1. Response Pattern
The response pattern shows the actual distribution of the 106 answers given by a
respondent. It shows this in both a table and a chart as follows:
The chart shows the expected distribution (black bars) and the actual distribution
(coloured bars). The coloured bars are coded to indicate the Facet5 factor. The
table to the right of the chart gives the exact distribution.
A “perfect” Response pattern would be that which matched the “expected” pattern
exactly. It would be bi-modal with most answers being either 2 or 4. It is rare for
there to be vastly too many threes since the Facet5 system is designed to avoid
this. Respondents are instructed to try to avoid the “3”s unless they really cannot
decide. It they answer with more than 18 threes the system will re-present those
items and ask the respondent to confirm that that is what they meant.

Section 3 - Development of Facet5 Page 34
2. Response Latency
The response latency is presented as a chart as follows:
To produce this chart Facet5 follows these steps:
1. Calculate the response times for all items
2. Calculate intra-individual mean response time (i.e. the average response
time for that person)
3. Calculate the intra-individual standard-deviation of response time.
4. Remove any responses more than 2 standard deviations above the mean
response time.
5. Sort the remainder from quickest to slowest.
6. Select the slowest 15.
7. Count how many of these are associated with each Facet5 factor.
8. Present as a chart as shown above.
Each vertical bar in the chart represents a single item. In this chart you can see
that, for this respondent, 2 of the 15 items related to Will, 3 to Energy, 6 to
Affection, 1 to Control and 2 to Emotionality. The legend shows that the
respondent’s average response time was 9.93 seconds, her quickest was 2.91
seconds and her slowest (with those more than 2 standard deviations above the
mean removed) was 27.43 seconds.

Section 3 - Development of Facet5 Page 35
3. Response Distortion
The Response Latency chart provides an indication of whether there is an attempt
to “Impression Manage”. However it is difficult to estimate the degree of
distortion just by looking at the chart. The Response Distortion bar is designed to
help user to see how distorted the latencies are.
To produce this bar, Facet5 goes through a number of steps as follows:
1. Calculate DSQ(resp)
This is the distance between the actual Response Latencies and the “ideal”
Response Latency. The expected value is 3 under each factor so Distance from 3
across the board is:
DSQ(resp)=SQRT((NofWillItems-3)^2)+((NofEnergyItems-3)^2)+
((NofAffectionItems-3) ^2)+((NofControlITems-3)^2) +
((NofEmotionalityItems-3)^2)
2. Calculate DSQ(max)
This is the maximum possible distortion you can get which would be all 15 on one
factor (e.g. Will) and zero on all others.
DSQ(max)=SQRT((15-3)^2)+((0-3) ^2)+((0-3) ^2)+((0-3) ^2)+
((0-3)^2)=13.41641
3. Compute DSQ(nrm)
This is a normalised value obtained by:
DSQ(nrm) = Divide DSQ(resp) by DSQ(max).
This will give a value between 0 (all Factors have 3 items) through to 1 (1 factor
has 15 items and all others have 0).
4. Compute DSQ(pct)
Multiply DSQ(nrm) by 100 to give a value between 1 and 100. The value of 0 on
the chart is labelled “Minimal distortion” and a value of 100 is labelled “Maximum
distortion”.

Section 3 - Development of Facet5 Page 36
5. Lookup DSQ in the following table:
Value of DSQ Label
IF DSQ <=180.00
This profile is rather distorted. Only 1 in 10 profiles are more distorted so you should check the Response Latency chart for factors where Jennifer has spent a disproportionate amount of time. Interpret the profile with caution. You should check the specific items that caused Jennifer to think longer to see if there is confusion or misunderstanding.'
IF DSQ <=29.95
This profile is a somewhat distorted. Only 20% of profiles are more distorted so you should check the Response Latency chart for factors where Jennifer has spent a disproportionate amount of time.'
IF DSQ <=27.55
This profile is a little distorted. Only 30% of profiles are more distorted so you should check the Response Latency chart for factors where Jennifer has spent a disproportionate amount of time.'
IF DSQ <=25.00 There is only average distortion. 40% of profiles are more distorted so Jennifer is neither more nor less cautious than other people - the profile can be interpreted with confidence.'
IF DSQ <=22.19 There is only average distortion. 50% of profiles are more distorted so Jennifer is neither more nor less cautious than other people - the profile can be interpreted with confidence.'
IF DSQ <=19.67 There is very little evidence of distortion. 60% of profiles are more distorted. Jennifer has been quite open in responding and the profile can be interpreted with confidence.'
IF DSQ <=17.08 There is only minor evidence of distortion. 70% of profiles are more distorted so the profile can be interpreted with confidence.'
IF DSQ <=14.31 There is little evidence of distortion. 80% of profiles are more distorted. Jennifer has been very open in responding and the profile can be interpreted with confidence.'
IF DSQ <=11.33 This profile is not distorted and can be interpreted with confidence'

Section 3 - Development of Facet5 Page 37
4. List of Slowest Items
The three charts shown above are all printed in the Statistics section of the Facet5
report. However there is additional information available to the Facet5 user on
screen. The system will provide a list of the 15 selected “slow” items sorted by
Facet5 factor so you can see what was causing the person to think harder. It
looks like this:

Section 3 - Development of Facet5 Page 38
Response Latency - Case 1
An Operations Manager in an Australian Bank completing the
questionnaire out of interest. This is a “low valence” situation since there was
no preferred outcome so we would assume IM to be minimal. The figure below
shows the response pattern for all items.
There is no evidence of central tendency and the pattern follows expected bimodal
distribution reasonably closely.
The figure below shows the Response Latency Analysis (RLA) for this person and
as can be seen slow responses are spread relatively evenly across all domains.
Will and Energy have 4 items, Affection 3 items and Control and emotionality 2
items each. Other data shown is:
• The average response time is 8.99 seconds
• The fastest response time: 2.72
• The slowest response time: 154.08.
From this data we can assume that the profile is a fair representation of the
respondent and later feedback confirmed this.

Section 3 - Development of Facet5 Page 39
The Response Distortion Chart for this candidate is shown below:
It can be seen that the responses are quite free of distortion when compared to
other people who have completed the questionnaire.
The actual questions on which the respondent reflected more were:
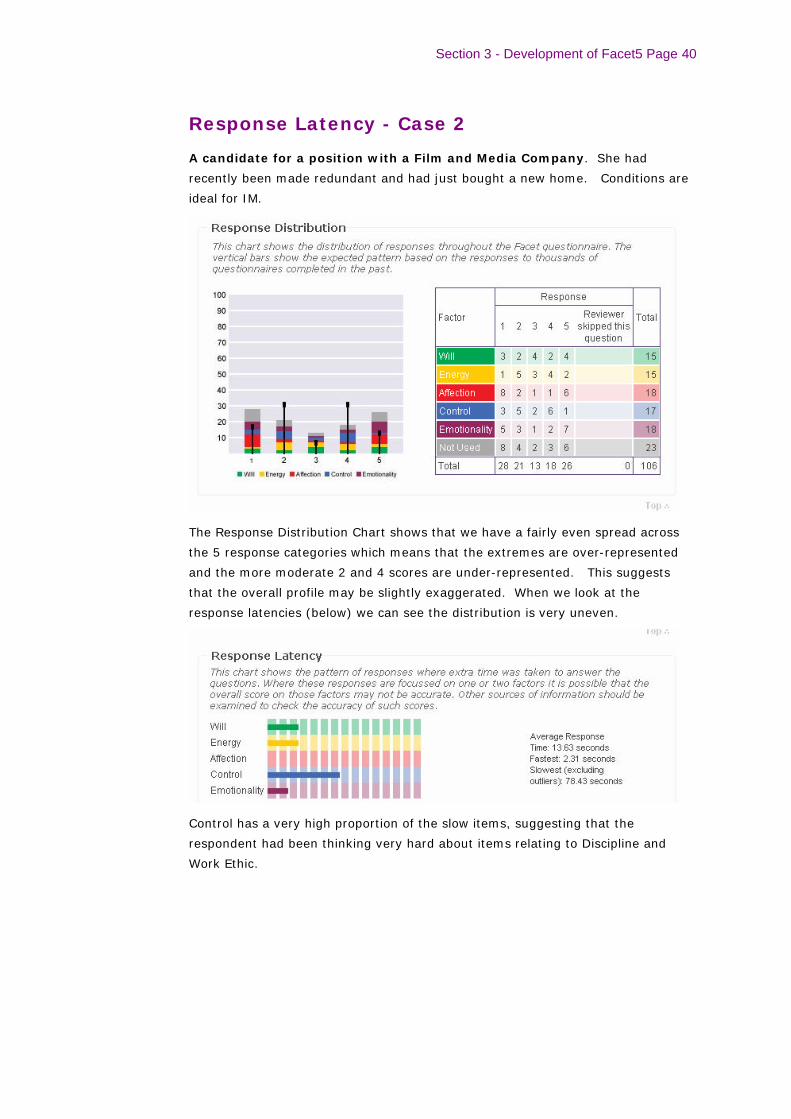
Section 3 - Development of Facet5 Page 40
Response Latency - Case 2
A candidate for a position with a Film and Media Company. She had
recently been made redundant and had just bought a new home. Conditions are
ideal for IM.
The Response Distribution Chart shows that we have a fairly even spread across
the 5 response categories which means that the extremes are over-represented
and the more moderate 2 and 4 scores are under-represented. This suggests
that the overall profile may be slightly exaggerated. When we look at the
response latencies (below) we can see the distribution is very uneven.
Control has a very high proportion of the slow items, suggesting that the
respondent had been thinking very hard about items relating to Discipline and
Work Ethic.

Section 3 - Development of Facet5 Page 41
The Response Distortion Chart for this candidate is shown below:
The distortion level is higher than 90% of respondents which suggests that care
should be taken interpreting it. It is likely that she was being very careful
answering the questions, particularly those to do with Control.
When we look at the items that she reflected longest on they were:
During feedback it would be wise to explore the sorts of issues that are raised by
the Control questions. It can be seen that they relate to issue to do with planning,
process and work standards.
Section 3 - Development of Facet5 Page 42
Summary
The adoption of web-based administration for Facet5 promised many advantages
but also raised questions regarding comparability of results. The evidence to date
suggests that the pattern of responses is broadly similar so we can have
confidence in the comparability of the outcomes. However, the application of
Response Latency Analysis (RLA) to the results would appear to be a powerful new
tool in the identification and understanding of cases where Impression
Management (IM) might be distorting the results.
For any Facet5 profile now produced on the web we advise people to look first at
the profile statistics. Only when they are confident that the response pattern is
as expected and the response latencies not unusually distorted, should they
proceed to interpretation. If they do not have this confidence then they really do
need to resort to other indicators but at least they know which areas need to be
addressed.
The next area of research would be to test the RLA model in controlled conditions
where Impression Management is deliberately attempted. In addition we need to
find out the direction of IM. Whether we will ever be able to automatically
compensate for IM and rescale the scores appropriately is in doubt without
knowingly throwing out some of the real rich tapestry of personality that we really
need to know about.

Section 3 - Development of Facet5 Page 43
References & Notes
1Some people may comment that they do not feel some of the phrases are truly antonymous ie. not true opposites. This is
normal due to the different semantic interpretations people will put on words.
2 Buckley, NL & Williams RJ, "Testing on the web - Response patterns and Impression Management", Selection &
Development Review, British Psychological Society, in press
3More detailed analysis of the structures of each factor is planned to ascertain if any of the sub-factors are indeed useful.
These would then form the basis of new, specialised versions of Facet.
4It is technically possible to obtain Sten scores beyond 1 and 10 but these should be considered as the normal limits.
5 Christiansen, N.D., Goffin, R.D., Johnston, N.G., Rothstein, M.G. “Correcting the 16PF for Faking: Effects on Criterion
related Validity and Individual Hiring Decisions”, J. Personnel Psych.,V47, No.4, Winter 1994
6Osgood,C.E. (1952) "The nature and measurement of meaning" Psychological Bulletin 49 197-237
7 People familiar with Brand's work will recognise that this cone represents only one half of his theory. The full model
includes Intelligence or "g" as a complement to Neuroticism to produce his "Double Cone". The positive aspects of "g"
counter the generally negative effects of Neuroticism. However, in most management development programmes "g" is
ignored.
8 Buckley, NL, "Facet5 User's Manual", Redfield Consulting, 1998
9 For a discussion on research in this field see Kristof, Amy L, “Person-Organisation Fit: an Integrative review of its
Conceptualisations, Measurement and Implications”, Personnel Psychology, Vol. 41, No 1, 1996, p3
10 Cattell, RB, Eber, HW and Tatsuoka, MM, "The Handbook for the Sixteen Personality Factor Questionnaire (16PF)", 1970,
IPAT
11 Smith, P, "The UK Standardization of the 16PF5: A Supplement of Norms and Technical Data", ASE, 1994
12 SHL, OPQ Manual, Saville & Holdsworth Ltd,
13 Briggs-Myers, I and McCaulley, MH. "Manual: A Guide to the Development and Use of the Myers-Briggs Type Indicator",
CPP 1989
14 Briggs-Myers, I and McCaulley, MH. "Manual: A Guide to the Development and Use of the Myers-Briggs Type Indicator",
CPP 1989, Table 10.5 Amherst Class of 1963 -14-16 months
15 Ibid Table 10.5 University of New Mexico - 9-21 months
16 Cattell, RB, Eber, HW and Tatsuoka, MM, "The Handbook for the Sixteen Personality Factor Questionnaire (16PF)", 1970,
IPAT p31 Table 5.2 Males - 4 year
17 Ibid , P31 Table 5.2 Females - 4 years
18 For a fuller discussion of issues of validity see any major psychology text such as ANASTASI, A. “Psychological Testing”,
Collier MacMillan International, London
19 Cattell, RB, Eber, H, Tatsuoka, MM, “Handbook for the Sixteen Personality Factor Questionnaire (16 PF)”, IPAT, 1988
20 Psytech, “The Fifteen Factor Questionnaire – Technical Manual”,
21 Bull, R, “After the Facts”, The Psychologist, BPS, November 2001
22 Buckley, N and Williams R, “Response Patterns and Impression Management”, paper presented to the ITC Conference –
Winchester UK June 2002-05-8