DEVELOPMENT OF EMULSIFIED WASTEWATER TREATMENT …umpir.ump.edu.my/id/eprint/10683/1/FKKSA - Chong...
24
III DEVELOPMENT OF EMULSIFIED WASTEWATER TREATMENT SYSTEM CHONG HON YVAIN Thesis submitted in partial fulfilment of the requirements for the award of the degree of Bachelor of Chemical Engineering Faculty of Chemical & Natural Resources Engineering UNIVERSITI MALAYSIA PAHANG JANUARY 2014 ©CHONG HON YVAIN (2014)
Transcript of DEVELOPMENT OF EMULSIFIED WASTEWATER TREATMENT …umpir.ump.edu.my/id/eprint/10683/1/FKKSA - Chong...
III
DEVELOPMENT OF EMULSIFIED
WASTEWATER TREATMENT SYSTEM
CHONG HON YVAIN
Thesis submitted in partial fulfilment of the requirements
for the award of the degree of
Bachelor of Chemical Engineering
Faculty of Chemical & Natural Resources Engineering
UNIVERSITI MALAYSIA PAHANG
JANUARY 2014
©CHONG HON YVAIN (2014)

VIII
ABSTRACT
Emulsions are commonly used in metal processing productions as emulsified
coolant and lubricating oil. These emulsions will be discharged off as emulsion waste
after losing their efficiency. These wastes have to be treated to satisfy the standard
limits before being discharged to waterways to prevent pollutions. This work targets
to develop an emulsified wastewater treatment system using effective bio-coagulant
and low cost agricultural waste as bio-adsorbent. Chitosan and rubber seed shell
activated carbon (RSSAC) as bio-coagulant and bio-adsorbent respectively will be
employed in this work. Samples of emulsified wastewater were collected and analysis was
done. Activation of chitosan powder was prepared by diluting it with acetic acid and distilled
water. The fresh rubber seed was cracked to get the shell which was then washed, sun-dried,
pulverised and sieved and impregnated with NaOH before carbonization to produce RSSAC.
Carbonization was able to increase the SBET up to 20 folds. Results show the highest
reading of SBET (19.2403m2/g) at 650
oC compared to SBET (0.9482m
2/g) before
carbonization. Carbonization is able to remove volatile compounds and promotes
formation of new pores. However, the SBET dropped at high temperature 850oC
because of surface erosion and rupture of some porous wall which causes lower
porosity formation. Jar test method was used with chitosan as coagulant at primary
treatment followed by RSSAC as adsorbent at secondary treatment. Effects on
removal of oil & grease (O&G), total suspended solids (TSS), turbidity and pH value
were studied in this paper by varying the contact time and dosage. The combined
system able to reduce 90% of O&G compared to chitosan alone which only able to
reduce up to 76%. The chitosan able to agglomerate and demulsify emulsion and
improve the residual oil coagulation. Further addition of RSSAC able to adsorb the
remaining oil left from the primary treatment. The treatment is able to reduce TSS and
turbidity up to 98.7% and 92.5% respectively. Treated wastewater can be further
processed by using membrane ultrafiltration to remove residual RSSAC. Also, the
colour indicates the presence of heavy metals and can be further treated to improve
filtrate clarity. RSS may be further explored into producing activated carbon by other
means of activation and used adsorb other types of substance such as dyes, heavy
metals and other impurities. Present work is able to treat emulsion waste by using
effective bio-coagulant and low cost industrial waste as bio-adsorbent.

IX
ABSTRAK
Emulsi lazimnya digunakan dalam industri pemprosesan logam sebagai bahan
penyejuk dan minyak pelincir. Sisa emulsi akan dibuang selepas digunakan. Sisa ini
perlu dirawat bagi memenuhi had standard sebelum dilepaskan ke laluan air untuk
mengelakkan pencemaran. Objektif kerja ini adalah untuk menstrukturkan satu sistem
rawatan air sisa emulsi dengan menggunakan bio-koagulan berkesan dan kos rendah
sisa pertanian sebagai bio-penjerap. Chitosan dan kulit biji getah sebagai bio-
koagulan dan bio-penjerap akan digunakan dalam eksperimen ini. Sampel air sisa
emulsi dikumpulkan dan analisis telah dijalankan. Pengaktifan serbuk chitosan telah
disediakan dengan melarutkan ia dengan asid asetik dan air suling. Benih getah segar
telah diretak untuk mendapatkan kulit dan kemudiannya dibasuh, dikering, dikisar,
diayak dan diaktifkan dengan NaOH sebelum proses karbonisasi untuk menghasilkan
RSSAC. Karbonisasi dapat meningkatkan SBET sehingga 20 kali ganda. Keputusan
menunjukkan bacaan tertinggi SBET(19.2403m2/g) pada 650
oC berbanding
SBET(0.9482 m2/g) sebelum proses karbonisasi. Karbonisasi berkesan untuk
menggalakkan pembentukan liang baru. Walau bagaimanapun, nilai SBET menurun
pada suhu 850oC adalah kerana hakisan permukaan dinding berliang. Jar-test telah
digunakan dengan chitosan sebagai koagulan di rawatan utama diikuti dengan RSSAC
sebagai penjerap pada rawatan selanjutnya. Kesan ke atas pengurangan O&G, TSS,
turbidity dan pH dikaji dalam kertas ini dengan mengubah masa dan dos. Sistem
chitosan + RSSAC dapat mengurangkan 90% O&G berbanding dengan chitosan
sahaja yang hanya dapat mengurangkan sehingga 76%. Chitosan menggumpal dan
meningkatkan pengumpulan sisa minyak dari emulsi. RSSAC pula dapat menjerap
minyak yang tertinggal daripada rawatan pertama. Rawatan ini dapat mengurangkan
TSS dan turbidity sehingga kepada 98.7 % dan 92.5 %. Air sisa yang telah dirawat
boleh diproses dengan lebih lanjut dengan menggunakan ultrafiltration membrane
untuk memerangkap sisa RSSAC. Selain itu, warna yang menunjukkan kehadiran
logam berat boleh dirawat dengan lebih lanjut untuk memperbaiki kejelasan hasil
turasan. RSS boleh terus diterokai untuk menghasilkan karbon dengan cara-cara lain
pengaktifan dan digunakan untuk menjerap jenis bahan-bahan lain seperti pewarna,
logam berat dan kekotoran lain. Kajian ini mampu merawat sisa emulsi dengan
menggunakan bio-koagulan berkesan dan sisa industri kos rendah sebagai bio-
penjerap.

X
TABLE OF CONTENTS
SUPERVISORS’ DECLARATION ............................................................................ IV
STUDENT’S DECLARATION ................................................................................... V
Dedication .................................................................................................................... VI
ACKNOWLEDGEMENT ......................................................................................... VII
ABSTRACT .............................................................................................................. VIII
ABSTRAK ................................................................................................................... IX
LIST OF FIGURES ................................................................................................... XII
LIST OF TABLES .................................................................................................... XIII
LIST OF ABBREVIATIONS ................................................................................... XIV
1.0 INTRODUCTION ................................................................................................... 1
1.1 Motivation and brief review ................................................................................. 1
1.2 Problem Statement ............................................................................................... 5
1.3 Research Objective ............................................................................................... 6
1.4 Research Scope .................................................................................................... 6
2.0 LITERATURE REVIEW ........................................................................................ 7
2.1 Chapter Overview ................................................................................................ 7
2.2 Emulsion............................................................................................................... 7
2.3 Treatment Method: Coagulation and Flocculation............................................... 9
2.3.1 Mixing Theory ............................................................................................. 11
2.3.2 Coagulant Aids ............................................................................................ 11
2.3.3 Coagulant Selection ..................................................................................... 11
2.3.4 Chitosan as Coagulant ................................................................................. 13
2.4 Treatment Method: Adsorption .......................................................................... 16
2.4.1 Adsorption Theory and Rationality of Adsorption Method ........................ 16
2.4.2 Potential Adsorbents .................................................................................... 18
2.4.3 Commercial Adsorbents .............................................................................. 19
2.4.4 Low-cost Agricultural Waste as Substitute Adsorbents .............................. 22
2.4.5 Rubber seed shell as Adsorbent ................................................................... 23
2.5 Treatment of Industrial Wastewaters ................................................................. 26
2.6 Conclusion .......................................................................................................... 26

XI
3.0 MATERIALS AND METHODS ........................................................................... 27
3.1 Experimental Materials ...................................................................................... 27
3.2 Parameters .......................................................................................................... 28
3.3 Preparation of chitosan and RSSAC .................................................................. 29
3.4 Experimental Procedures.................................................................................... 30
3.5 Laboratory Analysis ........................................................................................... 32
4.0 RESULTS AND DISCUSSIONS .......................................................................... 33
4.1 Results of produced RSSAC .............................................................................. 33
4.2 Characterization results of emulsified wastewater ............................................. 35
4.3 Effect on O&G removal % ................................................................................. 39
4.4 Effect on TSS removal % ................................................................................... 42
4.5 Effect on Turbidity removal %........................................................................... 45
4.6 Effect on pH value.............................................................................................. 48
5.0 CONCLUSION & RECOMMENDATION .......................................................... 51
5.1 Summary ............................................................................................................ 51
5.2 Limitations & Recommendations....................................................................... 52
REFERENCES ............................................................................................................ 53
APPENDICES ............................................................................................................. 59
A1: Graphics ............................................................................................................ 59
A2: Raw data ............................................................................................................ 64

XII
LIST OF FIGURES
Figure 1 - 1 : Parameter limits of effluent of Standards A and B. Adapted from
“Environmental Quality (Sewage and Industrial Effluents) Regulations 1979”, p. 107 ........... 3
Figure 2 - 1 : Structures of cellulose, chitin and chitosan. Adapted from “A Review of Chitin
and Chitosan Application” by M.N.V.R. Kumar, 2000, Reactive & Functional Polymers, 46,
p.1-27. ...................................................................................................................................... 14
Figure 2 - 2 : Variation of iodine adsorption of RSSC with carbonization temperature.
Adapted from “Effect of carbonization on the processing characteristics of rubber seed shell”
by Ekebafe, et al., 2012, Arabian Journal of Chemistry, 1878-5352. ..................................... 25
Figure 3 - 1: Activation of chitosan ........................................................................................ 29
Figure 3 - 2: Preparation of RSSAC ....................................................................................... 29
Figure 3 - 3: Schematic diagram of treatment of emulsified wastewater ............................... 31
Figure 4 - 1: Effect of temperature on the BET surface area of RSSAC. Carbonization time =
120 min. ................................................................................................................................... 34
Figure 4 - 2: Effect of mixing time on the O&G removal % .................................................. 40
Figure 4 - 3: Effect of dosage on the O&G removal % .......................................................... 40
Figure 4 - 4: Effect of mixing time on the TSS removal % .................................................... 43
Figure 4 - 5: Effect of dosage on the TSS removal % ............................................................ 43
Figure 4 - 6: Effect of mixing time on the turbidity removal % ............................................. 46
Figure 4 - 7: Effect of dosage on the turbidity removal % ..................................................... 46
Figure 4 - 8: Effect of mixing time on the pH value .............................................................. 49
Figure 4 - 9: Effect of dosage on the pH value ....................................................................... 49
XIII
LIST OF TABLES
Table 2 - 1 : Parameter values of the raw emulsified wastewater. ............................................ 8
Table 2 - 2 : Characteristics of rubber seed coat carbon and commercial activated carbon.
Adapted from “Removal of phenol from aqueous solution and resin manufacturing industry
wastewater using an agricultural waste: rubber seed coat” by Rengaraj, et al., 2001, Journal of
Hazardous Materials, B89, p. 185. .......................................................................................... 24
Table 3 - 1: Significance of parameters monitored in this research. ...................................... 28
Table 3 - 2: Summarized experimental analysis method. ....................................................... 32
Table 4 - 1: Results of produced activated RSS and RSSAC. ................................................ 33
Table 4 - 2 : Characteristics of raw emulsified wastewater in comparison with the parameter
limits of effluent of standards A and B. .................................................................................. 35
Table 4 - 3 : Physical properties of raw emulsified wastewater. ............................................ 37
Table 4 - 4: Effect of mixing time and dosage on the O&G removal at initial oil
concentration of 3657.1mg/L .................................................................................................. 39
Table 4 - 5: Effect of mixing time and dosage on the TSS removal at initial TSS
concentration of 750mg/L ....................................................................................................... 42
Table 4 - 6: Effect of mixing time and dosage on the turbidity removal at initial turbidity
level of 70mg/L ....................................................................................................................... 45
Table 4 - 7: Effect of mixing time and dosage on the pH value ............................................. 48
Table 4 - 8: Summary of produced optimum results .............................................................. 51

XIV
LIST OF ABBREVIATIONS
BOD Biochemical oxygen demand
CAC Commercial activated carbon
CNC Computer numerical control machine
COD Chemical oxygen demand
DOE Design of experiment
GAC Granular activated carbon
MTZ Mass transfer zone
NOM Natural organic matter
O&G Oil and grease
O/W Oil in water
PAC Powdered activated carbon
RSCC Rubber seed coat carbon
RSS Rubber seed shell
RSSAC Rubber seed shell activated carbon
SCD Streaming current detector
TSS Total suspended solids
W/O Water in oil

1
1.0 INTRODUCTION
1.1 Motivation and brief review
This research will be conducted to evaluate the coagulation and adsorption
performance of chitosan and rubber seed shell activated carbon (RSSAC) in
emulsified wastewater respectively. The effects of various process variables in this
research will be reviewed.
Chiefly, water is a basic source of life, energy and is a fundamental for human
consumption, agricultural process, economic activity and an important part in the
ecosystem. As rapid industrialization and economic expansion, unseen constraints on
freshwater resources are growing and caught the public’s attention on the limits to
water availability. Many places are expecting the point of peak water and there is a
need to shift the way of management of freshwater resources towards a more
productive, efficient and ecological use (Gleick & Palaniappan, 2010). Management
in water works have been explored and expanded to support water demand. Type of
facilities such as large dams, treatment plants, wells and pipelines are constructed
according to characteristics and life expectancy for continuous water supply to houses,
commercial and institutional facilities (Davis, 2010).
Surface water and ground water are the two basic fresh water supplies. Surface
waters are the ones which are highly exposed to hazardous waste and toxic effluents.
Though a fraction of the United States populations are supplied with groundwater, but
it do have its cons. Groundwater contains minerals which may cause unwanted
characteristics such as hardness, color from iron oxidation and arsenic from beneath
the earth’s surface (Davis, 2010). In addition to that, groundwater is estimated about
only 0.61% of the world’s water which is very limited (“Columbia Water Center”,
2013). This is why surface water is to be managed wisely. With the ongoing rise of
water supply risk, climate variability and pollution from industrial activities into
surface waters, this proves the urgency to protect and manage surface water in a long
term perspective.

2
Generally, global population is foreseen to hit up soon. Meaning that more
usage and demand of water in the future. The chief source of freshwater pollution is
due to untreated effluents and toxic industrial wastes. It is proven that water
contaminations which causes up to 70-80% of illness in developing countries are from
pollution discharge. It also causes a negative impact on aquatic life and the balance of
the ecosystem (“Global Water Supply and Sanitation Assessment Report”, 2000). The
environmental issues caused by modern industrial technologies especially in the
discharging of untreated effluents leads to scheduled wastes which is a material that
contains chemicals exceeding the threshold amount and the parameters limits of
discharge quality, Standard A and B as stated in the Environmental Quality Act 1974.
It is a crucial element to make sure that any effluents or discharges of water have to
be under all the parameter limits before is it allowed to be released into waterways.
Figure 1-1 below shows the acceptable limits of the parameter of effluents under the
Standard A and B.

3
Figure 1 - 1 : Parameter limits of effluent of Standards A and B. Adapted from
“Environmental Quality (Sewage and Industrial Effluents) Regulations 1979”, p. 107

4
Standard A is a more stringent guide because Standard A is applied as a
regulation at the water catchment areas which includes areas upstream of surface or
above sub-surface of waterways, mainly directed to the community and for human use.
On the other hand, Standard B applies to effluent that leads to the downstream
waterways such as the sea (“Environmental Quality: Sewage and Industrial Effluents
Regulations”, 1979). BOD, COD and TSS limits are all below 100mg/L for both
standards. Mercury and phenol are having the least allowable limit of 0.005mg/L and
0.001mg/L respectively. Chromium-trivalent, copper, manganese, nickel, tin and zinc
are to be less than 1.0mg/L for both standards. Arsenic and cyanide have to be less
than 0.1mg/L. Boron and iron each have to be less than 4.0mg/L and 5.0mg/L
respectively. Oil and grease, the most significant parameter in this research is to be
under 10.0mg/L for standard B.
On the other hand, emulsified wastewaters are one of the major toxic wastes
from the metal processing industry. Oil in water (O/W) is a type of emulsions where it
is a hydrophobic solvent which dispersed in an aqueous medium (“Pollution
Prevention Guidance Manual for the PFPR Industry”, 1998). Emulsions are
commonly used in metal processing productions as emulsified coolant and also in
power plant as lubricating oil. They are also commonly referred as cutting fluid,
cutting oil, coolant or lubricant. Usually after they lost their efficiency, these emulsion
waste will be discharged off or sent for treatment. On top of that, there are emulsion
wastes being produced monthly in a common mechanical lab or plant. Used oils must
be reused or have proper disposal methods by local waste management authorities or
automotive plant. It is because engine lubrication oil, gear oils or machine oils are a
major source of oil contamination of waterways. These emulsions are insoluble and
are exposed to toxic chemicals and heavy metals (“Used Oil Management Program”,
2012).
Majority of the industrial waste in Malaysia is sent to Kualiti Alam Sdn. Bhd.
for treatment and disposal periodically. Referring to Kualiti Alam Sdn Bhd’s
treatment rates for scheduled waste, it is very costly and used up a lot of resources
especially in transportation and treatment. Therefore, it is ideal in the present to
develop an emulsified wastewater treatment system. Breakthroughs on technologies
on water treatment have been developed over the years and chemical treatment is one

5
of the most useful and utilized techniques in wastewater treatment process (Sharma &
Sanghi, 2012). Chemical treatment usually involves coagulation and flocculation
process as a primary treatment then followed by secondary stage (Sharma & Sanghi,
2012). Among secondary stage are filtration, foam flotation, ion exchange, aerobic
and anaerobic treatment, electrolysis, solvent extraction and adsorption. Adsorption is
considered as an ideal treatment due to the process’s fundamental design and direct
procedures (Bhatnagar & Sillanpaa, 2010). Physical adsorption method will be
employed in this study by using natural bio-sorbent, chitosan. The work is also
extended to study the chelation behavior of RSSAC.
1.2 Problem Statement
It is costly to frequently send out emulsion waste for treatment. From a
conducted survey, it was estimated that a manufacturing plant will produce around 20
tonnes of wastewater every month. Meaning that, 240 tonnes of wastewater is
produced every year. This scheduled wastewater is disposed to Kualiti Alam Sdn. Bhd.
at a rate of RM 3000.00 per tonne. Hence, each plant will spend more than RM
720,000.00 per year. In Malaysia, there are more than 100 manufacturing plant and
are still counting. Therefore, RM72 million per year will be the total spending to treat
them. Since lots of money being spent by the industry to dispose the waste water, it is
rational to conduct a research to tackle this matter.
Therefore, it is feasible to have a treatment facility which runs on affordable
budget yet having high performance emulsion breaking system. Despite having
potential in improving adsorption methods in treating wastewater, there are only a
handful of studies that have focused on using biomaterials as adsorbent. A cheaper
alternative in adsorbent is also a more feasible factor in terms of economic production.
In this work, biomaterials chitosan and RSSAC will be used.
6
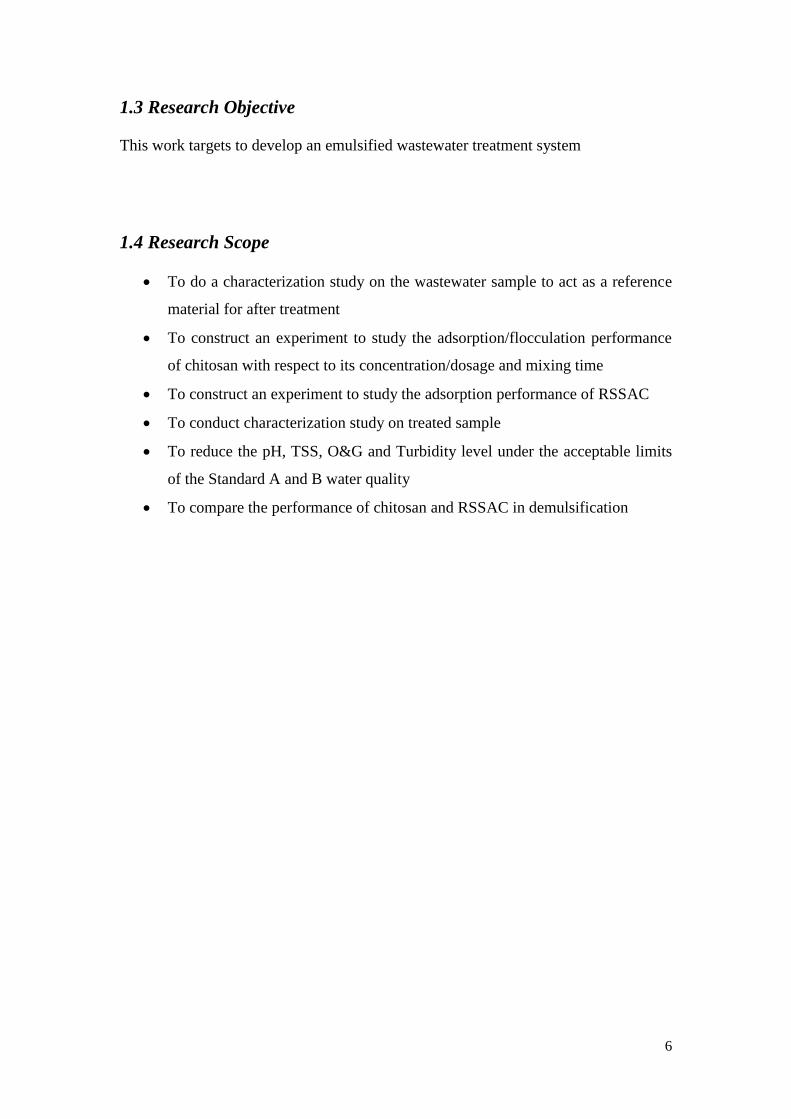
1.3 Research Objective
This work targets to develop an emulsified wastewater treatment system
1.4 Research Scope
To do a characterization study on the wastewater sample to act as a reference
material for after treatment
To construct an experiment to study the adsorption/flocculation performance
of chitosan with respect to its concentration/dosage and mixing time
To construct an experiment to study the adsorption performance of RSSAC
To conduct characterization study on treated sample
To reduce the pH, TSS, O&G and Turbidity level under the acceptable limits
of the Standard A and B water quality
To compare the performance of chitosan and RSSAC in demulsification

7
2.0 LITERATURE REVIEW
2.1 Chapter Overview
Being the utmost importance of wastewater treatment technologies and design,
the need of its quality breakthroughs, improvements and preservation are growing
continuously. Two treatment methods, coagulation and adsorption will be used for
chitosan and RSSAC respectively in this research. Adsorption and coagulation
technology including theories, type of adsorbents and coagulants and findings will be
reviewed in this chapter. Characteristics of emulsified wastewater used in this
research will also be discussed. Fundamentals theories of adsorption equilibria such as
Langmuir and Freundlich isotherm will not be discussed in this particular research.
This exploratory research will be focusing on the adsorption performance of bio-
sorbents rather than constructing an adsorption isotherm or determining the maximum
or ultimate capacity.
2.2 Emulsion
Generally, emulsions contain three basic components which are oil, some
emulsifying agent and water. Emulsifying agent will form a layer boundary around
the oil droplet which made the oil droplet suspended in the water. The breaking of
emulsion layer is the target way of treating this particular waste. Breaking of emulsion
is also known as demulsification. Demulsification is the utmost important processes in
metallurgical, food and chemical industries, where they frequently generate a large
quantity of water-in-oil (W/O) and (O/W) liquid waste (Kukizaki & Goto, 2008).
To date, many methods for demulsification have been practiced such as
electrical, temperature change, distillation, centrifuging, ultrasonic vibration, agitation
and filtration but all these are mostly shifted out due to the economic and convenience
reason and are not been explored thoroughly (Milne, 1950). Although membrane
demulsification is proven to have high efficiency, but it has energy costs and is a
complex process (Kukizaki & Goto, 2008). On top of that, although chemical
breaking methods by reacting emulsifying agent with salts of polyvalent metals are

8
satisfactory, but they use large quantity of chemicals and are not environment friendly
(Milne, 1950).
Raw emulsified wastewater will be used in this exploratory research. A
summary of the emulsified wastewater from a metallic processing machine parameter
results are as shown below.
Table 2 - 1 : Parameter values of the raw emulsified wastewater.
No Parameter Results
Unit
1 Density 1.001
g/cm3
2 Turbidity 70
NTU
3
pH
9.71 @ 24.5oC
-
4
TSS
More Than 750
mg/L
5
O&G
More Than 100
mg/L
6 Viscosity 132.6
cP

9
Theses analyzed values are way above the acceptable limits set as shown in
Figure 1-1 previously. The reported results of turbidity, TSS and O&G are all at risk
which proves that the waste is hazardous and is not ready to be discharged into the
waterways.
2.3 Treatment Method: Coagulation and Flocculation
Coagulation and flocculation are ideal elements in conventional water treatment
because they are capable in
Preventing the formation of disinfection byproducts
Removing disease spreading particles
Removing toxic substance that have adsorbed to the surface of particles
Treat the water to a suitable standard (Davis, 2010).
Chemical water treatment usually involves coagulation and flocculation process
as a primary treatment then followed by secondary stage (Sharma & Sanghi, 2012).
Coagulation and flocculation are pretreatment processes and they only assist in their
efficiency of removal in further separation operations and do not remove
contaminants (Edzwald, 2011) Coagulation is a complex process where it improves
the ability of small particles in an aqueous suspension to attract among itself and to
adsorbents (Edzwald, 2011). In addition, the purpose of coagulation is to transform
the small particles into larger particles called flocs. Flocs are usually formed as
precipitates or as suspended materials. They are readily to be removed easily via
settling, dissolved air flotation or filtration (Davis, 2010). There are four basic
mechanisms in chemical coagulation, namely
a) Ionic layer compression,
b) Charge neutralization,
c) Entrapment in a flocculent mass and interparticle bridging (Peavy, et al., 1985).
10
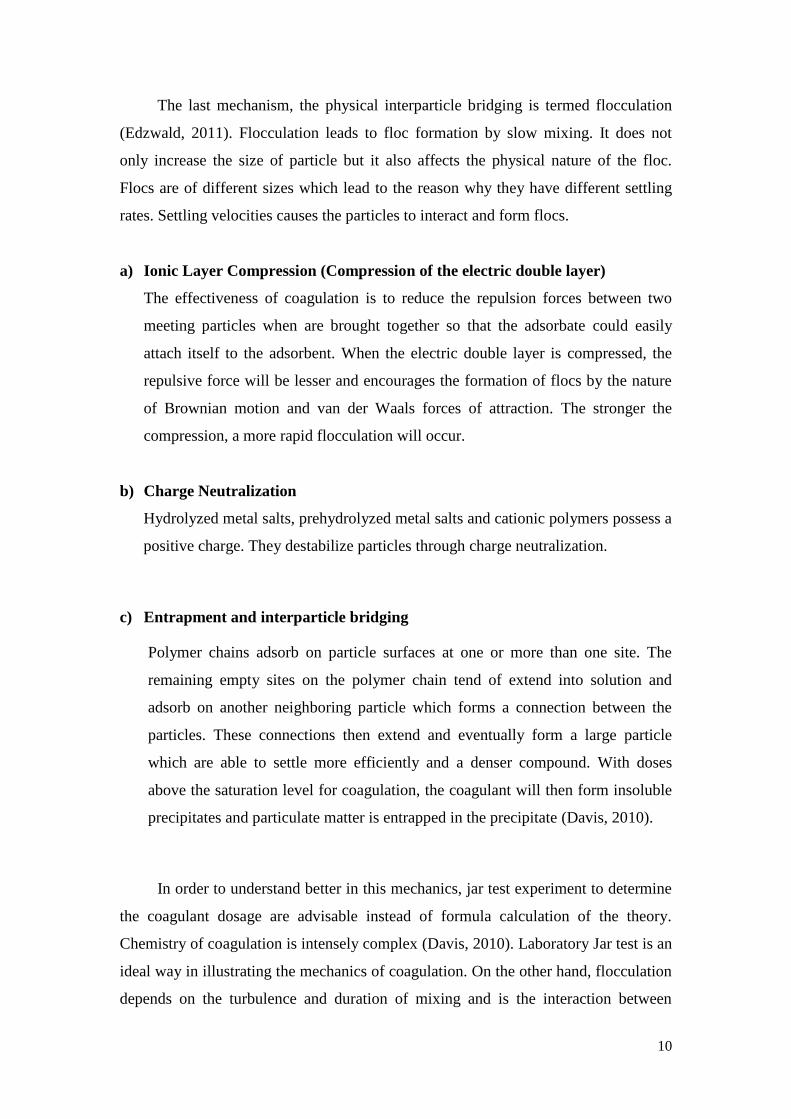
The last mechanism, the physical interparticle bridging is termed flocculation
(Edzwald, 2011). Flocculation leads to floc formation by slow mixing. It does not
only increase the size of particle but it also affects the physical nature of the floc.
Flocs are of different sizes which lead to the reason why they have different settling
rates. Settling velocities causes the particles to interact and form flocs.
a) Ionic Layer Compression (Compression of the electric double layer)
The effectiveness of coagulation is to reduce the repulsion forces between two
meeting particles when are brought together so that the adsorbate could easily
attach itself to the adsorbent. When the electric double layer is compressed, the
repulsive force will be lesser and encourages the formation of flocs by the nature
of Brownian motion and van der Waals forces of attraction. The stronger the
compression, a more rapid flocculation will occur.
b) Charge Neutralization
Hydrolyzed metal salts, prehydrolyzed metal salts and cationic polymers possess a
positive charge. They destabilize particles through charge neutralization.
c) Entrapment and interparticle bridging
Polymer chains adsorb on particle surfaces at one or more than one site. The
remaining empty sites on the polymer chain tend of extend into solution and
adsorb on another neighboring particle which forms a connection between the
particles. These connections then extend and eventually form a large particle
which are able to settle more efficiently and a denser compound. With doses
above the saturation level for coagulation, the coagulant will then form insoluble
precipitates and particulate matter is entrapped in the precipitate (Davis, 2010).
In order to understand better in this mechanics, jar test experiment to determine
the coagulant dosage are advisable instead of formula calculation of the theory.
Chemistry of coagulation is intensely complex (Davis, 2010). Laboratory Jar test is an
ideal way in illustrating the mechanics of coagulation. On the other hand, flocculation
depends on the turbulence and duration of mixing and is the interaction between
11
destabilized particles and between particles and flocs which will be reviewed as well
(Peavy, et al., 1985).
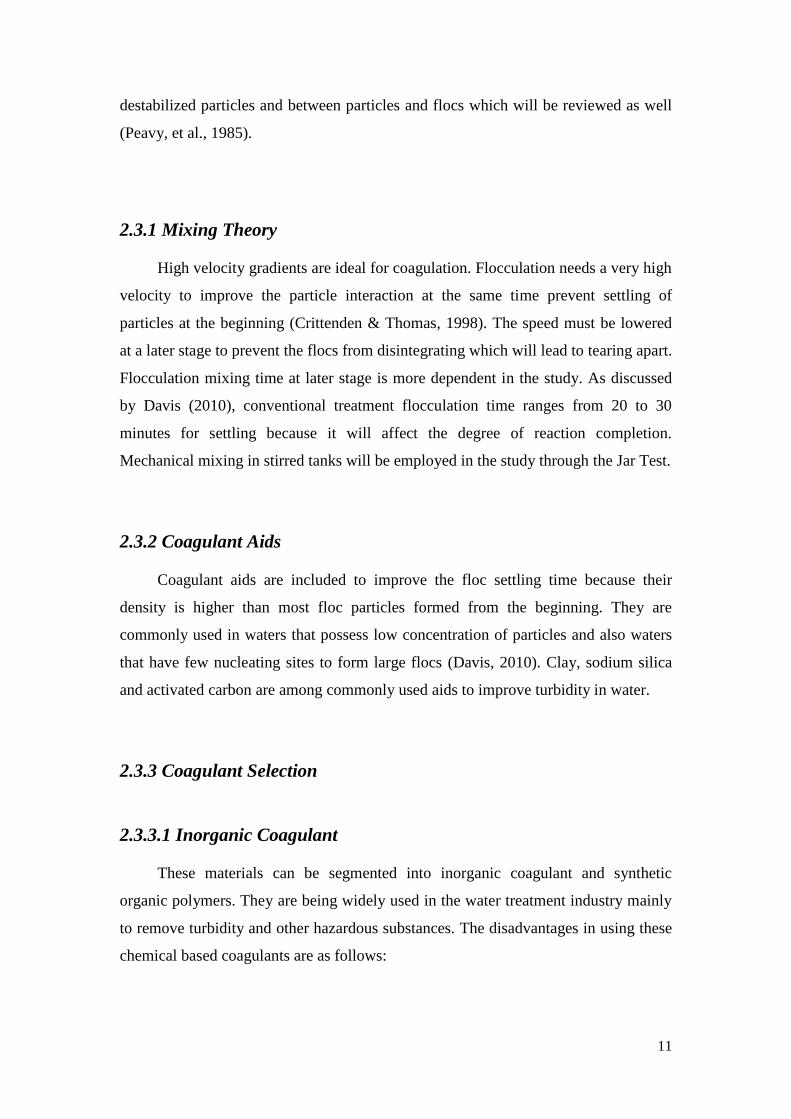
2.3.1 Mixing Theory
High velocity gradients are ideal for coagulation. Flocculation needs a very high
velocity to improve the particle interaction at the same time prevent settling of
particles at the beginning (Crittenden & Thomas, 1998). The speed must be lowered
at a later stage to prevent the flocs from disintegrating which will lead to tearing apart.
Flocculation mixing time at later stage is more dependent in the study. As discussed
by Davis (2010), conventional treatment flocculation time ranges from 20 to 30
minutes for settling because it will affect the degree of reaction completion.
Mechanical mixing in stirred tanks will be employed in the study through the Jar Test.
2.3.2 Coagulant Aids
Coagulant aids are included to improve the floc settling time because their
density is higher than most floc particles formed from the beginning. They are
commonly used in waters that possess low concentration of particles and also waters
that have few nucleating sites to form large flocs (Davis, 2010). Clay, sodium silica
and activated carbon are among commonly used aids to improve turbidity in water.
2.3.3 Coagulant Selection
2.3.3.1 Inorganic Coagulant
These materials can be segmented into inorganic coagulant and synthetic
organic polymers. They are being widely used in the water treatment industry mainly
to remove turbidity and other hazardous substances. The disadvantages in using these
chemical based coagulants are as follows:

12
Affect pH of water after treatment
Ineffective in low-temperature water
High procurement costs
Negative effects on human health
High quantity of sludge produced (Yin, 2010).
Despite being cheap and known to be the most widely used coagulants in water
and wastewater treatment in the world, the presence of residuals after treatment are
unwholesome and undesirable due to their neurotoxicity and heavy carcinogenic
characteristics which are unsafe for human health (Mallevialle et al., 1984). With a
large amount of these coagulant used, therefore generating a large quantities of sludge.
Coagulant recovery from water treatment works are being practiced since back
at the year 1970’s but was discontinued due to lack of literature and specifications
(Keeley et al., 2011). If coagulant recovery or recycling can be done, then this would
save up coagulant cost and thus providing a higher efficiency treatment process.
However, this situation has been overruled by the present high treatment efficiency.
Members of the public are focusing on the treatment of waste but are not mindful on
the economic and environmental consequences of post treatment. There are hardly
any published literatures on inorganic coagulant recovery after treatment. Examples
of inorganic and synthetic organic polymers coagulant are as follows.
a) Metal Salts
Alum, ferric chloride and ferric sulfate are the most common coagulants. These
metal salts are very robust over a wide range of variable pH. These metal salts
hydrolysis products react with F-, SO4
2-, PO4
3- and natural organic matter (NOM), and
form soluble and insoluble particles (Davis, 2010). The usual concentrations of alum
are from 10 to 150mg/L, ferric chloride from 5 to 150mg/L and ferric sulphate from
10 to 250mg/L. They are among the best in NOM removal provided is done with the
right dosage and selection of coagulant.

13
b) Polymer
Polymers are a promising coagulant in the strength to reduce metal salt
concentration and producing sludge production up to a high 80%. Generally,
polymers are known to be slightly affected by pH and the usual dosages are from only
1 to 10mg/L. On the other side, polymers are ineffective in NOM removal (Davis,
2010).
2.3.3.2 Natural Coagulant
In comparison to inorganic coagulants, natural coagulants are produced or
extracted from microorganisms, plant or animal tissues. These natural coagulant or
also known as bio-coagulants are biodegradable, non-toxic and safe for human
(Kumar, 2000). Being biodegradable, it produces less amount of volume of sludge
that consists only 20-30% that of alum treated otherwise (Sciban et al., 2009). On top
of that, it is obviously cost effective since its productions are mainly from agricultural
waste and other renewable resources. It is also rarely will produce treated water with
extreme pH value (Yin, 2010). Chitosan, a component from the exoskeleton of sea
material will be employed in this research and will be discussed in the following
section of this literature review.
2.3.4 Chitosan as Coagulant
Chitosan is a modified, natural and a versatile biopolymer derivative that is
produced by alkaline deacetylation of chitin which is a component of the exoskeleton
of crustaceans such as lobster, prawn, crab (Kim, 2011). It is nontoxic, antiviral,
antifungal, biodegradable, biocompatible, and has flocculating ability. Chitin is
composed of β (1→4)-lined 2-acetamido-2-deoxy-β-D-glucose (N-
acetylglucosamine). It can be related as cellulose with a hydroxyl at position C-2
replaced by an acetamido group. Chitosan is the N-deacetylated derivative of chitin
(Kumar, 2000). Agricultural materials especially those possesses cellulose shows

14
potential sorption capacity for a variety of pollutants (Bhatnagar & Sillanpaa, 2010).
Cellulose, chitin and chitosan all acts naturally as a structural polysaccharide which is
a better alternative to the synthetic polymer materials. The latter two are of industry
interest because of their nitrogen percentage of 6.89% compared to cellulose of 1.25%
which made them a better chelating species (Muzzarelli, 1973). The structures of
cellulose, chitin and chitosan are shown in Figure 2-1.
Figure 2 - 1 : Structures of cellulose, chitin and chitosan. Adapted from “A Review of
Chitin and Chitosan Application” by M.N.V.R. Kumar, 2000, Reactive & Functional
Polymers, 46, p.1-27.
Chitosan has tremendous contribution in various industries from drug delivery
in medical, beverage, cosmeticeuticals to food industry and there are hardly any
published articles on chitosan’s ideal ability in emulsified wastewater treatment. Since
it’s a global interest on the use of renewable resources in industry and is a very
abundant material, chitosan seems like a prominent choice as a bio adsorbent (Kim,
15
2011). Fisheries wastes such as crab shells and prawn from Asian countries including
Thailand, Japan and China are being focused to be developed into chitosan. Raw
materials can be obtained for free from the local fishermen (Ahmaruzzaman, 2008).
Studies showed chitosan’s ability in dye removal, coagulation and flocculation as well
as a heavy metal removal especially for copper (Kim, 2011). Chitosan molecules are
also known in removing heavy metals and oils from water. Higher molecular weight
and higher degree of deacetylation of chitosan powder have properties that show
stronger adsorption strength compared with its opposite counterpart. The prolonged
adsorption process is due to the constant disentanglement of the polymer molecules
(Chattopadhyay & Inamdar, 2010).
Activation of chitosan will be done by coagulating the chitosan powder with
dilute acids to form a gel for treatment purposes. Chitosan is soluble in dilute acids
such as acetic acid, formic acid, etc. The gel forming ability of chitosan in its
application in drug release formulations has been reported (Kumar, 2000). Chitosan
gives viscous solution when dissolved in acidic solutions. Hydrogel formation and
viscoelastic behavior determines its potential use as thickener and other applications
(Chattopadhyay & Inamdar, 2010). There are also studies implicating that chitosan
flakes proven to have a high oil removal percentage of 87.5 in treating palm oil waste
(Sofian, 2008). Based on all these findings, application of chitosan as a better
alternative adsorbent for the treatment of emulsified wastewater will be an expanded
interest in the near future.

16
2.4 Treatment Method: Adsorption
2.4.1 Adsorption Theory and Rationality of Adsorption Method
Adsorption method is considered as one of the few direct and economical
method of breaking emulsions in wastewater (“Pollution Prevention Guidance Manual
for the PFPR Industry”, 1998). Among others are filtration, foam flotation, ion
exchange, aerobic and anaerobic treatment, electrolysis, coagulation, solvent
extraction and adsorption. Adsorption is considered as an ideal treatment due to the
process’s fundamental design and direct procedures unlike aerobic treatment which is
time consuming (Bhatnagar & Sillanpaa, 2010). Adsorption method is being
extensively used in organic and inorganic micropollutants removal from aqueous
solutions (Lin, 2008).
Physical adsorption method will be employed in this study. This physical
treatment method would be an ideal procedure due to the fact that it is considered the
best way of treating wastewater as it is economical, has simple standard operation
procedures and has a removal capacity of up to 99.9% (Ali et al., 2012). Adsorbate is
the pollutant from the waste that is being adsorbed and the adsorbent is the adsorbing
phase in this study. Adsorption processes one or more components of a gas or liquid
stream are adsorbed on the surface of a solid adsorbent and a separation if
accomplished. Chiefly, adsorbents are produced in the form of granules, flakes,
powder and small pellets ranging from 0.1mm to 12mm in size (Peavy et al., 1985).
2.4.1.1 Adsorption Technology
There are basically four main processes and cycles in adsorption technology and
design such as
a) Fixed and moving bed processes
b) Fixed bed processes
c) Moving bed processes
d) Batch processes