DEVELOPMENT OF EDUCATIONAL SOFTWARE FOR THE DESIGN …
113
DEVELOPMENT OF EDUCATIONAL SOFTWARE FOR THE DESIGN OF SLENDER REINFORCED CONCRETE COLUMNS By KHALID BOUDAOUI Directed by Dr. GEORGE HEARN THESIS Submitted in partial fulfillment of the requirements for the degree of Master of Science in Structural Engineering and Structural Mechanics University of Colorado – Boulder, 2013 Boulder, CO
Transcript of DEVELOPMENT OF EDUCATIONAL SOFTWARE FOR THE DESIGN …

DEVELOPMENT OF EDUCATIONAL SOFTWARE
FOR THE DESIGN OF
SLENDER REINFORCED CONCRETE COLUMNS
By
KHALID BOUDAOUI
Directed by
Dr. GEORGE HEARN
THESIS
Submitted in partial fulfillment of the requirements
for the degree of Master of Science in
Structural Engineering and Structural Mechanics
University of Colorado – Boulder, 2013
Boulder, CO

SIGNATURE PAGE
This thesis entitled:
Development of Educational Software for the
Design of Slender Reinforced Concrete Columns
written by Khalid Boudaoui
has been approved for the Department of Civil, Architectural and Environmental
Engineering
Dr. George Hearn
Dr. Abbie Liel
Dr. Franck Vernerey
Date
The final copy of this thesis has been examined by the signatories, and we find that both
the content and the form meet acceptable presentation standards of scholarly work in the
above mentioned discipline

iii
ABSTRACT
Boudaoui, Khalid (M.S., Civil, Environmental and Architectural Engineering)
Development of Educational Software for the Design of Slender Reinforced Concrete
Columns
Thesis directed by Professor George Hearn
Education of undergraduate students in first class of reinforced concrete design
must include design of slender compression members since they are common components
in structures such as buildings and bridges. Education must engage students to function as
designers, that is, to determine the geometry of the member as well as the layout of the
steel reinforcement to withstand a set of loadings. Educational software application, CU
Slender Column, is developed to support the education of students in reinforced concrete
design. CU Slender Column studies single slender reinforced concrete columns with
circular cross section. Designs account for slenderness effects by applying the American
Concrete Institute (ACI) 318 moment magnification method for both non-sway and sway
frames. To help students in the design, CU Slender Column provides feedbacks relative to
the accuracy of numerical values of strengths and loads as well as the satisfaction of ACI
provisions. Also, it is demonstrated that CU Slender Column is an efficient tool able to
deal with a wide range of design situations. The demonstration of the performance of CU
Slender Column is done by developing 38 examples exploring different column designs
passing or failing in strength or in ACI provisions.

DEDICATION
My research at the University of Colorado – Boulder on the development of education
software for the design of slender columns has been valuable on many points. Being part
of the University of Colorado – Boulder has been possible thanks to the unlimited help of
my family especially my mother. Thus, I would like to dedicate my work to my loved ones.
Besides, working on a topic touching the education of students in structural engineering
taught me the importance of the education of those who will build the world of tomorrow.
I hope that my work will bring a humble contribution to enhance the education of future
structural engineers. Thus, I would also like to dedicate my work to this large and
wonderful community devoted to design and construct sustainable and reliable structures.

v
ACKNOWLEDGMENTS
I would like to express my gratitude to Dr. George HEARN, my Master’s thesis adviser
and professor in the Civil, Environmental and Architectural Engineering (CEAE)
Department at the University of Colorado – Boulder. His experience in both structural
engineering practice and education have been highly profitable for me. First, Dr. HEARN
provided a new skill: Knowing the basics of C++ programming which were necessary for
the development of the educational software application. Besides, Dr. HEARN showed a
huge respect for my person and my work and his critics were always relevant to enhance
my research. Also, Dr. HEARN taught me the rigor and the methodology necessary in the
writing of my thesis. I am grateful to other committee members, Dr. Abbie LIEL and Dr.
Franck VERNEREY for showing interest in my research and for their relevant evaluation.
I am thankful to the faculty of the CEAE department who provided me a valuable education
in structural engineering. Also, I would like to thank authors and publishers whose works
were an important source of knowledge for the development of my thesis. Finally, I would
like to thank the Fondation Francis Bouygues which provided me a grant to ease my
studying in United States.

vi
TABLE OF CONTENTS
Contents
List of Tables ............................................................................................................................................. x
List of Figures .......................................................................................................................................... xii
Chapter 1 - Introduction ................................................................................................................................. 1
The Design Code ....................................................................................................................................... 2
The Design Method ................................................................................................................................... 2
Limitation on Structural Members ............................................................................................................. 2
Organization of the Study .......................................................................................................................... 3
Chapter 2 - Theory and Application of ACI 318 Moment Magnification Method ......................................... 4
ACI 318 Loading Combinations ................................................................................................................ 5
Elastic Theory of the Moment Magnification Method for Non-Sway Frame ............................................ 6
Sign Convention ................................................................................................................................... 6
Expression of the Moment 𝑴(𝒙) along the column ............................................................................. 7
Governing Equation and Solution ......................................................................................................... 7
ACI 318 Moment Magnification Method for Non-Sway Frame ............................................................... 9
Comparison between elastic analysis and ACI 318 expressions for magnification factor ...................10
ACI 318 Moment Magnification Method for Sway Frame ......................................................................16
Strength Computations .............................................................................................................................18
Compression zone smaller than half the column cross-sectional area .................................................20
Compression zone larger than half the column cross-sectional area ....................................................21
ACI 318 Moment Magnification Method and Checks of Strength Requirements for Non-Sway and Sway
Frames ......................................................................................................................................................23
Non-sway frame ...................................................................................................................................23
Sway frame ..........................................................................................................................................26
Flowchart of ACI 318 Moment Magnification Method .......................................................................28
Chapter 3 - Educational Software for the Design of Slender Reinforced Concrete Columns .......................30
Available Professional Software ...............................................................................................................30

vii
Educational modules .................................................................................................................................32
Operating System......................................................................................................................................34
Organization CU Slender Column Program .............................................................................................34
Graphical User Interface of CU Slender Column .....................................................................................36
Tab Inputs ............................................................................................................................................36
Tab Feedback .......................................................................................................................................37
Grid construction .................................................................................................................................38
CU Slender Column Classes .....................................................................................................................39
Aci Chapter 10 class ............................................................................................................................39
Aci class ...............................................................................................................................................39
Section forces class ..............................................................................................................................39
Rebar class ...........................................................................................................................................39
Material class .......................................................................................................................................39
Transverse rebar class ..........................................................................................................................39
Longitudinal rebar class .......................................................................................................................40
Boundaries class...................................................................................................................................40
Component class ..................................................................................................................................40
StudentChecks class .............................................................................................................................40
TabInput ...............................................................................................................................................40
columnGraphic .....................................................................................................................................40
CU Slender Column computations of 𝝓𝑷𝒏 and 𝝓𝑴𝒏 .............................................................................41
Chapter 4 - Demonstration of Educational Software .....................................................................................42
Presentation of Examples .........................................................................................................................42
Demo #1 – Evaluation of column strength in non-sway and sway frames ..........................................42
Demo #2 – Non satisfaction of ACI provisions ...................................................................................46
Demo #3 – Accuracy of student’s inputs .............................................................................................46
Comprehensiveness of examples for validation of CU Slender Column .............................................47
Detailed Examples for Moment Magnification Method in Non-Sway Frame ..........................................48
Detailed Examples for Moment Magnification Method in Sway Frame ..................................................55

viii
CU Slender Column Feedbacks ................................................................................................................61
Passing Column ...................................................................................................................................61
Failing Column ....................................................................................................................................63
Evaluation of Accuracy of CU Slender Column .......................................................................................65
Accuracy of the approach determining 𝒄 .............................................................................................65
Accuracy of Strengths ..........................................................................................................................66
Accuracy of Demands and Moment Magnification Factor ..................................................................67
Demo #1 – Variations on Evaluation of Columns in Non-Sway Frame ...................................................70
Example Pair #2 – Low Slenderness / Non-Sway / Low Cm / Low Eccentricity ................................71
Example Pair #3 – Low Slenderness / Non-Sway / High Cm / High Eccentricity ...............................72
Example Pair #4 – Low Slenderness / Non-Sway / High Cm / Low Eccentricity ...............................73
Example Pair #9 – High Slenderness / Non-Sway / Low Cm / High Eccentricity ...............................74
Example Pair #10 – High Slenderness / Non-Sway / Low Cm / Low Eccentricity .............................76
Example Pair #11 – High Slenderness / Non-Sway / High Cm / High Eccentricity ............................77
Example Pair #12 – High Slenderness / Non-Sway / High Cm / Low Eccentricity .............................78
Demo #1 – Variation on Evaluation of Column in Sway Frame ..............................................................79
Example Pair #6 – Low Slenderness / Sway / Low Eccentricity .........................................................80
Example Pair #7 – High Slenderness / Sway / High Eccentricity ........................................................81
Example Pair #8 – High Slenderness / Sway / Low Eccentricity .........................................................82
Demo #2 – Non Satisfaction of ACI Design Provisions ...........................................................................83
Example Pair #1 – ACI 318 7.10.4.3: Confinement Spiral Spacing ....................................................83
Example Pair #2 – ACI 318 10.9.3: Spiral Reinforcement Ratio ........................................................84
Example Pair #3 – ACI 318 10.9.1: Longitudinal Rebars Ratio ..........................................................86
Example Pair #4 – ACI 318 10.9.2: Longitudinal Rebars Count .........................................................87
Example Pair #5 – ACI 318 10.11.5: Applicability of Moment Magnification Method ......................88
Demo #3 – Accuracy of Student’s Inputs .................................................................................................90
Designs Admissible in ACI Provisions ................................................................................................90
Designs Inadmissible in ACI Provisions ..............................................................................................92
Chapter 5 - Summary. Further Study .............................................................................................................93

ix
Summary ...................................................................................................................................................93
Future Work ..............................................................................................................................................95

x
List of Tables
Table 1 – Contributions in ACI 318 Loading Combinations .......................................................................... 5
Table 2 – Moment magnification factor from elastic analysis and ACI 318 for example 1 ..........................12
Table 3 – Moment magnification factor from elastic analysis and ACI 318 for example 2 ..........................15
Table 4 – Notations used in Figure 13 ...........................................................................................................19
Table 5 – Notations used in steel linear stress-strain diagram .......................................................................22
Table 6 – Checks on strength requirements in non-sway frame ....................................................................25
Table 7 – Checks on strength requirements in sway frame ...........................................................................27
Table 8 – Notations used in Figure 17 ...........................................................................................................28
Table 9 – Student’s Inputs in tab Inputs ........................................................................................................36
Table 10 – Student’s inputs in tab Feedback .................................................................................................37
Table 11 – Examples for Demo #1 ................................................................................................................43
Table 12 – Examples for Demo #2 ................................................................................................................46
Table 13 – Examples for Demo #3 ................................................................................................................47
Table 14 – Comprehensiveness of examples for validation of CU Slender Column .....................................47
Table 15 – Column geometry for detailed examples in non-sway frame ......................................................48
Table 16 – Student’s loading inputs for detailed examples in non-sway frame ............................................49
Table 17 – Factored loads for detailed examples in non-sway frame ............................................................49
Table 18 – Column slenderness for detailed examples in non-sway frame ...................................................50
Table 19 – 𝑪𝒎 for detailed examples in non-sway frame .............................................................................50
Table 20 – 𝜹𝒏𝒔 for detailed examples in non-sway frame ............................................................................52
Table 21 – 𝑴𝒄 for detailed examples in non-sway frame .............................................................................52
Table 22 – Strengths for detailed examples in non-sway frame ....................................................................53
Table 23 – Findings for detailed examples in non-sway frame .....................................................................53
Table 24 – Example Pair #1 – Low Slenderness / Non-Sway / Low Cm / Low Eccentricity / Single Curvature
.......................................................................................................................................................................54
Table 25 – Column geometry for detailed examples in sway frame .............................................................55
Table 26 – Slenderness for detailed examples in sway frame .......................................................................56
Table 27 – Student’s loading inputs for detailed examples in sway frame ....................................................56
Table 28 – Factored loads for detailed examples in sway frame ...................................................................57
Table 29 – 𝜹𝒔 for detailed examples in sway frame ......................................................................................59
Table 30 – 𝑴𝒄 for detailed examples in sway frame .....................................................................................59

xi
Table 31 – Strengths for detailed examples for sway frame ..........................................................................59
Table 32 – Findings for detailed examples in sway frame ............................................................................59
Table 33 – Example Pair #5 – Low Slenderness / Sway / High Eccentricity / Single Curvature ..................60
Table 34 – Design features of failing column................................................................................................63
Table 35 – Examples varying 𝑪𝒎 and eccentricity for Examples Pairs #1 to #4 ........................................70
Table 36 – Example Pair #2 – Low Slenderness / Non-Sway / Low Cm / Low Eccentricity / Single Curvature
.......................................................................................................................................................................71
Table 37 – Example Pair #3 – Low Slenderness / Non-Sway / High Cm / High Eccentricity / Single Curvature
.......................................................................................................................................................................72
Table 38 – Example Pair #4 – Low Slenderness / Non-Sway / High Cm / Low Eccentricity / Single Curvature
.......................................................................................................................................................................73
Table 39 – Examples varying 𝑪𝒎 and eccentricity for Example Pairs #9 to #12 .........................................74
Table 40 – Example Pair #9 – High Slenderness / Non-Sway / Low Cm / High Eccentricity / Double
Curvature .......................................................................................................................................................75
Table 41 – Example Pair #10 – High Slenderness / Non-Sway / Low Cm / Low Eccentricity / Double
Curvature .......................................................................................................................................................76
Table 42 – Example Pair #11 – High Slenderness / Non-Sway / High Cm / High Eccentricity / Double
Curvature .......................................................................................................................................................77
Table 43 – Example Pair #12 – High Slenderness / Non-Sway / High Cm / Low Eccentricity / Double
Curvature .......................................................................................................................................................78
Table 44 – Examples varying slenderness and eccentricity for Example Pairs #5 to #8 ...............................79
Table 45 – Example Pair #6 – Low Slenderness / Sway / Low Eccentricity / Single Curvature ...................80
Table 46 – Example Pair #7 – High Slenderness / Sway / High Eccentricity / Double Curvature ................81
Table 47 – Example Pair #8 – High Slenderness / Sway / Low Eccentricity / Double Curvature ................82
Table 48 – Example Pair #1 – Confinement Spiral Spacing .........................................................................83
Table 49 – Example Pair #2 – ACI 318 10.9.3: Spiral Reinforcement Ratio ................................................85
Table 50 – Example Pair #3 – Longitudinal Rebars Ratio ............................................................................86
Table 51 – Example Pair #4 – ACI 318 10.9.2: Longitudinal Rebars Count ................................................87
Table 52 – Example Pair #5 – Application of Moment Magnification .........................................................89
Table 53 – Examples #37 and #38 with design admissible in ACI Provisions ..............................................90
Table 54 – Examples #39 and #40 with designs inadmissible in ACI Provisions .........................................92

xii
List of Figures
Figure 1 – Non-sway frame structure ............................................................................................................. 6
Figure 2 – Frame sign convention .................................................................................................................. 6
Figure 3 – Free Body Diagram ....................................................................................................................... 7
Figure 4 – Values of k for different column configuration [Saatcioglu, 2012] ............................................... 9
Figure 5 – Single-curved column in non-sway frame ....................................................................................11
Figure 6 – Magnification from Elastic analysis .............................................................................................11
Figure 7 – Moment Magnification factor for Elastic Analysis and ACI 318 .................................................13
Figure 8 – Double-curved column in non-sway frame ..................................................................................13
Figure 9 – Magnification from Elastic analysis .............................................................................................14
Figure 10 – Moment Magnification factor for Elastic Analysis and ACI 318 ...............................................15
Figure 11 – Sway frame structure in dotted line ............................................................................................16
Figure 12 – Strain diagram of column cross section .....................................................................................18
Figure 13 – Concrete Stress Diagram ............................................................................................................19
Figure 14 – Compression zone smaller than half the column cross-sectional area........................................20
Figure 15 – Compression zone larger than half the column cross-sectional area ..........................................21
Figure 16 – Steel linear stress-strain diagram ................................................................................................22
Figure 17 – Flowchart for ACI 318 moment magnification method .............................................................29
Figure 18 – Flowchart for the organization of CU Slender Column program ...............................................35
Figure 19 – Graphical user interface of the tab Inputs...................................................................................37
Figure 20 – Graphical user interface of the Tab Feedback ............................................................................38
Figure 21 – Variation of eccentricity 𝒆𝒏 in function of the depth of concrete compression zone 𝒄 .............41
Figure 22 – Scattering of columns geometry for Demo #1 ...........................................................................44
Figure 23 – Dimensions of columns for Demo #1 .........................................................................................44
Figure 24 – Cross sections of columns for Demo #1 .....................................................................................45
Figure 25 – Column cross section for detailed examples in non-sway frame ...............................................48
Figure 26 – Column cross section for detailed examples in sway frame .......................................................55
Figure 27 – Student’s inputs for passing column ..........................................................................................61
Figure 28 – CU Slender Column feedbacks for student in case of passing column ......................................62
Figure 29 – Student’s inputs for failing column ............................................................................................63
Figure 30 – CU Slender Column feedbacks for student in case of failing column ........................................64
Figure 31 – CU Slender Column Approach vs Benchmark for values of c. ..................................................65

xiii
Figure 32 – CU Slender Column Axial Strength vs Benchmark Axial Strength ...........................................66
Figure 33 – CU Slender Colum Moment Strength vs Benchmark Moment Strength....................................67
Figure 34 – CU Slender Column Axial Demand vs Benchmark Axial Demand ...........................................68
Figure 35 – CU Slender Column Magnified Moment vs Benchmark Magnified Moment ...........................68
Figure 36 – CU Slender Column Moment Magnification Factor vs Benchmark Moment Magnification Factor
.......................................................................................................................................................................69
Figure 37 – Ex 25: Detection of failed provision ACI 7.10.4.3 .....................................................................84
Figure 38 – Ex 30: Detection of failed provision ACI 7.10.4.3 .....................................................................84
Figure 39 – Spiral reinforcement in circular column .....................................................................................84
Figure 40 – Ex 26: Detection of failed provision ACI 10.9.3 ........................................................................86
Figure 41 – Ex 31: Detection of failed provision ACI 10.9.3 ........................................................................86
Figure 42 – Ex 27: Detection of failed provision ACI 10.9.1 ........................................................................87
Figure 43 – Ex 32: Detection of failed provision ACI 10.9.1 ........................................................................87
Figure 44 – Ex 28: Detection of failed provision ACI 10.9.2 ........................................................................88
Figure 45 – Ex 33: Detection of failed provision ACI 10.9.2 ........................................................................88
Figure 46 – Ex 29: Detection of failed provision ACI 10.11.5 ......................................................................89
Figure 47 – Ex 34: Detection of failed provision ACI 10.13.2 ......................................................................89
Figure 48 – Ex 35: detection of inaccuracy of student’s numerical values of loads and strengths ................91
Figure 49 – Ex 36: detection of inaccuracy of student’s numerical values of loads and strengths ................91
Figure 50 – Ex 37: detection of inaccuracy of student’s numerical values of loads and strengths ................92
Figure 51 – Ex 38: detection of inaccuracy of student’s numerical values of loads and strengths ................92

Boudaoui 1
Chapter 1 - Introduction
Compression members are common components in reinforced concrete structures such as
buildings and bridges. The structural engineering design of reinforced concrete columns
must furnish members with adequate strength under simultaneous effects of axial force and
end moments. In addition, for slender columns, the design must deal with stability issue by
accounting for the slenderness effects.
Thus, engineering courses in design of reinforced concrete structures must include design
of compression members and should engage students in design situations that include
combined axial force and end moments as well as the effects of member slenderness.
Education in design should allow students to function as designers, that is, to select the
dimensions of the concrete member and the details of the steel reinforcement.
Efficiency in engineering courses requires to evaluate in detail the designs prepared by
students and to check the designs for adequate strengths and for compliance with all
provisions of design code.
In classes with large enrollments, checking and evaluation must be automated if each
design is to be checked in detail. Evaluation is more than grading. Options for structural
systems are considered as preliminary designs evolve with revision into final designs. In
coursework, there is an additional level of iteration as students encounter, recognize and
correct errors in their works as well as revise and refine their designs.
Evaluation of students’ works must support and advance the process of design iterations.
Evaluation must notify students of errors, provide some guidance on the nature of errors
and the likely remedies. The educational goal is to guide and sometimes prod the student
to a study of design requirements and discovers of appropriate design solutions.
For this purpose, it is developed educational software: CU Slender Column. CU Slender
Column checks, evaluates and guides students in the design of a single slender reinforced
concrete column.

Boudaoui 2
CU Slender Column operates in two levels. First, given the student’s column design and
the set of loadings, CU Slender Column executes a benchmark study to compute the axial
and the bending strengths of the column as well as the factored demands. Second, CU
Slender Column provides feedbacks on whether the column design satisfies strength
requirements, design code provisions as well as if the student’s numerical values of
strengths and loads are accurate compared to values computed by the benchmark study.
The Design Code
CU Slender Column implements the provisions of Chapter 10 for flexure and axial loads
of the latest version of the ACI building code: ACI 318 for structural concrete [Building,
2011].
The Design Method
Slenderness effects refer to the phenomenon when the action of the axial force combined
with the column deflection leads to additional moments along the column. ACI 318
proposes two methods to account for slenderness effects in the design of slender reinforced
concrete columns. First, the moment magnification method which accounts for slenderness
effects by magnifying the larger column end moments. Second, the P-Δ or 2nd order
analysis method which discretizes the column to plot the bending moment along the
member and catches the maximum moment [Building, 2011]. CU Slender Column uses the
traditional moment magnification method which is reliable, less difficult to implement and
appropriate for students in first class of reinforced concrete design.
Limitation on Structural Members
The study considers single slender reinforced concrete column with circular cross section
and spiral ties reinforcement. Other structural members, cross-sectional geometries and
type of ties are beyond the scope of the study.

Boudaoui 3
Organization of the Study
The study is organized in Chapters.
Chapter 1 is an introduction to the study. It highlights the interest of developing educational
software for the design of slender reinforced concrete columns. Also, it presents the
building code the study uses as well as the design method to account for slenderness effects.
Chapter 2 focuses on the theory and the application of the moment magnification method.
The theory is explained through an elastic analysis of slender columns subjected to axial
forces and end moments in non-sway frames. The purpose is to show that ACI 318 formula
for the moment magnification approaches the elastic solution. Besides, Chapter 2 provides
a detailed method for computing axial and bending strengths for a circular column. Chapter
2 ends with two detailed procedures showing how to apply the moment magnification
method in the non-sway and sway cases.
Chapter 3 inventories some professional software available in the market as well as
educational tools developed for the design of structural members. Also, Chapter 3 presents
the graphical user interface and the organization of the program running CU Slender
Column.
Chapter 4 starts by presenting the three demonstrations that aim at validating CU Slender
Column. Then, it is detailed two examples of the application of ACI 318 moment
magnification method for non-sway and sway frames with references to program routines
that perform the computations. Chapter 4 ends with the presentation of the 38 examples
developed for the validation of CU Slender Column.
Chapter 5 summarizes the study for educational software for the design of slender
reinforced concrete columns and opens to possible improvements.

Boudaoui 4
Chapter 2 - Theory and Application of ACI 318 Moment
Magnification Method
To begin, the Chapter presents the elastic solution for secondary moments in compression
members and the ACI 318 method for moment magnification for slender compression
members within a non-sway frame. Then, results are analyzed to show the consistency
between both methods.
Besides, the Chapter presents a detailed method for the computations of both axial and
bending strengths for reinforced concrete column with circular cross section.
Finally, the Chapter presents step by step the application of the ACI 318 moment
magnification method for both non-sway and sway frames.
It is noted that throughout the study, the same ACI 318 label formats are used in reference
of ACI 318 sections and equations. For example, ACI 318 sections are referred using the
format 10.13.2 and ACI 318 equations are referred using the format (10-7).

Boudaoui 5
ACI 318 Loading Combinations
ACI 318 has developed a set of seven loading combinations (Eq. 1 to Eq. 7) to assess the
loading demand for the design of concrete structures. The loading demand accounts for all
loading contributions and has to affect to each contribution a factor reflecting the accuracy
the contribution is computed and the variation of the contribution during the lifetime of the
structure. Also, different combinations are made to reflect the probability of simultaneous
occurrence of contributions [Building, 2011]. The load computed from a loading
combination is the factored load.
ACI (9-1) U = 1.4(D + F) Eq. 1 ACI (9-2) U = 1.2(D + F + T) + 1.6(L + H) + 0.5(Lr or S or R) Eq. 2 ACI (9-3) U = 1.2D + 1.6(Lr or S or R) + (1.0L or 0.8W) Eq. 3 ACI (9-4) U = 1.2D + 1.6W + 1.0L + 0.5(Lr or S or R) Eq. 4 ACI (9-5) U = 1.2D + 1.0E + 1.0L + 0.2S Eq. 5 ACI (9-6) U = 0.9D + 1.6W + 1.6H Eq. 6 ACI (9-7) U = 0.9D + 1.0E + 1.6H Eq. 7
Contributions used in the ACI 318 loading combinations are defined in Table 1.
Table 1 – Contributions in ACI 318 Loading Combinations
Contribution Signification
U Factored load
D Dead load
E Load effects of earthquake
F Loads due to weight and pressure of fluids with well-defined densities
H Loads due to weight and pressure or soil, water in soil, or other materials
L Live loads
Lr Roof live loads
R Rain load
S Snow load
T Cumulative effect of temperature, creep, shrinkage, differential settlement
W Wind load

Boudaoui 6
Elastic Theory of the Moment Magnification Method for Non-Sway Frame
This section aims at presenting the elastic theory behind the moment magnification method.
The Figure 1 shows on the left a non-sway frame structure and on the right a detail of the
studied column. The column is modeled as a 1-Dimensional (1D) member and has 3
external factored loads at each end. The end i has a factored bending moment 𝑀𝑖, a factored
axial force 𝑃𝑢 and a factored shear force V. The end j has a factored bending moment 𝑀𝑗,
a factored axial force 𝑃𝑢 and a factored shear force V.
Figure 1 – Non-sway frame structure
Sign Convention
The study uses the frame convention. It defines positive axial forces, positive shear forces
and positive moments as oriented in the Figure 2. Clockwise acting end moments are
counted positive. By convention the larger of the two factored end moments, either 𝑀𝑖 or
𝑀𝑗, is noted 𝑀2 and the smaller of the two factored end moments is noted 𝑀1.
Figure 2 – Frame sign convention
Throughout the study, the column is laid out horizontally for a better reading.

Boudaoui 7
Expression of the Moment 𝑴(𝒙) along the column
The Figure 3 shows in dotted-line the deformed shape of the column under the external
loads. Also, a free body cut into the column is made at the abscissa 𝑥 to determine through
an equilibrium analysis the expression of the moment 𝑀(𝑥) at the abscissa 𝑥. The
deflection of the column at the abscissa 𝑥 is noted 𝑦(𝑥).
Figure 3 – Free Body Diagram
Governing Equation and Solution
The primary moment noted 𝑀𝑝(𝑥) corresponds to the moment along the column when
there is no axial force 𝑃𝑢. The secondary moment noted 𝑃𝑢 ∗ 𝑦 is the moment created by
the coupling of the column deflection 𝑦(𝑥) and 𝑃𝑢.
A derivation of the linear differential equation from the equilibrium analysis of the Figure
3 is provided by [Salmon and Johnson, 1990] in case of a column with unequal end
moments without transverse loadings.
𝑀′′(𝑥) + 𝜔2𝑀(𝑥) = 𝑀′′𝑝(𝑥) Eq. 8
where
𝜔 = √𝑃𝑢
𝐸𝐼 Eq. 9
𝐸𝐼 is the reduced stiffness. 𝐸 is the elasic modulus and 𝐼 is the second moment of area.
𝑀𝑝(𝑥) refers to the primary moment varying along the column as:
𝑀𝑝(𝑥) = 𝑀𝑖 +
−𝑀𝑗 − 𝑀𝑖
𝐿𝑥
Eq. 10

Boudaoui 8
The resolution of the linear differential equation gives a solution valid for any 𝑥. The
maximum moment in the column which accounts for the primary moment and the second
moment is determined as [Salmon and Johnson, 1990]:
𝑀𝑚𝑎𝑥 = √𝑀𝑖2 + (
−𝑀𝑗 − 𝑀𝑖𝑐𝑜𝑠(𝜔𝐿)
𝑠𝑖𝑛(𝜔𝐿))
2
Eq. 11
It is noted that the length of the column [0, 𝐿] constitutes the domain of interest. Any
maximum moment 𝑀𝑚𝑎𝑥 greater than the larger end moments for an abscissa outside the
domain does not refer to the moment magnification. In fact, the curve of the moment along
the column continues away from the domain and reaches larger values.
The maximum moment is reached at the abscissa 𝑥0 when:
𝑡𝑎𝑛 (𝜔𝑥0) =
−𝑀𝑗 − 𝑀𝑖𝑐𝑜𝑠 (𝜔𝐿)
𝑀𝑖𝑠𝑖𝑛 (𝜔𝐿) Eq. 12
𝑥0 =1
𝜔𝑎𝑡𝑎𝑛 (
−𝑀𝑗 − 𝑀𝑖𝑐𝑜𝑠 (𝜔𝐿)
𝑀𝑖𝑠𝑖𝑛 (𝜔𝐿)) Eq. 13
If 𝑥0 is outside the domain of interest [0, 𝐿], then the maximum moment in the column is
the larger factored end moments, 𝑀2.
If 𝑥0 is inside the domain of interest [0, 𝐿], then the maximum moment in the column is
the computed 𝑀𝑚𝑎𝑥 using (Eq. 11).
In the case of a column without transverse loading, the maximum moment along the
column before counting for the secondary moment is 𝑀2.
The moment magnification occurs by increasing the axial force 𝑃𝑢 , that is, by compressing
axially the column harder, the deflection of the column increases, then the second moment
𝑃𝑢 ∗ 𝑦 increases until the maximum moment 𝑀𝑚𝑎𝑥 becomes bigger than 𝑀2.
The elastic magnification factor, 𝛿𝑛𝑠,𝑒𝑙𝑎𝑠𝑡 , is defined as:

Boudaoui 9
𝛿𝑛𝑠,𝑒𝑙𝑎𝑠𝑡 = |
𝑀𝑚𝑎𝑥
𝑀2| Eq. 14
ACI 318 Moment Magnification Method for Non-Sway Frame
ACI 318 provides an approximate method to estimate the magnified moment.
The buckling load 𝑃𝑐 is by definition the axial load needed to buckle a column. It depends
only on the column characteristics: The length 𝐿, the effective length factor 𝑘 and 𝐸𝐼.
ACI (10-10) 𝑃𝑐 =
𝜋2𝐸𝐼
(𝑘𝐿)2
Eq. 15
The Figure 4 shows values of 𝑘 for different end conditions.
Figure 4 – Values of k for different column configuration [Saatcioglu, 2012]
ACI 318 constrains the axial load 𝑃𝑢 to not more than 75% of the buckling load 𝑃𝑐. This is
partially justified by the approximation of the buckling load formula which is derived using
a linear model. However, while buckling, the column tends to respond in a nonlinear
fashion due to large displacements and the nonlinear behavior of concrete.
For non-sway frames, ACI 318 introduces 𝐶𝑚, the factor relating actual moment diagram
to an equivalent uniform moment diagram, to account for the curvature of the column.
Indeed, in case of identical end moments magnitudes, a double-curved column is less
deflected than a single-curved column. Thus, 𝐶𝑚 is used to mitigate the effect of
magnification when a column is double-curved.

Boudaoui 10
For sway frames, conditions of single or double curvature do not affect the values of
magnification factor.
ACI 318 defines a magnification factor for non-sway frame, 𝛿𝑛𝑠, as:
ACI (10-9) 𝛿𝑛𝑠 =
𝐶𝑚
1 −𝑃𝑢
0.75𝑃𝑐
≥ 1.0
Eq. 16
𝐶𝑚 = 0.6 − 0.4
𝑀1
𝑀2≥ 0.4 Eq. 17
It is noted that ACI 318 uses a different expression for 𝐶𝑚 with a positive sign instead of a
negative sign because ACI 318 relies on the single beam convention where moments
sagging the beam are positive. The upper bound for 𝐶𝑚 is 1.0.
The magnified moment, 𝑀𝑐, for which the column is designed is computed using 𝛿𝑛𝑠 and
𝑀2.
ACI (10-8) 𝑀𝑐 = 𝛿𝑛𝑠 ∗ 𝑀2
Eq. 18
Comparison between elastic analysis and ACI 318 expressions for magnification factor
A set of two examples aim at showing the consistency between the magnification factor
derived from elastic analysis and the magnification factor defined by ACI 318.
Columns in both examples are identical. The first example studies a single-curved column
and the second example studies a double-curved column.
Example 1 – Non-Sway / Single Curvature
Consider a 20 ft-long pin supported circular reinforced concrete column in a non-sway
frame. The reduced stiffness of the column, 𝐸𝐼, is equal to 20 ∗ 106 kin−2. Consider the
column is subjected to positive clockwise 𝑀𝑖, negative counterclockwise 𝑀𝑗 and axial force
𝑃𝑢.

Boudaoui 11
Figure 5 – Single-curved column in non-sway frame
For a pin supported column, the effective length factor 𝑘 is 1.0.
The buckling load 𝑃𝑐 is:
ACI (10-10) 𝑃𝑐 =
𝜋2𝐸𝐼
(𝑘𝐿)2 =
𝜋220 ∗ 106
(1.0 ∗ 20 ∗ 12)2 Eq. 19
= 3427 𝑘
The end moments are:
𝑀𝑖 = 100 𝑘𝑓𝑡 = 𝑀1 Eq. 20
𝑀𝑗 = −100 𝑘𝑓𝑡 = 𝑀2 Eq. 21
The factor 𝐶𝑚 is:
𝐶𝑚 = 0.6 − 0.4
𝑀1
𝑀2 = 0.6 − 0.4
100
−100 Eq. 22
= 1.0
The Figure 6 shows the moment along the column while 𝑃𝑢 increases. The moment
magnification occurs as soon as 𝑃𝑢 is applied.
Figure 6 – Magnification from Elastic analysis
99
100
101
102
103
104
105
106
107
108
109
0 5 10 15 20
Mo
men
t (k
ft)
Position along the Column (ft)
Evolution of the Moment while Pu increases
Pu=0 k
Pu=100 k
Pu=200 k

Boudaoui 12
The Table 2 lists the magnification factor from the elastic analysis 𝛿𝑛𝑠,𝑒𝑙𝑎𝑠𝑡 and from the
ACI 318 method 𝛿𝑛𝑠 for increasing 𝑃𝑢.
Table 2 – Moment magnification factor from elastic analysis and ACI 318 for example 1
L ft 20
𝐸𝐼 kin−2 20 ∗ 106
𝐶𝑚 1.0
𝑃𝑐 k 3427
𝑀𝑖 kft 100
𝑀𝑗 kft -100
Elastic Analysis ACI 318
𝑃𝑢 𝜔 𝑀𝑚𝑎𝑥 𝛿𝑛𝑠,𝑒𝑙𝑎𝑠𝑡 𝛿𝑛𝑠
k in−1 kft
0.1 0.00007 100 1.00 1.00
100 0.00224 104 1.04 1.04
200 0.00316 108 1.08 1.08
400 0.00447 116 1.16 1.18
400 0.00447 116 1.16 1.18
800 0.00632 138 1.38 1.45
1600 0.00894 210 2.10 2.65
The Figure 7 shows the evolution of the magnification factor from the ACI 318 and the
elastic analysis.

Boudaoui 13
Figure 7 – Moment Magnification factor for Elastic Analysis and ACI 318
By increasing the magnitude of the axial force, the moment magnification factor curve
becomes convex and shows the magnification effect.
It is noted that the curves fit well for an axial load ranging from 0 to 1000 k and that the
ACI 318 curve is above the elastic curve to provide a more conservative design.
Beyond an axial force magnitude of 800 k and values of magnification factor larger than
1.40, the two curves diverge and highlights a limitation in the ACI 318 method. In this
range, the linear model is no longer valid due to large displacements and the non-linear
behavior of the concrete.
Example 2 – Non-Sway / Double Curvature
Consider a 20 ft-long pin supported circular reinforced concrete column in a non-sway
frame. The reduced stiffness of the column, 𝐸𝐼, is equal to 20 ∗ 106 kin−2. Consider the
column is subjected to positive clockwise 𝑀𝑖, positive clockwise 𝑀𝑗 and axial force 𝑃𝑢.
Figure 8 – Double-curved column in non-sway frame
1.00
1.20
1.40
1.60
1.80
2.00
2.20
2.40
2.60
2.80
0 500 1000 1500 2000
Mag
nif
icat
ion
Fac
tor
Pu (k)
Evolution of Magnification Factor while Pu increases
ACI 318
Elastic analysis

Boudaoui 14
The buckling load 𝑃𝑐 remains at 3427 k.
The end moments are:
𝑀i = 50 𝑘𝑓𝑡 = 𝑀1 Eq. 23
𝑀j = 100 𝑘𝑓𝑡 = 𝑀2 Eq. 24
The factor 𝐶𝑚 is:
𝐶𝑚 = 0.6 − 0.4
𝑀1
𝑀2 = 0.6 − 0.4
50
100
Eq. 25
= 0.4
The Figure 9 shows the moment along the column while 𝑃𝑢 increases. The moment
magnification occurs when 𝑃𝑢 is larger than 1600 k.
Figure 9 – Magnification from Elastic analysis
The Table 3 lists the magnification factor from the elastic analysis 𝛿𝑛𝑠,𝑒𝑙𝑎𝑠𝑡 and from the
ACI 318 𝛿𝑛𝑠 for increasing 𝑃𝑢.
-120
-100
-80
-60
-40
-20
0
20
40
60
0 2 4 6 8 10 12 14 16 18 20
Mo
men
t (k
ft)
Position along the column (ft)
Evolution of the Moment while Pu increases
Pu=0 k
Pu=1600 k
Pu=2000 k

Boudaoui 15
Table 3 – Moment magnification factor from elastic analysis and ACI 318 for example 2
L ft 20
𝐸𝐼 kin−2 20 ∗ 106
𝐶𝑚 0.4
𝑃𝑐 k 3427
𝑀𝑖 kft 50
𝑀𝑗 kft 100
Elastic Analysis ACI 318
𝑃𝑢 𝜔 𝑀𝑚𝑎𝑥 𝛿𝑛𝑠,𝑒𝑙𝑎𝑠𝑡 𝛿𝑛𝑠
k in−1 kft
0.1 0.00007 100 1.00 1.00
100 0.00224 100 1.00 1.00
200 0.00316 100 1.00 1.00
400 0.00447 100 1.00 1.00
800 0.00632 100 1.00 1.00
1600 0.00894 100 1.00 1.06
2000 0.01000 106 1.06
The Figure 10 shows the evolution of the magnification factor from the ACI 318 and the
elastic analysis.
Figure 10 – Moment Magnification factor for Elastic Analysis and ACI 318
1.00
1.01
1.02
1.03
1.04
1.05
1.06
1.07
100 300 500 700 900 1100 1300 1500 1700 1900
Mag
nif
icat
ion
fac
tor
𝑃𝑢 (k)
Evolution of Magnification Factor while 𝑃𝑢 increases
ACI 318 Elastic analysis

Boudaoui 16
The double curvature of the column decreases the deflection 𝑦 and the secondary moment
𝑃𝑢 ∗ 𝑦. The Figure 10 shows that 𝑀2 remains the maximum moment in the column for the
axial force ranging from 0 to 1600 k. For this range, there is no magnification and the
magnification factor is equal to 1.0. When applying an axial force larger than 1600 k, the
magnification starts, the magnification factor takes values greater than 1.0 and the
maximum moment is located within the column.
Here is illustrated the role of 𝐶𝑚 as a factor mitigating the magnification factor because of
the double curvature of the column.
As in the non-sway case, the ACI 318 curve is beyond the elastic curve in order to provide
a more conservative design.
ACI 318 Moment Magnification Method for Sway Frame
In the application of ACI 318 moment magnification method, ACI 318 notations are used:
𝑀1𝑛𝑠 is the smaller factored end moments in non-sway case, 𝑀2𝑛𝑠 the larger factored end
moments in non-sway case, 𝑀1𝑠 is the smaller factored end moments in sway case and 𝑀2𝑠
is the larger factored end moments in sway case.
Figure 11 – Sway frame structure in dotted line

Boudaoui 17
ACI 318 computes the magnified sway moment, 𝛿𝑠𝑀𝑠, as:
ACI (10-18)
𝛿𝑠𝑀𝑠 =𝑀𝑠
1 −𝑃𝑢
0.75𝑃𝑐
≥ 𝑀𝑠
Eq. 26
The magnification factor, 𝛿𝑠, in case of sway frame is defined as:
𝛿𝑠 =1.0
1 −𝑃𝑢
0.75𝑃𝑐
≥ 1.0
Eq. 27
For sway frame, the upper bound for 𝛿𝑠 is 2.5 [Building, 2011]. For values larger than 2.5,
the frame might be subjected to foundation rotations and stiffness variations along the
column. It is noted that the factor 𝐶𝑚 is equal to 1.0 for a sway frame, because as stated
earlier, the curvature of the column does not influence the magnification factor.
ACI 318 method estimates total magnified moment, 𝑀𝑐, as the sum of two contributions:
Non-sway moment 𝑀2𝑛𝑠 and magnified sway moment 𝛿𝑠𝑀2𝑠.
𝑀𝑐 = 𝑀2𝑛𝑠 + 𝛿𝑠𝑀2𝑠 Eq. 28

Boudaoui 18
Strength Computations
This section describes the method to compute the axial strength 𝜙𝑃𝑛 and the bending
strength 𝜙𝑀𝑛 for columns with circular cross section and subjected to combined axial force
and end moments. The method applies for both sway and non-sway frames.
Figure 12 – Strain diagram of column cross section
To begin, the depth of the concrete compression zone, 𝑐, is determined by equalizing the
strength eccentricity, 𝑒𝑛 and the demand eccentricity, 𝑒𝑢.
𝑒𝑢 =
𝑀𝑐
𝑃𝑢
Eq. 29
𝑒𝑛 =
𝜙𝑀𝑛
𝜙𝑃𝑛
Eq. 30
𝑒𝑛 = 𝑒𝑢 Eq. 31
The strain of the ith longitudinal rebar, 휀𝑖, is computed using 𝑐 and the distance between the
ith longitudinal rebar and the most compressed concrete fiber, 𝑑𝑖.
휀𝑖 = 0.003
𝑑𝑖 − 𝑐
𝑐
Eq. 32
The stress in the ith longitudinal rebar, 𝑓𝑖, is computed using 휀𝑖 and the steel Young’s
modulus 𝐸𝑠 .
𝑓𝑖 = 휀𝑖 ∗ 𝐸𝑠 Eq. 33
By convention, the rebar is in compression when 𝑓𝑖 is negative and the rebar is in tension
when 𝑓𝑖 is positive.

Boudaoui 19
A parabolic stress distribution is used to describe the actual stresses in concrete (Figure
13). However, calculating internal forces with the parabolic stress distribution involves
integration over a parabolic curve. To make the computations easier, an equivalent
rectangular stress distribution is used (Figure 13).
Table 4 – Notations used in Figure 13
a (in) equivalent depth of the concrete compression zone in rectangular distribution
𝑐 (in) depth of the concrete compression zone in parabolic distribution
𝑓’𝑐 (ksi) concrete compression strength NA Neutral Axis
Figure 13 – Concrete Stress Diagram
ACI 318 computes a based on 𝑐 as:
a = 𝛽1𝑐 Eq. 34
The parameter 𝛽1 is equal to 0.85 for concrete with 𝑓’𝑐 less than 4 ksi and 0.05 less for each
1 ksi of 𝑓’𝑐 in excess of 4 ksi [Building, 2011].
For a circular column, the compression zone is a segment of a circle. Two cases are studied:
The compression zone is either smaller or larger than half of the column cross-sectional
area.

Boudaoui 20
Compression zone smaller than half the column cross-sectional area
The Figure 14 shows the cross section of a circular reinforced concrete column with a
compression zone smaller than half the column cross-sectional area.
Figure 14 – Compression zone smaller than half the column cross-sectional area
For known column diameter h and depth of compression zone a, the central angle of the
compression zone, θ, is:
θ = 2 ∗ acos (1 −
2a
h) Eq. 35
The area of concrete compression zone, Ac, is:
Ac =
1
8∗ h2(θ − sin(θ))
Eq. 36
The distance from the center of the column to the line of action of the compression force,
y, is:
y =2 ∗ h ∗ sin3(
θ2)
3(θ − sin(θ))
Eq. 37
𝑃𝑛 is computed using the equilibrium of forces at the section, that is, by summing the
compressive force in concrete section and the force in steel rebars where Ai is the area of
a steel rebar. In (Eq. 38), the negative sign comes from the convention counting positive
the tension of a steel rebar and positive the compression in concrete. 𝑀𝑛 is computed by
summing the product of compressive force in concrete and distance y and the product of
force in steel rebars and distance from rebars to column center.
𝑃𝑛 = 0.85 𝑓’𝑐 Ac − ∑ Ai𝑓𝑖 Eq. 38
𝑀𝑛 = 0.85 𝑓’𝑐 Acy + ∑ Ai𝑓𝑖 (di −
h
2) Eq. 39

Boudaoui 21
Compression zone larger than half the column cross-sectional area
The Figure 15 shows the cross section of a circular reinforced concrete column with a
compression zone larger than half of the column cross-sectional area.
Figure 15 – Compression zone larger than half the column cross-sectional area
The central angle of the concrete zone not in compression, θt, is:
θt = 2 ∗ acos (
2a
h− 1) Eq. 40
The area of the concrete zone not in compression, At, is:
At =
1
8∗ h2(θt − sin(θt))
Eq. 41
The distance from the center of the column to the line of action of the tension force acting
in the concrete zone not in compression, yt, is:
yt =2 ∗ h ∗ sin3(
θt2
)
3(θt − sin(θt))
Eq. 42
The strength computations are similar to the previous case. 𝑃𝑛 is computed by summing
the compressive force in concrete section and the force in steel rebars. 𝑀𝑛 is computed by
summing the product of compressive force in concrete and distance y and the product of
force in steel rebars and distance from rebars to column center.
𝑃𝑛 = 0.85 f’c (
πh2
4− At) − ∑ Ai𝑓𝑖 Eq. 43
𝑀𝑛 = 0.85 𝑓’𝑐 Aty + ∑ Ai𝑓𝑖 (di −
h
2) Eq. 44

Boudaoui 22
The reduction factor 𝜙 lowers the column strength to make the design more conservative.
𝜙 = 0.70 + 0.20
(휀𝑡 − 0.002)
0.003 Eq. 45
0.70 ≤ 𝜙 ≤ 0.90
where 휀𝑡 is the strain in the furthest rebar from the most compressed concrete fiber.
By convention, 휀𝑡 is positive in tension and negative in compression.
The notations used in Figure 16 are defined in Table 5:
Table 5 – Notations used in steel linear stress-strain diagram
σ (ksi) Stress in steel rebar
ε Strain of steel rebar
Figure 16 – Steel linear stress-strain diagram
It is noted that the expression of 𝜙 is proportional to 휀𝑡. The linear stress-strain steel
diagram shows that variations in small values of strain influence the values of stresses
hence the strengths and variations in large values of strain do not influence stresses. Thus,
when 휀𝑡 is small, the design must be more conservative by lowering 𝜙 to account for
uncertainty on stresses in steel rebars.

Boudaoui 23
ACI 318 Moment Magnification Method and Checks of Strength
Requirements for Non-Sway and Sway Frames
Two procedures for both non-sway and sway frames show step by step the ACI 318
moment magnification method and the checks of the column design. It is noted that ACI
318 notations are used.
Non-sway frame
The following procedure shows in detail the sequence of computations for the application
of the ACI 318 moment magnification method in non-sway case and the checks of strength
requirements.
Step #1:
Compute the factored loads.
The student gets the values of end moments contributions using a structural analysis
software. Besides, the factored end moments are computed using ACI 318 loading
combinations. For columns subjected to little or no moments, a minimum moment (Eq. 47)
is computed using the minimum eccentricity (Eq. 46) because the axial loads are never
rigorously at the center of the member and little unpredictable moments may occur at both
ends [Building, 2011]. Accidental bending effects are taken proportional to the column
diameter.
𝑒𝑚𝑖𝑛 = 0.6 + 0.03h Eq. 46
ACI (10-14) 𝑀2,𝑚𝑖𝑛 = 𝑃𝑢 (0.6 + 0.03h) Eq. 47
Step #2:
Compute the slenderness of the column.
For non-sway frames, ACI 318 allows to ignore the slenderness effects, that is, not applying
the moment magnification method, if the slenderness of the column is less than:
𝑘𝐿
𝑟≤ 34 + 12
𝑀1
𝑀2
Eq. 48
Boudaoui 24
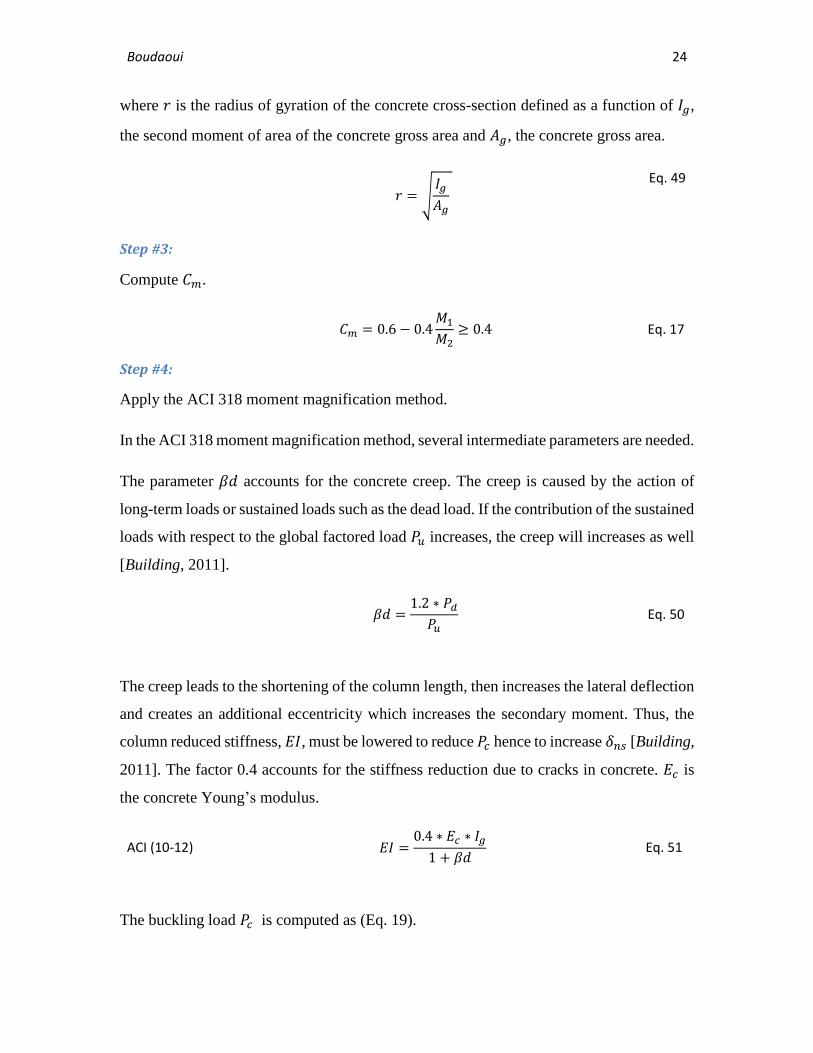
where 𝑟 is the radius of gyration of the concrete cross-section defined as a function of 𝐼𝑔,
the second moment of area of the concrete gross area and 𝐴𝑔, the concrete gross area.
𝑟 = √
𝐼𝑔
𝐴𝑔
Eq. 49
Step #3:
Compute 𝐶𝑚.
𝐶𝑚 = 0.6 − 0.4𝑀1
𝑀2≥ 0.4 Eq. 17
Step #4:
Apply the ACI 318 moment magnification method.
In the ACI 318 moment magnification method, several intermediate parameters are needed.
The parameter 𝛽𝑑 accounts for the concrete creep. The creep is caused by the action of
long-term loads or sustained loads such as the dead load. If the contribution of the sustained
loads with respect to the global factored load 𝑃𝑢 increases, the creep will increases as well
[Building, 2011].
𝛽𝑑 =1.2 ∗ 𝑃𝑑
𝑃𝑢 Eq. 50
The creep leads to the shortening of the column length, then increases the lateral deflection
and creates an additional eccentricity which increases the secondary moment. Thus, the
column reduced stiffness, 𝐸𝐼, must be lowered to reduce 𝑃𝑐 hence to increase 𝛿𝑛𝑠 [Building,
2011]. The factor 0.4 accounts for the stiffness reduction due to cracks in concrete. 𝐸𝑐 is
the concrete Young’s modulus.
ACI (10-12) 𝐸𝐼 =0.4 ∗ 𝐸𝑐 ∗ 𝐼𝑔
1 + 𝛽𝑑 Eq. 51
The buckling load 𝑃𝑐 is computed as (Eq. 19).
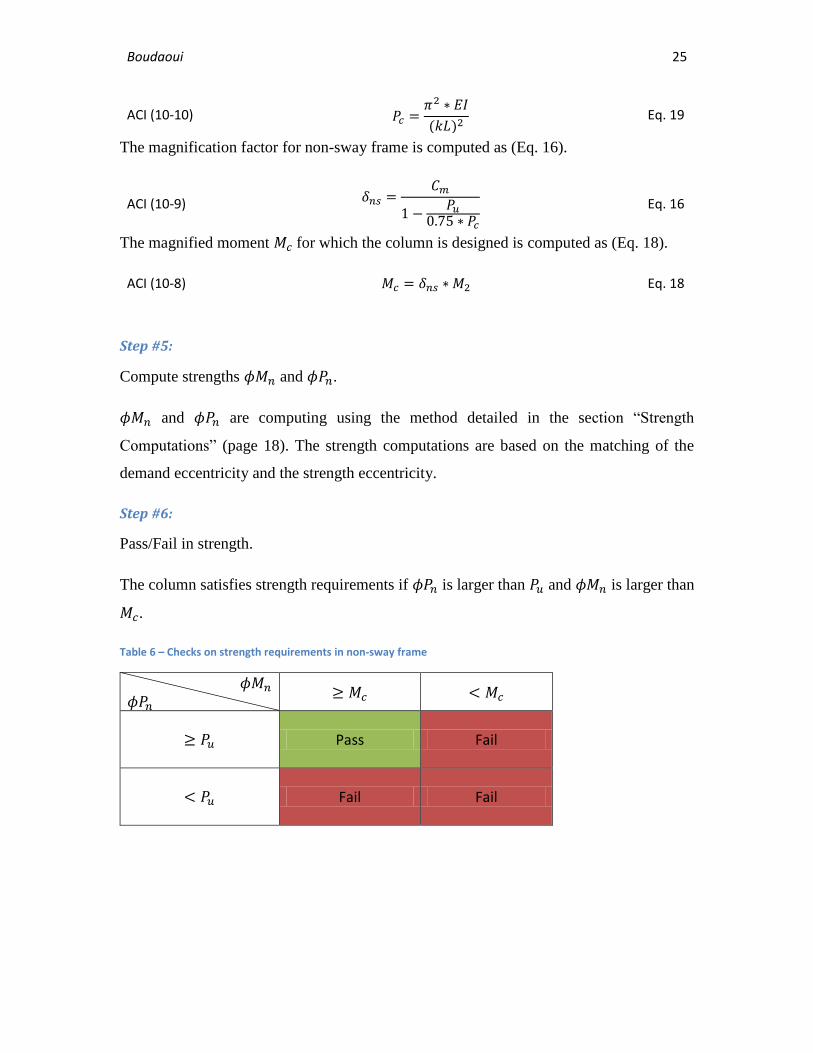
Boudaoui 25
ACI (10-10) 𝑃𝑐 =𝜋2 ∗ 𝐸𝐼
(𝑘𝐿)2 Eq. 19
The magnification factor for non-sway frame is computed as (Eq. 16).
ACI (10-9) 𝛿𝑛𝑠 =𝐶𝑚
1 −𝑃𝑢
0.75 ∗ 𝑃𝑐
Eq. 16
The magnified moment 𝑀𝑐 for which the column is designed is computed as (Eq. 18).
ACI (10-8) 𝑀𝑐 = 𝛿𝑛𝑠 ∗ 𝑀2 Eq. 18
Step #5:
Compute strengths 𝜙𝑀𝑛 and 𝜙𝑃𝑛.
𝜙𝑀𝑛 and 𝜙𝑃𝑛 are computing using the method detailed in the section “Strength
Computations” (page 18). The strength computations are based on the matching of the
demand eccentricity and the strength eccentricity.
Step #6:
Pass/Fail in strength.
The column satisfies strength requirements if 𝜙𝑃𝑛 is larger than 𝑃𝑢 and 𝜙𝑀𝑛 is larger than
𝑀𝑐.
Table 6 – Checks on strength requirements in non-sway frame
𝜙𝑀𝑛 𝜙𝑃𝑛
≥ 𝑀𝑐 < 𝑀𝑐
≥ 𝑃𝑢
Pass Fail
< 𝑃𝑢
Fail Fail

Boudaoui 26
Sway frame
The following procedure shows in detail the sequence of computations for the application
of the ACI 318 moment magnification method in sway case and the checks of strength
requirements.
Step #1:
Compute the slenderness of the column.
For sway frames, ACI 318 allows to ignore the slenderness effects, that is, not applying the
moment magnification method, if the slenderness of the column is less than:
𝑘𝐿
𝑟≤ 22
Eq. 52
Step #2:
Compute the factored loads.
The student gets the values of end moments contributions using a structural analysis
software. Besides, the factored end moments are computed using ACI 318 loading
combinations. In ACI 318 moment magnification method for sway frames, it is required to
provide the end moments contributions in sway case and the end moments contributions in
non-sway case to compute 𝑀2𝑠 and 𝑀2𝑛𝑠.
Step #3:
Determine if the frame can be considered as non-sway.
The stability index for a story 𝑄 represents the importance of moments induced by the sway
with respect to the moments induced by external lateral loads. If 𝑄 is smaller than 0.05, the
sway contribution is considered as small and the frame is considered as non-sway
[Building, 2011]. The story drift 𝛥0 is obtained through a structural analysis software.
ACI (10-6) 𝑄 =
𝑃𝑢 ∗ 𝛥0
𝑉𝑢 ∗ 𝐿
Eq. 53
Step #4:
Apply the ACI 318 moment magnification method.

Boudaoui 27
The computation of 𝑃𝑐, 𝛽𝑑 and 𝐸𝐼 are similar to the non-sway case. The magnification
factor for sway frame is computed as (Eq. 27).
𝛿𝑠 =1
1 −𝑃𝑢
0.75 ∗ 𝑃𝑐
≥ 1.0
Eq. 27
The magnified moment 𝑀𝑐 for which the column is designed is computed as (Eq. 28).
𝑀𝑐 = 𝑀2𝑛𝑠 + 𝛿𝑠𝑀2𝑠 Eq. 28
Step #5:
Compute strengths 𝜙𝑀𝑛 and 𝜙𝑃𝑛.
𝜙𝑀𝑛 and 𝜙𝑃𝑛 are computed using the method detailed in the section “Strength
Computations” (page 18). As the non-sway case, the strength computations are based on
equalizing the demand eccentricity and the strength eccentricity.
Step #6:
Pass/Fail in strength.
The column satisfies strength requirements if 𝜙𝑃𝑛 is larger than 𝑃𝑢 and 𝜙𝑀𝑛 is larger than
𝑀𝑐.
Table 7 – Checks on strength requirements in sway frame
𝜙𝑀𝑛 𝜙𝑃𝑛
≥ 𝑀𝑐 < 𝑀𝑐
≥ 𝑃𝑢
Pass Fail
< 𝑃𝑢
Fail Fail

Boudaoui 28
Flowchart of ACI 318 Moment Magnification Method
The Figure 17 presents a flowchart of the ACI 318 moment magnification method.
The sequence is as follows:
- The student chooses whether the column is in a sway or a non-sway frame.
- The student determines whether the column is slender using (Eq. 52) for a sway frame or
(Eq. 48) for a non-sway frame. A non-slender column is beyond the scope of the study.
- To account for slenderness effects, the student uses ACI 318 moment magnification
method. The use of the 2nd order analysis is beyond the scope of the study.
- For each type of frame (sway or non-sway), a sequence of computations leads to the
magnified moment for which the column is designed.
- The software checks whether the column satisfies strength requirements.
The notations used in Figure 17 are defined in Table 8
Table 8 – Notations used in Figure 17
𝐶𝑚 Factor relating actual moment diagram to an equivalent uniform moment diagram
𝛿𝑛𝑠 Moment magnification factor for non-sway case
𝛿𝑠 Moment magnification factor for sway case 𝑀𝑖𝑗 Moment due to load contribution j at end i
𝑀𝑐 Magnified moment for which the column is designed
𝑃𝑐 The buckling load
𝑃𝑢 Factored axial demand

Boudaoui 29
Figure 17 – Flowchart for ACI 318 moment magnification method

Boudaoui 30
Chapter 3 - Educational Software for the Design of Slender
Reinforced Concrete Columns
Available Professional Software
Civil engineers use structural engineering software to design a structure. Several structural
engineering software are available in the market. Many deal with slender reinforced
concrete columns with circular cross section. The slenderness effects are taking into
account through different methods: 2nd order analysis, moment magnification and the
nominal curvature method. The latter is used in the European Building Code Eurocode 2
(EC 2, 2002) in the section (Cl 5.8.8). The 2nd order analysis and the nominal curvature
method are not discussed in the study.
In the list of presented professional software, two use the nominal curvature method to
account for slenderness effects. Three software use the simplified moment magnification
method and four more advanced software deal with both 2nd order analysis and moment
magnification method.
SAP2000 [SAP2000, 2013] uses in the analysis of slender reinforced concrete column the
2nd order analysis and the moment magnification method. Irregular column cross sections
can be input as well as biaxial bending moments. The main building codes SAP2000 relies
on are ACI 318 and EC 2.
Dlubal [Concrete Column 8.xx, 2013] uses in the analysis of slender reinforced concrete
column the nominal curvature method. Rectangular and circular column cross sections can
be input as well as biaxial bending moments. The main building codes Dlubal relies on are
ACI 318 and the Chinese Building Code GB 50010.
ASDIP Concrete [Concrete Column Design, 2013] uses in the analysis of slender
reinforced concrete column the moment magnification method. Rectangular and circular
column cross sections can be input as well as uniaxial bending moments. The main building
code ASDIP relies on is ACI 318.
Digital Canal [Technical Specification, 2013] uses in the analysis of slender reinforced
concrete column the 2nd order analysis and the moment magnification method. Rectangular

Boudaoui 31
and circular column cross sections can be input as well as biaxial bending moments. The
main building code Digital Canal relies on is ACI 318.
StructurePoint Column [Reinforced Concrete Column, 2013] uses in the analysis of slender
reinforced concrete column the moment magnification method. Irregular column cross
sections can be input as well as biaxial bending moments. The main building code
StructurePoint Column relies on is ACI 318.
Graitec [Advance Concrete, 2013] uses in the analysis of slender reinforced concrete
column the 2nd order analysis. Irregular column cross sections can be input as well as
biaxial bending moments. The main building codes Graitec relies on are ACI 318 and EC
2.
Real3D Analysis [cColumn, 2013] uses in the analysis of slender reinforced concrete
column the 2nd order analysis and the moment magnification method. Rectangular and
circular column cross sections can be input as well as biaxial bending moments. The main
building code Real3D Analysis relies on is ACI 318.
Oasys [GSA Building, 2013] uses in the analysis of slender reinforced concrete column the
moment magnification method. Rectangular and circular column cross sections can be
input as well as uniaxial bending moments. The main building codes Oasys relies on are
ACI 318 and EC 2.
BuildSoft ConCrete [ConCrete (Plus), 2013] uses in the analysis of slender reinforced
concrete column the nominal curvature method. Irregular column cross sections can be
input as well as biaxial bending moments. The main building code BuildSoft ConCrete
relies on is EC 2.

Boudaoui 32
Educational modules
As stated in the introduction, education in design of reinforced concrete structures should
allow students to function as designers, that is, to select the dimensions of concrete
members and the details of steel reinforcement to satisfy strength requirements as well as
ACI provisions. Some software applications have been developed to support the education
of students in design of concrete structural members.
Jiang H. developed virtual laboratories for education in design of reinforced concrete
[Virtual, 2013]. Virtual laboratories are written in Java and provide students the complete
reinforcement given a set of loads, member geometry and material properties. By
performing the design for the student, the module does not educate the way of designing a
structural member through the application of ACI provisions and the satisfaction of
strength requirements.
Urgessa [2011] developed Matlab modules for the design in reinforced concrete. Using
student’s initial estimates of geometry and reinforcement ratio, the tool leads the student
to the optimum values of geometry and reinforcement that withstand the demand. The
module does not check for ACI provisions for a design entirely developed by the student.
Al-Ansari and Senouci [1999] developed worksheets in Mathcad supporting in class
students’ education in reinforced concrete design. The teacher designs the structure using
the application while the classroom learns the steps of the design process. The teacher can
alter the design and obtain immediate outcomes from the application. This tool is useful
during students’ learning but is not used to check students’ works for a term project.
Gambatese J. wrote a module using Microsoft PowerPoint for education in reinforced
concrete [Reinforced, 2013]. The module provides practical information about the
construction of structural members rather than details of the design process. For instance,
it is described the sequence of building a structural member from the placing of
reinforcement to the curing of the structural member.
Kastanos et al. [2011] developed a software in Matlab environment about the influence of
soil-structure interaction on the seismic design of reinforced concrete buildings. Based on

Boudaoui 33
student’s design of the building (general dimensions and shear walls geometry), the
software provides outcomes on the influence of considering soil-structure interaction over
fundamental period and base shear force. The software was not developed to provide
feedbacks to students on whether the design satisfies the Eurocode 8 provisions.
Canakci [2007] developed an educational module called Pile-D using Microsoft Excel. The
software supports design of pile foundation in clay. The module executes a benchmark
study based on the student’s design and displays outcomes on many geotechnical
parameters. Then, the student inputs its values and can check whether they are correct or
not. However, no feedbacks are given to students regarding the design and its compliance
with building codes.
Adeli and Kim [2000] developed a web-based interactive courseware written in Java and
supporting structural steel design. The process is as follows: The student fills the Input
panel with design characteristics on loadings, supports, steel type and section type. The
student can impose a nominal depth for the steel member. Then, the applet executes the
design and provides under the Results panel internal loads diagrams as well as the detail of
the cross section. The applet performs the design for the student based on the AISC code.
The applet was not developed to let the student determine the complete design of steel
beam and then to provide feedbacks on whether the design satisfies AISC provisions.
Wang and Adeli [2012] developed a web-based module in Java supporting educational in
steel design for beams, columns, beam-columns, connections and girders. The paper
presents a specific applet called Beam Tutor which focuses on design of steel beams. Given
a set of loadings, the beam supports and student’s choice of cross section shape, the module
selects the lightest shape that withstands the maximum moment and shear force. But, the
student can choose a nominal depth for the selected cross section shape. The user is
informed if no shape verifies AISC requirements. The module performs almost the entire
design for the student, and then does not provide feedbacks on whether the design satisfies
AISC provisions. The paper points that comments on errors are displayed if inputs such as
tensile strength and nominal depth are out of range.

Boudaoui 34
Many educational tools supporting education in structural design have been developed.
However, none of them was developed to provide feedbacks on the satisfaction of building
codes provisions for a design entirely performed by the student. Regarding the evaluation
of the student’s numerical values, one tool [Canakci, 2007] compares the student’s
outcomes with that of the software.
Operating System
CU Slender Column is developed in C++ using Microsoft’s Windows Forms framework
and targets personal computers running Windows operating systems. The integrated
development environment is Microsoft Visual Studio Express.
Organization CU Slender Column Program
CU Slender Column is developed using Microsoft Visual Studio Express which organizes
the program into interactive classes. A class is a substructure able to interact with other
classes by calling them. This organization is useful in the development of CU Slender
Column because a class is used to support a grid.

Boudaoui 35
Figure 18 – Flowchart for the organization of CU Slender Column program
The tab Inputs is composed of six grids: Cross Section, Material Properties, Longitudinal
Rebars, Ties, Boundaries and Section Forces.
Under the tab Inputs, the rebar class is used in the classes transverseRebar and
longitudinalRebar. The Aci class is used in the sectionForces class. Then, five classes:
Material, longitudinalRebar, transverseRebar, sectionForces and boundaries are used in
the component class which supports the AciChapter10 class.
The tab Feedback is composed of three grids: Checks on Inputs, Students Inputs and ACI
Checks.
Under the tab Feedback, the Students Inputs are used in the StudentsChecks class.
While clicking on the button Compute located under the tab Inputs, feedbacks are
generated and checks on accuracy of student’s inputs are performed.
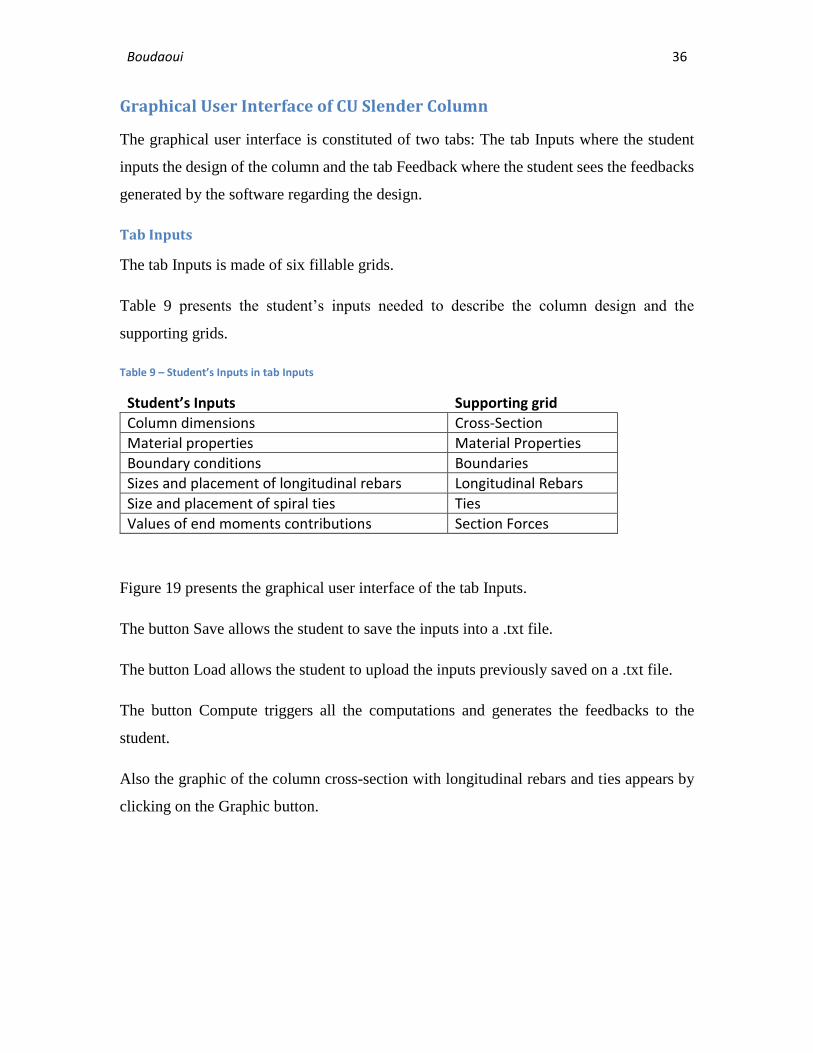
Boudaoui 36
Graphical User Interface of CU Slender Column
The graphical user interface is constituted of two tabs: The tab Inputs where the student
inputs the design of the column and the tab Feedback where the student sees the feedbacks
generated by the software regarding the design.
Tab Inputs
The tab Inputs is made of six fillable grids.
Table 9 presents the student’s inputs needed to describe the column design and the
supporting grids.
Table 9 – Student’s Inputs in tab Inputs
Student’s Inputs Supporting grid
Column dimensions Cross-Section
Material properties Material Properties
Boundary conditions Boundaries
Sizes and placement of longitudinal rebars Longitudinal Rebars
Size and placement of spiral ties Ties
Values of end moments contributions Section Forces
Figure 19 presents the graphical user interface of the tab Inputs.
The button Save allows the student to save the inputs into a .txt file.
The button Load allows the student to upload the inputs previously saved on a .txt file.
The button Compute triggers all the computations and generates the feedbacks to the
student.
Also the graphic of the column cross-section with longitudinal rebars and ties appears by
clicking on the Graphic button.
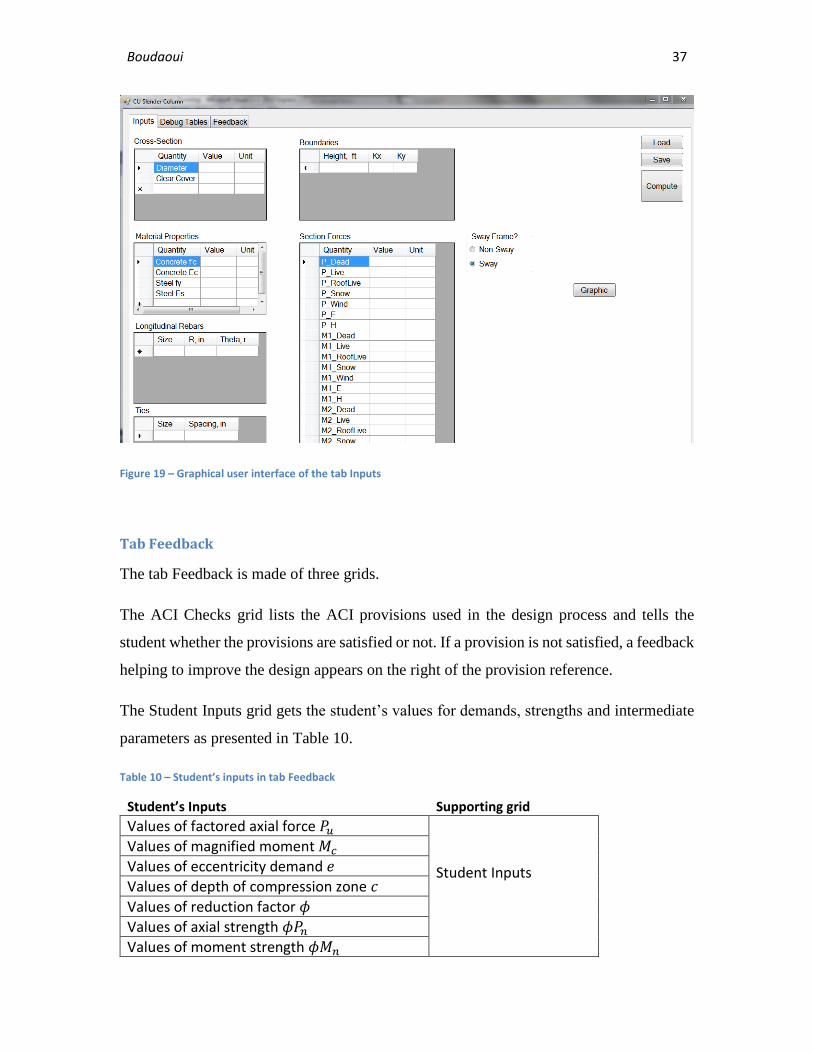
Boudaoui 37
Figure 19 – Graphical user interface of the tab Inputs
Tab Feedback
The tab Feedback is made of three grids.
The ACI Checks grid lists the ACI provisions used in the design process and tells the
student whether the provisions are satisfied or not. If a provision is not satisfied, a feedback
helping to improve the design appears on the right of the provision reference.
The Student Inputs grid gets the student’s values for demands, strengths and intermediate
parameters as presented in Table 10.
Table 10 – Student’s inputs in tab Feedback
Student’s Inputs Supporting grid
Values of factored axial force 𝑃𝑢
Student Inputs
Values of magnified moment 𝑀𝑐
Values of eccentricity demand 𝑒
Values of depth of compression zone 𝑐
Values of reduction factor 𝜙
Values of axial strength 𝜙𝑃𝑛
Values of moment strength 𝜙𝑀𝑛
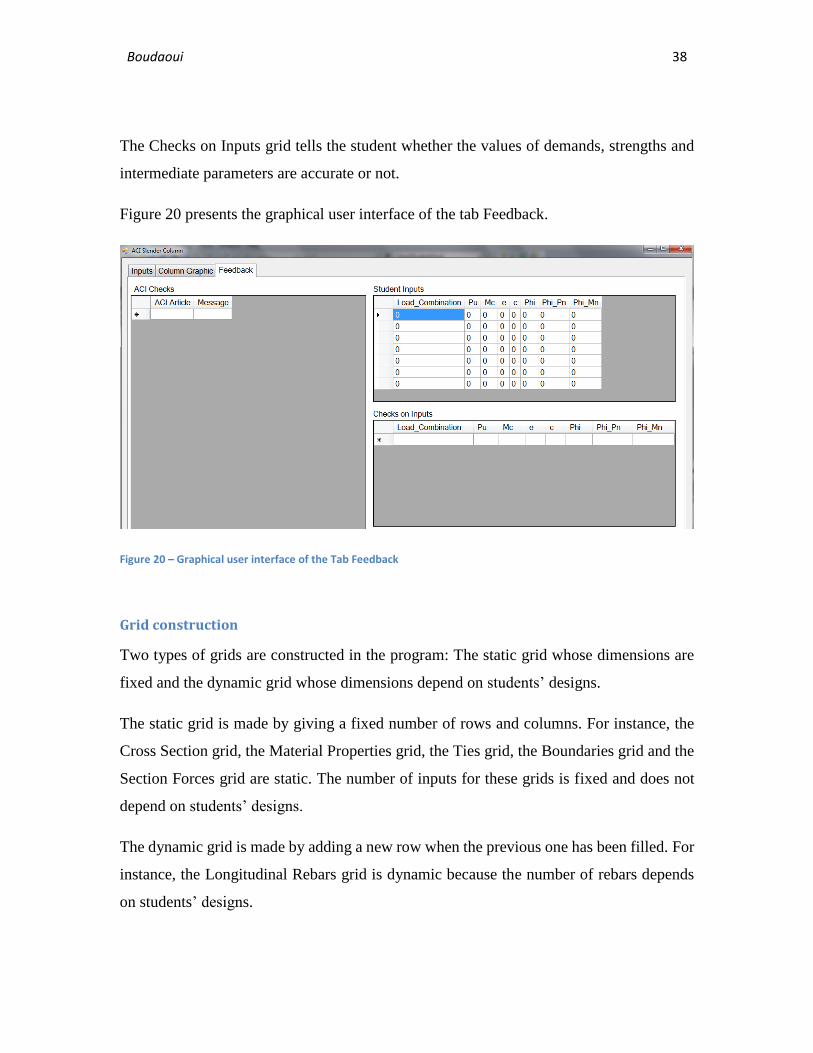
Boudaoui 38
The Checks on Inputs grid tells the student whether the values of demands, strengths and
intermediate parameters are accurate or not.
Figure 20 presents the graphical user interface of the tab Feedback.
Figure 20 – Graphical user interface of the Tab Feedback
Grid construction
Two types of grids are constructed in the program: The static grid whose dimensions are
fixed and the dynamic grid whose dimensions depend on students’ designs.
The static grid is made by giving a fixed number of rows and columns. For instance, the
Cross Section grid, the Material Properties grid, the Ties grid, the Boundaries grid and the
Section Forces grid are static. The number of inputs for these grids is fixed and does not
depend on students’ designs.
The dynamic grid is made by adding a new row when the previous one has been filled. For
instance, the Longitudinal Rebars grid is dynamic because the number of rebars depends
on students’ designs.
Boudaoui 39
CU Slender Column Classes
In this section are provided the descriptions of the classes used in the development of CU
Slender Column.
Aci Chapter 10 class
AciChapter10 class runs all ACI 318 Chapter 10 provisions for compression members.
When a provision is called in the program, it unveils a feedback to the student about
whether the provision is satisfied or not. When a provision is not satisfied, the key
parameter and some explanations related to the error are given.
Aci class
Aci class runs required ACI provisions located in other ACI Chapters such as the loading
combinations in Chapter 9 section 9.2.1 and the reduction factor 𝜙 in Chapter 9 section
9.3.2.2.
Section forces class
SectionForces class runs student’s values of each contribution for axial force and end
moments (Dead, Live, Live Roof, Snow, Wind, Earthquake, Lateral Earth Pressure). This
class supports the static grid Section Forces.
Rebar class
Rebar class interacts with classes that use rebars such as Material to inventory the
characteristics of a steel rebar, longitudinalRebar for the circular layout of the longitudinal
rebars and transverseRebar for the spiral ties reinforcement.
Material class
Material class runs concrete properties such as 𝑓’𝑐 and 𝐸𝑐 as well as steel properties such
as the yield stress 𝑓𝑦 and 𝐸𝑆. This class supports the static grid Material Properties.
Transverse rebar class
TransverseRebar class runs spiral ties reinforcement characteristics such as the rebar size
and the spacing. Ties reinforcement are made of one spiral rebar. This class supports the
static grid Ties.

Boudaoui 40
Longitudinal rebar class
LongitudinalRebar class runs longitudinal rebars characteristics such as the rebar size and
the polar coordinates of the rebar: The distance from the column center and the angle from
the horizontal axis. This class supports the dynamic grid Longitudinal Rebars.
Boundaries class
Boundaries class takes into account the column height and the effective length factor. This
class supports the static grid Boundaries.
Component class
Component class is supported by all classes under the tab Inputs as shown in Figure 18. It
contains design information for columns as well as the loadings. Also, it checks the unit
given by the student and generates a “bad unit” message if the inputs differs from the
United States customary units. Also, routines to build static and dynamic grids are written
under this class.
StudentChecks class
StudentChecks contains a program which compares the student’s values to the CU Slender
Column benchmark values. An arbitrary tolerance of 2% is considered. If the relative error
is greater than 2%, a “ng” message appears, if the error is within 2%, a “ok” message
appears and if only the sign is different, a “bad sign” message appears.
TabInput
TabInput contains ACI 318 moment magnification method calculations and strength
calculations.
columnGraphic
columnGraphic is used to sketch the column cross-section. The size of a cross-section is
scaled as follows: 216 pixels is equivalent to a 32 in diameter.
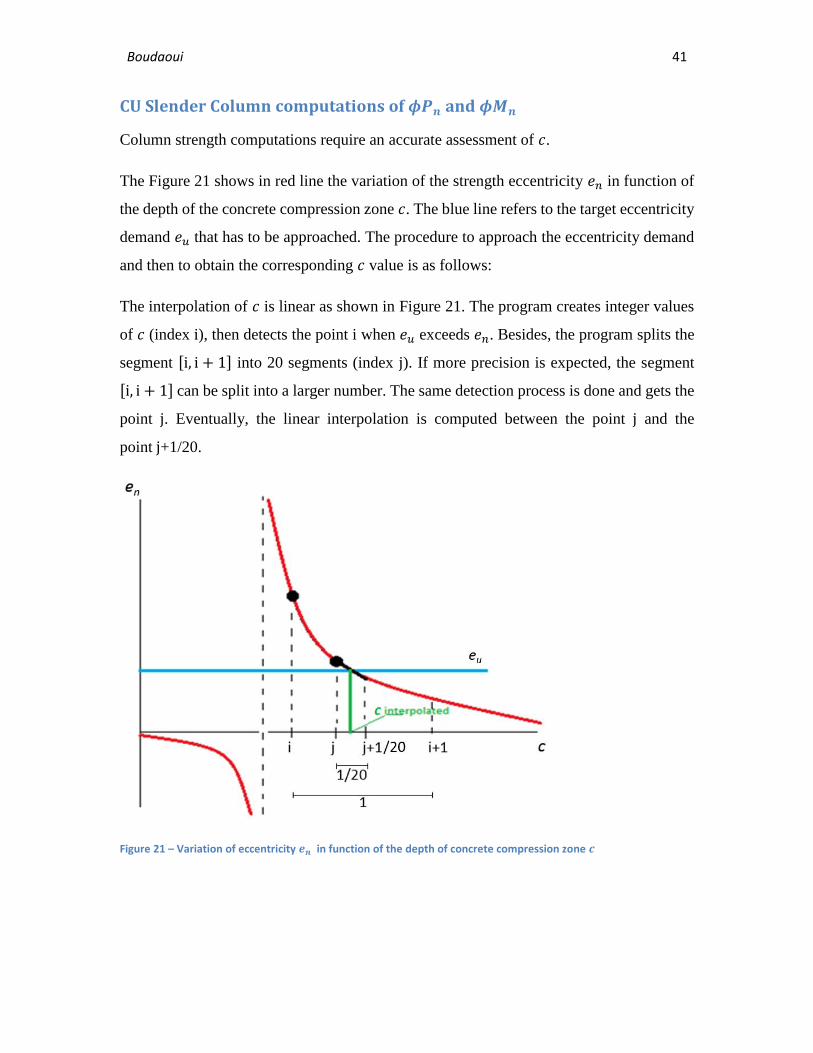
Boudaoui 41
CU Slender Column computations of 𝝓𝑷𝒏 and 𝝓𝑴𝒏
Column strength computations require an accurate assessment of 𝑐.
The Figure 21 shows in red line the variation of the strength eccentricity 𝑒𝑛 in function of
the depth of the concrete compression zone 𝑐. The blue line refers to the target eccentricity
demand 𝑒𝑢 that has to be approached. The procedure to approach the eccentricity demand
and then to obtain the corresponding 𝑐 value is as follows:
The interpolation of 𝑐 is linear as shown in Figure 21. The program creates integer values
of 𝑐 (index i), then detects the point i when 𝑒𝑢 exceeds 𝑒𝑛. Besides, the program splits the
segment [i, i + 1] into 20 segments (index j). If more precision is expected, the segment
[i, i + 1] can be split into a larger number. The same detection process is done and gets the
point j. Eventually, the linear interpolation is computed between the point j and the
point j+1/20.
Figure 21 – Variation of eccentricity 𝒆𝒏 in function of the depth of concrete compression zone 𝒄
Boudaoui 42
Chapter 4 - Demonstration of Educational Software
Presentation of Examples
The validation of CU Slender Column is done by three demonstrations aiming at covering
many design situations. These demonstrate that CU Slender Column detects whether a
column passes or fails in strength through 24 examples (Demo #1), CU Slender Column
detects whether a design does not satisfy ACI provisions through 10 examples (Demo #2),
and CU Slender Column detects whether a student values are not accurate through 4
examples (Demo #3).
Demo #1 – Evaluation of column strength in non-sway and sway frames
A column either in a non-sway or a sway frame passes in strength if the strengths exceed
the demands for every single load combination:
𝜙𝑃𝑛 ≥ 𝑃𝑢 Eq. 54
𝜙𝑀𝑛 ≥ 𝑀𝑢 Eq. 55
𝑒𝑛 = 𝑒𝑢 Eq. 31
Demo #1 is made of 24 examples covering a wide range of column designs either passing
or failing in strength. The variety of examples is obtained by varying parameters such as
eccentricity demand 𝑒𝑢 through values of factored axial force and end moments, the type
of frame: Sway or non-sway frame, 𝐶𝑚 through the value of the ratio of factored end
moments and the slenderness. To explore both single curvature and double curvature cases,
columns in the first half of examples are single-curved and columns in the second half are
double-curved.

Boudaoui 43
Table 11 – Examples for Demo #1
# Example Slenderness Sway/Non Sway 𝑪𝒎 Eccentricity Strength
1 Low Value N-S Low Value Diameter Pass
2 Low Value N-S Low Value Diameter/10 Pass
3 Low Value N-S 1.0 Diameter Pass
4 Low Value N-S 1.0 Diameter/10 Pass
5 Low Value S 1.0 Diameter Pass
6 Low Value S 1.0 Diameter/10 Pass
7 High Value S 1.0 Diameter Pass
8 High Value S 1.0 Diameter/2 Pass
9 High Value N-S Low Value Diameter Pass
10 High Value N-S Low Value Diameter/2 Pass
11 High Value N-S 1.0 Diameter Pass
12 High Value N-S 1.0 Diameter/2 Pass
13 Low Value N-S Low Value Diameter Fail
14 Low Value N-S Low Value Diameter/10 Fail
15 Low Value N-S 1.0 Diameter Fail
16 Low Value N-S 1.0 Diameter/10 Fail
17 Low Value S 1.0 Diameter Fail
18 Low Value S 1.0 Diameter/10 Fail
19 High Value S 1.0 Diameter Fail
20 High Value S 1.0 Diameter/2 Fail
21 High Value N-S Low Value Diameter Fail
22 High Value N-S Low Value Diameter/2 Fail
23 High Value N-S 1.0 Diameter Fail
24 High Value N-S 1.0 Diameter/2 Fail
The Figure 22 presents the scattering of geometry of columns presented in this section and
shows that examples in Demo #1 deal with many column dimensions. Columns diameters
range from 14 in to 32 in and columns heights range from 10 ft to 32 ft.

Boudaoui 44
Figure 22 – Scattering of columns geometry for Demo #1
The Figure 23 shows the elevated view of the columns used in Demo #1.
Figure 23 – Dimensions of columns for Demo #1
Figure 24 shows the cross sections of columns developed in Demo #1.
0
5
10
15
20
25
30
35
0 5 10 15 20 25 30 35
Co
lum
n H
eigh
t (f
t)
Column Diameter (in)
Scattering of Examples

Boudaoui 45
h= 24in 𝐴𝑠𝑡/𝐴𝑔= 6.47 %
h= 26in 𝐴𝑠𝑡/𝐴𝑔= 1.69 %
h= 32in 𝐴𝑠𝑡/𝐴𝑔= 1.42 %
h= 18in
𝐴𝑠𝑡/𝐴𝑔= 3.30 %
h= 18in
𝐴𝑠𝑡/𝐴𝑔= 4.34 %
h= 22in
𝐴𝑠𝑡/𝐴𝑔= 4.10 %
h= 16in
𝐴𝑠𝑡/𝐴𝑔= 3.54 %
h= 16in
𝐴𝑠𝑡/𝐴𝑔= 3.54 %
h= 18in
𝐴𝑠𝑡/𝐴𝑔= 3.54 %
h= 14in
𝐴𝑠𝑡/𝐴𝑔= 6.60 %
h= 15in
𝐴𝑠𝑡/𝐴𝑔= 6.79 %
h= 17in
𝐴𝑠𝑡/𝐴𝑔= 5.50 % Figure 24 – Cross sections of columns for Demo #1

Boudaoui 46
Demo #2 – Non satisfaction of ACI provisions
A column passes in ACI provisions if all ACI provisions are satisfied.
Demo #2 is made of 10 examples failing in ACI provisions. Provisions that are considered
are the confinement spiral spacing, the spiral reinforcement ratio, the longitudinal rebars
ratio, the longitudinal rebars count and the applicability of the moment magnification
method.
Table 12 – Examples for Demo #2
# Example ACI provisions Content Strength
#25 ACI 7.10.4.3 - FAIL Confinement Spiral Spacing PASS
#26 ACI 10.9.3 - FAIL Spiral Reinforcement Ratio PASS
#27 ACI 10.9.1 - FAIL Longitudinal Rebars Ratio PASS
#28 ACI 10.9.2 - FAIL Longitudinal Rebars Count PASS
#29 ACI 10.11.5 - FAIL Application of Moment Magnification PASS
#30 ACI 7.10.4.3 - FAIL Confinement Spiral Spacing FAIL
#31 ACI 10.9.3 - FAIL Spiral Reinforcement Ratio FAIL
#32 ACI 10.9.1 - FAIL Longitudinal Rebars Ratio FAIL
#33 ACI 10.9.2 - FAIL Longitudinal Rebars Count FAIL
#34 ACI 10.11.5 - FAIL Application of Moment Magnification FAIL
Demo #3 – Accuracy of student’s inputs
Student’s inputs are accurate if they match CU Slender Column outcomes within a
tolerance set at 2% in the study. A table entitled Checks on Inputs under the tab Feedback
allows the student to check whether the inputs are accurate with those computed by CU
Slender Column. As stated earlier, if the values are not accurate, a message “ng” appears,
if the values are accurate, a message “ok” appears then, if the sign is wrong, a message
“bad sign” appears.
Demo #3 is made of 4 examples where student’s inputs are not accurate with CU Slender
Column outcomes.

Boudaoui 47
Table 13 – Examples for Demo #3
# Example 2% Accuracy ACI provisions Strength
#35 FAIL PASS PASS
#36 FAIL PASS FAIL
#37 FAIL FAIL PASS
#38 FAIL FAIL FAIL
Comprehensiveness of examples for validation of CU Slender Column
The Table 14 shows the strong demonstration of CU Slender Column through the
validation of examples covering a wide range of design situations. It is shown that all
possibilities under the three demonstrations are covered.
Table 14 – Comprehensiveness of examples for validation of CU Slender Column
Accuracy ACI Provisions Strength Demo Examples
PASS
PASS
PASS #1
#1 to #12
FAIL #13 to #24
FAIL
PASS #2
#25 to #29
FAIL #30 to #34
FAIL
PASS
PASS
#3
#35
FAIL #36
FAIL
PASS #37
FAIL #38
To generate examples for validation more rapidly, Dead, Live and Wind contributions are
considered equal. Other contributions are not considered for those examples.
𝑃𝑑 = 𝑃𝑙 = 𝑃𝑤 = 𝑃 Eq. 56
𝑀𝑖𝑑 = 𝑀𝑖𝑙 = 𝑀𝑖𝑤 = 𝑀𝑒𝑖 Eq. 57
𝑀𝑗𝑑 = 𝑀𝑗𝑙 = 𝑀𝑗𝑤 = 𝑀𝑒𝑗 Eq. 58
It is noted that CU Slender Column program through the routine Aci9_2_1 under the Aci
class considers all load contributions and loading combinations.

Boudaoui 48
Detailed Examples for Moment Magnification Method in Non-Sway Frame
Examples #1 and #13 composing the Example Pair #1 and presented in Table 11 are
detailed to show step by step the ACI 318 moment magnification method for a non-sway
frame as described in the section “ACI 318 Moment Magnification Method and Checks of
Strength Requirements for Non-Sway and Sway Frames” (page 23). References to the
routines written in the program performing the computations are provided.
Examples #1 and #13 use the same single-curved column. The column is in a non-sway
frame with a diameter of 32 in and a height of 24 ft. The concrete Young’s modulus 𝐸𝑐 is
equal to 4287 psi. Examples target a low value of slenderness, a low factored end moments
ratio and a high eccentricity.
Table 15 – Column geometry for detailed examples in non-sway frame
Column Geometry
Height (ft) 24
Diameter (in) 32
SCALE 1:14
Longitudinal Rebars, 9 –No 10 Spiral Ties, No 5 @ 2 in
Figure 25 – Column cross section for detailed examples in non-sway frame

Boudaoui 49
Step #1:
Compute the factored loads.
The student gets the values of load contributions using a structural analysis software. In
the detailed examples, the Dead, Live and Wind contributions for the axial force are
identical and equal to 𝑃 (Eq. 56). The Dead, Live and Wind contributions at the end i are
identical and equal to 𝑀𝑒𝑖 (Eq. 57). The Dead, Live and Wind contribution at the end j are
identical and equal to 𝑀𝑒𝑗 (Eq. 58).
Table 16 – Student’s loading inputs for detailed examples in non-sway frame
Loading Ex #1 Ex #13
𝑃 (k) 50 700
𝑀𝑒𝑖(kft) 10 5 𝑀𝑒𝑗(kft) -200 -1500
The routine Aci9_2_1 under the Aci class computes the factored loads and the routine
Aci_10_12_3_1 defines 𝑀1 as the smaller factored end moments and 𝑀2 as the larger
factored end moments.
For example #1, the factored axial force 𝑃𝑢 is equal to 190 k and the larger factored end
moment 𝑀2 is equal to -760 kft. For example #13, the factored axial force 𝑃𝑢 is equal to
2660 k and the larger factored end moment 𝑀2 is equal to -5700 kft.
Table 17 – Factored loads for detailed examples in non-sway frame
Factored Load Ex #1 Ex #13
𝑃𝑢(k) 190 2660
𝑀1(kft) 38 19
𝑀2(kft) -760 -5700

Boudaoui 50
Step #2:
Compute the slenderness of the column.
In the program, the routine Aci_10_12_2 under the AciChapter10 class computes the
slenderness of the column. The effective length factor 𝑘, equal to 1.0, and the column
length 𝐿, equal to 24 ft, are given by the student in the grid Boundaries. The routine
SectionProperties under the component class computes the radius of gyration 𝑟.
Columns in both examples have identical geometrical features, the slenderness is the same:
𝑘𝐿
𝑟=
1.0 ∗ 24 ∗ 12
8= 36
Eq. 59
Table 18 – Column slenderness for detailed examples in non-sway frame
Ex #1 Ex #13
Slenderness 36 36
The routine Aci_10_12_2 under the AciChapter10 class computes the slenderness lower
bound for the application of the ACI 318 moment magnification method as defined in (Eq.
46). The slenderness lower bound for both examples is 34. The column used in both
examples is slender and the ACI 318 moment magnification method applies.
Step #3:
Compute 𝐶𝑚.
The routine Aci_10_12_3_1 under the AciChapter10 class computes 𝐶𝑚 from the factored
end moments.
𝐶𝑚 is identical for both examples and equal to 0.6.
Table 19 – 𝑪𝒎 for detailed examples in non-sway frame
Correction factor Ex #1 Ex #13
𝐶𝑚 0.6 0.6

Boudaoui 51
Step #4:
Apply the ACI 318 moment magnification method.
The routine Aci_10_13_6 under the AciChapter10 class computes the parameter 𝛽𝑑. The
factored sustained loads are computed using the routine Aci9_2_1_Sus under the Aci class
and the factored loads are computed using the routine Aci9_2_1 under the Aci class.
Parameter 𝛽𝑑 is identical for both examples and equal to:
𝛽𝑑 =
1.2𝑃
𝑃𝑢 =
1.2 ∗ 50
190 Eq. 60
= 0.316
The routine Aci_10_12_3 under the AciChapter10 class computes the reduced stiffness 𝐸𝐼.
𝐸𝐼 is identical for both examples and equal to:
𝐸𝐼 =
0.4 ∗ 𝐸𝑐 ∗ 𝐼𝑔
1 + 𝛽𝑑 =
0.4 ∗ 4287 ∗ 51472
1 + 0.316 Eq. 61
= 6.7 ∗ 107kin−2
The routine Aci_10_12_3 under the AciChapter10 class computes the buckling load 𝑃𝑐.
𝑃𝑐 is identical for both examples and equal to:
𝑃𝑐 =
𝜋2𝐸𝐼
(𝑘𝐿)2 =
π2 ∗ 6.7 ∗ 107
(1.0 ∗ 24 ∗ 12)2
Eq. 62
= 7982 k
The magnification factor 𝛿𝑛𝑠 is calculated in the routine Compute under tabInput.
For example #1, 𝛿𝑛𝑠 is equal to:
𝛿𝑛𝑠 =
𝐶𝑚
1 −𝑃𝑢
0.75 ∗ 𝑃𝑐
=0.6
1 −190
0.75 ∗ 7972
Eq. 63
= 0.64
=> 𝛿𝑛𝑠 = 1.0

Boudaoui 52
The magnification factor is taken as 1.0 because the column has to withstand at least the
existing larger factored end moment.
For example #13, 𝛿𝑛𝑠 is equal to:
𝛿𝑛𝑠 =
𝐶𝑚
1 −𝑃𝑢
0.75 ∗ 𝑃𝑐
=0.6
1 −2660
0.75 ∗ 7972
Eq. 64
= 1.08
Table 20 – 𝜹𝒏𝒔 for detailed examples in non-sway frame
Magnification factor Ex #1 Ex #13
𝛿𝑛𝑠 1.0 1.08
The magnified moment 𝑀𝑐 is calculated in the routine Compute under tabInput.
For example #1, 𝑀𝑐 is equal to:
𝑀𝑐 = 𝛿𝑛𝑠 ∗ 𝑀2 = 1.0 ∗760 Eq. 65
= 760 kft
For example #13, 𝑀𝑐 is equal to:
𝑀𝑐 = 𝛿𝑛𝑠 ∗ 𝑀2 = 1.08 ∗ 5700 Eq. 66
= 6170 kft
Table 21 – 𝑴𝒄 for detailed examples in non-sway frame
Magnified moment Ex #1 Ex #13
𝑀𝑐(kft) 760 6170

Boudaoui 53
Step #5:
Compute the strengths.
The strengths are computed when the student presses the button Compute under the tab
Inputs. The program interpolates 𝑐 by equalizing the eccentricities. The strengths are
computed by the method described in the section “Strength Computations” (page 18).
Table 22 – Strengths for detailed examples in non-sway frame
Strength Ex #1 Ex #13
𝜙𝑃𝑛(k) 202 400 𝜙𝑀𝑛(kft) 806 826
Step #6:
The column satisfies strength requirements if the load demands are smaller than the column
strengths.
Table 23 – Findings for detailed examples in non-sway frame
Finding Ex #1 Ex #13
Strength PASS FAIL ACI Provisions PASS PASS

Boudaoui 54
The complete detailed examples #1 and #13 for non-sway frame are summarized in Table
24.
Table 24 – Example Pair #1 – Low Slenderness / Non-Sway / Low Cm / Low Eccentricity / Single Curvature
Column Geometry
SCALE 1:14
Longitudinal Rebars, 9 – No 10 Spiral Ties, No 5 @ 2in
Height (ft) 24
Diameter (in) 32
Column Configuration
Slenderness 36 ~Low Value
Sway/Non-Sway? Non-Sway
𝐶𝑚 0.60 ~Low Value
Eccentricity (in) 33 ~diameter
Loading Ex #1 Ex #13
𝑃 (k) 50 700
𝑀𝑒𝑖(kft) 10 5 𝑀𝑒𝑗(kft) -200 -1500
𝛿𝑛𝑠 1 1.08
Results
𝑃𝑢 (k) 190 2660
𝜙𝑃𝑛 (k) 202 400
𝑀2 (kft) 760 5700
𝑀𝑐 (kft) 760 6170
𝜙𝑀𝑛 (kft) 806 826
Finding
Strength PASS FAIL
ACI Provisions PASS PASS

Boudaoui 55
Detailed Examples for Moment Magnification Method in Sway Frame
Examples #5 and #17 composing the Example Pair #5 and presented in Table 11 are
detailed to show step by step the ACI 318 moment magnification method for a sway frame
as described in the section “ACI 318 Moment Magnification Method and Checks of
Strength Requirements for Non-Sway and Sway Frames” (page 23). References to the
routines written in the program performing the computations are provided.
Examples #5 and #17 use the same single-curved column. The column is in a sway frame
with a diameter of 22 in and a height of 28 ft. Examples target a low value of slenderness,
and a high eccentricity.
Table 25 – Column geometry for detailed examples in sway frame
Column Geometry
Height (ft) 28
Diameter (in) 22
SCALE 1:14
Longitudinal Rebars, 10 –No 11 Spiral Ties, No 5 @ 2 in
Figure 26 – Column cross section for detailed examples in sway frame
Step #1:
Compute the slenderness of the column.
In the program, the routine Aci_10_12_2 under the AciChapter10 class computes the
slenderness of the column. The effective length factor 𝑘, equal to 1.0, and the column
length 𝐿, equal to 28 ft, are given by the student in the grid Boundaries. The routine
SectionProperties under the component class computes the radius of gyration 𝑟.

Boudaoui 56
Since columns in both examples have identical geometrical features, the slenderness is
identical and equal to:
𝑘𝐿
𝑟=
1.0 ∗ 28 ∗ 12
5.5= 61 Eq. 67
Table 26 – Slenderness for detailed examples in sway frame
Ex #5 Ex #17
Slenderness 61 61
In sway frame, the slenderness lower bound for the application of the ACI 318 moment
magnification method is equal to 22.
Thus, the ACI 318 moment magnification method is applicable in examples #5 and #17.
Step #2:
Compute the factored loads.
Structural analysis software provides load contributions as well as contributions due to
non-sway and sway case. Likewise, in the detailed examples, the Dead, Live and Wind
contribution for the axial force are identical and equal to 𝑃. The Dead, Live and Wind
contribution at the end i are identical and equal to 𝑀𝑒𝑖. The Dead, Live and Wind
contribution at the end j are identical and equal to 𝑀𝑒𝑗.
Table 27 – Student’s loading inputs for detailed examples in sway frame
Loading Ex #5 Ex #17
𝑃 (k) 80 75
𝑀𝑒𝑖(kft) 100 120 𝑀𝑒𝑗(kft) -100 -120
The routine Aci9_2_1 under the Aci class computes the factored loads and the routine
Aci_10_12_3_1 computes 𝑀2.

Boudaoui 57
For example #5, the factored axial force 𝑃𝑢 is equal to 304 k and the larger factored end
moment 𝑀2 is equal to -380 kft. For example #17, the factored axial force 𝑃𝑢 is equal to
285 k and the larger factored end moment 𝑀2 is equal to -456 kft.
Table 28 – Factored loads for detailed examples in sway frame
Factored Load Ex #5 Ex #17
𝑃𝑢(k) 304 285
𝑀1(kft) 380 456
𝑀2(kft) -380 -456
Step #3:
Determine if the frame can be considered as non-sway.
In the examples, it is considered that a structural software analysis gives a story drift 𝛥0 of
1.0 in, a factored shear force V5 equal to 7k for example #5 and a factored shear force V17
equal to 8.5k for example #17. The routine Aci_10_11_4_2 under the AciChapter10 class
computes the story index 𝑄.
For example #5, 𝑄 is equal to:
𝑄 =
𝑃𝑢 ∗ 𝛥0
𝑉5 ∗ 𝐿 =
304 ∗ 1.0
7 ∗ 28 ∗ 12 Eq. 68
= 0.13
For example #17, 𝑄 is equal to:
𝑄 =
𝑃𝑢 ∗ 𝛥0
𝑉17 ∗ 𝐿 =
285 ∗ 1.0
8.5 ∗ 28 ∗ 12 Eq. 69
= 0.10
For both examples, as 𝑄 is larger than 0.05, the frame is considered as sway and the ACI
318 moment magnification method for sway frames applies.
Step #4:
Apply the ACI 318 moment magnification method.
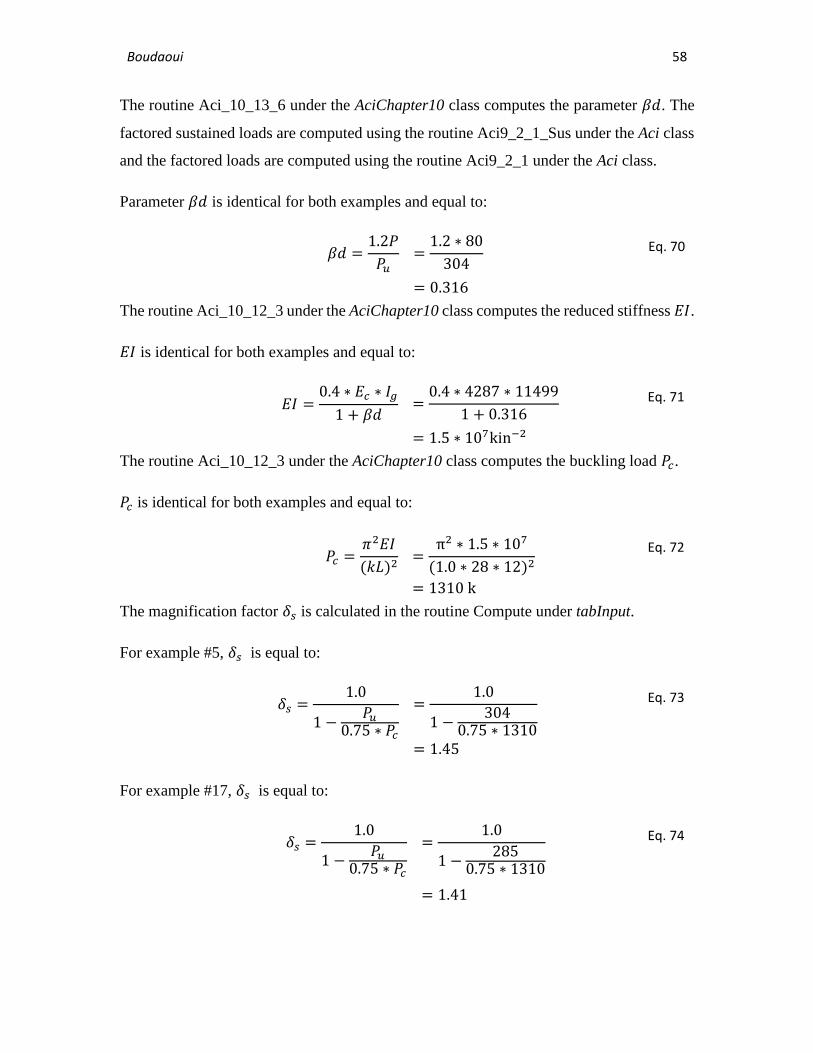
Boudaoui 58
The routine Aci_10_13_6 under the AciChapter10 class computes the parameter 𝛽𝑑. The
factored sustained loads are computed using the routine Aci9_2_1_Sus under the Aci class
and the factored loads are computed using the routine Aci9_2_1 under the Aci class.
Parameter 𝛽𝑑 is identical for both examples and equal to:
𝛽𝑑 =
1.2𝑃
𝑃𝑢 =
1.2 ∗ 80
304 Eq. 70
= 0.316
The routine Aci_10_12_3 under the AciChapter10 class computes the reduced stiffness 𝐸𝐼.
𝐸𝐼 is identical for both examples and equal to:
𝐸𝐼 =
0.4 ∗ 𝐸𝑐 ∗ 𝐼𝑔
1 + 𝛽𝑑 =
0.4 ∗ 4287 ∗ 11499
1 + 0.316 Eq. 71
= 1.5 ∗ 107kin−2
The routine Aci_10_12_3 under the AciChapter10 class computes the buckling load 𝑃𝑐.
𝑃𝑐 is identical for both examples and equal to:
𝑃𝑐 =
𝜋2𝐸𝐼
(𝑘𝐿)2 =
π2 ∗ 1.5 ∗ 107
(1.0 ∗ 28 ∗ 12)2
Eq. 72
= 1310 k
The magnification factor 𝛿𝑠 is calculated in the routine Compute under tabInput.
For example #5, 𝛿𝑠 is equal to:
𝛿𝑠 =
1.0
1 −𝑃𝑢
0.75 ∗ 𝑃𝑐
=1.0
1 −304
0.75 ∗ 1310
Eq. 73
= 1.45
For example #17, 𝛿𝑠 is equal to:
𝛿𝑠 =
1.0
1 −𝑃𝑢
0.75 ∗ 𝑃𝑐
=1.0
1 −285
0.75 ∗ 1310
Eq. 74
= 1.41

Boudaoui 59
Table 29 – 𝜹𝒔 for detailed examples in sway frame
Magnification factor Ex #5 Ex #17
𝛿𝑛𝑠 1.45 1.41
The magnified moment 𝑀𝑐 is calculated in the routine Compute under tabInput.
For example #5, 𝑀𝑐 is equal to:
𝑀𝑐 = 452 𝑘𝑓𝑡 Eq. 75
For example #17, 𝑀𝑐 is equal to:
𝑀𝑐 = 534 𝑘𝑓𝑡 Eq. 76
Table 30 – 𝑴𝒄 for detailed examples in sway frame
Magnified moment Ex #5 Ex #17
𝑀𝑐(kft) 452 534
Step #5:
Compute the strengths. The strengths are computed when the student presses the button
Compute under the tab Inputs. The program interpolates 𝑐 by equalizing the eccentricities.
The strengths are computed by the method described in the section “Strength
Computations” (page 18).
Table 31 – Strengths for detailed examples for sway frame
Strength Ex #5 Ex #17
𝜙𝑃𝑛(k) 314 251 𝜙𝑀𝑛(kft) 466 471
Step #6:
The column satisfies the strength requirements if the load demands are smaller than the
column strengths.
Table 32 – Findings for detailed examples in sway frame
Finding Ex #5 Ex #17
Strength PASS FAIL ACI Provisions PASS PASS

Boudaoui 60
The complete detailed examples #5 and #17 for sway frame are summarized in Table 33.
Table 33 – Example Pair #5 – Low Slenderness / Sway / High Eccentricity / Single Curvature
Column Geometry
SCALE 1:14
Longitudinal Rebars, 10 – No 11 Spiral Ties, No 5 @ 2in
Height (ft) 28
Diameter (in) 22
Column Configuration
Slenderness 61 ~Low Value
Sway/Non-Sway? Non-Sway
𝐶𝑚 1.0 ~High Value
Eccentricity (in) 33 ~diameter
Loading Ex #5 Ex #17
𝑃 (k) 80 75
𝑀𝑒𝑖(kft) 100 120 𝑀𝑒𝑗(kft) -100 -120
𝛿𝑛𝑠 1.45 1.41
Results
𝑃𝑢 (k) 304 285
𝜙𝑃𝑛 (k) 314 251
𝑀2 (kft) 380 456
𝑀𝑐 (kft) 452 534
𝜙𝑀𝑛 (kft) 466 471
Finding
Strength PASS FAIL
ACI Provisions PASS PASS

Boudaoui 61
CU Slender Column Feedbacks
CU Slender Column provides useful feedbacks about satisfaction of ACI provisions and
accuracy of numerical values of loads and strengths. The feedbacks aim at helping students
in the design process. To show that CU Slender Column generates correct feedbacks, two
examples are developed for a passing column and a failing column.
Passing Column
The following example targets a column design satisfying strength requirements as well as
ACI provisions. The purpose is to show that CU Slender Column detects that the design
satisfies ACI provisions as well as strength requirements and provides the correct
feedbacks. The Figure 27 shows the tab Inputs with the student’s inputs and the Figure 28
shows the tab Feedback with the feedbacks to the student.
Figure 27 – Student’s inputs for passing column

Boudaoui 62
Figure 28 – CU Slender Column feedbacks for student in case of passing column
The Figure 28 shows that CU Slender Column detects that the column passes in strength
by providing the feedback “Pass” in front of “Design Strengths”. Also CU Slender Column
detects that ACI 318 provisions are satisfied by providing the feedback “Pass” in front of
“ACI Design Provision(s)”.
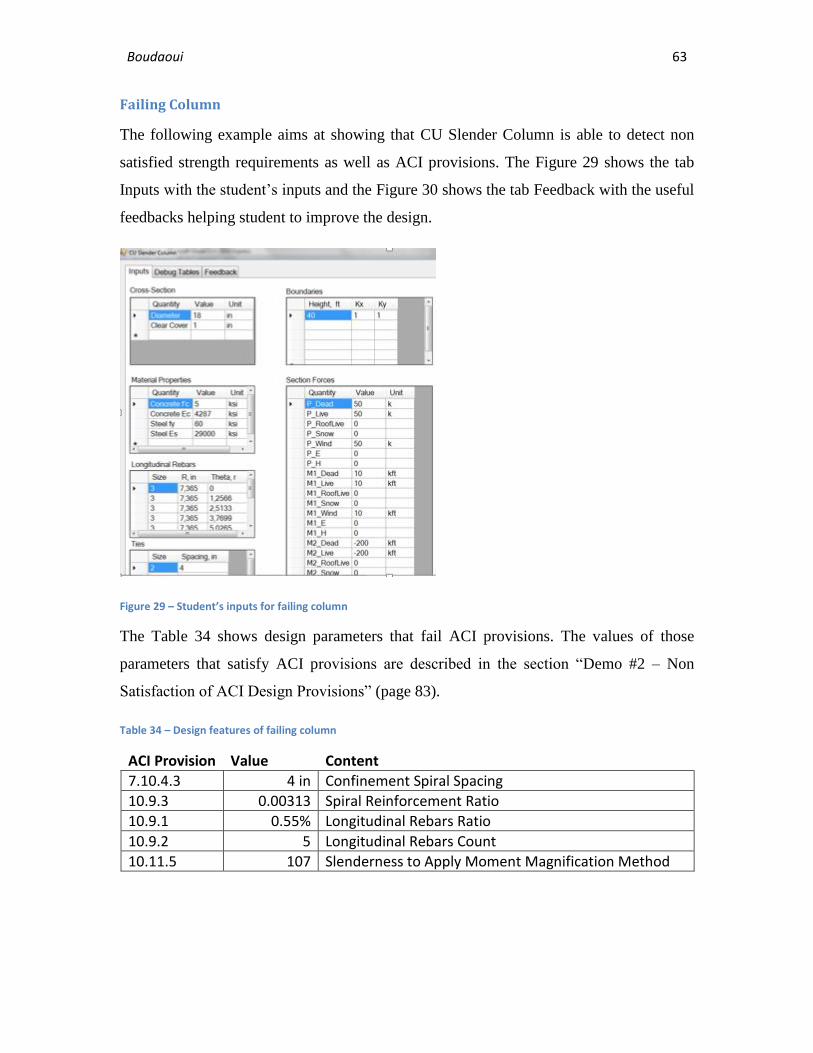
Boudaoui 63
Failing Column
The following example aims at showing that CU Slender Column is able to detect non
satisfied strength requirements as well as ACI provisions. The Figure 29 shows the tab
Inputs with the student’s inputs and the Figure 30 shows the tab Feedback with the useful
feedbacks helping student to improve the design.
Figure 29 – Student’s inputs for failing column
The Table 34 shows design parameters that fail ACI provisions. The values of those
parameters that satisfy ACI provisions are described in the section “Demo #2 – Non
Satisfaction of ACI Design Provisions” (page 83).
Table 34 – Design features of failing column
ACI Provision Value Content
7.10.4.3 4 in Confinement Spiral Spacing
10.9.3 0.00313 Spiral Reinforcement Ratio
10.9.1 0.55% Longitudinal Rebars Ratio
10.9.2 5 Longitudinal Rebars Count
10.11.5 107 Slenderness to Apply Moment Magnification Method

Boudaoui 64
Figure 30 – CU Slender Column feedbacks for student in case of failing column
The Figure 30 shows that CU Slender Column detects that the column fails in strength by
providing the feedback “Fail” in front of “Design Strengths”. Also CU Slender Column
detects that ACI 318 provisions are not satisfied by providing the feedback “Fail” in front
of “ACI Design Provision(s)”. For non-satisfied provisions, CU Slender Column identifies
the parameters that have to be corrected.

Boudaoui 65
Evaluation of Accuracy of CU Slender Column
As part of the development of CU Slender Column, it is developed an independent study
with Microsoft Excel 2013. This independent study is used as the benchmark for the
evaluation of CU Slender Column accuracy. All outcomes are computed with a precision
of three significant figures.
Accuracy of the approach determining 𝒄
The accuracy of the approach to determine 𝑐 is illustrated by the Figure 31. It is shown that
with a precision of three significant figures, CU Slender Column outcomes match those of
the benchmark study. Thus, the linear interpolation implemented in CU Slender Column
provides a good accuracy in the assessment of 𝑐.
Figure 31 – CU Slender Column Approach vs Benchmark for values of c.
0.999
0.9992
0.9994
0.9996
0.9998
1
1.0002
1.0004
1.0006
1.0008
1.001
1 2 3 4 5 6 7 8 9 10 11 12 13 14 15 16 17 18 19 20 21 22 23 24
c,C
U/c
,Ben
chm
ark
Examples
CU Slender Column Approach vs Benchmark for values of c

Boudaoui 66
Accuracy of Strengths
The accuracy of CU Slender Column to determine the axial strength is illustrated in the
Figure 32 and the accuracy for the moment strength is illustrated in the Figure 33. It is
shown that with a precision of three significant figures, CU Slender Column outcomes
match those of the benchmark study.
Figure 32 – CU Slender Column Axial Strength vs Benchmark Axial Strength
0.999
0.9992
0.9994
0.9996
0.9998
1
1.0002
1.0004
1.0006
1.0008
1.001
1 2 3 4 5 6 7 8 9 10 11 12 13 14 15 16 17 18 19 20 21 22 23 24
𝜙𝑃𝑛,C
U/𝜙𝑃𝑛,B
ench
mar
k
Examples
CU Slender Column Axial Strength vs Benchmark Axial Strength

Boudaoui 67
Figure 33 – CU Slender Colum Moment Strength vs Benchmark Moment Strength
Accuracy of Demands and Moment Magnification Factor
The accuracy of CU Slender Column to determine the axial demand 𝑃𝑢 is illustrated in
Figure 34, the accuracy for the magnified moment demand 𝑀𝑐 is illustrated in Figure 35,
and the accuracy for the moment magnification factor is illustrated in Figure 36. It is shown
that with a precision of three significant figures, CU Slender Column outcomes match those
of the benchmark study.
0.999
0.9992
0.9994
0.9996
0.9998
1
1.0002
1.0004
1.0006
1.0008
1.001
1 2 3 4 5 6 7 8 9 10 11 12 13 14 15 16 17 18 19 20 21 22 23 24
𝜙𝑀𝑛,C
U/𝜙𝑀𝑛,B
ench
mar
k
Examples
CU Slender Column Moment Strengthvs Benchmark Moment Strength

Boudaoui 68
Figure 34 – CU Slender Column Axial Demand vs Benchmark Axial Demand
Figure 35 – CU Slender Column Magnified Moment vs Benchmark Magnified Moment
0.999
0.9992
0.9994
0.9996
0.9998
1
1.0002
1.0004
1.0006
1.0008
1.001
1 2 3 4 5 6 7 8 9 10 11 12 13 14 15 16 17 18 19 20 21 22 23 24
Pu,C
U/P
u,B
ench
mar
k
Examples
CU Slender Column Axial Demand vs Benchmark Axial Demand
0.999
0.9992
0.9994
0.9996
0.9998
1
1.0002
1.0004
1.0006
1.0008
1.001
1 2 3 4 5 6 7 8 9 10 11 12 13 14 15 16 17 18 19 20 21 22 23 24
𝑀c,
CU
/𝑀c,
Ben
chm
ark
Examples
CU Slender Column Magnified Moment vs Benchmark Magnified Moment

Boudaoui 69
Figure 36 – CU Slender Column Moment Magnification Factor vs Benchmark Moment Magnification Factor
The evaluation of the accuracy of CU Slender Column is based on the study of the accuracy
of the software application approach to determine 𝑐, the study of the accuracy of the axial
strength 𝜙𝑃𝑛, the study of the accuracy of the moment strength 𝜙𝑀𝑛 as well as the study
of the accuracy of the axial demand 𝑃𝑢, the magnified moment demand 𝑀𝑐 and the moment
magnification factor. It is shown that the outcomes generated by CU Slender Column are
accurate with a three significant figures precision and can be used as a benchmark in the
evaluation of students’ numerical values.
0.999
0.9992
0.9994
0.9996
0.9998
1
1.0002
1.0004
1.0006
1.0008
1.001
1 2 3 4 5 6 7 8 9 10 11 12 13 14 15 16 17 18 19 20 21 22 23 24
δ,C
U/δ
,Ben
chm
ark
Examples
CU Slender Column Moment Magnification Factor vs Benchmark Moment Magnification Factor

Boudaoui 70
Demo #1 – Variations on Evaluation of Columns in Non-Sway Frame
Columns in examples for validation in non-sway frame have different geometry and
subjected to different loadings to explore low and high values of design parameters such
as slenderness, eccentricity and ratio of factored end moments. Those variations show that
CU Slender Column detects whether a column passes or fails in strength for a wide range
of design situations.
Example Pairs #1 to #4 target a low slenderness. As shown in Table 35, variations touch
on low and high values of 𝐶𝑚 and eccentricity. It is noted that examples #1 and #13 which
compose the Example Pair #1 are the detailed examples for non-sway frame presented
earlier (page 48).
Table 35 – Examples varying 𝑪𝒎 and eccentricity for Examples Pairs #1 to #4
𝐶𝑚 Eccentricity
Low High
Low
#2 #4
#14 #16
High
#1 #3
#13 #17

Boudaoui 71
Example Pair #2 – Low Slenderness / Non-Sway / Low Cm / Low Eccentricity
The column in Example Pair #2 is in a non-sway frame and single-curved. Compared to
Example Pair #1, Example Pair #2 explores a longer column with a smaller diameter and
targets a low slenderness. Also, the axial force is larger and the end moments smaller to
target a low eccentricity. In Example Pair #2, longitudinal rebars have a smaller size.
Table 36 – Example Pair #2 – Low Slenderness / Non-Sway / Low Cm / Low Eccentricity / Single Curvature
Column Geometry
SCALE 1:14
Longitudinal Rebars, 9 – No 9 Spiral Ties, No 5 @ 2in
Height (ft) 18
Diameter (in) 26
Column Configuration
Slenderness 33 ~Low Value
Sway/Non-Sway? Non-Sway
𝐶𝑚 0.63 ~Low Value
Eccentricity (in) 3.5 ~diameter/10
Loading Ex #2 Ex #14
𝑃 (k) 275 350
𝑀𝑒𝑖(kft) 10 20
𝑀𝑒𝑗(kft) -120 -140
𝛿𝑛𝑠 1.0 1.0
Results
𝑃𝑢 (k) 1045 1330
𝜙𝑃𝑛 (k) 1093 1153
𝑀2 (kft) 456 532
𝑀𝑐 (kft) 456 532
𝜙𝑀𝑛 (kft) 477 461
Finding
Strength PASS FAIL
ACI Provisions PASS PASS

Boudaoui 72
Example Pair #3 – Low Slenderness / Non-Sway / High Cm / High Eccentricity
The column in Example Pair #3 is in a non-sway frame and single-curved. Compared to
Example Pair #2, Example Pair #3 explores a shorter column with a smaller diameter and
targets a low slenderness. Also, the axial force is smaller and the end moments bigger to
target a high eccentricity. The ratio of factored end moments is bigger.
Table 37 – Example Pair #3 – Low Slenderness / Non-Sway / High Cm / High Eccentricity / Single Curvature
Column Geometry
SCALE 1:14
Longitudinal Rebars, 9 – No 9 Spiral Ties, No 5 @ 2in
Height (ft) 12
Diameter (in) 18
Column Configuration
Slenderness 32 ~Low Value
Sway/Non-Sway? Non-Sway
𝐶𝑚 1.0 ~High Value
Eccentricity (in) 24 ~diameter
Loading Ex #3 Ex #15
𝑃 (k) 20 100
𝑀𝑒𝑖(kft) 50 180
𝑀𝑒𝑗(kft) -50 -180
𝛿𝑛𝑠 1.03 1.19
Results
𝑃𝑢 (k) 76 380
𝜙𝑃𝑛 (k) 87 106
𝑀2 (kft) 190 684
𝑀𝑐 (kft) 196 813
𝜙𝑀𝑛 (kft) 226 227
Finding
Strength PASS FAIL
ACI Provisions PASS PASS

Boudaoui 73
Example Pair #4 – Low Slenderness / Non-Sway / High Cm / Low Eccentricity
The column in Example Pair #4 is in a non-sway frame and single-curved. Compared to
Example Pair #3, Example Pair #4 explores a shorter column and targets a low slenderness.
Also, the axial force is larger and the end moments smaller to target a low eccentricity. In
Example Pair #4, more longitudinal rebars are used with a smaller size.
Table 38 – Example Pair #4 – Low Slenderness / Non-Sway / High Cm / Low Eccentricity / Single Curvature
Column Geometry
SCALE 1:14
Longitudinal Rebars, 14 – No 8 Spiral Ties, No 5 @ 2in
Height (ft) 10
Diameter (in) 18
Column Configuration
Slenderness 27 ~Low Value
Sway/Non-Sway? Non-Sway
𝐶𝑚 1.0 ~High Value
Eccentricity (in) 1.4 ~diameter/10
Loading Ex #4 Ex #16
𝑃 (k) 240 350
𝑀𝑒𝑖(kft) 20 50
𝑀𝑒𝑗(kft) -20 -50
𝛿𝑛𝑠 1.36 1.63
Results
𝑃𝑢 (k) 912 1330
𝜙𝑃𝑛 (k) 952 778
𝑀2 (kft) 76 190
𝑀𝑐 (kft) 118 309
𝜙𝑀𝑛 (kft) 123 181
Finding
Strength PASS FAIL
ACI Provisions PASS PASS

Boudaoui 74
Example Pairs #9 to #12 target a high slenderness. As shown in Table 39, variations touch
on low and high values of 𝐶𝑚 and eccentricity.
Table 39 – Examples varying 𝑪𝒎 and eccentricity for Example Pairs #9 to #12
𝐶𝑚 Eccentricity
Low High
Low
#10 #12
#22 #24
High
#9 #11
#21 #23
Example Pair #9 – High Slenderness / Non-Sway / Low Cm / High Eccentricity
The column in Example Pair #9 is in a non-sway frame and double-curved. Compared to
Example Pair #4, Example Pair #9 explores a longer column with a smaller diameter and
targets a high slenderness. Also, the axial force is smaller to target a high eccentricity. The
ratio of factored end moments is smaller. In Example Pair #9, less longitudinal rebars are
used with a bigger size.

Boudaoui 75
Table 40 – Example Pair #9 – High Slenderness / Non-Sway / Low Cm / High Eccentricity / Double Curvature
Column Geometry
SCALE 1:14
Longitudinal Rebars, 8 – No 10 Spiral Ties, No 5 @ 2in
Height (ft) 26
Diameter (in) 14
Column Configuration
Slenderness 89 ~High Value
Sway/Non-Sway? Non-Sway
𝐶𝑚 0.4 ~Low Value
Eccentricity (in) 10 ~diameter
Loading Ex #9 Ex #21
𝑃 (k) 15 40
𝑀𝑒𝑖(kft) 10 20 𝑀𝑒𝑗(kft) 20 25
𝛿𝑛𝑠 1.00 2.14
Results
𝑃𝑢 (k) 57 152
𝜙𝑃𝑛 (k) 103 102
𝑀2 (kft) 76 95
𝑀𝑐 (kft) 76 204
𝜙𝑀𝑛 (kft) 137 137
Finding
Strength PASS FAIL
ACI Provisions PASS PASS

Boudaoui 76
Example Pair #10 – High Slenderness / Non-Sway / Low Cm / Low Eccentricity
The column in Example Pair #10 is in a non-sway frame and double-curved. Compared to
Example Pair #9, Example Pair #10 explores a slightly shorter column with a slightly
smaller diameter and targets a high slenderness. Also, the axial force is bigger to target a
low eccentricity. The ratio of factored end moments is slightly bigger. In Example Pair
#10, more longitudinal rebars are used with a smaller size.
Table 41 – Example Pair #10 – High Slenderness / Non-Sway / Low Cm / Low Eccentricity / Double Curvature
Column Geometry
SCALE 1:14
Longitudinal Rebars, 12 – No 9 Spiral Ties, No 5 @ 2in
Height (ft) 25
Diameter (in) 15
Column Configuration
Slenderness 80 ~High Value
Sway/Non-Sway? Non-Sway
𝐶𝑚 0.47 ~Low Value
Eccentricity (in) 10 ~diameter/2
Loading Ex #10 Ex #22
𝑃 (k) 40 55
𝑀𝑒𝑖(kft) 10 20 𝑀𝑒𝑗(kft) 30 27
𝛿𝑛𝑠 1.09 1.86
Results
𝑃𝑢 (k) 152 209
𝜙𝑃𝑛 (k) 218 196
𝑀2 (kft) 114 102
𝑀𝑐 (kft) 124 191
𝜙𝑀𝑛 (kft) 179 179
Finding
Strength PASS FAIL
ACI Provisions PASS PASS

Boudaoui 77
Example Pair #11 – High Slenderness / Non-Sway / High Cm / High Eccentricity
The column in Example Pair #11 is in a non-sway frame and double-curved. Compared to
Example Pair #10, Example Pair #11 explores a longer column and targets a high
slenderness. Also, the axial force is smaller and end moments bigger to target a high
eccentricity. The ratio of factored end moments is lower. In Example Pair #11, less
longitudinal rebars are used with a smaller size.
Table 42 – Example Pair #11 – High Slenderness / Non-Sway / High Cm / High Eccentricity / Double Curvature
Column Geometry
SCALE 1:14
Longitudinal Rebars, 9 – No 8 Spiral Ties, No 5 @ 2in
Height (ft) 30
Diameter (in) 16
Column Configuration
Slenderness 90 ~High Value
Sway/Non-Sway? Non-Sway
𝐶𝑚 0.55 ~High Value
Eccentricity (in) 17 ~diameter
Loading Ex #11 Ex #23
𝑃 (k) 30 30
𝑀𝑒𝑖(kft) 5 5 𝑀𝑒𝑗(kft) 37 40
𝛿𝑛𝑠 1.04 1.05
Results
𝑃𝑢 (k) 114 114
𝜙𝑃𝑛 (k) 120 110
𝑀2 (kft) 141 152
𝑀𝑐 (kft) 147 160
𝜙𝑀𝑛 (kft) 154 154
Finding
Strength PASS FAIL
ACI Provisions PASS PASS

Boudaoui 78
Example Pair #12 – High Slenderness / Non-Sway / High Cm / Low Eccentricity
The column in Example Pair #12 is in a non-sway frame and double-curved. Compared to
Example Pair #11, Example Pair #12 explores a longer column with a larger diameter and
targets a high slenderness. Also, the axial force is smaller to target a low eccentricity. The
ratio of factored end moments is lower. In Example Pair #12, more longitudinal rebars are
used with a smaller size.
Table 43 – Example Pair #12 – High Slenderness / Non-Sway / High Cm / Low Eccentricity / Double Curvature
Column Geometry
SCALE 1:14
Longitudinal Rebars, 14 – No 7 Spiral Ties, No 5 @ 2in
Height (ft) 32
Diameter (in) 18
Column Configuration
Slenderness 85 ~High Value
Sway/Non-Sway? Non-Sway
𝐶𝑚 0.53 ~High Value
Eccentricity (in) 11 ~diameter/2
Loading Ex #12 Ex #24
𝑃 (k) 60 65
𝑀𝑒𝑖(kft) 5 5 𝑀𝑒𝑗(kft) 30 30
𝛿𝑛𝑠 1.65 2.00
Results
𝑃𝑢 (k) 228 247
𝜙𝑃𝑛 (k) 271 240
𝑀2 (kft) 114 114
𝑀𝑐 (kft) 188 227
𝜙𝑀𝑛 (kft) 223 221
Finding
Strength PASS FAIL
ACI Provisions PASS PASS

Boudaoui 79
Demo #1 – Variation on Evaluation of Column in Sway Frame
Similarly to the evaluation of columns in non-sway frame, columns in examples for
validation in sway frame have different geometry and subjected to different loadings to
explore low and high values of design parameters such as slenderness and eccentricity.
Those variations show that CU Slender Column detects whether a column passes or fails
in strength for a wide range of design situations.
Example Pairs #5 to #8 target a high value of 𝐶𝑚. As shown in Table 44, variations touch
on low and high values of slenderness and eccentricity. It is noted that examples #5 and
#17 are the detailed examples for sway frame presented earlier (page 55).
Table 44 – Examples varying slenderness and eccentricity for Example Pairs #5 to #8
Slenderness Eccentricity
Low High
Low
#6 #8
#18 #20
High
#5 #7
#17 #19

Boudaoui 80
Example Pair #6 – Low Slenderness / Sway / Low Eccentricity
The column in Example Pair #6 is in a sway frame and single-curved. Compared to
Example Pair #5, Example Pair #6 explores a shorter column with a larger diameter and
targets a low slenderness. Also, the axial force is larger to target a low eccentricity. In
Example Pair #6, less longitudinal rebars are used with a bigger size.
Table 45 – Example Pair #6 – Low Slenderness / Sway / Low Eccentricity / Single Curvature
Column Geometry
SCALE 1:14
Longitudinal Rebars, 13 – No 14 Spiral Ties, No 5 @ 2in
Height (ft) 26
Diameter (in) 24
Column Configuration
Slenderness 52 ~Low Value
Sway/Non-Sway? Sway
𝐶𝑚 1.0 ~High Value
Eccentricity (in) 3 ~diameter/10
Loading Ex #6 Ex #18
𝑃 (k) 120 200
𝑀𝑒𝑖(kft) 30 200
𝑀𝑒𝑗(kft) -30 -200
𝛿𝑛𝑠 1.39 1.89
Results
𝑃𝑢 (k) 456 760
𝜙𝑃𝑛 (k) 1699 577
𝑀2 (kft) 114 760
𝑀𝑐 (kft) 133 1045
𝜙𝑀𝑛 (kft) 495 794
Finding
Strength PASS FAIL
ACI Provisions PASS PASS
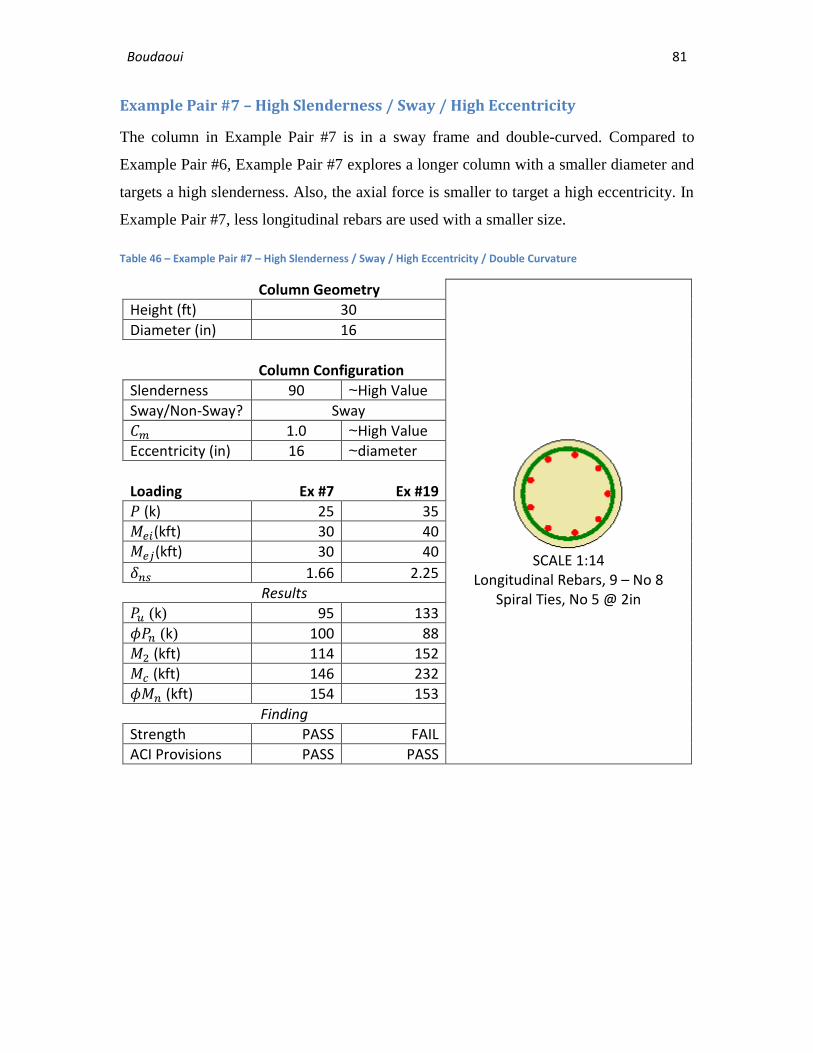
Boudaoui 81
Example Pair #7 – High Slenderness / Sway / High Eccentricity
The column in Example Pair #7 is in a sway frame and double-curved. Compared to
Example Pair #6, Example Pair #7 explores a longer column with a smaller diameter and
targets a high slenderness. Also, the axial force is smaller to target a high eccentricity. In
Example Pair #7, less longitudinal rebars are used with a smaller size.
Table 46 – Example Pair #7 – High Slenderness / Sway / High Eccentricity / Double Curvature
Column Geometry
SCALE 1:14
Longitudinal Rebars, 9 – No 8 Spiral Ties, No 5 @ 2in
Height (ft) 30
Diameter (in) 16
Column Configuration
Slenderness 90 ~High Value
Sway/Non-Sway? Sway
𝐶𝑚 1.0 ~High Value
Eccentricity (in) 16 ~diameter
Loading Ex #7 Ex #19
𝑃 (k) 25 35
𝑀𝑒𝑖(kft) 30 40
𝑀𝑒𝑗(kft) 30 40
𝛿𝑛𝑠 1.66 2.25
Results
𝑃𝑢 (k) 95 133
𝜙𝑃𝑛 (k) 100 88
𝑀2 (kft) 114 152
𝑀𝑐 (kft) 146 232
𝜙𝑀𝑛 (kft) 154 153
Finding
Strength PASS FAIL
ACI Provisions PASS PASS

Boudaoui 82
Example Pair #8 – High Slenderness / Sway / Low Eccentricity
The column in Example Pair #8 is in a sway frame and double-curved. Compared to
Example Pair #7, Example Pair #8 explores a shorter column with a shorter diameter and
targets a high slenderness. Also, the axial force is larger to target a low eccentricity. In
Example Pair #8, less longitudinal rebars are used with a bigger size.
Table 47 – Example Pair #8 – High Slenderness / Sway / Low Eccentricity / Double Curvature
Column Geometry
SCALE 1:14
Longitudinal Rebars, 8 – No 11 Spiral Ties, No 5 @ 2in
Height (ft) 29
Diameter (in) 17
Column Configuration
Slenderness 82 ~High Value
Sway/Non-Sway? Sway
𝐶𝑚 1.0 ~High Value
Eccentricity (in) 8 ~diameter/2
Loading Ex #8 Ex #20
𝑃 (k) 50 50
𝑀𝑒𝑖(kft) 10 30
𝑀𝑒𝑗(kft) 30 50
𝛿𝑛𝑠 2.39 2.39
Results
𝑃𝑢 (k) 190 190
𝜙𝑃𝑛 (k) 246 149
𝑀2 (kft) 114 190
𝑀𝑐 (kft) 181 301
𝜙𝑀𝑛 (kft) 234 236
Finding
Strength PASS FAIL
ACI Provisions PASS PASS
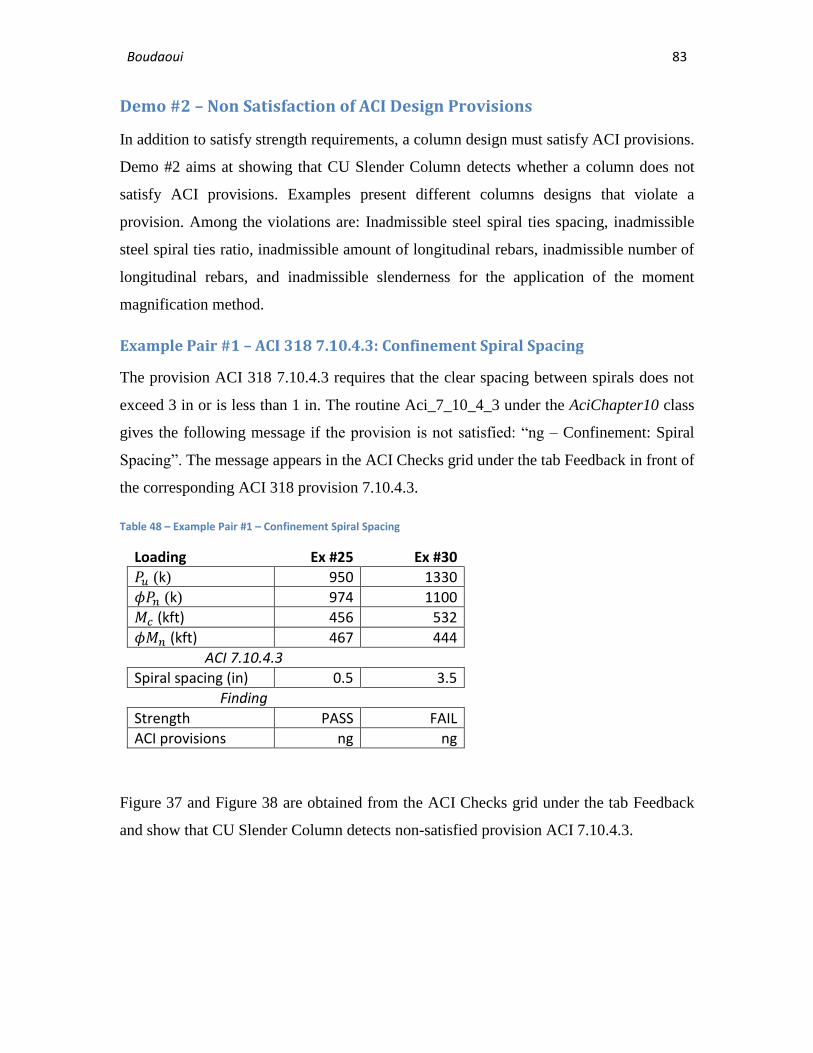
Boudaoui 83
Demo #2 – Non Satisfaction of ACI Design Provisions
In addition to satisfy strength requirements, a column design must satisfy ACI provisions.
Demo #2 aims at showing that CU Slender Column detects whether a column does not
satisfy ACI provisions. Examples present different columns designs that violate a
provision. Among the violations are: Inadmissible steel spiral ties spacing, inadmissible
steel spiral ties ratio, inadmissible amount of longitudinal rebars, inadmissible number of
longitudinal rebars, and inadmissible slenderness for the application of the moment
magnification method.
Example Pair #1 – ACI 318 7.10.4.3: Confinement Spiral Spacing
The provision ACI 318 7.10.4.3 requires that the clear spacing between spirals does not
exceed 3 in or is less than 1 in. The routine Aci_7_10_4_3 under the AciChapter10 class
gives the following message if the provision is not satisfied: “ng – Confinement: Spiral
Spacing”. The message appears in the ACI Checks grid under the tab Feedback in front of
the corresponding ACI 318 provision 7.10.4.3.
Table 48 – Example Pair #1 – Confinement Spiral Spacing
Loading Ex #25 Ex #30
𝑃𝑢 (k) 950 1330
𝜙𝑃𝑛 (k) 974 1100
𝑀𝑐 (kft) 456 532
𝜙𝑀𝑛 (kft) 467 444
ACI 7.10.4.3
Spiral spacing (in) 0.5 3.5
Finding
Strength PASS FAIL
ACI provisions ng ng
Figure 37 and Figure 38 are obtained from the ACI Checks grid under the tab Feedback
and show that CU Slender Column detects non-satisfied provision ACI 7.10.4.3.
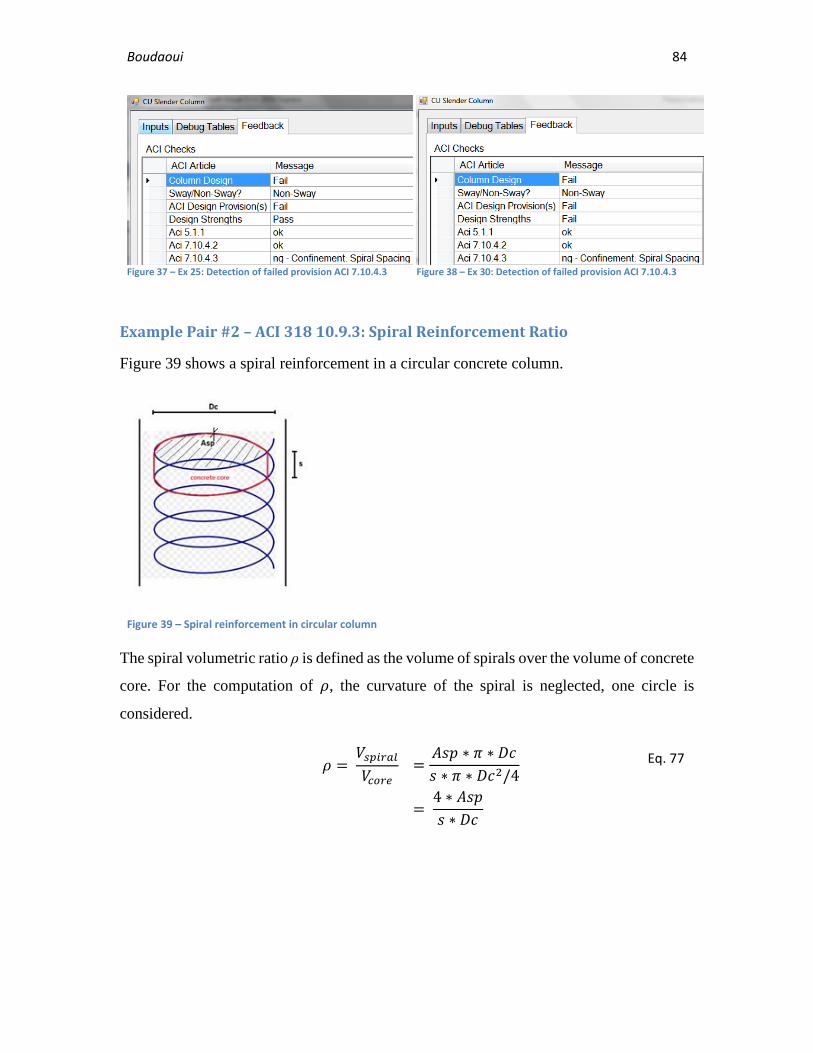
Boudaoui 84
Figure 37 – Ex 25: Detection of failed provision ACI 7.10.4.3
Figure 38 – Ex 30: Detection of failed provision ACI 7.10.4.3
Example Pair #2 – ACI 318 10.9.3: Spiral Reinforcement Ratio
Figure 39 shows a spiral reinforcement in a circular concrete column.
Figure 39 – Spiral reinforcement in circular column
The spiral volumetric ratio ρ is defined as the volume of spirals over the volume of concrete
core. For the computation of 𝜌, the curvature of the spiral is neglected, one circle is
considered.
𝜌 =
𝑉𝑠𝑝𝑖𝑟𝑎𝑙
𝑉𝑐𝑜𝑟𝑒 =
𝐴𝑠𝑝 ∗ 𝜋 ∗ 𝐷𝑐
𝑠 ∗ 𝜋 ∗ 𝐷𝑐2/4 Eq. 77
=
4 ∗ 𝐴𝑠𝑝
𝑠 ∗ 𝐷𝑐

Boudaoui 85
where:
𝐴𝑠𝑝 is the cross sectional area of the spiral
𝑠 the spacing between spirals
𝐷𝑐 the diameter of the concrete core
The provision ACI 318 10.9.3 requires that 𝜌 is larger than 𝜌𝑠, a minimum spiral
volumetric ratio specified by ACI 318.
𝜌 ≥ 𝜌𝑠 Eq. 78
𝜌𝑠 = 0.45( 𝐴𝑔
𝐴𝑐ℎ− 1)
𝑓′𝑐
𝑓𝑦𝑡
Eq. 79
where:
𝐴𝑔 is the concrete gross area
𝐴𝑐ℎ is the concrete core area
𝑓’𝑐 and 𝑓𝑦𝑡 are respectively the concrete compression strength and the transverse
reinforcement yield stress
The routine Aci_10_9_3 under the AciChapter10 class gives the following message if the
provision is not satisfied: “ng – Spiral Reinforcement Ratio”. The message appears in the
ACI Checks grid under the tab Feedback in front of the corresponding ACI 318 provision
10.9.3.
Table 49 – Example Pair #2 – ACI 318 10.9.3: Spiral Reinforcement Ratio
Loading Ex #26 Ex #31
𝑃𝑢 (k) 1045 1330
𝜙𝑃𝑛 (k) 1049 1108
𝑀𝑐 (kft) 456 532
𝜙𝑀𝑛 (kft) 458 443
ACI 10.9.3
𝜌𝑠 0.0065 0.0065
𝜌 0.0061 0.0061
Finding
Strength PASS FAIL
ACI provisions ng ng
Figure 40 and Figure 41 are obtained from the ACI Checks grid under the tab Feedback
and show that CU Slender Column detects non-satisfied provision ACI 10.9.3.

Boudaoui 86
Figure 40 – Ex 26: Detection of failed provision ACI 10.9.3
Figure 41 – Ex 31: Detection of failed provision ACI 10.9.3
Example Pair #3 – ACI 318 10.9.1: Longitudinal Rebars Ratio
The provision ACI 318 10.9.1 requires that the ratio of longitudinal rebars area over
concrete gross area does not exceed 8% or is less than 1%. The routine Aci_10_9_1 under
the AciChapter10 class gives the following message if the provision is not satisfied: “ng –
Ast”. The message appears in the ACI Checks grid under the tab Feedback in front of the
corresponding ACI 318 provision 10.9.1.
Table 50 – Example Pair #3 – Longitudinal Rebars Ratio
Loading Ex #27 Ex #32
𝑃𝑢 (k) 1045 1330
𝜙𝑃𝑛 (k) 1116 1146
𝑀𝑐 (kft) 380 1332
𝜙𝑀𝑛 (kft) 406 1148
ACI 10.9.1 𝐴𝑠𝑡/𝐴𝑔 0.99% 9.04%
Finding
Strength PASS FAIL
ACI provisions ng ng
Figure 42 and Figure 43 are obtained from the ACI Checks grid under the tab Feedback
and show that CU Slender Column detects non-satisfied provision ACI 10.9.1.
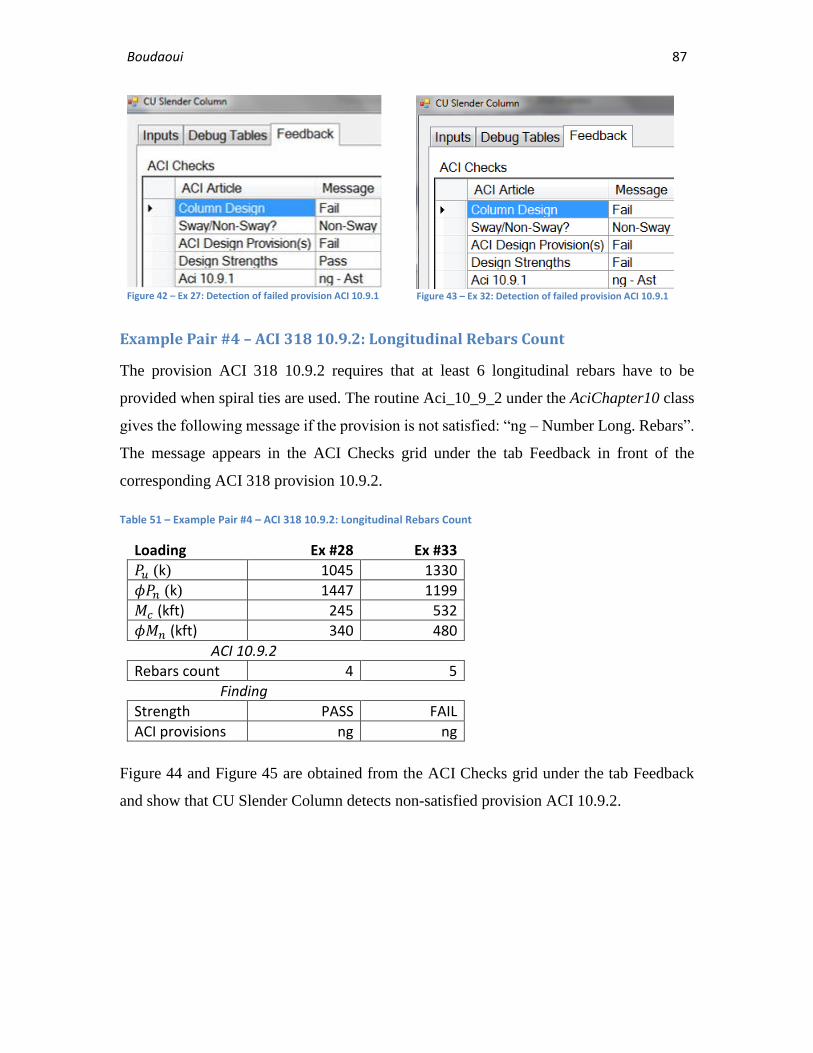
Boudaoui 87
Figure 42 – Ex 27: Detection of failed provision ACI 10.9.1
Figure 43 – Ex 32: Detection of failed provision ACI 10.9.1
Example Pair #4 – ACI 318 10.9.2: Longitudinal Rebars Count
The provision ACI 318 10.9.2 requires that at least 6 longitudinal rebars have to be
provided when spiral ties are used. The routine Aci_10_9_2 under the AciChapter10 class
gives the following message if the provision is not satisfied: “ng – Number Long. Rebars”.
The message appears in the ACI Checks grid under the tab Feedback in front of the
corresponding ACI 318 provision 10.9.2.
Table 51 – Example Pair #4 – ACI 318 10.9.2: Longitudinal Rebars Count
Loading Ex #28 Ex #33
𝑃𝑢 (k) 1045 1330
𝜙𝑃𝑛 (k) 1447 1199
𝑀𝑐 (kft) 245 532
𝜙𝑀𝑛 (kft) 340 480
ACI 10.9.2
Rebars count 4 5
Finding
Strength PASS FAIL
ACI provisions ng ng
Figure 44 and Figure 45 are obtained from the ACI Checks grid under the tab Feedback
and show that CU Slender Column detects non-satisfied provision ACI 10.9.2.

Boudaoui 88
Figure 44 – Ex 28: Detection of failed provision ACI 10.9.2
Figure 45 – Ex 33: Detection of failed provision ACI 10.9.2
Example Pair #5 – ACI 318 10.11.5: Applicability of Moment Magnification
Method
The moment magnification method is used within a specific range of slenderness. For non-
sway frames, the provision ACI 318 10.12.2 allows to ignore slenderness effects, that is
not to apply the moment magnification method if:
𝑘𝐿
𝑟≤ 34 + 12
𝑀1
𝑀2
Eq. 48
For sway frames, the provision ACI 318 10.13.2 allows to ignore slenderness effects if:
𝑘𝐿
𝑟≤ 22
Eq. 52
Also, the provision ACI 318 10.11.5 specifies that a 2nd order analysis must be applied
instead of the moment magnification method if:
𝑘𝐿
𝑟≥ 100
Eq. 80
The routine Aci_10_11_5 under the AciChapter10 class gives the following message if the
provision is not satisfied: “ng – Moment Magnification Not Applicable”. The message
appears in the ACI Checks grid under the tab Feedback in front of the corresponding ACI
318 provision 10.11.5.

Boudaoui 89
Table 52 – Example Pair #5 – Application of Moment Magnification
Loading Ex #29 / Non-Sway Ex #34 / Sway
𝑃𝑢 (k) 380 1330
𝜙𝑃𝑛 (k) 581 189
𝑀𝑐 (kft) 38 532
𝜙𝑀𝑛 (kft) 58 76
ACI 10.11.5
Slenderness 110 17
Limit 100 22
Finding
Strength PASS FAIL
ACI provisions Method N/A Method N/A
Note: N/A stands for Not Applicable
Figure 46 and Figure 47 are obtained from the ACI Checks grid under the tab Feedback
and show that CU Slender Column detects non-satisfied provision ACI 10.11.5.
Figure 46 – Ex 29: Detection of failed provision ACI 10.11.5
Figure 47 – Ex 34: Detection of failed provision ACI 10.13.2

Boudaoui 90
Demo #3 – Accuracy of Student’s Inputs
Demo #3 aims at showing that CU Slender Column detects whether student’s inputs are
accurate. A relative error between the student’s inputs and CU Slender Column outcomes
of less than 2% is tolerated. In the program, the routine CheckStudentWork under the
StudentChecks class compares the student’s inputs to outcomes computed by CU Slender
Column and generates the messages reporting to the student whether the inputs are accurate
or not.
Designs Admissible in ACI Provisions
The examples #35 and #36 explore student’s numerical values of loads and strengths that
are not accurate with satisfied ACI provisions. Examples aim at demonstrating that the
application detects a wrong value or a wrong sign and provides the correct feedbacks, either
“ng” or “bad sign”.
The numerical error is computed as a percentage of the CU Slender Column outcome:
휀 = |𝑉𝑎 − 𝑉𝑠|
|𝑉𝑎|∗ 100
Eq. 81
where: 𝑉𝑎 is the software outcome 𝑉𝑠 is the student’s input 𝑉𝑎 and Vs are any of the following values: 𝑃𝑢 , 𝑀𝑐 , 𝑒 , 𝑐 , 𝜙, 𝜙𝑃𝑛 , 𝜙𝑀𝑛 Table 53 – Examples #37 and #38 with design admissible in ACI Provisions
Software Loading Ex #35 Ex #36
𝑃𝑢 (k) 190 228
𝜙𝑃𝑛 (k) 241 145
𝑀𝑐 (kft) 174 352
𝜙𝑀𝑛 (kft) 221 224
Student’s Loading error error
𝑃𝑢 (k) 260 36.9% - ng -228 bad sign
𝜙𝑃𝑛 (k) 200 17.0% - ng -145 bad sign
𝑀𝑐 (kft) -174 bad sign 344 2.27% - ng
𝜙𝑀𝑛 (kft) -221 bad sign 231 3.13% - ng Finding ACI Provisions PASS PASS Strength PASS FAIL

Boudaoui 91
Figure 48 shows feedbacks to the student relatively to the accuracy of numerical values of
loads and strengths for Example 35.
Figure 48 – Ex 35: detection of inaccuracy of student’s numerical values of loads and strengths
Figure 49 shows feedbacks to the student relatively to the accuracy of numerical values of
loads and strengths for Example 36.
Figure 49 – Ex 36: detection of inaccuracy of student’s numerical values of loads and strengths

Boudaoui 92
Designs Inadmissible in ACI Provisions
The examples #37 and #38 explore student’s numerical values of loads and strengths that
are not accurate with non-satisfied ACI provisions
Table 54 – Examples #39 and #40 with designs inadmissible in ACI Provisions
Software Loading Ex #37 Ex #38
𝑃𝑢 (k) 190 228
𝜙𝑃𝑛 (k) 241 145
𝑀𝑐 (kft) 174 352
𝜙𝑀𝑛 (kft) 221 224
Student’s Loading error error
𝑃𝑢 (k) -190 bad sign 234 2.63% - ng
𝜙𝑃𝑛 (k) -241 bad sign 159 9.66% - ng
𝑀𝑐 (kft) 260 49.4% - ng -352 bad sign
𝜙𝑀𝑛 (kft) 215 2.71% - ng -224 bad sign Finding ACI Provision FAIL FAIL Strength PASS FAIL
Figure 50 shows feedbacks to the student relatively to the accuracy of numerical values of
loads and strengths for Example 37.
Figure 50 – Ex 37: detection of inaccuracy of student’s numerical values of loads and strengths
Figure 51 shows feedbacks to the student relatively to the accuracy of numerical values of
loads and strengths for Example 38.
Figure 51 – Ex 38: detection of inaccuracy of student’s numerical values of loads and strengths

Boudaoui 93
Chapter 5 - Summary. Further Study
Summary
First class in design of reinforced concrete structures must include design of slender
compression members since they are common components in many structures such as
buildings and bridges. Education must engage students to consider basic loads such as axial
forces and end moments as well as teach the importance of stability effects through the
consideration of slenderness effects. Education in design must allow students to function
as designers, that is, to determine the geometry of the member as well as the complete steel
reinforcement that verify strength requirements as well as design code provisions. In design
of reinforced concrete compression members, students use ACI 318 [Building, 2011] and
implement the Chapter 10 for flexure and axial loads. To support the education of students
in reinforced concrete design, educational software application, CU Slender Column, is
developed. CU Slender Column considers members that are single slender reinforced
concrete columns with circular cross section. CU Slender Column uses ACI 318 moment
magnification method to account for slenderness effects for both non-sway and sway
frames.
CU Slender Column evaluates students’ designs in two levels. First, it realizes a benchmark
study based on the students’ designs. Second, it provides feedbacks on satisfaction of ACI
provisions and on accuracy of numerical values of loads and strengths. Strength
requirements are satisfied if the column strengths exceed both axial and bending demands
and ACI provisions are satisfied if the design respects all design provisions written under
the Chapter 10 of ACI 318.
The graphical user interface of CU Slender Column is composed of two tabs. The tab Inputs
collects the student’s design as well as the values of contributions of axial force and end
moments. Three buttons, Save and Load and Compute allow the student to save the work,
to load it and to perform computations that evaluate the work and generates the feedbacks
on the design. The tab Feedback displays the feedbacks to the student on ACI provisions
and provides messages on accuracy of student’s numerical values of strengths and loads.

Boudaoui 94
CU Slender Column is validated with a set of 38 examples. Those examples aim at
exploring a wide range of design situations to provide a strong and comprehensive
demonstration of the software performance. The first set of examples is made of 24
examples with columns either passing or failing strength requirements. To show that CU
Slender Column is able to consider a wide range of column features, the examples explore
variations in column geometry, reinforcement ratio, loadings, curvature and type of frame.
The second set of examples is made of 10 examples with columns failing in ACI provisions.
Five ACI design provisions are explored. The third set of examples is made of 4 examples
touching on inaccurate student’s numerical values of strengths and loads.
CU Slender Column is used as a benchmark in the evaluation of students’ designs. It is
paramount to demonstrate that the outcomes computed by CU Slender Column are
accurate. An independent study using Microsoft Excel 2013 is performed to evaluate the
accuracy of the computations of the software. Evaluations on several outcomes such as
demands, magnification factor and strengths show that CU Slender Column provides
accurate outcomes and can be used as a benchmark for evaluation of students’ designs.

Boudaoui 95
Future Work
CU Slender Column aims at improving the evaluation of students’ projects in design of
slender reinforced concrete columns. By using this application, the teacher can quickly
evaluate in detail a large number of projects, which is more efficient than the method of
evaluation by hand. This traditional method is time consuming and more likely to miss
some errors. CU Slender Column achieves the goal of providing students a complete check
of the design by pointing out the errors and providing the remedies. The report on the
design is done by the use of feedbacks which are efficient because they tend to prod the
students in the discovery of a design passing strength requirements and complying with
ACI provisions. However, the application is restrained in several levels and it is possible
to enhance the educational performance of the software to allow students to work on more
complex and more practical designs. Further studies are possible on inputs and feedbacks.
The variables input by the student to characterize the design and the loadings can be
increased to consider more elaborate designs.
For column geometry, CU Slender Column only deals with circular cross sections but can
expand to rectangular and irregular cross sections. It can propose a library of three or four
predefined cross-sectional shapes usually used for compression members in bridges and
buildings. To find those shapes, a large panel of recently built concrete bridges and
buildings across the United States can be studied and then the most common shapes are
selected.
For spiral ties reinforcement, CU Slender column only considers a single spiral but it can
consider circular reinforcement as an alternative. The transverse reinforcement does not
influence the axial and bending strengths of the column but does play a role in case of shear
design. The application should allow the student to create a pattern for the transverse
reinforcement along the member so that it provides just enough steel to withstand the shear
demand along the column.
For types of end conditions, CU Slender Column can either let the student input the value
of effective length factor beforehand computed using the alignment charts in case of a

Boudaoui 96
column within a frame, or propose several combinations whether the column ends are
fixed, hinged, rollers or free in case of a single column.
For the loadings, CU Slender Column only considers axial forces and end moments. The
software can expand to biaxial bending moments to allow the student to consider a column
within a 3-Dimensional (3D) frame. If biaxial bending moments are considered, two
different effective length factors, one for each bending direction, have to be defined. Also,
it would be interesting to take into account distributed lateral loads such as wind and ground
excitation due to earthquake for design in areas with high seismicity.
Finally, since students may use a structural engineering software to get values of loads
contribution in case of sway and non-sway frames, it would be useful to enable CU Slender
Column to accept outputs files generated by structural analysis software. This compatibility
would save time to students because they would not type the values of loads contributions
in the Section Forces grid.
The feedbacks aim at reporting accuracy of the student’s work as well as detecting design
flaws. Improvements are possible to make those feedbacks more efficient.
Design error can be ranked according to its importance in the context of education. A
design error can either be evaluated as critical, weak or inaccurate. A critical error signifies
a design that does not satisfy basic design rules affecting the column strengths and the
disposition of the steel reinforcement. Thus, the critical parameters the student has to work
on are the minimum number of reinforcement rebars, a feasible layout of reinforcement
rebars and the dimensions of the cross section to withstand the loads. A weak design
signifies a design that does not satisfy strength requirements. Thus, the parameter the
student must review is the area of steel reinforcement. An inaccurate design signifies a
design which values of factored loads and strengths are not accurate. Thus, the student must
review the computations of loads and strengths.
Evaluations of the design can be performed throughout the student’s work and detects
design flaws early in the design process to avoid waste of effort by the student. For instance,
the design process can be split into several important steps: Computation of factored loads,
layout of steel reinforcement, computation of magnified moments … Then, when the

Boudaoui 97
student achieves a step, he can ask for a check and the software will provide feedbacks on
what he has achieved.
Students must be educated regarding efficiency of material use. The student’s design can
be checked for material use by performing an optimal design and comparing the quantities
of steel and concrete required in both optimal and student’s designs.
Finally, for evaluation of intermediate outcomes obtained by the student, it is helpful to tell
the student whether those outcomes are “consistent” with the starting inputs. For instance,
an error in the computation of the eccentricity demand 𝑒𝑢 leads to an error for 𝑐, then an
error for strengths. The student must be able to see that even though 𝑒𝑢 is wrong, the
computation of strengths, for example, are “consistent”. Thus, the student can better point
the flaws in the computations and spend time in computing only the wrong values.
To evaluate the educational efficiency of the software application, students’ evaluations
are collected by the professor at the term of each semester. Students will be asked to give
their impressions regarding the use of the software and the relevance of the feedbacks.
Those impressions will be used to adjust the software objectives and features in order to
become a valuable educational tool in design of reinforced concrete structures.

Boudaoui 98
REFERENCES
1. American Concrete Institute. (2012). The reinforced concrete design manual in
accordance with ACI 318-11. 8th ed. pp 119-145.
2. Chan, S.L. (2009). Guide on second order and advanced analysis of structure.
Nonlinear Integrated Design and Analysis software for structure. 2nd Version.
41p.
3. Nilson, A.H., Darwin,D., and Dolan,C.W. (2010). Design of Concrete Structures.
14th ed., McGraw-Hill.795p.
4. Salmon, C. G. Johnson, J. E. (1990). Steel Structures: Design and Behavior. 3rd
ed., Harper Collins. 1086p.
5. Saatcioglu, M. (2012). Reinforced concrete design manual in accordance with
ACI 318-11. American Concrete Institute. pp. 171-190.
6. Wytroval, T. Tuchscherer, R. (2013). Design of Slender Concrete Columns.
NCSEA/CASE/SEI. Structure Magazine. pp. 10-13.
7. Beeby, A. W. Narayanan, R. S. (1995). Designers’ handbook to EuroCode2: Part
1.1: Design of Concrete Structures. Amer Society of Civil Engineers. 253p.
8. Moss, R. Brooker, O. (2006). How to design concrete structures using Eurocode
2. The Concrete Centre and British Cement Association. pp. 35-42.
9. SAP2000 Analysis. Computer & Structures Inc.,
www.csiamerica.com/sap2000/analysis viewed Sept. 2013.
10. Concrete Columns 8.xx-Dlubal Software. Dlubal Software GmbH,
http://www.dlubal.com/concrete-columns-8xx.aspx viewed Sept. 2013

Boudaoui 99
11. Concrete Column Design – ASDIP Structural Software. ASDIP Structural
Software. http://www.asdipsoft.com/products/concrete/columns/ viewed Sept.
2013.
12. Technical Specification – Digital Canal. Digital Canal.
http://digitalcanalstructural.com/concrete-column-design/technical-specifications/
viewed Sept. 2013.
13. Reinforced Concrete Column Wall, Pile & Pier Design Software.
STRUCTUREPOINT.http://www.structurepoint.org/soft/software-
profile.asp?l_family_id=40 viewed Sept. 2013.
14. Advance Concrete: Reinforces Concrete Design Software. GRAITEC.
http://www.graitec.com/en/ac.asp viewed Sept. 2013.
15. cColumn. Computations & Graphics, Inc. http://www.cg-
inc.com/cgiCColumn.aspx viewed Sept. 2013.
16. GSA Building. Oasys Limited. http://www.oasys-
software.com/products/engineering/gsa-building.html viewed Sept. 2013.
17. ConCrete(Plus). BuildSoft. http://www.buildsoft.eu/fr/product/concrete-plus
viewed Sept. 2013.
18. Building Code Requirements for Structural Concrete and Commentary. (2011).
American Concrete Insitute, ACI 318-11. 503p.
19. Virtual Laboratories for Reinforced Concrete Education.
http://www3.nd.edu/~concrete/java/ viewed Sept. 2013.

Boudaoui 100
20. Reinforced Concrete Design Education Module.
http://www.cdc.gov/niosh/docs/2013135/pdfs/Reinforced%20Concrete%20PtD%
20Module.pdf viewed Sept. 2013.
21. Urgessa, G. S. (2011). Incorporating MATLAB® modules in reinforced concrete
design instruction. Comput. Appl. Eng. Educ. Volume 21. Issue 4.
doi: 10.1002/cae.20547.
22. Al-Ansari, M. S. and Senouci, A. B. (1999). Use of Mathcad as a teaching and
learning tool for reinforced concrete design of footings. Comput. Appl. Eng.
Educ. Volume 7. Issue 3. pp. 146-154. doi: 10.1002/(SICI)1099-
0542(1999)7:3<146::AID-CAE2>3.0.CO;2-8.
23. Katsanos, E. I., Taskari, O. N. and Sextos, A. G. (2011). A Matlab-Based
Educational Tool for the Seismic Design of Flexibility Supported RC Buildings.
Comput. Appl. Eng. Educ. Volume 21. Issue 4. doi: 10.1002/cae.20568.
24. Canakci, H. (2007). Pile Foundation Design Using Microsoft Excel. Comput.
Appl. Eng. Educ. Volume 15. Issue 4. pp. 355-366. doi: 10.1002/cae.20206.
25. Wang, N. and Adeli, H. (2012). Web-based tutor for interactive design of single-
span and continuous steel beams. Comput. Appl. Eng. Educ. Volume 20. Issue 2.
pp. 383-389. doi: 10.1002/cae.20474.
26. Adeli, H. and Kim, H. (2000). Web-Based Interactive Courseware for Structural
Steel Design Using Java. Computer-Aided Civil and Infrastructure Engineering.
Volume 15. Issue 2. pp. 158-166. doi: 10.1111/0885-9507.00180.