Development of Economic Instruments for the Indonesian...
189
Development of Economic Instruments for the Indonesian Industry to Reduce Emissions of Greenhouse Gases
Transcript of Development of Economic Instruments for the Indonesian...

Development of Economic Instruments for the Indonesian Industry
to Reduce Emissions of Greenhouse Gases

i
Table of Contents
Table of Contents i
Introduction 1
Part I Moderation Process to identify Fiscal and Economic Instruments for the
Indonesian Industry to reduce Emissions of Greenhouse Gases
1 Introduction 7
2 Promoting Industrial Energy Savings in Indonesia: Main Challenges 9
2.1 Generic challenges for energy efficiency policy 9
2.2 Challenges for EE-policy that are specific for Indonesia 10
2.3 Role of local governments 11
3 Main Policy Instruments for Industry in Indonesia 13
3.1 Matrix for fiscal, economic and finance instruments 13
3.2 Fiscal and economic instruments – a few observations 14
3.3 Financial sector engagement instruments – a few observations 15
3.4 Challenge funds for low-carbon innovations 17
4 Potential Packages of Instruments 18
4.1 Cement industry 18
4.2 Pulp & paper 19
4.3 Textile industry 21
5 Follow-up 23
5.1 Working Groups for fixing Voluntary Agreements 23
5.2 Theory-based M&E 25
Annexes 26
Annex I Generic Framework for EE&RE Policy Interventions 26
Annex II Evidence based versus faith based policy making 27
Basic principles 27
How do you find evidence? 28
How do you prioritize public intervention for EE? 28
Forecasting the future 29
Choosing the right analytical approach for the design of an
instrument
33
Annex III Fuel subsidies and energy poverty 36
Annex IV Technology Policy: Promotion of Green Growth 40
Annex V Bappenas/GIZ Capacity Building and Stakeholder 42

ii
Workshops
Annex VI List of Interviews 44
Part II Economic Instruments for the Indonesian Industry to Reduce Emissions of
Greenhouse Gases
1 Introduction 46
1.1 Background 46
1.2 Purposes and Objectives 47
1.3 Structure and Outline 48
2 Mitigation of GHG Emissions and Economic Instruments in the
Industry Sector
49
2.1 Mitigation of GHG Emission in the Industrial Sector 49
2.2 Definition of Economic Instrument 52
2.3 Economic Instrument Specific for Industrial Sector 53
2.4 Economic-Wide Instruments 55
2.5 International Examples 58
3 Current Condition in Indonesia 64
3.1 Key Stakeholders 64
3.2 Industrial Sector in Indonesia 70
3.3 Regulation and Policy Framework 76
3.4 Existing Economic Instruments 80
4 Stock Taking and Gap Analysis of Economic Instruments 84
4.1 Review of Regulatory and Policy Framework 84
4.2 Review of Economic Instruments and Industry Practice 85
4.3 Regulatory and Policy Gap 85
4.4 Industry Potential Gap 87
4.5 Economic Instruments Gap 92
5 Proposed Economic Instruments for Indonesian Industries 97
5.1 Criteria of Economic Instruments 97
5.2 Policy Alternatives 100
5.3 Potential Economic Instruments 104
5.4 Recommendation 105
References 107
Annexes 109
Annex 3.1 Total Emission by Fossil Fuel Source 109
Annex 3.2 Indonesia Emission Intensity: Average Annual Growth Rate
Between 1994-1999, and 1999-2004
109

iii
Annex 3.3 Top Priority Individual Industry Sector 110
Annex 4.1 MOI Energy Policy for Iron and Steel Industry 110
Annex 4.2 MOI Energy Policy for Pulp and Paper Industry 110
Annex 4.3 IPCC List of GHG Emission Particles 111
Part III Private Sector Engagement in GHG Emission Reduction Activities in
Indonesia – An Empirical Study
List of abbreviations 113
1 Background 114
2 Objectives and methodology 115
3 Results 118
3.1 Climate change awareness 118
3.2 Existing activities 119
3.3 Motivations and drivers for engagement 121
3.4 Barriers and challenges 122
4 Support measures and incentives 125
5 Conclusions and recommendations 127
References 130
Annexes 131
Annex I Interview guideline 131
Round 1 131
Round 2 134
Annex II Request letter 139
a) Example round 1 139
b) Example round 2 141
Annex III Lessons learnt from the empirical research process 143
Annex IV Interview summaries 145

1
Introduction
The Government of Indonesia has committed to reduce the country’s GHG emission in 2020 by
26% with national resources, and up to 41% with international support to the mitigation
efforts, benchmarked to the emission level from a business as usual (BAU). To stipulate the
implementation of this commitment, a National Mitigation Action Plan on Greenhouse Gas
Emission Reduction/Rencana Aksi Nasional Penurunan Emisi Gas Rumah Kaca (RAN-GRK) is
developed. The RAN GRK document will be followed by the development of internationally
accepted “Nationally Appropriate Mitigation Actions” (NAMAs) according to the United
Nations Framework Convention on Climate Change (UNFCCC). NAMAs refer to a set of policies
and actions countries undertake as part of a commitment to reduce greenhouse gas emissions.
Industrial activities are known as contributors to greenhouse gas (GHG) emissions. Sources of
GHG emissions from the industry sector are energy usage, industrial processes and industrial
wastewater. Thus, the industrial sector, as one of the focal sectors under RAN-GRK, plays a
crucial role in reducing GHG emissions for climate change mitigation.
The implementation of potential mitigation actions in the industry sector clearly requires
appropriate regulatory framework conditions in place. The right mix of policies and
instruments is needed to encourage the respective industry players to be actively involved in
the national efforts to reduce Indonesia’s GHG emissions. Economic instruments would then
provide the necessary incentives for the industrial companies to implement mitigation actions.
With regard to this, the Government of Indonesia (GOI) through its National Development
Planning Agency (BAPPENAS) would like to develop economic instruments especially for the
industry sector. The German-Indonesia technical cooperation programme on ‘Policy Advice for
Environment and Climate Change’ (GIZ PAKLIM) is committed to support in the development
of such economic instruments. This engagement and activities are in line with PAKLIM’s
overall objective to support relevant Indonesian stakeholders from the public and private
spheres in the development and implementation of climate change strategies and instruments.
For the development of such economic instruments, various activities are needed to provide
the basis for selecting those instruments suitable fort he Indonesian industries and subsequent
to that for further integration into policy, i.e. the activities should include the review of
economic instruments and mitigation policies for industries as generally existing, an outline of
exemplary implementation and best practices from other countries around the globe,
stocktaking of the current situation in Indonesia and a related gap analysis, as well as

2
involvement and exchange with relevant public and private stakeholders regarding the issues
at hand.
The present report aims to present the results of the current activities done by PAKLIM and
Bappenas in this context. The report is structured into three parts according to the different
activities undertaken so far. These are:
1. Moderation process to identify economic instruments for the Indonesian industry to
reduce GHG emissions by Mr. Wolfgang Mostert (international consultant). The
mission was carried out between February 10-25, 2011. This part of the report focuses
on the promotion of national manufacturing and servicing of low carbon technology,
evidence based policy making, observations from own interviews conducted, and
recommendations for next steps. Finally, also potential packages of intruments for the
Indonesian industry sector are elaborated in this part of the report. These focus on
three of the GOI’s focal sectors for mitigation: cement, pulp and paper, and textiles.
2. Review study on feasible economic instruments for reductions of GHG emissions in
Indonesia by Mr. Ikhsan Modjo and team (national consultants). This part of the report
presents identified key stakeholders, the wide spectrum of economic instruments as
generally existing and specifically for the industry sector, best practices and good
policies from other relevant countries, the current condition of the Indonesian
industries and the existing regulatory framework, a gap analysis of regulatory and
policy issues, a gap analysis of economic instruments and industrial practice, as well as
criteria for selecting suitable economic instruments.
3. Empirical study on private sector involvement in climate change activities in Indonesia
by Ms. Maren Breuer (GIZ advisor). This part of the report outlines the results of a
series of interviews that were conducted with representatives of selected companies
operational in Indonesia. It discusses the industries’ current level of awareness
concerning GHG emission related issues and existing policy initiatives, their activities
to reduce GHG emission and related barriers and challenges faced by industries, as well
as recommendations/ wishes for improvements voiced directly by the ‘demand side’ of
any economic instruments.
Overall recommendations and steps ahead
The above outlined activities have provided valuable insights concerning the conditions
surrounding the Indonesian industry sector, especially on the relevant regulatory framework,
related economic instruments, as well as the industries‘ own awareness on climate change and
their current and potential future activities towards reducing GHG emissions.

3
Based on the analyses made during and as a result of these activities, related discussions and
the evidence at hand, certain overall conclusions and central recommendations can be made
that are to serve as valuable input for choosing from the wide array of possible approaches and
instruments a confined number to follow up in more depth and for suggesting concrete next
steps for a joint development process between GIZ PAKLIM and GOI/BAPPENAS:
• Firstly, it is recommended that instead of the development of economic instruments as
individual instruments, integrated packages of instruments should be designed. Here,
since considerable differences exist depending on the different industry sectors, attention
must be paid to these sector specifics and the respective packages have to be carefully
targeted.
• While in the long run it is certainly all major industries that are to be covered, it is
suggested here to first start by focusing on one of the sectors that have already been
chosen by the GOI and to engage in deeper discussions with relevant stakeholders there,
collect the required data, engage in economic modeling, etc. The suggested pilot sector for
this is the cement industry. Several reasons underline this choice:
o Firstly, it is here where good data (energy consumption, GHG emissions) are
already available, which are a necessary prerequisite for establishing the baseline
in order to implement any incentives and/ or disincentives.
o Also the readiness of the industry is important and largely given here.
o Besides, as part of PAKLIM’s other ongoing activities and objectives specifically in
its industry component, a process has already been started on developing so called
voluntary partnerships agreements (VPA) between the Indonesian industries
and the Ministry of Industry (MoI). This idea of voluntary agreements, which has
also been recommended in the present report, is currently already well accepted
on the part of the MoI, which now envisages starting concrete discussions with the
cement industry as the first target group. In this context then, such voluntary
agreements clearly require concrete instruments and incentive schemes from the
public side to trigger actions from the respective industry actors. Hence, to
formalize such voluntary approaches for the industry sector, it seems highly
beneficial to closely couple the development of economic instruments with the
option of a VPA between the government (MoI) and the cement industry.
• In line with this sector-specific approach, from synthesizing the more detailed suggestions
and data in the three present reports, a pre-selected list of potentially valuable
approaches and instruments for such a particular ‘cement package’ are presented in the
table below.

4
# Approach/ instrument Details (from the reports)
1 Regulations/ standards:
Fly-ash as blending
material
Changing government regulations that unnecessarily complicate
the introduction of fly-ash as blending material. Regulations for
transporting fly ash from generator to plant are tough; this
makes fly ash more expensive than clinker. Supporting
measures that are already being undertaken include new
cement standards and recycled materials content standards.
2 Regulations: Usage of
hazardous waste as fuel
Adjustments in regulations to facilitate the use of toxic waste
materials as fuel (e.g. a solid information campaign could be
implemented, including arranged visits of journalists,
representatives from the Ministry of Environment and from
municipal and district authorities to municipalities in Europe
that have introduced effective use of toxic and municipal wastes
as fuel without detrimental effects on the local environment and
with full acceptance of the neighboring population).
3 Municipal waste
management: Establishing
local PPPs
Encouragement of public-private-partnerships between
subsidiaries of cement companies and municipal governments
for setting jointly owned firms to engage in municipal waste
sorting and treatment. The co-financing municipality could
presumably seek funds from the Climate Change Trust Fund
(ICCTF) to finance its share of the company’s equity capital.
4 Positive technology list for
energy efficiency
investments
Introduction of a positive list for EE-investments to be eligible to
reduced import duty and reduced VAT and access to soft loans.
It could comprise: (i) burning waste in the kiln; (ii) transformers
to regulate the speed of the fan; (iii) transporting alternative
fuel to the kiln, (iv) support to buy equipment to measure CO2 on
the stack.
5 Tax incentives on large
investments (esp. fuel
switching)
Due to the large size of the investment in fuel-switching, and
because of the fact that the company’s overall are financially
strong (providing a tax base!) a 100% depreciation (tax write
off) in year 1 on investment would be a powerful economic
incentive for the companies. Alternatively, a 50% write off in
year 1 and a 50% in year 2 could be contemplated.
• Drawing on these suggestions, the first concrete activity proposed for detailing these
ideas is to set up a working group to work on processing the suggested instruments. The
members of the working group would come from relevant ministries (e.g. Bappenas, MoI,
etc.). At the same time, a workshop/ focus group discussions (FGDs) bringing together the
relevant actors from the industry itself – including in particular also the cement association
– has to be arranged. The objective of these interactions would be to more closely identify
the relevant stakeholders on both the public and the private side, to enquire on the process
within the GOI required to move forward, and to assess the feasibility of the suggested
instruments.

5
• Furthermore, apart from this recommended industry specific “track”, the reports and
insights provided also point to the fact that in order to achieve real emission reductions
from already existing facilities and/ or to pave the way for fast growing economies and
related planned industrial installations/expansions like in Indonesia towards a low-carbon
development, approaches and instruments targeting in particular the high energy
consumers/GHG emitters independent of industrial sector are advisable.
• In line with this, the interviews conducted here have shown that the respective national
industries currently merely engage in those energy efficiency measures that are directly
cost beneficial for them. The potential and also financial means for doing ‘more’ and doing
so faster are there, but currently there is no real pressure for these companies to really do
so. Here then, while a sophisticated emissions trading system like in the EU would
certainly be too much given the level of development in Indonesia, it is recommended to
have a closer look at other cross-sectoral options for targeting the high emitters, e.g. by
setting certain emission limits (caps) or considering the introduction of a tax on
carbon, emissions or energy.
• To further work on these recommendations, it is crucial then to follow the process
required by GOI to bring these instruments into policy. Thus, it is necessary to identify the
‘champion’ in the GOI who would support this policy direction and required approaches for
initiating such a process.
• Considering the process required, a possible activity here could be to initiate an expert
study, e.g. providing comparisons and experiences from other countries on such taxes and/
or caps, and evaluating the applicability (also through concrete economic modeling) for the
Indonesian industry sector. In this regard, GIZ has already considerable experiences and
expertise in the field of environment fiscal reforms in diverse developing countries, which
could be tapped for the present purposes.
• Apart from and even before initiating this kind of expert study, as part of identifying a
‘champion’ within the GOI and relevant public stakeholders, it is here where the Ministry of
Finance (MoF) will surely have to be closely involved from the very beginning on.

6
Part I
Moderation Process to identify Fiscal and
Economic Instruments for the Indonesian
Industry to reduce Emissions of Greenhouse
Gases
By:
Wolfgang Mostert

7
1 Introduction
The Government of Indonesia has committed to reduce the country’s GHG emission in 2020 by
26% with national resources, and up to 41% with international support to the mitigation
efforts, benchmarked to the emission level from a business as usual. A NAMA for the industry
sector has been prepared, with particular focus on the two energy intensive industries:
cement, pulp & paper - and the textile industry, which because of its share in industrial GDP is
one of the largest industrial energy consumers. To implement the mitigation actions, the
industry sector needs regulatory framework conditions to provide sufficient incentives for the
companies to be involved in the national effort to reduce GHG emissions.
The GIZ-financed PAKLIM program contracted Wolfgang Mostert, in the following referred to
as “the consultant”, to moderate a stakeholder workshop in Jakarta on fiscal and economic
instruments to reduce energy consumption in industry; the objective being the identification
of instruments that could be applied. The consultant prepared a proposal for the execution of
the moderation workshop as part of the preparation of the contract process: a round of
individual consultations followed by the moderated stakeholder workshop.
The clients were Bappenas, the agency for national development planning, which develops
policy initiatives, including financial and economic instruments; and Ministry of Industry which
proposes the related instruments to Bappenas. Bapenas identified three industries as the most
important for the assignment to focus on: the cement industry, the pulp and paper industry
and the textile industry.
The consultant visited Jakarta (including a short visit to one municipality in the suburbs of
Jakarta) from February 10 to 25. Following the wishes of Bappenas, the program was modified
to include a capacity building workshop for civil servants on energy/low carbon policy making
slightly (February 23), before the stakeholder workshop (February 24). A wish by the KADIN
(Indonesian Chamber of Commerce) for a separate energy/low carbon policy instruments
discussion workshop for private sector participants, coming mainly from the “green finance”
community, was accommodated also (February 25). Annex V provides the agenda for the
workshops on February 23 and 24. The program of visits is found in Annex VI.

8
Director Mesdin Simarmata of Bappenas asked for this report to concentrate on four issues: (i)
promotion of national manufacturing and servicing of low carbon technology, (ii) evidence
based policy making, (iii) observations from interviews, (iv) recommended next steps.
The consultant would like to express his sincere gratitude to Director Mesdin, his staff and
colleagues in other public and private organizations for the valuable time and insights they
provided during the mission; and to Mr. Heiner von Luepke and his colleagues at GIZ/PAKLIM
for superb logistical assistance. To all also thanks for friendly, good spirits.

9
2 Promoting Industrial Energy Savings in Indonesia: Main Challenges
2.1 Generic challenges for energy efficiency policy
Why is the realisation of financially viable EE-potential so difficult to achieve in energy policy?
The short answer is: “Contrary to popular perception, strengthened by the international
McKenzie-curves of the cost of carbon-mitigation technologies, there are no low-hanging fruits
in energy efficiency ready to be plucked”.
Energy intensive industries, unless they operate in very oligopolistic environments, are energy-
efficient because being energy efficient is a core competence for surviving in the industry.1 For
these industries, a switch to low-carbon technology is not a matter of identifying EE-potential
in the existing production process. It requires changes in the production process itself,
involving fuel-switching and/or changes in the use of key raw materials. The cement and the
pulp & paper industries are energy intensive. In non-energy intensive industries, it will always
be possible to identify financially viable energy saving opportunities, as energy is a support
activity, which receives no more management attention than the others. To be efficient and
successful, individual agents try to maximise their portfolio of interventions in a way that
maximises overall efficiency and effectiveness; not maximum efficiency in a single area. For
auxiliary and support activities, the rule of thumb applied by efficient management is that one
can achieve 80% of achievable results with 20% of the effort which is required to achieve
100% efficiency in the area. Here, the challenge for implementation of EE-measures is that
1 The definition of energy intensive varies. But energy expenditure accounts for more than 10% of production costs.
Intensity of Management Effort/Attention(from ”100%” to 20%/80% rule)
Core Activities & Competencies
Support Activities
Auxiliary Activities
(Security, gardening, cleaning,
catering)
(in energy-intensive industries , EE is
part of core competences)
(e.g. accounting, call center, IT,
bill ing&invocing, energy in non-
energy-intensive industries)

10
financially viable EE-investment opportunities compete for management attention with
equally viable investment opportunities in other areas. For the textile industry, the costs of
energy are not insignificant, but amount to around 6-8% of production costs “only”.
The chart below illustrates two key points.
Change in Ambitions for EE when switching
to Integrated Climate & Energy Policy
Market delivered potential
Technical potential
Economic price potential
(internalized CO2-prices)
Financial price potential
Target for integrated climate &
energy policy
Economic price potential
(incl. domestic environmental)
Source: Mostert
One is the point made above about financially viable energy saving measures in commercial
buildings and in industrial process not being fully realised.
The other is the expansion of the “economic viability frontier” for new energy policy initiatives
as climate policy goals are incorporated into energy policy. Policy initiatives that before
inclusion of the economic value of climate benefits were not considered to be economically
viable, can pass the economic viability criterion once climate benefits are added to the
equation. It means a deepening in the gap between private ambitions for EE and policy
ambitions for EE. Sooner or later this necessitates the adoption of more “fundamentalist
policies”. In the medium term, as we get closer to 2020, Indonesia will not escape that fact.
2.2 Challenges for EE-policy that are specific for Indonesia
In Indonesia, the promotion of EE in industry (and in the economy in general) faces two
serious obstacles.
One is the subsidization of fossil fuels and of electricity. The subsidization of fossil fuels is the
overriding obstacle. It increases the gap between financial viability and economic viability,
and thus, the distance between private and public EE-ambitions. The Government is aware of
the need to move to full-cost pricing of fossil fuels and of electricity. Whereas households,

11
public transportation and small scale industries still get full subsidy, most larger industries are
paying close to full-cost prices for their energy consumption. The Ministry of Finance has
defined a roadmap until 2015 to eliminate energy subsidies. PLN is announcing increases in
its electricity prices. They are met with the usual outcry from industry. Indonesia has its own
coal mines, the output of which is sufficient to cover national demand and is prices below the
cost of comparable internationally traded coal. But the cost of Indonesian coal price index is
linked to the international price index for coal. But the Government faces the political-social
obstacles to the removal of subsidies; the increase in world food prices on low-income
households intensifies the political problem.
The other is the lack of political willingness to impose EE on industry (using the stick). This is
not a bad policy. The Ministry of Environment insists that it wants to promote clean
production as something positive to strive for and change the mentality of its staff away from
equating pollution with regulation; to get them into the mindset that assistance to industries is
better than blaming. But the absence of sticks reduces the range of instruments to be used and
limits the effectiveness of others. For example, Bapenas is strongly interested in testing
voluntary EE-agreements signed between the industry associations and the Government as a
primary instrument for accelerating EE in the three industries. However, the lack of a threat to
impose economic sanctions or EE-standards in case of underperformance will limit the
effectiveness of voluntary agreements as a policy instrument: it reduces peer pressure within
the industry!
2.3 Role of local governments
It is well-known world-wide that the shift to low-carbon economies requires effective
participation by local Government in planning and implementation. In Indonesia, the
Governance structures for making this feasible are slowly evolving under the Government’s
devolution policy: authority in a range of areas is being shifted to local Government. Permits
for foreign companies used to be issued by the Bureau for Investment; this authority is being
shifted to the Provincial Governments.2 Municipalities handle SMEs. Bekasi Municipality, a
suburb of Jakarta, has 2.5 million Inhabitants and around 80,000 SMEs of which 8,000 are
assisted by the municipality’s Office for Industry. Before 2009, office gave equipment directly
to SMEs. Now the Office’s activities are limited to capacity building in design and productivity
improvement.
2 As written, the Governance system is evolving: presently, for example, the municipalities are not copied the authorizations issued by Provincial Government.

12
Indonesia has 520 districts. The local Governments are the responsible environmental
managers; they monitor compliance with Government standards and regulations. In Bekasi,
the Office of Environment undertakes that task. Ministerial Decree 33-2009 obligates local gvt
to assist industries in cleaner production and to monitor their performance; local
Governments need capacity building for this. The national regulations on solid waste
management are strict and the Offices try to help companies comply. Licenses for hazardous
waste are issued for five activities: (i) waste generation, (ii) transport, (iii) collection, (iv)
processing/treatment, (v) users.
The Government has created an Environmental Trust Fund to complement the existing sources
of funds for local Governents provided from the Government budget and from loans/grants
given by development partners, inter alia KfW. A key objective of the Fund is to provide
financial resources to stakeholders who cannot access finance. Indonesia has 40 million
SSMEs, which are an important source of pollution. They require flexible interventions,
support schemes for them will have to be tailored. The Fund will enable the municipalities to
plan multi-year activities. Sources of funding will be flexible, including SCR-(social corporate
responsibility) funds from companies.
Within the support policy of the Ministry of Environment, subsidies and grant programs for
municipal waste management figure prominently. A goal of the Ministry is to get waste
collectors and waste recycling facilities to separate the waste into at least three big groups (i)
dry waste like plastic and paper, (ii) waste with organic – make this waste for fertilizers, (iii)
mix of everything – chop it into a small size and send it to firing.
Municipalities, in collaboration with local NGOs, can play a role in evaluating the use of CSR for
cleaner production. The two conventional criteria for use of CSR are (i) charity and (ii)
assistance to making local people becoming independent (by giving seed-money). But some
believe that a company can install cleaner technology and claim it as CSR.

13
3 Main Policy Instruments for Industry in Indonesia
3.1 Matrix for fiscal, economic and finance instruments
The matrix below gives an overview of potential instruments divided by the three categories:
fiscal, economic and financial (all three are ‘economic’); and according to the three targets for
support instruments: investment, cost of operation, revenue generation. Almost all are reward
instruments, not penalties.
Table 1: Fiscal, Economic and Financial Instruments for Energy Efficiency in Industry
Cost of Investment Cost of Operation Revenue Generation Fiscal Instruments
Exemption from import duty Exemption from VAT and excise taxes Accelerated tax write-offs (100% or 50%/50%) on clean technology Tax rebates to firms meeting specific targets
Fuel taxes (on energy content) Carbon taxes (with or without refunds for implementation of EE-measures)
Economic Instruments
Subsidised energy audits Subsidised loan guarantees Subsidised interest rates Ex-ante investment grant Ex-post bonus payment for results from investment Investment grant equal to savings by MoF on subsidies to fossil fuel
Subsidised training in EE Linking payment for fuels & electricity to efficiency of production White tradable certificates (cap & trade)
Pollution levies (charges for disposal of hazardous waste) CERs
Financial Instruments
Loans with longer tenor Loan guarantees Local Government co-finance of investments in waste management firms State supported ESCOs Green bonds
Source: Mostert
The distinction between fiscal, economic and finance instruments is artificial in the sense that
all three are economic and that all three intend to leverage private finance for EE-investments.
There is widespread recognition, also in Indonesia, that integrated packages of measures, not
individual instruments, are capable of generating results.3 In accordance with the
Government’s emphasis on voluntary actions, positive economic instruments play a prominent
role in environmental legislation and policy making. The Environmental Act 32-2009 Articles
42 and 48 list three categories: (i) environmental economics for planning process (natural
resource accounting, green GDP measurement, compensation for local Gvt in terms of payment
for environmental services, internalization) ; (ii) environmental funds (performance bonds,
environmental guarantees, environmental recovery fund, a block grant from Gvt to remove the
impact of environmental degradation and pollution – from source to recovery and the
3 See the chart in 5.1 and in Annex I for an overview.
14
Environmental Trust Fund to complement the existing sources of funds, especially for local
Gvt); (iii) positive and negative incentives (listing 11 instruments – taxation, payment for
environmental services, environmental insurance, green banking, labeling, etc.). The Law for
Renewable Energy includes tax and VAT exemptions; the Law for Energy Efficiency does not.
It is no surprise, therefore, that Indonesia has introduced several of the instruments listed in
the matrix: exemption from import duty, VAT and excise taxes on qualifying EE-equipment4,
grant support to energy audits5, subsidized training of auditors. Indonesia will also increase
landfill levies over time. Early 2011, banks in Indonesia charge interest rates of 10.5% to 13%
for loans to companies, with the highest being charged to SMEs. High nominal interest rates
pose an obstacle to investments with pay-back periods beyond two years, even if inflation
reduces the real rate of interest to much lower levels. Large companies in Indonesia, therefore,
tap funding from overseas instead of from local banks for larger scale investments. Some
donor financed schemes provide interest rate subsidies of 5-7 percentage points below
commercial interest rates to EE-investments by SMEs.
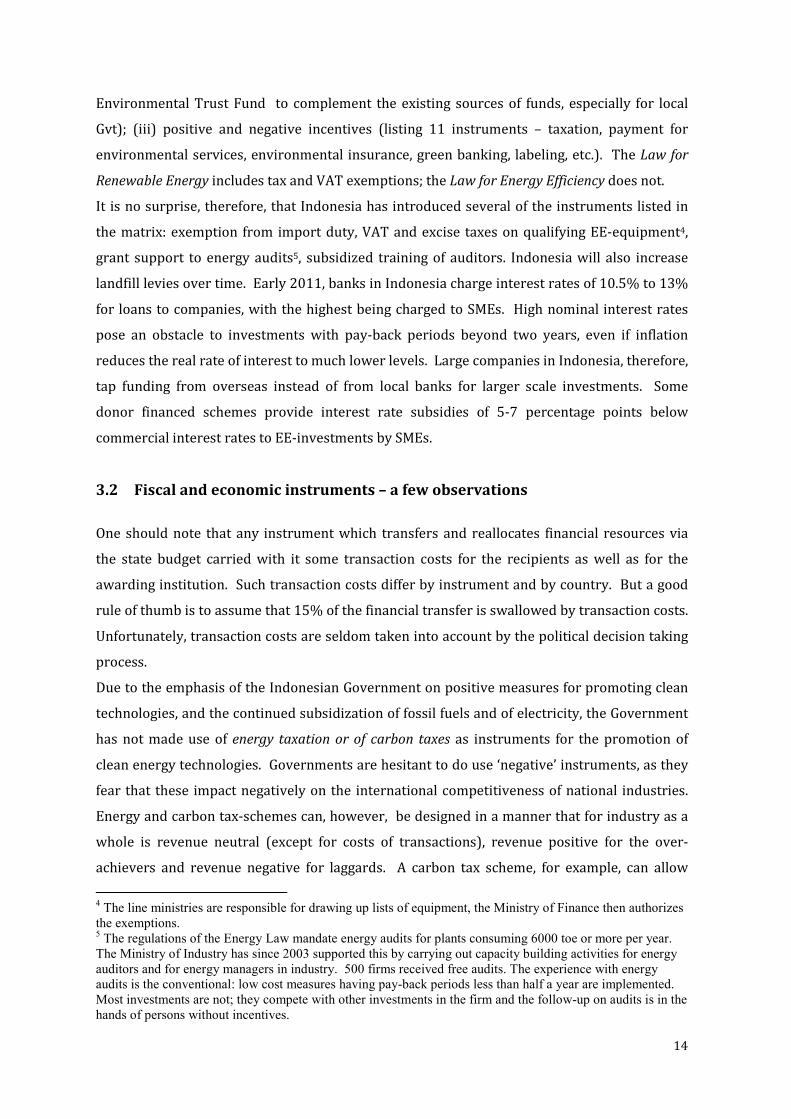
3.2 Fiscal and economic instruments – a few observations
One should note that any instrument which transfers and reallocates financial resources via
the state budget carried with it some transaction costs for the recipients as well as for the
awarding institution. Such transaction costs differ by instrument and by country. But a good
rule of thumb is to assume that 15% of the financial transfer is swallowed by transaction costs.
Unfortunately, transaction costs are seldom taken into account by the political decision taking
process.
Due to the emphasis of the Indonesian Government on positive measures for promoting clean
technologies, and the continued subsidization of fossil fuels and of electricity, the Government
has not made use of energy taxation or of carbon taxes as instruments for the promotion of
clean energy technologies. Governments are hesitant to do use ‘negative’ instruments, as they
fear that these impact negatively on the international competitiveness of national industries.
Energy and carbon tax-schemes can, however, be designed in a manner that for industry as a
whole is revenue neutral (except for costs of transactions), revenue positive for the over-
achievers and revenue negative for laggards. A carbon tax scheme, for example, can allow
4 The line ministries are responsible for drawing up lists of equipment, the Ministry of Finance then authorizes the exemptions. 5 The regulations of the Energy Law mandate energy audits for plants consuming 6000 toe or more per year. The Ministry of Industry has since 2003 supported this by carrying out capacity building activities for energy auditors and for energy managers in industry. 500 firms received free audits. The experience with energy audits is the conventional: low cost measures having pay-back periods less than half a year are implemented. Most investments are not; they compete with other investments in the firm and the follow-up on audits is in the hands of persons without incentives.

15
companies to reclaim twice the paid amount (including deduction for forward payments) of
paid in carbon taxes for specified clean energy investments.
The gap between the strategic interest of Government in EE and the financial priority of
private investors provides the rational for sweeteners in the form of upfront investment grants
even for investments that make financial sense marginally. The challenge is to reduce the
number of free riders and to use these as market expanding instruments, encouraging banks to
develop specific loan products for EE. Linking the size of the upfront investment grants to
investments the pay-back periods of the investments reduces the free rider effect. In countries
that subsidize the prices of fossil fuels, investment grants to RE&EE investments are snot
subsidies but compensating payments to level the field with conventional energy.
Prices for electricity can be linked to the level of EE, with increasingly high rates being paid by
firms for inefficient consumption.6. The implementation of such a scheme presupposes good
data.
Tradable white certificates have up to now been used in combination with an obligation
scheme. Market actors (usually retail energy suppliers or distributors) are obliged to reach a
certain amount of energy savings. Target compliance requires submission of a number of
certificates commensurate with the energy saving target. Certificates can be created from
projects that result in energy savings beyond business as usual, by obliged market actors or by
third parties, such as Energy Services Companies (ESCOs). Operators receive certificates
reflecting the savings achieved, which can be used for their own target compliance or can be
sold to (other) obliged parties.
The pollution levies (charges for disposal of hazardous waste) are a source of revenue for
cement plants: some cities pay cement plant to burn their waste.
3.3 Financial sector engagement instruments – a few observations
A goal for bank-engagement activities in EE-programs is to motivate the finance industry to
introduce standard finance products specifically for EE-investments. The obstacles for this is
that the financial sector in countries without a high-profile EE&RE industry is not interested in
developing EE-loans as a specific activity. The banks are willing to give EE-loans to their
business clients as part of their normal corporate loans. But they are not interested in taking
up EE-lending as a specific product line they market to clients because the initial demand for
EE-loans is too low for this. Thus, creating a large market demand for EE is essential. In China, 6 China has adopted innovative pricing reforms, which link the prices that large industrial consumers pay for electricity to the efficiency of their production. The program applies to the largest energy-consuming industries in the country, such as aluminum, cement and steel. It assigns different electricity prices based on the relative energy efficiency of each enterprise. The most efficient ones pay the standard regional prices for electricity without penalty, while the poorer performers pay surcharges which are being increased on a regular basis.

16
the top 100 industries program with mandated EE-targets created such a demand: the targets
fixed for EE at the big enterprises created a demand for financing, which triggered a
specialization response in the financial sector.7
Indonesia does not have the same level of command and control instruments as China.
Instead, it can attempt to promote special lending products through the introduction of grants
for qualified technologies and through intense dialogues with banks. At present, banks are
said to charge higher risk premium on interest rates to EE-projects because they do not
understand such projects. Banks are among the most regulated institutions in Indonesia. They
have so many demands imposed on them, that they cannot be that flexible.
The longest tenor being offered is 10 years with 1 year grace period. Typical bank interest
rates: 11 – 13%; depending on the central bank rate, which early 2011 was 6%. The Ministry
of Environment (or MoF??) has signed MoUs with Central Bank to include environmental
criteria into its credit policy towards commercial banks so that banks get softer conditions to
reduce the cost of loans to environmental products. 8 A working group will soon be established
to speed up the initiative. The Directorate of System Management with the Ministry of Finance
is in charge of the initiative. All sub-loan agreements come from MinFin, the MinEnv provides
criteria.
In the absence of a large market for EE-investments, Governments typically use publicly-
backed partial credit guarantees and dedicated credit lines as bank-engagement instruments.
However, before introducing risk sharing facilities such as guarantees and first loss reserves
two questions must be posed: (i) is EE inherently more risky than an SME portfolio? (ii) is the
finance industry sufficiently interested in guarantees and motivated by these to reduce
interest rates or demands for collateral? In some countries, the finance industry has refused to
reduce its demands for collateral, when being offered a partial credit guarantee. In Indonesia,
the ex-ante response of the banking industry is more positive: it is claimed that the issue of a
70% credit guarantee will reduce the demand for collateral to 30%!
Before introducing dedicated credit lines for EE-investments, one must be certain that lack of
long-term funding a legitimate barrier to the involvement of commercial banks in EE-lending?
7 The Top 1000 Energy Consuming Enterprises Program is a voluntary tool that sets out requirements and incentives to foster energy efficiency in 1008 participating enterprises responsible for around a third of China’s energy consumption and a similar proportion of carbon dioxide emissions. According to the action plan of the program, the top-1000 enterprises shall establish an energy conservation organisation, formulate energy efficiency goals, establish an energy utilization reporting system, conduct energy auditing, formulate an energy conservation plan, invest in energy efficiency improving, adopt energy conservation incentives, and conduct training. Because of the centralised nature of the Chinese economy, compliance to the Top 1000 Programme is mandatory in all but name, which ensures that the objectives of the programme are effectively complied with. 8 For certain stakeholders, lower interest rate is not that interesting, fast speed and simpler procedures are required, getting credit without collateral.

17
Overall, financially sound firms can easily access loans from markets, and banks can give
favorable rates under ‘greening our products’ schemes.
ESCOs are frequently marketed by donors as an ideal finance instrument for EE-investments in
medium sized industries. Some countries have tried to establish ESCOs with donor assistance,
targeting the industrial market. They have shown not to be commercially viable. Also in the
USA, which has had ESCOs for 30 years now, public clients (central Government and
municipalities) make up 70-80 percent of the annual revenue of ESCOs. The industrial market
represents “icing on the cake”.
3.4 Challenge funds for low-carbon innovations
Challenge funds publish periodic – typically once or twice per year – calls for proposals for
innovative projects. They provided grant support in the range of 25-40% to the best projects
selected according to published criteria and evaluated by peer experts for ranking. The level of
support to a specific project is not fixed. It depends on the financial feasibility of the project; as
the support is intended to cover the incremental cost of innovative projects, including a risk
premium. Projects are selected until the full amount of grant support that is available for the
challenge round is used up.
Indonesia has the ambition to promote green growth. Yet, the Government has not yet set up
specialized challenge funds to co-finance the cost of innovative pilot- /demonstration/
technology transfer projects. Presumably, the Indonesia Climate Change Trust Fund and/or the
Green Fund could set up a specific finance window for this. This is strongly recommended. It
could be called ‘Low-Carbon Technology Challenge Fund’.

18
4 Potential Packages of Instruments
This paper, in accordance with the instructions received by the consultant, focuses on cement,
pulp&paper and textile industry. Steel, another priority industry for the Government’s EE-
effort is not included.
4.1 Cement industry
Because it operates in a national oligopolistic market structure In Indonesia, the cement
industry overall is financially strong; three companies have almost 90% of the market. The
present capacity of the cement plants of 47 million tons per year is fully utilized as demand
amounts to 42 mt growing 6% per year. This makes it inconvenient to close a plant to change
the equipment towards a lower-carbon technology. But within the next 2-3 years, no capacity
additions will provide the surplus capacity enabling modernization investments to proceed.
An AFD-financed study was useful for the smaller cement plants.
Indonesian cement industry has limited energy saving potential in its present production
processes: only 10% of the total GHG- emission reduction potential that has achievable
(reducing energy consumption from non-kiln activities such as lighting, motor efficiencies, air-
conditioning and fuel in machinery including trucks).
40% of the emission reduction potential comes from fuel switching from coal to biomass in the
form of agricultural waste, fuel crops, municipal solid waste, industrial waste, including
hazardous wastes. dried sewage sludge, shredded plastic animal meal/animal fat.
The remaining 50% reduction potential comes from less energy intensive blending materials as
substitutes for clinker (including recycled concrete, fly-ash). The industry has found it easy to
reduce the amount of klinker – using other additives. All industries work on reduction of
klinker and customers already accept the new type of cement.
The EE-policy package for the cement industry would focus on:
• Changing Government regulations that unnecessarily complicate the introduction of
fly-ash as blending material. Regulations for transporting fly ash from generator to
plant is tough; makes fly ash more expensive than klinker. Supporting measures,
already being undertaken include new cement standards and recycled materials
content standards.
• Adjustments in regulations to facilitate use of toxic waste materials as fuel. A solid
information campaign would be implemented, including arranged visits of journalists,
representatives from the Ministry of Environment and from municipal and district
authorities to municipalities in Europe that have introduced effective use of toxic and

19
municipal wastes as fuel without detrimental effects on the local environment and
with full acceptance of the neighboring population.
• Encouragement of public-private-partnerships between subsidiaries of cement
companies and municipal Governments for setting jointly owned firms to engage in
municipal waste sorting and treatment. The co-financing municipality could
presumably seek funds from the Climate Change Trust Fund to finance its share of the
company’s equity capital.
• Ideally, a more rational collection and treatment of municipal waste would also be
promoted by full cost waste deposit levies.
• If a Low-Carbon Technology Challenge Fund A cement company, or a consortium of
companies assisted by the Cement Association could seek grant support for innovative
pilot projects in areas of joint interest, e.g. new ways to dry moist waste.
• Introduce a positive list for EE-investments to be eligible to reduced import duty and
reduced VAT and access to soft loans. It could comprise: (i) burning waste in the kiln;
(ii) transformers to regulate the speed of the fan; (iii) transporting alternative fuel to
the kiln, (iv) support to buy equipment to measure CO2 on the stack.
• The five state owned companies use very old equipment. For them, the path is to
change their equipment. Relevant technologies would be planetary cooler, cut the kiln
and use grid cooler to reduce consumption of fuel.
• The new plants can reduce energy consumption by using vertical mil for grinding of
cement (it reduces electricity), and use modern burners and automation to keep stable
the operation of the mill.
• The smaller companies may need assistance in getting loans. For them the
introduction of a publicly backed guarantee may be required. But that needs to be
looked into.
• Due to the large size of the investment in fuel-switching, and because of the fact that
the companies overall are financially strong (providing a taxbase!) a 100%
depreciation (tax write off) in year 1 on investment would be a powerful economic
incentive for the companies. Alternatively, a 50% write off in year 1 and a 50% in year
2 could be contemplated.
4.2 Pulp & paper
The pulp & paper industry comprises 85 companies in 2010, who produced a total revenue of
USD 8.1 billion; pulp: 1.8 billion, paper: 4.9 billion and paper products: 1.4 billion. The pulp &
paper industry has since 1970 undergone a rapid expansion: from 50,000 tons capacity of

20
paper to now 12 million tons of paper plus 8 million tons of pulp. Due to favorable natural
resource conditions, Indonesia’s pulp and paper industry enjoys an absolute production
advantage compared with competitors on the international market.
As a consequence of rapid growth, the industry uses modern machineries and processes;
meaning that its EE is of international standards. As 40% of papers and 50% of pulp are
exported, the industry must follow the demand of the market. It must be careful to protect
itself against attacks from NGOs. To be efficient and use process that are environmentally
friendly – including finding was to reduce GHG - is welcome as it makes the industry more
competitive. The industry is financially strong and has easy access to the foreign and national
financial markets.
The energy saving potential in the production processes in pulp and paper is thus limited;
although energy saving potential in the production of thermal energy has been identified. The
major emission reduction potential is in fuel switching to increased use of self-generated
biomass waste as fuel, in cogeneration of heat and power (with surplus power production
being sold to the grid) and in increased recycling of recovered paper. The latter option,
however, is not yet financially viable, and, possibly, also not economically viable under present
conditions in Indonesia. The industry association has no information on the waste material
that is being produced each year; a study to provide that information is warranted.
According to the industry association, neither liquid waste nor gas wastes present a problem.
But solid waste, inter alia due to misunderstandings between industry and the MinEnv. The
latter considers consider solid waste a dangerous material/substance with the implication that
it has to be handled according to the norms for dangerous material. E.g. for transporting solid
waste from one place to another special trucks are required to carry it. Now MinEnv has
agreed building materials, solid materials, compost.
Since September 2010, an EE-project with UNDP assistance has implemented energy audits in
steel (45 companies) pulp & paper (15) and provided technical assistance (TA). The project
seeks to follow up with an action plan for the implementation of the recommendations of the
audits and seek VAT-exemption for the equipment. Some ESCO-initiative is contemplated also
as well later replication in other regions.
Subject to the outcome of the identification process for the preparation of The EE-policy
package for pulp and paper would focus on promoting biomass-based cogeneration of power
and heat.
• The most important instruments for this are standard PPA-tariffs and standard
regulations for connection and PPA-negotiations. In North Sumatra, one of the
companies sell extra electricity to PLN. PLN is positive, the general position that the
companies can sell extra electricity to PlN.

21
• Removal of regulations that complicate use of waste for energy purposes without basis
in truly documented environmental benefits.
• To promote technology innovations, the Government can publish call for project
proposals by the ‘Low-Carbon Technology Challenge Fund’to co-finance relatively
untested technologies as pilot or demonstration projects; e.g. gasification technology.
• Introduce a positive list for EE-investments to be eligible to reduced import duty and
reduced VAT.
• A 100% depreciation (tax write off) in year 1 on investment or a 50% write off in year
1 and a 50% in year 2 could be contemplated for investments in capacity expansion in
power for sales to PLN.
• Introduction of soft loans (interest rate subsidy only, as these companies have easy
access to commercial loans) may be of interest if it turns out that the low-carbon
investments are marginally financially viable even if a 100% tax write off on the
depreciation is offered.
4.3 Textile industry
The situation in the textile industry will be totally different from the above two industries.
The textile industry is a success story in terms of growth in production, in employment and in
exports. Yet, it operates with low margins due to intense international competition. Some
companies have managed to move into the production of high-quality fabrics delivered to
leading brands and enjoy reasonable profits, others with more commodity style production
barely survive. Therefore, whereas the cement and pulp and paper companies can balance
sheet finance their EE-investments, the textile industry is considered a high risk industry by
the national banks. Most companies find it difficult to come up with aksed for collateral.
80% of equipment in the industry is 20 years old. Therefore, it is possible to identify
interesting EE-potential. The price of energy for the industry is increasing; in percent of the
cost of production is amounts to 6-8%.
The scale of EE-investment s in individual plants will be much lower than in investments in
fuel conversion and in waste-power capacity in the cement and paper & pulp industries. But
many more plants are affected: Indonesia has about 4000 textiles companies.
In the textile industry a bank engagement program is the sine qua non for introducing a
successful EE-support program. The large number of plants offers a large enough market for
the introduction of standardized finance products from the banks for the industry, based on
the identification of standard technical packages for specific types of textile firms.

22
An EE- intervention could be launched with reference to the national program for productivity
improvement, which in the past had soft loan program for the industry for buying new
machines. Per company the support was limited to 1 billion Rps.
A public program for the textile industry would have a number of features that are not found in
the programs for the above energy intensive industries:
• The companies have an energy consumption size and composition that makes quasi-
ESCOs (performance guarantees for recommended EE-investment packages) and even
full-blown ESCO-operation (design, investment, finance, operation) feasible in the
industry.
• Government can provide training and certification to these and through a public EE-
program provide a public market for the quasi-ESCOs.
• The efforts would be linked with intensive consultation in the finance industry to get
the sector to develop and market standard finance products for standard technology
packages that are relevant for clusters of textile industries. Government will need to be
in close dialogue with the financial sector to explain the rational for performance
guarantees as a means to reduce the risks of the investments to the companies and
ultimately the banks giving the loans.
• The program needs in consultation with the textile industry association identify pilot
clusters, find a focal organization in each selected cluster, providing training to the
focal organizations, supporting project pipeline development, and establishing local
monitoring and evaluation (M&E) systems
• There is s a strong case for the introduction of publicly backed guarantees for loans to
EE-projects in companies that have a good chance of commercial survival, yet are on
the borderline for posing an acceptable credit risk for banks.
• Because of the number of firms, a PoA (Program of Activities) could be formulated for
the industry with the receipts being used to pay performance based grants in
accordance with either the GHG-reductions they achieve, or energy efficiency
benchmarks that exceed the average efficiency in the industry.
• To promote technology innovations, the Government can publish call for project
proposals by the ‘Low-Carbon Technology Challenge Fund’to co-finance relatively
untested technologies as pilot or demonstration projects.
• Introduce a positive list for EE-investments to be eligible to reduced import duty and
reduced VAT.
• Introduction of interest rate subsidies is essential to get the financially weak sector to
invest in EE.

23
5 Follow-up
5.1 Working Groups for fixing Voluntary Agreements
Bappenas is strongly interested in testing voluntary EE-agreements signed between the
industry associations and the Government as the primary instrument for accelerating EE in the
three industries. But are they feasible in Indonesian business culture? The key success factors
must be identified.
One is a well-established dialogue between industries and government; that seems to be the
case in Indonesia.
Another is credibility that the Government in case of underperformance will resort to the stick.
Voluntary agreements are bi-lateral good will agreements, where implementation is entirely
under the self-responsibility of the industry and its branch associations. An important cultural
factor to make self-enforcement and self-evaluation to succeed, is peer pressure, that is exerted
if an industry is faced with threat of dictates in case of non-performance. Peer pressure will
work best in the cement industry where there are only 8 companies and next in the pulp and
paper industry where there are 81 companies in Indonesia, and worst in the textile industry
where there 4000 SMEs. Monitoring reports produced by the industry associations are used as
basis to renegotiate targets. That calls for a great deal of trust in reporting; a trust that can be
promoted in the textile industry through the implementation of a PoA.
Yet, a voluntary agreement, even if it is imperfectly implemented, will still provide benefits, not
the least, in the form of awareness raising and in providing the public monitoring authorities
with “open information” on (i) EE-measures that the industry itself considers financially viable
and (ii) policy measures that the industry believes are particularly valuable as a means of
support.
The TOR for the working groups basically will list three tasks:
1. For a voluntary partnership agreement to work you start with industries that have
good data and are ready to go. Data is needed to assess what is the baseline in order to
implement incentive and disincentives. The cement industry has good data, the other
two working groups have to secure data of similar quality for the other two industries.
2. The working groups shall describe the obligations of the industries in the agreement.
Enterprises shall establish an energy conservation organisation, formulate energy
efficiency goals, establish an energy utilization reporting system, conduct energy
auditing, formulate an energy conservation plan, invest in energy efficiency improving,
adopt energy conservation incentives, and conduct training.

24
3. The working groups shall describe the commitments and the financial support to be
provided by Government to the industries. It will be for the industry representatives to
identify the obstacles to progress that warrant public initiative and in collaboration
with the civil servants to develop a sector specific package of instruments by
commenting point-by-point on the items listed in the chart below. The sections above
have described the content of potential support packages. The economic instruments
to be included in the packages are by and large well-known in Indonesia. The list of
potential packages, the matrix and the chart below are provided to help triggering
constructive discussions in the working groups.
Public Support Package for EE1. TA to company staff in cost-effective EE measures
2. Support to improve quality of technical supply side
• Consultants / environmental auditors
• Equity/subordinated loan instruments for ESCO start-ups
3. Removing Regulatory Obstacles
• Reclassification of hazardous waste?, changing rules for handling waste?
• Changing waste policy / landfill levies ??
• Streamlining local planning and project approval procedures?
• Standardised PPA and grid connection fees for cogenerated power
4. Financial sector engagement
• Need for publicly backed guarantees providing partial risk coverage
• Need for refinancing facility to get banks involved
• TA to banks in understanding EE project financing
• Technical/engineering evaluation of project proposals by public agency?
5. Financial incentives
• Accelerated depreciation, import duty exemptions, TVA excemptions
• Soft loans /interest rate grants/Direct investment grants
6. Challenge funds for pilot /demonstration projects/technology transfer
Source: Mostert

25
5.2 Theory-based M&E
For each support instrument that is included in a package for an industry, the civil servant
experts will provide a theory-based monitoring and evaluation scheme analyzing how the
instrument is expected to work, its expected outcomes and what the key success factors are
(what has to be done well) for the instrument to succeed?
The table below provides an illustrative example of how a theory-based monitoring and
evaluation scheme could be developed, taking a look at the Ministry of Industry’s energy audit
program.
Activities causing impact Indicators Success Factors (&fail) 1. Program to promote energy auditing • Promotion campaign to make
EAP known. • Training and authorisation of
auditors • Development of energy audit
models and auditor's tools
• Quality and type of
promotion & awareness campaign
• Quality of training; number of persons authorised; competence
• Quality, relevance and usefulness of models and tools.
• Good relations with media
and industry organisations
• Quality of auditors responsible for training
• Flexible development; co-operation with stakeholders
2. Investment support • Subsidies to energy audits • MoUs with FIs for loan
finance • Training of FI staff in EE-
projects • External specialist agency for
technical project evaluation
• Increase in number of audits followed-up by EE-investments
• Increase in average investment
• Standardized EE-finance products introduced
• Low free rider effects
• Quality of FI capacity building
• Trust of FIs in long-term government EE policy
• Trust of FIs in external agency
• Defined investments with long pay-back periods qualify for grants
3. Implementation of energy audits • Companies implement some
or all of investments suggested in audits
• Ministry controls the quality of energy audits
• Appointed energy managers • Realised energy savings • Share of audits that are
controlled;
• Prestige awarded to
energy manager function • Quality of in-house energy
managers • Mentality of tight quality
control
Source: Mostert, inspired by AID-EE: “Ex-Post Evaluation of 20 Instruments to improve Energy
Efficiency across Europe”, March 2007

26
Annexes
Annex I: Generic Framework for EE&RE Policy Interventions
A point, agreed early on during the visit, is that the promotion of energy savings in industry,
and of low-carbon development in general, is done through packages of instruments where the
effectiveness of individual instruments depends on their interaction with others. The generic
framework for EE&RE-policy interventions, consisting of (i) a series of demand side measures
(bluish), (ii) measures to strengthen the technical supply side (brownish) and (iii) private
finance engagement measures (yellowish), is shown in the chart.
Public Framework for EE & RE
Quality control
& monitoring
Env. Regulations
& Enforcement
Creating Demand for Investments in Clean Technologies
Financial Sector offers Finance for Investments in CTs and develops tailor
made and standardized Financing Products
Pricing Policies
(energy, waste)
Power market
design & rules
Quality green
technology
Information
campaigns
TA to supply
side
Public green
procurement
Refinancing
line for CT
Financial sector
regulations
Financial
aggregation
Cost
reduction
Risk
reduction
Source: Mostert
The chart illustrates that a large scale market demand for low carbon technology requires (i)
easy access to high quality low carbon technology, (ii) favorable relative price and regulatory
conditions and (iii) the availability of standard finance products for investments in low carbon
technology. Although not all instruments are equally essential, it is difficult to take an element
out of the package with a negative impact on desired outcomes.
The chart overleaf summarises the policy making consequence. For each sub-sector - cement,
pulp & paper and textile industry - a support package needs to be identified. Some elements
will be common for all three packages; e.g. there will only one challenge fund for pilot and
demonstration projects open to applicants from all industries. Other elements will be industry-
specific; e.g. regulations for waste management that facilitate the burning of waste in cement
incinerators.

27
Annex II: Evidence based versus faith based policy making
Basic principles
Policy is done by politicians, formulating their policies partly on factors/evidence, partly on gut
instincts. Both are needed. Good evidence is needed to decisde on the introduction of a new
policy or a new policy instrument on a well-informed basis; good gut instincts are needed
because the future is uncertain and perfect information is never present. The task of public
officials is to provide policy makers with the best possible evidence in support of policy
proposals; politicians form their position by reflecting on the information and supplementing
it with their gut feelings about whether it will work as described. At least, this is the way
policies are formulated in the ideal world. In the real world decisions are often taking at the
spur of the moment based on gut instincts without awaiting documentation. That can work
out well, but often it leads to misallocation of resources. Worldwide it is likely that 70-80% of
subsidy schemes generate negative economic rates of return for society.
The steps in evidence based policy making are logical: (i) you start by scoping the issue, ask
what questions need to be answered and decide what sort of evidence is needed to answer the
questions; (ii) you collect existing information and contract research to procure new evidence;
(iii) you interpret the collected evidence; (iv) you synthesize and communicate the evidence to
policy makers; (v) simultaneously, you build from the very start M&E into the program so that
key assumptions and expected outcomes can be checked for their validity, allowing early
corrective action to be taken during implementation.
Poor policies are caused by one of four factors: (i) by political wishes for taking advantage of a
momentum – leaving details to be corrected during implementation; (ii) by slogan-based
misunderstandings about how the market works; (iii) by the work of pressure groups and
lobbyists from stakeholders that gain from the change or continuation in policies (targeted
misinformation); (iv) by weaknesses in the policy making process. Even the best “evidence
based policy” structure is defenseless against the first. It is almost defenseless against the
second type of policy errors. Facts are facts, but perception is reality! And slogan/faith based
perceptions of reality can grip not only politicians, but a whole administrative apparatus as
well. An efficient planning system can force changes in (mis-)perceptions by asking for
documentation about assumed instrument-effect-impact relationships. But when a whole
administration is slogan-driven, the crucial questions about the basis for held assumptions are
never asked because these are assumed to be self-evident. Evidence-based policy making
begins by checking to what extent established assumptions are supported by solid evidence.

28
Very often planners will find to their surprise that widely held assumptions are purely faith-
based.
How do you find evidence?
Evidence for policy preparation is collected through a combination of deductive and
inductive approaches.
• The deductive approach is forward looking: an instrument-impact-outcome
hypothesis is suggested for an economic instrument and applied micro-economic
theory is used to explain its cause-effect relationship. Existing econometric evidence is
used to establish the size of the relevant parameters, e.g. the price elasticity of demand
for a product to be subsidized.
• The inductive approach is more backward looking: one looks at the experience from
similar policies and instruments that have been applied in the country (or in foreign
countries) in the past and tries to deduct conclusions from it. Believes in the feasibility
of this approach provides the justification for the publication by international
organizations of “best practice” and “lessons learned” studies.
Both approaches pose challenges for the practitioner.
The key challenge for both approaches – that is, for evidence based policy making - is to identify
the right issues and pose the right questions.
The key challenge of the deductive approach is to identify the proper analytical method and
theory to use. (The section on subsidies for RE&EE shows an example to illustrating this
point.)
The key challenge for the inductive approach is to identify the correct success factors, when
analyzing lessons learned from similar experiences. ”Best practice is always circumstance
based” and an instrument that worked in one context may be unsuccessful in another. To
arrive at adequate conclusions, one can try to use the ‘theory based policy evaluation’ approach.
In its cause-impact analyses it focuses not only on the final impact (e.g. energy savings) but
above all on the intermediate indicators. For each intermediate indicator, theory based policy
evaluation, both ex-ante and ex-post, identify the relevant success factors - things that have to
be done well in order to succeed - as well as specific factors that led to failure. Table 1 in
chapter 2 provides an example.
How do you prioritize public intervention for EE?
Indonesia is well-endowed with excellent studies to support policy making in low-carbon
development. Arguably, the three most important of relevance for EE in industry are (i)
Ministry of Finance Green Paper: “Economic and fiscal policy strategies for climate change

29
mitigation in Indonesia” , (ii) Bappenas: “Indonesia Climate Change Roadmap for Industry” and
(iii) World Bank: “Low Carbon Development Options for Indonesia“. Together, these
documents illustrate how prioritization, a key objective for policy making, is done starting at
macro level and going consecutively deeper into micro-level issues:
• The green paper identifies emissions from fossil-fuel combustion as the key challenge
for low-carbon policy; whereas forest- and peat based emissions dominate at present,
fossil fuel based emissions will be larger from around 2025 and forward.
• The options report identified the sectoral priorities for action; the priorities for
initiatives in industry were found making use of three screening criteria:
(i) A carbon emissions & energy efficiency (which are the energy inefficient firms +
where can we find carbon reduction/EE-potential with substantial impact on
overall industrial carbon & energy use reduction). The largest greenhouse gas
emitting industries are: non-metallic minerals, textiles, basic metals, food and
beverage.
(ii) Economic development importance (contribution to GDP, high GDP growth from
2000-2005, high backward and/or forward linkages). The Industry sub-sectors
found to be central to Indonesia’s development process are: garments, pulp,
porcelain, auto parts, fertilizer, crumb rubber.
(iii) Opportunity, capacity and incentive to improve EE (cost of energy in % of total
cost of inputs + scope for improvement + range of inefficiency in the industry
sector from the most efficient to the least efficient - large differences facilitate
learning from others, knowledge sharing and transfer of technology within the
country).
• The road map was the outcome of an optimization exercise that mixed bottom up
identification of EE-opportunities with a modeling exercise across the transportation,
power and industry sectors to identify integrated, least-cost approach to a low carbon
economy.
Forecasting the future
Uncertainty about the future is a fact of life. Whoever tries to forecast the future will inevitably
get it wrong except by accident/coincidence. For this reason, politically savvy planners insist
that they do not make forecasts but present scenarios! On the one hand, this is semantics: in
daily life politicians and the media will not be conscious of the difference between the two.
Yet, for an intelligent planner, it is a sensible “covering my back” trick. When asked a few years
later why the plan could get it so wrong, the effective defense is: “it was not a forecast, just a

30
scenario exercise”. In the following we will not make the distinction, but use the words
interchangeably.
Policies are about changing future outcomes. As such, a proposed policy, implicitly, has two
scenarios in mind: a baseline development (without policy) and an outcome scenario (with
policy). Often these scenarios are not made explicit; a policy instrument such as a subsidy is
expected to promote demand for a given good, and it is not analysed whether the market
expansion or poverty alleviation impact is large enough to justify its cost to the public budget.
In evidence based policy making, ‘with and without scenarios’ must always be presented
explicitly to show to politicians the expected orders of magnitudes and the expected costs of
the interventions per unit of expected benefit. Although the implicit forecasts made by the
scenarios will prove to be wrong, planners must make an effort to minimize the margin of
error. The advices given below can help planners to be as realistic as is feasible.
First, when drawing on forecasts made by others for a parameter in the forecasting model,
check for build in bias in forecasts caused by institutional self-interest:
• Governments will always systematically over-estimate the GDP growth forecast of their
national economies; they want to look good in the eyes of their electorate. (The
exception is the Chinese Government, which does not seem the understand the strong
impact of its incentive systems on the actors in the economy)
• Central Banks, who have inflation control as explicit policy target, will systematically
underestimate the rate of inflation in their forecasts.
• Investment banks who market “future insurance coverage products” such as oil futures,
derivatives and call or put options will always in the their oil/gas/coal price forecasts
overestimate upward trends (be over-bullish) as well as downward trends (be over-
bearish).
• Consultants analyzing the impact of proposed policy instruments for self-interested
clients (e.g. the European Commission presenting a directive for a new EU-wide policy
instrument) will inevitably present orders of magnitudes of positive impacts that are
greater than those achievable in practice.
Second, apply a systems approach in forecasting that takes into account feed-back effects
and interconnections:
• “Feed-back impacts on the economic system” must be taken into account; they provide a
check on the reasonableness of assumptions. In 1981, the IEA forecast that the 1981oil
price of USD35/bbl, would double in real prices by the year 2000. Instead, the price
decreased by two thirds, meaning that the IEA got it wrong by a factor of six! Had the
IEA tried to analyse the impact of the oil price assumption on the economic feasibility
of RE&EE investments it would have noticed that the impact on investments was so

31
huge that the demand-supply squeeze which provided the foundation for the belief in
the doubling of the oil price was not realistic. In the wave of the 2011 political
upheavals in the Arab world, reports come up pointing to the risk of a USD200/bbl oil
price. The analysis providing these forecasts do not take into account the implied shift
in the distribution of world purchasing power. The increase to $147/bbl in 2008 from
the price in 2004 implied a shift of income equal to 5% of world GDP from oil
consuming to oil producing countries. An increase from the present US$100/bbl to
US$200/bbl would also equal an income shift of 5% of GDP. Since the oil exporting
countries cannot expand their consumption by an equivalent amount, this would lead
to an increase in the world saving rate that would smash world economic growth and
oil consumption.
• Interrelationships between fossil fuel prices and prices for RE-technologies. Prices
between thermal fuels – oil, gas and coal – move in tandem because of their
substitutability in power generation and because a general demand pressure will affect
all three. Planners are less aware of that increasing oil prices (usually accompanied by
demand pressure on metals) increase the price of RE-technologies for roughly the
same reasons. If a forecast assumes a trend based decline in RE-prices and,
simultaneously an increase in fossil fuel prices, the planner must make a downward
correction in the assumed rate of decline of the prices for RE-technologies.
• Feed-back impacts on consumer behavior. The socalled rebound effect” must be taken
into account when EE-measures are introduced. More fuel efficient cars reduce the cost
of driving per km, this increases the demand for driving; more efficient insulation
reduces the cost of heating, which leads households to increase temperature levels in
their houses; etc. Unless these rebound effects are taken into account, the impact on
national energy demand by the promoted introduction of EE- technology will be over-
estimated.
Third, be aware of the possibility of permanent shifts in parameter values, yet, avoid the
trap of false theories of discontinuity. Forecasts are always made with reference to past
trends and patters – otherwise one has no idea of what values to assign to the parameters in a
model. It becomes problematic, when past trends and values are applied mechanically,
thereby overlooking developments that lead to a fundamental shifts in the factors that shape
the market. In 2004, when the price of crude oil averaged $34 per barrel, the International
Energy Agency (IEA) in its World Energy Outlook 2004 (WEO2004) had a reference scenario of
an oil price of US$24 in 2010, after which it increased to US$31 in year 2030. In 2005, when
the average oil price was above US$50, the reference scenario price in WEO2005 for 2030 was
raised from US$31 to US$39, the “deferred investment scenario” price was US$51. The IEA

32
totally overlooked that demand
side and supply side factors
interact to create a tighter oil
market during the 2006-2030
period: the supply as well as the
demand side will be less elastic in
the future. On the demand side two
factors interact to reduce the
elasticity of demand. The GDP-
elasticity of the demand for oil will
be higher because an increasing
share of world GDP growth comes from oil-thirsty emerging economies, among these China,
the world’s largest nation and within the next ten years the world’s largest economy. From
1979 to 2004, world GDP growth averaged 2.9%, and the growth in world oil consumption
1.1% per year, yielding a GDP growth/oil growth ratio of less than 0.4. The “oil growth-GDP
growth ratio” for 2005-2030 will be higher. The price elasticity of world oil demand will be
lower than in the past because the increasing concentration of oil use in the transport sector
reduces the oil substitution possibilities. The elasticity of supply will be reduced by “geology”
and by the increase in OPEC’s ability to exercise market power. Together they will create a de
facto peak oil situation, irrespective of physical possibilities to increase world oil production.
A shift in parameter values has to be grounded in a theory of discontinuity. One can have faith
in theories about long-term changes in macro-economic conditions, as done above in the
analysis of the oil market. But one must be deeply suspicious about theories that *we live in a
totally different world now” and which draw into doubt long-tested micro-economic
relationships. The internet-economy bubble in the early 2000s, for example, was created by
investors and market makers claiming that price-earnings ratios as an instrument o value
internet companies was old-fashioned thinking by people who did not understand the reality
of post-industrial economies.9
Fourth, do not believe that evolving consensus around a forecasts increases the likelihood
that a forecast will turn out to be more correct than forecasts on average. “Investors herd
together because they do not have a sure grasp of the future. Faced with uncertainty, they
resort to whatever conventions they can find to cling to, from popular wisdom to new
theories” (John Maynard Keynes).
9 “Every sequence of boom and bust, or bubble, begins with some fundamental change, such as the spread of the Internet, and is followed by a misinterpretation of the new trend in prices that results from the change. Initially that misinterpretation reinforces both the trend and the misinterpretation itself; but eventually the gap between reality and the market's interpretation of reality becomes too wide to be sustainable.” (George Soros).
Changes in
Elasticity of Demand
Changes in
Elasticity of Supply
”Hotelling price effects”
(due to forward looking
supply scarcities)
”Hubbert plateau risks” (a minor share
of new supply can come from increase
in extraction rates of oil fields found
before 1980)
OPEC market
power (increase
in oil supply from
OPEC and in
OPEC’s market
share)
Decrease in the price elasticity of oil
demand (due to increase in transport
sector’s share of oil consumption)
Increase in the oil demand
elasticity of world GPD growth
(importance of India, China, etc)
Changes in Elasticity of Demand & Supply shift Long-Term Price of Oil

33
Choosing the right analytical approach for the design of an instrument
In the late 1990s, the World Bank/GEF designed a US$50 million market transformation
program for the promotion of solar home PV-systems In Indonesia. Solar home PV-systems
are marketed in many sizes ranging from around 15 Wp to 200 Wp or more. Typically,
household who want to watch colour TV purchase a 50-75 Wp system, households who want
to watch black-and-white TV a 35 Wp system, while households who cannot afford either
purchase 15-20 Wp systems.10 Since rural households have difficulties coming up with the
US$200 to US$800 for a solar PV system, Governments introduce subsidies to make the
systems more affordable to households. The issue for the consultants designing the scheme
was to decide on the type of subsidy to give: (i) a percentage subsidy to the cost of the system,
(ii) a subsidy per Wp of a system, (iii) a fixed subsidy amount per system? A ‘percentage of
cost subsidy’ is too easy to manipulate by vendors and by beneficiaries. Therefore, the
relevant choice was between the per Wp and the per system subsidy. The team, approved by
GEF, adopted the per Wp subsidy. They reasoned that GEF paid for the reduction of CO2-
emissions. A 40 Wp system would reduce twice as many as a 20 Wp system; therefore, it was
reasonable to pay a subsidy that was twice as high.
The analysis mistook the economics of grant support for a grid connected RE-power plant with
the economics of a grant scheme for promoting the mass penetration of an individual
consumer product. The challenge for the former scheme is to identify an incremental cost
finance system which minimizes public expenditure. The challenge for the latter is to identify a
market expanding subsidy, which reduces the percentage of “free riders” that benefit from the
subsidy is low. The objective of providing subsidies to investments in SHS is to increase sales
(serviced households) in the target area, not subsidize purchases of SHSs that would be bought
anyway. The principle is illustrated in the chart below.
10 In recent years, white LED system down to 4 Wp sizes provide basic lighting and LED-TVs with small screens can be powered by 10-20 WP TV systems as well.

34
The Free-Rider Problem in Subsidy Programs
Price before
subsidy, P 1
Price P2 after
50% subsidy
Q 1 Q 2 Q 4
Promotional impact of subsidy
without annual limit on amounts
Free
rider
Price P3 after
25% subsidy
Q 3Q 5
Public budget restrictions
on annual subsidy amount
D 2
D 1
S1 S 2
S 11
S 22
Source: Mostert
At the unsubsidised selling price P1 of the technology, consumer demand is limited to the
amount Q111. The provision of a subsidy equal to P1 minus P2 increases consumer demand to
either Q2 or to Q4, depending on the reaction of consumer demand to changes in the price of
the product, the so-called “price elasticity of demand”. If demand is elastic, as shown by the
demand curve D2, product sales increase to Q4. If demand is relatively inelastic, as shown by
demand curve D1, sales increase to Q2. In both cases, the number of “free riders” equals Q1, the
number of consumers who would invest in the product also without a subsidy. For them, the
subsidy is a “free gift”. When demand elasticity is high, the promotional impact, Q4–Q1, is large
compared with the free rider impact, Q1. When the elasticity of demand is low, the promotional
impact Q2–Q1 is relatively small 12.
What are the implications of this analysis for the ‘per system’ versus * The point of the analysis
is that grants to solar home PV-systems should given to the systems having the highest price
elasticity of demand. The per Wp subsidy give the highest subsidy payments to the larger
systems purchased by the more well-off households. And because the price per Wp capacity of
solar home PV-systems declines with system size, they also pay the highest percentage
subsidies to the larger systems. The per system grant pays the same subsidy to the richer as
well as the lower income households and gives the highest percentage subsidy to the smallest
systems. Since the price elasticity of demand of poor households must be assumed to be
higher than the price elasticity of demand of richer households, the per system subsidy has 11 Quantities on the x-axis could express annual system sales (number of units) or annual Wp sales. 12 The policy recommendation from this is that “market pump priming subsidies” should not be used for products or services having a low price elasticity of demand.

35
smaller free-rider effects than the per Wp subsidy, that is, for a given annual subsidy budget
provided by the state, it can achieve a larger market expansion.
The example underlines the importance of asking the right questions upfront. The consultants
for the per Wp subsidy had pre-defined their task as designing an output-based-subsidy,
defining Wps as outputs. Instead, they should have asked: “how do we defined a subsidy
scheme that achieves maximum market expansion per unit of payment?”

36
Annex III: Fuel subsidies and energy poverty
Energy poverty has several dimensions. Sometimes the term is used to refer to situations
where households lack access to modern sources of energy such as electricity. That use of the
term we will leave aside. Instead we will discuss the implication for energy policy of the
conventional definition: the affordability burden imposed on low income groups by their
expenses on energy. A household is classified as being affected by energy poverty if its
expenditures on household energy make up more than a given percentage of its total cash income
or expenditure. The threshold level varies from country to country; the percentages range from
5% to 20%. In the U.K., where the percentage is 10%, the definition is used in policy to trigger
cash transfers to households that surpass the limit. One can expand the concept of energy
poverty to include a country’s ability to withstand external shocks of increasing fuel prices and
afford policies to subsidize commercial fuels. The cost of oil consumption, for example, amounts
to 9.5% of GDP in Egypt, and to 2.5% of GDP in Japan. Yet, whereas Japan does not subsidize
commercial fuels, Egypt does. Since underpricing of fossil fuels slows down the shift to the low
carbon economy and imposes a number of costs on an economy, it is relevant to ask whether
Egypt can afford such a policy. It cannot.
A fuel is subsidized when its sales price is lower than its full economic cost. Underpricing can
be explicit, caused by government subsidies to a commercial fuel to keep its price below its
world market price. Or it can be implicit, in the form of negative externalities imposing costs
to society that are not included in the market price for the fuel.13 The appropriate policy
instrument for externalities is to impose a socalled Pigovian tax on the fuel at a level reflecting
the costs imposed on others.
Politically, changing a subsidy is an uphill fight in every country in the world. Subsidies are
similar to cancer or to corruption in terms of their impact (probably 80 percent of subsidy
schemes worldwide yield negative rates of return to society) and their tenacious hold onto a
system: once they are in, it is almost impossible to get rid of them again. Within half a year
after the introduction of a new subsidy, neither the recipients nor the subsidy awarding body
can imagine life without it. Yet, because getting the prices right is the most effective
instrument to promote a low carbon development, planners must not give up on making an
efforts to convince politicians of the virtues of full-cost pricing. Success in the endeavor
requires four things from planners. They must: (i) convincingly lay out the economic costs to
society imposed by the subsidy; (ii) demonstrate how the issue of energy poverty can be
13 The green paper includes a calculation of the total cost of production per kWh of a coal fired power plant, that adds three external costs to the financial cost: cost of fuel price velocity, domestic environmental impacts, GHG-emissions.
37
effectively addressed by a social measures package accompanying the introduction of full-cost
pricing; (iii) present an effective communication strategy to be implemented prior and during
the implementation of full-cost pricing; (iv) lay-out a strategy of a phased introduction of the
price increases. The latter is important because abrupt price changes lead to an over-shooting
of price adjustments in effected products (almost all products and services in an economy are
affected) and thus, to a short-term overshooting of general inflation that upsets the population.
Usually, energy/finance ministers and members of energy committees in Parliament
understand the negative consequences of subsidies to fossil fuels, at least partially: that
artificially low energy prices misallocate resources, hurt the environment, and encourage
excessive energy consumption. Yet, there is more to it than that and planners can apply visual
tools such as the chart below to effectively pass that message. The blue arrows show the
positive benefit flow to the population in terms of lower energy prices, the red arrows show
the negative impacts.
Social Impact of Subsidy Policy for Gas/Coal
Commercial coal/gas/power consumers
Household electricity consumers,
Tax Payers and citizens
Subsidized Fuel Price for Thermal Power Generation
State Budget
Companies investing in
RE-based power generation
Reduced
power tariff
Increase
in taxesReduced
public
service
Subsidy from
RE&EE Fund
Welfare loss
from tax-subsidy
distortions
Source: Mostert
In Egypt, like in Indonesia, a number of retail prices for basic goods are kept low as a way of
providing basic goods to households at affordable prices. It is also believed that subsidizing
the cost of energy for industries will generate additional industrial value added and increase
industrial employment. However, the financial subsidies in the oil and gas sectors alone
consume nearly 6% of GDP; if electricity is added to the mix, the subsidies would be as high as
14% of GDP. It is not surprising then that Egypt’s energy and carbon intensity is two-and-a-
half to three times higher than the OECD average. The budgetary costs of the energy subsidies

38
crowd out expenditures on health and on education, their combined share of the budget is
lower than the mount spent on energy subsidies. It is not surprising then that Egypt has an
illiteracy rate higher than 30 percent and an abysmal performance in terms of generating new
technology and economic growth. Better health services and education would lead to a larger
welfare and economic benefits to low income groups than low energy tariffs, so the poverty
alleviation impact is almost certainly negative. Yet, the corrupt Government was caught in a
negative trap. Unable to generate prospects of improved conditions for poor families, it used
subsidized basic goods as a means to keep social discontent from exploding; yet the cost of that
policy deprived the state budget of the funds needed to promote broad-based economic
growth.
The level of fuel subsidies in Indonesia was almost as high: in 2005, the Government spent
US$13 billion dollars on consumer fuel subsidies, equivalent to one-quarter of the government
budget and about five percent of GDP. Price reforms since then lowered the scale of the
problem. In 2010, the cost of electricity subsidies amounted to US$5.1 billion. They will be
eliminated gradually by 2014.
No Government will engage in a removal of fuel subsidies unless it is done as part of an
integrated reform package that effectively protects the purchasing power of low-income
households. The 2005 price reforms in Indonesia, in fact, were accompanied by social
compensations. One can here distinguish between three levels of ambition:
1. The administratively simplest method to protect low-income household from the
impact of increases in the average price of electricity is to introduce a lifeline tariff for
low consumption levels of, say, the first 25 kWh per month. A lifeline tariff is lower
than the full-cost household tariff(s) that are charged for consumption levels above the
lifeline consumption level; that is, higher income households subsidize the
consumption of lower income households.
2. Since the living standards of low-income households are affected also by increasing
prices of kerosene, LPG and transport, a more comprehensive solution is to give
compensating cash transfers to low income households.14 The political advantage of
this is that cash transfers are more visible for recipients. In addition, transport
subsidies to bus operators and expanded investments in public transport used by
poorer part of population can be used to supplement the cash transfers.
3. A yet more ambitious strategy is to present a total poverty abatement package in which
the energy price increases are presented as a means to finance the cost of
redistributive measures and to protect the affordability of public expenditures on
14 Low income households are also affected by the experience that inflation rates at least during a first two years period or so, typically outpace the upward evolaution of low wages and salaries.

39
health and on education. In addition to the instruments listed under 1 and 2, the
Government would introduce new measures to promote affordable housing for low-
income households.15
The launch of a well-designed communication strategy prior to the implementation of the
measures is one prerequisite for success.16 A second is to implement the “compensating
measures” at least two months before the energy price increases. A third is to make sure that
the middle class does not feel their economic interests threatened by the reform package.
Policy makers typically express two concerns with the cash transfer instrument: (i) whether it is
feasible to identify qualifying low-income households, particularly those living in informal
suburbs; (ii) whether a cash distribution mechanism can be organized without large-scale
deviation of funds. It is not easy. But answers have been found in emerging economies that
implemented cash transfer systems for low-income households. In Russia, municipal
administrations paid part of the cost of utility services of low-income households directly to
the utilities. Mexico and other Central American countries used sociological survey methods to
identify qualified poor households, and used modern information technology, such as cash-
credit cards and money transfers through mobile phone systems, as medium to effect the cash
transfers: Different approaches were tested, as each country had to adopt its scheme to its
particular structural characteristics.
The point is that cash transfers are difficult, yet feasible in practice.
15 E.g., the Moroccan package of incentives to revive the construction of low-cost housing, which include tax breaks for buyers and developers alike. Developers building affordable housing get a 10-year exemptions from capital gains tax and land for housing aimed at the poor is provided by the state at a discounted price. The number of units a developer has to build to qualify for the incentives is 500 over two years. The units should be sold at the fixed price of Dh290,000 (US$37,000). Low-income buyers are entitled a rebate on value added tax and the registration fees have also been abolished; together this amounts to a rebate of US$4,750. Fogarim, a guarantee fund, underwrites 70 per cent of the sum loaned, to encourage mortgage providers to lend to lower-income families. Fogarim is funded by a levy of about $12 on every tonne of cement sold in the country. As a barrier to speculation, owners of the low-cost homes are not allowed to sell for four years. For those who cannot afford the monthly mortgage payments of $120, which are the norm for the normal low-cost units, there is an alternative scheme that offers subsidised homes costing about $19,000. 16 It would demonstrate how the package (over)compensates low income households for the effects of the price increases and explain the positive income redistribution effect of the measure: that general fuel subsidies give the largest subsidies to high-income households.

40
Annex IV: Technology Policy: Promotion of Green Growth
The term “green economy” has two applications. One refers to the low-carbon development of
the national economy, the other to “green job creation”. The latter interpretation will be
discussed below. Because an ambitious RE&EE policy – or low carbon technology policy – can
win political support in the long run only if it leads to employment and economic growth
benefits. Thus, Bapenas must develop a strategy for this.
Technology policy is a hotly discussed topic.
There is general agreement on the benefits of state supported R&D at technical universities –
controversies concern only the balance between pure basic research and applied research
done in collaboration with industry. There is also agreement on the benefits of fostering a
national innovation system. There is no universally accepted definition of the term ‘innovation
system’. For the purposes here it can be defined as ‘structured collaboration relationships
among the key actors in the national technology system -enterprises, universities, government
research institutes, ministries and finance institutions - that ensure an efficient flow of
technology information and funds between these in order to maximize the national innovation
potential.’
There is less uniformity of opinion about the cost-benefit ratios of government support to
private R&D. Tax incentives to general R&D in private industry receive widespread support, as
a means to lift the national innovation rate. But strong differences of opinion appear about the
benefits of sector or technology specific public support programs. Opponents claim that the
state is not good at picking winners; that should be left to private investors.17 Proponents of
targeted support recommend focusing on those areas or ‘proximate framework conditions’
that can be influenced by individual countries. These include all the circumstances that directly
or indirectly influence the production situation of industry and commerce in a country. They
frequently originate in the interaction of businesses and the authorities. If a country can
provide better proximate framework conditions than are found abroad, the competitiveness of
businesses in that country increases.
For Indonesia a reasonable and cost-effective green technology policy could be build around
two lines of action. The challenge is to set up a national innovation system capable of
providing efficient public-private-partnerships for innovators. A common prerequisite for
both are policy instruments to create a large market demand for the promoted technologies.
17 That argument ignores that private investors also fail in picking winners. 4 out of 5 high-tech start-ups fail. Yet, nobody critizes angel and venture capital investors for that. Overall they make money; the same analysis should apply to state interventions.

41
1. The “proximate framework conditions approach” can be applied to geothermal power
technology. Indonesia has the largest proven high-temperature geothermal resources
in the world. This makes sense to introduce a concerted program to promote national
scientific and technological know-how and manufacturing of components in
geothermal energy. Inter alia, this will involve know how transfer through strategic
partnerships with leading foreign R&D institutions in the field. This cannot be done
without a prid-pro-quo; Indonesian research institutions must bring along research
excellence and research funds of their own to partnerships. Local manufacturing
requires a large-sized national demand for geothermal power investments and
Technology transfer. The chart below provides a very broad overview of tools that can
be used to promote national manufacturing of green technology, some of which are
relevant for geothermal technology.
2. A complementary instrument to target green technologies more broadly is to set up a
Low Carbon Technology Innovation Fund with two main windows: one to support start-
up technology SMEs with mezzanine-type finance and with nurturing services, the
other a challenge fund providing grants and low-cost loan finance to innovative, but
risky, project proposals submitted by established firms. In this respect one should take
note that supported projects would not be limited to new technology only, but also to
innovative marketing and finance schemes for low carbon technology.
Government Policies to Support Local Manufacturing of
RE Technologies (Example of Wind Turbine Manufacture)
Policy Purpose Countries
1. Local content
requirement
Encourages leading manufacturers to
transfer technology..
Should be applied in a gradual and
staged manner.
Spain, China,
Brazil, Canada
2. Financial and tax
incentives for
investors in RE-
companies
Improves financial viability through
low-interest loans, tax credits, direct
investment in joint ventures.
Denmark,
Germany, US,
Spain, China
3. Indirect financial
support through
market creation
and expansion
Improves economic viability through
the increased volume, feed-in tariffs,
mandatory energy targets,
government tendering, financial and
tax incentive for development and use
of RE.
Germany,
Denmark, Spain,
India, China
-------------------------
UK, US
Source: Mostert

42
Annex V: Bappenas/GIZ Capacity Building and Stakeholder Workshops
Economic Instruments for Reducing Emissions of Greenhouse Gases in Industry
Agenda, February 23-24, 2011
February 23, 2011
Part I: Policy making: Promoting Rational Use of Energy
9.00-9.10: “Introduction” by Mesdin Simarmata, Director for Industry, Technology and
State-owned Enterprises, Bappenas
9.10- 09.20 “Welcome” by Heiner von Luepke / Anandita Susanto, GIZ
9.20-09.30 “Evidence based policy making versus faith-based/slogan driven
policymaking”, by W. Mostert. GIZ-consultant
09.30-10.00 “Full-cost pricing of energy and energy poverty” by W. Mostert. GIZ-consultant
10.00-10.30 “Green Growth: Instruments to promote industrial development and
employment opportunities” by W. Mostert. GIZ-consultant
10.30-10.50 “The Future is difficult to forecast”, by W. Mostert, GIZ consultant
10.50-11.05 Tea break
Part II: Economic Instruments for Carbon Reductions
11.05-11.35 “Economic instruments defined in the Environmental Act 32-2009 and efforts
by the Ministry of Environment in defining frameworks for economic
instruments” by Mr. Gustami, Head of Incentives and Environmental Division”,
Ministry of Environment
12.05-12.30 “Status quo for use of economic instruments for low-carbon development in
Indonesia”, Berly Martawardaya, GIZ-consultant.
12.30 – 14.00 Lunch
14.00-14.30 “Economic principles for subsidy policy”, by W. Mostert, GIZ-consultant
14.30-15.30 “Public finance instruments to attract private finance” by W. Mostert. GIZ-
consultant
15.30-15.45 “Carbon taxation versus cap-and-trade”, by W. Mostert, GIZ-consultant
15.45-16.00 Tea Break
16.00-16.45 “ESCOs where can they be used and how?” by W. Mostert, GIZ-consultant
16.45-17.00 Summing up, closing remarks” by Mesdin Simarmata, Director for Industry,
Technology and State-owned Enterprises, Bappenas
February 24, 2011
Part III: Stakeholder Consultation Workshop
9.00-9.10: “Introduction” by Mesdin Simarmata, Director for Industry, Technology and
State-owned Enterprises, Bappenas

43
9.10- 09.15 “Welcome” by Heiner von Luepke / Anandita Susanto, GIZ
9.15-09.30 “Policies for energy savings: why are financially viable energy saving
investments not carried out?” by W. Mostert. GIZ-consultant
09.30-10.00 ”Voluntary Partnership Agreements: structure and basic principles”, Pak
Edzard Ruehe, GIZ consultant
10.00-10.15 “Addidas efforts to reduce its carbon footprint by collaborating with
companies in its international supply chain”, by Dr. Maren Brauer, advisor,
GIZ
10.15-10.30 Tea break
10.30-11.00 “Potential package of economic instruments for (i) cement industry, (ii) paper
and pulp, (iii) other industries” by W. Mostert, GIZ-consultant
11.00-12.30 Round Table Discussion: industry representatives and senior government
officials.
Moderator: W. Mostert, GIZ-consultant
12.30-12.50 Summing up, closing remarks” by Mesdin Simarmata, Director for Industry,
Technology and State-owned Enterprises, Bappenas
12.50-14.00 Lunch
Participants for roundtable discussion:
• Representatives from industry associations for cement, pulp & paper (somebody who
knows about cogeneration using biomass), textile industry
• Energy engineer from industry with practical experience to respond to questions about
“use of energy audits in industry”
• Lilih Handayaaningrum, Director, Ministry of Industry to respond to questions about
“the experience of the Ministry of Industry with Partnership Program on Energy
Conservation”
• Representative from municipality with experience/responsibility for municipal waste
management
• NGO representative with experience in processing of municipal waste
• Representative from national power company who has been involved in PPA-
negotiations for sales of surplus power from industrial cogeneration plants to the grid
• Representative from Chambers of Commerce about the readiness of Indonesian
industry to adjust to the emerging need for introducing measures and technologies to
reduce greenhouse gas emissions

44
Annex VI: List of Interviews
Ministry of Finance, Climate Change Team.
Bappenas, Mesdin Simarmata, Director of Directorate of Industry, Science Technology and
State-Owned Enterprises, Ade Faisal, Yogi Harsudiono
Ministry of Industry, Ir. Tri Reni Budiharti, Director (Kepala)
Ministry of Environment, Laksmi Dhewanthi, Assistant Deputy Minister for Environmental
Economics; Arif Wibowo, Head of Env. Sound Technology Division
Ministry of Energy, Director of Energy Conservation
Textile Industry, Herry Pranoto, Management Representative
Indonesian Pulp & Paper Association, Muhammed Mansur, Chairman
Cement Industry,
KADIN Indonesia, Indonesian Chambers of Commerce and Industry, Dr. Ing. Ilhamy Elias,
Dadang Sukandar, Oliver Oehms. Environmental Impact Management
BNI Bank Negara Indonesia, Zippora, Assistant Vice President
Bekasi Municipality
World Bank, Timothy H. Brown
Afd, Benoit Chassatte, Céline Bernadat
Danish Embassy, Lars Eskild Jensen, Counsellor. Mogens Søndergård Strarup, Component
Advisor
GIZ, Dieter Brulez, Heiner von Luepke, Anandita Laksmi Susanto, Aris Ika Nugrahanto

45
Part II
Economic Instruments for the Indonesian Industry to Reduce Emissions of Greenhouse
Gases
By:
M. Ikhsan Modjo Berly Martawardaya

46
1 Introduction
1.1 Background
The Government of Indonesia has committed itself to reduce the country’s Green House
Gasses (GHG) emission by 26% in 2020 with national resources, and up to 41% with
international support to mitigation efforts. All these reductions are benchmarked to the
emmission level from a business as usual. To be able to successfully implement this
commitment, the country needs a comprehensive strategy labelled as Nationally
Appropriate Mitigation Action (NAMA), which refers to a set of policies and actions
countries undertake as part of a commitment to reduce GHG emissions.
NAMA includes regulatory framework conditions to provide sufficient incentives, for the
companies to be involved in the national effort to reduce GHG emissions. The term
recognizes that different countries may take different nationally appropriate action on the
basis of equity and in accordance with common but differentiated responsibilities and
respective capabilities. It also emphasizes financial assistance from developed countries to
developing countries to reduce emissions and cope with climate changes. This national
strategy will be subject to international measurement, reporting and verification in
accordance with guidelines adopted by the United Nations Framework Convention on
Climate Change (UNFCC).
With the above commitment, Indonesia is now facing two simultaneous challenges: how to
strive for a more rapid economic growth, at the same time protecting environmental
sustainability through reductions of GHG emissions. The country needs a more rapid
economic growth in order to tackle the lingering unemployment and poverty problems. At
the moment, there are no less than 8 millions people unemployed and 30 millions people
living in poverty in Indonesia (BPS 2011). Obviously, this poses an added challenge to the
efforts of GHG emissions mitigations, as unwanted side effects on the weak and vulnerable
members of society may occur. The implementation of NAMA will also need to pay
attention to the government grand strategy: the so-called "pro-growth, pro-poor and pro-
employment strategies, which was in 2007 amended with the addition the pro-
environment”. Furthermore, there are challenges on how to nudge the policy into different
structures of government (central, regional and district) with different scope of authorities
towards desired goals.

47
Nevertheless, the effort on GHG emissions reductions provides a new opportunity for the
development of the green technology and low carbon renewable energy. These in turn
produce novel economic and business opportunities, as new incentives will be created to
foster expansions of alternative energy sources such as solar, wind, micro-hydro, and
biomass energies. Thus, green technology development may encourage the development
of green economy for Indonesia. Furthermore, it could open trade opportunities and new
type of cooperations between the country and its trading partners.
Given the cross-region and complex multi-dimensional nature of the challenges, the
central government has to lead the effort with a clear strategy and public policy. These
public policy factors are the key elements for succesful efforts to mitigate or adapt to
climate change both nationally and internationally. The effectiveness of the policy is
determined both by its exact content and the processes as well as the roles of the various
components of the nation in its formulations and implementations. Therefore, a dialogue
involving all stakeholders is an imperative.
This report provides a basis to select suitable economic instruments and for further steps
to integrate reduction of GHG emmission in the industrial sector in Indonesia. The sector
has the largest contributions in the formation of Indonesia’s Gross Domectic Product
(GDP) and absorps around 12% of the total labour force. This report includes gap analysis
of the instruments in the industrial sector. It is expected that the results of this study will
be integrated into Indonesian set of NAMAs for the industrial sector, as coordinated by the
Director of Environment ot the National Development Planning Agency (Badan
Perencanaan Pembangunan Nasional, Bappenas).
1.2 Purposes and Objectives
This study aims to undertake a review on feasible economic instruments for reductions of
GHG emissions in Indonesia. With special focus on efforts of achieving emissions
reductions target in the industrial sector, the study attempts to obtain the following
objectives:
a. Identified key stakeholders and their specific interest in GHG emissions reduction;
b. Study policy instruments, fiscal and economic, to reduce GHG emissions;
c. List best practices and good policies taken by other relevant countries;

48
d. To understand and illustrate how fiscal and economic instruments could play roles
in reducing GHG emissions;
e. To identify the appropriate instruments suitable for Indonesian conditions;
f. To inform the dialogue between the Government of Indonesia and stakeholders,
including donor agencies.
1.3 Structure and Outline
This study is outlined as follows: Chapter 1 provides the background, purposes and
objectives. Chapter 2 explores the linkages between mitigations of GHG emissions and
economic instruments as well as providing international examples. Meanwhile, Chapter 3
overviews some suitable instruments, discussed along with their application for industries
in other countries. The chapter will also provide GHG inventory background. In this
chapter discussions of some instruments still being sharpened in academic circle are also
discussed. In Chapter 4, the study preceeds to conduct a stock taking and gap analysis of
economic instruments in Indonesia. This chapter discusses the current policy as well as its
standards and procedures. It also elabores the current environment for policy
implementation as references.
Lastly, Chapter 5 discusses several selected economic instruments for the Indonesian
industries to reduce GHG emissions. The discussion covers the review of the policy
alternatives, the criteria of economic instruments, and key performance indicators for
selected instruments. The study concludes with specific policy recommendations feasible
for Indonesian circumstances.

49
2 Mitigation of GHG Emissions and Economic Instruments in
the Industry Sector
This Chapter describes the linkage between mitigations of GHG emissions and economic
instruments in the industrial sector. Some of their examples in various countries will be
provided. The discussion starts with an overview of the mitigation of GHG emissions in the
industrial sector. It then provides a definition of economic instruments and discusses their
implementations. Lastly, the chapter provides some international examples.
2.1 Mitigation of GHG Emission in the Industrial Sector
Table 2.1: GHG Emissions by Sector in Indonesia (2005)
Sector MtCO2e %
Energy 339.3 18,7
Electricity & Heat 125.3 6.9
Manufacturing &
Construction 93.1 5.1
Transportation 73.9 4.1
Other Fuel Combustion 38.7 2.1
Fugitive Emissions 8.3 0.5
Industrial Processes 16.9 0.9
Land-Use Change & Forestry 1,459.0 80,2
International Bunkers 3.4 0.2
Total 1,818.6 100
Source: WRI (World Resources Institute) website (www.wri.og), accessed on 06 June 2011.18
Industrial sector is one of important sources of GHG emissions in both developed and
developing nations. Industrial GHG emissions come from three sources: fossil fuel
combustions, industrial manufacturing processes and wastes. In most developed nations,
industry sector produces 20% of total GHG emissions.19 Fossil fuel combustions in
industry sector produce 15%, while manufacturing processes produce 5% of total GHG
18 The official GHG emission inventory is provided in the Second National Communication to UNFCC, Ministry of Environment (2010). Nevertheless it does not provide details as Table 2.1. In addition, the data are closely matched while the WRI provides the more latest data. 19 See OECD and IEA (2003).

50
emissions. In China, 21% of total GHG emissions come from industries.20 In Indonesia, the
industrial sector consumes around 47% of the total energy consumptions in 2008. It also
has been the 9th largest source of GHG emmisions, which contributes 0.7% of the total
emissions. The biggest contributor of GHG emissions in Indonesia is Land-Use Change &
Forestry which produces 74.4% of the total emissions. Nevertheless, as the Indonesia’s
GDP is predicted to grow by an average around 7% per year for the coming years, with the
industrial sector underpinned the growth. Thus, the sector’s emissions are also projected
to increase and becoming important.
GHG emissions are different across individual industry sectors. Cement, and iron and steel
industries are the main source of industrial GHG emissions. In the United States, iron and
steel, forest product, chemical, cement, and food and beverages industries are the main
source of Industrial GHG emissions. Emissions from food and beverages, forest product,
and chemicals industries are generated by fossil fuel combustions. On the other hand,
emissions from iron and steel, and cement industries are produced by manufacturing
processes.21 In India, iron and steel, and cement industries produce 50% of industrial GHG
emissions.22 Meanwhile, In Indonesia, five industrial subsectors are identified as
significant emitters. They are the cement, iron and steel, pulp and paper, textiles and
chemical production (Bappenas 2010).
The importance of GHG emissions in the industrial sector has led many nations to
implement several strategies for their reductions. These strategies are briefly discussed
below:
2.1.1 Introducing New Technologies and Procesess
Although the efficiency of industrial processes has increased greatly during the past two
decades, energy-efficiency improvements remain the major opportunity for reducing CO2
Emissions, both for developed and developing nations. The greatest potential lies with
developing countries, where industrial energy intensity is typically two to four times
greater than developed countries (IPCC 1996).
20 See Leggett et al. (2008). 21 See EPA (2008). 22 See INCCA (2010).

51
2.1.2 Fuel Switching
Switching to less carbon-intensive industrial fuels such as natural gas can reduce GHG
emissions in a cost-effective manner. Such transitions are already underway in many
countries. Nevertheless, care must be exercised to ensure that increased emissions from
natural gas leakage do not offset these gains. In addition, the efficient use of biomass in
steam and gas turbine cogeneration systems also can contribute to emissions reductions,
as has been demonstrated in the pulp and paper, forest products and some agricultural
industries (such as sugar cane) (El-Fadel, Zeinati et al. 2001).
2.1.3 Cogeneration and Thermal Cascading
Increasing industrial cogeneration and thermal cascading of waste heat have significant
GHG reduction potential for fossil and biofuels. In many cases, combined heat and power
or thermal cascading is economically cost-effective. For example, coal-intensive industry
has the potential to reduce its CO2 emissions by half, without switching fuels, through
cogeneration. Thermal cascading, which involves the sequential capture and reuse of
lower temperature heat for appropriate purposes, requires an industrial ecology approach
that links several industrial processes and space and water conditioning needs, and may
require inter-company cooperation and joint capital investment to realize the greatest
gains (El-Fadel, Zeinati et al. 2001).
2.1.4 Process Improvements
Industrial feedstocks account for an estimated 16% of industrial sector energy, most of
which eventually ends up as CO2. Replacing natural gas as the source of industrial
hydrogen with biomass hydrogen or with water electrolysis using carbon-free energy
sources would reduce carbon emissions in the manufacture of ammonia and other
chemicals, and, if inexpensive enough, might ultimately replace coking coal in the
production of iron. Efforts to produce cheap hydrogen for feedstocks need to be
coordinated with efforts to produce hydrogen as a transportation fuel. Industrial process
alterations can reduce all process-related GHGs significantly or even eliminate them
entirely (IPCC 1996).
2.1.5 Material Substitution
Replacing materials associated with high GHG emissions with alternatives that perform
the same function can have significant benefits. For example, cement produces 0.34 tC per
ton of cement (60% from energy used in production and 40% as a process gas). Shifting

52
away from coal to natural gas or oil would lower the energy-related CO2 emissions for
cement production, and additional CO2 reductions from other techniques (e.g., the fly-ash
substitution and the use of waste fuels) are possible. Moreover, lightweight packaging, for
example, will cause lower transport-related emissions than heavier materials. Material
substitution is not always straightforward, however, and depends on identifying
substitutes with the qualities needed to critical specifications (IPCC 1996).
2.1.6 Material Recycling
When goods are made of materials whose manufacture consumes a considerable amount
of energy, the recycling and reuse of these goods can save not only energy but GHGs
released to the atmosphere. For example, it is estimated that primary materials release
about four times the CO2 of secondary (recycled) materials in steel, copper, glass and
paper production. For aluminum, this figure is substantially higher. Recycling can involve
restoring the material to its original use or “cascading” the material by successively
downgrading its use into applications requiring lower quality materials (IPCC 1996).
These strategies are complementary to each other. Thus, it is a common practice that a
nation use different types of strategies at the same time. In order to successfully
implement those strategies, one can use several different types of economic instruments
which discussed in the next Subsection.
2.2 Definition of Economic Instrument
This paper use a definition of economic instruments in the context of GHG emissions
reductions as a policy package that allows the private sectors to maximise investment in
clean and green technologies, and management practices. The policy packages could
include fiscal and financial instruments, incentives and other regulations such as fuel and
energy efficiency standards in such a way to boost private sector investments and to fulfil
GHG emissions reductions targets.
The policy also uses market mechanisms and economic incentives for agents to internalize
environmental costs. Thus, the policy allows agents such as firms to make an individual
choice corresponds social choice. For example, a factory that discards its waste in the
upstream does not bear the cost of polluting the river. However, the people who live in the
downstream are suffered from deterioration of water quality. The government can

53
charges pollution tax on the firm as a compensation for its production activity that
pollutes the river. The pollution tax increases the production cost; thus, the firm will
reduce its production to a level that coincides the people value of clean river. Incentives or
disincentives indeed work best in a package approach, which combined with more
stringent policy instruments such as standards for energy efficiency, or possible penalities
for non compliance.
2.3 Economic Instrument Specific for Industrial Sector
GHG emission reductions policy must be considered in the context of existing economies.
In the real world, GHG emission is only one of many externalities; competition is not
perfect; information and markets are not complete; and distorting taxes and transfers are
widespread. These observations are important because many analyses of GHG emission
reductions policy assume that the externality of emissions is the only distortion that exists.
The conclusions of such analyses may be misleading or incorrect (OECD, 2003).
Several economic instruments have been used to reduce GHG emissions in the industrial
sector. These instruments could be classified either as a command-and-control or market-
based instruments. The command-and-control instruments consist of rules and
regulations prohibiting, limiting or requiring certain forms of behaviour. Whereas the
market-based instruments, such as tax, subsidy, and tradable permits, are designed to
create appropriate patterns of incentives or disincentives for economic agent to behave
accordingly. A variety of potential Industry-specific measures, discussed briefly below,
could encourage improvements in energy efficiency and reductions in process-related
emissions.
2.3.1 Industry-Specific Tax Incentives
Tax incentives could be designed to encourage continued innovation in energy-efficient
and low GHG-emitting processes. Most industrial processes have a relatively short lifetime,
on the order of a decade or less, while facilities are used for several decades. Hence, there
are large opportunities to rapidly introduce low-emitting technology into the
manufacturing process as part of normal capital-stock turnover. Under present
circumstances, where GHGs are uncosted externalities, there are no compelling reasons
beyond profit maximization for companies to choose a lower GHG emission strategy over a
higher one when they are planning new processes or products. Even when it is cost-
effective to introduce low GHG-emitting technologies, there may be barriers to doing so.

54
Hence, there is a need for additional incentives, perhaps by accelerating depreciation
taxes, to encourage firms to utilize the natural cycle of capital stock replacement to
introduce less GHG intensive technology and production facilities to achieve further
reductions (OECD 2003).
2.3.2 Government Procurement Programs
Governments could establish procurement requirements for products that minimize GHG
emissions in their manufacture and use. If drawn flexibly, government purchasing criteria
would stimulate suppliers to develop low GHG-emitting products that met both
governmental and larger market needs (El-Fadel et al. 2003).
2.3.3 Emission Standards and Non-Transferable Licenses
The government could set industry- and product-specific GHG emission standards, like the
energy-efficiency standards for appliances or vehicles, can bring about more certain
compliance. These instruments can help to overcome a variety of barriers and shift
production to lower GHG-emitting industrial practices. These barriers can include lack of
information about high-efficiency products, financial analyses or investment criteria that
overemphasize investment costs and de-emphasize operating costs, or difficulty in
obtaining more efficient products through suppliers. However, reaching agreement about
the appropriate standards for different types of equipment in different applications can be
difficult, while monitoring and enforcement costs may be high and may raise the price to
consumers.
Non-transferable emission licenses refer to a system licenses cannot be transferred
(exchanged) between firm: each firm’s initial allocation of pollution license sets the
maximum amount of emission that is allowed. Successful operation of license schemes is
hindered if polluters believe their action are not strictly observed, or if the penalties on
polluters not meeting license restrictions are low relatives to the cost of abatement.
License schemes will have to be supported, therefore, by pollution monitoring systems
and by sufficiently harsh penalties for non-compliance (OECD 2003).
2.3.4 Voluntary and Mandatory Agreement
Voluntary agreements between the government and industries can be an effective way in
achieving energy and GHG reductions. These include negotiated but voluntary targets for
achieving emissions reductions, voluntary adoption of high-efficiency products or

55
processes, cooperative RD&D efforts, and agreements to monitor and report emissions
reductions based on voluntary actions. Voluntary agreements with industry groups to
improve general environmental quality could be expanded to include GHG reduction (e.g.,
expansion of government-industry environmental covenants in The Netherlands), as could
the ISO 14000 process. If voluntary agreement cannot be reached then the government
can adopt a command-and-control approach, which involves specifying required
characteristic of production processes or capital equipment used in industries. In other
word, minimum technology requirement are imposed upon potential polluter. Examples of
this approach have been variously known as best practicable means (BPM), best available
technology (BAT), and best available technology not entailing excessive cost (BATNEEC)
(OECD 2003).
2.3.5 Localisation
Pollution control objective, in so far as they are concerned only with reducing human
exposure to pollutants, could be met by moving affected persons to areas away from
pollution source. In the implementation, ex-post relocation decisions are rare because of
their draconian nature. However, it has been far more common to move pollution sources
away from areas where people will be affected (ex-ante), or to use planning regulation to
ensure separation. Planning control and other forms of direct regulation directed at
location have a large role to play in the control pollution with localized impacts and for
mobile source pollution. They are also used to prevent harmful spatial clustering of
emission sources (OECD 2003).
2.4 Economic-Wide Instruments
In addition to the industry-specific measure, economy-wide instruments could affect
emissions in the sector by encouraging processes that are less energy- or fossil fuel-
intensive. These economy-wide instruments are also discussed below.
2.4.1 Subsidies and Subsidy Elimination
An activity can be subsidized in many ways. A government may transfer funds to an
enterprise, provide preferential tax treatment, supply commodities at below market
prices, or restrict competing products to assist a particular activity. Many countries
including Indonesia currently subsidize some activities that emit GHGs (e.g., subsidies that
reduce the prices of fossil fuels). Eliminating permanent subsidies that encourage fossil
fuel use would reduce GHG emissions and increase real incomes in the long run.
56
On the other hand, temporary subsidies could be offered for particular activities aimed at
limiting GHG emissions. Such subsidies might be directed at fostering adoption of emission
abatement technologies, or stimulating development of improved GHG mitigation
technologies. Eliminating subsidies changes the incomes of affected groups. Compensation
for groups whose incomes are adversely affected may need to be considered. In the case of
financial subsidies, the net effect depends on how the revenues are redistributed. Raising
distortionary taxes to finance the subsidies increases the cost of this option.
2.4.2 Domestic Taxes
A tax pollutant emission has for long been the instrument advocated by economists to
achieve a pollution target. It is useful to distinguish between three case: (a) the pollution
target is the economically efficient level of pollution (the level which maximizes social net
benefit); (b) a specific target is sought, but it is set according to some criterion other than
economic efficiency; and (c) an emission reduction of some unspecified amount is sought.
Where taxes or charges can be used as a penalty on discharges, subsidies can be used to
reward the reduction of discharges in a similar manner. The financial incentive is
effectively the same, though the flow of funds is in a different direction. A subsidy program
will involve a transfer of funds from the government to the industry, while a charge
program would be a revenue source for the government (Duncan Austin 1999). Given that
taxes on emission equivalent to subsidies (negative taxes) on emission abatement, it will
be convenient to deal explicitly with tax instruments, and refer to subsidy schemes only
when there is a significant difference .

57
Figure 2.1: An Economically Efficient Emission Tax
Figure 2.1 illustrates the mechanism of an emissions tax. If the firm have regard to the
pollution they generatein absence of an emission tax, emission will be produced to the
point where the private marginal benefit of emission zero. This is shown as M”, the pre-tax
level of emissions. Now suppose an emission tax was introduced at the constant level rate
µ* per unit emission, the value of marginal damage at the efficient pollution level. Given
this, the post-tax marginal benefit schedule differs from its pre-tax counterpart by that
value of marginal damage. Once the tax is operative, profit-maximizing behaviour by firms
leads to a pollution choice of M* rather than M” as was the case before the tax.
We started earlier that an emission tax and an emission abatement subsidy (at the same
rate) have an identical effect in terms of pollution outcome. However, the two instruments
do have some very important differences. Most importantly, the distribution of gain and
loses will differ. Taxes involve net transfer of income from polluters to government, while
subsidies lead to net transfers in the other direction. This has important implications for
the political feasibility of the instruments. It is also could affect the long-run level of
pollution abatement under some circumstances.
2.4.3 Tradeable Permits
A country committed to limiting its GHG emissions could implement such a policy using
tradable permits for energy related CO2 emissions, non-energy sources of CO2, emissions
of other GHGs, and carbon sequestration. Energy-related CO2 emissions could be
controlled by a system of tradable permits for the carbon content of fossil fuels consumed.
Under such a scheme, regulated sources are given (or must buy) permits for the carbon
µ*
0 M* M” M
Marginal
benefit
(after tax)
Marginal benefit
(before tax)
Marginal damage

58
content of the fossil fuel. Tradable permits could also be applied to actual energy-related
CO2 emissions. Participants are free to sell surplus permits or to buy permits to achieve
regulatory compliance. Downstream of the permit system, the effect is comparable to that
of a carbon tax. In principle, tradable permit systems could also be used to regulate non-
energy CO2 emissions, emissions of other GHGs, and carbon sequestration. Permits earned
for carbon sequestration could be sold to sources that need permits for their emissions.
2.5 International Examples
Economic instruments are varied across nations. One reason for variations is that each
nation has different institutional constraint. Another reason is that each nations has
different economic endowments, and industry structure. Hence, each nation needs
different approach in implementing economic instruments. International application of
economic instruments are illustrated below. Three cases have been selected due to their
wide applications in many countries: the implementation of tradeable permits, domestic
taxes and voluntary private iniative in energy management.
2.5.1 Tradeable Permits Policy
The development of tradeable permits was started by the United States in the 1970's.23
Tradeable permits implemented for the first time in 1974 by the Environmental
Protection Agency (EPA). EPA tried the first emission trading program in 1974, and
introduced it to the public in 1976. The success of EPA emission trading program led to
development of other tradeable permit programs. In 1980's, EPA authorized lead trading
for gasoline refinery. In 1984, Denver State developed tradeable permits program to
reduce water pollution in Denver; however, this program was unsuccessful. In the late
1980's, The U.S. government developed the first tradeable permit program for global
pollutant that is the CFC Trading to slow ozone depletion. After the amendments of Clean
Air Act in 1990, EPA introduced SO2 trading program to control acid rain. This program
performed well; nevertheless, false prediction undermined the success of this program. In
1994, Southern California developed the Regional Clean Air Incentives Market (RECLAIM)
to control the emissions from nitrogen oxides and sulphur dioxides. Following the
authorization of Climate Stewardship Act in 2003, the U.S. government developed
emission trading program that encompass broad range of GHG emission, such as CO2,
HFCs, CH4, PFCs, N2O, and SF6.24
23. For further explanation see Stavins (1997). 24. See Paltsev et al, (2003).

59
Tradeable permits is not available in Europe until early 2000's. In 1997, the European
Union signed the Kyoto Protocol, and designed EU-ETS (European Union Emissions
Trading Scheme) to support its commitment in GHG emission reduction. EU-ETS required
each EU member to implement domestic emissions trading system before 2005.25
However, each EU Member State designed different emissions trading system. For
example, Germany applied mandatory emissions trading system, and distributed the
permit free of charges. In contrast, UK used voluntary emissions trading system with
incentives, and distributed the permit through auctions. Another issue in EU-ETS is how to
link CDM credits with the credits which is issued by the emissions trading system.
25. See Haites and Mullins (2001).

60
Box 1
Similarities of Environmentally Related Taxes and Tradable Permits
When governments seek to address environmental challenges through market-based
instruments, the debate is typically between taxes and tradable permits. The differences
between taxes and tradable permits are, however, very small in theory, when it is assumed
that there is a fair degree of certainty about the future. Specifically:
1. If an environmentally related tax set at rate per unit of emissions T leads t+o an emissions
level Q, then alternatively regulating the same problem by issuing a quantity Q of tradable
emissions permits will lead to a permit price per unit of emissions T (if the permit market is
competitive).
2. The level and pattern of pollution abatement, as well as the incentives for innovation, will
be the same under the two instruments. In both cases, the incentive firms face for abatement
at the margin is T per unit of emissions, and firms would undertake abatement where the cost
per unit is less than this incentive. In the diagram, the abatement undertaken reduces
emissions to Q from the pre-regulation level U.
3. The abatement cost incurred by firms will be the same. The total abatement cost incurred
by firms in reducing their emissions from U to Q is represented by the area labelled A under
the marginal abatement cost schedule. Properties 1-3 hold regardless of whether the permits
are distributed free or sold (e.g. through an auction). In either case, the value of the last
permit used is given by the abatement cost that would otherwise be incurred, and this is given
by the marginal abatement cost at emission level Q, which is T per unit. The value of tradable
emissions permits, therefore, is independent of the way in which the permits are distributed
(so long as the permit market is competitive). Where permits are auctioned, there is a further
point of similarity between an emissions tax and tradable emissions permits:
4. If the permits are sold in a competitive auction, then the auction revenue yield will be Q*T,
which is the same as the tax revenue that would be collected from the environmentally
related tax.
It should be noted, however, that real-world variations can cause differences between the two
instruments. First, information is usually never perfect, requiring that policy makers rely on
assumptions and have to factor in tolerances for risk about the errors of their assumptions.
Second, compliance and administrative costs of the instruments have to be factored in. Third,
the efficiency of permit markets are not always guaranteed, given concerns about market
power, extent of participation, level of trading, and design constructs. Fourth, in a tax regime,
new innovations would effectively lead to reduced total emissions. Finally, there is an
important difference in how a tax regime and a cap-and-trade regime interact with any other
policy instruments that apply to the same environmental problem. Under a pollution tax,
additional policy instruments could lead to further emission reductions; under a cap-and-trade
regime, that is not the case. Since the cap is fixed, additional abatement will only lower the
price of permits.
Source: OECD (2008) at Perman, et.al, 2003).

61
Stavins (1997) highlights several points for the application of tradeable permits. First is
the human capital constraint. Command and control regulation needs regulator with
technical or legal-based skills; in contrast, economic instruments require market-trained
thinkers to understand market reaction. Second is the political constraint. Some political
groups, i.e. environmental activists, labelled tradeable permits as unethical, because it
gives firm “right to pollute”; and, they can create political barrier for implementing
economic instruments. Third is the valuation problem. EPA's SO2 trading program shows
how inaccurate valuation can hinder the success of emissions trading program. Also,
conducting economic valuation is difficult, because economic valuation attempts to value
indirect or unrevealed preference on better environment. Last is the firm strategic
decision. Firms respond strategically to every incentives or disincentives in market
economy. Regulator must understand industry and firm cost structure in order to
understand firm respond to marketable permits or other economic instruments.
2.5.2 Domestic Tax Policy
Domestic Tax policy is widely used in many nations. In Europe, it has been implemented
since early 1990's. European nations used fees and charges for pollution control, and GHG
emissions reduction.26 For example, France uses emission charges on N2O emissions from
industry. Norway uses carbon tax on CO2 emissions from industry. The other nations, such
as UK, Austria, and Finland use energy tax to limit GHG emissions from industry.
In Latin America, it is widely used alongside other economic instruments; also, they use
charges and fees policy beyond pollution control (Table 2.2). Brazil use charges and fees
policy for water conservation and control pollution from oil exploration. Barbados
implements environmental tax on imported goods. Venezuela applies environmental tax
on forestry sector and wood industry to prevent deforestation. Mexico charges payment
on fishing in order to support fisheries sustainability. Colombia uses pollution tax to
control water pollution.
26. See OECD and IEA (2003).

62
Table 2.2: Economic Instruments in Latin America
Country Name Regulation Explanation
Brazil Payment for the right to use water
Financial Compensation for oil exploration
Barbados
Environmental tariff on imported durable goods
Tariff collection for solid waste management Fiscal incentives for creating rain water reservation in hotels
Jamaica Payment for the right to use water Colombia Retributive rate for water pollution
Chile Eco-labeling for ozone and organic agricultural goods
Individual Transferable Fishing Quotas
Guatemala
Payment for the right to use water
Subsidies for reforestation
Eco-labeling for ozone and organic agricultural goods
Certification for Eco-tourism
Mexico Surcharge on Gasoline
Payment for the right to use water
Payment for sports fishing Venezuela Tax on deforestation
Source: UNEP (2003).
Blackman (2006) uses Colombia experience to explain the difficulties of economic
instrument implementation in developing nations. First, Colombia has difficulty to charge
the pollution fee fairly from all polluters. Setting the fee is the most difficult part in charges
policy. If the fee (cost) outweighs the benefit, firm will not comply with the fees policy.
Second is the coordination problem. Colombia faces two coordination problems. The first
problem is synchronization between the new charges policy, and the old command and
control regulation. The second problem is the compliance of local government and
business sector to the new program. Blackman argues that these problems are common in
the first stage of implementation. To face these challenges, the government needs strong
political willingness to assure all polluters that the new economic instruments program is
more transparent and accountable than the previous command and control regulation,
especially in cost and benefit allocation.
2.5.3 ESCO: Private Initiative in Energy Management
Private initiative is an important aspect to deal with climate change issue. Many
governments in developed and developing nations have encouraged private sector to take
active roles with economic incentives. The rise of economic instruments also encourages a

63
new innovation in the business sector that is the ESCO (Energy Service Company). ESCO is
a company that specializes in giving advice, managing, and conducting energy saving
project for the business sector. ESCO can be categorized as market innovation, because it
comes from business sector initiative to face environmental issues, especially energy
issues.
The development of ESCO was originated in United States after a rapid increase of energy
prices in 1970's. Increase in energy prices created a need for energy efficiency. Several
business practitioners in the United States responded to this needs by developing ESCO.
ESCO was originally small in scale, but, after several years, most ESCO decided to merge
with another ESCO to form larger company. Currently, there are four major ESCO in the
United States; they are Ameresco, Honeywell International, Chevron Energy Services, and
Carrier Green. Many International donor organizations, i.e., the World Bank and USAID,
have been promoting ESCO to developing nations since 1990's. They focused the first
ESCO promotion in developing nations with large population, such as India, China, and
Brazil.27 India had been implementing ESCO since 1992. China and Brazil implemented
ESCO later in 1998. The government in each nation supports ESCO implementation. For
example, the government of Brazil obliges electricity sector to spend 1% of its revenue in
energy efficiency program. In China, the government encourages ESCO practice by
providing guaranteed commercial loan to support energy efficiency program. In India, the
government creates BEE (Bureau of Energy Efficiency) that responsible to create energy
efficiency codes, labels, accreditation, and standards in order to support ESCO practice.
The above suggests that government intervention is important in the early stage of ESCO
implementation. There are two areas that need government intervention. First is the
financing. ESCO is still new to banking sector in developing nation, so they are still
unfamiliar with ESCO practices. Moreover, most ESCO in developing nations are small in
scale, and have weak asset based. It makes banks reluctant to finance ESCO practices.
Second is the institutional support. Many business practitioners in developing nation are
still unfamiliar with ESCO practices and energy efficiency programs. The government must
introduce ESCO practices through laws and regulations. India is a good example of
government institutional support for ESCO practices.
27. For further explanation see Econoler International (2005).

64
3 Current Condition in Indonesia
This Chapter provides an overview of the current condition related to efforts to mitigate
GHG emissions in Indonesia. The aim is to set the stage for gap analysis discussion in the
next Chapter. It first discusses key stakeholders and industry sectors in Indonesia. It then
provides regulatory and policy framework. Finally, it explores existing economic
instruments used to reduce GHG emissions already in place.
3.1 Key Stakeholders
As it is the case in many countries, there are many interests in the formulation of the
environmental policies in the Indonesia’s industrial sector, particularly in relation to the
stated target of 26% and 41% reductions of the GHG emissions. The parties involved may
have conflicting interests. These parties are not limited to the executives and the
legislatives, but also interest groups such as donors, business and industry associations,
non-government organizations (NGOs), academicians and the media. The interactions of
these parties result in the GHG emissions reductions policy in Indonesia. This Section
briefly discusses stakeholders in the formulations of this policy, which analyse actors
involved, their characteristics and channels influences on the policies.
3.1.1 The Direct Influences Group: the Government and the Parliament
There are two big groups of players in the formulation of GHG emission mitigations policy
in the industrial sector in Indonesia: the direct and indirect influences groups. First are the
government institutions or the executive branches. Within these subgroups, there are at
least seven main institutions of the President, the National Agency for Development
Planning (Bappenas), the Ministry of Environment (MoE), the Ministry of Industry (MoI),
the Ministry of Finance (MoF), the Ministery for Energy and Mineral Resources (MoEMR)
and the National Council on Climate Change (Dewan Nasional Perubahan Iklim – DNPI).
Nonetheless, other ministries as well as the Regional and District government include in
this subgroup. They are the most powerful stakeholders beside the national parliament.
They could affect directly the formulation of strategy including budget allocations for the
GHG mitigations policy, while other could only affect indirectly.
The first seven institutions - the President, the Bappenas, the MoE, the MoF, the MoI, the
MoEMR and the DNPI - are the main institutions responsible for designing the policy as
well as providing the budget. President Susilo Bambang Yudhoyono, or SBY as he

65
commonly known, in G20 meeting in 2009 at Pittsburgh announced Indonesia’s goal to
decrease GHG emissions by 26% and 41% from business as usual condition by 2020.
President SBY has a stake to move Indonesia to reach the target. On the one hand,
weakening discipline in second term in office and competing priorities, such as the need to
revive the national industry, may distract his focus. On the other hand, successful
strategies and programs for GHG emissions reductions could be something that can be
used as flagship program to be promoted internationally
Meanwhile, Bappenas is the chief architect in formulating GHG emissions reductions
policy strategy at the national level. Bappenas was used to be a very powerful technocratic
institution in Indonesia in a New Order era. Even up to now, it is still considered as one of
the institutions, beside Bank of Indonesia and the Ministry of Finance, which have many
capable technocrats in Indonesia. Many technocrats previously worked in Bappenas are
recruited elsewhere in the government institutions or the private sectors, including
international agencies operating in Indonesia. It was used to be powerful not only because
its capability, but mainly because it had authorities to approve or decline budget proposals
submissions from other line ministries or government agencies, including the MoE.
However, after the enactment of the new law of state financing (Law No. 17/ 2003), it’s
authorities in the budget are limited.
Bappenas is currently headed by Professor Armida Alisjahbana, an economic professor
from Padjajaran University Bandung. The Deputy of Natural Resources and Environment
of the Bappenas, headed by Dr. Endah Murniningtyas, has the task to implement the policy
formulation and implementation of national development plans in the field of natural
resources and environment, which includes how to achieve the targets of reducing GHG
emissions by 26% and 41%. Nevertheless, the Directorate of Industry, State Owned
Enterprise and Technology which is a subset of Deputy for Economy, also involves in
formulating the environment policy which related to the industry.
The MoE is the institution responsible to assist the President in formulating policies and
coordination in the field of environment and control of environmental impacts. In terms of
GHG emissions for industry, the MoE not only gives inputs to policy formulation by
Bappenas. MoE also has duties to translate the policy into its strategic plan (Rencana
Stratejik/ Renstra) every five years, which contains environmental strategies, policies, and
programs. This includes formulating the Plan for Environmental Protection and

66
Management (Rencana Perlindungan dan Pengelolaan Lingkungan Hidup – RPPLH) at the
national level and supervising the Regional Governments to formulate it at the local level.
Every year, MoE also translates the Renstra into an annual Working Plan (Renja-KL),
which contained planning for a particular year, projects and a budget proposal. In
designing projects, MoE might be influenced by other stake holders. Nevertheless, both the
project and the budget must obtain approval from the parliament. They too must pass
reviews from other government institutions: the Bappenas and the MoF.
MoE is staffed with many knowledgeable and committed people to protect environment as
it form for. But few since Dr Emil Salim, its first minister when the ministry set up in 1978
and still combine with development supervisory, managed to make major shift in
development policy due to lack of cloud in policy making. While there has been increase in
profile and authority, MoE not always win the policy battle with industry interest groups
and the MoI.
Another stakeholder within the executive branch is the MoI. This ministry is mandated
with the task of developing Indonesia industries as well as authority to regulate them. MoI
have Centre of Green Industry and Environment in its Institute for Industrial Policy,
Business-Climate and Quality Study, but environment appears to be the foremost concern
for this ministry. The ministry is currently headed by Mr. MS Hidayat, who used to be the
head of the Indonesian Chamber of Commerce and Industry (Kamar Dagang dan Industri
Indonesia - KADIN) and an outspoken business defender. The MoI also cordinates
industry-related GHG mitigations policy implementation. Similar the MoE, the MoI also has
duties to translate the industry-related policy into its strategic plan (Rencana Stratejik/
Renstra) every five years as well into an annual Working Plan (Renja-KL), which contained
planning for a particular year, projects and a budget proposal. The Ministry is too
influenced by other stake holders, particularly business groups. Both their project and the
budget must obtain approval from the parliament, and must pass reviews from the
Bappenas and the MoF.
The Ministry for Energy and Mineral Resources (MoEMR) is another stakeholder with
growing important in the efforts of reducing GHG emissions. Its importance is due to its
authority in the national energy policies, which are most crucial and hence influential on
the GHG emissions of the industry sector. In addition, the MoEMR supervise energy audits

67
for firms mostly in the industrial sector. This ministry is currently lead by Darwin Saleh, a
politician as well as an academician from the University of Indonesia.
An institution which become more relevant in recent years is the National Council on
Climate Change (Dewan Nasional Perubahan Iklim - DNPI). DNPI was founded by PP No
46/2008 to coordinate national strategy, program and activity on climate change. DNPI is
a cross-departmental body which consist 17 ministries plus Meteorology & Geophysics
Agency (BMG). DNPI lead directly by President with Rahmat Witoelar, former Minister of
Environment as the second in line. While Rahmat Witoelar is widely respected, do not
having a cabinet post is costing the agency effectiveness and stature in decision-making.
After big-bang decentralization in 1999, the Regional Governments became more
important in Indonesia. They have wide discretions in national policy implementations in
their localities. In this context, the recent Environment Law of 32/2009 spefically
mandates an active participation of regional governments in protecting and conserving
local environments. The regional governments are now too required to formulate the
Regional Plan for Environmental Protection and Management (Rencana Perlindungan dan
Pengelolaan Lingkungan Hidup – RPPLH), which supervised by the MoE. Nevertheless,
most local government is hard pressed to increase revenue, hungry for industrial investor
and weak constituent for green policy, especially outside Java. This has caused the
environmental priority uneven across the regions.
Other national institutions are also involved in the formulation and implementation of
GHG emissions mitigation policy. These include line ministries such as the Ministry of
Transportation (MoT) and the Ministry of Agriculture (MoA). However, their interests and
influences on the GHG emissions mitigation are limited to a specific aspect which related
to their portfolio.
The parliament is another actor which could directly influence the formulation and the
implementation of GHG emission mitigation policy in industry sector, particular the
Commission VI (responsible for Industry), the budget agency and the Commission VII
(responsible for Environment and Energy). Approval of the parliament is required for
every detail of the budget used in implementing the policy in the industry. Commission VII
and the budget agency of the parliament of the parliament could increase or decrease
budget allocation for certain programs or projects, or even proposing new ones for the

68
MoE. Commission VI oversees the national industry and programs and project of the MoI.
All political parties have their representatives in the Commission VI and VII. They come
from vast different backgrounds and know-how about industry and environment. Most of
them are businessman, while some are activists, academicians, veteran politicians or
entertainers. Parliament members have various interests. Some have genuine concerns
about environment, while others only concern about their political career and personal
interests. Due to its powerful direct influences on the policies and the budget, parliament
members are often approach by other stakeholders, such as business groups, the
ministries, academicians and NGOs.
3.1.2 The Indirect Influences Group
Besides stakeholders outlined above, there are also other groups of players which could
affect the formulation and the implementation of GHG emissions reduction policy in the
industrial sector. However, unlike the main players, their influences on the policy are
indirect. They affect the formulation and the allocation by influencing the main players of
the government institution (bureaucrats) and parliament factions (members). For the
purpose of this study, these players are grouped in four different categories: external
donors, business association, industry associations, and other stakeholders. They
capability to affect the policy are vary, depending on their scale, capital, organization,
problem know-how and other organizational resource. Generally, better organization and
abundant resources correspond to better abilities to influence the policy.
Business groups and associations are the first category of stakeholders that could affect
the budget indirectly. Some of them have strong influences on industrial and
environmental policies. Two important associations are KADIN and the Indonesian
Businessmen Council (Asosiasi Pengusaha Indonesia – Apindo). They have strong and
robust connections both with the ministries as well as with politicians in the parliament.
As has been mentioned above, the current minister for industry, Mr. MS Hidayat, is used to
be the leader of KADIN. The organization is a vocal business group lobbyist in Indonesia
and based on the similarity of activity, profession, and interest in business and industrial
development in Indonesia. Similarly, Apindo is also a business group lobbyist in Indonesia,
with main concerns are on industrial relation. Nevertheless, they too often voice a strong
concern regarding government regulations when conflicting with their interests, as are
often the case with environmental regulations.

69
The second one is the external donors. Their influences on formulation and
implementation of the GHG emissions reductions are becoming increasing in Indonesia.
The development of the Indonesian Climate Change Sectoral Roadmap (ICCSR) document,
for example, was supported by the Deutsche Gesellschaft für Internationale
Zusammenarbeit (GIZ) through its Study and Expert Fund for Advisory Services. The
external donors cooperate not only with government but also with civil society and
communities. With increasing international cooperations to tackle the issue of global
warming and climate change, it is foreseen that their role both in policy formulation and
implementation will become more important.
The third category of this group is the industry associations. They have interest in GHG
emissions reduction policy when it affects specifically on their industries . Some business
groups such as the Cement Association and Steel Association have strong ties and
connections with the government and the parliament members. They way they influencing
the policies are also vary. They could request an audience with ministers, director
generals or even higher level of government heads. Powerful companies such as PT Semen
Gresik and PT Krakatau Steel could also directly request the parliament to veto a policy if
they see it not suit to their interest.
The last category is the academicians, the NGO and the media, which concerned about
environment and GHG emissions. They usually are actively voicing their opinions on
environment through the media or from frequent consultations or seminars with the
government. Academicians could influence the policy, for example, through medium such
as public seminars or workshops. Indonesia too has a strong presence of international
environmental NGOs, such as WWF and Greenpeace. National NGOs, such as Walhi and
Pelangi, which are deeply concern with GHG emissions issues. They have wide networks to
local NGOs, academia, press and the government. There have been instances of conflict
between NGOs and industry that pollute environment. Similarly, green topic is becoming
more attractive lately and gets increasing coverage in media and dicussions by the
academia, especially in big cities like Jakarta, Bandung, Jogjakarta and Surabaya where
middle class is significant.
Next, a brief overview about industrial sector in Indonesia is given. This section provides
some background before discussing regulation and policy framework currently
implemented with regard GHG emissions reductions within the Indonesian industry.

70
3.2 Industrial Sector in Indonesia
The industrial sector is one of the leading sectors in the Indonesian economy. The sector
accounted for around 30% of the nation’s GDP, and contributes about 12% of the total
employment. It reached a hallmark of structural transformation in 1995 when the overall
industry’ share reached 41.8% of GDP and overtook the service sector’s share as the main
source of GDP. At the same time, the industrial sector contributions towards total
employment was more than 20%. Thereafter, the industry sector continued to be the
largest contributor to national income, although it’s shares slightly declined to only
around 30% in 2000s.
Between 2008 and 2010, the industrial sectors grew by an average rate of around 4%.
This growth is less than half of the average growth rates experienced during the 1980s
and 1990s, where industry growing by an average of more than 10% per year. Much of the
expansion at that time was concentrated in low-skill, labor-intensive, export-oriented
industries, and it contributed greatly to a decline in poverty by providing expanded job
opportunities. Since then, however, the industrial sector has experienced a slow-down.
One of the most commonly cited reasons for the turnaround is the country's substandard
infrastructure, which forces up transportation costs. Port facilities and other logistics
systems in particular are widely regarded as needing urgent attention. Two government-
sponsored infrastructure summits, one in January 2005 and another in November 2006,
had only limited success in encouraging foreigners to invest in infrastructure projects.
Since the late 1990s, Indonesian manufacturing has also faced increased competition from
other low-wage producers such as India and China. Furthermore, there are problems
related to the industrial relation, which has rendered minimum wage rose faster than
productivity. This decreasing competitiveness has caused not only declining industrial
growth, but also reduce the ability of the industrial sector to absorp labour forces.
Moreover, it rendered domestic banks to become reluctant to lend to the industrial sector,
particularly the labor-intensive sectors such as the textile industry (Bank Indonesia,
2010).
The industrial sector is also one of the nation’ largest sources of fossil-fuel derived GHG
emissions, and continues to grow. Overall, industrial sector was responsible for over 40%
of Indonesia’s fossil-fuel emission (including electricity use within industries). Future
emissions is expected to be larger as emissions from fossil-fuel use are growing at around
6% per year (World Bank 2009). In terms of the total GHG emissions, the industrial sector

71
has been the 7th largest source of GHG emmisions in Indonesia, which contributes 6% of
the total GHG emissions28.
Even so, the level of GHG emissions is different across individual industry sector. Table 3.1
presents the rank for individual industry sector (5 digit ISIC code) based on GHG
emissions from fossil fuel combustions. Cement Industry is the largest GHG emitter, and it
produces 11.5 mtCO2e emissions in 2005. Iron and Steel Industries industry occupies the
second and third ranks, where together they generate 10.1 mtCO2e emissions in total.
Next, Textiles takes the fourth, seventh, thirteenth, and fourteenth ranks. Garments
Industry is placed fifth in the rank. Pulp and Paper Industries are ranked sixth and
fifteenth. The eighth to tenth ranks are occupied by Ceramic, Vehicle Components, and
Fertilizers Industries.
Table 3.1: Rank of Individual Industry Sector by GHG Emission
Rank Manufacturing Sectors ISIC
Code GHG Emissions 2005
1 Cement 26411 11.5
2 Steel rolling industry 27102 5.5
3 Iron and steel basic industry 27101 4.6
4 Weaving mills except gunny and other sacks 17114 4.1
5 Wearing apparel made of textile (garments) 18101 3.9
6 Pulp 21011 3.8
7 Preparation of textile fiber 17111 3.6
8 Structural materials made of porcelain 26202 2.9
9 Motor Vehicle Component and apparatus 34300 2.5
10 Straight fertilizer 24122 1.9
11 Crumb rubber 25123 1.5
12 Toys 36941 1.4
13 Finished Textiles 17122 1.2
14 Spinning mills 17112 1.1
15 Cultural papers 21012 1.1
16 Tire and inner tubes 25111 1.1
17 Crude vegetable and animal cooking oil 15141 1.0
18 Product of plastics for technical/industrial purposes 25206 1.0
19 Basic chemicals, not elsewhere classified 24119 1.0 20 Cooking oil made of palm oil 15144 0.9
Source: World Bank (2009).
From Table 3.1, there are eight individual industries that produce almost half of industry
total GHG emission.29 They are Cement, Textiles, Iron and Steel, Pulp and Paper, Garments,
Ceramic, Vehicle Components, and Fertilizer. We provide analysis for each industry to give
28 In 2005 included emissions from Energy in Manufacturing, see Table 2.1. 29 The total emissions from rank 1-10 are 44.3 mtCO2e. If we include rank 13-15, it is 47.4 mtCO2e. Individual industry sector produces 40.2% of total industry emission (compare to table 3.1).

72
a deeper insight on their condition. However, we exclude Garments, Ceramic, and Vehicle
Components from our analysis because Bappenas does not include them in the top priority
industrial sector.30
3.2.1 Cement Industry
Indonesia cement industry is the largest GHG emitter among the priority sectors. Cement
industry generates 11.5 mtCO2e emissions in 2005. Also, cement industry has high level of
emission intensity that is 0.64 mtCO2e per one trillion rupiah of output.31 Cement industry
only has 8 firms, thus could be characterized as oligopoly. Small numbers of firms imply
that each firm produces 0.64 mtCO2e GHG emission on average.
Table 3.2: Indonesia Cement Industry
Cement
Emissions (Fossil Fuel Combustion) 11,5
Total Output (Billion Rupiah) 17,890
Number of Enterprise 18
Total Employee 20,866 Ratio of Energy Cost to Input Cost 57.74%
Source: World Bank (2009).
Table 3.3: Cement Industry Energy Expenditure by Source
Energy Source Value (Million
Rupiah) Percent
Oil 268,334 11.75%
Coal 1,134,430 49.69%
Gas and Others 880,044 38.55%
Total 2,282,808 100.00% Source: BPS (2005).
Moreover, the ratio of energy to input cost implies that the industry is energy intensive.
Cement industry spends nearly half of its energy expenditure on coal. It only spends
38.5% of its energy expenditure on gas and other energy sources. Also, Coal is the most
carbon intensive energy source. Cement industry also generates CO2 emission through its
calcination process. Hence, it is unsurprising that cement industry generates the highest
level of emission among all industry sectors.
30 We provide the classification in the appendix (see appendix 3.3). 31 We define emission intensity as emission per output. We use one trillion rupiah as benchmark.

73
3.2.2 Iron and Steel Industry
Table 3.4: Indonesia Iron and Steel Industry
Iron and Steel
Emissions (Fossil Fuel Combustion) 10.1
Total Output (Billion Rupiah) 55,208
Number of Enterprise 67
Total Employee 22,513
Ratio of Energy Cost to Input Cost 9.57% Source: World Bank (2009).
Table 3.5: Iron and Steel Industry Energy Expenditure by Source
Energy Source Value (Million
Rupiah) Percent
Oil 62,437 23.33%
Coal 30,625 11.44%
Gas and Others 174,531 65.22%
Total 267,593 100.00% Source: BPS (2005).
Iron and steel industry is the second largest GHG emitter. Iron and steel industry produces
10.1 mtCO2e in 2005. Also, iron and steel industry generates 0.18 mtCO2e emission per
one trillion Rupiah of output. Iron and steel industry has 67 enterprises, and the average
GHG emission that is generated by each firm is 0.15 mtCO2e. Iron and steel industry has
low ratio of energy-input cost that is 9.57%. Therefore, iron and steel industry can be
classified as less energy intensive industry.
Iron and steel industry produces large amount of GHG emissions and could be considered
as energy-intensive, albeit this is not shown in the ratio of energy cost to input. Iron and
steel industry spends 65.22% of its energy expenditure on gas and other energy sources. It
only spends 11.44% of its energy budget on coal and 23.33% on oil.
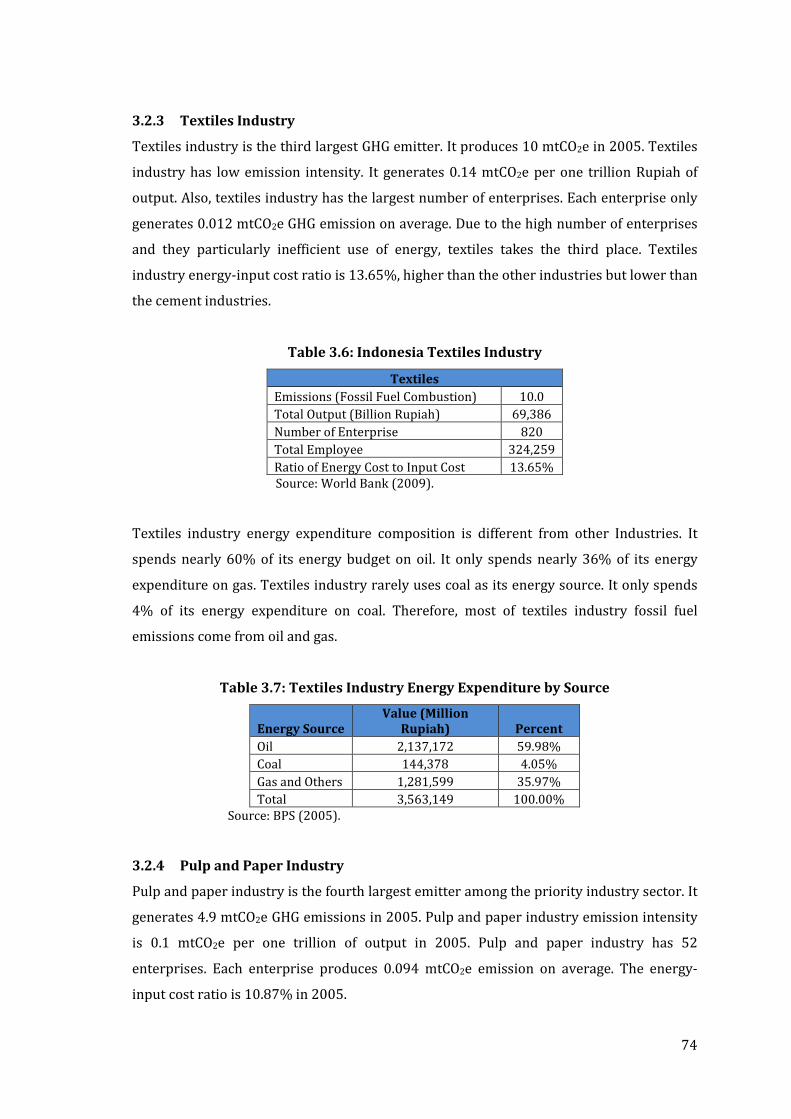
74
3.2.3 Textiles Industry
Textiles industry is the third largest GHG emitter. It produces 10 mtCO2e in 2005. Textiles
industry has low emission intensity. It generates 0.14 mtCO2e per one trillion Rupiah of
output. Also, textiles industry has the largest number of enterprises. Each enterprise only
generates 0.012 mtCO2e GHG emission on average. Due to the high number of enterprises
and they particularly inefficient use of energy, textiles takes the third place. Textiles
industry energy-input cost ratio is 13.65%, higher than the other industries but lower than
the cement industries.
Table 3.6: Indonesia Textiles Industry
Textiles
Emissions (Fossil Fuel Combustion) 10.0
Total Output (Billion Rupiah) 69,386
Number of Enterprise 820
Total Employee 324,259
Ratio of Energy Cost to Input Cost 13.65% Source: World Bank (2009).
Textiles industry energy expenditure composition is different from other Industries. It
spends nearly 60% of its energy budget on oil. It only spends nearly 36% of its energy
expenditure on gas. Textiles industry rarely uses coal as its energy source. It only spends
4% of its energy expenditure on coal. Therefore, most of textiles industry fossil fuel
emissions come from oil and gas.
Table 3.7: Textiles Industry Energy Expenditure by Source
Energy Source Value (Million
Rupiah) Percent
Oil 2,137,172 59.98%
Coal 144,378 4.05%
Gas and Others 1,281,599 35.97%
Total 3,563,149 100.00% Source: BPS (2005).
3.2.4 Pulp and Paper Industry
Pulp and paper industry is the fourth largest emitter among the priority industry sector. It
generates 4.9 mtCO2e GHG emissions in 2005. Pulp and paper industry emission intensity
is 0.1 mtCO2e per one trillion of output in 2005. Pulp and paper industry has 52
enterprises. Each enterprise produces 0.094 mtCO2e emission on average. The energy-
input cost ratio is 10.87% in 2005.

75
Table 3.8: Indonesia Pulp and Paper Industry
Pulp and Paper
Emissions (Fossil Fuel Combustion) 4.9
Total Output (Billion Rupiah) 49,198
Number of Enterprise 52
Total Employee 55,010
Ratio of Energy Cost to Input Cost 10.87% Source: World Bank (2009).
Pulp and paper industry uses gas and other energy sources as its primary energy source.
Pulp and paper industry spends 1.8 trillion rupiah on gas and the other energy sources
from 2.6 trillion Rupiah on total energy expenditure. It is equivalent to 70.69% of total
energy expenditure. Pulp and paper industry only spends 24% of its energy budget on oil
and 5.23% on coal.
Table 3.9: Pulp and Paper Industry Energy Expenditure by Source
Energy Source Value (Million
Rupiah) Percent
Oil 632,792 24.08%
Coal 137,333 5.23%
Gas and Others 1,857,414 70.69%
Total 2,627,539 100.00% Source: World Bank (2009).
3.2.4 Fertilizer Industry
Table 3.10: Indonesia Fertilizer Industry
Fertilizer
Emissions (Fossil Fuel Combustion) 1.9
Total Output (Billion Rupiah) 15,110
Number of Enterprise 15
Total Employee 12,338
Ratio of Energy Cost to Input Cost 2.17% Source: World Bank (2009).
Fertilizer industry is the smallest GHG emitter in the absolute terms among all priority
industry, as the industry has only 15 enterprises. It generates 1.9 mtCO2e GHG emissions
in 2005. Fertilizer industry emission intensity is 0.12 mtCO2e per one trillion of output.
Similar to cement industry, fertilizer industry has oligopoly market. Moreover, fertilizer
industry generates 0.13 mtCO2e per firm. Fertilizer industry energy-input cost ratio is
2.17%, which is the lowest among all priority industry sectors.

76
Table 3.11: Fertilizer Industry Energy Expenditure by Source
Energy Source Value (Million
Rupiah) Percent
Oil 32,307 39.78%
Coal 0 0.00%
Gas and Others 48,913 60.22%
Total 81,220 100.00% Source: BPS (2005).
Fertilizer industry only uses oil, coal and gas as its primary energy sources. Oil is
accounted for 40% of fertilizer industry energy expenditure. The value is 32 billion
Rupiah, the lowest among all priority industry sectors. Meanwhile, gas and other sources
are accounted for 60% of fertilizer energy consumption. The value is 48 billion rupiah. It is
the lowest among all priority industry sectors.
3.3 Regulation and Policy Framework32
The Government of Indonesia sets two policy objectives for the industrial sector. First,
Indonesia wants to improve its industry competitiveness. Second, Indonesia wants to
achieve low GHG emissions on its industry while improving its competitiveness. In order
to achieve the two objectives, there are a number of existing and planned national policies
whose aims are not directly to reduce GHG emissions but whose implementation
nonetheless will impact materially on the efforts. They are listed here:
1. Presidential Regulation (PR) No.5/2006 – Energy Diversification and Conservation
Indonesia’s national energy mix policy, formulated in Presidential Regulation No. 5/2006,
targets the reduction of current oil consumption from 51.6% to less than 20% in 2025 by
substitution from other energy sources. If implemented as intended, carbon emissions are
predicted to be 17% lower than the Business as Usual (BAU) in 2025 on a 2005 baseline.
The national energy mix policy reflects consideration of the importance of alternative
energy utilization, energy conservation, and energy security aims to enable secure energy
supply.
32 Most materials in this section are taken from Climate Change Roadmap on Industry Sector,
Bappenas 2010.

77
Table 3.12: Primary Energy Mix According to PR 05/2005
Energi Mix 2005
PR No. 5/2006: Energi Mix 2025
Oil 55% Biofuel 5%
Natural Gas 22% Oil 20%
Coal 17% Natural Gas 30%
Geothermal 2% Liquified Coal 2%
Other 4% Coal 33%
Geothermal 5%
Renewable 5%
Total 100% Total 100%
The objective to be achieved is the reduction of energy elasticity to < 1. Energy elasticity is
the prime indicator for low carbon growth being defined as the percentage change in
energy consumption to achieve one per cent change in national GDP.
2. Presidential Regulation No. 28/2008 about National Industrial Policy
This regulation is aimed to strengthen competitiveness of the industrial sector as a driver
of economic growth – supported by “macro economic stability, qualified public
institutions, an improved industry structure with increasing role for Small-to-Medium
Enterprises (SME) and improved productivity”. The objective is to achieve balanced roles
between SME and large industries, so Indonesia will become recognized worldwide by
2030 as an industrialized country. Furthermore, the Presidential Regulation anticipates
the problems about energy in the industry sector (meeting future demand, fossil fuel
resource depletion and gradual withdrawal of energy pricing subsidies).
3. Act No.30/2007 on Energy Development in Indonesia
The law incorporates several provisions, whose implementation will affect GHG emissions
mitigation, i.e. provisions, which support energy conservation and the development of new
and renewable energy through incentive mechanisms. The implementation of the
provisions concerning energy conservation and renewable energy development has to be
regulated by a Government Regulation.

78
4. Presidential Instruction No. 10/2005 concerning Energy Saving
This instruction mandates state institutions and agencies to conserve energy in their
operation.
5. Strategic Plan on National Energy Conservation Program Development 2005–2025
This plan covers energy conservation programs, campaigns, information, education and
training. Focus is on demand side management, energy savings labelling, partnership
programs.
6. Green Energy Policy – Ministry of Energy and Mineral Resources Decree No. 0002/2004
This policy implements the maximum use of renewable energy; efficient use of energy and
increasing public awareness on energy efficiency.
7. Ministry of Energy and Mineral Resources Ministerial Regulation No. 31/2005 about
Guidance for the Implementation of Energy Saving
Demand-side policy objectives are to reduce economy-wide energy intensity by 1% p.a. In
the medium-term PLN has set up to 14.3TWh the cumulated electricity savings target for
the period 2005 – 2010.
8. Partnership Program on Energy Conservation
This partnership aims to provide free of charge energy audits for buildings and industries.
The years 2003–2007 energy audit service already done for more than 250 industries and
buildings; paid for by Government.
9. Energy Manager Competency Program
This program prepares energy manager accreditation mechanisms, and competency
standard for energy manager in building and industry, paid for by Government.
10. Monitoring of Air Pollution Emission from Industry Sector
The monitoring is conducted by State Ministry of Environment through Company
Performance Evaluation Program (PROPER).
11. Implementation of Cleaner Production Program (CP EE/Cleaner Production) and Energy

79
12. Ministry of Environment Decree No.206/05 - Establishment of National Commission on
Clean Development Mechanism as Designated National Authority (DNA)
This decree gives national approval to the proposal of CDM projects that have satisfied
sustainable development criteria. The National Commission on Clean Development
Mechanism consists of nine departments, and chaired by Deputy III, State Ministry of
Environment.
13. Jakarta Commitments
The commitments are signed jointly by the Government of Indonesia and its development
partners regarding strengthening country ownership on development as well as on the
creation of a new aid instrument.
14. Act N0. 17/2006 on the Change on Act No.10/1055 regarding Custom Regulations
This act ives free or reduced import tax on clean technology equipment.
15. State Ministry of Environment Minister Regulation No.5/2006 on NonStatic Source
Emission Standard for New Type Vehicles
16. State Ministry of Environment Minister Regulation No.7/2007 regards Static Source
Emission Standard for Boiler.
17. Government Regulation No. 70/2009 on Energy Conservation
This regulation provides details on energy conservation strategy. In addition, it stipulates
a mandatory energy managers and auditor for private and government institutions.
18. Act No 18/2008 regarding Solid Waste Management
This act gives explanation on the composition of solid waste and its different sources, such
as domestic waste, specific waste. It states also that waste is seen as a resource with
economic value that can be utilised for energy, compost or material for industry.
19. Government Regulation No. 18/1999 regarding Hazardous Waste Management
This regulation covers regulation concerning hazardous waste e.g. for the handling,
storage, process, utilisation, transportation.

80
20. Ministry of Environment Regulation No. 02/2008 regarding Hazardous Waste Utilisation
It covers regulation on how to include hazardous waste as part of reuse, recycle and
recovery actions. Includes activities to use hazardous waste to substitute material, fuel
and other purposes, such as research and other environment analysis.
21. Ministry of Environment Decree regarding Permit on Utilisation of Hazardous Waste as
Alternative Fuel and Raw Material
The decree is made specific for each industry that uses or plans to use hazardous waste as
alternative fuel and raw material.
Besides the above regulations, each particular industry often has its own specific law,
regulations and policies which affect GHG emissions from the industry, both directly or
indirectly. For example in Cement Industry, each factory in must have an Environmental
Impact Assessment study on Development (Analisis Mengenai Dampak Lingkungan,
AMDAL). In addition, two further approvals for onGoIng operations are required: a.
Environmental operational permits - approved Environmental Management Plans
(Rencana Pengelolaan Lingkungan, RKL); and b. Environmental Monitoring Plans (Rencana
Pemantauan Lingkungan, RPL).
Next, the existing economic instruments currently used to deal with GHG emissions
mitigations in the industrial sector is discussed.
3.4 Existing Economic Instruments
The usage of economic instrument for environmental protection including GHG emissions
mitigations in Indonesia is mandated by the Law No. 32/2009 on Enviromental Protection
and Management. The law states that in order to conserve and protect the enviroment, it is
compulsory for both the national and the regional governments to develop environmental
economic instruments. Three types of economic instruments specifically mentioned in the
Article 41 Paragraph 2 of the law are: developmental planning, funding for environment,
and incentives or disincentives. The first instrument basically stipulates that both national
and regional governments must pay attention to environmental protection and
conservation in their development planning. The second instrument provides a basis for
budgetary provisions for environmental recovery, conservation and protection.
Meanwhile, as per Article 43 Paragraph 3, the third economic instruments, the incentives

81
or disincentives, could be in the forms of taxes or subsidies, which will be elaborated in the
next paragraphs.
As it currently stands, the government predominantly uses subsidies, both on loans and
taxes, as incentives to reduce GHG emissions from industries. Direct consultation with the
Directorate General of Taxation confirmed that there are currently no taxation scheme
which specifically target GHG emissions in industries.
The subsidized loan or soft loan incentives are administered by the MoE (see Table 3.13).
The initial soft loan program is JBIC-EPA, which began in 1992 and sponsored by the BOJ
(central bank of Japan). The objective of JBIC-EPA is to improve waste management at all
firm level. In the first period of implementation (1992-1996), 65% of the loan spent in
pollution prevention program, and 35% of the loan invested in waste-water treatment
plant. During the second period of implementation (1997-2006), 89% of the loan was
invested in pollution prevention program, and 8% spent in waste-water treatment plan.33
Table 3.13: Soft Loan Program for Industry Year of Implementation Program Name Sponsor Nation Aid Amount Target
Since 1992 JBIC-EPA Japan - All Scales
Since 1997 IEPC-KfW 1 Germany 53 Billion IDR SME
Since 2005 IEPC-KfW 2 Germany 9 Million Euro SME
Since 2006 DNS Germany - MSE Source: Dhewanti (2007).
The other soft loan program is IEPC-KfW. It is sponsored by the German Government and
divided into two phases. The initial phase was in 1997 which disbursed Rp.53 billion
amount of aid. The next phase was launched in 2005 with total loan of €9 million. The goal
of IEPC-KfW is to improve SMEs waste management equipment. During the initial phase,
66% of the loan invested in pollution prevention, 17%, and 14% went to waste-water
treatment plan. The other type of soft loan program supported by the German Government
is the DNS (Debt for Nature Swap), which launched in 2006. The DNS is also targetting
micro and small enterprises (MSEs), as they have difficulties to acquire loan from formal
banking system.. The purpose of this scheme is to support MSE investment in
environmental friendly technology (Working Group on Fiscal Policy for Climate Chnage,
The Ministry of Finance, 2009).
33 Dhewanti (2007), pp. 6

82
Meanwhile, the tax subsidy is administered by the Ministry of Finance (see Table 3.14). It
consists of subsidy in customs duty, sales tax (PPN), and Income tax (Pph). The subsidy is
divided for two sectors which is energy and industry sector. Most of the subsidies are
spent in the energy sector. The objective of the tax subsidy in the energy sector is to
support GoI policy on energy diversification and conservation. The GoI too uses it to
increase the share of renewable energy, and gas in Indonesia energy mix. The subsidy for
investment in oil is different, because the GoI wants to increase oil production that has
been decreasing since 2000.34 In 2009, the GoI allocated Rp. 180 billion for subsidy in
biofuel to support investment in renewable energy. Moreover, The GoI allocated Rp.2.5
trillion IDR for investment in oil, gas, and Geothermal energy.
Table 3.14: Tax Subsidy in Energy, and Industry Sector No. Regulation Explanation
1 MOF Ministerial Regulation No. 177/2007
Customs Duty Subsidy for Investment in Oil, Natural Gas, and Geothermal Energy
2 MOF Ministerial Regulation No. 154/2008
Customs Duty Subsidy for Investment in Electricity Equipment
3 MOF Ministerial Regulation No. 242/2008
Sales Tax (PPN) Subsidy for Investment in Oil, Natural Gas, and Geothermal Energy
4 MOF Ministerial Regulation No. 156/2009
Sales Tax (PPN) Subsidy for the Production of Renewable Energy Sources (Bio-fuel)
5 MOF Ministerial Regulation No. 176/2009
Customs Duty Subsidy for Machinery Investment in Industrial Sector
6 MOF Ministerial Regulation No. 21/2010
Sales Tax (PPN) Subsidy for Investment in Oil, Natural Gas, and Geothermal Energy
7 MOF Ministerial Regulation No. 24/2010
Tax and Customs Duty Facilities for the Production of Renewable Energy Sources
8 MOF Ministerial Regulation No. 35/2010
Income Tax (Pph) Subsidy for Investment in Oil, Natural Gas, and Geothermal Energy
9 MOF Ministerial Decision No. 402/2010
Sales Tax (PPN) Subsidy for Investment in Climate Change Mitigation Technology
Source: MOF Climate Change Fiscal Policy Task Force.35
In addition, there are two specific fiscal subsidies designed for industry. The first is for
investment in machinery equipment, which aimed at improving competitiveness. An
example of this type of subsidy are import duty exemption for Textile Industry for
restructuring. However, improving industry competitiveness does not necessarily lead to
support in investment for GHG emission reduction. Also, the regulation does not provide
any explanation on how to conduct this subsidy in supporting investment for GHG
emissions reductions. The other type is fiscal subsidy to support investment in climate
change mitigation technology. The aim of this particular scheme is to induce a more
34 Indonesia oil production decreased from 517 million bbl in 2000 to 348 million bbl in 2007 (MEMR, 2008). 35 See http://www.fiscalpolicyforclimatechange.depkeu.go.id.

83
environmentally friendly technologies in the private sector. The MoF allocated Rp.900
billions in 2010. But, it was latter reduced the fund into Rp.500 billions in 2011, as it was
not fully absorbed in the previous year. 36
In summary, it may well be said that economic instruments particularly in the forms of
fiscal incentives and disincentives are still limited in Indonesia. The next chapter will
conduct stock taking and gap analysis of the utilisations and the effectiveness of the
current economic instruments to mitigate GHG emissions.
36 Our interview with KADIN reveals that many in private sectors do not know the existence of such a scheme. Thus, there might be problems with the passing of information from the government to the private sector.

84
4 Stock Taking and Gap Analysis of Economic Instruments
In this chapter, we provide a review and analysis on the current GHG emissions reductions
regulations framework and economic instruments implemented in Indonesia. Gap analysis
of the framework and instruments would be provided. In addition, industry potential
would be explored. This Chapter prelude the final Chapter 5 which uses the gap analysis
and lesson-learnt from other countries to construct policy recommendations for
Indonesia.
4.1 Review of Regulatory and Policy Framework.
The current regulation and policy framework that affect the industrial sector in Indonesia
has been listed in the previous Chapter (Chapter 3.3). These regulations can be divided
into three categories. The first is by adopting a new energy policy, which has dual
objectives: improving energy efficiency and promoting energy diversification. Currently,
the Indonesian industries is too dependent on oil as a source of energy, which generate the
majority of GHG emissions in the sector. The GoI aims to change this dependency by
promoting more usages of natural gas and other renewable energies. By adapting the new
energy policy, the GoI also expects firms to exercise energy management practices and
obliges them to conduct energy efficiency program.
The second category is controlling air pollution. The GoI uses emission standards to
decrease air pollution from static sources (industry equipments), and non-static sources
(vehicles or transportation). In addition, to reduce air pollution from industry, the GoI
administers the level of air pollution on industrial equipment, such as boiler. It also
regulates the level of air pollution on several industry sectors, such as cement, pulp and
paper, iron and steel, and fertilizer. The third category is waste management. This policy
originally is aimed to improve waste management practices. Nevertheless, in 2008, the
MoE introduced hazardous waste utilization as alternative energy source. Moreover, the
MoE encouraged industry sector to utilize agriculture waste (biomass), and industrial
waste as alternative energy source.
Apart from the above regulations and policies which could be classified as command-and-
control type policies, Indonesia also adopts a market-based instrument to limit GHG
emissions. This type of instrument and the industry practices are discussed in the next
subsection.

85
4.2 Review of Economic Instruments and Industry Practice.
The GoI also utilise fiscal incentives as instruments for reducing GHG emissions in
industries. First is the soft loan program, which funded by foreign donors (Japan and
Germany). The GoI cooperates with formal banking system to organize the soft loan
program. There were four such a program which had been carried out in Indonesia as
summarised in Table 3.13 in Section 3.4. The objective of the soft loan program is mainly
to improve industry waste management practices.
Second is the fiscal subsidy which administered by the MoF. The subsidy is divided for two
sectors which is energy and industry sector The GoI fiscal subsidy has two objectives. The
first objective is promoting energy diversification. The GoI uses taxes and import duty
subsidy to encourage investment in less-carbon-intensive fossil-fuel, such as gas, and
renewable energy, such as geothermal, and biofuel. The second objective is encouraged
investment in energy efficient industrial equipments and machinery. The GoI focuses its
subsidy on general industrial machinery, and climate change mitigation technology.
These instruments are only indirectly contribute to the reduction of GHG emission in
industry. The government has yet to impose a tax instrument that directly provide
disincentives for industry. Furthermore, programs such as soft loan provisions is not
sustainable as it depends only donors contributions. Thus, its impact on long-term GHG
emissions reductions can be questioned. Some programs aimed specifically at SMEs. This
is depite the majority of GHGs emitters in the industrial sector are large companies, which
owned factories and consume large amount of fossil energy. Some programs are also
constrained by inadequate socialization. This may indicate a problem in the evaluation
and monitoring of the program.
4.3 Regulatory and Policy Gap
On the basis of the review of the present regulatory framework for limiting GHG emissions
in Indonesia’s industries, it can be inferred that there is a need to bridge some gaps in the
policy and legal framework for GHG regulations which outlined below.
4.3.1 Need for a Comprehensive GHG Law
The present regulations for GHGs are in scattered form in a number of laws issued by
several ministries and institutions. This applies for regulations for GHGs in all sectors, not

86
only in the industrial sector. Further, the subject matter and objectives of these laws are
incidental in reducing GHG emissions. With the current ambitious targets GHG emissions
reductions targets it seems a special composite legislation could help in better
coordination as well as institutionalize delivery system for attainment of the objectives.
This composite legislation could set the targets and efforts should be made by each
economic sector in order to achieve the GHG emissions reductions objective.
4.3.2 Need for More Robust a Sectoral Industrial Policy
GHG emissions are not related to any specific human activity. In fact the sources of the
GHG emissions are scattered in almost all human economic activities including industrial
production, power generation, transportation, energy consumption, agricultural and the
like. However, analysis of the causes and mitigations of GHG emissions in industrial sector
are arguably more complex compared to other sectors. Thus, there is a need to develop
sector-specific climate policies, measures and regulations that could mitigate GHG
emissions as well as be integrated with the objective of sustainable development of the
economy. It is foreseen this industrial sectoral policy is a section of the comprehensive
GHG law discussed above.
4.3.3 Need for One Comprehensive GHG Regulatory Institution
One of the drawbacks of the GHG regulatory framework in Indonesia the absence of an
effective institutional framework to regulate GHG emissions in the industrial sector. In this
respect, the general institutional framework in Indonesia includes the Bappenas, the MoE,
the MoI, and the DNPI. At present, this institutional framework is responsible for
administering and supervising GHG-related regulations which affecting the Industrial
Sector in Indonesia. Even though in paper, the DNPI is responsible for formulating national
policies, strategies, programs and activities to control climate change. This task is most of
the times overlapped with the task of institutions such as the Bappenas and the MoE. Both
of the aforementioned institutions are actively involved in formulating policies and
strategies. In view of the growing complexities of economic development and the technical
issues involved, it seems necessary to transfer all the task formulating policies and
strategies into one single institution in Indonesia.. This could help in regulating GHG
emissions in the industry in an efficient and coherent manner.

87
4.3.4 Need for Indicative Targets and Time Frames
The Indonesia Climate Change Sectoral RoadMap emphasizes nine core “national
missions” integrated with the sustainable development objective as the national strategy
to combat climate change in the country. This national strategy generally emphasizes on
reducing emissions from deforestations and degradation, and for industry, by cutting
down fossil fuel use. However, it does not put GHG emissions limits from these various
sources like factories, vehicles and the like. In addition, there are no targets or time frames
for mitigating GHG emissions from the sources. In this respect, there are needs to directly
regulate the sources of GHG emissions by taking appropriate measures as well putting an
appropriate time frame as an indicator of progress.
4.3.5 Need for Maket Based Rules
In the light of the emerging trend in regulatory schemes, there is a need to shift from a
command-and-control regulatory system to a more market-based compliance system.
Some trends in this respect are visible since the inception of the subsidized loan or soft
loan incentives by the MoF discussed in Section 3.4. Nevertheless, a subsidy instrument is
a mean to promote demand. Thus, it only indirectly affects GHG emissions reductions.
Further, it could be costly to the public budget if it is wrongly administered. In the near
future, these subsidy schemes need to be complemented with taxation schemes which
directly reduce demand for processes or products that generate GHG emissions.
Apart from the above regulatory gaps, there are also some industry potential gaps in the
efforts of mitigating GHGs. These gaps are discussed in the next section.
4.4 Industry Potential Gap37
GHGs reductions in the industrial sector in Indonesia will mainy be achieved through
energy efficiency, energy diversifications and blended materials. This is explicitly
mentioned in the Indonesia Climate Sectoral RoadMap for Industry Sector (2010, p. 15-
24). In order to be successfull, the efforts must concentrate on subsectors which
contribute most of the emissions. In addition, only integrated packages of measures, not
individual instruments, are capable of generating results. Bappenas (2010) has identified
five industries as the most important for mitigating GHGs: the cement industry, the iron
37 Section 4.4 is mainly taken from Mostert (2011) with some additional discussions on iron and steel as well as fertilizer industries.

88
and steel industry, the textiles industry, the pulp and paper industry and the fertilizer and
other chemicals industry. The following discussions on industry gap focus on these five
industries.
The Cement Industry is the most energy intensive, where energy expenditure accounts for
more than 57% of input costs (See Section 3.2). For the other industries, the costs of
energy are around 2-13% of input costs. The distinction is significant. Energy management
is a core competence in energy intensive industries, which is the reason why these are
reasonably energy efficient (unless they work in a monopolistic environment). In non-
energy intensive industries, it will always be possible to identify financially viable energy
saving opportunities, as energy is a support activity, which receives no more management
attention than the others. The rule of thumb that you can achieve 80% of the achievable
results with 20% of the required effort to achieve 100%, is applied here (Mostert, 2011).
It is not surprising, therefore, that in Indonesian cement industry has limited energy
efficiency potential in its present production processes: only 10% of the total GHG-
emission reduction potential that has achievable (reducing energy consumption from non-
kiln activities such as lighting, motor efficiencies, air-conditioning and fuel in machinery
including trucks). 40% of the emission reduction potential comes from diversifications i.e.
fuel switching from coal to biomass in the form of agricultural waste, fuel crops, municipal
solid waste, industrial waste, including hazardous wastes, dried sewage sludge, shredded
plastic animal meal/animal fat. The remaining 50% reduction potential comes from less
energy intensive blending materials as substitutes for clinker (including recycled concrete,
fly-ash).
Therefore, there are considerable potential in the cement industry to mitigate GHGs by
diversifying energy sources and using blended materials. The policy package for the
cement industry would focus, above all on changing Government regulations, that for
misunderstood reasons, block the introduction of fly-ash as blending material. Supporting
measures include new cement standards and recycled materials content standards.
Adjustments in regulations to facilitate use of toxic waste materials as fuel, would be
accompanied by a solid information campaign including arranged visits of journalists,
representatives from the MoE and from municipal and district authorities to
municipalities in Europe that have introduced effective use of toxic and municipal wastes
as fuel without detrimental effects on the local environment and with full acceptance of
the neighboring population. It would encourage public-private-partnerships with

89
subsidiaries of cement companies in municipal waste sorting and treatment, inter alia by
providing grant support to pilot projects that are identified through challenge rounds.
Ideally, a more rational collection and treatment of municipal waste would also be
promoted by waste deposit levies.
The energy efficiency potential in the production processes in pulp and paper is limited for
the same reasons; although energy efficiency potential in the production of thermal energy
has been identified. The major emission reduction potential is through diversification by
switching to increased use of self-generated biomass waste as fuel, in cogeneration of heat
and power (with surplus power production being sold to the grid) and in increased
recycling of recovered paper. The latter option, however, is not yet financially viable, and,
possibly, also not economically viable under present conditions in Indonesia.
Thus the potential GHGs reductions package for pulp and paper would focus on
diversification of promoting biomass-based cogeneration of power and heat. The most
important instruments for this are standard PPA-tariffs and standard regulations for
connection and PPA-negotiations. Supplementary instruments comprise energy audits to
identify maximum bank engagement programs to promote project-finance for investments
in cogeneration. The latter can be promoted by schemes whereby monthly tariff payments
for sold power are deposited in a trust account at the loan giving bank from which the
bank draws due monthly amortization payments before transferring the surplus to an
account of the pulp and paper company. To promote technology innovations, the
Government can introduce (challenge) grant programs to co-finance relatively untested
technologies as pilot or demonstration projects; e.g. gasification technology (Mostert,
2011).
The situation in the textile industry is different, although there huge potentials for
efficiency. The financial situation in the other two industries is strong. In cement industry
because it operates in a national oligopolistic market structure, in pulp and paper because
Indonesia due to favorable natural resource conditions enjoys an absolute production
advantage compared with competitors on the international market. The textile industry,
on the other hand, whilst a success story in terms of growth in production and in
employment, operates with low margins due to intense international competition. Some
companies have managed to move into the production of high-quality fabrics delivered to
leading brands and enjoy reasonable profits, others with more commodity style

90
production barely survive. Therefore, whereas the cement and pulp and paper companies
can balance sheet finance their energy efficiency investments, the textile industry is
considered a high risk industry by the national banks.
A public program for the textile industry would have a number of features that are not
found in the programs for the energy intensive industries. The companies have an energy
consumption size and composition that makes quasi-ESCOs (performance guarantees for
recommended energy efficiency investment packages) and even full-blown ESCO-
operation (design, investment, finance, operation) feasible in the industry. Government
can provide training (if necessary, because large firms like Siemens would set them up)
and certification to these. Government will also be in close dialogue with the financial
sector to explain the rational for performance guarantees as a means to reduce the risks of
the investments to the companies and ultimately the banks giving the loans. A case can be
made for the introduction of publicly backed guarantees for loans to EE-projects in
companies that have a good chance of commercial survival, yet are on the borderline for
posing an acceptable credit risk for banks. Because of the number of firms, a PoA could be
formulated for the industry with the receipts being used to pay performance based grants
in accordance with either the GHG-reductions they achieve, or energy efficiency
benchmarks that exceed the average efficiency in the industry.
Similar to the cement industries, iron and steel industry is also one of the most energy-
intensive industries (ICCSR, 2010). Even though this intensity is not fully reflected in the
average cost ratio of the industry. Iron and steel productions use fossil fuels for energy
utilisation and as reductors in the production process. Three routes are used to make
steel. In the primary route (about 60%), iron ore is reduced to iron in blast furnaces using
mostly coke or coal then processed into steel. In the second route (about 35%) scrap steel
is melted in electric-arc furnaces to produce crude steel that is further processed; this
process uses only 30% to 40% of the energy of the primary route, with GHG emissions
reductions being a function of the source of electricity. The remaining steel production
(about 5%) uses natural gas to produce direct reduced iron (DRI). DRI cannot be used in
primary steel plants and is mainly used as an alternative iron input in electric arc furnaces
which can result in a reduction of up to 50% in GHG emissions compared with primary
steel making (IPCC, 2007).

91
The IPCC’s Working Group III to the 4th Assessment Report (AR4) mentions energy
conservation potential in steel production as (1) energy audits/energy management
systems to increase energy efficiency, (2) fuel switching and (3) recycling. Approximately
10% of total energy consumption in steel making could be saved through improved energy
and materials management. The potential for energy efficiency improvement varies
between steel plants based on the production route used, product mix, energy and
emissions intensities of fuel and electricity, and the boundaries chosen for the evaluation.
Similarly, fuel switching, including the use of waste materials, is mentioned as an energy
conservation measure for the steel industry. Technology to use wastes such as plastics as
alternative fuel and feedstock for steel production has already been developed. Pretreated
plastic wastes can be recycled in coke ovens and blast furnaces, reducing GHGe by
reducing both emissions from incineration and the demand for fossil fuels. Meanwhile,
recycling of steel in electric arc furnaces accounts about a third of world production and
typically uses 60–70% less energy (IPCC 2007).
The fertilizer and other chemicals industry is highly diverse with thousands of companies
producing tens of thousands of products in quantities varying from a few kilograms to
thousand of tonnes. The chemical industry belongs to the energy-intense industries
worldwide with a high contribution to global GHG emissions. According to the
International Energy Agency (IEA) the share of industrial energy used for ammonia,
ethylene, propylene and aromatics production (worldwide) has increased from 6% to
15% between 1971 and 2006 (IEA, 2007) and hence belongs to the top energy consumers
in industry nowadays. Separations, chemical synthesis and process heating are the major
uses of energy in the chemical industry. The following sub-sectors have been identified as
the top energy users in the chemicals industry (IPCC, 2007): (1) Ethylene, (2) Fertilizer,
(3) Chlorine, (4) Adipic Acid, (5) Nitric Acid, (6) Caprolactam, (7) HCFC-22.
Among the different groups of chemical producers the key sub-sectors for the Indonesian
Ministry of Industry is the petrochemical industry. Currently the Indonesian
petrochemical industry’s share of world’s petrochemical industry’s total production is
around 0.5% to 1.5%. According to IPCC drastic reductions are possible. Various energy
efficiency and GHG emissions mitigation options are known and could be applied by the
different groups and classes of chemicals producers. For example, process integration and
cogeneration of heat and electricity have also been appliedin the petrochemical industry

92
and petroleum refining. If both industries are co-located, they can make use of the energy
in bi-products that would otherwise be vented or flared (IPCC. 2007).
Next, the economic instruments gap of those implemented in Indonesia and other
countries are discussed.
4.5 Economic Instruments Gap
The usages of economic instruments particularly in the forms of fiscal incentives and
disincentives are still limited in Indonesia. Instruments used have been in the forms of soft
loan, fiscal subsidies for energy efficiency and fiscal subsidies for industrial equipments
and machinery. This section briefly discuss the economic instruments policies and policy
packages that have been implemented both in developed and developing countries.
Results from this gap analysis would be the basis for our proposal of economic instrument
to be implemented in Indonesia’s industries in the subsequent chapter
A wide variation exists in the relative importance of policy instruments used to control
GHG emissions in developed countries. Three economic instruments mostly used are the
voluntary aggrements (VAs), taxes and trading. Their application in OECD countries,
including their effectiveness and the possibility of application in Indonesia’s industries
will be explored.
In general, voluntary agreements (VAs) have dominated in terms of numbers, with almost
every OECD country having adopted a voluntary approach of one sort or another. Most
VAs are energy or CO2-related, although some also cover process emissions. A range of VAs
have been adopted, varying from voluntary non-binding agreements on reporting
emissions and progress to self-defined targets to negotiated agreements that are legally
binding, have benchmarking and performance assessment and contain sanctions in the
case of non-compliance. VAs can be classified into one of four types (OECD 1999):
unilateral commitments by industry; private agreements between industry and
stakeholders; environmental agreements negotiated between industry and government;
voluntary programmes developed by government that individual firms can join. VAs with
national and/or regional governments can, and are, being entered into at the company,
industry association or sector-wide level.

93
Table 4.1: Summary of Range of Economic Instrument in Selected Developed Countries
Source: OECD (2003)
For examples, VAs in combination with fiscal incentives and environmental permits, are
the main policy tool used to limit industry GHG emissions in the Netherlands, and
companies that account for almost all (96%) of Dutch industrial energy use have
subscribed to an energy efficiency “benchmarking covenant”. The “long-term agreements”
between the Dutch government and different industry sectors are legally binding once
entered into. The German 3rd National Communication to the UNFCCC also indicates that
VAs in industry are expected to have a greater GHG impact than any other policy
instrument in reducing GHG emissions to 2010 (Government of Germany 2002). VAs
covering process emissions have also been developed, e.g. in Germany, the Netherlands,
Japan and the UK (OECD 2003).
In Indonesia, there has not been any VAs involving the government and the industry
associations which tackle the GHGs. Bappenas is strongly interested in using voluntary
energy efficiency agreements between industry associations and the Government as the
instrument for accelerating energy efficiency in the some industries. Nevertheless, these

94
agreements are unlikely to yield results without a stick or a carrot. Economic sticks could
be: emission caps enforced through an industry-specific cap-and-trade program or a white
energy certificate program with penalties for under-performance. Economic carrots could
be bonus grants (reduced principal on energy efficiency -loans), tax credits for
investments in case of over-achievement of minimum EE-targets for the company and
carbon credits (Mostert 2011).
Further, the key success factors of VAs is the feasibility of the business culture. One is a
well-established dialogue between industries and government; that seems to be the case
in Indonesia. Another is credibility that the Government in case of underperformance will
resort to the stick. An important cultural factor to make self-enforcement and self-
evaluation to succeed, is peer pressure. Voluntary agreements are bi-lateral good will
agreements, where implementation is entirely under the self-responsibility of the industry
and its branch associations. Peer pressure will work best in the cement industry where
there are only 8 companies and next in the pulp and paper industry where there are 81
companies in Indonesia, and worst in the textile industry where there are 4000 SMEs.
Monitoring reports produced by the industry associations are used as basis to renegotiate
targets (Mostert 2011).
Taxes are also part of the policy mix used by many countries to reduce GHG emissions.
These include carbon taxes, carbon/energy taxes as well as taxes on process emissions.
Carbon taxes were first introduced in the early 1990s in a handful of northern European
countries. They are now becoming increasingly used by other countries to reduce CO2
emissions, despite significant concerns raised by industry. Some examples are the UK’s
“climate change levy” and Estonia’s CO2 tax (OECD 2003).
Several countries developing countries have adopted Carbon Tax policy as a measure to
mitigate GHG emissions. India, for example, in July 2010 introduced a nationwide carbon
tax of 50 rupees per metric tonne ($1.07/t) of coal both produced and imported into India.
China is also expected to follow suit in 2012, by applying carbon tax on carbon dioxide
output from fossil fuel sources such as oil and coal. In Indonesia, according to its Green
Paper (MoF 2009), the Ministry of Finance plans to impose a carbon tax in 2014. Carbon
tax of Rp80,000 per ton of CO2 emissions will be implemented and scheduled to increase
5% every year, with revenues derived from the carbon tax is estimated to reach Rp 95
trillion in 2020. Carbon tax will apply to the use of electricity from fossil fuels, diesel oil,

95
kerosene and gasoline. However, the implementation of this policy will be in contrast with
the fuel subsidy policy which currently is implemented. This subsidy has encouraged
demand for fossil fuels both from consumers and industries. It would better if the
government first remove the fuel subsidies gradually and then implement the carbon tax
policy.
The imposition of carbon taxes on the electricty from fossil fuels are expected to cause
increases in electricty price by Rp.60 per kwh, diesel oil and kerosene to rise by Rp. 225
per liter and gasoline prices by around Rp. 190 per liter. This obviously will have some
serious impact for energy-intensive industries such as cement industry and transports.
Simulations by Yusuf and Resosudarmo (2007), for example, concludes that imposition of
carbon tax in Indonesia will result in the contraction of the energy-intensive
manufacturing and expansion of the agriculture and service sectors. It is expected will
have serious ramifications on other social issues such poverty and income distributions38.
Thus, when implementing carbon tax, the GoI needs to ensure that it provides sufficient
incentive for action while ensuring that they are not so high that industries close down or
relocate, which could just result in GHGs “leakage” rather than reduction.
Many developed countries have also implemented emissions trading and other forms of
trading that can indirectly be used to reduce industry emissions. These include GHG
emissions trading, renewable energy certificate or green electricity trading and energy
efficiency trading. Whereas the primary objective of domestic emissions trading schemes
is to reduce GHG emissions, the primary objective of renewable energy certificate trading
schemes is to promote the development and diffusion of cost-effective renewable energy
sources, with a reduction in GHG emissions being a secondary objective.
However, the implementation of domestic emission trading particularly for industry in
Indonesia is deemed not feasible. The difficulties of monitoring emissions sequestration
may make the use of tradable permits impractical in some or all of these situations.
Considerations such as the number of participants, the share of total emissions covered,
industry structure, and enforcement will influence the choice among alternative trading
system designs. Regardless of the specific design, a number of factors can adversely affect
the performance of emissions trading systems, including situations where a few
38 Yusuf and Resosudarmo (2007), however, found that the imposition of carbon tax will yield positive results for income distribution as a result of agriculture expansions.

96
participants can influence the permit market or where a few firms can influence the
output market, transaction costs, non-profit maximizing behavior, the pre-existing
regulatory environment, and the degree of monitoring and enforcement required. Some of
these factors also affect the performance of other policies and measures (OECD, 2010).
Next chapter provides economic instrument recommendations to be implement in the
Indonesia’s industries.

97
5 Proposed Economic Instruments for Indonesian Industries
This Chapter provides the sythesis of the previous chapters by proposing economic
instruments to mitigate GHG gases in Indonesian industries. It starts by presenting the
criteria for economic instruments. It then lists their key performance indicators. Next,
some policy alternatives and potential instruments are outlined. This chapter concludes
with instruments recommendations.
5.1 Criteria of Economic Instruments
The application of economic instruments to mitigate GHG emissions in any country will
reflect a number of factors, including a country’s national circumstances, industry
structure, and exposure of these industries to competition in international markets.
Customized policies suitable for each country’s specific circumstances are often required
(Aiba 2002). Therefore, instruments developed in order to reach the goals of reducing
GHG gasses in Indonesia industry, will need to fullfill the following criteria:
5.1.1 Environmental effectiveness
Impact analysis and ranking among available instruments on its effectivity in reducing
greenhouse gas would be the first test. The optimal policy will not be a single instrument,
no matter how powerful it is. Some instruments might work better in tandem with other
instruments, therefore the various combination and permutation as well as sequences will
have to carefully considered before implementation.
Further, the policy will need to reduce - rather than displace - emissions, as “leakage” of
carbon or other GHG will have no global benefits39. Policies may also need to address the
broad picture, rather than focusing on optimising the performance of individual sub-
systems. For example, modifying products from (or changing inputs to) industrial
processes may have more GHG mitigation potential than increasing the energy efficiency
of a particular process (OECD 2003).
39
Leakage could occur if industries became uncompetitive as a result of an introduced policy and
had to relocate.

98
A requirement to determining the environmental effectiveness of a policy is to have both a
credible business-as-usual (BAU) scenario and an appropriate monitoring, reporting and
verification system. Developing a BAU scenario is needed to assess whether or not an
improvement in performance has happened because of policies or actions put in place or
whether it is something that would have occurred anyway as part of normal business
development. In this regards, a transparent system for monitoring, reporting and verifying
(MRV) emission performance is needed to calculate actual emissions.
In addition, the various effects of different policies aiming to reduce GHG emissions may
also need to be disentangled from one another. However, while it may be relatively
straightforward to determine the absolute energy efficiency or emissions generated in a
particular industry, it is more complex to determine how much of this improvement is due
to the introduction of an individual policy instrument as opposed to implementing a range
of policy approaches.
5.1.2 Economic Efficiency
A GHG reduction policy is economically efficient if it enables and encourages low-cost
reduction opportunities to be taken up. Depending on how they are set up, on one hand,
environmental taxes, trading or VAs may all prove more economically efficient than
traditional “command and control” policies. On the other hand, they could also be more
distortionary, depending on how the issue of exemptions is dealt with. However, since VAs
are not necessarily uniformly applied within a country or across a sector they may not be
as economically efficient as taxes or trading. When uniformly applied across the industry
sector in a country, the use of taxes or trading provides a consistent price signal to
industry to reduce emissions where it is cheapest to do so. Coupled with revenue
recycling, the economic efficiency of taxes or tradeable permit systems can be further
improved (OECD 2001). When applied over multi-year periods with an expectation of
ratcheting up in stringency, such policies can also deliver dynamic efficiency benefits
providing the incentive for continuous technological innovation to limit emissions (OECD
1993).

99
5.1.3 Limited Impact on Competitiveness (and addressing where it occur)
There are many factors that can affect the competitiveness of a country or sector in both
the short and longterm. These include exchange rates, political stability, skill of the labour
force, tax policies, both environmental and non-environmental legislation, levels of R&D
and access to markets (OECD 2003). Some of these factors are more subject to uncertainty
than others. Thus, while actions that increase the marginal costs of production can impact
the competitiveness of the firm, region or country that is affected by the increase they are
only one of several possible factors that can impact competitiveness.
An uneven application of GHG reduction policies such as taxes, or an uneven allocation of
emission permits, can affect the competitiveness of individual firms or sectors within a
particular country when compared with similar industrial activities in another country.
This is particularly important for industries – such as chemicals, iron and steel - whose
goods are: 1) very GHG-intensive; and, 2) widely traded. Competitiveness impacts and
carbon “leakage” may be of particular concern to countries whose major trading partners
are without GHG commitments and therefore unlikely to impose similar regulations (Aiba
2002). For this reason, industry has strongly opposed the introduction of
environmentally-related taxes (OECD 2001b) and is liasing with governments in providing
industry views on the quantity of emissions permits allocated under a domestic emissions
trading scheme as well as on allocation modes. For example, the Japanese industry
association Keidanren argues that taxes undermine competitiveness and discourage
investment in technology (Aiba 2002).
While taxes have nevertheless been introduced, mostly in European countries,
competitiveness concerns have been taken into account in their design. Different
governments have chosen different means to soften the effect of taxes on industry
competitiveness. This can involve either providing full or partial exemptions for certain
industries. A study by Morgenstern et al (2002) show that a carbon tax – or a similar price
signal through emissions trading – would have a significant effect only on a small number
of manufacturing sectors in the United States in the near-term, i.e. before any technology
improvements can take place. Any exemption policy may be fairly limited in scope in order
to offset the most negative competitiveness impacts.
In addition to the above, policies that increase awareness and/or engagement of industry
in climate change issues may also lead to more climate-friendly investments in the longer

100
term. Increased stakeholder awareness and participation in policy development could also
be a measure of success, as it would increase the likelihood that policies are both credible
and feasible to implement.
Success could also be assessed as the environmental effectiveness of policy instruments
from both a climate change and wider environmental perspective, such as whether they
promote “co- or ancillary benefits,” such as improvements in local air and water quality.
Significant potential exists for ancillary environmental benefits when using policy
instruments to reduce greenhouse gas emissions. For example, a regulation requiring
industry to reduce SOx and NOx emissions has the potential to reduce air pollution,
increase health benefits, as well as reduce greenhouse gas emissions. Policies may also be
seen as successful if they result in social and economic benefits such as increased
employment and welfare. Policies may also result in a reduction in resource inputs and
input costs or an increase in health and safety (OECD 2003).
5.2 Policy Alternatives40
This paper suggests in accordance with Bappenas (2010) has identified five industries as
the most important for mitigating GHGs: the cement industry, the iron and steel industry,
the textiles industry, the pulp and paper industry and the fertilizer and other chemicals
industry. Policy alternatives on this section focus on three subsectors: Cement, Pulp &
Paper and Textiles Industry.
5.2.1 Cement industry
As previously discussed in Section 4.4, GHGs reductions in the industrial sector in
Indonesia will mainy be achieved through energy efficiency, energy diversifications and
blended materials, accordingly policy package for the cement industry would focucs on:
a. Changing Government regulations that unnecessarily complicate the introduction
of fly-ash as blending material. Regulations for transporting fly ash from generator
to plant is tough; makes fly ash more expensive than klinker. Supporting measures,
already being undertaken include new cement standards and recycled materials
content standards.
b. Adjustments in regulations to facilitate use of toxic waste materials as fuel. A solid
information campaign would be implemented, including arranged visits of
40 This section is mainly taken from Mostert (2011).
101
journalists, representatives from the Ministry of Environment and from municipal
and district authorities to municipalities in Europe that have introduced effective
use of toxic and municipal wastes as fuel without detrimental effects on the local
environment and with full acceptance of the neighboring population.
c. Encouragement of public-private-partnerships between subsidiaries of cement
companies and municipal Governments for setting jointly owned firms to engage
in municipal waste sorting and treatment. The co-financing municipality could
presumably seek funds from the Climate Change Trust Fund to finance its share of
the company’s equity capital.
d. Ideally, a more rational collection and treatment of municipal waste would also be
promoted by full cost waste deposit levies.
e. If a Low-Carbon Technology Challenge Fund A cement company, or a consortium
of companies assisted by the Cement Association could seek grant support for
innovative pilot projects in areas of joint interest, e.g. new ways to dry moist
waste.
f. Introduce a positive list for EE-investments to be eligible to reduced import duty
and reduced VAT and access to soft loans. It could comprise: (i) burning waste in
the kiln; (ii) transformers to regulate the speed of the fan; (iii) transporting
alternative fuel to the kiln, (iv) support to buy equipment to measure CO2 on the
stack.
g. The five state owned companies use very old equipment. For them, the path is to
change their equipment. Relevant technologies would be planetary cooler, cut the
kiln and use grid cooler to reduce consumption of fuel.
h. The new plants can reduce energy consumption by using vertical mil for grinding
of cement (it reduces electricity), and use modern burners and automation to
keep stable the operation of the mill.
i. The smaller companies may need assistance in getting loans. For them the
introduction of a publicly backed guarantee may be required. But that needs to be
looked into.
j. Due to the large size of the investment in fuel-switching, and because of the fact
that the companies overall are financially strong (providing a taxbase!) a 100%
depreciation (tax write off) in year 1 on investment would be a powerful economic
incentive for the companies. Alternatively, a 50% write off in year 1 and a 50% in
year 2 could be contemplated.

102
5.2.2 Pulp & Paper
Similar to the cement industry, the potential GHGs reductions package for pulp and paper
would focus on diversification of promoting biomass-based cogeneration of power and
heat. Some packages could be as follows:
a. The most important instruments for this are standard Power Purchase Agreement
(PPA)-tariffs and standard regulations for connection and PPA-negotiations. In
North Sumatra, one of the companies sell extra electricity to PLN. PLN is positive,
the general position that the companies can sell extra electricity to PLN.
b. Removal of regulations that complicate use of waste for energy purposes without
basis in truly documented environmental benefits.
c. To promote technology innovations, the Government can publish call for project
proposals by the ‘Low-Carbon Technology Challenge Fund’to co-finance relatively
untested technologies as pilot or demonstration projects; e.g. gasification
technology.
d. Introduce a positive list for EE-investments to be eligible to reduced import duty
and reduced VAT.
e. A 100% depreciation (tax write off) in year 1 on investment or a 50% write off in
year 1 and a 50% in year 2 could be contemplated for investments in capacity
expansion in power for sales to PLN.
f. Introduction of soft loans (interest rate subsidy only, as these companies have easy
access to commercial loans) may be of interest if it turns out that the low-carbon
investments are marginally financially viable even if a 100% tax write off on the
depreciation is offered.
5.2.3 Textile Industry
The situation in the textile industry will be totally different from the above two industries.
The textile industry is a success story in terms of growth in production, in employment
and in exports. Nevertheless, it operates with low margins due to intense international
competition. Some companies have managed to move into the production of high-quality
fabrics delivered to leading brands and enjoy reasonable profits, others with more
commodity style production barely survive. Therefore, whereas the cement and pulp and
paper companies can balance sheet finance their EE-investments, the textile industry is
considered a high risk industry by the national banks.

103
A public program for the textile industry would have a number of features that are not
found in the programs for the above energy intensive industries:
a. The companies have an energy consumption size and composition that makes
quasi-ESCOs (performance guarantees for recommended EE-investment
packages) and even full-blown ESCO-operation (design, investment, finance,
operation) feasible in the industry.
b. Government can provide training and certification to these and through a
public EE-program provide a public market for the quasi-ESCOs.
c. The efforts would be linked with intensive consultation in the finance industry
to get the sector to develop and market standard finance products for standard
technology packages that are relevant for clusters of textile industries.
Government will need to be in close dialogue with the financial sector to
explain the rational for performance guarantees as a means to reduce the risks
of the investments to the companies and ultimately the banks giving the loans.
d. The program needs in consultation with the textile industry association
identify pilot clusters, find a focal organization in each selected cluster,
providing training to the focal organizations, supporting project pipeline
development, and establishing local monitoring and evaluation (M&E) systems
e. There is s a strong case for the introduction of publicly backed guarantees for
loans to EE-projects in companies that have a good chance of commercial
survival, yet are on the borderline for posing an acceptable credit risk for
banks.
f. Because of the number of firms, a PoA (Program of Activities) could be
formulated for the industry with the receipts being used to pay performance
based grants in accordance with either the GHG-reductions they achieve, or
energy efficiency benchmarks that exceed the average efficiency in the
industry.
g. To promote technology innovations, the Government can publish call for
project proposals by the ‘Low-Carbon Technology Challenge Fund’to co-
finance relatively untested technologies as pilot or demonstration projects.
h. Introduce a positive list for EE-investments to be eligible to reduced import
duty and reduced VAT.
i. Introduction of interest rate subsidies is essential to get the financially weak
sector to invest in EE.

104
5.3 Potential Economic Instruments
Based on the previous discussions, the matrix below gives an overview of potential
instruments divided by the three categories: fiscal, economic and financial (all three are
‘economic’); and according to the three targets for support instruments: investment, cost
of operation, revenue generation. Almost all are reward instruments, not penalties.
Table 5.1: Fiscal, Economic and Financial Instruments for GHG Reductions
Cost of Investment Cost of Operation Revenue Generation
Fiscal
Instruments
Exemption from import duty
Exemption from VAT and
excise taxes
Accelerated tax write-offs
(100% or 50%/50%) on clean
technology
Tax rebates to firms meeting
specific targets
Fuel taxes (on energy
content)
Carbon taxes (with or
without refunds for
implementation of EE-
measures)
Economic
Instruments
Subsidised energy audits
Subsidised loan guarantees
Subsidised interest rates
Ex-ante investment grant
Ex-post bonus payment for
results from investment
Investment grant equal to
savings by MoF on subsidies
to fossil fuel
Subsidised training in
EE
Linking payment for
fuels & electricity to
efficiency of production
White tradable
certificates (cap &
trade)
Pollution levies
(charges for disposal
of hazardous waste)
CERs
Financial
Instruments
Loans with longer tenor
Loan guarantees
Local Government co-finance
of investments in waste
management firms
State supported ESCOs
Green bonds
Source: Mostert (2011)
The distinction between fiscal, economic and finance instruments is artificial in the sense
that all three are economic and that all three intend to leverage private finance for EE-
investments.
There is widespread recognition, also in Indonesia, that integrated packages of measures,
not individual instruments, are capable of generating results. In accordance with the

105
Government’s emphasis on voluntary actions, positive economic instruments play a
prominent role in environmental legislation and policy making. The Environmental Act
32-2009 Articles 42 and 48 list three categories: (i) environmental economics for planning
process (natural resource accounting, green GDP measurement, compensation for local
government in terms of payment for environmental services, internalization); (ii)
environmental funds (performance bonds, environmental guarantees, environmental
recovery fund, a block grant from Gvt to remove the impact of environmental degradation
and pollution – from source to recovery and the Environmental Trust Fund to
complement the existing sources of funds, especially for local Gvt); (iii) positive and
negative incentives (listing 11 instruments – taxation, payment for environmental
services, environmental insurance, green banking, labeling, etc.). The Law for Renewable
Energy includes tax and VAT exemptions; the Law for Energy Efficiency does not.
It is no surprise, therefore, that Indonesia has introduced several of the instruments listed
in the matrix: exemption from import duty, VAT and excise taxes on qualifying EE-
equipment , grant support to energy audits , subsidized training of auditors. Indonesia will
also increase landfill levies over time. Early 2011, banks in Indonesia charge interest rates
of 10.5% to 13% for loans to companies, with the highest being charged to SMEs. High
nominal interest rates pose an obstacle to investments with pay-back periods beyond two
years, even if inflation reduces the real rate of interest to much lower levels. Large
companies in Indonesia, therefore, tap funding from overseas instead of from local banks
for larger scale investments. Some donor financed schemes provide interest rate
subsidies of 5-7 percentage points below commercial interest rates to EE-investments by
SMEs.
5.4 Recommendation
The adjustment and implementation process will take time with its ups and down,
therefore it is critically important to:
• Gradual change
Change rarely easy, even more so for change with up-front cost and far future
benefit. There will be some actors that bore larger share of the negative impact or
cost and need to be persuaded. A gradual process with flexibility but persistant is
preferred than big bang approach that sprint in the beginning but fizzle later on.

106
• Recognize best practice
Starting small with few pilot project that is well documented and well dissiminated
will take some edge of the inertia and smooth the transition. People are more
willing to be change if they see the benefit clearly and part of, albeit slow, moving
crowd instead of first to be experimented with.
• Monitoring and evaluation
The transition will be complex with numerous stages and multi-faceted. in order
to avoid being overwhelmed and loosing control, its imperative to devide into
managable stages with clear milestone and monitoring-evaluation system in place
since beginning. Thus, enabling re-calibration if needed in the midst of the process.
• Setting framework for cap and trade
Setting up a market for polution permit is a complicated process. Even the
European Union that initialized in 2005 is still far from perfect. Indonesia need to
study experiences of countries/region that already have the market and adjust the
framework to suit our circumstances, espcially on the monitoring, reporting and
verification (MRV) mechanism.

107
REFERENCES Aiba, T., “Competitiveness and Kyoto Protocol – A Japanese Perspective”, Presentation on
OECD Workshop on Policies to Reduce GHG Emissions Lesson Learnt, 2002
Blackman, Allen, “How Well Has Colombia’s Waste-Water Discharge Fee Program Worked and Why?”, Economic Incentives to Control Water Pollution in Developing Countries, 2006
Bank Indonesia, “Economic Survey”, July, 2010
BAPPENAS, “Industry Sector Report”, Indonesia Climate Change Sectoral Road Map (ICCSRM), 2010a
BAPPENAS, “Rencana Pembangunan Jangka Menengah Nasional (RPJMN) 2010-2014”, Book II, 2010b
BPS, “Small and Medium Manufacturing Statistics 2005”, Book I, 2005
BPS, “Monthly Report on Social Economic Conditions”, July, 2011.
Dhewanti, Laksmi, “Addressing Financial Obstacle of Micro Small Medium Enterprises (MSMEs) for Environmental Investment in Indonesia”, ESCAP Policy Paper – Greening the Business and Making Environment a Business Opportunity, 2007
ECOFYS, “Skema Penurunan Gas Rumah Kaca untuk Industri Semen di In-donesia”, Agence Francaise de Developpment (AFD) and MOI policy paper, 2010
Econoler International, “Developing Financial Intermediation Mechanisms for energy efficiency projects in Brazil, China, and India”, Workshop on ESCOs and Equity Financing, 2005
M. El-Fadel, M. Zeinati, N. Ghaddar and T. Mezher, “Uncertainty in Estimating and Mitigating Industrial Related GHG Emissions”, Energy Policy, vol. 29, issue 12, 2001
Morgenstern R.D., Ho M., Shih J.-S., Zhang X. “The �ear-Term Impacts of Carbon
Mitigation Policies on Manufacturing Industries”, Discussion Paper 02-06, 2002
EPA, “Quantifying Greenhouse Gas Emissions from Key Industrial Sectors in the United States”, Working Draft, 2008
KfW Bankengruppe, “Financing Renewable Energy: Instruments, Strategy & Practical Approach”, Discussion Paper 38. 2005.
Haites E., and F. Mullins ,“Linking Domestic and Industry Green-house Gas Trading Systems.”, Policy Report for IETA, EPRI, and IEA, 2001
INCCA, “India: Greenhouse Gas Emissions 2007”, MEF Working Draft, 2010
Leggett, Jane, J. Logan, and A. Mackey, “China's Greenhouse Gas Emissions and Mitigation Policies”, CRS Reports for Congress, 2008
Mostert, W., “Moderation Process to identify Fiscal and Economic Instruments for the Indonesian Industry to reduce Emissions of Greenhouse Gases”, Bappenas-GIZ, 2011
Indonesian Ministry of Environment, ” Indonesia Second National Communication to UNFCC”, November, 2010

108
OECD. “International Economic Instruments and Climate Change”, OECD, 1993
OECD, “Domestic Transferable Permits for Environmental Management – Design and
Implementation, OECD, 2001
OECD, “Environmentally Related Taxes in OECD Countries - Issues and Strategies, OECD”, Paris, 2001b
OECD, “Voluntary Approaches for Environmental Policy: Effectiveness, Efficiency, and Usage in Policy Mix”, OECD Policy Paper, 2003
OECD, and IEA, “Policies to Reduce Greenhouse Gas Emissions in Industry – Successful Approaches and Lessons Learned”, Information Paper, 2003
Paltsev, Sergey, John Reilly, Henry Jacoby, A. Ellerman, and Kok Hou Tay, “Emission Trading to Reduce Greenhouse Gas Emissions in the United States: The McCain-Liberman Proposal.”, MIT Joint Program: the Science and Policy of Global Change, 2003
Patunru, Arianto A., “Can the Market Take Care of the Environment? (What the Literature Says about Marketable Permits)”, Economic and Finance in Indonesia, 2004, Vol. 52, No. 3, pp. 263-278
PEACE, “Indonesia and Climate Change: Current Status and Policies”, DFID, and World Bank, 2007
Stavins, Roberts, “Economic Incentives for Environmental Regulation”, The Belfer Centre for Science and International Affairs (BCSIA) Discussion Papers, 1997
Torvanger, A., “Taxing and trading in �orwegian climate policy”, Paper for the OECD Workshop on ‘Policies to Reduce Greenhouse Gas Emissions in Industry – Successful Approaches and Lessons Learned’, 2002
UNEP, “Economic Instruments and Fiscal Policy”, Fourteenth Meeting of the Forum of Ministers of the Environment of Latin America and the Caribbean, 2003
World Bank, “Phase 1: Status Report and Findings”, Low Carbon Develop-ment Options for Indonesia, 2008
World Bank, “Emissions Reduction Opportunities and Policies: Manufactur-ing Sector”, Low Carbon Development Options for Indonesia – Technical Report, 2010
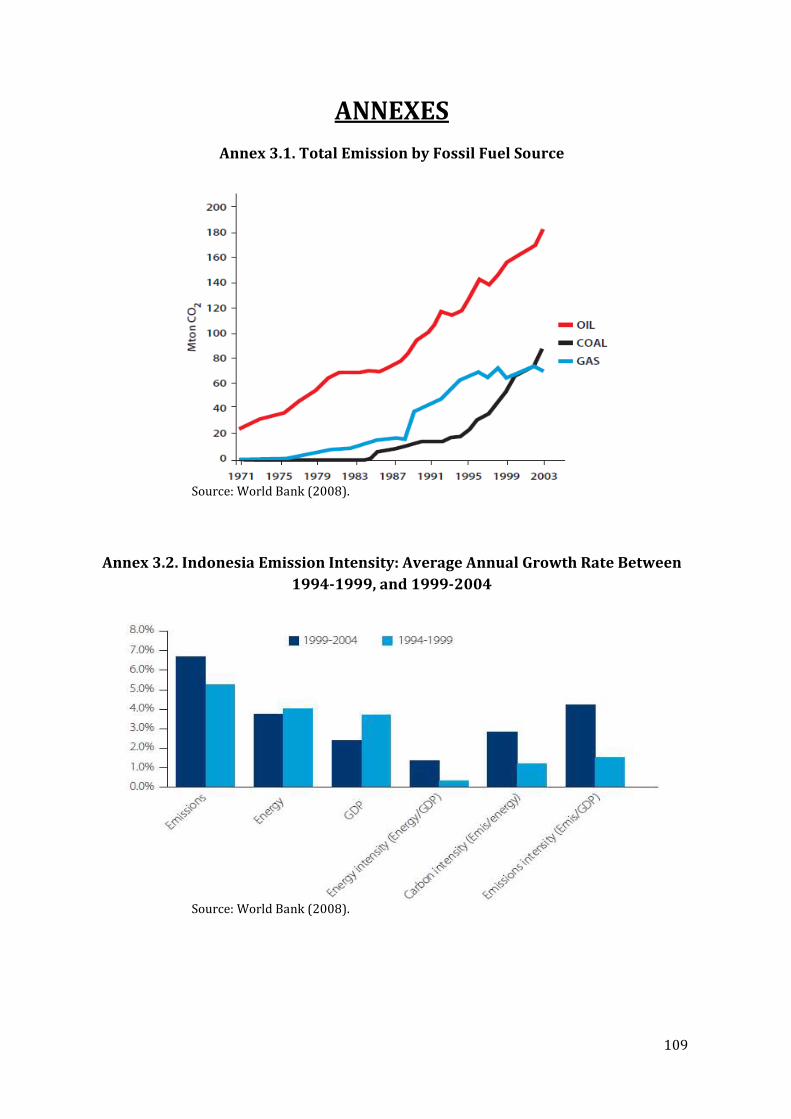
109
ANNEXES
Annex 3.1. Total Emission by Fossil Fuel Source
Source: World Bank (2008).
Annex 3.2. Indonesia Emission Intensity: Average Annual Growth Rate Between
1994-1999, and 1999-2004
Source: World Bank (2008).

110
Annex 3.3. Top Priority Individual Industry Sector
No. Manufacturing Sectors ISIC Code
1 Cement 26411
2 Iron and Steel 27101
27102
3 Pulp and Paper 21011
21012
4 Fertilizer 24122
5 Textiles 17111
17112
17114
17122
Source: BAPPENAS (2010a).
Annex 4.1. MOI Energy Policy for Iron and Steel Industry
Source: BAPPENAS (2010a).
Annex 4.2. MOI Energy Policy for Pulp and Paper Industry
Source: BAPPENAS (2010a).
Policy 2010-2015 2015-2020 2020-2030
Energy Efficiency
Efficiency of pulping process Recycling of products and its waste Increase efficiency of technology/process via modification
Boiler efficiency
Efficiency on drying process
Shoe press usage
Alternative Energy
Condebelt drying
Initiation of biogas utilization Gastification process (natural gas) with black liquor
Policy 2010-2015 2015-2020 2020-2030
Energy Efficiency
Preheating furnace for 71 industries Recycling of products and its waste Dry coke quenching
Improvement of preheating process Improvement of process fuzzy based preheating process Hydrogen reduction and O2 consumption on blast furnace
Smelt Reduction Scrap preheating
Development of optimized electrical Furnace
Alternative Energy
Product gas combine cycle (coal)
Initiation of biomass utilization
Product gas combine cycle (including biogas)
Initiation of biogas consumption

111
Annex 4.3. IPCC List of GHG Emission Particles
Source: IPCC.
No. List of GHG Emission Regulated
1 Yes
2 CO Yes
3 No
4 No
5 CFC-11 No
6 CFC-12 No
7 CFC-13 No
8 HCFC-22 No
9 HCFC-141b No
10 HCFC-142b No
11 No
12 No
13 HFC-125 No
14 HFC-134a No
15 HFC-152a No
16 HFC-23 No
17 No
18 No
19 No
CO2
CH4
N2O
CH3CCL
3
CCL4
SFe
CF4
C2F
e

112
Part III
Private Sector Engagement in GHG Emission
Reduction Activities in Indonesia
- An Empirical Study -
By:
Maren Breuer

113
List of abbreviations
RE Renewable energy
EE Energy efficiency
CDM Clean Development Mechanism
CER Certified emission reductions
SME Small and medium enterprises
e.g. For example
i.e. That is
GOI Government of Indonesia
FDI Foreign direct investment
ID Indonesia
MNC Multinational corporation

114
1 Background
Climate change, which is globally recognized as the major, overriding environmental issue of
our time, is becoming a more and more urgent issue as the rates of emissions of greenhouse
gases (GHG) need to be significantly reduced in order to prevent the dangerous impacts of
global warming.
The Indonesian government recognizes that tackling climate change is an integral part of the
development challenge facing the nation and thus plays an active role in various international
negotiations. To set a new course on climate change and be part of the solution to global
warming, Indonesia aims to cut emissions by 26 percent from current levels with own efforts.
With international support in the mitigation actions even 41 percent are targeted at.
To reach this goal, national mitigation measures need to be developed and integrated into all
aspects of national, regional, and local development planning and implementation.
In Indonesia, the industry sector is the driving force for the economic development and wealth
of the nation.41 Simultaneously, however, climate change is caused to significant degrees by the
emission of green house gases (GHG) released during industrial production processes. In
recognition of these crucial interlinkages Bappenas, assisted by the ‘Deutsche Gesellschaft für
Internationale Zusammenarbeit’ (GIZ) through its technical cooperation programme PAKLIM
(‘Policy Advice for Environment and Climate Change’), is currently working on the
development of policies and incentive schemes to support Indonesian industries in
increasing their productivity and strengthening their competitiveness while at the same time
reducing GHG emissions.
In the outlined context, in order to be able to target the design of these policies and support
mechanisms closely to the needs of the industrial actors, the present report outlines the results
of a series of interviews that were conducted with representatives of selected companies
operational in Indonesia to obtain the ‘voices’ of the industries and hence explicitly explore the
‘demand side’ itself.
41 Indonesia is already the 6th largest economy among developing countries with positive projections towards Indonesia’s
status of competitiveness and a very dynamic economy (World Economic Forum, 2011). The annual GDP growth of Indonesia has increased steadily since 1998, reaching 4.9% in 2009 and showing robust growth until 2012 with preliminary figures of 6.1% in 2010 and 6.4% in 2011 and 6,7% in 2012 (World Bank 2011, p.9). The manufacturing industry is the largest contributor to the GDP of Indonesia, followed by the agriculture, livestock, forestry and fishery sector (BDS 2009).

115
2 Objectives and methodology
The specific interests of the interviews were to:
- Stock take of a) the industries’ current level of awareness concerning GHG emission
related issues and existing policy initiatives, and b) companies’ existing / potential
activities in the area
- Understand and discuss the barriers and challenges that the industries currently
face when intending to engage and invest in issues related to GHG emission reductions
(e.g. energy efficiency, waste water treatment, solid waste management, low carbon
technologies, ‘green’ products)
- Discuss incentives and support mechanisms that the industries would require to
enable them to engage and invest in the above mentioned behavioral and technological
improvements.
The insights gained are to be integrated into the specific endeavor of designing appropriate
instruments for the Indonesia industries, as well as to be used more generally for the policy
work that PAKLIM is jointly undertaking with its public partners for improving the overall
framework conditions for low carbon business operations and investments in Indonesia.
In line with these objectives the primary targets the study aimed at were national
manufacturing companies, primarily from the GOI’s focal sectors for mitigation, i.e. cement,
pulp and paper, iron and steel, and fertilizer.
Besides these, although the particular focus here concerned actors from the industrial sector, it
is generally widely acknowledged that in order to successfully meet the challenges posed by
global warming, it is essentially the private sector generally that has to be mobilized for
finance, technology and investment. I.e. more than 85% of the investments that are needed
globally over the next 20 years to curb GHG emissions ($ 1 trillion per annum according to
IEA) will likely have to come from private investors (UNFCCC, 2007) (e.g. through investments
in green/ clean technologies). In light of this and together with the fact that the importance of
foreign direct investment (FDI) is clearly recognized by the Indonesian government,
interviews were also conducted with multinational corporations (MNCs) operational in the
Indonesian market.
The approach adopted for selecting the companies to be interviewed followed the method of
purposeful sampling (Denzin & Lincoln, 2000), whereby the choice of the targets was guided by
certain predefined criteria and characteristics. I.e., for the first round of interviews the focus

116
was set on selecting companies that had already distinguished themselves as being socially
responsible in some way or another (exemplified e.g. by being members of the UN Global
Compact, Caring for Climate signatories, and/ or former GIZ development partners), as these
were generally thought to be more responsive to such a request and would hence enable the
researchers a good ‘entrance’ to the field.
In a second round then, the focus was explicitly set on national companies, thereby favoring
the larger manufacturing entities from the GOI’s focal sectors because together these
establishments already account for a high share of the overall emissions from the Indonesian
industry sector.
In all cases, the concrete process towards being granted an interview followed the same
procedure: A standard template for the interview requests was developed (cf. Annex II a) for
round 1, Annex II b) for round 2) and personalized to each company as much as possible,
including efforts to also directly identify the most suitable person to address the letter to. In
particular with the national companies this search for the most ‘suitable’ person proved to be
quite challenging as these companies often do not predispose of any well-developed website,
and no general ‘rule’/pattern could be identified as to which concrete department (e.g. CSR,
environment, energy, corporate communications) would be responsible and most
knowledgeable about the issues at hand.
As already indicated to the potential interviewee in the individual request letters, after approx.
one week a member of the PAKLIM team then called the respective companies in order to
arrange a specific date and time for the interview (round 1), or to confirm (or make
adjustments) to the initially suggested fixed timeslot in the letters (round 2).
Overall, more than 45 letters were sent and numerous and repeated calls were made to the
different companies. This finally resulted in 16 interviews that were conducted between
February and June 2011. While this response rate sounds rather low, it is in fact a very
common outcome in any such empirical endeavors and was already calculated into the design
of the entire qualitative approach. In line with this, rather than aiming at a large sample size,
statistical data and answers that would be representative for the Indonesian industry sector as
a whole, the explicit aim here was instead to explore a number of ‘interesting’ cases that would
reveal in-depth insights into the selected companies. For this kind of qualitative research then,
a few interviews are usually already sufficient to meet the objectives at hand (for details on the
variety of qualitative research approaches and the specifics of these cf. e.g. Yin, 2008). In line
with these research interests, semi-structured interviews were used, for which a guideline was
prepared that outlined the different areas/categories to be covered and certain exemplary
questions within each field (cf. Annex I). On request by the interviewees (or their assistants),

117
this guideline was sent to them prior to the interview. During the interviews themselves,
however, the document was not used in a rigid way but the interviewers were specifically
required to remain as flexible and open to the individual situations as possible.
Overall, by following this exploratory qualitative approach and having this diversified
purposefully selected sample, in-depth insights could be gained that allow for comparisons not
only across industry sectors but also between national and international companies, thereby
enabling the derivation of valuable conclusions and recommendations. (For details on the
lessons learnt from the empirical research process itself cf. Annex III).
Table 1: Company interviews conducted
3 Results
42 FDI: foreign direct investment 43 ID: Indonesian 44 MNC: multinational corporation 45 SOE: state-owned enterprise
Company Sector Affiliation/
Ownership
Interview
date
DB Schenker transport/ logistics Germany/ FDI42 16.02.2011
Festo Didactics automation technology, related training Germany/ FDI 16.02.2011
Holcim cement Switzerland/ FDI 22.02.2011
PT. Martha Tilaar cosmetics/ beauty services ID43/ private
(MNC44)
25.02.2011
Entec renewable energy technology and consulting Switzerland/ FDI 28.02.2011
SAP business software Germany/ FDI 08.03.2011
TÜV Rheinland certification company Germany/ FDI 25.02.2011
Siemens engineering conglomerate Germany/ FDI 31.03.2011
PT. Sinar Mas agrobusiness division ID/ private 31.03.2011
PT. Asia Pulp & Paper (APP) pulp & paper ID/ private 25.04.2011
PT. Mulya Keramik ceramics ID/ private 12.05.2011
PT. Indocement cement ID/ private 26.04.2011
PT. Semen Gresik cement ID/ SOE45 16.06.2011
PT. Chandra Asri petrochemical ID/ private 31.05.2011
PT. Petrokimia Gresik petrochemical ID/ SOE 13.05.2011
PT. Krakatau Steel iron & steel ID/ SOE 23.06.2011

118
Overall, one of the most crucial remarks regarding the results gained from the interviews
conducted is that considerable differences have to be noted concerning climate change
awareness and activities depending on industry sector (i.e. energy-intensive industries versus
less energy intensive sectors) and on company affiliation (i.e. particularly between Western
affiliated multinational corporations, national companies oriented towards international
markets, and national companies that are largely focused on the domestic market). These will
be reflected in the following presentation and discussion of the results.
Besides these differences within the present sample, however, in using and interpreting the
insights outlined, it must also be emphasized that the study was clearly focused on large
companies, as these are considered the core actors and primary ‘targets’ regarding the issues
at hand (due to being large “polluters”/ energy consumers, and/ or predisposing of the
important competences and also financial means for successfully tackling the issues posed by
climate change, e.g. by applying the right management and investments approaches – if
appropriately stimulated). For SMEs the situation regarding awareness and activity levels,
barriers and challenges, and consequently also support measures required, will certainly be
quite different. A differentiated approach is hence necessitated for this target group, which
might be the subject of subsequent investigations.
3.1 Climate change awareness
Concerning awareness of the topic of global warming and climate change in general, all
interviewees indicated that they knew about the basic tenets and related global challenges.
This knowledge, however, did not seem to be related to their specific professional context, but
rather derive from the topic’s general discussion and coverage in the media nowadays.
More crucially, regarding the (international) position and official commitments, activities, and
related policies (plans) of the Indonesian government in the area of climate change, the
knowledge is rather limited. Whereas most interviewees had at least heard about the
president’s “26%/ 41% commitment”, the majority was neither informed about any concrete
programs or initiatives the GOI/ different ministries are currently undertaking, nor could
name the overall direction the GOI was heading to in this context. Even those companies
whose core business directly involves ‘green/ clean’ technology or who are widely known as
significant contributors to global warming (esp. cement and pulp & paper companies)
indicated that it is actually international regulations and global customer/ stakeholder
requirements that they mostly orient themselves at because these will in any case always be
more stringent and demanding than whatever is set up/ demanded in the Indonesian market.

119
3.2 Existing activities
All interviewed companies have already implemented, are currently engaging in, and are
further planning a variety of activities related to the environment in general. These include
efforts in waste management, waste water treatment, reduction of air pollution caused by their
operations, etc. In line with this, almost all interviewees explicitly stated that their companies
are certified ISO 9001 and most also ISO 14001. In addition, the majority of concerned
companies has already achieved PROPER “Green” status (or even “Gold”), and the rest is
currently striving to move from “Blue” to “Green”.
Besides efforts directed at environmental issues, also a plurality of energy conservation/
efficiency measures have and are being implemented by the companies interviewed. At the
forefront here are clearly the energy-intensive industries. I.e., where energy costs make up 2/3
and more of the companies’ overall costs (like in cement, fertilizer, steel), energy savings are
equal to cost savings. Hence, in these cases it is actually already from the inception of their
business operations that efforts are being made to constantly improve the energy efficiency in
the production itself and to maximize the companies’ products accordingly. A well-staffed
energy department exists, including in-house R&D on related technological solutions, which is
then usually quite powerful compared to other corporate departments (cf. esp. Chandra Asri).
Whereas such energy conservation efforts must clearly be noticed and appreciated, they are,
however, actually common practice in those industries (“business as usual”) motivated by pure
cost considerations, instead of any direct climate change concerns. Hence these activities also
do not represent/ include any additional efforts directly oriented towards climate change/GHG
mitigation.
In a similar way, also the environment related activities that the national companies have
initiated are in fact not explicitly or consciously oriented towards climate change mitigation/
GHG emission reductions.
Different from the plurality of ‘normal’/BAU activities, there are, however, still some projects/
initiatives that are explicitly oriented towards climate change mitigation. I.e., among the
national companies it is particularly efforts to increase the use of alternative raw materials
(esp. in the cement industry) as well as the substitution of fossil fuels through biomass (e.g. in
pulp & paper, cement) that are officially registered as CDM projects. Apart from the prospects
of receiving revenues from the CERs and cost considerations, the motivation to pursue CDM
projects is not always entirely financial, but these projects may also be promoted in the context
of the company’s CSR activities (cf. e.g. APP).

120
With regard to the MNCs in the sample, in terms of both environment and energy related
issues their operations in Indonesia are largely oriented at the high standards their mother
company follows in their home country. In line with this, even though the majority does in fact
not have large own production facilities in Indonesia itself and local conditions are often quite
different from ‘home’, the MNCs’ activities are still clearly driven by their headquarters’ “green
global strategies”. I.e., certain (reduction) targets are set at home, and the individual local units
then either do exactly what is prescribed top-down (where feasible) or they are given the
freedom to come up with own ‘green’/ climate change activities and programs tailored to what
is possible in their surroundings in order to contribute to the corporation’s overall global
target (e.g. DB Schenker has a 20% emission reduction target until 2020). Examples include
internal awareness raising (e.g. through a ‘green corner’ in the company’s monthly corporate
newsletter, driver's training to improve fuel efficient driving, encouragement to use less paper
or to leave one’s car at home and instead use public transport), the construction of a new eco
building as the company’s new head office or logistics centre in Jakarta, participation in the
new Dry Port project in Jabakeka, ensuring sustainable operations at their own sites, e.g.
through regular checks on energy, water, and waste issues, and a waste-to-energy power
generation unit.
Finally, apart from environment and energy related measures, which are primarily internally
oriented, and the widespread existence of respective departments responsible for these issues,
all of the national companies also have a specific CSR department, a fact that is clearly related
to the existing regulations and widespread concept of “CSR” in the Indonesian market. I.e., as
part of the “state-owned company law” (UU 19), SOEs are already since longer required to
dedicate a certain percentage of their sales to improvements in social circumstances and
infrastructure. In addition to this, in July 2007 the GOI uniquely released a specific law making
social and environmental responsibility mandatory for all limited liability corporations,
emphasizing so far particularly companies operating in extracting industries and in the field of
natural resources (TJSL 40/1007). In line with this, traditionally these companies’ CSR
activities then are mainly focused on philanthropic issues and center on the company’s
surrounding community. Typical programs include scholarships and support for education,
sports and arts committee, healthcare and hospitals in the local community. Regarding “green”
CSR, the major and largely only activity so far is tree planting.

121
3.3 Motivations and drivers for engagement
As partially indicated in the above section already, the overriding/ primary motivation or
‘driver’ for any of the companies to engage in environmental and especially in energy related
activities is economic, i.e. cost reductions and/ or direct revenues.
Besides, in line with the above distinction between the different company categories, an
important driver for MNCs in particular is the requirements from their headquarters, the
demands of their customers at ‘home’, alignment with international standards and
participation in international multi-stakeholder initiatives. For national companies that are
exposed to (international) competition and those that are highly ‘visible’ to the end consumer
and/ or under scrutiny from other stakeholders (e.g. NGOs like Greenpeace), also image
questions are of importance. Moreover, another increasingly important driver for companies
listed on the stock market is financial investors, who have started to scrutinize the ‘green’ side
of potential investment targets.
Finally, more long-term considerations drive those companies that have a deeper
understanding of the overall issue, for whom climate change is already a strategic issue, who
see the related business opportunities and who are also able and can ‘afford’ the flexibility to
adopt their business models/ products to these ever more changing circumstances. These are
clearly the large MNCs, who are affiliated with some powerful mother company in the West.
Table 2: Overview on motivations and drivers for company engagement in climate
change related activities
Motivation/ driver Source (if applicable)
• Cost and efficiency
o “It’s tough competition”
o Pressure to decrease transportation costs (less fuel
consumption)
o Reduce fossil fuel, electricity and raw material usage
Mulia
DB Schenker
Indocement
• Increasing energy prices
o “The industry still has no awareness of energy conservation but
due to increasing prices it gradually changes.”
Krakatau Steel
• Stakeholder demands
o Shareholder commitment
o Make added value for core business partners and stakeholders
such as Certified Emission Reduction (CER)
o Pressure from clients that intend to improve their CO2 footprint
(such as Nike, adidas)
o Demands of financial investors/ stock market
Indocement
DB Schenker
Chandri Asri

122
• Competitive positioning
o Climate change is clearly a business opportunity … hence we are
starting our own „green business” now and position ourselves e.g. in
the waste sector….”
o Create new business and job opportunities; Offer waste management
solutions for other industries; Provide low cost, high quality and
environmental friendly product
Holcim
Indocement
• Own image improvement (“in Europe”) and marketing aspects
DB Schenker, Holcim
3.4 Barriers and challenges
While there are significant differences in terms of climate change awareness and related
corporate activities/engagement, which primarily depend on the companies’ core business
operations and their ‘orientation’, regarding barriers and challenges there are in fact a number
of common and recurring issues mentioned throughout the different interviews.
A first area concerns existing regulations. I.e., interviewees mention the lack of clarity of e.g.
reporting requirements as well as partial overlaps between ministries’ demands (e.g. for the
collection of energy data from their factories). Also the high level of bureaucracy and the
plurality of required tedious procedures e.g. for applying for certain funds, lead to both
confusion and overburdening. Moreover, in line with the fact that there are already a variety of
legislations in place, interviewees remark that the biggest problem in Indonesia is actually not
their quality, but the limited enforcement of what exists on paper.
A second essential barrier emphasized throughout almost all interviews is the severe lack of
internal capacities, knowledge and information on possible mitigation measures and
especially on available ‘green/ clean’ technologies:
• “… but the people just do not know about it. … hence educate people and also set e.g.
equipment/ efficiency standards” (Krakatau Steel)
• “… so the technologies are in principle available but especially among those industry players
that are not global actors both the awareness and the willingness to change are missing …”
(Holcim)
Related to this, even though in principle most of the larger companies would actually be able to
afford external consultants to advice and assist them in these activities, the external market
of such qualified service providers is considered as severely limited.
• “… the only solution currently is to “go to the university of google” (Mulia)

123
Internally again, interviewees also note that among their own employees the awareness
regarding climate change issues is still very low, which makes any attempts for improvements
or initiatives in these areas very difficult.
• “… environmental issues are generally equated with ‘mere’ air pollution – the GHG/ climate
change topic is not yet really socialized” (Mulia)
Considered one important underlying reason for the limited awareness especially regarding
energy efficiency issues then clearly is the fundamental problem/ topic of energy subsidies.
Although at first sight clearly beneficial to many, even from the side of the national big energy
users in the sample the existing subsidies were mentioned as an important barrier. I.e., due to
the low costs for energy in Indonesia, people are largely careless about their energy
consumption, and since issues like energy efficiency (and also renewable energy as e.g. a
substitute for conventional fossil fuels) are not linked to profitability, there is consequently
also no motivation to save energy.
More broadly again, different voices concerned the distance the companies feel between the
GOI and the private sector. Quotes emphasizing this include:
• “Politicians are talking up in the air… the government should not talk alone all the time entirely
remote from the private sector” (Entec)
• “Politicians are discussing alone in the basement” (DB Schenker)
• “There is lack of guidance from the government” (APP)
The companies miss knowledge of the GOI’s vision regarding the topic of climate change, and
energy in particular, and explicitly call for being more involved.
Moreover, it was repeatedly mentioned by national companies in the sample that equity is in
fact not the problem. However, when it comes to certain new technologies or process
improvements that would require rather high investments, there is still always considerable
rivalry among different internal investment targets. In these cases then any ‘green’ or
more innovative/ advanced topics are most likely to lose out if they do not come directly from
the top management. Also, in any case companies (as well as public actors) in Indonesia still
make investment decisions largely based on the least cost principle without any life cycle
assessments, also mostly leaving out any environmental considerations. As a consequence, the
companies go largely for the cheaper and dirtier technologies from China since the ‘clean’
alternatives are (seen as) too expensive to afford.

124
Besides, in line with the above mentioned fact that all the national companies actually have a
specific CSR department and also engage in a variety of different mostly community-related
projects, the challenge they face, however, is the lack of innovative ideas for using their CSR
funds to implement new ‘green’ projects beyond the common tree planting.
Finally, although not valid throughout all sectors, an essential barrier emphasized particularly
for the cement as well as for the steel industries is the existing hazardous waste regulations
in Indonesia. I.e., for the steel industry, whereas in Europe and elsewhere in the world steel
slag is not classified as hazardous waste and can hence easily be disposed of, the situation in
Indonesia is different and the disposal is hence cumbersome and expensive. This is seen as a
considerable competitive disadvantage both for the companies’ operations in general, and for
any efforts to reduce GHG emissions in particular. In the cement industry the challenge is
related to the respective regulations preventing the companies from using certain waste
materials classified as hazardous either as alternative fuel in their production processes and/
or within blended cement, which could both considerably reduce the industries’ emission level
of GHG emissions.

125
4 Support measures and incentives
Deriving from the above outlined barriers and challenges, a number of incentives and support
measures that the companies would require/ wish for were voiced and discussed during the
interviews.
Related to the existing regulations, a clear need to harmonize, streamline, and especially better
communicate what is already there was identified, instead of creating ever new laws and
regulations.
Moreover, companies are in high need of real competent assistance. I.e., instead of the
trainings their employees currently receive e.g. through the different ministries’ training
centers, they would require actual technical assistance on the ground in their own facilities to
really implement and follow-up any measures for improving energy efficiency/ reducing GHG
emissions. A crucial support measure would hence be the availability of an increased market of
real competent service providers – “rather than consultants just certified as such” (Mulia).
Concerning energy subsidies the discussion is clearly quite delicate/ sensitive. Nevertheless,
there were several voices from both MNCs and national companies that explicitly pointed to
the need to finally reduce the existing subsidies since at least the larger industries in Indonesia
could actually handle higher energy prices. For doing so a balanced approach would of course
be needed whereby price increases must not impair the companies’ competitiveness. Instead
they should be coupled with information and direct support and (financial) incentives for
installing e.g. technologies that allow the industries to compensate the increased costs through
improvements in energy efficiency.
With regard to the essential role of technology for tackling the challenges at hand, particularly
the national companies require better information on what are “clean” technologies in the first
place. In addition, even though companies are oftentimes aware that the cleaner/greener
(technological) solutions would be those available from e.g. Germany or the US, the cheaper
price of especially Chinese equipment makes them finally go for the ‘dirtier’ solutions. Support
and incentives for such greener investments would hence be required, e.g. in the form of tax
exemptions, the reduction in import duties or other rewards for those companies that
implement low-carbon technologies and report their GHG reduction achievements.
On the ‘softer’ side again then, companies wish for increased communication between the GOI
and themselves, especially Bappenas and other coordinating ministries, in order to enable
higher involvement and raising their voices with regard to the important energy and climate

126
change issues at hand. Also, clearly set and enforced standards, security and orientation
(particularly for making investments) are what the companies look for.
Besides, both assistance in developing and implementing “green” CSR projects is asked for, as
well as official recognition and rewards for any such efforts that are beyond mere compliance.
Finally, in line with the country’s target to reduce the use of oil and coal to meet the industries’
energy demand, the employment of gas as well as increasingly also of biomass has been
encouraged by the GOI. The companies are very open to follow this direction and have already
made moves into this direction. However, in order to make these efforts truly sustainable, on
the one hand support is required for realizing the necessary (technological) changes. On the
other hand, the GOI is asked to ensure both sufficient and constant supply of natural gas, as
well as competitive prices for renewable energies (in particular biomass; e.g. through a special
subsidy) – otherwise the companies resort back to the use of coal (as happening already) and
refrain from turning towards renewables.
Conclusions and recommendations
Rethink power generation strategy – ID has so much RE potential, esp. geothermal –some scattered windmills won’t do it.
The GOI wants us to use more gas but now the supply is short and we have to resort back to coal.
The only solution for us is to resort to the universe of google .
It’s just all so tedious the procedures (for CDM and
project applications in general).
The German/US technologies would be better but it’s too expensive – without support we will keep going for the cheap
ones from China.
The majority of companies can actuallyafford higher energy prices; they do a bit already but would do it all much fasterthen .
Government activities should be more down to
earth.
People in ID focus only on investment costs – we should
consider lifecycle approaches.
Industries also need/ want guidance/ direction.
Indonesia is not ready for climate change.
Coal is the energy source for ID – but make it “clean”.
Climate change is clearly an opportunity.
Politicians are discussing alone in the basement.
What is needed is not someone just“certified” as competent but reallycompetent.
It is more important to educate the market than to have more
regulations.
We would like to have a “grand design” from the GOI of what activities can actually be counted
towards the national target .
Figure 1: Selected citations

127
5 Conclusions and recommendations
To summarize and conclude from the empirical study presented here, a content-wise synthesis
and recommendations shall be made. For the interested reader lessons learnt from the
empirical research process itself are included in Annex III.
Overall, one of the most apparent conclusions that can be drawn from the study is that the
topic of climate change is not (yet) a strategic issue for the large Indonesian industries. This
stands in quite considerable contrast to the situation found in many (Western) MNCs. These
often have explicit ‘green’ or even climate change strategies and related concrete targets, and it
is then even someone from the top management/ board of directors who is the company’s
chief sustainability officer (cf. e.g. Siemens).46 In the present study this difference was already
clearly exemplified by the fact that from the national companies it was oftentimes people from
the production/ operational level, the energy and/ or environment departments that were
sent to be interviewed, rather than those responsible for the overall strategic direction of the
company. Also, these companies do not have any extra budget specifically for climate change
initiatives or measures, but any such activities are then merely part of e.g. the company’s cost
control/ risk management targets in the different operational sections.
Due to the prevalence of technical people during the interviews (with the national companies)
actual concerns regarding the companies’ competiveness in case of e.g. increased efficiency
standards, higher energy prices, or an emission tax, were not raised or discussed.
Nevertheless, the rich insights gained from the different interactions and the results hence
presented above still allow for some important recommendations to the GOI (Bappenas’
directorate for industry in particular) for initiatives and the design of incentives and policies to
achieve the envisaged emission reductions in the Indonesian industries:
• On a more general and sector-spanning level, the GOI should significantly increase its
efforts to communicate its own vision, ongoing initiatives and already existing support
mechanisms regarding GHG emission reductions in the Indonesian industries. Working
closer with the respective companies/ sectors, e.g. by establishing targeted stakeholder
forums, could support these efforts.
• Closely coupled with the previous is the need to invest more substantially in education
and capacity building on energy efficiency and climate change, both for the local
46 This high ‘anchoring’ is clearly related to the earlier observation (3.2) that in these companies there is already widespread awareness that climate change is – and will increasingly be – an essential issue for the competitiveness of the overall business. This is due in particular to already existing regulations (e.g. cap for certain energy intensive industries in the EU) and/ or anticipated ones, and to stakeholder demands, both consumers as well as financial investors.

128
industries (large and SMEs) and for service providers. Awareness levels regarding these
issues are low throughout all companies and sectors, and competent technical assistance
(rather than mere training disconnected from the industries’ own facilities/ realities) is
needed to ensure actual implementation of measures and to achieve sustainable results.
• Moreover, the GOI should capitalize a) on the observed fact that increasingly also the
Indonesian companies, both industrial and others, strive to be “green” driven by the
demands of financial investors and the global market; and b) on the knowledge and
competences that MNCs have from back “home” and on their potential to act as “climate
champions” and role models to inspire others in Indonesia.
• Related to the latter, use should also be made of the companies’ ambitions and available
funds for CSR measures, e.g. by establishing criteria for officially recognizing and
rewarding “beyond compliance” activities, and by doing so with a particular focus on
efforts directed at reducing GHG emissions.
• Regarding the recurring topic of energy subsidies, although this clearly belongs to the
most difficult and controversial issues to tackle, the GOI should make concerted efforts to
enforce cuts in energy subsidies, while at the same time clearly showing and giving
support to the plurality of measures and technologies that are in fact available for the
industries to cope with higher energy prices.
• Furthermore, apart from the different previous recommendations that are of a more cross-
sectoral nature and may even be extended beyond the manufacturing sector, for designing
more concrete policies that lead to actual and more immediate reductions in industrial
GHG emissions, it seems essential to pay due attention to sector specifics and to follow
differentiated approaches. I.e., if real reductions are to be achieved only ‘carrots’ will not
be sufficient in all cases as it has been shown here that especially certain large
manufacturing industries and companies from the energy intensive sectors currently feel
no real pressure to engage in any reduction/ efficiency measures that are beyond what is
directly cost-beneficial for them. Since the potential and also financial means for doing
‘more’ and doing so faster are actually there though, it should hence eventually be
considered to set certain emission limits (caps) for this group of high emitting/ energy-
intensive companies.
• Finally, as widely acknowledged and emphasized all over the globe, technology is the key
to successfully tackling the important climate change and energy challenges at hand. More
information, incentives and financial support for clean/ green technologies appropriate
for the Indonesian industries should hence be on top of the GOI’s agenda. Here, taking into
account Indonesia’s specific situation in regard to available natural resources, i.e.
particularly its abundance in coal, especially a stronger promotion and improved

129
conditions for “clean coal technologies”, e.g. coal gasification, should be aimed at. In this
regard, in order to prevent the industries from continuing to go for the (initially) cheaper,
but significantly dirtier and overall costlier Chinese technologies, the Indonesian
government could for instance bridge the initial investment gap through direct financial
support. Moreover, it should provide the industries with a clear direction and security for
making such investments by establishing, and particularly also enforcing, adequate
standards for low-carbon technology and energy efficiency codes for certain key industrial
components, and by also anchoring these in the GOI’s own long-term energy plans and own
procurement strategies.

130
References Bada Pusat Statistics (2009): Gross Domestic Product at Current Market Prices by Industrial
Origin 2004-2009, available at:
http://dds.bps.go.id/eng/tab_sub/view.php?tabel=1&daftar=1&id_subyek=11¬ab=1
Denzin, N. K., & Lincoln, Y. S. (2000). Handbook of qualitative research (2nd ed.). Thousand Oaks, CA: Sage Publications. World Bank (2011): Indonesia Economic Quarterly. Available at:
http://www.wds.worldbank.org/external/default/WDSContentServer/WDSP/IB/2011/03/18/0
00333037_20110318015637/Rendered/PDF/601520revised010IEQ1Mar20111english.pdf
World Economic Forum (2011): The Indonesia Competitiveness Report 2011. Sustaining the
Growth Momentum, Geneve.
Yin, Robert K. (2008). Case Study Research: Design and Methods (4th ed.). Thousand Oaks, CA: Sage Publications.

131
Annexes Annex I: Interview guideline
Round 1
Interview Guideline:
"Private sector involvement in climate change activities in Indonesia"
Introduction of GIZ - PAKLIM to the interviewed party:
1. Climate change policy in Indonesia and GIZ's programme PAKLIM
The Indonesian government recognizes that tackling climate change is an integral part of the
development challenge facing the nation and thus plays an active role in various international
negotiations. To set a new course on climate change and be part of the solution to global warming,
Indonesia aims to cut emissions by 26 percent from current levels with own efforts. With
international support in the mitigation actions even 41 percent are targeted at.
To reach this goal, national mitigation and adaptation measures need to be developed and
integrated into all aspects of national, regional, and local development planning and
implementation. To address the related pressing challenges, on behalf of the German government,
the ‘Deutsche Gesellschaft für Internationale Zusammenarbeit’ (GIZ) assists within its programme
‘Policy Advice for Environment and Climate Change’ (PAKLIM) relevant Indonesian stakeholders to
develop and realize sustainable mitigation and adaptation measures.
2. PAKLIM's private sector study
Besides our work with national and local governments, PAKLIM clearly recognizes the essential role
of corporate actors and private investments, and has hence set a particular focus on involving and
engaging with the private sector. To further strengthen this kind of public – private dialogue and
cooperation, PAKLIM is currently conducting a series of interviews with representatives of selected
companies operational in Indonesia.47
The specific interests of these interviews are to:
• Identify the main drivers for private sector engagement in climate change mitigation
activities, investments in low carbon technologies, ‘green’ products, or other climate
change related areas
• Understand and discuss the barriers and challenges that the private sector currently faces
when intending to engage and invest in the above areas.
The insights to be gained are to be integrated into PAKLIM’s policy advice to the relevant
Indonesian ministries for improving the framework conditions for low carbon business operations
and investments. Besides this, PAKLIM is also interested in establishing new partnerships with
private companies to jointly initiate mitigation activities, e.g. awareness raising and capacity
building on climate change, develop and facilitate larger scale co-financed projects in the areas of
energy efficiency and renewable energies, and/ or assist companies with its long-term technical
47 While the focus of the first round of interviews was particularly on multinational companies that have already distinguished themselves through their particular responsibility towards sustainable environmental behavior, the emphasis is to be moved to national companies in subsequent interview rounds.

132
and market expertise in the implementation of their own planned climate change strategies and
action plans.
Introduction of the interviewee and his/her company:
1. Introduction of the interview partner.
2. What does your company know about climate change?
3. In how far is your company affected by climate change (currently/ in the future)?
Current status of climate change activities:
4. Is your company currently involved in any kind of climate change activities?
5. What is the focus area of your company’s climate change activities?
6. Where is the whole topic of climate change ‘located’ in the company’s governance?
Private sector’s motivation for climate change activities:
7. Does your company perceive more risks related to climate change or rather chances arising from
it?
8. What specific risks and/ or chances arise from climate change for your company?
9. What is the main driver for your engagement in CO2/GHG mitigation activities?
10. In your opinion, what is the main driver for the private sector in general to engage in CO2/GHG
mitigation activities?
Difficulties to implement climate change activities:
11. a) What are the difficulties/ barriers your company currently faces when addressing climate
change issues/ implementing climate change activities? What is still missing to do more? Or to
start in the first place?
b) OPTIONAL: Can you give examples of projects that were planned but could not be
implemented due to one of the above mentioned reasons.
12. a) OPTIONAL: What does your company do to overcome difficulties in realizing climate
change activities?
b) OPTIONAL: Can you give examples of projects, in Indonesia or other developing countries,
where you could successfully overcome such difficulties?

133
Indonesia specific situation – Differences to other countries:
13. What is your company’s priority for climate change/CSR activities in Indonesia? Do those
priorities differ from your company’s climate change activities in developed countries or do they
differ from those implemented in other emerging markets? If so, please state why.
Policy Frameworks
14. a) Are you aware of any current Indonesian national (local) policy related to climate change?
b) OPTIONAL: What do you think about the effectiveness of current national climate change
mitigation policy and related policies such as energy efficiency policies, renewable energy
policies, etc.?
15. What do you think about the current status of private sector involvement in CO2/
GHG mitigation in Indonesia?
16. How could national climate change policies be improved to ensure a higher rate of participation/
investment of the private sector in CO2/GHG mitigation in Indonesia?
Further cooperation and engagement in Indonesia:
17. What kind of climate change initiatives/ activities would your company like to and/ or could
image to undertake if the conditions were different/ the ‘right’ incentives in place?
18. Do you already interact with other organizations/ initiatives/ associations/ companies in the area
of climate change?

134
Round 2
Interview Guideline:
"Private sector engagement in GHG emission reduction activities in Indonesia"
Introduction of the study background and research team to the interviewed party:
1. Climate change policy in Indonesia and GIZ's programme PAKLIM
The Indonesian government recognizes that tackling climate change is an integral part of the development
challenge facing the nation and thus plays an active role in various international negotiations. To set a new
course on climate change and be part of the solution to global warming, Indonesia aims to cut emissions by
26 percent from current levels with own efforts. With international support in the mitigation actions even 41
percent are targeted at.
To reach this goal, national mitigation and adaptation measures need to be developed and integrated into all
aspects of national, regional, and local development planning and implementation. To address the related
pressing challenges, on behalf of the German government, the ‘Deutsche Gesellschaft für Internationale
Zusammenarbeit’ (GIZ) assists within its programme ‘Policy Advice for Environment and Climate Change’
(PAKLIM) relevant Indonesian stakeholders to develop and realize sustainable mitigation and adaptation
measures.
2. PAKLIM's private sector/ industries study
The industry sector is the driving force for the economic development and wealth of Indonesia.
Simultaneously, however, climate change is caused to significant degrees by the emission of green house
gases (GHG) released during industrial production processes. In recognition of these crucial interlinkages
Bappenas, assisted by PAKLIM, is currently working on the development of policies and incentive schemes to
support Indonesian industries in increasing their productivity and strengthening their competitiveness while
at the same time reducing GHG emissions. In order to be able to target the design of these support
mechanisms closely to the needs of the industrial actors, PAKLIM is conducting a series of interviews with
representatives of selected companies operational in Indonesia. The specific interests of these interviews are
to:
• Stock take of a) the industries’ current level of awareness concerning GHG emission related issues and
existing policy initiatives, and b) companies’ existing / potential activities in the area
• Understand and discuss the barriers and challenges that the industries currently face when intending to
engage and invest in issues related to GHG emission reductions (e.g. energy efficiency, waste water
treatment, solid waste management, low carbon technologies, ‘green’ products)
• Discuss incentives and support mechanisms that the industries would require to enable them to engage
and invest in the above mentioned behavioral and technological improvements.
The insights to be gained are on the one hand to be integrated into the policy work that PAKLIM is jointly
undertaking with its public partners for improving the framework conditions for low carbon business
operations and investments, and will hence give your company’s voice and concern an increased hearing at
the political level.
Apart from that, PAKLIM is also interested in establishing new partnerships with industrial companies to
jointly initiate mitigation activities, e.g. awareness raising and capacity building on GHG emission reductions,
develop and facilitate larger scale co-financed projects in the areas of energy efficiency and renewable
energies, and/ or assist companies with the long-term technical and market expertise of German
Development Cooperation in the implementation of their own planned energy efficiency/ emission reduction
strategies and action plans.

135
Introduction of the interviewee and his/her company:
1. Introduction of the interview partner and the company’s business overall.
Current status of climate change awareness and activities:
2. What does your company know about climate change/ GHG emissions?
3. Is your company currently involved in any kind of climate change activities?
� If yes, go on with the original interview outline (Questions 19 - 32)
� If limited/ no awareness and no specific CC activities/ plans:
Explore the company’s operations, knowledge, activities, and challenges via the more
implicit links to CC, i.e.: energy usage, energy efficiency, waste, ‘clean’ technologies
and ‘green’ products (Questions 4 - 18)
Current status of energy/ emission related activities:
4. What are energy/ emission related issues that are relevant for your company?
5. What kind of energy/ emission related systems and activities do you already have in place
(e.g. conduct regular energy audits, appointed energy manager, Energy Management
System, relevant certifications?)
6. What is the focus area of your company’s energy/ emission related activities? Please explain
and detail relevant examples.
7. Where are these topics ‘located’ in the company’s organizational structure (i.e. in terms of
managerial responsibility, existence of specific department/ taskforce, budget allocation,
etc.?)
Policy frameworks:
8. Are you aware of any current Indonesian national (local) policy related to energy efficiency/
management, (GHG) emission reductions?
OPTIONAL: What do you think about the effectiveness of current national policies in the above
areas?
Private sector’s motivation:
9. Does your company perceive more risks related to energy/ emission reduction issues or
rather chances arising from it?
10. What is (/ would be) the main driver for your engagement in the outlined activities?

136
11. In your opinion, what is the main driver for the private sector in general to engage in energy/
emission reduction activities?
12. What do you think about the current status of private sector involvement in energy/ emission
reductions in Indonesia?
Difficulties to implement energy/ emission reduction activities:
13. What are the difficulties/ barriers your company currently faces when addressing/
implementing energy efficiency/ emission reduction activities? What is still missing to do
more? Or to start in the first place?
OPTIONAL: Can you give examples of projects that were planned but could not be
implemented due to one of the above mentioned reasons?
14. a) OPTIONAL: What does your company do to overcome difficulties in realizing these
activities?
Required support/ incentives/ and suggestions for policy improvements:
15. How could national energy/ emission reduction policies be improved to ensure a higher rate
of participation/ investment of the private sector in these areas in Indonesia?
16. What particular support/ incentives would your company require to engage and invest
(more) in the discussed behavioral and technological improvements?
Further cooperation and engagement in Indonesia:
17. What kind of concrete energy/ emission reduction initiatives/ activities would your company
like to and/ or could image to undertake if the conditions were different/ the ‘right’
incentives in place?
18. Do you already interact with other organizations/ initiatives/ associations/ companies in
these areas?

137
19. What is the focus area of your company’s climate change activities?
20. Where is the whole topic of climate change ‘located’ in the company’s governance?
Private sector’s motivation for climate change activities:
21. Does your company perceive more risks related to CC or rather chances arising from it?
22. What specific risks and/ or chances arise from climate change for your company?
23. What is the main driver for your engagement in CO2/GHG mitigation activities?
24. In your opinion, what is the main driver for the private sector in general to engage in
CO2/GHG mitigation activities?
Difficulties to implement climate change activities:
25. a) What are the difficulties/ barriers your company currently faces when addressing climate
change issues/ implementing climate change activities? What is still missing to do more? Or
to start in the first place?
b) OPTIONAL: Can you give examples of projects that were planned but could not be
implemented due to one of the above mentioned reasons.
26. a) OPTIONAL: What does your company do to overcome difficulties in realizing climate
change activities?
b) OPTIONAL: Can you give examples of projects, in Indonesia or other developing countries,
where you could successfully overcome such difficulties?
Indonesia specific situation – Differences to other countries:
27. What is your company’s priority for climate change/CSR activities in Indonesia? Do those
priorities differ from your company’s climate change activities in developed countries or do
they differ from those implemented in other emerging markets? If so, please state why.
Policy Frameworks:
28. a) Are you aware of any current Indonesian national (local) policy related to climate
change?
b) OPTIONAL: What do you think about the effectiveness of current national climate change
mitigation policy and related policies such as energy efficiency policies, renewable energy
policies, etc.?
29. What do you think about the current status of private sector involvement in CO2/
GHG mitigation in Indonesia?
30. How could national climate change policies be improved to ensure a higher rate of
participation/ investment of the private sector in CO2/GHG mitigation in Indonesia?
Further cooperation and engagement in Indonesia:
31. What kind of climate change initiatives/ activities would your company like to and/ or could
image to undertake if the conditions were different/ the ‘right’ incentives in place?

138
32. Do you already interact with other organizations/ initiatives/ associations/ companies in the
area of climate change?

139
Annex II: Request letter
a) Example round 1
Interview request on ‘Private sector involvement in climate change activities in Indonesia‘ with
Deutsche Gesellschaft für Internationale Zusammenarbeit (GIZ) GmbH48
Dear Mr. XXX,
As your company and our programme already have good experiences from our previous
cooperation on the development of guidelines for waste co-processing in the Indonesian cement
industry, we would like to interview you or a representative of your company for our current study
on ‘Private sector involvement in climate change activities in Indonesia’.
Climate change is recognized as the major, overriding environmental issue of our time. To address
the related pressing challenges, on behalf of the German government, the ‘Deutsche Gesellschaft
für Internationale Zusammenarbeit’ (GIZ) assists within its programme ‘Policy Advice for
Environment and Climate Change’ (PAKLIM) relevant Indonesian stakeholders to develop and
realize sustainable mitigation and adaptation measures.
Besides our work with national and local governments, PAKLIM clearly recognizes the essential role
of corporate actors and private investments, and has hence set a particular focus on involving and
engaging with the private sector. To further strengthen this kind of public – private dialogue and
cooperation, PAKLIM is currently conducting a series of interviews with selected representatives of
companies that have already distinguished themselves through their particular responsibility
towards sustainable environmental behavior. The specific interests of these interviews are to:
o Identify the main drivers for private sector engagement in climate change mitigation activities,
investments in low carbon technologies, ‘green’ products, or other climate change related areas
o Understand and discuss the barriers and challenges that the private sector currently faces when
intending to engage and invest in the above areas.
The insights to be gained are on the one hand to be integrated into PAKLIM’s policy advice to the
relevant Indonesian ministries for improving the framework conditions for low carbon business
operations and investments, and will hence give your company’s voice and concern an increased
hearing at the political level. On the other hand, we are also interested in establishing new
partnerships with private companies to jointly initiate mitigation activities, e.g. awareness raising
and capacity building on climate change, develop and facilitate larger scale co-financed projects in
the areas of energy efficiency and renewable energies, and/ or assist companies with our long-term
technical and market expertise in the implementation of their own planned climate change
strategies and action plans.
48 Deutsche Gesellschaft für Technische Zusammenarbeit (GTZ) changed its name into Deutsche Gesellschaft für Internationale
Zusammenarbeit (GIZ) as of January 1, 2011.

140
Against this background, we hope to have sparked your interest in agreeing to our request to
conduct an interview with you or another representative of your company responsible for the
above outlined topic area. The interview will ideally take place in February 2011 at your company’s
premises and will last max. 1 hour. To collect your feedback and schedule an appointment, a
member of the PAKLIM team will contact you again via telephone one week after receiving this
letter. Meanwhile, if you have any queries or would like to receive further information, please do
not hesitate to contact:
o Dr. Maren Breuer ([email protected])
o Julia Lettinger ([email protected])
We look forward to further interaction with you.
Best regards,
Dieter Brulez Head of Programme Environment and Climate Change
PAKLIM - Program Advis Kebijakan untuk Perlindungan Lingkungan Hidup dan Iklim
TC Programme Module Policy Advise for Environment and Climate Change
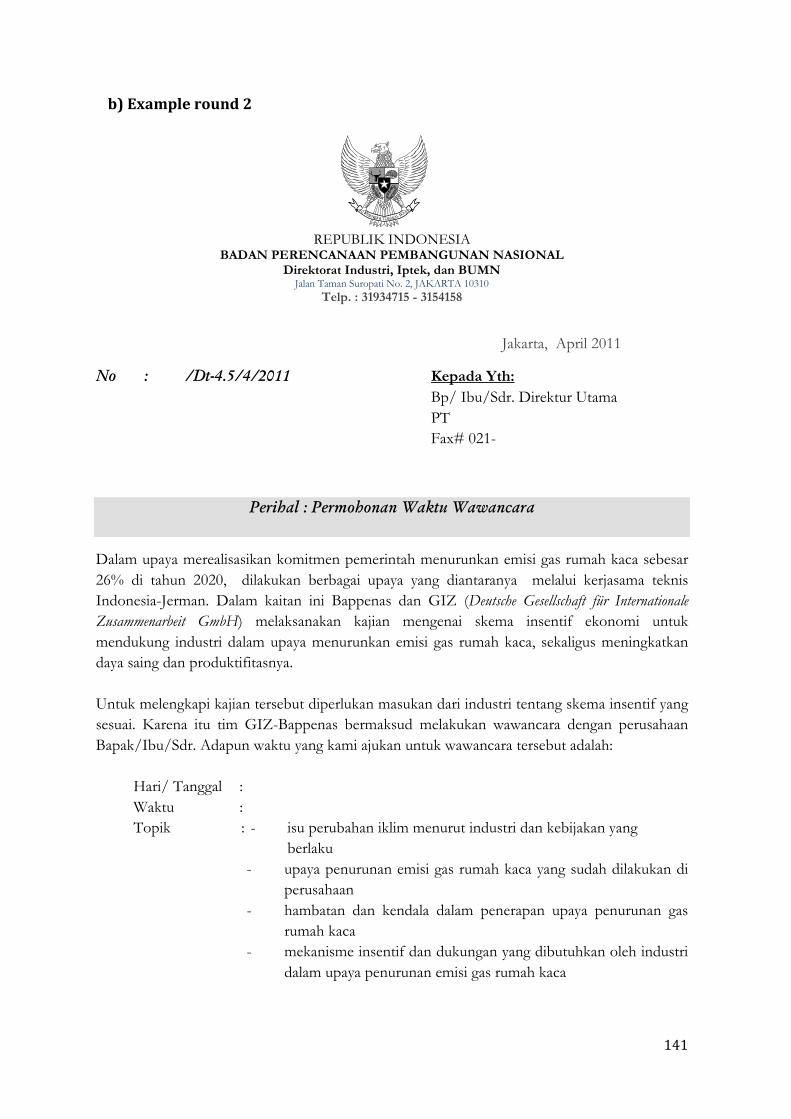
141
b) Example round 2
REPUBLIK INDONESIA BADAN PERENCANAAN PEMBANGUNAN NASIONAL
Direktorat Industri, Iptek, dan BUMN Jalan Taman Suropati No. 2, JAKARTA 10310
Telp. : 31934715 - 3154158
Jakarta, April 2011
No : /Dt-4.5/4/2011 Kepada Yth:
Bp/ Ibu/Sdr. Direktur Utama
PT
Fax# 021-
Perihal : Permohonan Waktu Wawancara
Dalam upaya merealisasikan komitmen pemerintah menurunkan emisi gas rumah kaca sebesar
26% di tahun 2020, dilakukan berbagai upaya yang diantaranya melalui kerjasama teknis
Indonesia-Jerman. Dalam kaitan ini Bappenas dan GIZ (Deutsche Gesellschaft für Internationale
Zusammenarbeit GmbH) melaksanakan kajian mengenai skema insentif ekonomi untuk
mendukung industri dalam upaya menurunkan emisi gas rumah kaca, sekaligus meningkatkan
daya saing dan produktifitasnya.
Untuk melengkapi kajian tersebut diperlukan masukan dari industri tentang skema insentif yang
sesuai. Karena itu tim GIZ-Bappenas bermaksud melakukan wawancara dengan perusahaan
Bapak/Ibu/Sdr. Adapun waktu yang kami ajukan untuk wawancara tersebut adalah:
Hari/ Tanggal :
Waktu :
Topik : - isu perubahan iklim menurut industri dan kebijakan yang
berlaku
- upaya penurunan emisi gas rumah kaca yang sudah dilakukan di
perusahaan
- hambatan dan kendala dalam penerapan upaya penurunan gas
rumah kaca
- mekanisme insentif dan dukungan yang dibutuhkan oleh industri
dalam upaya penurunan emisi gas rumah kaca

142
Kerjasama Bapak/Ibu/Sdr dalam menerima tim GIZ- Bappenas sangat kami harapkan
sehingga hasil kajian dapat memberikan hasil yang optimal. Apabila diperlukan informasi lebih
lanjut, Bapak/Ibu/Sdr dapat menghubungi Sdr. Anandita/Maren Breuer (021-8517186 atau
melalui e-mail: [email protected]/[email protected]) atau Sdr.Suryati (021 –3154158
atau melalui e-mail: [email protected]).
Demikian disampaikan atas perhatian dan kerjasamanya diucapkan terima kasih.
Direktur
Industri, Iptek dan BUMN Bappenas
Dr.Ir. Mesdin Simarmata

143
Annex III: Lessons learnt from the empirical research process
Compared to pure secondary (desk) research, empirical research always poses a particular
challenge since many issues involved are beyond the control of the researcher himself/ herself.
Of particular importance and a large challenge in most cases is the access to the field of
enquiry. Even though compared to other topics (e.g. truly strategic issues for a
company/organization or deeply personal issues for an individual) climate change is in fact
not such a highly sensitive issue, the challenge here is that for conducting interviews from
which statements valid for the whole organization are to be made, real knowledgeable people
from the respective companies are required as it is a highly complex and cross-disciplinary
topic. In light of the fact that these people then are always difficult to get access to, the
response rate of the present endeavor must clearly be seen as a positive outcome. However, a
considerable amount of perseverance was required for this, which at the same time enabled
the team to gain important insights into how (not) to design such a study in the context of the
Indonesian industries. In this regard, one of the crucial ‘success factors’ for finally being
granted an interview was to follow a personalized approach: I.e., first of all in terms of
targeting at least the opening sentences of the request letter to the specific company. And even
more importantly, to direct this letter to a particular person that would either be the ‘right’
interview partner him/ herself (if this is known a priori) or to someone from the department
most likely to be most knowledgeable/ involved in the issues of interest (here: climate
change). In any case, it must not be expected that the company/ person will by his/ her own
initiative respond to the request, but it proved to be imperative for the research team to then
follow-up via telephone and try to arrange the concrete meeting with reference to the written
request. Regarding this letter, in the present study for the first round of interviews, which was
primarily directed at international companies and others that had already proven to be
‘responsible’, the request came from PAKLIM’s head of programme. This proved to be a valid
strategy for approaching this specific target group. Still, rather unexpectedly (and to be noted
critically), despite the careful sampling the responses from a number of companies who
officially claim to be highly engaged socially and environmentally (e.g. as Global Compact
signatories), was rather ‘cold’ and no interviews could finally be scheduled. For the second
round, which focused on national industries, the request then came directly from the
Indonesian government, Bappenas in particular. While having this official letter showed to be
no guarantee for being granted an interview either (rather surprisingly), this approach
nevertheless seems to be more promising vis-à-vis national companies, who generally proved
to be much more difficult to gain access to empirically than the former group.

144
All in all then, thanks to the team’s perseverance, the well-grounded sampling strategy, and the
semi-structured in-depth interviews finally conducted, a diversity of highly valuable insights
regarding the issues of interest were gained, and also valuable contacts with these companies
were established for later follow-up and/ or involvement in related initiatives.

145
Annex IV: Interview summaries
1 Interview Summary: PT. Asia Pulp & Paper (APP)
Date: 25. April 2011, 11.00 – 12.30
Location: APP Marketing Headquarter, bii plaza, Tower II, 15th floor, Jl. M.H. Thamrin No.
51, Jakarta
Attendants: APP: Ibu Dewi P. Bramono (APP Deputy Director Sustainability & Stakeholder
Engagement), Pak Adrianus Tanari (Sinarmas Senior Environmentalist-
Technocenter), Ibu Librian Angraeni (Environmental & Social Footprint,
Sustainability & Stakeholder Engagement)
GIZ/ PAKLIM: Anandita Susanto, Maren Breuer, Kristin Meyer
General
• APP belongs to the Sinarmas group and is one of the world’s largest P&P companies with
pulp, paper, and packaging capacities of 7 million tons in ID; sales outside ID represent
75% of total sales in 65 countries; APP has 8 subsidiaries (mills) in Java, Sumatra and
Borneo
• The sustainability activities for all the mills are driven and managed centrally by APP’s
marketing department � since 2005 they have a sustainability report according to the GRI
• Main drivers for sustainability activities are their stakeholder demands (shareholders,
customer)
• Active actor in the UN Global Compact (they are one of the lead companies), WBCSD, UNDP
Water mandate
• The sustainability activities/ CSR projects are checked against a social assessment and the
UN millennium goals/ focus areas of the GOI (e.g. health)
• In ID they cannot operate without involving the community
• CC is an issue for APP and they are well aware of GOI’s CC policies; they know about the
mitigation target announced by the president and about the roadmap (ICCSR), but they
also emphasized that when demarcating ID as one of the world’s biggest GHG emitters it is
important to note that this is mainly linked to forest burning and not due to ID’s industry
sector
• They have provided carbon data of some of their mills to KLH/MoI in order to support the
government’s effort to design a baseline. However, they question whether this is truly
representative for the whole industry due to the very different operations among different
mills, i.e.:
• There are mills with high emissions because these also produce their own chemicals
and others procure them externally and hence have fewer emissions themselves. MoI
does not include these differences but just takes those data of the few mills and
extends them to the whole P&P industry
• APP invited MoI to discuss on the calculations and to clarify on the boundaries/ scope
to make sure that it is representative for the entire industry � this representativeness
will eventually become a crucial issue later on if the GOI introduces emission caps/
quotas for certain industries, whose extent will be based on such baseline data

146
Information on CSR/CC-activities
• In 2007 first carbon footprint activity – the purpose is to detect potentials for reduction
and/ or for CDM projects; the “low-hanging fruits” come first and are done anyway in
order to increase the efficiency of the production; APP has involved their suppliers into the
carbon calculation
• In 2010 first water footprint activities
• Implemented different EE measures according to the specific characteristics of the
respective mills
• Have 2 CDM projects: PT Pindo has done “hybrid plant” – gas boilers to produce steam –
80-90% better than BAU; PT Indah Kiat has done a substitution of coal through biomass �
their main driver to do CDM is rather to declare it as a “CSR activity/reputation” than the
fact of selling CERs
• Involvement in two governmental projects: 1) baseline development – currently
implemented 2) receiving free energy audit/ implementing energy management program
resulting from the new energy conservation regulation by the MoI (for 3-4 mills they were
obliged to have an energy manager now) � APP is still waiting for the feedback from the
government � they do not know why the government has chosen these mills (probably
because these are the largest ones)
• Other CSR activities: APP supports the community through trainings/ soft loans; want to
truly empower the community and not just give them money
• Have implemented a fiber procurement policy, including sustainable forest management,
human rights issues
Current problems to realize more low-carbon operations:
• Significant tax on (low-carbon) equipment coming from outside of ID (APP is going to have
a stakeholder dialogue on that issue with KLH in June – there is no specific mechanism for
this currently)
• Lack of guidance from the GOI
• Too many uncoordinated demands from different ministries
• Lack of knowledge about appropriate EE-technology; high investment costs
Potential policy improvements (views, suggestions):
• Harmonization of ministerial activities:
o Better coordination between different ministries (e.g. confusing for APP as they
get a lot of invitations and requests from different sides, which, however,
require the same data)
o Even within one ministry (e.g. MoI) there is a lack of coordination
• Reduce energy subsidies
o Then, let people know that there is technology out there which helps to reduce
energy costs (so they could compensate right away a bit, and it also helps CC/
environment)
o However, balanced program of course needed, i.e. support to those groups/
people that could not afford the higher energy prices
• Better involvement of the private sector in order to shape the policy process

147
o Currently the privates are just supposed to deliver data but are not asked to
truly participate. (APP already requested MoI to have a stakeholder dialogue
with the companies)
• Need orientation/ direction from the government
o They want to support the GOI’s mitigation targets, but would like to have a
“grand design”/ guideline of how to reduce emissions and what activities can
actually be counted towards the 26%/41% target (APP did e.g. not know that
reductions from CDM cannot be counted towards ID’s national target)
o Hence, clarity about government goals /CC vision/ framework – and what they
as a company can do (would e.g. do their investments/ activities faster if they
knew for sure that these are in line with the government’s intentions)
• Financial incentives:
o Better knowledge of funding opportunities/ better loan conditions
o Tax subsidies for imported equipment
o Information on methane capture technology
• Recommend to more closely interact with the respective industry associations because
these have an overview on the issues concerning the respective sectors
Cooperation with GIZ, others:
• Generally, APP is highly interested in cooperation with GIZ in terms of voluntary
agreements and/ or DPP and would like to have more information about the ongoing
policy process (e.g. RAN-GRK)
• Are willing to participate in stakeholder dialogues

148
2 Interview Summary: PT. Chandra Asri (CA)
Date: 31 May 2011, 14.00 – 15.30
Location: Jl. Raya Anyer KM 123, Ciwandan, Anyer, Cilegon
Attendants: CA: Bapak Helmilus Moesa (Technology General Manager – responsible for the
internal R&D unit)
GIZ/PAKLIM: Aris Nugrahanto, Maren Breuer, Kristin Meyer
General
• Established in 1989; CA is the first and only OLEFIN complex in ID; have 5 plants currently
• Listed on the Indonesian stock exchange
• Products from CA are: Ethylene, Propylene, Crude C4 and Pyrolysis Gasoline (Py-gas),
Polyethylene and Polypropylene for the Indonesian as well as regional export markets
• Polypropylene resins is widely used in various plastic packaging applications and is
produced from propylene, which is derived by processing naphtha or propane
• CA is the only ethylene producer in Indonesia with a capacity of 600.000 t per year, but
they cannot meet the demand of 1,2 Mio t in the area � ID still needs to import ethylene
• Since 2004 they use natural gas because it is 1/3 cheaper than diesel, before they used
diesel oil
• Production capacity of methane is 100.000 t per year
• CA delivers most of the propylene to its sister company TRI POLYTA’s (transport via a 35
km pipeline)
• Strategic decision to build a new plant as their future project (increase capacity), i.e.
strategic downstream integration. Mission: be a world-class petrochemical company in
Indonesia
Information on CSR/CC-activities
• Pak Moesa is aware of CC from TV (personal and not corporate statement explicitly)
• Raw material are the highest costs in their production, the second largest are the energy
costs (i.e. heating up the raw materials consumes a lot of fuel) � Hence, the question is
always how to optimize energy usage
• Any energy saved is a plus for the company. This is a very common practice for the entire
industry and not due to climate change or the like: “Energy is money”
• Brief description of the production process:
• The Naphtha (raw material from crude oil) is cracked into C1 (Hydrogen), C2
(Methane), C3 (Ethylene), C4 Propylene and other commodity products
• Then the material/resins are heated up in one of the 8 furnaces at 850 degree Celsius
• Cold section (with cold box compressor) and recycling area
• The combustion step 2 consumes most of the fuel/ emits the most CO2 emissions � not
the process itself = 5 tons/h of natural gas needed
• Costs are is the main driver for CA’s energy optimization activities
• The technology department, headed by the interviewee, takes care of how to maximize
products/ how to improve energy efficiency (they have an internal benchmark that is
leaned on benchmarks resulting from annual regional meetings with companies from
other SEA countries (the benchmarks have no direct impact but they give CA an idea
where they stand)

149
• The equipment and technologies CA uses are very common equipment used throughout
the entire industry (use e.g. ABB technology from the US)
• Since 2005 CA has a “Community Development Department”, which is responsible for CSR
activities (divided in 3 zones around the factories with the first zone being the community
closest to the factory)
• Examples: local plantation, scholarship programs for orphans, ‘pesantren’ (Islamic
boarding school), internship programs for high school and university students,
providing training and fishing equipments for local fishermen, etc. (spend
approximately Rp 1.9 billion on CSR programs)
• CA also has a department for the environment
• Are certified ISO 9001 since 1998 and ISO 14001 since 2002 (have e.g. waste water
treatment facility, desalination unit, cooling water; waste is not really an issue)
• Want to achieve PROPER “Gold” – that’s one reason for their increasing engagement in CSR
activities (CA even has a film about their CSR activities, which the interviewee showed
after the interview); from 1996-2003 CA received “Blue”, since 2004 “Green”
• Moreover, CSR attracts investors and improves the company’s reputation (they do
feasibility studies to give information to potential investors – investors ask about ISO, CSR,
etc.) � hence, besides being cost driven, as a listed company CA is also investor driven in
its “green” and “responsible” activities
• Since the very beginning CA has its own power generation utilities and is thus completely
independent in its production from PLN due to the high risk of “blackouts” (would cost
them 4 Mio US$ and would take three days to start the production again)
• Use methane as fuel in other steps of the process � gas turbine generator � use CHP for
electricity
• Even though CA’s boilers are still the ones originally installed in 1990 they still have an
efficiency of around 93%, which is almost like brand new
• Since 2010 CA also produces degradable plastic because companies all over the world do
that
Current problems to realize more low-carbon operations:
• CA itself doesn’t need any incentives because they do EE measures anyway due to cost
reasons; if they received incentives it would be a “double win”
Potential policy improvements (views, suggestions):
• Would suggest to only focus on one “Green Award”: either PROPER or the Green Industry
Award in order to prevent confusion among the industries
• Government activities “have to be more down to earth”; most of the industries do not know
and do not care
Cooperation with GIZ, others:
• Are part of “Responsible Care” and of the Chemical Care Association in the region
• Conclusion: The petrochemical industry is highly energy-intensive primarily because of its
furnaces; since “energy is money” there is hence no high need for actual capacity building
or awareness-raising on these issues within the companies – it is common practice to
constantly try to optimize energy usage. Setting a cap thus seems to be the best/ most
appropriate means here. Besides, as the company already has a good data documentation

150
of its own energy consumption, the GoI “just” needs to collect the respective data, and one
of the main potential interventions might be to enquire on the company’s reporting
scheme and utilize it as a model for MRV.
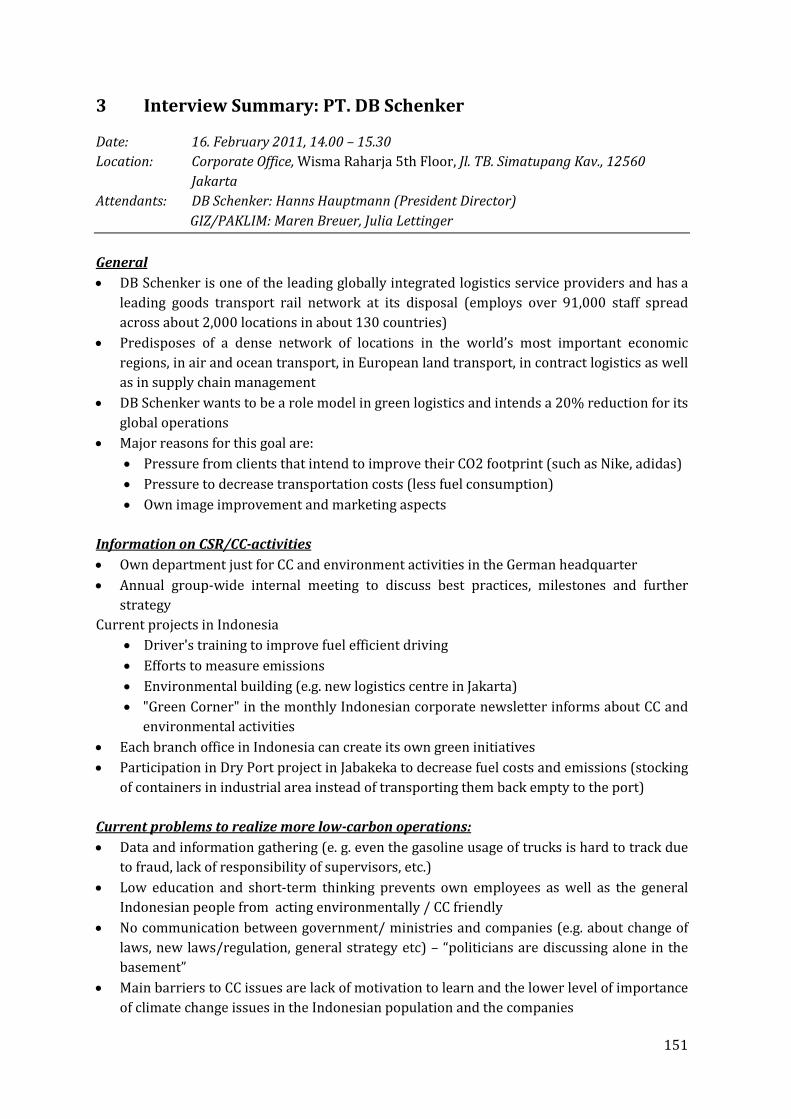
151
3 Interview Summary: PT. DB Schenker
Date: 16. February 2011, 14.00 – 15.30
Location: Corporate Office, Wisma Raharja 5th Floor, Jl. TB. Simatupang Kav., 12560
Jakarta
Attendants: DB Schenker: Hanns Hauptmann (President Director)
GIZ/PAKLIM: Maren Breuer, Julia Lettinger
General
• DB Schenker is one of the leading globally integrated logistics service providers and has a
leading goods transport rail network at its disposal (employs over 91,000 staff spread
across about 2,000 locations in about 130 countries)
• Predisposes of a dense network of locations in the world’s most important economic
regions, in air and ocean transport, in European land transport, in contract logistics as well
as in supply chain management
• DB Schenker wants to be a role model in green logistics and intends a 20% reduction for its
global operations
• Major reasons for this goal are:
• Pressure from clients that intend to improve their CO2 footprint (such as Nike, adidas)
• Pressure to decrease transportation costs (less fuel consumption)
• Own image improvement and marketing aspects
Information on CSR/CC-activities
• Own department just for CC and environment activities in the German headquarter
• Annual group-wide internal meeting to discuss best practices, milestones and further
strategy
Current projects in Indonesia
• Driver's training to improve fuel efficient driving
• Efforts to measure emissions
• Environmental building (e.g. new logistics centre in Jakarta)
• "Green Corner" in the monthly Indonesian corporate newsletter informs about CC and
environmental activities
• Each branch office in Indonesia can create its own green initiatives
• Participation in Dry Port project in Jabakeka to decrease fuel costs and emissions (stocking
of containers in industrial area instead of transporting them back empty to the port)
Current problems to realize more low-carbon operations:
• Data and information gathering (e. g. even the gasoline usage of trucks is hard to track due
to fraud, lack of responsibility of supervisors, etc.)
• Low education and short-term thinking prevents own employees as well as the general
Indonesian people from acting environmentally / CC friendly
• No communication between government/ ministries and companies (e.g. about change of
laws, new laws/regulation, general strategy etc) – “politicians are discussing alone in the
basement”
• Main barriers to CC issues are lack of motivation to learn and the lower level of importance
of climate change issues in the Indonesian population and the companies

152
• Due to bad transportation infrastructure in Indonesia, reduction of fuel and CO2 is difficult.
Highest transportation costs in Asia
Potential policy improvements (views/suggestions):
• Tax breaks and improvements of the tax system
• CSR policy as already in place for state companies could be extended to the private sector
Cooperation with GIZ:
Strong interest in cooperation with GIZ

153
4 Interview summary: PT. Entec
Date: 28. February 2011, 14.00 – 15.30
Location: Entec office in Jakarta, Tebet Barat 8, Nr. 52, Jakarta Attendants: Entec:Marc Hayton
GIZ/PAKLIM: Maren Breuer
General
• Founded in St. Gallen, Switzerland in 1993; since then grown into a larger global multi-
disciplinary consulting engineering organization
• Mission: provide clients with long-term sustainable solutions in the field of hydro power,
other sources of renewable energy, water and environmental sector projects. Quality,
environmental compatibility, social responsibility and cost effectiveness are the principal
criteria that guide Entec’s problem solving strategies in close relationship with their
clients.
Information on CSR/CC-activities
• Entec is not aware of current Indonesian climate change policy processes such as NAMA
Entec is not directly involved in any climate change activities but renewable energies is
their core business anyways �Position from the renewables perspective
• Climate change is clearly an opportunity - not only for Entec specifically but for the
entire RE sector
• There are in fact many low hanging fruits for improvements in the use of RE, e.g.
o Tax incentives for technologies: the Indonesian government has actually
already talked lots about this but it just doesn’t come true; it needs the minister
to decide finally � too much bureaucracy
o Import duty exemption, e.g. make very clear that for the import of xyz
technology there is a tax exemption
o Feed in tariffs: there are actually regulations in place and these also work
somehow; nevertheless, it is somehow a kind of ping pong between the
Provinces and Jakarta currently – e.g. the required revisions to improve the
existing FIT would be possible but the “ok” needs to come from the central
government
Good example: PLN pays for energy fed into the company’s grid
METTI – Renewable Energy Association (private sector people): quite active in
lobbying for a better RE framework; many ex PLN people and other influential
actors in there
Current problems to realize more low-carbon operations:
• Unclear legislation
• Lack of streamlining
• Too much bureaucracy
o E.g. very difficult procedures for project applications; in the EU it is all easier for RE
projects as the procedures and requirements are put up in a quite transparent way;
in ID against that there are many grey areas

154
• Politicians are talking ‘up in the air’, nothing gets finally really done � the government
should not talk alone all the time entirely remote from the private sector
Potential policy improvements (views, suggestions):
• To get the private sector on board it is not only the financial attractiveness but also
convenience (even if a project would be lucrative, as long as the upfront costs in terms of
too much bureaucracy are too high, the private sector will not do it)
• Get the big and real projects to ID – i.e. grid connected projects
o All the small and stand-alone projects will not have a real impact on the reduction
of emissions. Only a bit at least once it is all is connected to the grid (even though
overall then compared to the continuously new launching of power plants it will
still be neglectable) � Entec’s mini hydro projects are also examples for these
projects
o It can be produced almost everything in ID – there are no actual technical
limitations – the government should encourage such large projects. Also here the
private sector will then in the end take care of the things but it needs the start-up
stimulation/ allowance
• Make forms/ project applications easy
o However, an innovative approach to technical assistance is needed in terms of
establishing easy procedures – the private sector/ the market will actually do it
and make it move finally but they just need to have easy procedures for doing so
o E.g. work with METTI thus; the private sector needs to be supported by the right
people
Cooperation with GIZ, others:
Follow up with the contact provider to METTI

155
5 Interview Summary: PT. Festo Didactics
Date: 16. February 2011, 10.00 – 12.00
Location: Corporate Office: Jl. Sultan Iskandar Muda No.68, Arteri Pondok Indah,
Jakarta 12240 Attendants: Festo: Hartono Indra (Managing Director), Safri Susanto (Didactic Manager),
Aries Teguh Aprilianto (Marketing Manager)
GIZ/PAKLIM: Maren Breuer, Julia Lettinger
General
• Festo is a leading world-wide supplier of automation technology and the performance
leader in industrial training and education programs
• Founded in 1925; around 13,500 employees globally; 58 independent national companies,
authorized agencies in a further 39 countries, worldwide after sales service in 176
countries; turnover (group) 1.3 billion euros
• Festo is not directly impacted by climate change but has a new product focusing on energy
efficiency and also has environmental / energy saving activities
• The CC topic is located in the company's headquarter in Germany. Design of green
buildings, technology and green products is conducted there
• For Festo CC is an opportunity to create new innovative products
• Festo also has a new CC friendly and green philosophy for the company's own
development
Information on CSR/CC-activities
Product-related
• Festo introduced its new product "Energy Saving" in Indonesia. The product measures and
tries to minimize air leakages of pneumatic automation systems. Minimizing leakage
decreases the use of energy and thus the costs per liter of air. The product is not that
successful in Indonesia yet, only multinationals or big Indonesian groups are interested in
the product. First customers are: Indofood, Martel, Johnson & Johnson. Product
implementation is usually decided top down by Festo’s HQ.
• Reason for limited success of Festo’s energy saving product in ID so far is that CC problems
are not the first interest of companies in Indonesia. The only motivation in the area of
climate change or energy efficiency comes from cost saving aspects. Marketing or image
improvements only play a role for big or multinational companies as the Indonesian
customer is not that sensitive towards environmental /CC issues yet
General activities
• Indonesia: A new environmentally friendly corporate office in Jakarta (Taman Techno) is
planned and will be finished 2012.
• German headquarter: Offices and plants are all built and equipped with environmental
technology (e.g. heating/AC with cogeneration, lightening with balloons on the roof,
sunshades at glass fronts)
• Learning impact: Festo believes that the new environmental building will impress
Indonesian clients

156
Current problems to realize more low-carbon operations:
• The Indonesian government already conducts CC consultations and workshops but it does
not follow up on the activities. The problem is implementation and continuation of actions
– when the staff in the ministries changes also the policies change
Cooperation with GIZ, others:
• Festo is strongly interested in a cooperation with GIZ
• They would prefer to work on projects where GIZ takes the leadership and suggest to
conduct climate change projects in the following manner:
• Initial project implementation with GIZ
• Those projects could spill over to the private sector and attract other
companies

157
6 Interview Summary: PT. Holcim
Date: 22. February 2011, 14.00 – 15.30
Location: PAKLIM office, KLH
Attendants: Holcim: Vincent Aloysius (Country Manager)
GIZ/PAKLIM: Maren Breuer, Julia Lettinger
General
• Holcim is aware of the ICCSR Roadmap but has never heard of RANGRK or NAMAs before
• Holcim's philosophy, which drives its global green strategy, is based on the triple bottom
line, i.e. Planet: Care about CO2 and environment; Profit: Find new business areas, People:
Improve people's living conditions
• An important driver for Holcim's green behavior and strategy is its image in Europe
• The players in the cement industry are in fact generally well aware of the contributions
they make to climate change
• Holcim’s global guidelines for a green strategy are laid out by the corporate headquarter;
however, local activities are always possible and even explicitly aimed at (Holcim in
Indonesia is e.g. the first subsidiary to have established a CFC gas destruction facility; and
also their engagement in the Sustainable Jakarta Convention in the context of their project
on “Healthy living conditions” is unique)
• Those guidelines from the corporate headquarter are already stricter than the
requirements of the Indonesian regulation – so if the latter change/ improve in terms of
CC, this will not have much impact on Holcim’s operations here in Indonesia
• Holcim views CC as an opportunity for business, not as a threat – they are starting their
own “green business” now and position themselves e.g. in the waste sector (see below)
Information on CSR/CC-activities
• Participant in PROPER (awarded “green”), a yearly environmental rating and ranking for
big companies being active in Indonesia. The program is administered by KLH, already
established for many years and receives a lot of attention. Holcim is always performing
very well in the ranking but also criticizes the in-transparent rating criteria.
• Participant also in the newly established Green Industry Award, administered by the
Ministry of Industry. Critical is now only that the presence of these two systems
potentially confuses the industries. Duplications should be avoided and alignments aimed
at; e.g. the MoI might focus on only a specific aspect/ area (energy efficiency) whereas
KLH’s established PROPER covers a whole range of issues on which the companies are
being assessed
• Holcim organizes the yearly event "Sustainable Jakarta Convention"
(http://www.sjconvention.com/)
• Holcim also has to use 5% of its profit for CSR activities. So far the money is used mainly
for community development around Holcim's plants. Holcim chooses the project itself.
Product-related
• Green products are mainly offered in the Geocycle business unit. The unit builds waste-to-
energy power generation units for the usage in cement plants. Heating through waste of
energy can result in nearly carbon-neutral cement product. Holcim is a pioneer in this

158
area. The waste-to-energy process avoids landfills and saves CO2 at the same time while
also avoiding the usage of natural resources. Currently agricultural waste is used but
Holcim is interested to expand its business into municipal waste. However, this requires
partners who take over the part of waste collection and sorting. I.e. because the company
recognizes that they themselves are only good at receiving, processing and burning waste
– so they need to have a partner who takes care of the entire upfront process
• The process of cement production is more CO2 friendly through the substitution of a
certain percentage of klinker through fly ash. Thus, less energy is used in the cement
production process. The process is nowadays already standard in the industry and is also
used by Indonesian companies.
• The product segment "Solusi Rumah" has its first "Eco home project" in Solo. The house
demonstrates opportunities for the design of energy efficient building, which is a core
competence of the "Solusi Rumah" segment.
Current problems to realize more low-carbon operations:
• Holcim criticizes the overload and un-practicability of regulation by the Indonesian
government.
• Problem in Indonesia is not a lack of regulation, but a lack of enforcement. In the case of
environment and climate change, especially the enforcement of implementation in SMEs is
very bad (all those program’s like PROPER et al. take only care and focus on the ‘big’ ones
– these are actually already doing quite well).
• If regulation is not enforced, Indonesian SMEs in general do not care about environmental
/ CC issues because
1. they do not see it as an important issue,
2. they see CC as a cost factor, not as a potential opportunity. For them acting
environmentally friendly may also be more costly as global expertise / knowledge
is missing.
3. So the technologies are in principle available but especially among those industry
players that are not global actors both the awareness and the willingness to change
are missing – the local cement companies are not yet ready, which makes it difficult
for the industry in Indonesia to act in a consolidated way
Potential policy improvements (views, suggestions):
• As Indonesian companies mainly consider the costs of an environmental / CC-friendly
production process, their motivation to undertake investments has to be increased.
• In general, the focus should be on better implementation of regulation and not on the
creation of more regulation.
• Simply putting some more regulation in place will not do it since what is essentially
required then is to also have the people and the resources for implementing the measures
on site within the respective companies
Cooperation with GIZ, others:
• Strong interest in cooperation with GIZ in the area of waste-to-energy through usage of
municipal solid waste. A potential project could be the usage of municipal waste from Solo
in Holcim's plant in Cilacap.

159
• In addition, Holcim currently cooperates with AFD (cement sector study) and Responsible
Care (group of mainly chemical companies in Indonesia that conduct trainings and
exchanges on best practices). AFD has actually only gathered data in the cement industry
so far and has not ‘taken’ the sector entirely in terms of mitigation interventions.

160
7 Interview Summary: PT. Indocement
Date: 26. April 2011, 15:00 – 16:00 Location: Citeureup Factory, Jl. Mayor Oking Jayaatmadja, Citeureup, Bogor, Attendants: Indocement: Pak Gunawan Purwadi (AFR General Manager) GIZ/ PAKLIM: Maren Breuer, Anandita Susanto, Kristin Meyer
Note: Indocement provided written answers to the interview guideline shared with them prior to the meeting. These are outlined below plus additional notes from the interview team (in blue letters)
General
Company name : PT INDOCEMENT TUNGGAL PRAKARSA Tbk Address : Wisma Indocement Level 13, Jl Jend. Sudirman Kav 70-71, Jakarta Industry Type : Cement Manufacturing Plantsite Location :
- Citeureup – Bogor – West Java - Palimanan – Cirebon – West Java - Tarjun – South Kalimantan
- Indocement has 12 cement plants (9 in Citeureup, 2 in Palimanan-Cirebon, 1 in Tarjun) with an
annual production capacity of 18.6 million tons of cement - Part of the Heidelberger Cement Group, Germany (became the biggest shareholder in 2001) - Heidelberg Cement has 17 cement companies all over the world - Heidelberg Cement determines the sustainability policy of all group members - Member of WBCSD (17 companies worldwide participate in this Council) CC activities
CDM Project Registered First CER
Indocement Alternative Fuels Project
29 Sept 2006 14 March 2008
Indocement Blended Cement Project 27 Oct 2006 Not Yet
2. What does your company know about climate change/ GHG emissions?
Yes, we know that Cement industry worldwide contributes about 3 – 5% of global anthropogenic CO2 emissions (International Energy Agency Greenhouse R&D Programme, UK). Cement manufacturing produce around 0,869 tons CO2 per ton of Clinker
19. What is the focus area of your company’s climate change activities?
- CDM project: Indocement’s Blended Cement Project
To reduce CO2 emissions by reducing the clinker content in the produced cement. The total CO2 emissions will be reduced proportionally with the amount of alternative materials use such as Limestone, Fly-Ash, Natural Pozzolana (Trass), Slag, etc
(Blended cement is the common cement practice in Europe; Indocement is the only company that can claim “Blended Cement” as CDM in Indonesia
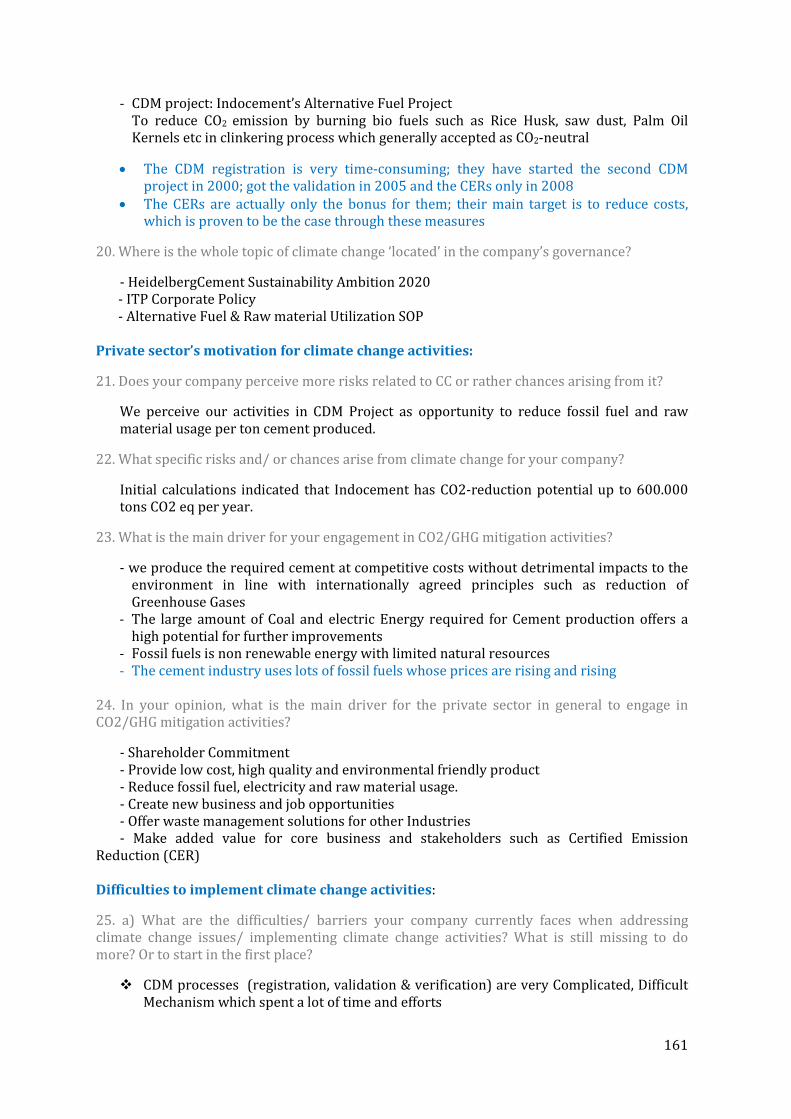
161
- CDM project: Indocement’s Alternative Fuel Project To reduce CO2 emission by burning bio fuels such as Rice Husk, saw dust, Palm Oil Kernels etc in clinkering process which generally accepted as CO2-neutral
• The CDM registration is very time-consuming; they have started the second CDM project in 2000; got the validation in 2005 and the CERs only in 2008
• The CERs are actually only the bonus for them; their main target is to reduce costs, which is proven to be the case through these measures
20. Where is the whole topic of climate change ‘located’ in the company’s governance?
- HeidelbergCement Sustainability Ambition 2020 - ITP Corporate Policy - Alternative Fuel & Raw material Utilization SOP Private sector’s motivation for climate change activities:
21. Does your company perceive more risks related to CC or rather chances arising from it?
We perceive our activities in CDM Project as opportunity to reduce fossil fuel and raw material usage per ton cement produced.
22. What specific risks and/ or chances arise from climate change for your company?
Initial calculations indicated that Indocement has CO2-reduction potential up to 600.000 tons CO2 eq per year.
23. What is the main driver for your engagement in CO2/GHG mitigation activities?
- we produce the required cement at competitive costs without detrimental impacts to the environment in line with internationally agreed principles such as reduction of Greenhouse Gases
- The large amount of Coal and electric Energy required for Cement production offers a high potential for further improvements
- Fossil fuels is non renewable energy with limited natural resources - The cement industry uses lots of fossil fuels whose prices are rising and rising
24. In your opinion, what is the main driver for the private sector in general to engage in CO2/GHG mitigation activities?
- Shareholder Commitment - Provide low cost, high quality and environmental friendly product - Reduce fossil fuel, electricity and raw material usage. - Create new business and job opportunities - Offer waste management solutions for other Industries - Make added value for core business and stakeholders such as Certified Emission Reduction (CER) Difficulties to implement climate change activities:
25. a) What are the difficulties/ barriers your company currently faces when addressing climate change issues/ implementing climate change activities? What is still missing to do more? Or to start in the first place?
� CDM processes (registration, validation & verification) are very Complicated, Difficult Mechanism which spent a lot of time and efforts

162
� CDM Project also need national data to determine project baseline (PLN the bottleneck as it doesn’t issue the needed baseline data)
� Limited local consultant who can assist project developer � Limited accredited DoE who can validate and verify CDM Project
26. a) OPTIONAL: What does your company do to overcome difficulties in realizing climate change activities? Close contact and coordination with Government, Worldbank and DoE
Indonesia specific situation – Differences to other countries:
27. What is your company’s priority for climate change/CSR activities in Indonesia? Do those priorities differ from your company’s climate change activities in developed countries or do they differ from those implemented in other emerging markets? If so, please state why.
Priority for Climate Change: - To reduce CO2 Emission through CDM Project - Offer waste management solutions to other Industries - Assist our local government to treat their municipal waste. Priority for CSR: - Charity Program => 5 pillars : Education, Economic, Health, Social culture & sport, Security - Sustainable Development Project such as Jatropha Plantation, Waste To Energy, Biogas,
Motorcycle service station, Small scale industry, farming, Local Purchase, Local Employee
Policy Frameworks:
28. a) Are you aware of any current Indonesian national (local) policy related to climate change? Yes we know and we involved in Establishment of A Greenhouse Gas Emission Reduction Scheme in The Cement Industry in Indonesia with Indonesia Ministry of Industry • PLN has no data available for constructing the baseline scenario; thus, Indocement
provided their help to create a baseline/emission factor • Pak Gunawan stated that he cannot see the real policy implementation at the operational
level � the GOI just sets the target but they don’t know how to achieve it � guidelines specific for the industry sector are needed (because one cannot compare it to the forest sector)
29. What do you think about the current status of private sector involvement in CO2/ GHG mitigation in Indonesia?
Very low involvement.
30. How could national climate change policies be improved to ensure a higher rate of participation/ investment of the private sector in CO2/GHG mitigation in Indonesia?
A. Rewards and Penalties System
- Development of rewards and penalties and provisions for application (e.g. which reduction leads to which reward)
- Setting legal basis for rewards and penalties (connection to PROPER?) - Development of clear guidance on rewards and penalties for the operators - Annual evaluation with regards to rewards and penalties and potential revision of the system
B. Incentive System

163
1. Ministry of Finance
- Provide fiscal incentives for clean energy technology investments - Support by special subsidy of biomass alternative fuel. - Remove subsidies which maybe barrier for using more energy efficient technologies. - Consider a scheme to put a price on carbon
2. Ministry of Industry, Energy & Environment
- Revise or develop new cement standards, or codes for more utilization of the blended cement.
- Review and update legislations to ensure alternative fuel and biomass are provided adequate incentives for their use and not restricted.
- Encourage technology – transfer process and technology development by demonstration projects and by study-tours
- Develop energy-efficiency codes and standards for the key components in the cement production
• Pak Gunawan also added that the GOI should remove coal subsidies and should make geothermal energy and hydropower more attractive
• In terms of clean energy, he thinks that waste heat recovery is one of the most important issues the GOI should focus on
• Import taxes for equipment should be reduced
Further cooperation and engagement in Indonesia:
31. What kind of climate change initiatives/ activities would your company like to and/ or could image to undertake if the conditions were different/ the ‘right’ incentives in place?
Municipal Waste and Industrial Waste Utilization in cement industry with “Polluter Pay principles”
• Indocement has signed a MoU with the West Java Province with the intention to take the waste coming from the Bogor regent and to burn it in their kilns; the actual project, however, has not yet started (possibly in 2012); they see a lot of potential in municipal waste management since ID produces 7 Mio t of waste per year – aim to assist other industries in the disposal of their waste
32. Do you already interact with other organizations/ initiatives/ associations/ companies in the area of climate change?
Yes, we have signed MoU with: - West Java Province to utilize municipal waste from Bogor City, Bogor Regency and Depok Regency. - Waste Generators, Waste Transporters, Waste Collectors and Waste Platforms. Cooperation with GIZ, others: Have previous experience with GIZ (iPPP on co-processing)

164
8 Interview Summary: PT. Krakatau Steel
Date: 23. June 2011, 14.00 – 15.00
Location: Jl. Gatot Subroto Kav. 54, Jakarta Selatan 12950
Attendants: KS: M.Yusuf Marhaban (Energy and Resources Management Manager), Zulham
Lubis (Sr. Engineer of Energy and Resources Management)
GIZ/PAKLIM: Anandita Susanto, Maren Breuer, Kristin Meyer
General
• PT. Krakatau Steel is the only integrated large government-owned steel plant located in the
Krakatau Industrial Estate in Cilegon, Indonesia, was established on August 31, 1970 and
has
more than 6,000 employees. The company consists of 6 production plants that produce hot
rolled coils, plates and sheets; cold rolled coils and sheets and wire rods. The company is a
producer of sheet steel hot (HRC) and cold steel sheet (CRC), the largest in Indonesia, each
with a domestic market share of 47% and 33%, and manufacturer of steel wire rods, the
second largest in Indonesia, with 32% domestic market share. In terms of product
specifications, Krakatau Steel controlled about 85% of the total product absorbed by the
domestic market. Krakatau Steel sells most of its products in Indonesia especially in
Jakarta and Surabaya. Meanwhile, a fraction of its product has been consumed, among
others, by Australia, Japan, Malaysia, Singapore, England and Vietnam.
Information on CSR/CC-activities
• Energy accounts to be the second largest costs (after the costs for raw material)
• The energy division is a “powerful” department and was established in 1995; now they
have 28 engineers/chemical engineers and electricians; also have 3 patents in energy � its
main task is to detect energy saving potentials in order to save costs
• Even though the energy price is now 4times higher than it was in 1997, the steel price is
still constant due to such energy conservation activities
• Beside the energy division, KS also has an environmental department in charge of ISO
14001 and a CSR department only dealing with community development
• The motivation behind energy conservation are cost considerations/economical reasons,
not necessarily regulation and also CC
• They have changed from fuel oil to natural gas, but the gas supply is not stable (also due to
the fact that ID belongs to the 5 biggest gas exporters in the world, for instance especially
to South Korea); if there were no exports the available amount of gas would be enough for
ID but the contracts are already set up for 15-20 years
• KS has an own pipe from Cirebon to Cilegon to supply gas which now is also used by others
• KS has contract up to 140 mmscfd but uses in total 126,600 NCMH of natural gas from
which nearly half of it is used as material input for the reforming process (process energy),
respectively for the Direct Reduction Plant and the other half is consumed as fuel
• they need electricity for the Steel Making Plant in order to produce slabs and billets; PLN
delivers 280 MW of electricity, whereas 400 MW is delivered by Krakatau Daja Listrik
(energy subsidiary)
• Energy conservation activities by KS:
• Fuel oil substitution - switch to gas in 2010 � replaced all burner (they
switched because after Suharto era the prices for heavy fuel oil steadily

165
increased, e.g. 1998 – 1800 Rp. per liter; now – 7000 Rp.) � savings account
28.150 t CO2
• Energy Control Center controls energy conservation � savings account for
100.000 t CO2 per year � each plant has an production manager and a
maintenance manager who are in charge of delivering data and responsible for
energy conservation
• Coal gasification at calcinations plant � before they used solely oil, now coal
for gasification; the plan is to use coal gasification for 200 MW (the amount of
400 MW oil is still needed)
• Oxygen lancing at Electric Arc Furnace
• Scrap Preheater
• Slabs/Billets hot charging
• Tin slab mill technology
• In general, saving energy is rather linked to “good housekeeping” which require small
investments than to big technology investments (e.g. overall they shut down their plants 1
month a year for maintenance)
• During Suharto Era, KS and others mainly used old technology because it was so cheap
hence there were no reasons to save costs
• The industry still has no awareness of energy conservation but due to increasing prices it
gradually changes
• KS invest mainly in new facilities/equipment but basically they do not need loans because
they have enough equity capital (e.g. one huge investment would be to replace 6000
motors which only have 82% of efficiency � if the government would ban those old
motors every company is forced to replace them but unless the government does not do it
the industries are not aware of it even though the pay-back period would be only 2 years) –
> Fazit: there are many energy conservation opportunities which require high upfront cost
but also have a short amortization period “but the people do not know about it”
• KS staffs are usually asked to be trainer in trainings for other industries in regard to
Energy Conservation. The trainings are usually provided by MEMR or MoI. The interviewee
thinks that usually training participants will go back to their routine activity after the
training, thus the knowledge from training is not applied directly. Thus, they also think it is
necessary to have technical assistance to apply energy management in the industries.
• They received green for PROPER
• The company has an ISO14001 Environmental Management System and an ISO9001
Quality Management System in place as well as an Occupational Safety and Health
Management System (OSH), and Laboratory Management System ISO 17025
• Its biggest environmental problem is dust and steel slag because latter is considered to be
hazardous waste (besides ID only Finland considers slag as hazardous; all the other
countries do not) � is perceived as an competitive disadvantage since it is much an effort
and expensive to appropriately dispose the slag
• Biggest competitor is China
• Have a CSR program mainly in regard to their location in Cilegon Banten: scholarships,
education, union labor, sports and arts committee � its divided into several business
units, especially also PKBL Division working on partnerships regarding small
entrepreneurs

166
• They have a welfare program for their employees including job security insurance,
accident insurance, and pension fund. Employees are also provided with housing facilities,
recreation center, a hospital, a place for worship and school facility.
• Received many awards: Green industry, PKBL award, etc.
Current problems to realize more low-carbon operations:
• Energy subsidies lead to wasteful use of resources (this does not apply to KS)
Potential policy improvements (views, suggestions):
• KS would like to have assistance in the topic of “hot charging”, i.e. they seek to have
technology that avoids the “cooling down” process that is required for the slab steel
transport (from 800 degree down to 30 degree) � because then they have to re-heat it
again for the rolling mill � to minimize heat loss they would like to have kind of “hot
boxes” that already exist in Europe but which within KS currently are not considered as
“investment priority”
• They think incentives in terms of subsidies are not the right way to engage the private
sector, it is rather about training/educating the companies in terms of available EC options
that are likely to save costs
• They think that it is better to provide capacity building and technical assistance, rather
than to place another subsidy, especially in the field of coal gasification since this is a new
technology in ID
Cooperation with GIZ, others:
KS could be considered as GIZ partners in the field of energy related trainings modules

167
9 Interview Summary: PT. Martha Tilaar
Date: 25. February 2011, 12:45 – 15.45
Location: Martha Tilaar Center Graha Irama Building, Mezzanine Fl., Jl. Rasuna Said Blok XI
–Kuningan, Jakarta Selatan
Attendants: Marthar Tilaar: Ibu Nuning
GIZ/PAKLIM: Maren Breuer
General
• Martha Tilaar Group is one of Indonesia’s foremost purveyors of innovative, high-quality beauty products and services. From its humble beginnings as a beauty salon in the early 1970s, the company has grown into an integrated, world-class, total beauty provider with an annual turnover of around Rp600 billion (US$75 million), which exports its products all over the world. The company’s key brands have won numerous prizes and consistently achieved the country’s highest ratings for brand awareness, reflecting Martha Tilaar’s strong focus on beauty products specifically designed for the Eastern woman.
• Eastern Garden Spa, Martha Tilaar Salon & Day Spa and Dewi Sri Spa are internationally franchised chains of spa and beauty treatments based on the traditional Indonesian concept of Rupasampat Wahyabiantara, influenced by Chinese and Indian age-old health and beauty rituals.
• The group also owns and operates Puspita Martha beauty schools, Bali Sari spa training center and Cipta Busana Martha, which markets traditional Indonesian garments.
• Motto: “Local wisdom – go global” • Martha Tilaar was chosen for the study’s first interview round because of its membership
in the UN Global Compact, specifically for being a Caring for Climate signatory. In line with
this, the company is engaged in a variety of environment and climate change related
activities (even though the CSR department comprises of only three employees), of which
an expert is documented below
Information on CSR/CC-activities
• 3 hectares organic village in Cikarang
o Cultivation of aromatic and cosmetic plants, education for all ages, slow food resto,
solar panel, wind panel (which does not yet work though)
• Kalimantan Initiative – forest preservation and restoring
• Biotrading initiative together with UNCTAC (2011-2012)
o Pilot project within the Global Compact’s new LEAD initiative (see below)
o Assessment of biotrade products from Indonesia: evaluation of species according
to diverse criteria, stakeholder meetings to deduce the weighting of the criteria,
two subsectors to be selected and then send as proposal to the UN
• Climate change education and awareness raising in local communities (also work with
national and international universities, e.g. Leiden, Bandung)
Engagement in the UN Global Compact
• Marthar Tilaar is one of the founding members of the UN Global Compact. In 2000 the
company was personally approached and invited by Kofi Anan to join the newly starting
UN initiative
• Despite various efforts to get other Indonesian companies on boards, until 2004 MT
remained the only Indonesian GC company. In response to this poor result, MT then

168
changed its strategy and no longer approached the CEO of potential GC members but
instead started to go via the marketing departments and especially the Indonesian
marketing association. The approach proved to be successful with there being 24
companies by 2006. Today, the Indonesian local Global Compact network counts 155
active members.
• Besides chairing the local network, at the GC’s 10th anniversary in 2010 MT was also
chosen as one of only 55 LEAD companies worldwide
o The participants in LEAD have been invited because they have a history of
engagement with the UN GC – locally and/or globally. They have committed to
work towards implementing the Blueprint and share related outcomes and
learnings with the broader universe of companies in the Global Compact by
participating in global initiatives as well as in GC Local Networks
o The aim is to really merge the activities in the GC areas with the core business
of the company
• Activities of the local GC network comprise among others the coaching for member
companies on how to do the communication on progress (COP), monthly meetings with the
network members; Bali meeting – 17 countries – discussion of the network’s next goals
Current problems to realize more low-carbon operations:
• none mentioned really
Potential policy improvements (views, suggestions):
• no real suggestions as MT pursues its CC activities in any case
Cooperation with GIZ/others
• MT has many cooperation projects and regular interactions with different NGOs,
international donor organizations, different UN agencies, other privates
• KLH contact: Ibu Liana
• No cooperation with GIZ (yet) but great potential in different areas, e.g.:
o Community projects
o CC education
o Biodiversity
o Global Compact network
Conclusions
• While MT itself is clearly not a large ‘polluter’/emitter, the insights from the interview
show that it is still also very valuable to engage with such highly ‘responsible’ private
actors from sectors others than the usual ‘suspects’. Interesting ideas can be gained from
the outlined approach and activities and linkages possibly created for later engagements in
the area of climate change education, biodiversity or even adaption issues.
• Keeping good contact with MT is also promising because of its role as chair in the local
Global Compact network. Engaging in this context may be highly valuable for PAKLIM in
the context of intensified cooperation with the private sector in Indonesia, but also with
regard to the fact that GIZ itself is the coordinator of the German local network and hence
linkages may be initiated between these currently detached local networks (specific

169
interest/ request by the GIZ’s GC contact person in the Berlin Repräsentanz Mrs. Ann-
Ulrike Henning).
• For GOI the value of cooperating with and/ or at least ‘having’ MNCs in the country
becomes apparent again

170
10 Interview Summary: PT. Mulia Keramik Indah Raya
Date: 12. May 2011, 11.00-12.00
Location: Jl. Raya Tegal Gede, Lemahabang; Cikarang – Bekasi 17550 Attendants: Mulia: Pak Agung ( health & safety; environmental manager)
GIZ/PAKLIM: Aris Nugrahanto, Maren Breuer
General (note: the meeting was held primarily in Bahasa)
- Mulia Keramik is one of the operating subsidiaries of Mulia Industrindo (Mulia Glass and
Mulia Keramik) which belongs to Mulia Group (is a commercial property developer)
- Products: using advanced Italian technology, products consisting of wall tiles, floor tiles,
decorative tiles, and trims with average production capacity of 62 million sqm per year
- Mainly active in ID, trying to expand to another countries
- Nothing found on sustainability/cc issues from Mulia Keramik and Mulia group in general
- MuliaGroup won International Five Star Diamond Award for one of its building and the
Mulia hotel
Information on their CC/ CSR-activities:
• Are aware of CC and the government’s target because they attended the launching of the
Roadmap – otherwise they would not know about it all; environmental issues are generally
equated with ‘mere’ air pollution – the GHG/CC topic is not yet really socialized
• Currently take part in KLH training on emissions from stationary sources (focus on air
pollution) – oriented towards compliance (delivered by Stanteksi competence center)
• Enquire on the amount GHG emissions that actually originate from the industry sector and
hence the contribution the industries have to make to reaching the GOI’s targets
• Mulia already has several initiatives/actions regarding environment/ energy issues
ongoing, i.e.:
o Changed from oil to gas as fuel � motivation: efficiency – costs: “it’s tough
competition”
o Energy efficiency – standardize equipment, try to prevent leakage – preventive
maintenance � all this is being done because energy is increasingly expensive
o Opening of their factory’s ceiling to let in daylight; improve insulation
o Inspired by Indocement they even tried to propose a CDM project, which finally
was not realized though
• All these activities are put under Mulia’s risk management unit, i.e. it is not a separate
project/ unit yet but instead part of the cost performance indicators of the different units
• Currently they hence also neither have an energy management system nor conduct actual
energy audits; are ISO 14001 certified though
• Energy costs for Mulia/ ceramics industry are less than for the cement industry but still
considerable – are hence now increasingly moving towards larger focus on energy issues
• 85% of its competitors are those in the Indonesian market – hence don’t look abroad too
much; overall it is a very price sensitive market
• Already do heat recovery; the technology they use is said to be Italian but actually it is
technology produced in China by Italians; previously they actually used German
technology but it is too expensive
• Have “Blue” PROPER

171
• Interviewers’ impression: the company actually already does a lot of things related to
contributing to the GOI’s targets; the problem, however, is that they are not able to
integrate and relate them to the respective climate change context and to communicate
these activities accordingly when asked by the ministries
• CSR: Mulia is engaged in CSR projects for their immediate surroundings, i.e. the industry
zone around their factory – hence do the “normal” CSR activities (overall, their CSR is not
so much exposed though since their customers are other businesses and not the end
consumer) �They would like to know more about what they could potentially do as CSR
Current problems to realize more low-carbon operations:
• Lack the internal capacities for tackling CC/ energy issues, i.e. missing knowledge; the only
solution currently is to “go to the university of google”
• The GOI pushes the industries to use more gas but now the gas supply is too low – hence
they might have to change back to coal
• TA is what they really need, i.e. not only trainings. The competence level of the service
providers in ID is still quite bad, so what is needed is not someone just “certified” as
competent but really competent
• E.g. how exactly to realize energy improvements? Where do the GHG emissions really
originate in their operations? How to do a corporate GHG inventory? Missing standards
• Finances are not their major problem, so far they use their own capital for their
investments; however, tax reductions for specific technology would be good
• The banks don’t really understand the area of clean/green technology and the industry
knows too little about what is available in terms of financial support
Potential policy improvements (views, suggestions):
• Consistency in governmental policies, cf. gas as fuel, i.e. they need certainty to switch to
gas, and also better knowledge how to operate with gas
• Enlarged pool of competent service providers
• Encourage closer interlinkage between R&D/ universities and companies; i.e. in Italy for
instance companies and universities are closely interlinked, hence the level of technology
is so advanced there. Companies themselves are primarily focused on their daily
operations, would need innovative input/ideas from research institutions/ departments
(even though universities sometimes have too crazy ideas)
• (While e.g. in Germany and other countries decentralized supply is increasingly
advocated/ employed, for Indonesia the interviewee’s personal opinion is that supply
should be/stay centralized (i.e. through PLN))
Cooperation with GIZ, others:
• Would like to engage further with GIZ especially in the area of CSR, i.e. designing more
innovative/ creative CSR projects
• There is an investor forum in their industry area of which Mulia is the secretary � if we
want to do awareness raising on CC/ CSR we could approach them again and they could
invite the other companies for sharing ideas etc

172
11 Interview Summary: PT. Petrokimia Gresik
Date: 13. May 2011, 09:00 – 10:00
Location: Jl. Tanah Abang III/16, Jakarta 10160 Attendants: PG: Bapak Mulyono Prawiro (Director of Production) and Bapak Nanang Teguh GIZ/PAKLIM: Nanda Susanto, Maren Breuer, Kristin Meyer
General
• PG is a member of the Holding Pusri Persero (the holding is controlled by BUMN; it
includes five big fertilizer companies)
• PG is the biggest state-owned fertilizer company in ID – 3400 employees, 2200 from
subsidiaries
• Products: various kinds of fertilizers, such as: Urea, ZA, SP-36, NPK Phonska, DAP, NPK
Kebomas, ZK and organic fertilizer namely Petroganik, and non fertilizer products such as:
Sulphuric Acid, Phosphoric Acid, Ammonia, Dry Ice, Aluminum Fluoride, Cement Retarder,
etc.
• PG produces 5.867.600 ton/year of fertilizer in 16 plants and 1,647,600 tons / year of non-
fertilizer in 21 plants
• There is a steadily increase in fertilizer demand, PG has 3% growth each year
• The main production is located in Gresik, some subsidiaries might be at different locations
• PG imports phosphate and sulfur from the Middle East; the natural gas comes from East
Java; the coal from Kaltion, potassium from Canada
• (Private) competitors: Wirma and Sintana (national); internationally PG competes with
companies from the Middle East
Information on CSR/CC-activities:
• Are aware of CC
• Implemented ISO 14001 in 1998, including the following policies: meet environmental
legislation; preventing pollution and minimizing waste; review to ensure environmental
management; fostering sensitivity, awareness and concern for all employees
• Follow PROPER rule: got blue but are striving for green now
• The whole production of 5.867.600 ton/year produces 48.74 BBTUD (billion British
thermal unit per day) from which 6.24 BBTUD comes from process heat recovery, 12.4
BBTUD of coal and 34.50 BBTUD of natural gas
• Total CO2 emissions from PG (based on the presentation provided by the interview partners)

173
• Raw materials and energy together make up 70% of PG’s production costs � as a energy-
intensive industry energy is very important for them and hence the main driver for any
energy efficiency measures; have e.g. a specific energy conservation manager
• PG falls under ESDM’s Energy Law: consumption > 6000kW – however, this classification is
still based on data from the time when PG primarily used diesel oil (Solar) and marine fuel
oil. Meanwhile, for some time PG already used gas but now they changed back again to coal
due to the bad supply of gas lately; nevertheless PG still emits less Co2 today compared to
earlier
• Efficiency measures regarding the production: PG uses 3 boilers (2 with natural gas and
one with coal); but the Co2 they emit, they actually reuse directly
• Examples from the presentation: 34.5 BBTU converted to 1317 tons of ammonia / day and 1600
tons of CO2 per day in the ammonia plant. 1600 tons of CO2 were converted to urea and
ammonium sulfate. Utilization of residual heat energy process into electric energy 15.2 MW
(equivalent to 1.24 BBTUD) in Sulfuric Acid Plant which can reduce CO2 emissions by 8.1 tons /
hour; produce thermal energy (steam) of 70 tons / hour in Ammonia Plant that can reduce CO2
emissions 10.7 tons / hour)
• Further energy efficiency measures
• Utilization of purge gas as fuel in the primary reformer of ammonia plant, CO2 emissions
reduction of 1.81 tons / hour;
• Use of low pressure steam in the Ammonia plant, reducing CO2 emissions by 1.8 tons / hour;
• Settings of excess oxygen in the primary reformer and boiler package, reducing CO2 emissions
by 1.7 tons / hour;
• Economize on electricity consumption for air conditioning, office lighting and housing of PT
Petrokimia Gresik since September 2008
0,0000
500,0000
1.000,0000
1.500,0000
2.000,0000
20
00
20
01
20
02
20
03
20
04
20
05
20
06
20
07
20
08
20
09
20
10
ton
CO
2/t
on
pro
du
k
tahun
Emisi CO2
(from the presentation) : 2006 CO2 emissions rise and fall again
Disruption of gas supply (pipe burst Porong)
Switch to a fuel
2010 CO2 emissions rise
Changes in fossil fuel consumption from fuel oil to coal
CO2 Emissions MFO = 1.3 times the CO2 emissions of natural gas
CO2 Emissions Coal = 2 times the CO2 emissions of natural gas

• PG has a specific department for CSR with two divisions: one just dealing with social
activities and one unit for the environment and safety issues
• PG’s main CC/CSR activity is planting trees: the aim is to plant 1 million trees in the period
of 2003-2011 (already planted 400.000 in East Java: saving 3,16 Mio ton CO2); PG supports
the local government with 100.000
mandated CSR money)
• Other CSR community activities are related to drinking water pumps, education and
supporting SMEs
• The future technology is coal gasification; currently the technology is still too expe
(e.g. from Germany); PG works with Japan on R&D regarding coal gasification; visited
plants in SEA and China (all R&D is actually done in the holding
technologies should then be used in all of the five companies)
• Use Mitsubishi technology for capturing methane
• PG’s technology needs are highly capital
• Currently PG’s capacity is still enough but in five years PG plans a new plant with new
gasification technology in East Kalimantan and also intends to “revitalize” the old
Current problems to realize more low
• Technology (gasification) does not exist at an affordable price
• CDM implementation is very difficult, PG stopped investing time and money in it; they
(only) do EE activities which are economic
Potential policy improvements (views, suggestions):
• PG would like to have tax exemption on import of equipment in order to use more envir.
friendly technology
• Want to have more support for their research activities (incl. financial resources)
got now from the Japan government for researching on the new technology
• Soft loans – or even better grants
process, i.e. from international funds to the government, and then from the gove
the companies but with the normal conditions; want to have loans with special conditions
to directly invest in new technology)
• Require more technical assistance
Summary of all measures that reduce CO2 emissions
PG has a specific department for CSR with two divisions: one just dealing with social
for the environment and safety issues
PG’s main CC/CSR activity is planting trees: the aim is to plant 1 million trees in the period
2011 (already planted 400.000 in East Java: saving 3,16 Mio ton CO2); PG supports
the local government with 100.000 trees per year in PG’s surroundings (it is not the
Other CSR community activities are related to drinking water pumps, education and
The future technology is coal gasification; currently the technology is still too expe
(e.g. from Germany); PG works with Japan on R&D regarding coal gasification; visited
plants in SEA and China (all R&D is actually done in the holding –
technologies should then be used in all of the five companies)
technology for capturing methane
PG’s technology needs are highly capital-intensive
Currently PG’s capacity is still enough but in five years PG plans a new plant with new
gasification technology in East Kalimantan and also intends to “revitalize” the old
Current problems to realize more low-carbon operations:
Technology (gasification) does not exist at an affordable price
CDM implementation is very difficult, PG stopped investing time and money in it; they
(only) do EE activities which are economically viable
Potential policy improvements (views, suggestions):
PG would like to have tax exemption on import of equipment in order to use more envir.
Want to have more support for their research activities (incl. financial resources)
got now from the Japan government for researching on the new technology
or even better grants – directly for the companies (now there is the 2 step loan
process, i.e. from international funds to the government, and then from the gove
the companies but with the normal conditions; want to have loans with special conditions
to directly invest in new technology)
Require more technical assistance
Summary of all measures that reduce CO2 emissions (same like above):
174
PG has a specific department for CSR with two divisions: one just dealing with social
PG’s main CC/CSR activity is planting trees: the aim is to plant 1 million trees in the period
2011 (already planted 400.000 in East Java: saving 3,16 Mio ton CO2); PG supports
trees per year in PG’s surroundings (it is not the
Other CSR community activities are related to drinking water pumps, education and
The future technology is coal gasification; currently the technology is still too expensive
(e.g. from Germany); PG works with Japan on R&D regarding coal gasification; visited
if successful the
Currently PG’s capacity is still enough but in five years PG plans a new plant with new
gasification technology in East Kalimantan and also intends to “revitalize” the old plants
CDM implementation is very difficult, PG stopped investing time and money in it; they
PG would like to have tax exemption on import of equipment in order to use more envir.-
Want to have more support for their research activities (incl. financial resources) as they
got now from the Japan government for researching on the new technology
directly for the companies (now there is the 2 step loan
process, i.e. from international funds to the government, and then from the government to
the companies but with the normal conditions; want to have loans with special conditions

175
12 Interview Summary: PT. SAP
Date: 08. March 2011, 14.00 – 15.00
Location: SAP office Jakarta
Attendants: SAP: Mrs. Jessica Schwarze (Head of Marketing – also responsible for CSR,
sustainability issues)
GIZ: Maren Breuer, Citara Nayla
General
• SPA is the world’s leading provider of business software solutions
o SAP industry solutions support the unique business processes of more than 25
industry segments, including high tech, retail, public sector and financial services
o SAP is committed to improving its own operations to become more sustainable and
to delivering customer solutions that can help improve sustainability on a grand
scale
• Start of operations in Indonesia in 1997; small team in ID, i.e. 60 people; work a lot with
local partners
• Customers of SAP Indonesia are only local companies; i.e. MNCs are part of the global
customer base of SAP and dealt with from the headquarter
• 80% of SOEs are their customers; among them especially also the large “polluters”
Information on CSR/CC-activities
• Globally, over the past 10 years, SAP has been recognized by the Dow Jones Sustainability
Index for upholding ethical, environmental, social, and governance values and standards �
SAP HQ is very advanced in these issues already since quite a while (e.g. also the SAP HQ in
Germany is an eco building)
• CC is seen as an opportunity overall
• Sustainability is SAP’s global business theme of the year
• Green issues/ strategy comes from the global headquarter in Germany � top-down
approach (also SAP’s Global Compact activities are done centrally in/from Germany)
• Global sustainability initiative currently ongoing from the HQ, e.g. Global Sustainability
Survey
• Green Day conducted once a year within SAP’s Indonesian branch
o E.g. use less paper; leave your car at home and use public transport
o However, currently sustainability is still somehow a dead end in ID, e.g. initiatives
like leave your car at home and use public transport instead fail due to insufficient
infrastructure in Jakarta
• Overall sustainability is so far not an issue in ID; neither within their own company nor
among their customers
SAP’s current strategy:
• Approach the private sector directly first
• Do own awareness campaigns among their customers
� Hope to finally sell their sustainability products in the Indonesian market;
i.e. software for measuring and reporting data on energy use, waste, water
etc. (26 industry templates; consulting/ training is part of the product/
service)

176
• Awareness raising event on 28.4.
• Go via the media (Warna Media in this case) to initiate such events as they as a private
company do not/ cannot approach the government directly; their footprint into the
government so far is still rather limited; increasing this is this year's target – MoF to be
approached first with SAP’s products (MoF has the financial resources)
• Marketing approach to find out about the status quo concerning sustainability: talk to the
companies at events as well as through feedback from their sales people
Current problems to realize more low-carbon operations:
• Indonesian industries are not yet ready for sustainability issues as it is not a priority yet;
this needs to come from within the individual as well as should be driven by the
government
• So far the privates’ focus is on profit first; only some ID companies do it for their image, e.g.
Asia pulp and paper
• While SAP doesn’t sell its sustainability solutions in ID yet, they are currently preparing the
ground with the different initiatives (see above)
o they estimate that it will still take 2-3 years till ID is ready for this
o in the West their sustainability solutions are already since long widely accepted
Potential policy improvements (views, suggestions):
• Awareness raising
• Education
• Stricter and more stringent regulations on the big manufacturing companies
• Not aware of any initiates/ commitments from GOI on the CC topic
• High interest though in the RAN GRK and would appreciate if the public side would share/
communicate more on all these issues to the private sector
Cooperation with GIZ, others:
• SAP Indonesia does not (yet) have any joint project with any other development
cooperation nor with NGOs
• Interest, however, in future interactions with PAKLIM, e.g. invitation to join their planned
sustainability event on April 28th; as well as potentially for a real cooperation in the
medium term

177
13 Interview Summary: PT. Semen Gresik
Date: 16 June 2011, 14.00-15.00
Location: PAKLIM office KLH
Attendants: SG: Bapak Rudy Hermawan (R&D on Process, Energy, & Environment), Bapak
Rama Wijaya (Amdal)
GIZ/PAKLIM: Aris Nugrahanto , Maren Breuer, Kristin Meyer, Anandita Susanto
General
• State-owned company with 51% public share
• Biggest cement company in ID � have 45% of the market share in ID
• To their group belong Semen Padang and Semen Tonasa
• Production capacity 19 Mio t/ annum
• Strong competition with the other cement companies in ID/ have the same customers
Information on their CC/CSR-activities:
• SG started first CC activities 5 years ago (but admit that they are not so active/fast like
Holcim or Indocement which operate based on regulations, directions and know-how from
their headquarters in Europe)
• Programs regarding alternative fuel and raw material (AFR):
• Blended Cement (already use 75% blended cement)
• For blended cement they use trash, lime stone, fly-ash, gypsum
• use steel slag, cooper slag, recently oil slag as alternative raw materials (co-
processing)
• Fuel switch: 2 years ago they started using biomass (e.g. ricehusk, tobacco dust
etc.)
• 300 t per day of biomass for one plant
• But the problem is the availability of biomass (especially for 4 plants) -> since
ID has increased their exports of biomass, the prices went up and now there is
the risk of not being economically viable anymore – biomass now is as
expensive as coal -> hence thinking of changing back again to coal
• Biomass needs more volume in its transporation and also for its storage.
Therefore, the transportation cost for biomass is quite expensive � that’s why
SG is planning to open a new plant close to the raw material
• Applied for one CDM project for biomass in one plant / verification in February
2011
• They cannot have 100% Blended Cement because that is not demanded by the customers
since these would have to change their own building process/ architecture � if you would
reduce the quality the customer would need more cement, which makes it more expensive
- that’s why they stick to 75% Blended Cement because that is the amount which maintains
the quality
• The blended cement is nearly the same price like the not-blended cement
• In ID, there is no quality standard for cement; e.g. in Europe there is a standard of strength
of cement of 280 kg – even though there is no standard in ID, Semen Gresik thinks that
quality is their competitive advantage and wants to keep the strength of cement very high
• Received PROPER green in 2009/2010 (received green 3 times already)

178
• Have implemented ISO 14001/ ISO 9001
• They undertake a bit of co-processing but not as much as Indocement or Holcim (which
already started 20 years ago in Europe)
• The Environment Department is integrated into the R&D department, which is working on
the continuous improvement of energy issues (hence do not have a specific CC
department)
• CSR activities: 1-5% of their sales goes to CSR (mandatory); they have a special CSR
department: activity: greening around the factories, health, scholarships, art and culture
Current problems to realize more low-carbon operations:
• They do not need loans; have enough own equity
• E.g. in Singapore it is allowed to use steel slag for blended cement (to reduce the clinker
content) but in ID it is not allowed from KLH because steel slag is categorized as hazardous
waste – that is a competitive disadvantage which the GOI should work on because steel
slag is cheaper � they could need an expert study what exactly are the impacts of
combining steel slag into blended cement
• Now all try to switch to alternative fuel, which increases the prices � GOI should do
something upfront and not wait until the prices are high again – they think a regulation of
10-15% use of alternative fuel is not useful since then the prices will rise; the GOI should
consider something like that before they promoting a certain fuel/measure – think of side
effects and of feasibility
• Alternative fuels are the only projects that might generate CERs from CDM in the cement
industry � if the GOI would now give incentives for alternative fuel, SG is not likely to
claim it as CDM anymore (because then they cannot prove the (investment) additionality
anymore that is required for a CDM project) � that’s why incentives for fuel switch is not
necessarily in the interest of SG
Potential policy improvements (views, suggestions):
• For blended cement, it is more important to “educate the market” rather than to have more
regulations – the customers just care about the quality and not about regulations or
standards – so, if the blended cement or the respective regulation cannot maintain the
quality anymore, the customer just do not buy anymore (no matter whether it is good for
the environment)
Cooperation with GIZ, others:
There are big cooperation potentials between Semen Gresik, GIZ and MoI. SG will be PAKLIM’s
main potential partner for the Voluntary Partnership Agreement (VPA). In the VPA Semen
Gresik and MoI will share their contribution and commitment.
Summary of most crucial issues:
• Supply of alternative raw materials (as fuel substitute; esp. biomass)
• Regulations for using alternative materials (in blended cement)
• Organizational issues – need for experts/ technical assistance

179
14 Interview Summary: PT. Siemens Indonesia
Date: 31. March 2011, 09:00 – 10:30
Location: Corporate Office, Arcadia Office Park, Tower F, Penthouse; Jl. T.B. Simatupang
Kav. 88, Pasar Minggu, Jakarta 12520
Attendants: Siemens: Hans-Peter Haesslein (President Director and CEO), Julieta Glasmacher
(corporate communications)
GIZ/PAKLIM: Maren Breuer
General
• Active in ID for 150 years, established throughout the country with a total of 5 operating
companies and 5 manufacturing facilities
• Deliver products, solutions and services across 5 broad industry groups: Power,
Automation and Control, Health Care, Transportation and Lighting (OSRAM); e.g.:
o PT Siemens Indonesia49
o PT Jawa Power50
• At CEO and management level clearly well aware of GOI CC policies as it is an essential part
of their business as a “green” technology provider (personal question, however: will
something really ever happen? cf. e.g. 10,000 MW program)
• Siemens about to found a forth division: “Infrastructure and cities” …
• In favor of coal as the energy source for ID, now and also in the future – hence emphasis on
“clean coal” (see below)
Business as technology provider in ID
• Key industries: cement, pulp & paper, mining, power generation
• The demand for Siemens’ products in ID is driven by the companies’ need to stand the
competition against other companies in the international markets – need to reduce costs,
increase productivity. Hence, national industries actually since long buy Siemens’
technology in so far as it helps them to save costs; however, there is clearly still room for
improvements, especially in the area of “clean coal” (see below)
• Just formed a new joint venture in ID, which aims to build small steam plants for the local
market (German technology standards to be applied, gradual increase of local contents
planned)
• Both push and pull business in ID
49 Power Generation (PG), Power Transmission and Distribution (PTD), Automation and Control (A&C), Building Technologies – Fire Safety and Security Products (SBT - FS), Medical Solutions (Med), Transportation Systems (TS) 50 Established in March 1995, the company is the owner of 2 x 160 NW coal-fired thermal power station also known as “Paiton II” which was developed on a BOO basis. Jawa Power sells electricity to state owned utility company PLN under a long term contract. The project is located in Paiton, Probolinggo District, East Java, directly along the existing Java – Bali 500 kV transmission system. The first unit achieved commercial operation in June 2000 and the second unit in November 2000. The Paiton II power station is one of the most environmentally friendly coal-fired power stations in the world.

180
Information on CSR/CC-activities
• CC, and sustainability in general, are a top management issue, e.g. Siemens’ chief
sustainability officer Mrs. Barbara Kuks is a member of the Board of Directors
• Global reduction target of 20% to be achieved in 2011 already
• In ID Siemens takes care of ensuring sustainable operations at their own sites, e.g.
regularly check energy, water, waste issues - well on the way to reach good sustainability
standards
Current problems to realize more low-carbon operations:
• Lack of money for Siemens’ higher quality and “greener”, but also more expensive,
products
• Competition from cheaper but dirtier Chinese products (cf. 10,000 MW project)
• Both public actors and privates in ID make investment decisions largely based on the least
cost principle without life cycle cost assessment – environmental considerations are
mostly left out (“trauma” of 10,000 MW program which went entirely to the Chinese; SOEs
do not want to be accused of corruption if they decide for the more expensive investment
option)
• Lack of political will to really do something against e.g. energy subsidies and promotion of
more modern and cleaner technologies
Potential policy improvements (views, suggestions):
• Removal/ reduction of energy subsidies:
o the majority of companies can actually afford higher energy prices; they do a
bit already but would do it all much faster then
o then, let people know that there is technology out there which helps to reduce
energy costs (so they could compensate right away a bit, and it also helps CC/
environment)
o however, balanced program needed of course, i.e. support to those groups/
people that could not afford the higher energy prices
• Clean coal: In line with believing in coal as the energy source for ID also in the future
(“some scattered windmills won’t do it”), there is an urgent need for stronger promotion
and improved conditions for “clean coal”, i.e. set the right frameworks, incentives, financial
support – don’t buy from backward companies/ technology – more modern technology is
needed
• Organizations like ADB, KfW, et al. need to provide funding at attractive rates to industries
in order for them to go for energy efficiency
• Education and capacity building on CC/ EE are needed:
o MNCs have the knowledge, local industries to a lesser degree (large difference
though between those exposed to international markets < -- > business
operations only in the national market)
• Power generation in general: geothermal has high potentials in ID, but: the different
ministries have overlapping or even contradicting policies and regulations on the issue,
which causes confusion and prevents progress – needs to be sorted out, then more is going
to happen in the area
Cooperation with GIZ, others:

181
• Currently running project with IABC (International Association of Business
Communicators) on “e-procurement” – prepare tenders to look more at life cycle costs
(related to the problems identified above concerning investment decisions based on least
cost principle only)
• Generally high interest in staying in contact and should there be options for cooperation
then these are very welcome
• However, as they already take care of their own sites themselves and act as technology
supplier ‘only’ in ID, Siemens would probably be best as a third partner in a potential iPPP
with some national companies
• Post interview idea from Heiner: potentially later on come back to Siemens in relation to
the NAMA in the energy/ power sector (cf. Siemens’ PT Jawa Power above)

182
15 Interview Summary: Sinar Mas (agrobusiness division)
Date: 31. March 201, 10.00-11.00
Location: Bii Plaza (30th floor), Jakarta
Attendants: Sinar Mas: Ira Larasaty
GIZ/PAKLIM: Maren Breuer
General
• The main business the interviewee is representing is Sinar Mas’s plantation/agro business;
(Sinar Mas’s pulp and paper mills are under Asia Pulp and Paper (APP))
• SM is the 2nd biggest palm oil producer in the world
Information on CC/ CSR-activities:
• RSPO (Roundtable for Sustainable Palm Oil) certification now (for two of their plants in
Kalimantan); aim to have two additional mills certified per annum from now on
• Traditionally very conservative company/ management; however, trying to improve now;
that’s why they e.g. focus on the RSPO now, have a related taskforce (which consists of
people from different corporate divisions)
• SM started with their sustainability activities only two years ago when Greenpeace brought
all the issues into the media
• Changed the standard operating procedures (SOPs)/ the way of running their plantations
• Work now with Swiss consultants and universities
• Since the company is so big, the overall awareness level on these issues is quite low
• Ecosecurities tried to introduce renewable energies (RE) already in 2006. However, SM
only now has the first RE project (with a technology provider as 3rd partner)
• One CDM project in validation, selecting buyers for the CER now
• Eventually RE will substitute fossil fuels; however, most of the mill owners are not in favor
of the RE activities
• Since SM buys the land in order to open plantations they need to do a lot of public
consultations, involve various parties; HCV (high conservation value), i.e. you can’t just cut
down trees there, land disputes; e.g. NGOs, cultural leaders, different ethnic groups need to
be involved – social experts as mediators in these consultations
• International critiques because the government granted permits to the sector to cut down
the forest. What needs to be preserved should come from the government �� Malaysia
e.g. is quite stringent with the allocation of land; their emissions rate is hence not so high
• Plans in terms of improving energy efficiency: e.g. replace boilers, build biogas plants
where applicable; then open to external investors to share the costs, have as CDM again �
actually all these (potential) projects are related to CDM since there are no other incentives
and there always needs to be sth. in for the company (“people want to be paid for doing
sth. good”; … “Sinar Mas is on a good way though”)
Current problems to realize more low-carbon operations:
• Here in ID it is always “carrots” that are used/have to be used, not “sticks” – they would not
work, i.e. the question is “what’s in for us?” �� in the EU people/ companies do things
more voluntarily (i.e. they do not only think of the immediate/direct financial benefits)
• PROPER is the only standard in ID, that’s all; e.g. RE is not mandatory

183
Potential policy improvements (views, suggestions):
• Incentives for companies/ sectors that do sth. to become green; e.g. tax breaks for imports,
technology transfer
• Investment support for RE, e.g. when the mills want to have a new RE technology –
currently the application process is too complicated
• Support the respective department in the Ministry of Finance since RE is not their core
business
• Overall great potential in the sector – need to get all on the same page, initiate stakeholder
dialogues
• GOI should be more assertive on the private sector
Note: Ms. Larasaty had been working for SM as CDM expert but was just about to leave the company and to return
to the Netherlands (continue to work as a freelance consultant for SM though from there). The interview came
about thanks to a personal PAKLIM contact and the information/ views shared by Ira and documented here clearly
reflect the personal notion during the interview and the high level of frustration of the interviewee herself.

184
16 Interview summary: PT. TÜV Rheinland
Date: 25. February 2011, 10.00 – 11.30
Location: Office of PT TUV Rheinland Indonesia, Menara Karya 10th Floor, Jakarta Attendants: TÜV: Muhammad Asana (President Director), Caterina Castellanos (General
Manager Marketing), Nicolas Pitet (Business Development), Heng Dang (project
manager), Ramaiyer Ramachandran (manager – TR CERT Lead Auditor)
GIZ/PAKLIM: Maren Breuer
General
• TÜV Rheinland is a global leader in independent testing and assessment services • TÜV Rheinland has about 850 customers in management system certifications and about
500 customers in product testing and factory inspection. According to Mr. Asana, president director, most of these could be our target for implementing eco efficiency projects.
Information on CSR/CC-activities
TÜV Rheinland’s Eco-Industry Certification
• Eco-Hotel Certification as the starting point for also developing a certification for the
industrial sector.
• The hotel project is a three year project lasting till the end of 2011. It is conducted as a PPP
with DEG. The management of the project is left entirely to TÜV Rheinland. So far 13 hotels
have been certified in Indonesia. Within the current PPP the TÜV does not make any real
profits as the audits and other related services are offered for free so far. The intention,
however, is to establish a market through this and thus to later on make profits with this
service. The Eco-Industry Certification is based on the same reasoning and basic principles
(e.g. continual improvement).
Characteristics:
• The Eco-Industry certification program acknowledges the initiative of industry to
constantly optimize the aspects of energy, water and waste management in order to
minimize the environmental impact. In times of increasing energy and production costs,
the optimizing of energy and production costs plays a crucial part in times of global crisis.
• The standard is complying with requirements related to: Environmental friendliness,
energy efficiency, CSR, safety at work
• Benefits of the Eco-Industry:
o Cost reduction through optimization of energy and water consumption
o Waste management optimization
o Reduction of ecological damages (incl. penalties)
o Reduction of environmental risk and consequent reception of lower insurance
contributions
o Reduction of accident risk and reduction of associated costs
• Certification Process:

185
• Motivation for creating the standard (together with the TÜV colleagues in Cologne):
o Missing incentives from the government for companies to actually act responsibly,
e.g. to save energy.
o Development of the certificate also in foresight to the coming potential regulations,
reductions of energy subsidies, etc. Certified companies will hence already now be
prepared for any such upcoming changes. Basically, the certification thus aims to
fill in the exiting regulatory gaps and with this to contribute to a better and
‘greener’ Indonesian industry.
• Envisaged customers:
o The certification is applicable to companies within virtually all kinds of different
sectors. However, overall the standard has been developed for developing
countries (as in Europe the companies already have to comply with very strict
regulations). In the absence of such requirements in e.g. Indonesia, especially in the
area of energy efficiency, the ‘beauty’ of the award is that it still makes companies
to act on energy efficiency issues already now.
• Interest in the certification has been shown especially from two types of companies:
o “Dirty” companies e.g. from the mining sectors, and
o Companies that want to do business with Germany and/or other European
countries (here especially also local SMEs). In these cases it is an advantage or even
necessary for the companies to be able to declare e.g. the carbon footprint and/or
carbon neutrality of their products.
• Despite all these potential benefits, so far PT Mercedez-Benz Indonesia is the first and only company obtaining this certification.
Current problems to realize more low-carbon operations:
In trying to promote the service among private companies the TÜV is frequently asked in how
far the certification is in line with the government regulation, i.e. especially PROPER � One of
their biggest challenges for the success of the 'Eco-Industry' certification is hence the
endorsement of the Ministry of Environment (Proper Team). If an eco-industry certification
could be compliant with the 'gold label' of the Proper team scheme, the private sector could
ensure compliance with the public sector's requirements.