Development of BioRID II Dummy Model using Stochastic … · 6th European LS-DYNA Users’...
22
6th European LS-DYNA Users’ Conference 5.1.3 5.13 Development of BioRID II Dummy Model using Stochastic Methods Authors: Sebastian Stahlschmidt, Bastian Keding, Katharina Witowski, Heiner Müllerschön, Uli Franz DYNAmore GmbH, Stuttgart, Germany, http://www.dynamore.de Email [email protected] ABSTRACT Consumer and insurance organizations use the BioRID II dummy as test device to assess the risk of whiplash injuries in rear crash scenarios. DYNAmore GmbH developed a finite element model for LS-DYNA of the BioRID II dummy in cooperation with the German Automotive Industry (FAT). The project follows the updated development guidelines of successfully developed models for the FAT in previous projects. This paper describes the applied development methodology, modeling techniques and the current model. Due to significant pre-stress in the dummy and other new features the modeling requires LS-DYNA 971. An outline of the good performance of the model release 2.0 in various validation tests is presented. The paper concludes with results from robustness investigations performed with LS-OPT. Keywords: BioRID, Dummy, whiplash, robustness, oscillation, neck link rotation
Transcript of Development of BioRID II Dummy Model using Stochastic … · 6th European LS-DYNA Users’...

6th European LS-DYNA Users’ Conference
5.1.3 5.13
Development of BioRID II Dummy Model using Stochastic Methods
Authors:
Sebastian Stahlschmidt, Bastian Keding, Katharina Witowski, Heiner Müllerschön, Uli Franz
DYNAmore GmbH, Stuttgart, Germany, http://www.dynamore.de
Email [email protected]
ABSTRACT
Consumer and insurance organizations use the BioRID II dummy as test device to assess the risk of whiplash injuries in rear crash scenarios. DYNAmore GmbH developed a finite element model for LS-DYNA of the BioRID II dummy in cooperation with the German Automotive Industry (FAT). The project follows the updated development guidelines of successfully developed models for the FAT in previous projects.
This paper describes the applied development methodology, modeling techniques and the current model. Due to significant pre-stress in the dummy and other new features the modeling requires LS-DYNA 971. An outline of the good performance of the model release 2.0 in various validation tests is presented. The paper concludes with results from robustness investigations performed with LS-OPT.
Keywords: BioRID, Dummy, whiplash, robustness, oscillation, neck link rotation

6th European LS-DYNA Users’ Conference
5.14 5.1.3
INTRODUCTION
Already in the 80th the interest for whiplash investigations was increasing significantly. Whiplash [1] is an injury that often occurs in low speed rear impact scenarios in passenger cars. In the 80th only the H3-50 Dummy with a rigid thoratic spine and a simple neck was available for whiplash investigations. The usage of this dummy was limited to capture injury criteria for whiplash scenarios.
In the 1990’s the Chalmers University of Technology of Sweden developed in corporation with Saab and Volvo the BioRID. The dummy is equipped with a detailed flexible spine and neck to predict injury risks in rear impacts. Later the BioRID II was developed based on the BioRID design. Consumer organizations use the BioRID II dummy in low speed rear sled tests with a predefined pulse to asses the whiplash risk of a seat.
Due to the dominantly elastic deformations in the seat during the whiplash tests, it is difficult to detect the different load paths between the dummy and the seat. In tests with high plastic deformation modes important information can be gained after the test. Unfortunately, this is not possible for the tests with the BioRID II dummy. Hence, by simulations important knowledge could be gained to understand the interaction of the parts. Therefore, a working group of the FAT (German Association for Automotive Research) has been launched in 2004 to develop a finite element model of the BioRID II. Participating companies are Audi, BMW, Mercedes, Porsche, Keiper Recaro, Hammerstein, Johnson Controls, Volkswagen and Karmann. During the project the FAT is defining tests, requirements and approves the model based on the milestones. Like in former dummy modeling projects DYNAmore is responsible for developing the LS-DYNA model. The model is commercially available for companies not participating the working group.
Previous releases of the model and the project itself has been presented in papers already. This paper is an updated version of [2], it is updated in respect to dummy model release 2.0. The aim of the paper is to describe the applied development methodology, modeling techniques and the current model. The correlation in the entire set of component and sled tests is presented in [3]. Beside the description of used new features the paper presents a stochastic investigation performed to understand the dummy behavior and to ensure stability.

6th European LS-DYNA Users’ Conference
5.1.3 5.15
BioRID II MODEL DESCRIPTION
The first commercial available release of the BioRID II model was available in June 2005. The current model release number is 2.0. It is based on CAD data from the dummy manufacturer Denton CAE for parts specifically designed for the BioRID II and scanned data for parts also used in Hybrid III dummies. The mesh targets to model the dummy with almost all details. The masses are adapted according to a detailed measurement of each part. The model BioRID II release 2.0 runs with LS-DYNA version 971 R2 upwards on computers with SMP and MPP architecture.
MODEL OUTLINE
Release 2.0 consists of approximately 145,000 nodes, 88,000 hexahedron elements, 22,000 tetrahedron elements, 72,000 shell elements , 4,000 beam elements, and a couple of discrete elements. The model uses 47 material definitions in 401 parts. Figures 1 and 2 depict the model and selected details. The foam materials are modeled with material type 83 (*Mat_Fu_Chang_Foam). All the rubber material are defined with material type 181 (*Mat_Simplified_Rubber). The parts made of steel and aluminum are modeled with material type 20 (*Mat_Rigid). One major single surface contact (Type 13, *Automatic_Single_Surface) with the soft constraint option is used to preserve the contacts in the dummy. The other contact parameters use the default settings. Global damping is not applied.
Figure 1: FAT LS-DYNA BioRID II dummy model. Left: completely assembled model. Right: Thorax and head model cut along the spine.
6th European LS-DYNA Users’ Conference
5.16 5.1.3
NECK MODEL
The neck depicted in Figure 2 consists of the OC plate and 7 neck vertebrae (C1-C7). In the middle the vertebrae are connected with bolts which work as rotation axis for the vertebrae. Between the vertebrae in the front and the back are small rubber bumper included. On the left hand side a steel cable is going through all vertebrae to a rotational damper, and on the other side two cables (one at the front and one at the back) are going also through the vertebrae to two springs. In use of these springs it is possible to move the OC plate into a described position by pre-stressing the springs and the rubber bumpers. Figure 2 shows on the right hand side the pre-stressed rubber bumpers.
Figure 2: Left: Neck model of BioRID II v2.0. Right: pre-stressed neck rubber bumpers.
The rubber bumper are modeled with hexahedron elements and they use the material type 181 (*Mat_Simplified_Rubber). The pre-stress is generated in use of the keyword *Initial_Foam_Reference_Geometry. To get equilibrium of the neck at the springs are also pre-stressed. The steel cables are modeled with seatbelt and slip-ring elements. The parts are pre-stressed according to the assembly procedure specified in [4].
rotational damper
OC plate
steel cables

6th European LS-DYNA Users’ Conference
5.1.3 5.17
THORATIC AND LUMBAR SPINE
The thoratic and lumbar spine has a different design as the neck. It is build by 11 thoratic vertebrae and 6 lumbar vertebrae. The vertebrae are jointed by tortional beams. Between the vertebrae rubber bumpers are located to limit the rotation of each vertebra. The torsional beams are connected by washers which are depicted in Figure 3.
Figure 3: Left: Spine without vertebrae. Right: Enlargement of the torsional beams and the washers.
The stiffness of the torsional beams is modeled by the keyword *Contrained_-Joint_Stiffness_Generalized. This modeling allows pre-stressing the torsional beams automatically in respect to the seating position of the dummy model.
TEST DATABASE FOR VALIDATION
A significant effort was made to generate a database on the static and dynamic material behavior, and the dummy behavior in component and fully assembled tests. A more detailed description of the material tests is presented in [5].
washers
torsional beams
T1 vertebra

6th European LS-DYNA Users’ Conference
5.18 5.1.3
MATERIAL TESTS
For each important material in the BioRID II different tests with static and dynamic tension and compression loads were performed. The considered strain rates vary from 0.001 to 500 1/s. Figure 4 shows some selected material samples which were used for the material tests. The tests were chosen to obtain material data that could be used with small adaptations for material *Mat_Fu_Chang_Foam and *Mat_Simplified_Rubber.
Figure 4: Material specimen for compression tests and a tension test sample.
COMPONENT TESTS
To get more experience on the kinematics of the spine component tests were performed. Most of the tests investigate behavior of the fully and partially assembled spine. In Figure 5 and Figure 6 different component tests are depicted. Each test setup was used with a set of different pulses.
The performance of the current release in the extensive number of tests is presented in the user manual of the dummy model [3].

6th European LS-DYNA Users’ Conference
5.1.3 5.19
Figure 5: Left: BioRID II component test with supported spine. Right: Component test of assembled thorax.
Figure 6: Left: BioRID II component test with partially supported spine. Right: Compo-nent test with not supported spine.
Exemplarily, a test with the spine coupled to the sled from the spine adapter plate up to the T1 vertebra is showcased in the following. Only the neck with the assembled head can move. The test setup is depicted in Figure 5 on the left hand side. The neck is equipped with damper and the pre-stressed steel cable.
In the first 45 ms the head is not rotating much. The dominant movement is a translation backwards and the deformation is a shear deformation between the head and the T1 vertebra. The motion in the first few milliseconds is very dependent on the pre-stress, the lateral strain of the rubber bumpers and the right rotation relationship between the vertebrae. Figure 7 to Figure 11 show the results of this load case.

6th European LS-DYNA Users’ Conference
5.20 5.1.3
Figure 7: Head acceleration [g] vs. time [ms]. Left: x-acceleration. Right: z-acceleration.
Figure 8: Neck acceleration [g] vs. time [ms] at C4. Left: x-acceleration. Right: z-acceleration.
Figure 9: Upper neck force [N] vs. time [ms]. Left: Force in x direction. Right: Force in z direction.

6th European LS-DYNA Users’ Conference
5.1.3 5.21
Figure 10: Lower neck force [N] vs. time [ms]. Left: Force in x. Right: Force in z direction.
Figure 11: Neck Moment [Nm] vs. time [ms]. Left: Upper neck moment. Right: Lower neck moment.
The double peak in the head x-acceleration (Figure 7 left) and in the upper neck x-force (Figure 10 left) is determined by the frictional dependency between the vertebrae. Also the negative peak at about 90 ms in Figure 11 on the left hand side for the upper neck y-moment has a high dependency of these friction values.
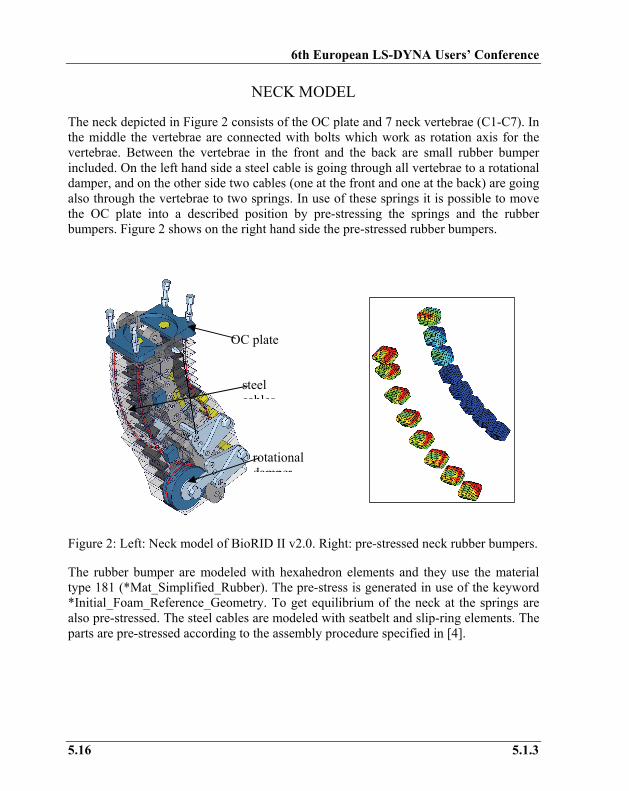
The oscillations of T1 are decreased very much in the upcoming release, as depicted in Figure 12. This was achieved by using the new material model for the rubber bumpers. This is a comparison between BioRID v1.5 (green line) and the current validation release (red line). The black lines are the test results. The shown test is depicted in
6th European LS-DYNA Users’ Conference
5.22 5.1.3
BioRID v1.5 BioRID current release tests
Figure 5 on the left hand side. The spine is fixed to the sled from the pelvis adapter plate up to T8. The thoracic and neck vertebrae can move freely.
Figure 12: Neck acceleration [g] vs. time [ms] at T1. Left: x-acceleration. Right: z-acceleration.
TEST WITH FULLY ASSEMBLED DUMMY
Since the seat systems are very complex a simplified seat was used to validate the dummy model. The seat used for the tests is a modified version of a seat built at Chalmers University to develop the BioRID dummy [6], originally. The simplified seat is depicted in Figure 13.
Figure 13: Simplified seat model with dummy model.
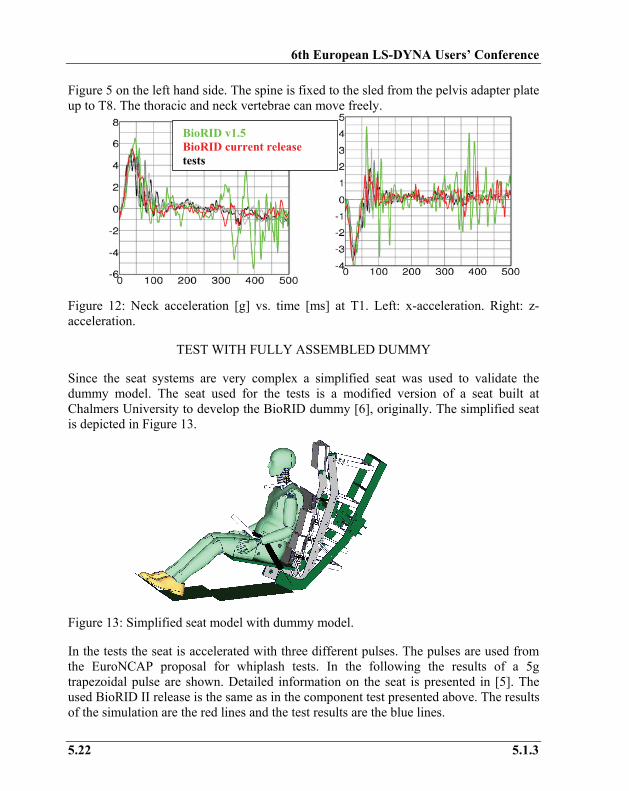
In the tests the seat is accelerated with three different pulses. The pulses are used from the EuroNCAP proposal for whiplash tests. In the following the results of a 5g trapezoidal pulse are shown. Detailed information on the seat is presented in [5]. The used BioRID II release is the same as in the component test presented above. The results of the simulation are the red lines and the test results are the blue lines.
6th European LS-DYNA Users’ Conference
5.1.3 5.23
Figure 14: Head acceleration [g] vs. time [ms]. Left: x-acceleration. Right: z-acceleration.
Figure 15: Neck acceleration [g] vs. time [ms] at C4. Left: x-acceleration. Right: z-acceleration.
Figure 16: Upper spine acceleration [g] vs. time [ms] at T1. Left: x-acceleration. Right: z-acceleration.
6th European LS-DYNA Users’ Conference
5.24 5.1.3
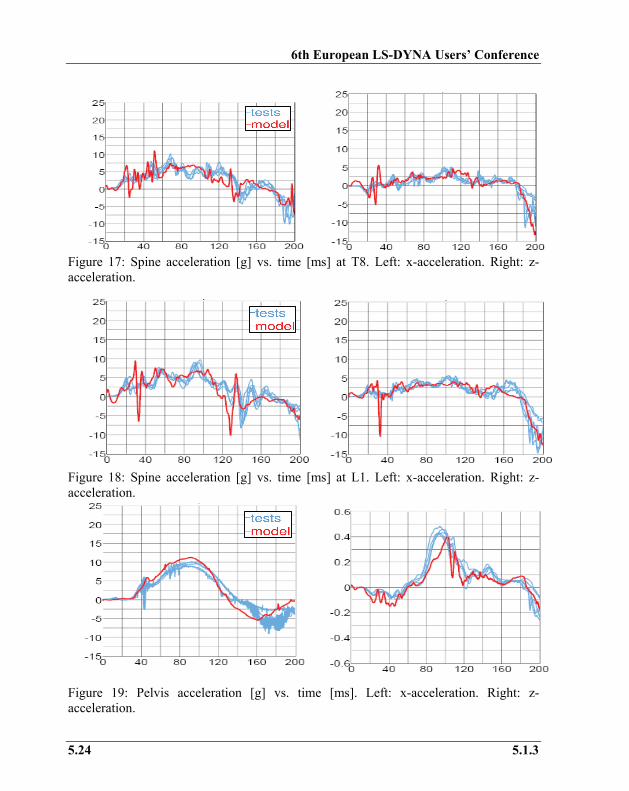
Figure 17: Spine acceleration [g] vs. time [ms] at T8. Left: x-acceleration. Right: z-acceleration.
Figure 18: Spine acceleration [g] vs. time [ms] at L1. Left: x-acceleration. Right: z-acceleration.
Figure 19: Pelvis acceleration [g] vs. time [ms]. Left: x-acceleration. Right: z-acceleration.

6th European LS-DYNA Users’ Conference
5.1.3 5.25
Figure 20: Upper neck force [kN] vs. time [ms]. Left: Force in x. Right: Force in z.
Figure 21: Lower neck force [kN] vs. time [ms]. Left: Force in x. Right: Force in z.
Figure 22: Neck moment [Nm] vs. time [ms].Left: Upper neck moment. Right: Lower neck moment.

6th European LS-DYNA Users’ Conference
5.26 5.1.3
Figure 23: Rotation [degree] vs. time [ms]. Left: OC neck link rotation. Right: T1 neck link rotation.
Figure 24: Rotation [degree] vs. time [ms]. Left: Global rotation of head. Right: Global rotation of T1.
The quality of the correlation in all tests is comparable to the above presented examples. The accelerations are captured very well. The forces and moments are captured well, but not perfectly. The rotation of the neck link, head and T1 are difficult to correlate, but results are considerably good. The later signals are much more sensitive than the forces and moments.
In addition to the standard validation work the robustness and sensitivities were analyzed with LS-OPT. These studies allow learning about influences and dependencies in the model.

6th European LS-DYNA Users’ Conference
5.1.3 5.27
ROBUSTNESS INVESTIGATIONS
In the following we focus on the question which parameters have major influences on specific responses and histories (curves). Initially we receive this information by sets of single simulations by varying parameters manually in the input file. Obviously, investigations by running single simulations are limited. Since LS-OPT provides a comfortable tool to investigate the model with stochastically methods, LS-OPT is applied to perform a robustness analysis. In the following selected conclusions of the stochastic analysis are presented.
The full assembled dummy test described above with a 5g trapezoidal pulse is used for the stochastic investigations. Some material data, load curves, friction coefficients or damping constants used in the simulation are obtained from tests, therefore the values are subject to some variations. The considered variables for the stochastic analysis are described in Table 1. Unfortunately, the performed tests do not allow determining the variation in terms of statistical quantities of the fuzzy test results. Hence, the scatter of the different parameters is derived from engineering experience and physical assumptions. As an exemption the distributions of “Puls1” and “Puls2” are based on test results. A normal distribution is applied if a target value is available; this target value is defined as the mean value of the distribution. For example, the target value of “Puls1” and “Puls2” is 5g. The responses considered in the analysis are listed in Table 2.
Variable Description Distribution lower upper mat1010 Material of rubber bumpers yellow. Scale factor
of ordinate values for all strain rates. uniform 0.0004 0.0012 lower upper mat1011 Material of rubber bumpers black. Scale factor
of ordinate values for all strain rates. uniform 0.0004 0.0012 lower upper mat1025 Material of silicon torso flesh. Scale factor of
ordinate values for all strain rates for material. uniform 0.0006 0.0014 lower upper Elbow Rotational stiffness of elbows. Frictional moment
limiting value for rotation of elbows. uniform 3.5 7.0 lower upper Should Rotational stiffness of shoulder yokes. Frictional
moment limiting value for rotation of shoulder uniform 12 24 lower upper mat1119 Material of pelvis foam. Scale factor of ordinate
values for all strain rates. uniform 0.0007 0.0013 lower upper damper Rotational damper. Damping moment per pitch
rate. uniform 0.2 1.0 lower upper con5502 Contact steal seat plate to dummy static and
dynamic coefficient of friction uniform 0.05 0.4 lower upper con5514 Contact black rubber mat of seat to back of
dummy static and dynamic coefficient of friction uniform 0.2 0.9 lower upper con5501 Contact of break system in the seat static and
dynamic coefficient of friction uniform 0.01 0.3 lower upper
mat5506 Steel plate of the seat breaking system in the seat scale factor for ordinate values for all strain rates (back frame stiffness)
uniform 0.6 1.0

6th European LS-DYNA Users’ Conference
5.28 5.1.3
lower upper Fric Steel cable friction in the BioRID neck. Coulomb
dynamic friction coefficient. uniform 0.05 1.3 puls1
mean std normal 5.0 0.25
mean std puls2
Acceleration pulse of sled. The variation of the trapezoid pulse is done by the variation of the vertex of the pulse. This variation is observed in the physical tests. normal
5.0 0.05
Table 1: Variation (distribution) of considered variables for the stochastic analysis.
response Description
max_Head_y_angle maximum angle of head rotation
max_T1_y_angle maximum angle of T1 rotation
max_Pelvis_x_accel maximum pelvis x acceleration
min_lower_Neck_y_moment minimum peek value of lower neck y moment
max_lower_Neck_x_force maximum peek value of lower neck x force
NIC Neck Injury Criteria
Table 2: Responses evaluated for the stochastic investigation
Most figures in this section were created by using the software D-SPEX. It is software to explore the design space and to evaluate relationships between variables and responses. Currently, D-SPEX is a stand-alone product from DYNAmore initiated by Audi AG [7], but it will be implemented in LS-OPT. D-SPEX allows the visualization of 2-dimensional curve plots as well as 3-dimensional surface plots. For an n-dimensional problem, where n is the number of design variables and n>2, one or two variables can be selected while the other variables values can be varied by a slider. In addition, it is possible to visualize statistical values like mean values and standard deviations, correlation matrix or ANOVA results.
The idea of a Monte Carlo Analysis is to evaluate the responses at randomly generated sampling points. From the results of these simulations, mean values, standard deviations and other stochastic values can be computed. Here, a Latin Hypercube sampling has been used to generate 200 sampling points. The standard deviation is a measure for the scatter of a random variable around its mean value. The smaller the standard deviation the more values accumulate around the mean value. For the Monte Carlo Analysis of BioRID II, in total 14 variables and 6 responses are considered, thus each simulation point has 20 dimensions.
Example: Normal Distribution (Gauss)

6th European LS-DYNA Users’ Conference
5.1.3 5.29
The mean value is denoted by μ and the standard deviation by σ. If a random variable has a normal distribution, the probability, that the value is between μ-σ and μ +σ is 0.68 = 68% which is represented by the marked area in Fel! Hittar inte referenskälla.Figure 25. The probability that the value is between μ-2σ and μ+2σ is 0.955 = 95.5%.
ANTHILL-PLOTS
In Figure 26 so called “anthill-plots” of the response values for maximum Head y angle, maximum angle of T1 rotation, maximum lower neck x-force and the minimum of lower neck y-moment versus the variables mat1010 and mat1025 are displayed. The solid lines mark the mean values, the dashed lines mark the standard deviations of the variables as well as of the responses.
The torso flesh material (mat1025) has a distinctive influence on the maximum T1 and head rotation. If the stiffness of the material does increase, the maximum rotation of T1 is decreasing and the maximum rotation of the head is increasing. The dependency of the torso flesh material with respect to the maximum T1 and head rotations is clearly seen. The stiffness of the torso flesh is varied by about ±40 %, the resulting variation of the maximum T1 rotation is about ±10 %.
As a general remark, the interpretation of anthill-plots should be performed carefully in case there is more than one significant variable present. The analysis of trends and dependencies might be wrong and misleading due to the multi-dimensionality of the problem.
Figure 25: Density function of probability for normal distribution.
μ+2σ
μ-σ
μ-2σ
μ+σ

6th European LS-DYNA Users’ Conference
5.30 5.1.3
Figure 26: Anthill plot: max_Head_y_angle, max_T1_y_angle, min_lower_Neck_y_-moment and max_lower_Neck_x_force over mat1010 and mat1025 respectively. Solid line: mean value, dashed line: standard deviation.
CORRELATION ANALYSIS
The matrix in Figure 27 shows the coefficients of correlation for all responses with respect to all input variables. If the value of the correlation coefficient is close to one or minus one, the field is marked red and the linear dependency of the response on the variable is significant, if the value is close to zero, the field is marked green and there is no significant relationship of the response with respect to the specific variable. Negative sign means that an increase of the input variable leads to a decrease of the output variable (negative correlation).
As already supposed from the anthill plots, variation of variable mat1025 has the highest influence on the values of the responses max_T1_y_angle and max_Head_y_angle. Also the variable Puls1 is significant with respect to the T1 and head rotations, but its lower compared to the significance of the torso flesh (mat1025). This means, the scatter of max_T1_y_angle and max_Head_y_angle might result from the variation of the pulse in the physical tests.

6th European LS-DYNA Users’ Conference
5.1.3 5.31
Figure 27: Correlation matrix displays significance of input parameters with respect to output values.
A further interesting dependence is the peak value of lower neck y moment. It depends much more on the stiffness of the yellow rubber bumpers (mat1010) than on the black rubber bumpers (mat1011).
STOCHASTIC OF HISTORY PLOTS
In D-SPEX it is possible to display specific curves of all Monte Carlo simulations in one plot. In addition, the value of an input variable can be visualized by coloring of the curves. So, the user can observe trends of the varying curves due to the variation of the selected variable.
Because of the high significance of the torso flesh material (mat1025) in the following some selected history (curve) plots are displayed with respect to the variation of mat1025.
The different colors show the value of the variable mat1025 (torso flesh stiffness) for a specific simulation, but the scatter of the history plots results from the variation of all

6th European LS-DYNA Users’ Conference
5.32 5.1.3
variables. This is again a problem of the multi-dimensionality similar to the interpretation of anthill plots.
Figure 28: Head acceleration [mm/ms2] vs. time [ms]. Left: x-acceleration. Right: z-acceleration.
Figure 29: T1 acceleration [mm/ms2] vs. time [ms].Left: x-acceleration. Right: z-acceleration.
Figure 30: Left: lower Neck x force [kN] vs. time [ms]. Right lower Neck y moment [Nm] vs. time [ms].
6th European LS-DYNA Users’ Conference
5.1.3 5.33
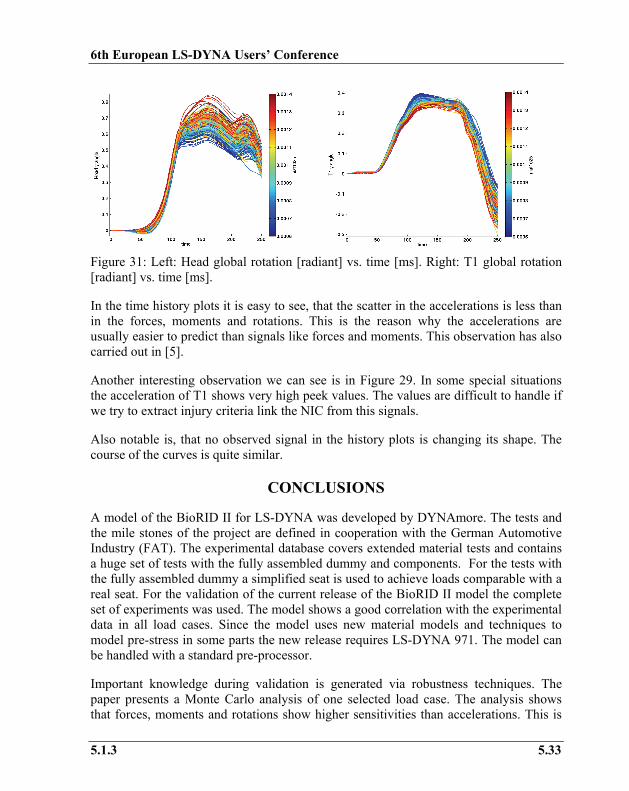
Figure 31: Left: Head global rotation [radiant] vs. time [ms]. Right: T1 global rotation [radiant] vs. time [ms].
In the time history plots it is easy to see, that the scatter in the accelerations is less than in the forces, moments and rotations. This is the reason why the accelerations are usually easier to predict than signals like forces and moments. This observation has also carried out in [5].
Another interesting observation we can see is in Figure 29. In some special situations the acceleration of T1 shows very high peek values. The values are difficult to handle if we try to extract injury criteria link the NIC from this signals.
Also notable is, that no observed signal in the history plots is changing its shape. The course of the curves is quite similar.
CONCLUSIONS
A model of the BioRID II for LS-DYNA was developed by DYNAmore. The tests and the mile stones of the project are defined in cooperation with the German Automotive Industry (FAT). The experimental database covers extended material tests and contains a huge set of tests with the fully assembled dummy and components. For the tests with the fully assembled dummy a simplified seat is used to achieve loads comparable with a real seat. For the validation of the current release of the BioRID II model the complete set of experiments was used. The model shows a good correlation with the experimental data in all load cases. Since the model uses new material models and techniques to model pre-stress in some parts the new release requires LS-DYNA 971. The model can be handled with a standard pre-processor.
Important knowledge during validation is generated via robustness techniques. The paper presents a Monte Carlo analysis of one selected load case. The analysis shows that forces, moments and rotations show higher sensitivities than accelerations. This is

6th European LS-DYNA Users’ Conference
5.34 5.1.3
in accordance with previous observations. In addition, an important result of the example was the high influence of the yellow rubber bumpers on the lower neck moment.
An advanced methodology for stochastic investigations is the Meta-Model-based Monte Carlo approach provided by LS-OPT [8, 9]. It will be used in the future development since it allows a detailed understanding of the model behavior, interactively.
REFERENCES
1. “Whiplash (2004)”, Aspen Opinion, Aspen Re, UK.
2. S. Stahlschmidt, B. Keding, K. Witowski, H. Müllerschön, U. Franz, “BioRID II Dummy Model Development – Stochastic Investigations”, 9th International LS-DYNA Users Conference Detroit USA, 2006.
3. “FAT LS-DNYA BioRID II User’s Manual (2006)”, Version 2.0, DYNAmore GmbH, Stuttgart, Germany.
4. “BioRID II User’s Manual (2002)”, Denton ATD Inc, Rochester Hill, MI, USA.
5. S. Stahlschmidt, B. Keding, U. Franz, A. Hirth, “BioRID II Dummy Model Development – Influence of Parameters in Validation and consumer Tests”, 9th International LS-DYNA Users Conference Detroit USA, 2006.
6. “BioRID IIc Rear Impact Crash Test Dummy”, Robert A. Denton Inc..
7. M. Thiele, H. Müllerschön, M. van den Hove, B. Mlekusch, “Optimization of an Adaptive Restraint System Using LS-OPT and Visual Exploration of the Design Space Using D-SPEX”, 9th International LS-DYNA Users Conference Detroit USA, 2006.
8. N. Stander, W. J. Roux, T. Eggleston, K. J. Craig, “LS-OPT Version 3.1 User’s Manual”, Livermore Software Technology Corporation, March 2006.
9. W. J. Roux, N. Stander, F. Günther, H. Müllerschön, H., “Stochastic analysis of highly nonlinear structures”, International Journal for Numerical Methods in Engineering, Vol. 65:1221-1242, 2006.