DEVELOPMENT OF AN INTERACTIVE COMPUTER ... Documention.pdfDEVELOPMENT OF AN INTERACTIVE COMPUTER...
46
DEVELOPMENT OF AN INTERACTIVE COMPUTER SIMULATION MODEL FOR DESIGNING LAMINATED COMPOSITE PANELS by Qinglin Wu Professor School of Renewable Natural Resources Louisiana State University Baton Rouge, Louisiana September 2005
-
Upload
vuongkhuong -
Category
Documents
-
view
223 -
download
5
Transcript of DEVELOPMENT OF AN INTERACTIVE COMPUTER ... Documention.pdfDEVELOPMENT OF AN INTERACTIVE COMPUTER...

DEVELOPMENT OF AN INTERACTIVE COMPUTER SIMULATION MODEL FOR DESIGNING
LAMINATED COMPOSITE PANELS
by
Qinglin Wu
Professor
School of Renewable Natural Resources
Louisiana State University
Baton Rouge, Louisiana
September 2005

ii
ABSTRACT
Application of computer science in the analysis of industrial data has become
increasingly important in today’s society due to increased complexity of the industrial
processes and high product quality standards required. In particular, computer simulation
of industrial processes has led to improvement in both production efficiency and product
quality.
In this study, an interactive computer software was developed to provide a design
tool for the manufacture of warp-resistant laminated wood composite panels. The
program was based on combing several mathematical theories in predicting material
properties, equilibrium moisture content, transient moisture distribution, and panel
warping. Numerical techniques were used to solve the unsteady state moisture diffusion
equation. The program was capable of creating new panels, searching existing panels in
the database, performing equilibrium and transient warp analysis, and displaying the
results graphically. Four example panels were created and their warping behaviors were
simulated using the program. The program predicted well-expected trends on panel’s
warpage as influenced by layer thickness, orientation, moisture content change, panel
width, and moisture gradient. The software could be a very useful tool for wood
composite laminate manufacturers to produce high quality laminates.
Keywords: database, design, laminated panels, simulation, warping, VB programming

iii
ACKNOELEDGMENTS
The author wishes to thank Dr. Otto Suchsland, Department of Forestry, Michigan
State University, for his cooperative work in this field, and Shivakumar K.
Srinivasamurthy for helping develop the computer code.

iv
Table of Contents
Abstract……………………………………………………………………………………ii
Acknowledgment……………………………..………………………………….……….iii
List of Tables...………………………………………………………………………...….v
List of Figures…...……………………………………………………………….……….vi
Chapter 1. Introduction…………..………………….…………………………………….1
Background………………………………….…………………………………….1
Significance………………………………..………………………………………1
Statement of the Problem…………………….……………………………………2
Objectives of Project………………………………………………………………3
Definition of Terms.…………………………………………….…………………4
Chapter 2. Review of Related Literature…………………...……………………………..5
Chapter 3. Methodology………………….………………...……………………………..8
Moisture Distribution Model………………….…………………………………..8
Warping Model.……………………………….…………………………………11
Material Property Models..………………..…………………………………….14
Program Design..……………………………………………..………………….16
Chapter 4. Program Testing and Results.…………….…………………….…………….36
Chapter 5. Conclusion and Recommendations…………………………….…………….38
References………………………………………………………………….…………….39
Appedices: Source Code………..………………………………………….…………….40
v
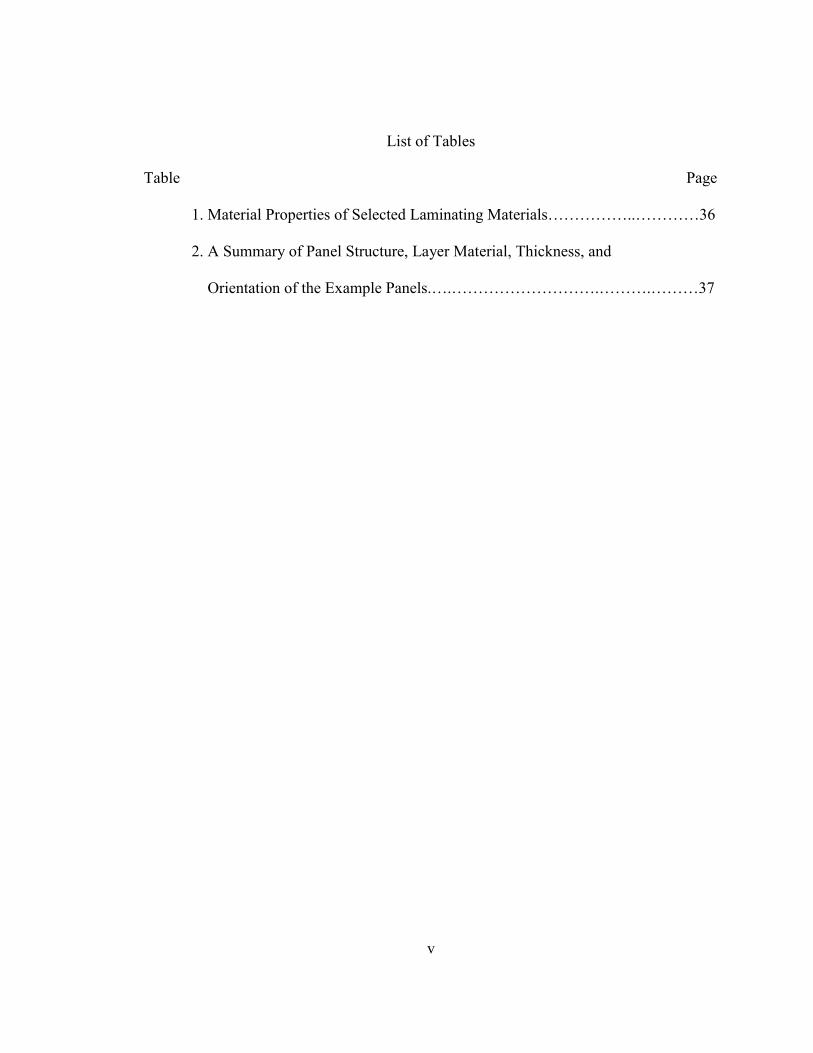
List of Tables
Table Page
1. Material Properties of Selected Laminating Materials……………..…………36
2. A Summary of Panel Structure, Layer Material, Thickness, and
Orientation of the Example Panels.….……………………….……….………37

vi
List of Figures
Figure Page
1. Moisture Distribution Model ………………………………..………………..9
2. Definition of Terms Used in Warp Equation………………………….………12
3. Definition of Center Deflection (B) and Radius of Curvature (R)....……...….12
4. Screen-Shot of the Material Property Form ….……………………….………16
5. Screen-Shot of the Panel Structure Form ….………………………….………17
6. Screen-Shot of the Equilibrium Layer Properties Form ..…………….………18
7. Screen-Shot of EMC Lookup Form ……….………………………….………19
8. Screen-Shot of MOE/EC Lookup Form . ….……………………...….………19
9. Screen-Shot of Equilibrium Analysis Summary Form ….…………….……...20
10. Screen-Shot of Warpage VS Width Analysis Form ………………...………21
11. Screen-Shot of Warpage VS Width Summary Form ……….……….………22
12. Screen-Shot of Warpage VS Thickness Analysis Form………….….………23
13. Screen-Shot of Warpage VS Thickness Summary Form…………….………24
14. Screen-Shot of Warpage VS Orientation Analysis Form .……….….………25
15. Screen-Shot of Warpage VS Orientation Summary Form ……….….………26
16. Screen-Shot of Warpage VS Moisture Content Analysis Form …….………27
17. Screen-Shot of Warpage VS Moisture Content Summary Form ……………28
18. Screen-Shot of Transient Layer Properties Form ………………...….……...29
19. Screen-Shot of The Transient Warp Analysis Form ……………..….………30
20. Screen-Shot of The Transient Warp Analysis Summary Form …..….…...…31
vii
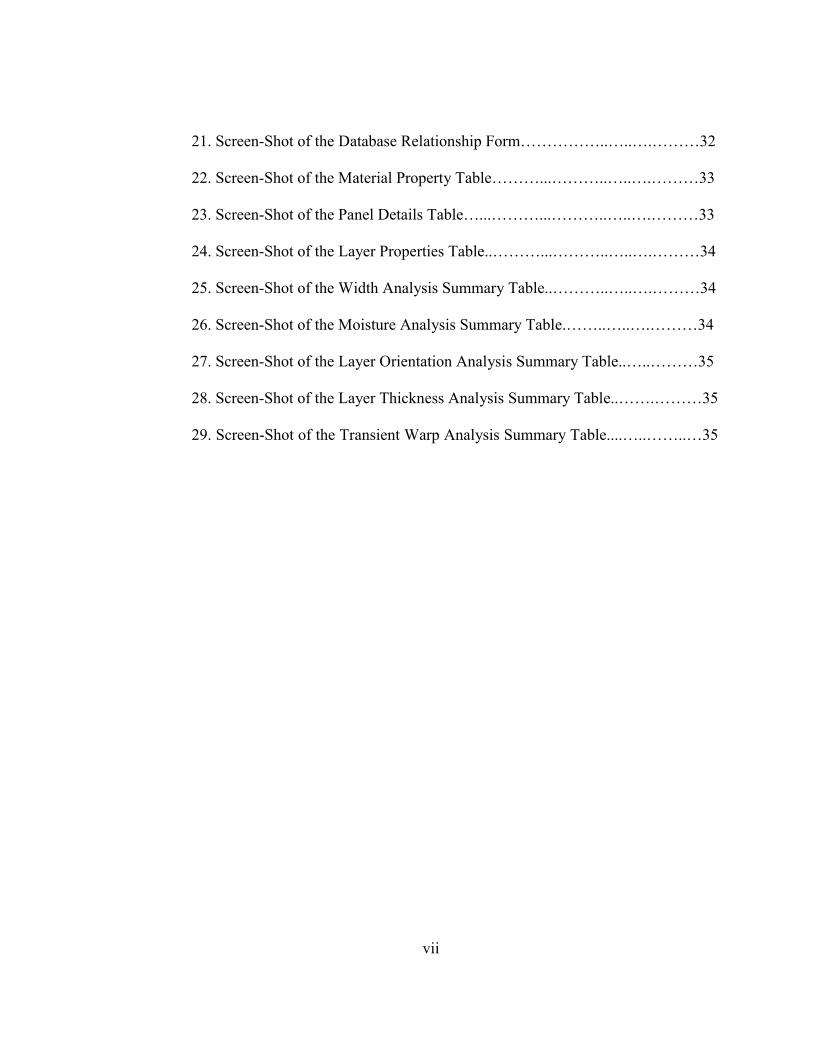
21. Screen-Shot of the Database Relationship Form……………..…..….………32
22. Screen-Shot of the Material Property Table………...………..…..….………33
23. Screen-Shot of the Panel Details Table…...………...………..…..….………33
24. Screen-Shot of the Layer Properties Table..………...………..…..….………34
25. Screen-Shot of the Width Analysis Summary Table..………..…..….………34
26. Screen-Shot of the Moisture Analysis Summary Table.……..…..….………34
27. Screen-Shot of the Layer Orientation Analysis Summary Table..…..………35
28. Screen-Shot of the Layer Thickness Analysis Summary Table..…….………35
29. Screen-Shot of the Transient Warp Analysis Summary Table....…..……..…35

1
CHAPTER 1
Introduction
Background
Application of computer science in the analysis of industrial data has become
increasingly important in today’s society due to increased complexity of the industrial
processes and high product quality standards required. In particular, computer simulation
of industrial processes has led to improvement in both production efficiency and product
quality.
In the field of wood science and technology, many scientists have attempted to
accurately model the performance behavior of laminated wood composite panels, in order
to provide some design guidelines for manufacturing high quality products [Tong and
Suchsland 1993, Xu 1993]. However, the efforts have often been met with frustrations
because of the complexity involved. A large amount of information about the
performance behavior can be obtained by modern computer simulation techniques,
providing valuable information for equipment and process modification and
developments. These assumptions and ideas are the motivation for this study.
Significance
Each year, a tremendous number of wood-based composite panels are produced in
the world to meet the market demand for wood-based furniture [Suchsland and McNatt
1985]. The lamination, which combines different materials in a layered structure as one
solid panel, has been done on a trial-and-error basis. This practice often leads to wastes in
resources and poor product quality. The use of the modern computer simulation

2
technology as outlined in this study allows a quicker and more accurate selection of the
laminated materials. The software developed will provide a training tool for industrial
personnel to better control of the lamination process. This work will lead to increased
production speed and product quality in the furniture industry, and will also advance the
current knowledge in computer simulation technologies.
Statement of the Problem
The wood material industry uses overlaid panels as flat, straight elements in
furniture and cabinet construction [Suchsland and McNatt 1985]. The panels are often in
3-ply or 5-ply construction with a thick core and thin overlays. Occasionally, two-ply
overlaid panels (e.g., particleboard or medium density fiberboard overlaid on the visible
face only) are used for economical reasons. These types of panels sometimes warp
unexpectedly and severely after being assembled, having left the manufacturing plant in a
perfectly flat condition. Such warping cannot be easily corrected by the application of
cleats or other reinforcing members because the forces that cause the warping are of
considerable magnitude. Often the entire panel or the entire product must be replaced
with no real guarantee that the replacement will perform better than the original. Severe
warping of finished products may well damage a company’s reputation and even lead to
lawsuits against the manufacturer.
There is a sound technological basis for such warping to occur. The potential to
warp is often built into the panel during manufacture [Norris 1964]. This potential may
be triggered by changes in the moisture content of the panel components in response to
long-term variations in relative humidity (RH) of the air. There is a need for a scientific

3
understanding of the mechanism of panel warping under service conditions. The reasons
are twofold: (a) to see whether existing lamination practice is as efficient as possible and
(b) to enable the technology to be extended to new products. The efficiency of the
lamination process depends on two opposing economies: (a) the need to reduce operating
costs by keeping production time to a minimum; and (b) the need to prevent wastage
costs being incurred if the product is damaged. An optimum lamination process must be
found which minimizes operating costs without damaging the product.
Determining the optimum lamination design for a given product application is a
matter of significant complexity, requiring fundamental information on how the material
behaves under a dynamic environment. The use of computer simulation technology is a
feasible way to study the complex interaction among many variables that control the
warping process. However, none of the existing simulation models has displayed all
merits in the process analysis. Therefore, the purpose of this study was to develop and
implement a new computational model based on the lamination concepts. The model was
capable of finding the best combination of various materials in terms of their
performance behavior and was implemented into an interactive computer program to
provide a design and training tool for industrial personnel.
Objectives of Project
The following objectives will be achieved in this study:
1. To develop database tables using MS Access for storing physical and
mechanical properties of common lamination materials including wood
veneer, plastic laminates, and wood-based composites;
4
2. To develop a mathematical simulation model for predicting warping behavior
of multi-layer laminated panels;
3. To implement the model in a user-friendly design software using Visual Basic
with graphical interface and MS Access database for dynamic data storage
and exchange; and
4. To apply the software as a design and training tool for the industrial personnel.
Definition of Terms
Diffusion – The process of moisture movement within a piece of wood-based
materials.
Equilibrium Moisture Content (EMC) – Moisture content in wood-based material
reached at a given relative humidity and temperature.
Lamination – Process of combining two or more pieces of sheet materials together
under heat and pressure to form a solid panel.
Linear Expansion (LE) – In-plane swelling of wood-based material over a given
moisture content change expressed as a percentage of the original dimension.
Moisture Content (MC) – The amount of water in wood-based material expressed
as a percentage of dry wood weight.
Modulus of Elasticity – Elastic constant of a wood-based material determined in
bending.

5
CHAPTER 2
Review of Related Literature
Model analysis has been the underlying approach of choice for selecting and
combining various materials to form a solid and warp-resistant panel in composite design
[Norris 1964, Springer 1976, Xu 1993]. In wood science field, several studies have been
conducted to measure and model warping behavior of wood-based laminates.
Heebink and Haskell [1962] measured properties of high pressure laminate (HPL)
materials. This information was later utilized in a follow-up study [Norris 1964] on the
warping of three-ply laminates consisting of HPL face, particleboard, and HPL backer
sheet. There was a fairly good agreement between calculated and measured warping.
Suchsland and McNatt [1985] conducted a comprehensive study on the warping
of laminated panels. Emphasis in this study was on the theoretical evaluations of the
effect of the variability of panel component properties, particularly of those of the face
and back layers of multi-layered laminates on the warping of structurally balanced and
unbalanced panels.
The warping of a veneered cabinet door was analyzed by Suchsland [1990]. By
applying an elastic warping model to the exact construction of the warped door, the
effects of such variables as grain deviation in the veneer layers, species differences, and
veneer thickness differences were investigated. The results showed warping of the same
order of magnitude as that exhibited by the real door. It was also found that warping
caused by imbalances in the panel is an essential prerequisite to the elimination of large
moisture content differences among layers and to the manufacture of stable panels.

6
A study of wood-based composite sheathing materials exposed to fluctuating
moisture conditions was conducted by Hiziroglu and Suchsland [1991]. Elastic analysis
indicated that even moderate moisture content changes in the materials could lead to
bending stresses exceeding the ultimate bending strength. However, the experimental
investigation revealed that these materials are not elastic and that relaxation at high
relative humidity reduces the maximal bending stresses to about 40 to 50 percent of the
bending strength. A buckled oriented Strandboard (OSB) beam does not return to its
original straight configuration upon regaining its initial moisture content, and at the initial
moisture content, the axial stress does not disappear but turns from compression into a
sizable tensile stress.
A study of the warping of overlaid particleboard was conducted by Suchsland et
al. [1993]. These laminates, consisting of different particleboard substrates and of various
types of plastic overlays, both in 2-ply and 3-ply constructions, were exposed to one
moisture cycle, and the warp was measured and also calculated based on elastic
assumptions. Residual warping at the end of the cycle indicated viscoelastic behavior, at
least on the part of the particleboard substrates.
Xu [1993] developed a visco-elastic plate theory, taking into account the effects
of changing moisture contents over time, and applied this theory with good results to the
prediction of the warp of a two-ply yellow-poplar laminate. Tong and Suchsland [1993]
developed a finite element model to predict warping in wood-based products.
Warp may also occur as a consequence of a transient imbalance such as the
development of an unbalanced moisture content gradient (Wu and Suchsland 1996). A

7
study by Suchsland et al. (1993) showed that if overlays are rigid, the transient warp may
not be recovered after eliminating the moisture gradient, and may contribute to
permanent deformation of the panel. Therefore, analysis of the warping problem requires
knowledge not only of the equilibrium moisture content (EMC) corresponding to a given
relative humidity, but also of the time-dependent moisture distribution within the
laminate.
In summary, it can be seen that various approaches have been taken to study the
warping behavior of laminated wood panels. However, the models are often complicated
in nature and are difficult to apply by industrial personnel. Thus, development of user-
friendly computer software implementing various mathematical theories will provide a
useful and convenient tool for designing the products. At the same time, it will help
advance current knowledge on the warping behavior of laminated wood panels.

8
CHAPTER 3
Methodology
The magnitude of warping of a laminated panel is a relatively complex function
of moisture distribution across panel thickness, layer thickness, modulus of elasticity (or
Young’s modulus), moisture expansion, and relative position of the layer in the panel.
Under swelling or shrinking conditions, these variables interact and result in a complex
pattern of warping for a given panel. Thus, simulation of the warping behavior requires a
detailed knowledge of internal moisture distribution and its effect on strength properties
of the material.
Moisture Distribution Model
1. Equilibrium Moisture Content
Layer equilibrium moisture content (EMC) is calculated using the Nelson’s
sorption isotherm [Wu and Suchsland 1996]:
( )
RH
WT R-
A - 1.0 M = EMC
WV LNLN1 [1]
where WW = molecular weight of water (18 1/mole);
R = universal gas constant (1.9858 cal/mole/oK);
T = absolute temperature (oK);
A = natural logarithm of the Gibbs free energy per gram of sorbed
water as RH approaches zero (∆Go, cal/g), i.e. A = LN(∆Go);
MV = material constant which approximates the fiber saturation point
for desorption (%). For a given temperature, the term (-RT/WW) becomes a constant and

9
parameters A and MV define the sorption isotherm. Wu and Suchsland [1996] measured
material constants defining the sorption isotherm (i.e., A and MV).
2. Transient Moisture Distribution
Fick's second law was used to describe the MC distribution inside a multi-ply
laminate (Fig. 1). The laminate consists of the materials that have different sorption and
diffusion characteristics. The one-dimensional form of the equation states:
∂∂
∂∂
∂∂
x M ) Mx, ( D
x =
tM
[2]
where, M = moisture content (%); t = time (hr); x = spatial coordinate starting from one
surface of the laminate (mm) (Fig. 1), and D = diffusion coefficient (mm2/hr), which may
vary with MC and x. The initial and boundary conditions for Equation 2 are:
0 t H = x ) t x, ( EMC = ) t x, ( M
0 t 0 = x ) t x, ( EMC = ) tx, ( M
0 < t H x 0 ) 0 < t x, ( EMC = ) tx, ( M O
≥
≥
≤≤
[3]
where, H is the panel thickness (mm), and EMCO(x, t<0) represents the initial EMCs
across panel's thickness.
At each interface between two adjacent layers of different materials, two
additional conditions must be specified [Springer 1976]. The first is that the rates of
moisture crossing the surfaces of two materials per unit area are equal
∂∂
∂∂
xM D- =
xM D- I I
I 1- I 1- I
1-I
ρρ [4]

10
H H(K)
X
EMC
EMC
LAYER1
2
3
.
K
.
K-1
K
1 2
N-1 N
I-1 I
NODE
I-N-1
Figure 1. Moisture Distribution Model
where ρ is the density at the oven-dry condition (g/mm3), and subscripts I-1 and I refer to
the adjoining regions at the interface (Fig. 1). The second condition is that MCs at the
surfaces of two interfacing materials correspond to the same relative humidity:
) | M( F = RH = ) | M( F I I 1-I 1-I [5]
where F represents the function defined by the right-hand side of Equation 1.
It is noted that at the interface RH is continuous, but MC is discontinuous. For an
isotherm condition, Equation 5 after substituting Equation 5a and replacing EMC with M
becomes:

11
| M A
M MA +
|A|A
- 1.0 | M = | M I V
1-I V I1-I
I 1-I V1-I
[6]
which provides an additional equation for the MCs of two materials at each interface.
Equations 1 to 6 define the entire moisture distribution problem. The Crank-
Nicholson's finite difference method [Crank 1965] was used to transform the differential
equations into a set of algebraic equations, which were solved through matrix operation.
The presence of the interface discontinuity in MC makes the coefficient matrix
asymmetric. A matrix solver based on the LU decomposition procedure [Press et al.
1989] was used to perform the matrix inversion and multiplication.
Warping Model
The equation that predicts the warping (i.e., radius of curvature – Figures 2 and 3)
of a laminated panel upon changes of moisture content and attended expansion or
shrinkage of the various layers is:
∑
∑
∑
∑
∑
∑
∑
∑
−−
−
−−
−
−
=
−
−
−
−
−
n
ii
n
iii
n
iii
n
iiii
n
ii
n
iii
n
iii
n
iii
TE
TE
SSE
SSE
TE
SSE
SSE
SSE
R
1
1
1
21
2
1
21
2
1
1
21
2
1
21
2
1
31
3
)(
)(
2
)(
)(3
)(2
αα [7]
where ∑=n
ii TS1
(Figure 2), αI = expansion value of layer i (in/in), and Ei =modulus of
elasticity of layer i (Psi). The equation reduces the warp of a plate to a one-dimensional

12
T(1)
T(2)
T(3)
T(4)
T(N)
T(N-2)
T(N-1)
T(I)
S(1) S(2)
S(3)
S(N)
Figure 2. Definition of Terms Used in the Warp Equation
B
R
L
Figure 3. Definition of Center Deflection (B) and Radius of Curvature (R) over a given
Span (L) for a Warped Panel

13
situation. It gives the radius of curvature of a laminated beam. To obtain the radius for the
other dimension of a plate, the equation must be applied again with appropriate changes
in the inputs. From the radius of curvature, the center deflection over a given span is
calculated as:
RLB8
2= [8]
where B = center deflection over length L(in) and R = radius of curvature (in).
There are three input variables to the warping equation (Equation 7 or 8): ply
thickness, expansion value, and modulus. Ply thickness is straight forward and strictly a
matter of measurement. The change in thickness with changing moisture content can be
disregarded.
The expansion value is the unrestrained expansion or shrinkage of each layer
when its moisture content changes. This expansion or shrinkage depends on the extent of
the moisture content change and on the sensitivity of each kind of material to such
moisture content changes. The Wood Handbook (1987) list only solid wood shrinkage
values measured in the radial and tangential directions when wood is dried from the green
condition to 0% moisture content. The moisture content range during which shrinkage
occurs is from 30% to 0%. Above 30% (fiber saturation point –FSP), no dimensional
changes take place. The shrinkage is a linear function of the moisture content change so
that the shrinkage value for any given moisture content interval can be calculated as
100FSP
MCa ∆=α [9]
14
where, α = expansion value (in/in), a = total shrinkage value (in/in), ∆MC = moisture
content change (%), and FSP = fiber saturation point (%).
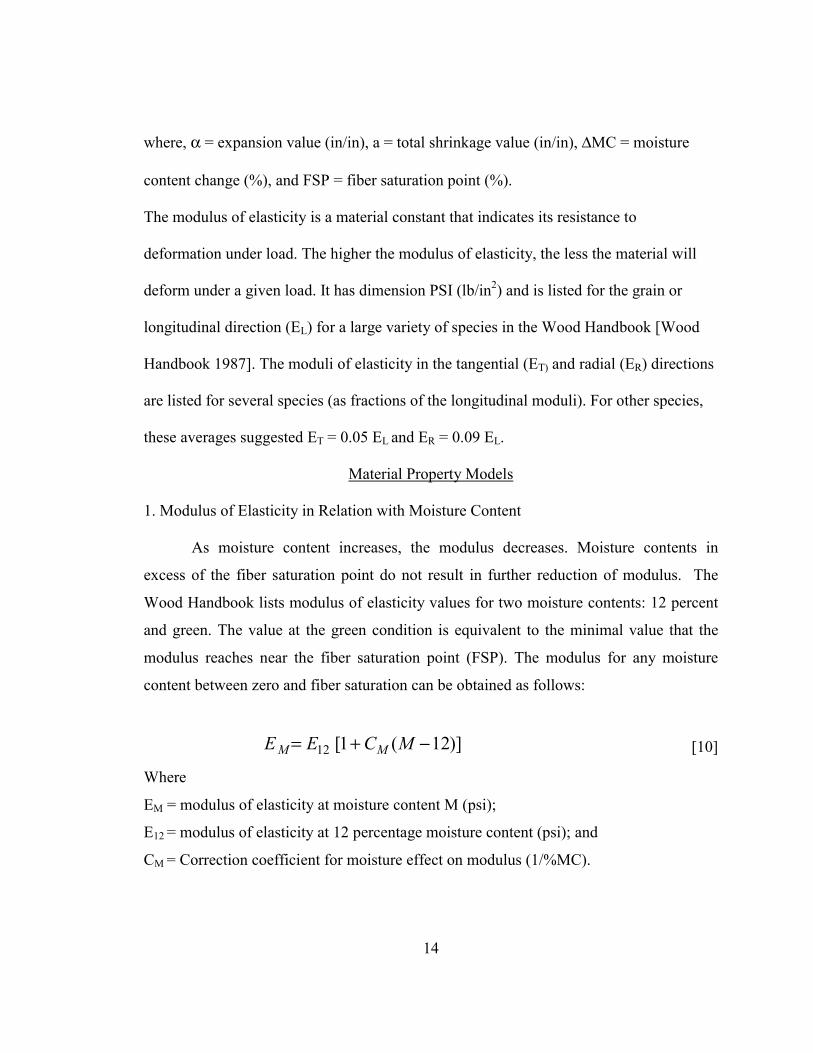
The modulus of elasticity is a material constant that indicates its resistance to
deformation under load. The higher the modulus of elasticity, the less the material will
deform under a given load. It has dimension PSI (lb/in2) and is listed for the grain or
longitudinal direction (EL) for a large variety of species in the Wood Handbook [Wood
Handbook 1987]. The moduli of elasticity in the tangential (ET) and radial (ER) directions
are listed for several species (as fractions of the longitudinal moduli). For other species,
these averages suggested ET = 0.05 EL and ER = 0.09 EL.
Material Property Models
1. Modulus of Elasticity in Relation with Moisture Content
As moisture content increases, the modulus decreases. Moisture contents in
excess of the fiber saturation point do not result in further reduction of modulus. The
Wood Handbook lists modulus of elasticity values for two moisture contents: 12 percent
and green. The value at the green condition is equivalent to the minimal value that the
modulus reaches near the fiber saturation point (FSP). The modulus for any moisture
content between zero and fiber saturation can be obtained as follows:
)]12(1[12 −+= MCEE MM [10]
Where
EM = modulus of elasticity at moisture content M (psi);
E12 = modulus of elasticity at 12 percentage moisture content (psi); and
CM = Correction coefficient for moisture effect on modulus (1/%MC).

15
2. Expansion and Modulus of Elasticity In relation with Gain Deviation
Input for both expansion value and modulus of elasticity must be corrected when
the direction of the grain deviates from the direction in which the warping is calculated.
The deviation from the prefect grain alignment is defined by the angle θ. It is clear that
the expansion value for a given moisture content change in the given direction is larger
than the minimal value associated with the grain direction (longitudinal). Similarly, the
expansion value in the transverse direction is less than the maximum value found in the
direction perpendicular to the grain (radial or tangential). The values for the given
directions must be determined and used as inputs.
The same adjustments must be made for the modulus of elasticity values. In a
given direction the modulus of elasticity is less than the maximum value in the grain
direction and larger than it is in the direction perpendicular to the grain direction (radial
or tangential). The necessary modifications of the input values are obtained by the use of
a Hankinson-type equation for the modulus of elasticity (Wood Handbook 1987) and by a
similar formula for the expansion value:
θθθ 22 ..
.CosESinE
EEE
PL
PL
+= [11]
1])1[(])1[( 22 −+++= θαθααθ CosSin LP [12]
where EL=Longitudinal modulus, αL= Longitudinal expansion, EP = Perpendicular
modulus, and αP = Perpendicular expansion.

16
Program Design
This program uses Visual Basic 6.0 as front end for graphical interface and MS
Access database for storing panel details and layer properties and for accessing them
when required. The main MDI form acts as a container and is also used for navigation to
other forms. This program contains the following VB forms and database tables.
1. VB Program Forms
Material Property Form
This form defines material properties to be used for panel design. New material
can be added to and existing materials can be deleted from database.
Figure 4. Screen-shot of the Material Property Form

17
Panel Structure
This form defines panel structure and basic layer properties including material,
thickness, and grain orientation. For a new panel, panel name, width, and number of
layers are first requested and the data are stored in the database tables. Material, thickness
and grain orientation of each layer are then added to the database table. For an existing
panel, panel name is used to search for the available information in the database. Panel
structure and layer properties can be added, updated, and deleted. Validations (with
warning messages) are performed before entering any data to the database.
Figure 5. Screen-shot of the Panel Structure Form

18
Equilibrium Layer Properties
This form defines layer properties for an existing panel in the database under the
equilibrium RH and temperature conditions given. Thus, it is not allowed to change panel
structure (i.e., name, width, and number of layers) in this form. An existing panel in the
database is searched through panel name. Given the layer ID number, existing layer
properties for the layer in the database is listed in the corresponding text boxes. Two pop-
up forms (EMC Lookup – Figure 7 and MOE/EC Lookup – Figure 8) are provided to
update layer EMC, modulus, and expansion coefficient. A summary popup form
(Summary – Figure 9) is used to provide a summary of the updated panel properties.
Layer properties can be added, updated, and deleted.
Figure 6. Screen-shot of the Equilibrium Layer Properties Form

19
EMC Lookup
Given the material type, which defines the material constants A and MV in
Equation 1 for the layer in the database, initial and final RH, and temperature, Equation 1
is used to calculate layer EMC values. The calculated initial and final EMC values are
returned to the Equilibrium Layer Properties form (Figure 6) through clicking OK button.
The calculated values will not be returned if Quit button is clicked.
Figure 7. Screen-shot of EMC Lookup Form
MOE/EC Lookup
Given the material type, which defines the modulus (MOE) and expansion
coefficient (EC) values in the parallel (i.e., 0 degree grain orientation) and perpendicular
Figure 8. Screen-shot of MOE/EC Lookup Form

20
(i.e., 90 degree grain orientation) directions for the layer in the database, initial and final
moisture contents, and temperature, the current layer modulus is calculated using
Equations 10 and 11 and EC is calculated using Equation 12. The calculated MOE and
EC values are returned to the Equilibrium Layer Properties form (Figure 6) through
clicking OK button. The calculated values will not be returned if the Quit button is
clicked.
Summary
The completed panel properties are summarized in this form (Figure 9). This
allows the user to check if all the information is correct before performing warp analysis.
A return button is provided for the user to return to the Equilibrium Layer Properties
form (Figure 6) after validating the data.
Figure 9. Screen-shot of Equilibrium Analysis Summary Form

21
Warpage VS Width Analysis
This form allows analyzing panel warpage as a function of panel width for an
existing panel with valid layer properties in the database. Given a panel name, a search is
made in the database. If found, panel width, layer ID, and material are listed. An initial
panel shape showing layer arrangements is drawn. The Initial Panel Frame is then
disabled and Warped Panel Frame is enabled. Given a panel width, panel warpage is
calculated using Equation 7 and returned to the textbox. The warped shape is then drawn
showing warping direction. The calculated warpage can be added to a database table
(Add to Table) and plotted as a function of panel width (Summary).
Figure 10. Screen-Shot of Warpage VS Width Analysis Form

22
Warpage VS Width Summary
This form allows listing and plotting calculated panel warpage values as a
function of panel width. The form can be printed. The user can navigate between
Warpage VS Width Analysis Form (Figure 10) and Warpage VS Width Summary Form
(Current) using the Back Button.
Figure 11. Screen-shot of Warpage VS Width Summary Form.

23
Warpage VS Thickness Analysis
This form allows analyzing panel warpage as a function of layer thickness for an
existing panel in the database. Given a panel name, a search is made in the database. If
found, panel width, layer ID, and material are listed. An initial panel shape showing layer
arrangements is drawn. Once a layer is selected from the listbox, the Initial Panel Frame
is then disabled and Warped Panel Frame is enabled. Given a layer thickness, panel
warpage is calculated using Equation 7 and returned to the textbox. The warped shape is
then drawn showing warping direction. The calculated warpage can be added to a
database table (Add to Table) and plotted as a function of layer thickness (Summary).
Figure 12. Screen-Shot of Warpage VS Thickness Analysis Form
24
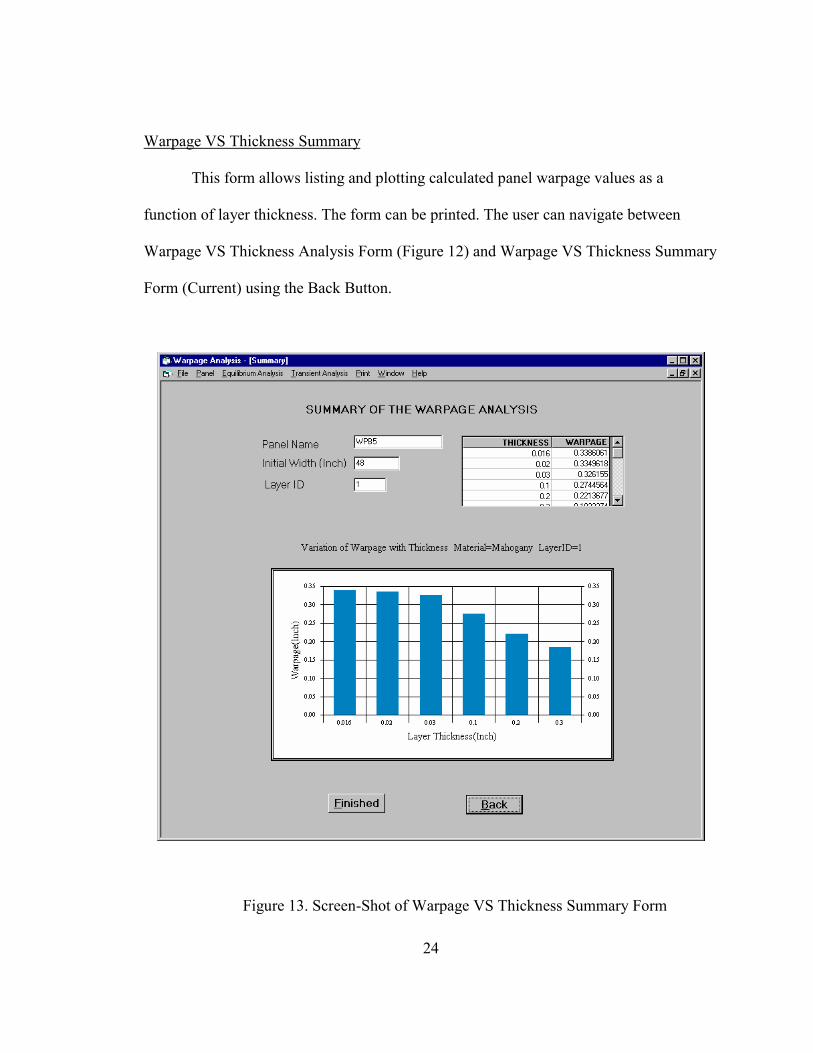
Warpage VS Thickness Summary
This form allows listing and plotting calculated panel warpage values as a
function of layer thickness. The form can be printed. The user can navigate between
Warpage VS Thickness Analysis Form (Figure 12) and Warpage VS Thickness Summary
Form (Current) using the Back Button.
Figure 13. Screen-Shot of Warpage VS Thickness Summary Form

25
Warpage VS Orientation Analysis
This form allows analyzing panel warpage as a function of layer orientation for an
existing panel in the database. Given a panel name, a search is made in the database. If
found, panel width, layer ID, and material are listed. An initial panel shape showing layer
arrangements is drawn. Once a layer is selected from the listbox, the Initial Panel Frame
is then disabled and Warped Panel Frame is enabled. Given a grain angle, panel warpage
is calculated using Equation 7 and returned to the textbox. The warped shape is then
drawn showing warping direction. The calculated warpage can be added to a database
table (Add to Table) and plotted as a function of layer orientation (Summary).
Figure 14. Screen-Shot of Warpage VS Orientation Analysis Form

26
Warpage VS Orientation Summary
This forms allows listing and plotting calculated panel warpage values as a
function of layer orientation. The form can be printed. The user can navigate between
Warpage VS Orientation Analysis Form (Figure 14) and Warpage VS Orientation
Summary Form (Current) using the Back Button.
Figure 15. Screen-Shot of Warpage VS Orientation Summary Form
27
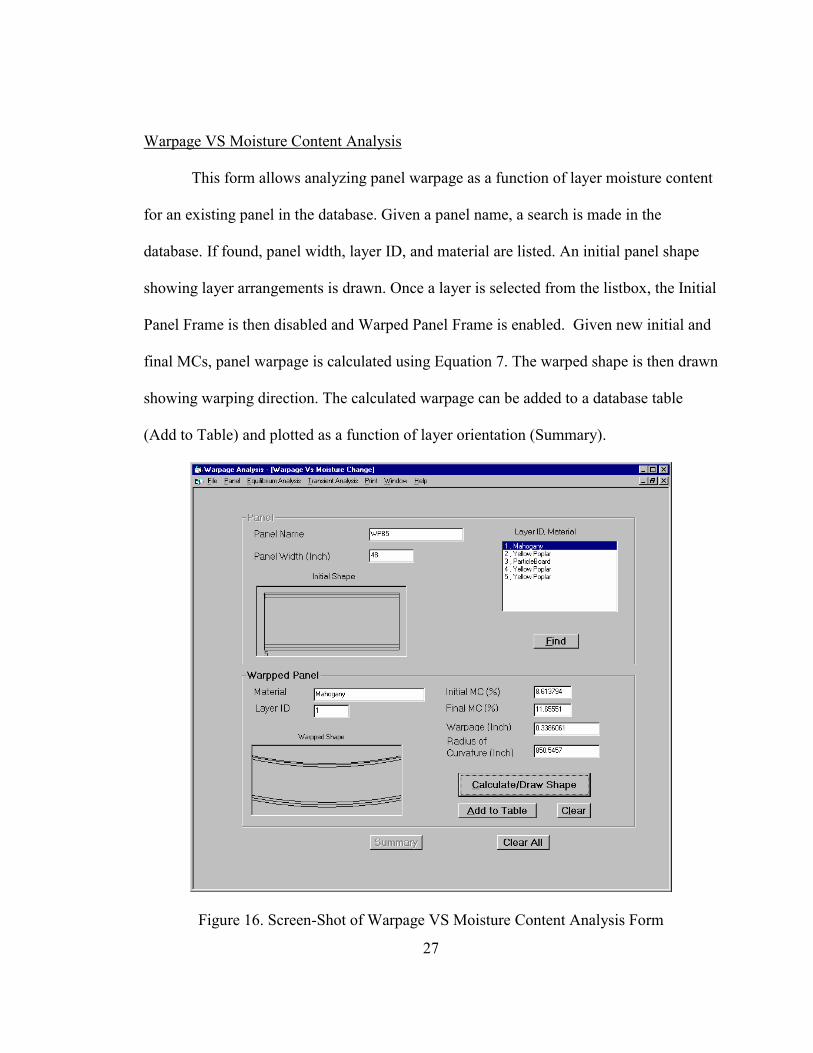
Warpage VS Moisture Content Analysis
This form allows analyzing panel warpage as a function of layer moisture content
for an existing panel in the database. Given a panel name, a search is made in the
database. If found, panel width, layer ID, and material are listed. An initial panel shape
showing layer arrangements is drawn. Once a layer is selected from the listbox, the Initial
Panel Frame is then disabled and Warped Panel Frame is enabled. Given new initial and
final MCs, panel warpage is calculated using Equation 7. The warped shape is then drawn
showing warping direction. The calculated warpage can be added to a database table
(Add to Table) and plotted as a function of layer orientation (Summary).
Figure 16. Screen-Shot of Warpage VS Moisture Content Analysis Form

28
Warpage VS Moisture Content Summary
This forms allows listing and plotting calculated panel warpage values as a
function of layer moisture content change. The form can be printed. The user can
navigate between Warpage VS Orientation Analysis Form (Figure 16) and Warpage VS
Orientation Summary Form (Current) using the Back Button.
Figure 17. Screen-Shot of Warpage VS Moisture Content Summary Form

29
Transient Layer Properties
This form allows performing transient moisture and warp analysis for an existing
panel in the database. Given a panel name, a search is made in the database. If found,
panel width, layer ID, and material are listed. The panel frame is disabled. Initial
Equilibrium Conditions, Final Conditions, and Transient Layer Properties Frames are
enabled. Initial and final RH and temperature conditions are then requested. Note that it is
Figure 18. Screen-shot of Transient Layer Properties Form

30
allowed using different final exposure conditions for the two panel surfaces. Given a time
to perform analysis, internal moisture distribution is calculated based on theories outlined
under Moisture Distribution Model. Database tables defining various material parameters
for each layer are used in the calculation. The layer mean moisture content, modulus, and
expansion coefficient are then calculated and returned to the listbox.
Transient Warp Analysis
A popup form (Figure 19 – Transient Warp Analysis) is used to perform warp
analysis. Panel name, width, number of layers, and layer properties are listed in the form
Figure 19. Screen-shot of The Transient Warp Analysis Form

31
for validation purpose. The time at which analysis is done and actual warpage values are
listed, which can be added to a database table for plotting. The user can return to the
transient layer properties form by clicking the Return button.
Transient Warp Summary
This form is used to plot transient warp as a function of time for the given panel.
Figure 20. Screen-shot of The Transient Warp Analysis Summary Form

32
2. Relational Database for Data Access and Data Storage
Relation database used for Warpage analysis is shown in Figure 21. Most of the
tables have one-to-many relationships maintaining referential integrity. Panel name has
one-to-many relationship (i.e., modifying the panel name in the Panel Structure Form
changes the panel name in all the other forms). The same applies for deletion of a panel.
This database employs referential integrity. In some tables, two fields are taken as the
primary key.
Figure 21. Screen-shot of the Database Relationship

33
3. Access Database Tables
There are 8 MS Access tables for storing material properties, panel name and
structure, and calculated results.
Material Properties
This table contains layer material properties. New material can be added to the
table and existing material can be deleted from the table.
Figure 22. Screen-shot of the Material Properties Table
Panel Details
This table contains panel name, width, and number of layers.
Figure 23. Screen-shot of the Panel Details Table

34
Layer Properties Table
This table contains layer ID, material type, panel name, thickness, and orientation
for all existing panels in the database.
Figure 24. Screen-shot of the Layer Properties Table
Width Analysis Summary Table
This table contains information from panel width analysis. The data are used for
run-time plotting. After exiting the program, the data are deleted.
Figure 25. Screen-shot of the Width Analysis Summary Table
Layer Moisture Analysis Summary Table
This table contains information from layer moisture content change analysis. The
data are used for run-time plotting. After exiting the program, the data are deleted.
Figure 26. Screen-shot of the Layer Moisture Analysis Summary Table

35
Layer Orientation Analysis Summary Table
This table contains information from layer orientation change analysis. The data
are used for run-time plotting. After exiting the program, the data are deleted.
Figure 27. Screen-shot of the Layer Orientation Analysis Summary Table
Layer Thickness Analysis Summary Table
This table contains information from layer thickness change analysis. The data are
used for run-time plotting. After exiting the program, the data are deleted.
Figure 28. Screen-shot of the Layer Thickness Analysis Summary Table
Transient Warp Analysis Summary Table
This table contains information from transient warp analysis. The data are used
for run-time plotting. After exiting the program, the data are deleted.
Figure 29. Screen-shot of the Transient Warp Analysis Summary Table

36
CHAPTER 4
Program Testing and Results
1. Material Properties
Layer material properties for the selected laminating materials are summarized in
Table 1. The properties are included in the database tables so that they can be accessed
during program running.
Table 1. Material Properties of Selected Laminating Materials.
Modulus (1000 PSI)
Expansion Coefficient
(In/In/%MC)
Sorption Isotherm
Parameters
Material
Type
Density (g/In3)
Par1 Per2 Par1 Per2 A Mv
Diffusion Coefficient
(In2/hr)
Mahogany 8.19 1,500 65 0.00007 0.0027 5.02 27.1 0.00279 Yellow Poplar
6.88 1,580 69 0.00007 0.0027 5.02 27.1 0.00279
Particleboard 10.49 300 300 0.00053 0.00053 5.15 22.9 0.000465 Particleboard
Face 12.29 425 425 0.00053 0.00053 5.11 23.1 0.000155
Particleboard Core
8.69 212 212 0.00053 0.00053 5.23 23.2 0.000775
HPL Face 24.59 2,227 1,560 0.00075 0.00125 5.17 11.4 0.0000233 HPL Back 19.67 2,284 1,514 0.00040 0.00055 5.66 12.6 0.0000341
1 Parallel Direction 2 Perpendicular Direction
2. Example Panels
Four example panels were created using the materials listed in Table 1 to test the
program (Table 2). These panels represent real commercial laminated wood-based panels
used by the furniture manufacturers.

37
Table 2. A Summary of Panel Structure, Layer Material, Thickness, and Orientation of the Example Panels.
Layer Orientation (degree)
Panel Type
Layer
ID
Layer
Material
Layer Thickness
(Inch) Parallel Perpendicular
1 Mahogany 0.016 0 90 2 Yellow Poplar 0.031 90 0 3 Particleboard 0.500 0 90 4 Yellow Poplar 0.031 90 0
1) Five-Layer Particleboard Wood Laminate (WPB5)
5 Yellow Poplar 0.031 0 90 1 Particleboard Face 0.187 0 90 2 Particleboard Core 0.375 0 90
2) Three-Layer Particleboard (PB3) 3 Particleboard Face 0.187 0 90
1 HPL Face 0.050 0 90 2 Particleboard Face 0.187 0 90 3 Particleboard Core 0.375 0 90
3) Four-Layer Particleboard HPL Laminate (PBHPL4) 4 Particleboard Face 0.187 0 90
1 HPL Face 0.050 0 90 2 Particleboard Face 0.187 0 90 3 Particleboard Core 0.375 0 90 4 Particleboard Face 0.187 0 90
4) Five-Layer Particleboard HPL Laminate (PBHPL5)
5 HPL Back 0.020 0 90 3. Typical Results
Typical results showing panel warpage as function of panel width, layer thickness,
layer orientation, and layer moisture content change under equilibrium conditions are
shown in Figures 11, 13, 15, and 17 respectively. Typical results showing panel warpage
as a function of time under transient moisture conditions are shown in Figure 19. The
predicted trends compared well with results from other related studies. Thus, the software
could be a very useful tool for wood composite laminate manufacturers to produce high
quality laminates.
38
CHAPTER 5
Conclusions and Recommendations
In this study, an interactive computer software was developed to provide a design
tool for the manufacture of warp-resistant laminated wood composite panels. The
program was based on combing several mathematical theories in predicting material
properties, equilibrium moisture content, transient moisture distribution, and panel
warping. Numerical techniques were used to solve the unsteady state moisture diffusion
equation. The program was capable of creating new panels, searching existing panels in
the database, performing equilibrium and transient warp analysis, and displaying the
results graphically. Four example panels were created and their warping behaviors were
simulated with the program. The program predicted well-expected trend on panel’s
warpage as influenced by layer thickness, orientation, moisture content change, panel
width, and moisture gradient. The software could be a very useful tool for wood
composite laminate manufacturers to produce high quality laminates.
Testing and verification of the program with additional laminates will be the next
step for improving the capability of the software. Immediate goals will be set to develop
additional panels with different materials for the analysis.
39
References
1. Crank, J. 1965. Mathematics of diffusion. Oxford University Press. London. 346 pp. 2. Wood Handbook. 1987. Agriculture Handbook No.72. USDA Forest Service. pp 466. 3. Heebink, B.C., and H. H. Haskell. 1962. Effect of heat and humidity on the properties
of high pressure laminates. Forest Products J. 20(11):542-548. 4. Hiziroglu, S.S., and O. Suchsland. 1991. Level of bending stresses in buckled
sheathing composites. Forest Products J. 41(2):58-62. 5. Norris, C.B. 1964. Warpage of laminated materials due to change in moisture content
or temperature. USDS Forest Service. Res. Note FPL-073. 6. Press, W.R., B.P. Flannery, S.A. Teukolsky, and W.T. Vetterling. 1989. Numerical
recipes. Cambridge University Press, New York, NY. 818 pp. 7. Springer, G. S. 1976. Moisture content of composites under transient conditions. J.
Composite Materials 11:107-122. 8. Suchsland, O.1990. Estimating the warping of veneered furniture panels. Forest
Products J. 21 (9): 90-96. 9. Suchsland, O., and J.D. McNatt, 1985. On the warping of laminated wood panels.
Michigan State Univ. East Lansing, MI. pp 120. 10. Suchsland, O., and H. Xu. 1989. On the measurement of linear expansion of
particleboard and medium density board. For. Prod. J.39 (6): 39-42. 11. Suchsland, O., Y. Feng, and D. Xu. 1993. The warping of laminated particleboard.
Wood Science Series, No. 4. Department of Forestry, Michigan State University. East Lansing, MI.
12. Tong, Y., and O. Suchsland. 1993. Application of finite element analysis to panel
warping. Holz ais Roh- und Werkstoff 51:55-57. 13. Wu, Q., and O. Suchsland. 1996. Prediction of moisture content and moisture
gradient of an overlaid particleboard. Wood and Fiber Science 28(2):227-239. 14. Xu, H. 1993. Application of a linear visco-ealstic plate theory on hygroscopic
warping of laminates. Ph.D dissertation. Department of Forestry, Michigan State University, East Lansing, MI.


![Qinglin Yang Qingkui Zeng arXiv:2110.11646v1 [cs.CR] 22 ...](https://static.fdocuments.us/doc/165x107/620f3df0c5dea80dec76c63b/qinglin-yang-qingkui-zeng-arxiv211011646v1-cscr-22-.jpg)