Development of an Illumination Identification System for the AIBO … · Development of an...
51
Development of an Illumination Identification System for the AIBO Robot By Michael Simon Zehmeister BComp A dissertation submitted to the School of Computing in partial fulfilment of the requirements for the degree of Bachelor of Computing with Honours (November, 2005)
Transcript of Development of an Illumination Identification System for the AIBO … · Development of an...
Development of an Illumination
Identification System for the
AIBO Robot
By
Michael Simon Zehmeister BComp
A dissertation submitted to the
School of Computing
in partial fulfilment of the requirements for the degree of
Bachelor of Computing with Honours
(November, 2005)

II
Declaration
This thesis contains no material which has been accepted for the
award of any other degree or diploma in any tertiary institution, and to
my knowledge and belief, this thesis contains no material previously
published or written by another person except where due reference is
made in the text of the thesis:
………………………………
Michael Zehmeister
III
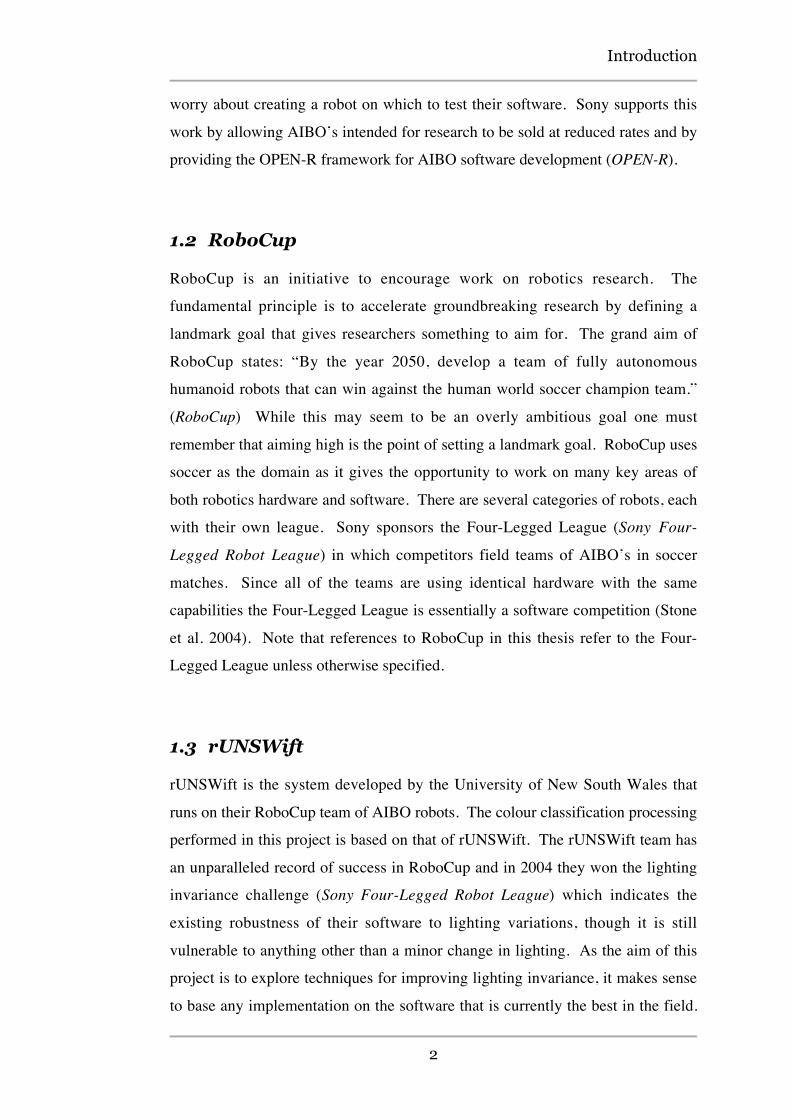
Abstract
The Four Legged League is a division of the RoboCup initiative that
uses Sony AIBO robots to further robotics research. Most
participants implement vision systems that use the colour of objects to
perform identification. Calibration of the colour classification system
must be done manually and any changes to the lighting of the
environment after calibration reduces the accuracy of the system,
often to a point at which the robot is effectively blind.
This study investigates the relationships in the colour data of image
pixels between different lighting conditions in an effort to identify
trends that can be used as the basis of a rule-based system. The aim
of the system is to identify the current lighting level as one of a set of
known conditions.
The proposed system uses the colour data of image pixels and
information about the AIBO’s location and orientation to identify
lighting levels, allowing a vision system to switch to an appropriate
pre-configured calibration.

IV
Acknowledgments
Firstly, I would like to thank my supervisor Byeong Ho Kang who
made this project possible and provided guidance when I most needed
it.
Thanks to Todd Walker, whom I have never met, for building the field
that was essential to this project.
I want to thank my friends and family for the love and support they
have shown me this year and every year, I am incredibly lucky to have
you all in my life.
Many thanks go out to my girlfriend Sarah who keeps me sane and
simply makes me a better person. You are far more important to me
than I ever imagined someone could be.
Last but definitely not least, I have to thank my fellow computing
honours students. They are far and away the reason that this has been
the single best and most enjoyable year of education in my life. I have
made friends this year that I hope will be with me for a long time to
come.

V
Table of Contents
1 INTRODUCTION....................................................................................................................... 1
1.1 AIBO.................................................................................................................................... 1
1.2 ROBOCUP ............................................................................................................................. 2
1.3 RUNSWIFT........................................................................................................................... 2
2 VISION ......................................................................................................................................... 4
2.1 THE YUV COLOUR SPACE................................................................................................... 4
2.2 COLOUR SEGMENTATION..................................................................................................... 4
2.3 LIGHTING VARIANCE ........................................................................................................... 6
2.4 COLOUR CONSTANCY .......................................................................................................... 7
2.5 EXISTING WORK .................................................................................................................. 9
2.5.1 Automating Calibration................................................................................................ 10
3 METHODOLOGY.................................................................................................................... 12
3.1 AIMS ................................................................................................................................... 12
3.2 THE SOFTWARE.................................................................................................................. 13
3.2.1 Overview ....................................................................................................................... 13
3.2.2 Colour Classification ................................................................................................... 14
3.2.3 Image Sequence Processing......................................................................................... 16
3.3 THE ENVIRONMENT ........................................................................................................... 17
3.3.1 The Field ....................................................................................................................... 18
3.3.2 Lighting Conditions...................................................................................................... 18
3.3.3 The Camera .................................................................................................................. 19
3.4 IMAGE ACQUISITION .......................................................................................................... 19
3.5 DATA STUDY...................................................................................................................... 22
4 RESULTS ................................................................................................................................... 24
4.1 TRENDS............................................................................................................................... 24
4.1.1 U & V Channels............................................................................................................ 24
4.1.2 Y Channel...................................................................................................................... 25
4.2 DIRECT IMAGE COMPARISONS........................................................................................... 29
4.3 LOCATION RESTRICTED IMAGES ....................................................................................... 33
4.3.1 Location 1 ..................................................................................................................... 33
4.3.2 Location 2 ..................................................................................................................... 35
4.4 DISCUSSION........................................................................................................................ 38
5 CONCLUSION & FURTHER WORK .................................................................................. 41
6 REFERENCES .......................................................................................................................... 43

VI
List of FiguresFIGURE 3.1 RANDOM IMAGES IN THE SAME LIGHTING CONDITION....................................................... 20
FIGURE 3.2 IDENTICAL IMAGES IN BRIGHT, NORMAL AND DIM LIGHTING CONDITIONS....................... 21
FIGURE 3.3 LOCATION RESTRICTED IMAGE SEQUENCE......................................................................... 21
FIGURE 3.4 THE FIELD IS DIVIDED UP INTO A 4X4 GRID WITH EACH DISTINCT LOCATION HAVING
EIGHT POSSIBLE ORIENTATIONS................................................................................................... 22
FIGURE 3.5 THE LOCATIONS AND ORIENTATIONS OF THE TESTED IMAGE SEQUENCES ........................ 22
FIGURE 4.1 AVERAGED U & V CHANNEL VALUES FOR IMAGE SEQUENCES IN EACH LIGHTING
CONDITION.................................................................................................................................... 25
FIGURE 4.2 AVERAGED Y CHANNEL VALUES FOR GREEN CLASSIFIED PIXELS OF IMAGE SEQUENCES
IN EACH LIGHTING CONDITION..................................................................................................... 26
FIGURE 4.3 AVERAGED Y CHANNEL VALUES FOR ALL PIXELS OF IMAGE SEQUENCES IN EACH
LIGHTING CONDITION................................................................................................................... 26
FIGURE 4.4 MEAN Y CHANNEL VALUES FOR GREEN PIXELS OF INDIVIDUAL IMAGES IN EACH
SEQUENCE..................................................................................................................................... 27
FIGURE 4.5 INTER-QUARTILE MINIMUM Y CHANNEL VALUES FOR GREEN PIXELS OF INDIVIDUAL
IMAGES IN EACH SEQUENCE ......................................................................................................... 28
FIGURE 4.6 MEAN Y CHANNEL VALUES FOR ALL PIXELS OF INDIVIDUAL IMAGES IN EACH SEQUENCE
...................................................................................................................................................... 28
FIGURE 4.7 INTER-QUARTILE MINIMUM Y CHANNEL VALUES FOR ALL PIXELS OF INDIVIDUAL
IMAGES IN EACH SEQUENCE ......................................................................................................... 29
FIGURE 4.8 MEAN Y CHANNEL VALUES FOR GREEN PIXELS IN THE IDENTICAL IMAGE SEQUENCES ... 30
FIGURE 4.9 INTER-QUARTILE MINIMUM Y CHANNEL VALUES FOR GREEN PIXELS IN THE IDENTICAL
IMAGE SEQUENCES ....................................................................................................................... 31
FIGURE 4.10 MEAN Y CHANNEL VALUES FOR ALL PIXELS IN THE IDENTICAL IMAGE SEQUENCES...... 32
FIGURE 4.11 INTER-QUARTILE MINIMUM Y CHANNEL VALUES FOR ALL PIXELS IN THE IDENTICAL
IMAGES SEQUENCES ..................................................................................................................... 32
FIGURE 4.12 INTER-QUARTILE MAXIMUM Y CHANNEL VALUES FOR ALL PIXELS IN THE IDENTICAL
IMAGE SEQUENCES ....................................................................................................................... 33
FIGURE 4.13 UNIQUE Y CHANNEL VALUES OF GREEN PIXELS IN LOCATION 1 SEQUENCES................. 34
FIGURE 4.14 INTER-QUARTILE MAXIMUM Y CHANNEL VALUES FOR ALL PIXELS IN LOCATION 1
SEQUENCES................................................................................................................................... 35
FIGURE 4.15 UNIQUE Y CHANNEL VALUES OF GREEN PIXELS IN LOCATION 2 SEQUENCES................. 36
FIGURE 4.16 INTER-QUARTILE MINIMUM Y CHANNEL VALUES FOR ALL PIXELS IN LOCATION 2
SEQUENCES................................................................................................................................... 37
FIGURE 4.17 MEAN Y CHANNEL VALUES FOR ALL PIXELS IN LOCATION 2 SEQUENCES ...................... 38

Introduction
1
1 Introduction
Computer vision is a continually expanding area of research and one of the
biggest emerging fields of research related to vision processing is robotics.
Research into this area has accelerated with the RoboCup initiative. While
research into robot vision is not lacking there is still a lot of room for
improvement in many areas. The particular focus area of computer vision
research that this thesis is concerned with is colour-based vision systems using
low-quality cameras, specifically in the domain of the AIBO robot in the Four-
Legged League. The problem that this thesis attempts to solve is that of lighting
changes rendering colour calibrations inaccurate and effectively blinding systems
that rely on identifying objects by colour. While the area of direct application is
on the AIBO in the RoboCup domain the work is applicable in any area that uses
colour-vision in a situation in which lighting changes may occur.
1.1 AIBO
Sony’s AIBO entertainment robot (AIBO) has the primary purpose of being an
extremely impressive toy. It is the most advanced robot marketed to the public
for entertainment purposes. The AIBO is a quadruped robot dog. It is capable of
impressive degrees of movement and as such is able to perform tasks such as
sitting up, walking and pushing a ball. AIBO features many sensors though the
main source of input is the CCD camera mounted at the front. The AIBO has
been very popular despite its hefty price tag.
The AIBO has an additional usage in that it serves as an excellent common
platform for robotics research. AIBO provides researchers with a fully featured
robot that can be used for research into many areas of robotics. This allows
computer scientists to do work on robotics software systems without having to
Introduction
2
worry about creating a robot on which to test their software. Sony supports this
work by allowing AIBO’s intended for research to be sold at reduced rates and by
providing the OPEN-R framework for AIBO software development (OPEN-R).
1.2 RoboCup
RoboCup is an initiative to encourage work on robotics research. The
fundamental principle is to accelerate groundbreaking research by defining a
landmark goal that gives researchers something to aim for. The grand aim of
RoboCup states: “By the year 2050, develop a team of fully autonomous
humanoid robots that can win against the human world soccer champion team.”
(RoboCup) While this may seem to be an overly ambitious goal one must
remember that aiming high is the point of setting a landmark goal. RoboCup uses
soccer as the domain as it gives the opportunity to work on many key areas of
both robotics hardware and software. There are several categories of robots, each
with their own league. Sony sponsors the Four-Legged League (Sony Four-
Legged Robot League) in which competitors field teams of AIBO’s in soccer
matches. Since all of the teams are using identical hardware with the same
capabilities the Four-Legged League is essentially a software competition (Stone
et al. 2004). Note that references to RoboCup in this thesis refer to the Four-
Legged League unless otherwise specified.
1.3 rUNSWift
rUNSWift is the system developed by the University of New South Wales that
runs on their RoboCup team of AIBO robots. The colour classification processing
performed in this project is based on that of rUNSWift. The rUNSWift team has
an unparalleled record of success in RoboCup and in 2004 they won the lighting
invariance challenge (Sony Four-Legged Robot League) which indicates the
existing robustness of their software to lighting variations, though it is still
vulnerable to anything other than a minor change in lighting. As the aim of this
project is to explore techniques for improving lighting invariance, it makes sense
to base any implementation on the software that is currently the best in the field.
Introduction
3
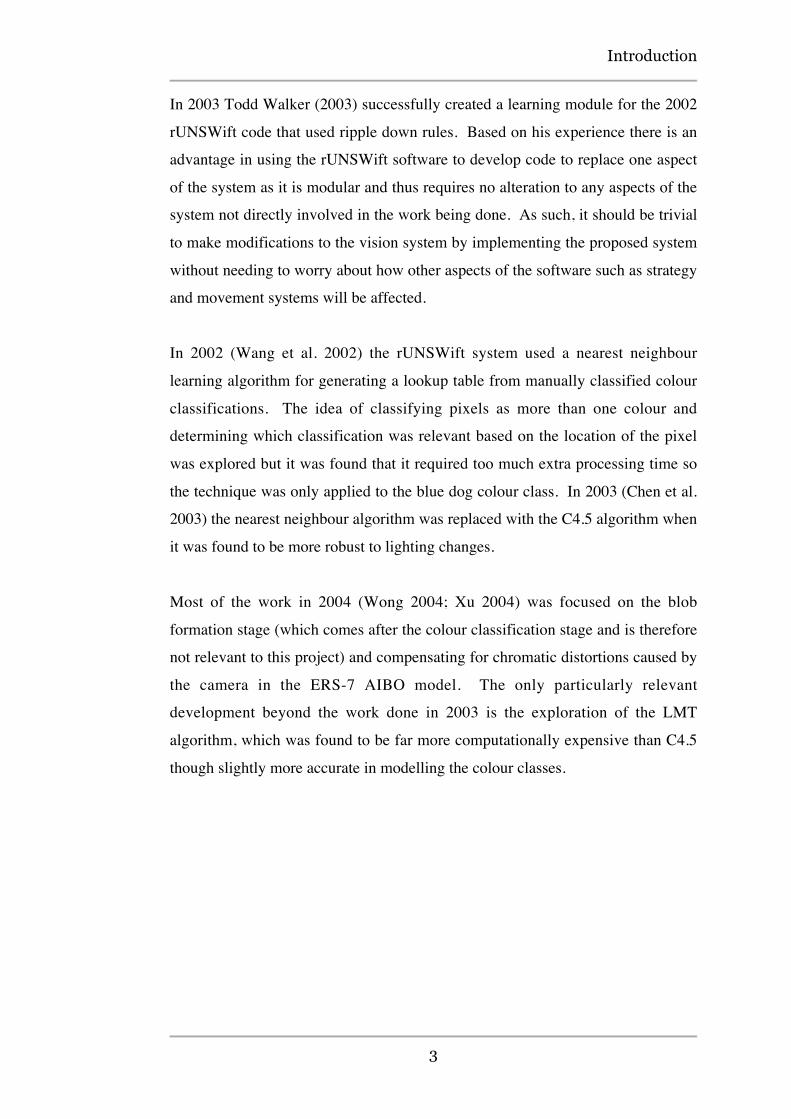
In 2003 Todd Walker (2003) successfully created a learning module for the 2002
rUNSWift code that used ripple down rules. Based on his experience there is an
advantage in using the rUNSWift software to develop code to replace one aspect
of the system as it is modular and thus requires no alteration to any aspects of the
system not directly involved in the work being done. As such, it should be trivial
to make modifications to the vision system by implementing the proposed system
without needing to worry about how other aspects of the software such as strategy
and movement systems will be affected.
In 2002 (Wang et al. 2002) the rUNSWift system used a nearest neighbour
learning algorithm for generating a lookup table from manually classified colour
classifications. The idea of classifying pixels as more than one colour and
determining which classification was relevant based on the location of the pixel
was explored but it was found that it required too much extra processing time so
the technique was only applied to the blue dog colour class. In 2003 (Chen et al.
2003) the nearest neighbour algorithm was replaced with the C4.5 algorithm when
it was found to be more robust to lighting changes.
Most of the work in 2004 (Wong 2004; Xu 2004) was focused on the blob
formation stage (which comes after the colour classification stage and is therefore
not relevant to this project) and compensating for chromatic distortions caused by
the camera in the ERS-7 AIBO model. The only particularly relevant
development beyond the work done in 2003 is the exploration of the LMT
algorithm, which was found to be far more computationally expensive than C4.5
though slightly more accurate in modelling the colour classes.

Vision
4
2 Vision
The AIBO’s camera is its primary source of information about its environment
and as such, all of the higher-level systems such as strategy formation depend on
it. Unfortunately the camera used in the AIBO is of rather low quality (McMahan
& Bunting 2002). When coupled with the limited processing power of the AIBO
the options for vision processing are limited. Any processing of images from the
camera really needs to occur in real-time for the AIBO to function suitably in a
soccer game. The AIBO takes thirty pictures per second with its camera so
ideally any vision system should operate fast enough to process each image before
the next one is taken. The vision system is responsible for enabling the robot to
recognize objects such as the ball, beacons, goals and other robots (Zrimec &
Wyatt 2002). The information from the vision system is used for localisation and
is the basis of any decisions made by the system.
2.1 The YUV Colour Space
The colour space used in the focus domain is the YUV colour space. YUV
separates the colour data into the Y channel, which represents luminance
(perceived as brightness) and the U and V channels, which represent the colour
data in the form of blue and red chromacity. The AIBO delivers images in YUV
format.
2.2 Colour Segmentation
Almost all of the vision systems developed for the Four-Legged League employ
colour classification as the primary low-level vision function to identify objects
such as the ball or goals. RoboCup uses a standard set of colours for identifying
objects in the league. The ball is orange, the goals are yellow etc. The size and
shape of objects are also kept consistent. Colour vision systems firstly must

Vision
5
classify all relevant pixels into one of a discrete number of colour classes (Bruce
et al. 2000). That is to say that all of the pixels making up the ball must be
classified as ‘orange’. This process is known as colour segmentation. The aim of
colour segmentation is to extract one segment for each visible object of the
current scene to aid in further processing (Bandlow et al. 2000).
While the particulars can vary most RoboCup teams use colour lookup tables to
classify colour in images. This lookup table is used to classify the colours in an
image for segmentation. The next step is for the vision system is to take these
segments of known colours and form blobs which shape recognition algorithms
can further process for object recognition (Wang et al. 2002).
With some exceptions (Jungel 2004; Jungel et al. 2004; Mayer et al. 2002;
Walker 2003) the general procedure for creating a colour lookup table involves
manual calibration using offline tools. Many images are taken with the AIBO’s
camera of the important objects such as the ball, goals and marker beacons. These
images are manually classified by humans and the results of the manual
classification are fed into an algorithm that generates the colour lookup table (Xu
2004). Ideally, the lookup table will be accurate enough to automatically classify
colours with a high degree of accuracy. The algorithm is necessary due to the fact
that the manual classification actually covers very little of the total YUV colour
space directly so other values must be mapped given what information there is
(Sridharan & Stone 2005). The lookup table is static and cannot be re-calculated
on the AIBO due to hardware limitations.
An alternative to using an algorithm such as nearest neighbour to generate a static
lookup table is colour space thresholding. Instead of the arbitrary shapes
generated by the nearest neighbour algorithm or other similar processes colour
space thresholding defines colours as rectangular blocks in the YUV colour space
(Bruce et al. 2000). The advantage of this is that modifications can be made on
the AIBO during runtime so that the colour table can be adjusted during a soccer
game. This method is not as accurate and can have trouble with colours that are
close together in the colour space (such as orange and yellow) but the argument is

Vision
6
that as they can be adapted without manual recalibration then it should be possible
to overcome this limitation (Jungel et al. 2004).
2.3 Lighting Variance
One of the biggest problems facing vision system development is the issue of
lighting. Vision systems based on colour classification almost always rely on
consistent lighting to function properly, this is because changes in lighting can
significantly change the way that the robot perceives colours (Mayer et al. 2003).
The set of YUV values represented by an image of a ball will be different to
another image of the same ball taken under different lighting conditions. The
problem with this is that if the light changes enough so the lookup table is no
longer sufficiently accurate then the robot will no longer be able to correctly
classify colours and will therefore be unable to recognize objects.
The YUV colour space has some inherent resistance to changes in illumination
due to the nature of the channels that make up the colour space. The Y channel
represents the luminance and as such, it is heavily influenced by lighting changes.
The U and V channels represent the chromacity and are comparatively unaffected
by the lighting changes (Bandlow et al. 2000). Unfortunately simply ignoring the
Y channel will not provide an accurate enough solution across all lighting
conditions.
As the vast majority of implemented AIBO vision systems use static lookup tables
they are unable to adjust for changing light conditions. This means that the vision
system needs to be manually recalibrated when the lighting conditions change.
This is time consuming and does nothing for the problem of lighting conditions
changing during a game (Zrimec & Wyatt 2002). Currently RoboCup uses
consistent lighting conditions to avoid problems though uncontrollable factors
such as audiences still have an adverse effect on vision performance (Chen et al.
2003). There is also a move to have RoboCup use less consistent lighting
conditions to force researchers to solve the problem of lighting variance. One of
the challenges at the 2004 RoboCup was a lighting invariance challenge designed

Vision
7
to see which teams vision system was the most resistant to the adverse effects of
changing light conditions (Technical Challenges for the RoboCup 2004 Legged
League Competition 2004).
There are three main directions that can be taken when it comes to producing a
vision system with the aim of suitable illumination invariance. Firstly one can
aim to create a system that can either dynamically adjust the lookup table to
account for lighting variations (Jungel et al. 2004). Secondly there is the option
of using some sort of test to estimate the levels of lighting and switch to the best
of a number of static lookup tables (Sridharan & Stone 2005). Finally the third
option is to simply try and optimise the single static lookup table to be as robust
as possible to lighting variations (Rofer et al. 2004). Each of these approaches
has advantages and disadvantages. The goal is to achieve the optimal balance
between performance and accuracy. It must also be remembered that even if a
vision system is able to adjust for illumination changes over time or is inherently
unaffected by such changes there needs to be some ability to handle localised
illumination variations from elements such as shadows and specular highlights.
2.4 Colour Constancy
One heavily researched area of computer vision is colour constancy. The
principle idea of colour constancy is that it should be possible to determine the
lighting factors of an image and identify the true colour of any object despite the
effects of the lighting conditions (Barnard et al. 1997). One of the main problems
with colour constancy is the fact that there are factors that affect images beyond
the illumination such as the properties of the camera used (Barnard 1999). This
problem is lessened in the RoboCup domain due to the consistent use of identical
hardware on all AIBO’s but it cannot be discounted entirely, for example the
ERS-7 model AIBO has known issues with the camera that produces chromatic
distortions around the edges of images (Xu 2004).
The human vision system has constant colour. Even though lighting changes the
colour of objects our brain processes the image and we see the colours as
Vision
8
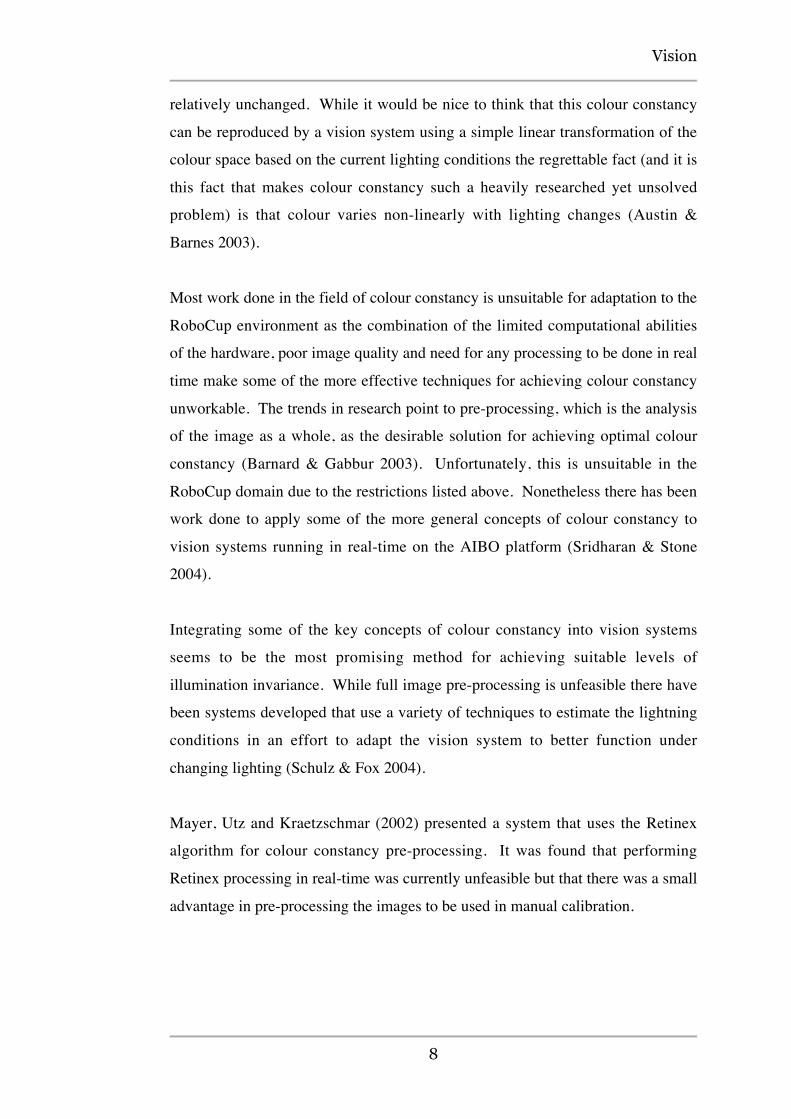
relatively unchanged. While it would be nice to think that this colour constancy
can be reproduced by a vision system using a simple linear transformation of the
colour space based on the current lighting conditions the regrettable fact (and it is
this fact that makes colour constancy such a heavily researched yet unsolved
problem) is that colour varies non-linearly with lighting changes (Austin &
Barnes 2003).
Most work done in the field of colour constancy is unsuitable for adaptation to the
RoboCup environment as the combination of the limited computational abilities
of the hardware, poor image quality and need for any processing to be done in real
time make some of the more effective techniques for achieving colour constancy
unworkable. The trends in research point to pre-processing, which is the analysis
of the image as a whole, as the desirable solution for achieving optimal colour
constancy (Barnard & Gabbur 2003). Unfortunately, this is unsuitable in the
RoboCup domain due to the restrictions listed above. Nonetheless there has been
work done to apply some of the more general concepts of colour constancy to
vision systems running in real-time on the AIBO platform (Sridharan & Stone
2004).
Integrating some of the key concepts of colour constancy into vision systems
seems to be the most promising method for achieving suitable levels of
illumination invariance. While full image pre-processing is unfeasible there have
been systems developed that use a variety of techniques to estimate the lightning
conditions in an effort to adapt the vision system to better function under
changing lighting (Schulz & Fox 2004).
Mayer, Utz and Kraetzschmar (2002) presented a system that uses the Retinex
algorithm for colour constancy pre-processing. It was found that performing
Retinex processing in real-time was currently unfeasible but that there was a small
advantage in pre-processing the images to be used in manual calibration.
Vision
9
2.5 Existing Work
Murch and Chalup (2004) implemented a vision system that combined colour
classification with edge detection to improve the recognition of objects. While
the technique proved effective in that it improved the performance of sub-
optimally calibrated lookup tables it had a serious problem in that motion blur on
images taken when the AIBO was moving its head rendered the edge detection
algorithm ineffective. There are also issues with partially obscured objects and
the problem of false edges being found.
Jungel et al. (2004) use an interesting technique for updating a dynamic colour
cube for use as a lookup table. Essentially the colour space is divided up into
rectangles by setting thresholds for each colour class, the unique part is that
instead of static thresholds all of the colour classes are defined by their relation to
the colour class ‘green’. The ‘green’ colour class can be defined dynamically
because it is known that pixels just below the white border are green. As the
‘green’ colour class is updated, all of the other colour classes are updated due to
their relation to green. It was found that the shifts were consistent enough among
the different colour classes to make this process yield fairly accurate results in
changing light. While the reduced accuracy is made up for by the simplicity of
the system and the removal of the need for manual calibration there are problems
with colours that have comparatively small differences between each other such
as orange and yellow. The authors propose compensating for this by using
alternate methods to identify problem colours. While this work does not provide
a solution in and of itself it does give credence to the idea of utilising the colour
shift of one colour class due to lighting changes to determine the colour shift of
other classes. Further work by Jungel (2004) shows that the technique used to
determine the ‘green’ colour class can be used to determine other colours based
on assumptions about the environment and that it can be adapted into a system
that generates a lookup table dynamically during a soccer game.
In Towards Illumination Invariance in the Legged League, Sridharan and Stone
(2004) present a promising technique that involves using a set of three colour
cubes; one calibrated for light conditions, one for dark conditions and one for

Vision
10
conditions of intermediate illumination. By using the KL-divergence algorithm
the system is able to detect which lookup table is best suited for the current
conditions and the robot is able to switch between the three calibrations
accordingly. (Sridharan & Stone 2005) details the application of this technique
into a complete vision system in the RoboCup domain. While there is a delay in
the system switching to the optimal colour cube, this can be generally accepted
since static systems would cease to function altogether. While there is room for
improving the method of illumination detection the idea of switching between
several pre-calibrated sets of colour space data would seem to deliver the lighting
invariance of a dynamic system but with the accuracy of a manually configured
static colour lookup table.
Lenser and Veloso (2003) use a mathematical algorithm to detect changes in
illumination over time. They implement a system that uses this detection
algorithm to switch between several sets of pre-calibrated vision thresholds. This
method is similar to that implemented by Sridhan and Stone (it also pre-dates that
work) but using a different method of detecting the illumination and thus which
set of colour table data to use.
2.5.1 Automating Calibration
Quinlan et al. (2003) demonstrate a technique using Support Vector Machines to
improve the quality of manually generated lookup tables and reduce the time it
takes to create them. While there is evidence that the technique can speed up the
process of manual calibration and make the lookup table more robust in terms of
lighting invariance, it does not help with lighting changes significant enough to
cause a substantial shift of the colour classes in the colour space.
Zrimec and Wyatt (2002) use machine learning to train the vision system to
recognize objects with the aim of producing a system that automates much of the
calibration of a colour vision system. With enough training, it is theorized that
the system should be able to do a complete calibration automatically without the
need for some of the images to be classified manually. While this seems
promising in making the manual calibration process easier (and eventually

Vision
11
unnecessary) it does not help the issue of lighting variations during a game as the
process can not be performed on the AIBO due to hardware restraints.

Methodology
12
3 Methodology
3.1 Aims
The primary aim of this project is to determine if it is possible to develop a system
that can identify lighting conditions based on the YUV data of image pixels. The
first step involves creating a system that takes in an image or sequence of images
as input and processes them with the intent of providing meaningful information
about how lighting conditions affect the colour classification process and the
YUV data of pixels. The desired result was to figure out a way to use the raw
colour data of the image pixels to reliably indicate a change in lighting conditions.
The image processing software was implemented in Java for reasons of
convenience and compatibility. Some of the code was based on offline colour
calibration tools that form part of the rUNSWift 2004 RoboCup system and as
these were written in Java it made sense to also create the implementation system
in Java. The nature of the software as an offline analysis tool also means that the
system does not need to run on the AIBO platform itself.
Two methods of image processing were tested. The first is to process only the
pixels that the colour classification (which has been calibrated for the normal
condition – see section 3.3.2) process classifies as green. The reason green is
used is because it is the only colour that can be relied on to be present in the vast
majority of images. The expectation is that in the normal condition for which the
lookup table has been calibrated the most pixels will be correctly classified and
that in other lighting conditions fewer pixels will be classified, as the calibration
has been rendered inaccurate by the unfamiliar conditions. By comparing the data
for the pixels classified green in each condition it should be possible to see
variations between lighting conditions in the data of what pixels are classified.
For example, if an image in the normal lighting condition has 90% of the green
pixels correctly classified but an image in the bright condition only has 20% of
the pixels correctly classified then there should be some reliable trend in the data
Methodology
13
of the 20% of pixels that can be used to create a rule identifying the bright
lighting condition.
The second method will be to simply look at the YUV data of all pixels in the
image regardless of the results of the colour classification process. This method is
less reliable as there are no constraints (other than those inherent in the domain) to
limit what pixels are processed. That said there is a good chance that patterns
may be visible between lighting conditions in the Y channel data due to its very
nature as a representation of the brightness of a colour.
3.2 The Software
3.2.1 Overview
When the user opens an image in the software it is displayed in a window. Upon
opening a calibration file the user can toggle the display between the original
image and the colour-classified image. The software also allows the user to save
the classified version of the image.
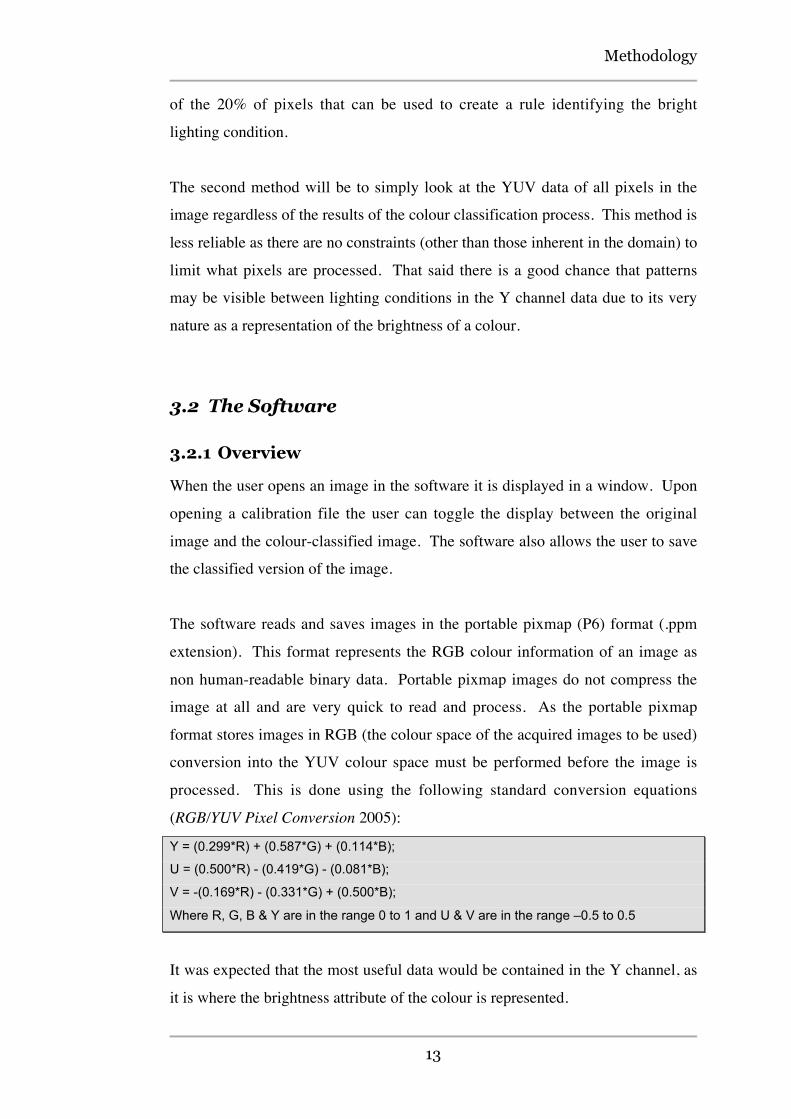
The software reads and saves images in the portable pixmap (P6) format (.ppm
extension). This format represents the RGB colour information of an image as
non human-readable binary data. Portable pixmap images do not compress the
image at all and are very quick to read and process. As the portable pixmap
format stores images in RGB (the colour space of the acquired images to be used)
conversion into the YUV colour space must be performed before the image is
processed. This is done using the following standard conversion equations
(RGB/YUV Pixel Conversion 2005):
Y = (0.299*R) + (0.587*G) + (0.114*B);
U = (0.500*R) - (0.419*G) - (0.081*B);
V = -(0.169*R) - (0.331*G) + (0.500*B);
Where R, G, B & Y are in the range 0 to 1 and U & V are in the range –0.5 to 0.5
It was expected that the most useful data would be contained in the Y channel, as
it is where the brightness attribute of the colour is represented.
Methodology
14
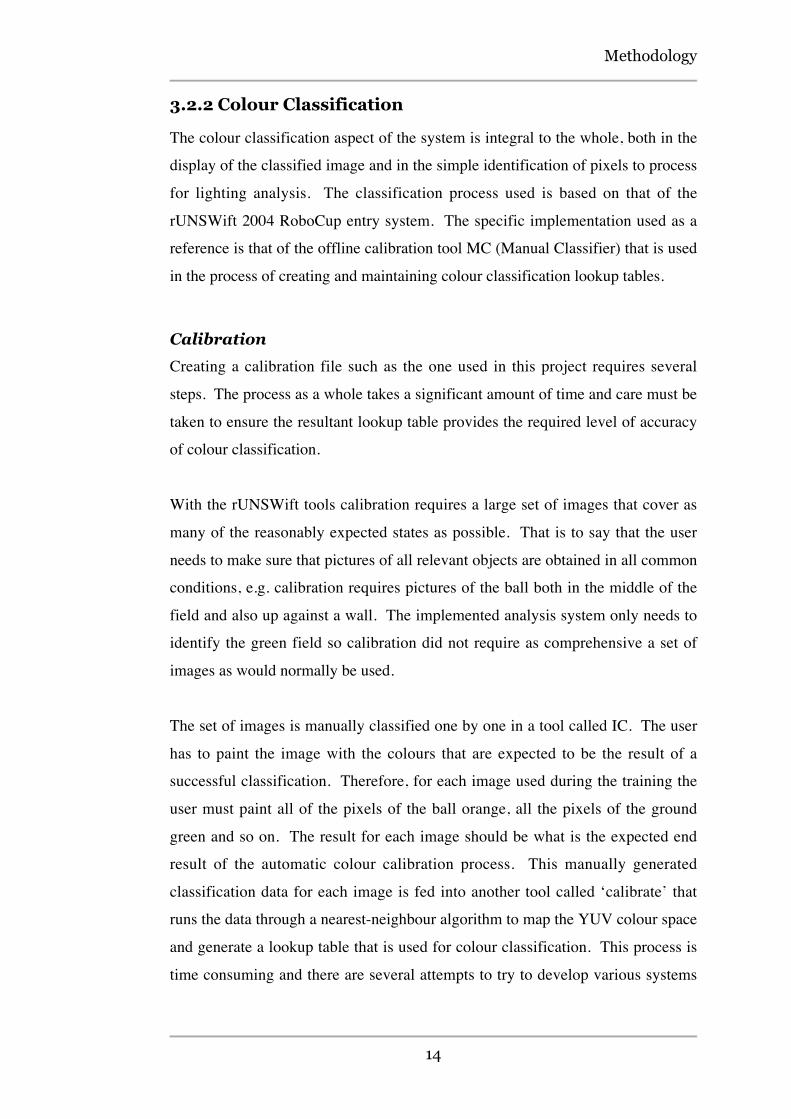
3.2.2 Colour Classification
The colour classification aspect of the system is integral to the whole, both in the
display of the classified image and in the simple identification of pixels to process
for lighting analysis. The classification process used is based on that of the
rUNSWift 2004 RoboCup entry system. The specific implementation used as a
reference is that of the offline calibration tool MC (Manual Classifier) that is used
in the process of creating and maintaining colour classification lookup tables.
Calibration
Creating a calibration file such as the one used in this project requires several
steps. The process as a whole takes a significant amount of time and care must be
taken to ensure the resultant lookup table provides the required level of accuracy
of colour classification.
With the rUNSWift tools calibration requires a large set of images that cover as
many of the reasonably expected states as possible. That is to say that the user
needs to make sure that pictures of all relevant objects are obtained in all common
conditions, e.g. calibration requires pictures of the ball both in the middle of the
field and also up against a wall. The implemented analysis system only needs to
identify the green field so calibration did not require as comprehensive a set of
images as would normally be used.
The set of images is manually classified one by one in a tool called IC. The user
has to paint the image with the colours that are expected to be the result of a
successful classification. Therefore, for each image used during the training the
user must paint all of the pixels of the ball orange, all the pixels of the ground
green and so on. The result for each image should be what is the expected end
result of the automatic colour calibration process. This manually generated
classification data for each image is fed into another tool called ‘calibrate’ that
runs the data through a nearest-neighbour algorithm to map the YUV colour space
and generate a lookup table that is used for colour classification. This process is
time consuming and there are several attempts to try to develop various systems
Methodology
15
that either simplify or take the place of this standard method. (Quinlan et al.
2003; Zrimec & Wyatt 2002)
Once a calibration file is created in the above-described manner the user can still
tweak the calibration to account for anomalies and missed colours. Using the
program MC a user can open an image and MC classifies the colours in the same
way that the AIBO vision system does during operation. By selecting a pixel the
user can override that colour in the lookup table and set its classification.
Once a calibration is created it acts as a simple lookup table for the vision system.
It is done this way simply for reasons of speed. The calibration table is loaded
into an array that has a length equal to the number of unique YUV values.
Normally the values for the Y, U & V channels range from 0 to 255 but to reduce
the file size the rUNSWift system creates a calibration based on the channels
having a range of 0 to 128. This lowers the resolution of the calibration in that
each entry in the table accounts for eight different YUV values. While this means
that the calibration is not as accurate as possible, the very nature of the colour
classification process renders this inaccuracy more than tolerable. If one YUV
value is classified as blue then the chances are very much in favour of the
neighbouring YUV values also being blue.
The lookup table used for this study was calibrated for the ‘normal’ lighting
condition as described in section 3.3.2. It should be noted that the calibration was
focused primarily on accurately classifying the field green colour class, as this is
the area of interest. As such, the calibration used does not do a very good job of
identifying other colours such as the orange of the ball and the blue of the goal.
This has no effect on the results as either processing is done on only the green
classified pixels or all pixels regardless of classified colour.
Classification
Like rUNSWift, the system uses an array of length 2097152 (128*128*128). The
calibration table is loaded into this array. To classify a colour the YUV values are

Methodology
16
used to refer to one of the elements in the array, the element will contain a number
representing the colour that the YUV value is classified as.
The system uses this process for two purposes. Firstly, it allows the user to view
the colour-classified version of an image. This is important for assessing the
quality of a classification. Normally the quality of the vision system colour
classification is determined by the standard of the object recognition but as the
system consists of only the lowest level of the vision system, the user must assess
the quality of the classification visually.
The second purpose for the colour classification process of the system is to allow
us to process colour data based upon the results of classification. Specifically it is
possible to look at the YUV data for the pixels that the system has classified as a
certain colour and analyse how the data changes in different lighting conditions.
3.2.3 Image Sequence Processing
The primary function of the software is to take input in the form of image
sequences and provide output in the form of meaningful information about the
YUV data of the pixels specified. It is possible to make the program analyse and
output information about all pixels or limit the analysis to one or more specific
colour classes.
Image processing simply starts with the currently open image and continues to
process images until the end of the sequence. There is a requirement that the
images be numbered sequentially though it is possible to set the increment
number if required. Optionally the user can elect to have the system save the
colour-classified version of each image as the system processes the image
sequence.
Output
The output of the system is in the form of CSV (Comma-Separated Values) files
that can be imported into any standard spread sheet software for analysis. Results

Methodology
17
of the processing for each image form one row. The cells of the row contain
statistics about the processed pixels of said image. The complete list and format
of output statistics is as follows:
Image Name | Number of Processed Pixels | Number of Unique YUV values | Number of
Unique Y values | Mean Y Value | Minimum Y value | Maximum Y value | Range of Y
values | Mode Y value | Median Y value | Standard Deviation of Y values | Inter-quartile
Mean Y value | Inter-quartile Minimum Y value | Inter-quartile Maximum Y value | Inter-
quartile Range of Y values
Image Name | Number of Processed Pixels | Number of Unique YUV values | Number of
Unique U values | Mean U Value | Minimum U value | Maximum U value | Range of U
values | Mode U value | Median U value | Standard Deviation of U values | Inter-quartile
Mean U value | Inter-quartile Minimum U value | Inter-quartile Maximum U value | Inter-
quartile Range of U values
Image Name | Number of Processed Pixels | Number of Unique YUV values | Number of
Unique V values | Mean V Value | Minimum V value | Maximum V value | Range of V
values | Mode V value | Median V value | Standard Deviation of V values | Inter-quartile
Mean V value | Inter-quartile Minimum V value | Inter-quartile Maximum V value | Inter-
quartile Range of V values
3.3 The Environment
The results of the data study are very much dependant on many real-world
conditions. The results of the image processing and thus any conclusions drawn
from it will vary to some degree with any changes to the environment in which
the images taken for the study are acquired. This variable environment aspect of
the domain has two major implications; firstly, that any conclusions drawn about
the feasibility of constructing a rule-based system must be mindful of the fact that
alterations to environmental conditions may affect said system. Secondly, that
repetition of the study would require careful recreation of the conditions to
achieve analogous results. To that end this section details the conditions in which
the images for the data study were taken.
Methodology
18
3.3.1 The Field
The field on which the images for the study were taken is the same field that was
built and used by Todd Walker for his thesis project (Walker 2003). The field
meets the RoboCup specifications for dimensions and colour scheme but is only
half of a whole field due to limitations in the availability of resources and physical
space. The field serves the purposes of this study well enough though there is
only one goal (which is blue).
3.3.2 Lighting Conditions
The lighting conditions are of the utmost import as the entire project is a study of
the effects of differing lighting conditions. The field is set up in a computer
laboratory; the room has windows on two sides, one set facing outside and the
other facing the main corridor of the building. As such while ambient light was
minimized as much as possible it could not be entirely eliminated. To attempt to
avoid the effect of the uncontrolled natural light on any results as much as
possible all image sequences were taken at approximately the same time of day
with all blinds in the room closed.
The study compares the YUV information of processed images in three distinct
lighting conditions: bright, normal and dim. The lights in the networks laboratory
are standard overhead fluorescent lights. As such, there is no control in terms of
dimming the lights but the room does have two light switches, each controlling
half of the lights. The bright condition has both sets of fluorescent lights on. The
normal lighting condition has only the lights in the half of the room in which the
field is located on so that the light is directly overhead. The dim condition has
only the lights in the other half of the room on. This situation is not ideal as the
dim condition results in slightly uneven lighting due to some shadowing along
one wall of the field but this was deemed acceptable as preliminary examination
of images in each lighting condition showed otherwise even lighting with a
discernable difference in overall brightness. The lookup table used for colour
classification was calibrated for the normal condition.

Methodology
19
While it is not expected that the lighting conditions could be exactly recreated in a
different location with a different field this fact does nothing to invalidate any
findings. The aim is to show whether a system can be created to discern lighting
conditions based on YUV data and not that any such system will work in all
environments and conditions. Issues of adapting the proposed system to different
environments and conditions are discussed in section 4.4.
3.3.3 The Camera
The number of images required for the study in addition to the amount of control
needed over certain image sequences meant that using the AIBO itself to take
pictures would have been impracticable. Issues such as lack of a viewfinder, low
battery-life and memory limitations as well as the sheer amount of time it would
take to capture hundreds of images required an alternative for taking the images to
be used for the study.
The device used was a Canon A75 digital camera. The main reason for using this
particular model was that it has full manual control over all settings, which
allowed for the closest approximation possible of the AIBO camera. The smallest
pictures that could be taken were 640x480 so they had to be shrunk to 176x132
before processing. Sequences of images were taken using the camera’s drive
mode, which continuously takes pictures while the button is held down. The
camera settings used were:
• ISO speed: 400
• Aperture: F2.8
• Shutter speed: 1/25
3.4 Image Acquisition
For the purposes of the study, three main types of image sequences were taken.
The first type is sequences that consist of a large number of random images, all in
the same lighting condition (Figure 3.1).

Methodology
20
Figure 3.1 Random images in the same lighting condition
These sequences were taken by holding down the button on the camera and
continuously taking pictures while moving the camera randomly around the field.
Each sequence consisted of a wide range of pictures covering as many situations
as could reasonably be expected. The purpose of these sequences is to get a good
range of images displaying various compositions so that the analysis of the
sequence as a whole would give an indication of broad trends in the YUV data
regardless of what the individual pictures were of. Most images contained at least
some of the green field within the frame. The only object on the field was the
orange ball, which appeared in some but not all images.
The second type of sequence was smaller sets of images with each picture
recreated in each lighting condition (Figure 3.2). Positioning the camera on a
stand and taking the same picture in each lighting condition created these
sequences. The result was a series of images in each lighting condition with
matching compositions for each picture. This allowed for an analysis of how
YUV data changes between lighting conditions given identical image
compositions. The aim was to see if it was possible to identify a pattern in how
the data of lighting conditions related to each other to create rules that would hold
true in all situations.

Methodology
21
Figure 3.2 Identical images in bright, normal and dim lighting conditions
The third and final type of image sequence acts as an intermediate between the
first two types. Large sequences were taken in each lighting condition but all
from the same general location and in the same general direction (Figure 3.3). As
such each sequence has a reasonable amount of variation in regards to the image
composition but the content from image to image is fairly consistent. The
purpose of these sequences is to allow for adding an extra dimension to the
possible rule system, that being a constraint of location and orientation. If it is
found that there cannot be a rule-set that provides satisfactory results in all
conditions then the possibility of creating different rules for each location and
orientation combination can be investigated.
Figure 3.3 Location restricted image sequence
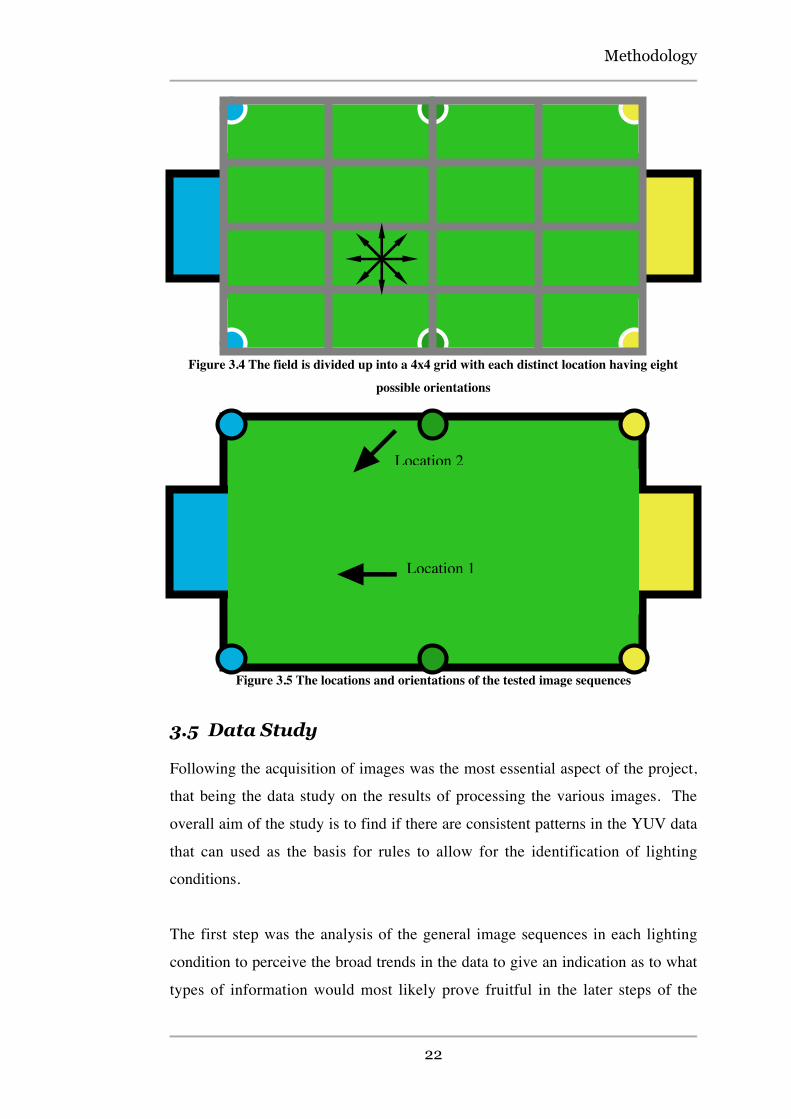
The proposed method for restricting rules to specific locations and orientations
would require knowledge of the AIBO’s position and facing on the field. This
information is easily obtainable from the localisation module of the system.
Basically, the field would need to be virtually divided up into sections with each
section having several possible orientations (Figure 3.4). In this example the field
is divided into a 4x4 grid with eight directions for each location. Figure 3.5
shows the positions from which image sequences were taken to test this method.
Methodology
22
Figure 3.4 The field is divided up into a 4x4 grid with each distinct location having eight
possible orientations
Figure 3.5 The locations and orientations of the tested image sequences
3.5 Data Study
Following the acquisition of images was the most essential aspect of the project,
that being the data study on the results of processing the various images. The
overall aim of the study is to find if there are consistent patterns in the YUV data
that can used as the basis for rules to allow for the identification of lighting
conditions.
The first step was the analysis of the general image sequences in each lighting
condition to perceive the broad trends in the data to give an indication as to what
types of information would most likely prove fruitful in the later steps of the
Location 1
Location 2

Methodology
23
study. This initial step is important as it can tell us what areas are not likely to
yield useful information upon closer inspection.
The second step involves comparing the data of the identical images in each
lighting condition. The aim of this step is to identify consistent relationships
between the data types in the distinct lighting conditions. This stage should reveal
if it is possible to create rules that apply in all situations or if the extra information
about image composition is needed.
Finally, an analysis of images constrained to a single location and orientation will
show if there is a consistent enough relationship between the YUV data and the
lighting conditions if the image contents are known to be generally uniform. If it
is possible to create rules constrained by location and orientation then the
proposed system will incorporate both colour and physical localisation
information to produce rules for lighting identification.

Results
24
4 Results
4.1 Trends
The first step of the study was to discover the areas that would be of primary
interest in the more focused stages of the study. Processing the large general
image sequences and comparing the averaged statistics for each lighting condition
achieved this. For example, image sequence norm1 (the first sequence taken in
the normal lighting condition) contains 88 images and has an average minimum Y
channel value of 90.7. Obviously, this does not mean that all of the images in the
sequence have the same minimum Y channel value but one can see that the
general trend is higher compared to the 81.2 average minimum Y channel value of
the dim image sequence. The second step of this stage involves looking closer at
the data that appears to indicate potential for establishing identifying rules by
looking at the individual values and assessing the consistency of the comparison.
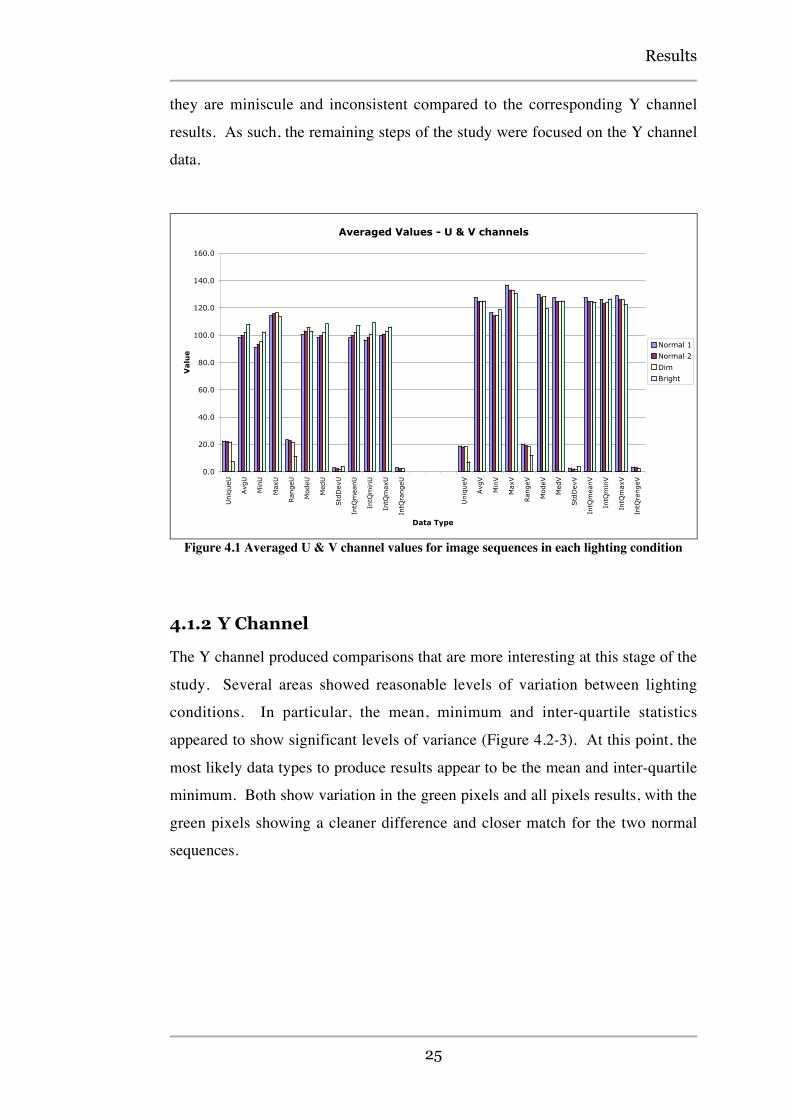
4.1.1 U & V Channels
Initial assessment of the U and V channel data shows that there is very little of use
in either channel for the purposes of this project. Referring to Figure 4.1 it can be
see that the variation in data from one lighting condition to another is only slight.
The one anomaly is the noticeable reduction in the number of unique values and
the range of both the U and V channels in the bright condition, though this is
explained by the very small number of pixels classified as green in the images and
as such is of no use. While it was expected that the Y channel would be the most
useful for lighting identification due to the nature of the YUV colour space it was
still hoped that some meaningful information could be gleaned from the U and V
channels but the initial analysis revealed that this was not the case. The U and V
channels are also inadequate for comparing the results of all pixels, as the colour
data is virtually random due to the fact that there are no constraints on the image
contents. Even in the cases where there is a small difference in trends for data,
Results
25
they are miniscule and inconsistent compared to the corresponding Y channel
results. As such, the remaining steps of the study were focused on the Y channel
data.
Averaged Values - U & V channels
0.0
20.0
40.0
60.0
80.0
100.0
120.0
140.0
160.0
Uniq
ueU
Avg
U
Min
U
Max
U
Ran
geU
ModeU
Med
U
Std
Dev
U
IntQ
mea
nU
IntQ
min
U
IntQ
max
U
IntQ
rangeU
Uniq
ueV
Avg
V
Min
V
Max
V
Ran
geV
ModeV
Med
V
Std
Dev
V
IntQ
mea
nV
IntQ
min
V
IntQ
max
V
IntQ
rangeV
Data Type
Valu
e
Normal 1
Normal 2
Dim
Bright
Figure 4.1 Averaged U & V channel values for image sequences in each lighting condition
4.1.2 Y Channel
The Y channel produced comparisons that are more interesting at this stage of the
study. Several areas showed reasonable levels of variation between lighting
conditions. In particular, the mean, minimum and inter-quartile statistics
appeared to show significant levels of variance (Figure 4.2-3). At this point, the
most likely data types to produce results appear to be the mean and inter-quartile
minimum. Both show variation in the green pixels and all pixels results, with the
green pixels showing a cleaner difference and closer match for the two normal
sequences.

Results
26
Averaged Values - Y channel - Green Pixels
0.0
20.0
40.0
60.0
80.0
100.0
120.0
140.0
160.0
UniqueY
AvgY
MinY
MaxY
RangeY
ModeY
MedY
StdDevY
IntQmeanY
IntQminY
IntQmaxY
IntQrangeY
Data Type
Valu
e
normal1normal2dimmerbrighter
Figure 4.2 Averaged Y channel values for green classified pixels of image sequences in each
lighting condition
Averaged Values - Y channel - All Pixels
0.0
50.0
100.0
150.0
200.0
250.0
300.0
UniqueY
AvgY
MinY
MaxY
RangeY
ModeY
MedY
StdDevY
IntQmeanY
IntQminY
IntQmaxY
IntQrangeY
Data Type
Valu
e
normal1normal2dimmerbrighter
Figure 4.3 Averaged Y channel values for all pixels of image sequences in each lighting
condition
Looking closer at the separate values in the sequences (Figure 4.4-7) it can be
seen that while the trends are definitely discernable the consistency is far from
ideal. The mean Y channel values have a large range for the green pixel results
but there is definitely a trend for the dim values to be lower and the bright values

Results
27
higher with normal values in the middle. That said there is a large overlapping
range between the higher normal values and the lower bright values, there is also
a large overlapping range between the higher dim values and the lower normal
values. The mean Y channel values for the all pixel results were much noisier
than the green pixel results (Figure 4.6). The inter-quartile minimum values for
the all pixel results showed the most consistency for the sequences though there
was still significant overlap.
Mean Values - Y channel - Green Pixels
80
90
100
110
120
130
140
150
Normal 1 Normal 2 Dimmer Brighter
Figure 4.4 Mean Y channel values for green pixels of individual images in each sequence

Results
28
Inter-quartile Minimum Values - Y Channel - Green Pixels
80
90
100
110
120
130
140
150
Normal 1 Normal 2 Dimmer Brighter
Figure 4.5 Inter-quartile minimum Y channel values for green pixels of individual images in
each sequence
Mean Values - Y Channel - All Pixels
75
95
115
135
155
175
195
215
235
255
Normal 1 Normal 2 Dimmer Brighter
Figure 4.6 Mean Y channel values for all pixels of individual images in each sequence

Results
29
Inter-quartile Minimum Values - Y channel - All Pixels
60
80
100
120
140
160
180
200
220
240
260
Normal 1 Normal 2 Dimmer Brighter
Figure 4.7 Inter-quartile minimum Y channel values for all pixels of individual images in
each sequence
This stage revealed that while there are definite trends that can be seen in the data
between lighting conditions it would seem that the patterns are too unreliable to
make rules based solely on the YUV data without an additional dimension of
information.
4.2 Direct Image Comparisons
The next step of the study was to examine the results of processing identical
sequences in each lighting condition (Figure 3.2). This step allows for the
comparison of data with the knowledge that the image contents are as close to
identical as possible.
Looking at the values for the green pixel results, it is apparent that without
restriction on image contents there is a large variation in values from image to
image while on a per-image basis there are significant differences in values
between lighting conditions. For example in the mean Y channel values (Figure
4.8) it can be seen that for most images the mean Y channel value is lowest in the
dim condition, highest in the bright and in-between in the normal. That said there

Results
30
are cases for which this does not hold true which makes this aspect of the data
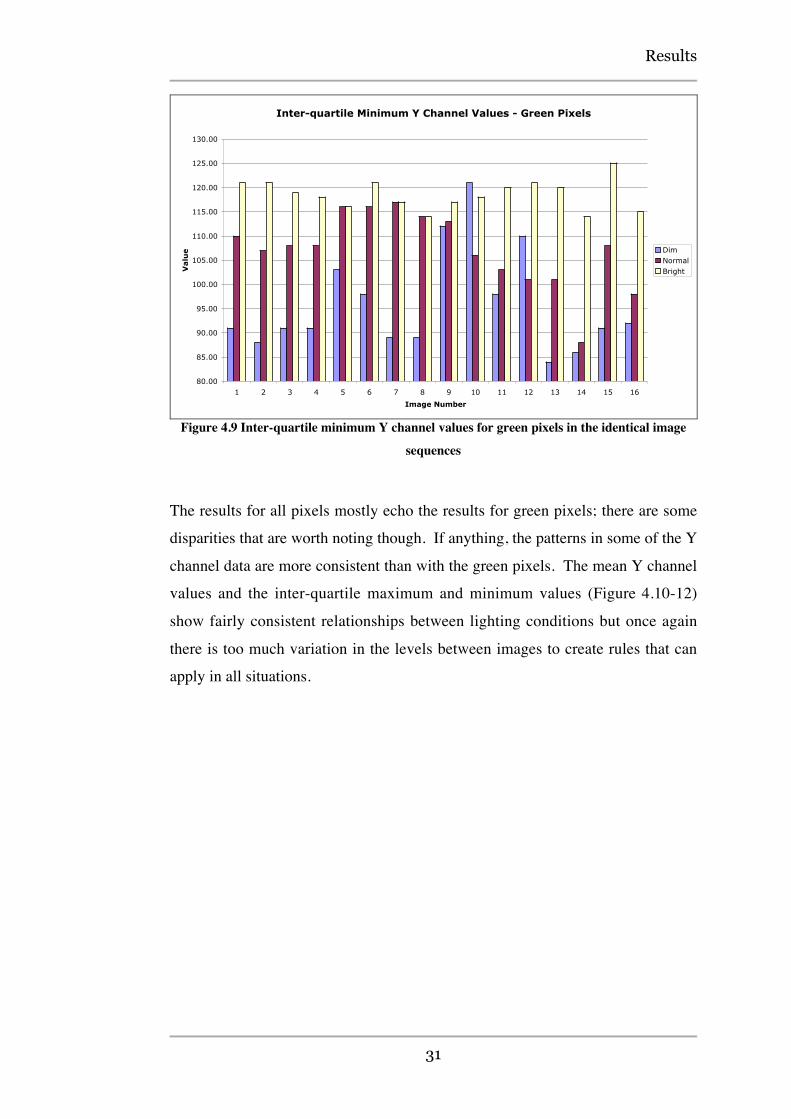
unsuitable for rule making. The same circumstance is evidenced in the inter-
quartile minimum Y channel values (Figure 4.9). While there is a general trend
for the bright condition to have a higher value it is not consistent enough for rule
creation.
Mean Y Channel Values - Green Pixels
80.00
90.00
100.00
110.00
120.00
130.00
140.00
1 2 3 4 5 6 7 8 9 10 11 12 13 14 15 16
Image Number
Valu
e DimNormalBright
Figure 4.8 Mean Y channel values for green pixels in the identical image sequences
Results
31
Inter-quartile Minimum Y Channel Values - Green Pixels
80.00
85.00
90.00
95.00
100.00
105.00
110.00
115.00
120.00
125.00
130.00
1 2 3 4 5 6 7 8 9 10 11 12 13 14 15 16
Image Number
Valu
e DimNormalBright
Figure 4.9 Inter-quartile minimum Y channel values for green pixels in the identical image
sequences
The results for all pixels mostly echo the results for green pixels; there are some
disparities that are worth noting though. If anything, the patterns in some of the Y
channel data are more consistent than with the green pixels. The mean Y channel
values and the inter-quartile maximum and minimum values (Figure 4.10-12)
show fairly consistent relationships between lighting conditions but once again
there is too much variation in the levels between images to create rules that can
apply in all situations.

Results
32
Mean Y Channel Values - All Pixels
80.00
100.00
120.00
140.00
160.00
180.00
200.00
220.00
1 2 3 4 5 6 7 8 9 10 11 12 13 14 15 16
Image Number
Valu
e DimNormalBright
Figure 4.10 Mean Y channel values for all pixels in the identical image sequences
Inter-quartile Minimum Y Channel Values - All Pixels
0.00
20.00
40.00
60.00
80.00
100.00
120.00
140.00
160.00
180.00
1 2 3 4 5 6 7 8 9 10 11 12 13 14 15 16
Image Number
Valu
e DimNormalBright
Figure 4.11 Inter-quartile minimum Y channel values for all pixels in the identical images
sequences

Results
33
Inter-quartile Maximum Y Channel Values - All Pixels
80.00
100.00
120.00
140.00
160.00
180.00
200.00
220.00
240.00
260.00
1 2 3 4 5 6 7 8 9 10 11 12 13 14 15 16
Image Number
Valu
e DimNormalBright
Figure 4.12 Inter-quartile maximum Y channel values for all pixels in the identical image
sequences
This stage of the study showed that there is definitely too much inconsistency in
the data to make rules that apply in all situations without a restriction on image
contents. Undertaking the direct image comparison has shown that there are
certain relationships in the data that remain reasonably constant. The next step
involves repeating the previous steps with image sequences that are restricted in
terms of location and orientation.
4.3 Location Restricted Images
This stage of the study analyses sequences of images that are all taken from the
same general location and facing the same general direction. The result is a
sequence of images that has very little variation in image contents compared to
the sequences studied early in the analysis (Figure 3.3). For each of the two
locations tested at this stage sequences for both training and testing were taken in
each lighting condition. Refer to Figure 3.5 for the specific locations used.
4.3.1 Location 1
The first location is left of the centre facing the blue goal. From this angle, the
images have very little variation in terms of contents with most of the image being
Results
34
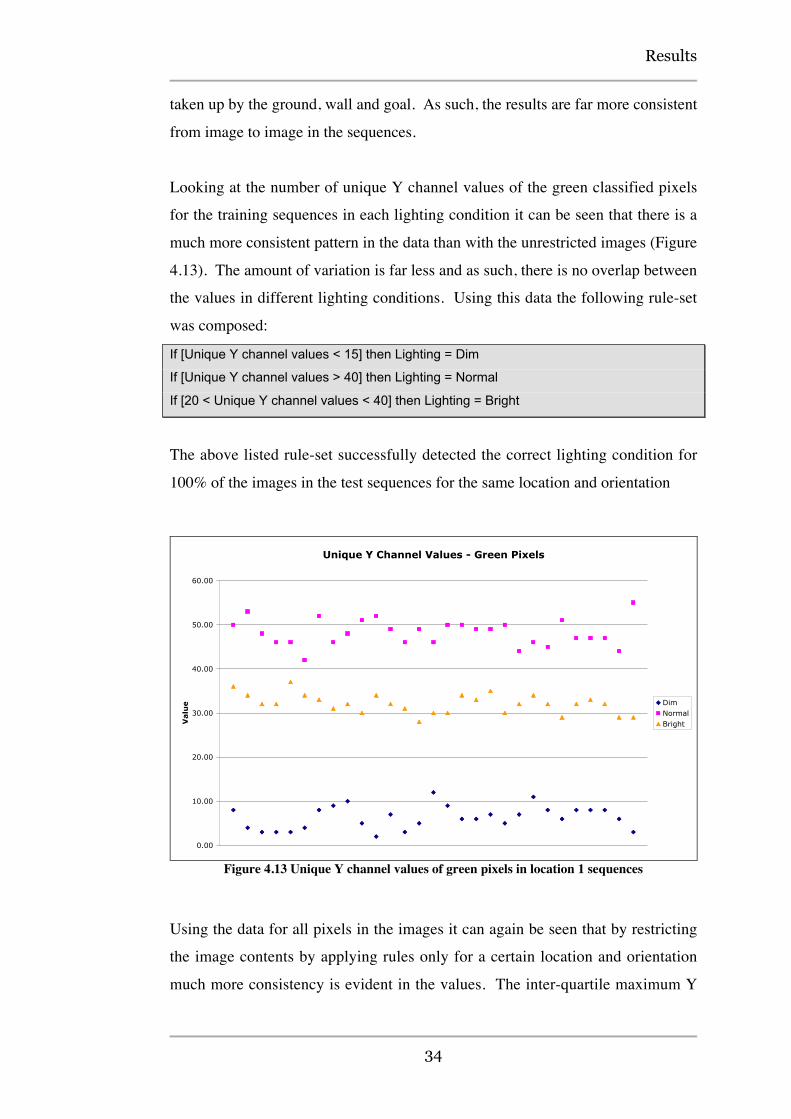
taken up by the ground, wall and goal. As such, the results are far more consistent
from image to image in the sequences.
Looking at the number of unique Y channel values of the green classified pixels
for the training sequences in each lighting condition it can be seen that there is a
much more consistent pattern in the data than with the unrestricted images (Figure
4.13). The amount of variation is far less and as such, there is no overlap between
the values in different lighting conditions. Using this data the following rule-set
was composed:
If [Unique Y channel values < 15] then Lighting = Dim
If [Unique Y channel values > 40] then Lighting = Normal
If [20 < Unique Y channel values < 40] then Lighting = Bright
The above listed rule-set successfully detected the correct lighting condition for
100% of the images in the test sequences for the same location and orientation
Unique Y Channel Values - Green Pixels
0.00
10.00
20.00
30.00
40.00
50.00
60.00
Valu
e DimNormalBright
Figure 4.13 Unique Y channel values of green pixels in location 1 sequences
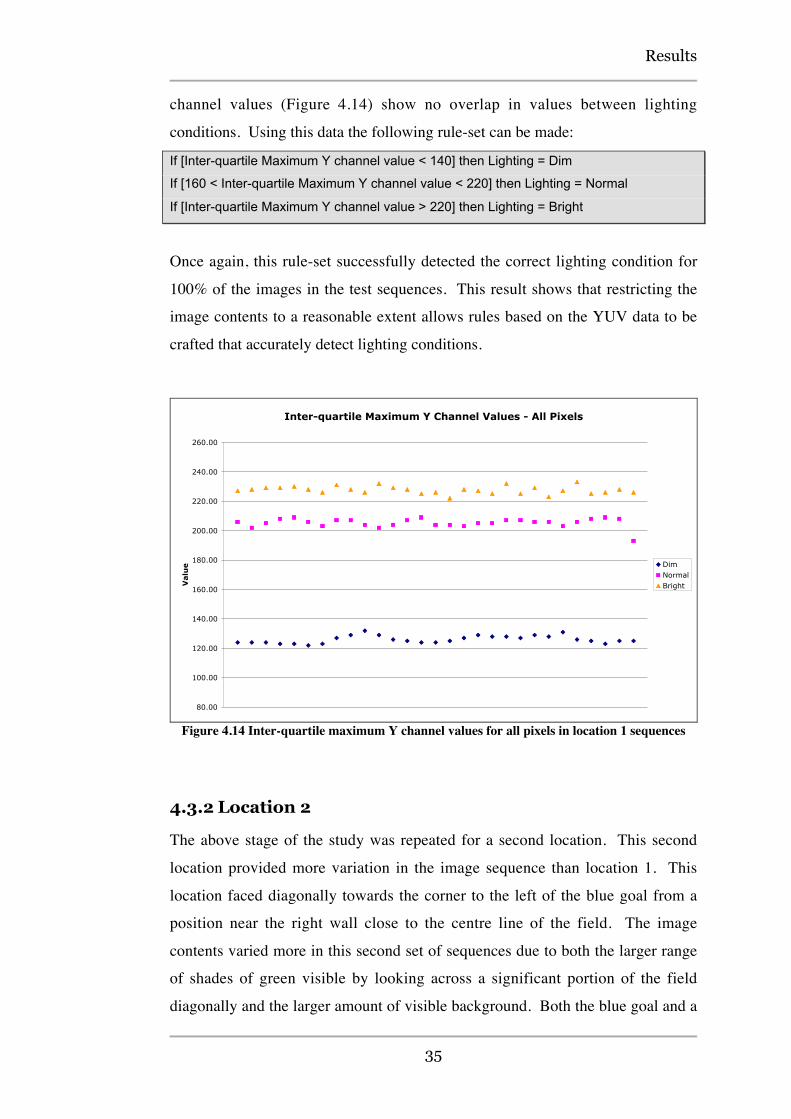
Using the data for all pixels in the images it can again be seen that by restricting
the image contents by applying rules only for a certain location and orientation
much more consistency is evident in the values. The inter-quartile maximum Y
Results
35
channel values (Figure 4.14) show no overlap in values between lighting
conditions. Using this data the following rule-set can be made:
If [Inter-quartile Maximum Y channel value < 140] then Lighting = Dim
If [160 < Inter-quartile Maximum Y channel value < 220] then Lighting = Normal
If [Inter-quartile Maximum Y channel value > 220] then Lighting = Bright
Once again, this rule-set successfully detected the correct lighting condition for
100% of the images in the test sequences. This result shows that restricting the
image contents to a reasonable extent allows rules based on the YUV data to be
crafted that accurately detect lighting conditions.
Inter-quartile Maximum Y Channel Values - All Pixels
80.00
100.00
120.00
140.00
160.00
180.00
200.00
220.00
240.00
260.00
Valu
e DimNormalBright
Figure 4.14 Inter-quartile maximum Y channel values for all pixels in location 1 sequences
4.3.2 Location 2
The above stage of the study was repeated for a second location. This second
location provided more variation in the image sequence than location 1. This
location faced diagonally towards the corner to the left of the blue goal from a
position near the right wall close to the centre line of the field. The image
contents varied more in this second set of sequences due to both the larger range
of shades of green visible by looking across a significant portion of the field
diagonally and the larger amount of visible background. Both the blue goal and a

Results
36
window in the background ranged from being fully visible to completely invisible
even within the parameters of location and orientation the image sequences
adhered to. The result was noisier data than that from location 1.
The data for green classified pixels again shows that the best results appear to be
gained from the number of unique Y channel values (Figure 4.15). While there is
a larger range of values for each condition than in the data from location 1 there is
still no overlap of values between lighting conditions. Using this data the
following rule-set is made:
If [Unique Y channel values < 20] then Lighting = Dim
If [Unique Y channel values > 50] then Lighting = Normal
If [20 < Unique Y channel values < 50] then Lighting = Bright
This rule set correctly identified the dim and normal lighting conditions for 100%
of the images from the test sequences but only correctly identified 96.3% of the
bright condition images with the remaining 3.7% incorrectly identified as normal.
While this result is not perfect, it is still within an acceptable range.
Unique Y Channel Values - Green Pixels
0.00
10.00
20.00
30.00
40.00
50.00
60.00
70.00
Valu
e DimNormalBright
Figure 4.15 Unique Y channel values of green pixels in location 2 sequences
Looking at the results for all pixels from this second location the best consistency
of values is found in the inter-quartile minimum Y channel values (Figure 4.16).
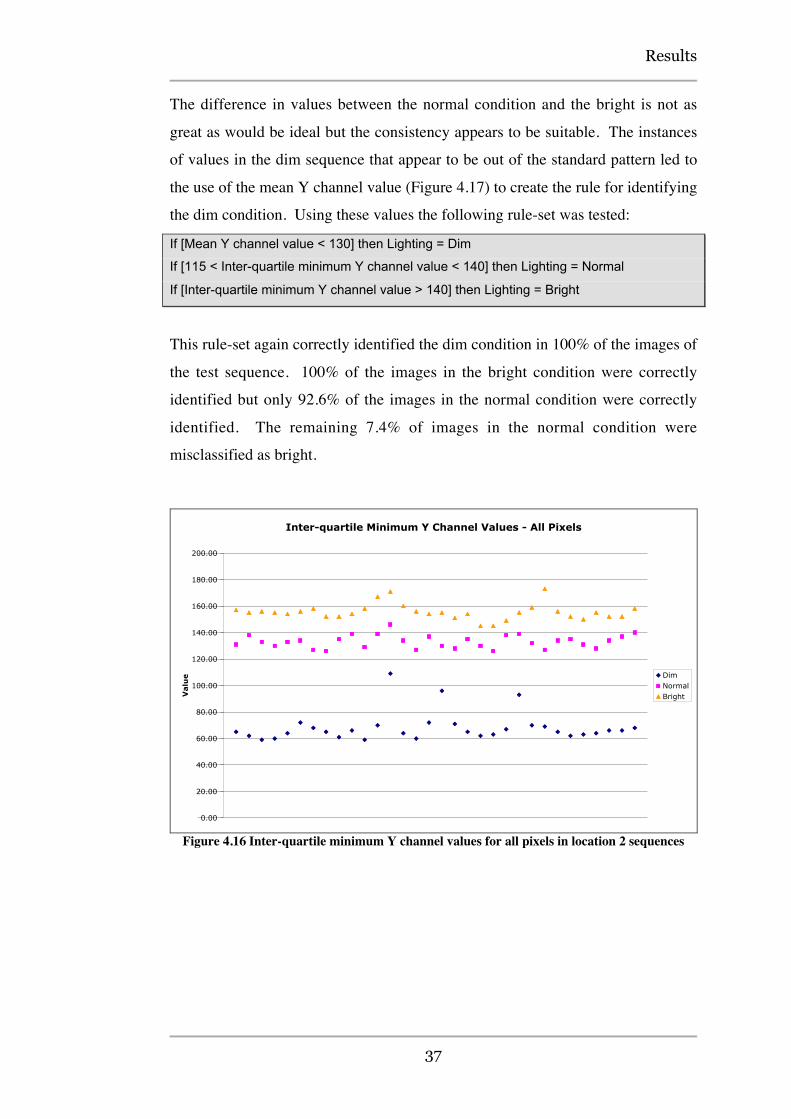
Results
37
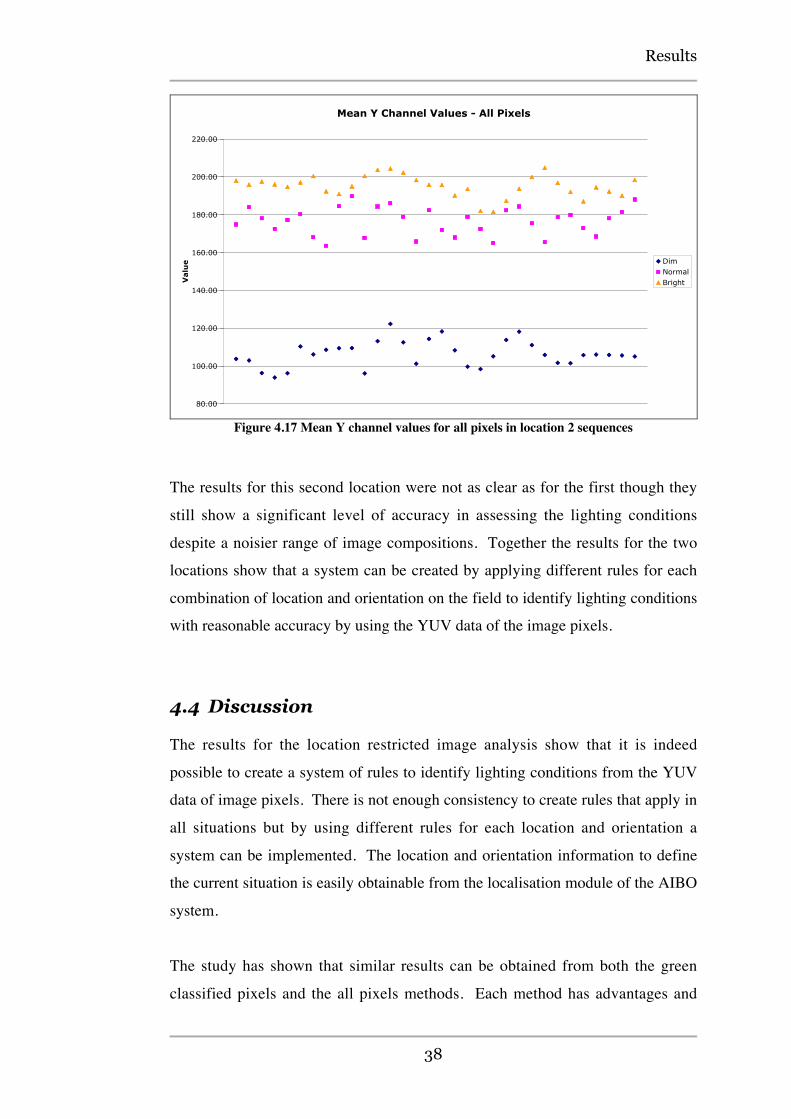
The difference in values between the normal condition and the bright is not as
great as would be ideal but the consistency appears to be suitable. The instances
of values in the dim sequence that appear to be out of the standard pattern led to
the use of the mean Y channel value (Figure 4.17) to create the rule for identifying
the dim condition. Using these values the following rule-set was tested:
If [Mean Y channel value < 130] then Lighting = Dim
If [115 < Inter-quartile minimum Y channel value < 140] then Lighting = Normal
If [Inter-quartile minimum Y channel value > 140] then Lighting = Bright
This rule-set again correctly identified the dim condition in 100% of the images of
the test sequence. 100% of the images in the bright condition were correctly
identified but only 92.6% of the images in the normal condition were correctly
identified. The remaining 7.4% of images in the normal condition were
misclassified as bright.
Inter-quartile Minimum Y Channel Values - All Pixels
0.00
20.00
40.00
60.00
80.00
100.00
120.00
140.00
160.00
180.00
200.00
Valu
e DimNormalBright
Figure 4.16 Inter-quartile minimum Y channel values for all pixels in location 2 sequences
Results
38
Mean Y Channel Values - All Pixels
80.00
100.00
120.00
140.00
160.00
180.00
200.00
220.00
Valu
e DimNormalBright
Figure 4.17 Mean Y channel values for all pixels in location 2 sequences
The results for this second location were not as clear as for the first though they
still show a significant level of accuracy in assessing the lighting conditions
despite a noisier range of image compositions. Together the results for the two
locations show that a system can be created by applying different rules for each
combination of location and orientation on the field to identify lighting conditions
with reasonable accuracy by using the YUV data of the image pixels.
4.4 Discussion
The results for the location restricted image analysis show that it is indeed
possible to create a system of rules to identify lighting conditions from the YUV
data of image pixels. There is not enough consistency to create rules that apply in
all situations but by using different rules for each location and orientation a
system can be implemented. The location and orientation information to define
the current situation is easily obtainable from the localisation module of the AIBO
system.
The study has shown that similar results can be obtained from both the green
classified pixels and the all pixels methods. Each method has advantages and

Results
39
disadvantages inherent within them. The green pixels method is more reliable as
it only uses pixels of the image identified to be within a particular constraint (the
YUV value of the pixel is listed as ‘green’ in the lookup table). The YUV method
uses all pixels regardless of colour classification, meaning that it is far more
influenced by any changes in the image composition. The most likely problem
this would cause is unreliability due to the dynamic nature of the background, an
effect that is less of an influence when using the green pixels method. The
disadvantage of the green pixels method is that is specific to the calibration used
to create the rules. Unlike the all pixels method, which does not factor in the
results of the colour classification process, the green pixels method only processes
the pixels classified as green in the lookup table. As the rules are based on the
number of unique Y channel values the results of the tests will change when using
a different calibration. The extent to which the change invalidates the rules was
not tested for this thesis. It is likely that using a different calibration file, even
calibrated in similar conditions, would require adjustment of the rules. This
would mean that the system would have to be recreated, or at least modified, for
any new calibration files created.
Any domain that requires colour classification in multiple lighting conditions
should be able to adapt the proposed system. The more limited the domain is in
terms of possible image contents the better, for example a static camera that
always looks at the same scene will only need one rule-set while a camera that can
rotate on a single axis will only need rules for the directions in which it can look.
There is also nothing restricting the proposed system from running on robotics
platforms other than the AIBO. The only requirement is the ability to perform
basic processing of the YUV data of the image pixels and some way of knowing
about the general image contents via the current location and orientation. Due to
the requirement of having pre-defined rules for each location and orientation the
system is not suitable for any application that could be expected to encounter fully
dynamic situations. Without some way of automating the rule creation the
proposed system really would not be suitable for implementation in any domain
that required many more situations than would be encountered in the RoboCup
domain.

Results
40
One issue that needs to be addressed is that of the problem of relying on
information from the localisation module. The AIBO performs localisation based
on results obtained from the vision system so using localisation information in
rules to maintain vision means that if the vision is ineffective enough (presumably
due to a sudden and significant lighting change) to prevent the AIBO being able
to perform an accurate localisation then the rules will be non-applicable. This
should only cause a problem in situations in which the AIBO is completely
blinded by gross inaccuracy in the colour classification calibration from the start
so that no initial localisation can be performed. As such, the system can only deal
with changes to the lighting, not with an initial unknown lighting condition. If the
AIBO is suddenly rendered blind by a drastic change in lighting then the last
known location and orientation should be suitable for performing an analysis.
Conclusion & Further Work
41
5 Conclusion & Further Work
While it is not possible to create a system of rules to determine the current
lighting condition that holds true in all cases, a system can be created that has
distinct rules for each location and orientation, information about which is easily
obtainable from the localisation module. Based on Y channel pixel data the
proposed system can accurately estimate the lighting condition and allow the
vision system to switch to a colour lookup table calibrated for the current
situation.
Due to the fact that the system is reliant on variable conditions such as the
physical environment and the colour classification calibrations used (in the case of
the green pixel method) the development of a system to partially automate the
construction of the rule set would be advantageous. This could reduce the time
and effort it would take to create a rule set. A system could take as input a set of
images from each location and orientation and for cases where there is a
consistent difference between lighting conditions in common data (such as the
number of unique Y channel values of green classified pixels) automatically
create a rule for that case. This way the user would only need to manually create
rules for situations where there is some ambiguity and fine-tuning is required.
Further testing would also be beneficial to establish the robustness of an
implemented system. While it has been shown that the system can accurately
determine lighting conditions in the domain of RoboCup, there is an unknown
factor in the effect of environmental change. The system was designed and tested
in a room with a reasonably consistent level of ambient light. Before fully
implementing the system, it would be a good idea to determine the effect of
changes in the environment by repeating the tests in another location to determine
if a rule set can be expected to perform satisfactorily in a location other than that
in which it was created. Additionally there is the issue of the performance of the
Conclusion & Further Work
42
system in a situation with more noise than in the test cases, for example a
RoboCup game. The question of the effectiveness of the system when the field is
obscured by two teams of AIBO robots and the background is constantly
changing due to people moving around is undetermined by the testing done for
this project due to physical limitations.
Apart from the further testing mentioned the next step is to implement the system.
Adaptation of the AIBO vision system to incorporate the extra step of lighting
assessment should be mostly trivial though steps must be taken to ensure that the
extra processing is able to be done in real-time or else not done on every frame.
This project has been focused on conducting a study to find out if a system could
be created that uses the YUV data of images to determine lighting conditions.
The proposed system achieves this goal with the required level of accuracy.
References
43
6 References
AIBO, Sony, viewed 11th May 2005,<http://www.sony.net/Products/aibo/index.html>.
Austin, D & Barnes, N 2003, 'Red is the new black - Or is it?' paper presented toAustralasian Conference on Robotics and Automation.
Bandlow, T, Klupsch, M, Hanek, R & Schmitt, T 2000, 'Fast ImageSegmentation, Object Recognition and Localization in a RoboCupScenario', paper presented to RoboCup-99: Robot Soccer World Cup III,London, UK.
Barnard, K 1999, 'Practical colour constancy', Ph.D. thesis thesis, Simon FraserUniversity School of Computing Science.
Barnard, K & Gabbur, P 2003, 'Color and Color Constancy in a TranslationModel for Object Recognition', paper presented to Eleventh Color ImagingConference, Scottsdale, Arizona, November 3-7.
Barnard, K, Finlayson, G & Funt, B 1997, 'Colour constancy for scenes withvarying illumination', Computer Vision and Image Understanding, vol. 65,no. 2, pp. 311-21.
Bruce, J, Balch, T & Veloso, M 2000, 'Fast and Inexpensive Color ImageSegmentation for Interactive Robots', paper presented to InternationalConference on Intelligent Robots and Systems, Takamatsu, Japan.
Chen, J, Chung, E, Edwards, R & Wong, N 2003, 'Rise of the AIBO's III - AIBORevolutions', University of New South Wales.
Jungel, M 2004, 'Using Layered Color Precision for a Self-Calibrating VisionSystem', paper presented to RoboCup2004 Symposium, Lisbon, Portugal.
Jungel, M, Hoffmann, J & Lotzsch, M 2004, A Real-Time Auto-Adjusting VisionSystem for Robotic Soccer.
Lenser, S & Veloso, M 2003, 'Automatic Detection and Response toEnvironmental Change', paper presented to IEEE International Conferenceon Robotics and Automation, 14-19 Sept. 2003.
Mayer, G, Utz, H & Kraetzschmar, G 2002, 'Towards Autonomous Vision Self-Calibration for Soccer Robots', paper presented to IEEE/RSJ InternationalConference on Intelligent Robots and Systems.

References
44
Mayer, G, Utz, H & Kraetzschmar, GK 2003, 'Playing Robot Soccer underNatural Light: A Case Study', paper presented to RoboCup2003Symposium, Padua, Italy.
McMahan, W & Bunting, J 2002, 'So Your Puppy Can't See?' University ofNewcastle.
Murch, CL & Chalup, SK 2004, 'Combining Edge Detection and ColourSegmentation in the Four-Legged League', paper presented to AustralasianConference on Robotics and Automation.
OPEN-R, Sony, viewed 11th May 2005, <http://openr.aibo.com/>.
Quinlan, MJ, Chalup, SK & Middleton, RH 2003, 'Techniques for ImprovingVision and Locomotion on the Sony AIBO Robot', paper presented toAustralian Conference on Robotics and Automation.
RGB/YUV Pixel Conversion, 2005, viewed 30/10/05 2005,<http://www.fourcc.org/fccyvrgb.php>.
RoboCup, viewed 11th May 2005, <http://www.robocup.org/>.
Rofer, T, Laue, T, Burkhard, H-D, Hoffmann, J, Jungel, M, Gohring, D, Lotzsch,M, Duffert, U, Spranger, M, Altmeyer, B, Goetzke, V, Stryk, Ov, Brunn,R, Dassler, M, Kunz, M, Risler, M, Stelzer, M, Thomas, D, Uhrig, S,Schwiegelshohn, U, Dahm, I, Hebbel, M, Nistico, W, Schumann, C &Wachter, M 2004, German Team Robocup 2004.
Schulz, D & Fox, D 2004, 'Bayesian Color Estimation for Adaptive Vision-basedRobot Localization', paper presented to International Conference onIntelligent Robots and Systems.
Sony Four-Legged Robot League, viewed 11th May 2005,<http://www.tzi.de/4legged/bin/view/Website/WebHome>.
Sridharan, M & Stone, P 2004, 'Towards Illumination Invariance in the LeggedLeague', paper presented to RoboCup2004 Symposium, Lisbon, Portugal.
---- 2005, 'Real-Time Vision on a Mobile Robot Platform', Under Review.
Stone, P, Dresner, K, Fidelman, P, Jong, NK, Kohl, N, Kuhlmann, G, Sridharan,M & Stronger, D 2004, The UT Austin Villa 2004 RoboCp Four-LeggedTeam: Coming of Age, University of Texas.
Technical Challenges for the RoboCup 2004 Legged League Competition, 2004,viewed 8th May 2005,<http://www.tzi.de/~roefer/Rules2004/challenges2004.pdf>.
Walker, T 2003, 'Development of a Learning System for the AIBO Robot usingRipple Down Rules', University of Tasmania.
References
45
Wang, Z, Tam, T, Kim, MS, Chang, A, Wong, J, Leung, B, Brooks, J & Huben,NV 2002, 'rUNSWift UNSW RoboCup2002 Sony Legged League Team',University of New South Wales.
Wong, T 2004, 'The Sony Legged Robot League COMP4911 Thesis B report',University of New South Wales.
Xu, J 2004, '2004 rUNSWift Thesis - Low Level Vision', University of NewSouth Wales.
Zrimec, T & Wyatt, A 2002, 'Learning to Recognize Objects - Toward AutomaticCalibration of Color Vision for Sony Robots', paper presented to TheNineteenth International Conference on Machine Learning.