Development of an Engineering Model of a monophasic ...
11
46th International Conference on Environmental Systems 10-14 July 2016, Vienna, Austria ICES-2016-436 Development of an Engineering Model of a monophasic Electro Hydro Dynamic pumped fluid loop within the frame of the NEOSAT pre-development activities Robert Thorslund 1 , Are Björneklett 2 , Mikael Antelius 3 APR Technologies, Enköping, 745 39, Sweden Tisna Tjiptahardja 4 European Space Agency, Noordwijk, 2201 AZ, The Netherlands Thomas Huens 5 Centre National d'Études Spatiales, Toulouse, 31400, France Arnaud Scommegna 6 Thales Alenia Space, Cannes, 06150, France and Andy Walker 7 Airbus Defence and Space, Toulouse, 31400, France We present the development of a novel pumped fluid loop thermal regulation system, completely free of moving parts. This technology is using electro hydrodynamic pumping of a dielectric coolant. This pumping mechanism gives unique advantages, e.g. variable thermal conductance (regulated thermal conductivity) and high reliability. In the framework of ESA’s “NEOSAT Phase B Pre-Development Activities”, APR Technologies has delivered an Engineering Model of a monophasic pumped fluid loop for a potential application on satcom platforms under development by Thales Alenia Space and Airbus DS. The thermal regulation system is specified to a qualification operating temperature range between -20 and 70 °C with a thermal conductance between 0 and 2 W/K over a 0.5 m transport length using 1/8” tubing. I. Introduction HERMAL management is a critical part of spacecraft design and performance. Electro hydrodynamic (EHD) pumped fluid loop systems have a potential wide range of applications addressing both general heat removal from heat dissipating equipment and payloads and closed loop temperature control. A typical example is temperature sensitive sensors such as star trackers or other optical instruments. In comparison with heat pipes and thermal conduction, the EHD pumped loop system is particularly suited for tight temperature control. The fluid flow rate is controlled by the strength of the electrical field generating the EHD flow and an on/off or analogue control schemes can be utilized. 1 CTO, Västra Järnvägsgatan 4, 745 39 Enköping. 2 CSO, Västra Järnvägsgatan 4, 745 39 Enköping. 3 R&D Engineer,Västra Järnvägsgatan 4, 745 39 Enköping. 4 NEOSAT Thermal Engineer, Telecommunication Satellite Programmes Department, Keplerlaan 1, 2201 AZ Noordwijk. 5 Telecom Mechanical and Thermal Architect, Mechanical and Thermal Architecture Department, 18 Avenue Edouard Belin, 31400 Toulouse. 6 Thermal Control Manager, Mechanical, thermal & technologies Department / Platform & Integration Competence Center, 5 Allée des Gabians, 06150 Cannes. 7 Thermal Expert & EurostarNeo Thermal System Architect, Telecom Satellites Division, 31 Rue des Cosmonautes, Z.I. du Palays, 31400 Toulouse. T
Transcript of Development of an Engineering Model of a monophasic ...
46th International Conference on Environmental Systems 10-14 July 2016, Vienna, Austria ICES-2016-436
Development of an Engineering Model of a monophasic
Electro Hydro Dynamic pumped fluid loop within the frame
of the NEOSAT pre-development activities
Robert Thorslund 1, Are Björneklett
2, Mikael Antelius
3
APR Technologies, Enköping, 745 39, Sweden
Tisna Tjiptahardja4
European Space Agency, Noordwijk, 2201 AZ, The Netherlands
Thomas Huens5
Centre National d'Études Spatiales, Toulouse, 31400, France
Arnaud Scommegna6
Thales Alenia Space, Cannes, 06150, France
and
Andy Walker 7
Airbus Defence and Space, Toulouse, 31400, France
We present the development of a novel pumped fluid loop thermal regulation system,
completely free of moving parts. This technology is using electro hydrodynamic pumping of
a dielectric coolant. This pumping mechanism gives unique advantages, e.g. variable thermal
conductance (regulated thermal conductivity) and high reliability. In the framework of
ESA’s “NEOSAT Phase B Pre-Development Activities”, APR Technologies has delivered an
Engineering Model of a monophasic pumped fluid loop for a potential application on satcom
platforms under development by Thales Alenia Space and Airbus DS. The thermal
regulation system is specified to a qualification operating temperature range between -20
and 70 °C with a thermal conductance between 0 and 2 W/K over a 0.5 m transport length
using 1/8” tubing.
I. Introduction
HERMAL management is a critical part of spacecraft design and performance. Electro hydrodynamic (EHD)
pumped fluid loop systems have a potential wide range of applications addressing both general heat removal
from heat dissipating equipment and payloads and closed loop temperature control. A typical example is
temperature sensitive sensors such as star trackers or other optical instruments. In comparison with heat pipes and
thermal conduction, the EHD pumped loop system is particularly suited for tight temperature control. The fluid flow
rate is controlled by the strength of the electrical field generating the EHD flow and an on/off or analogue control
schemes can be utilized.
1 CTO, Västra Järnvägsgatan 4, 745 39 Enköping. 2 CSO, Västra Järnvägsgatan 4, 745 39 Enköping. 3 R&D Engineer,Västra Järnvägsgatan 4, 745 39 Enköping. 4 NEOSAT Thermal Engineer, Telecommunication Satellite Programmes Department, Keplerlaan 1, 2201 AZ Noordwijk. 5 Telecom Mechanical and Thermal Architect, Mechanical and Thermal Architecture Department, 18 Avenue Edouard Belin,
31400 Toulouse. 6 Thermal Control Manager, Mechanical, thermal & technologies Department / Platform & Integration Competence Center, 5
Allée des Gabians, 06150 Cannes. 7 Thermal Expert & EurostarNeo Thermal System Architect, Telecom Satellites Division, 31 Rue des Cosmonautes, Z.I. du
Palays, 31400 Toulouse.
T
International Conference on Environmental Systems
2
Although the pump is driven by an externally applied electric field, the required energy input is low (0.34W) and
much less than typical electrical motors used in mechanically pumped fluid loops. The EHD pump technology
developed described herein is furthermore scalable across a wide range of fluid flow rates, operating temperature
ranges and mechanical envelopes.
In comparison with heat pipes and Loop Heat Pipes, EHD pumped fluid loops are much less affected by
gravitational field thus simplifying ground testing. In comparison with mechanically-pumped fluid loop, EHD
pumped fluid loops have no moving mechanical parts, meaning less vibration and potentially longer lifetime.
The Advanced Research in Telecommunications Systems (ARTES) Next Generation Platform element, or
NEOSAT, is the ESA programme to support the European satellite industry to develop the "Next Generation
Platforms". The programme is specifically aimed at developing, and demonstrating in orbit, new satellite platform
product lines for 3 to 6 tonne geostationary satellites, in partnership with industry. In the framework of ESA
“NEOSAT Phase B Pre-Development Activities”, APR Technologies has delivered in 2015 an Engineering Model
of a monophasic pumped fluid loop (thermal building block) for a potential application on satcom platforms under
development by Thales Alenia Space and Airbus DS.
II. EHD Pump Introduction
Electrohydrodynamics1 is the study of the dynamics of electrically charged fluids. This interaction can generate
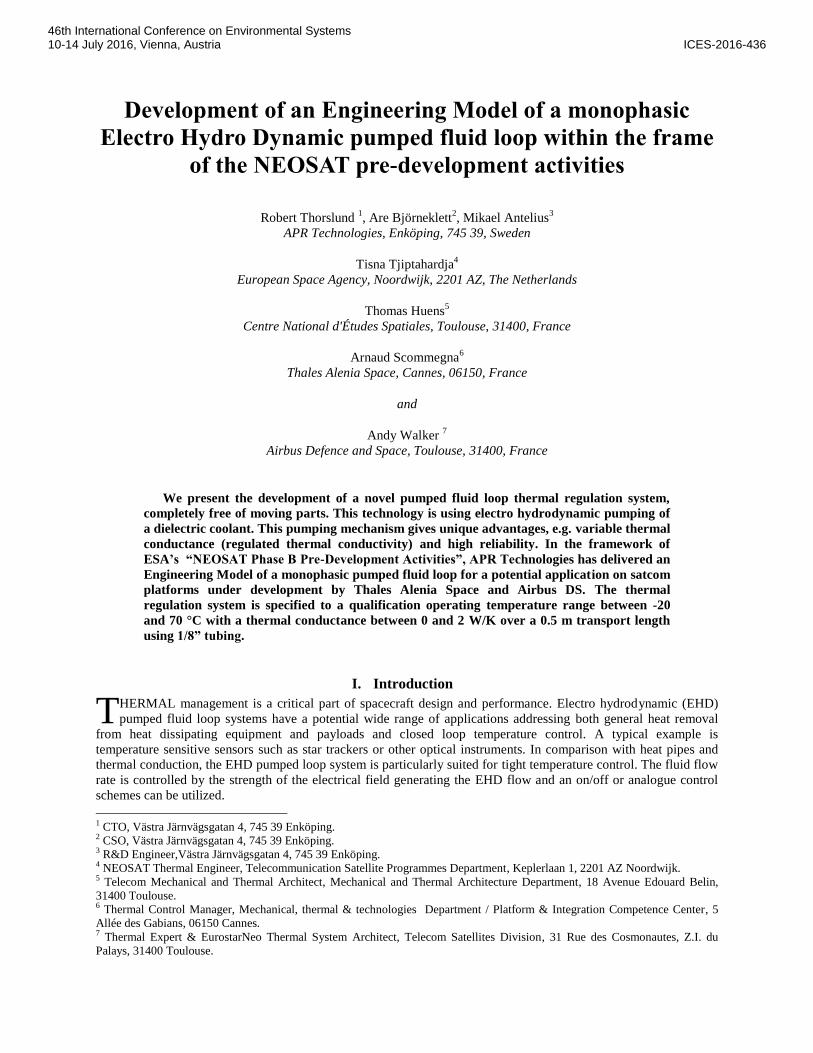
fluid movement2. The EHD pump mode utilized in this development is designed as an ion drag pump. In this pump,
ions are generated by electron injection into fluid
molecules at a metal/liquid interface (the electrode
surface). This is facilitated by the electric field
concentrations at the edges of the porous electrode.
This formed ion is accelerated by an electric field
towards an oppositely charged electrode, and as it
travels through the liquid the ion generates an ion
drag. Ion drag is basically accelerating ions that are
pushing/bringing along the adjacent molecules by
friction. The ions are neutralized at the destination
electrode. This is the intended mode of operation,
which is illustrated in Figure 2. However, there is
also a possibility of another EHD mode of operation,
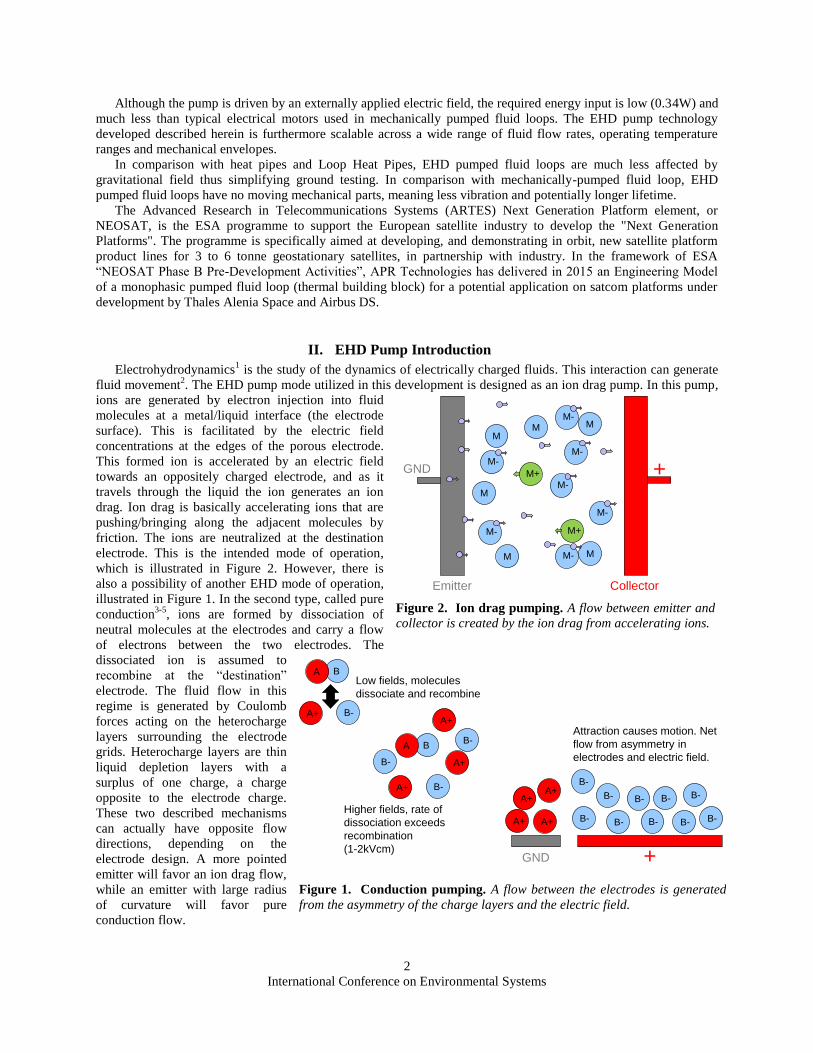
illustrated in Figure 1. In the second type, called pure
conduction3-5
, ions are formed by dissociation of
neutral molecules at the electrodes and carry a flow
of electrons between the two electrodes. The
dissociated ion is assumed to
recombine at the “destination”
electrode. The fluid flow in this
regime is generated by Coulomb
forces acting on the heterocharge
layers surrounding the electrode
grids. Heterocharge layers are thin
liquid depletion layers with a
surplus of one charge, a charge
opposite to the electrode charge.
These two described mechanisms
can actually have opposite flow
directions, depending on the
electrode design. A more pointed
emitter will favor an ion drag flow,
while an emitter with large radius
of curvature will favor pure
conduction flow.
Figure 2. Ion drag pumping. A flow between emitter and
collector is created by the ion drag from accelerating ions.
+
M
M-
M
M M
M
M
M+
M+
M-
M-
M-
M-
GND
Emitter Collector
M-
M-
Figure 1. Conduction pumping. A flow between the electrodes is generated
from the asymmetry of the charge layers and the electric field.
+GND
BA
B-A+
BA
B-A+
A+
A+
B-
B-
B-B-
B-
B-B-
B-
B-
B-
B- B-
A+ A+
A+A+
Low fields, molecules
dissociate and recombine
Higher fields, rate of
dissociation exceeds
recombination
(1-2kVcm)
Attraction causes motion. Net
flow from asymmetry in
electrodes and electric field.
International Conference on Environmental Systems
3
Additionally, for pure conduction flow, the two electrodes have to be dissimilar in order to break the symmetry
and create a flow. There is often two opposite and equal flows, consider for example the model dissociation-
recombination system A-+B
+ ↔ AB, where A
- and B
+ move in opposite directions and therefore do not create a net
flow. Using the shape of the electrodes, the layout of the pump core and the choice of fluid, the pump can be
designed strictly for one type of flow.
Ion drag pumping and conduction pumping have
different advantages. Ion injection will create higher
mass flow rates and head pressures, given that other
pump characteristics are kept similar. But, ion
injection might be more susceptible to fluid
degradation and electrode erosion.
III. System Overview
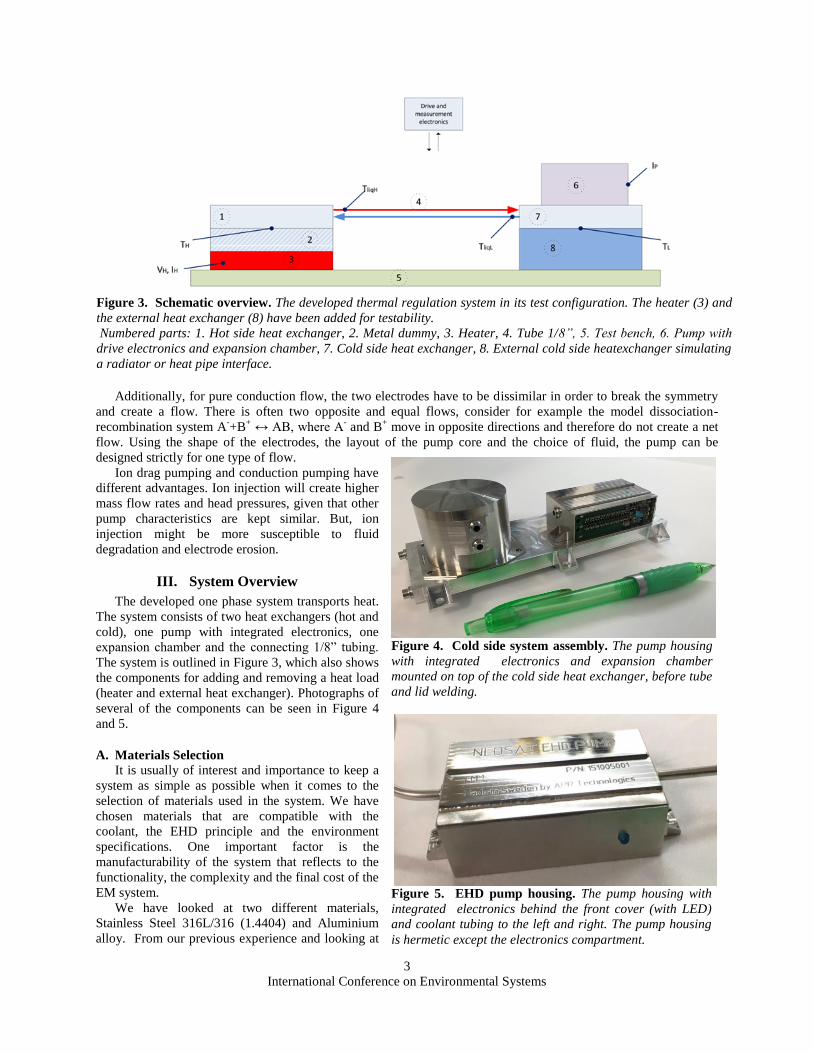
The developed one phase system transports heat.
The system consists of two heat exchangers (hot and
cold), one pump with integrated electronics, one
expansion chamber and the connecting 1/8” tubing.
The system is outlined in Figure 3, which also shows
the components for adding and removing a heat load
(heater and external heat exchanger). Photographs of
several of the components can be seen in Figure 4
and 5.
A. Materials Selection
It is usually of interest and importance to keep a
system as simple as possible when it comes to the
selection of materials used in the system. We have
chosen materials that are compatible with the
coolant, the EHD principle and the environment
specifications. One important factor is the
manufacturability of the system that reflects to the
functionality, the complexity and the final cost of the
EM system.
We have looked at two different materials,
Stainless Steel 316L/316 (1.4404) and Aluminium
alloy. From our previous experience and looking at
Figure 3. Schematic overview. The developed thermal regulation system in its test configuration. The heater (3) and
the external heat exchanger (8) have been added for testability.
Numbered parts: 1. Hot side heat exchanger, 2. Metal dummy, 3. Heater, 4. Tube 1/8”, 5. Test bench, 6. Pump with
drive electronics and expansion chamber, 7. Cold side heat exchanger, 8. External cold side heatexchanger simulating
a radiator or heat pipe interface.
Figure 4. Cold side system assembly. The pump housing
with integrated electronics and expansion chamber
mounted on top of the cold side heat exchanger, before tube
and lid welding.
Figure 5. EHD pump housing. The pump housing with
integrated electronics behind the front cover (with LED)
and coolant tubing to the left and right. The pump housing
is hermetic except the electronics compartment.
International Conference on Environmental Systems
4
the characteristics of the materials, our material of
choice is Stainless Steel 316L/316 for the pump
body, expansion chamber and tubes. Aluminium
was used for the heat exchangers.
When looking at the pros and cons, Aluminium
has a few great advantages over Stainless Steel but
lacks some in assembly compatibility and
weldability. Although aluminum of course is
possible to weld it requires special care and special
methods. In our case for example in the pump body,
with the assembly method we use we need to use a
material that is easily weldable with a small heat
affected zone. Therefore the choice of using SS 316
is clear for us right know when it comes to the pump
body and the expansion chamber. We also choose to
use SS316 in all the tubing for the reliability of the
welds and the assembly compatibility between the
materials.
For the heat exchangers we have chosen a different approach. Here we choose to use Aluminium for the weight
and thermal advantages. The heat exchangers lid is vacuum brazed to the heat exchanger bottom, creating reliable
and leak tight seal.
The tube connectors on the heat exchangers are made of a friction stir welded 2-layer metal which creates a full
fusion weld. The bimetallic interface consist of SS316-Aluminium, the Aluminium end of the interface are vacuum
brazed to the heat exchanger and the SS316 end allows for a solid TIG welding process of the tubes to the heat
exchangers.
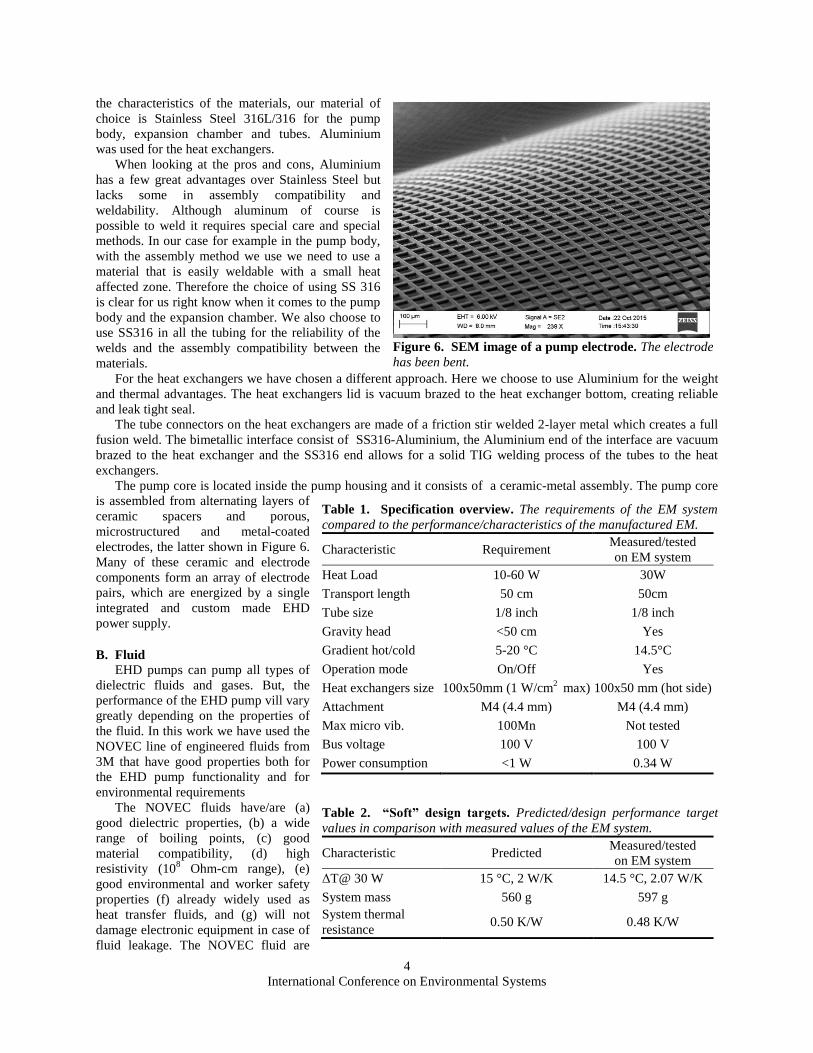
The pump core is located inside the pump housing and it consists of a ceramic-metal assembly. The pump core
is assembled from alternating layers of
ceramic spacers and porous,
microstructured and metal-coated
electrodes, the latter shown in Figure 6.
Many of these ceramic and electrode
components form an array of electrode
pairs, which are energized by a single
integrated and custom made EHD
power supply.
B. Fluid
EHD pumps can pump all types of
dielectric fluids and gases. But, the
performance of the EHD pump vill vary
greatly depending on the properties of
the fluid. In this work we have used the
NOVEC line of engineered fluids from
3M that have good properties both for
the EHD pump functionality and for
environmental requirements
The NOVEC fluids have/are (a)
good dielectric properties, (b) a wide
range of boiling points, (c) good
material compatibility, (d) high
resistivity (108 Ohm-cm range), (e)
good environmental and worker safety
properties (f) already widely used as
heat transfer fluids, and (g) will not
damage electronic equipment in case of
fluid leakage. The NOVEC fluid are
Table 1. Specification overview. The requirements of the EM system
compared to the performance/characteristics of the manufactured EM.
Characteristic Requirement Measured/tested
on EM system
Heat Load 10-60 W 30W
Transport length 50 cm 50cm
Tube size 1/8 inch 1/8 inch
Gravity head <50 cm Yes
Gradient hot/cold 5-20 °C 14.5°C
Operation mode On/Off Yes
Heat exchangers size 100x50mm (1 W/cm2 max) 100x50 mm (hot side)
Attachment M4 (4.4 mm) M4 (4.4 mm)
Max micro vib. 100Mn Not tested
Bus voltage 100 V 100 V
Power consumption <1 W 0.34 W
Table 2. “Soft” design targets. Predicted/design performance target
values in comparison with measured values of the EM system.
Characteristic Predicted Measured/tested
on EM system
ΔT@ 30 W 15 °C, 2 W/K 14.5 °C, 2.07 W/K
System mass 560 g 597 g
System thermal
resistance 0.50 K/W 0.48 K/W
Figure 6. SEM image of a pump electrode. The electrode
has been bent.

International Conference on Environmental Systems
5
planned to be used in the 10
MPCV
(Multi-Purpose Crew Vehicle)
spacecraft. The NOVEC fluid is also
investigated to be used as a coolant
in the SCiFI detector at Cern9.
Despite this we suggest that further
investigations related to the radiation
tolerance of the NOVEC fluid is
initiated.
IV. System Specifications
This chapter outlines how the
requirements, design targets and the
predicted values of the EM system
were fulfilled. The functional
requirements as well as the
measured values on the EM system
can be found in Table 1, 2 and 3.
Overall, the requirements that were to be tested are fulfilled. We have a very low and attractive power
consumption and the ΔT requirement is fulfilled, it was even acceptable to go up to a ΔT of 20°C but now we ended
up at 14.5°C which is very close to the predicted 15°C. Our measurements on the systems thermal resistance shows a
lower value than what was predicted.
The system mass is 37 g heavier than what was predicted. The predicted and measured weight of the system is
shown in Table 3. We believe that with the current design the mass budget could be optimized further and be
reduced by 10-15% for coming generations. One-way of even further reducing the system mass is to introduce
another type of expansion compensator (not presented in this paper). The NOVEC fluid mass would be reduced with
~20g and the expansion chamber weight reduced with ~50-80g. Introducing both the above optimizations for
coming generations of systems would give a total system mass of around 440-490g. It would also reduce the overall
size of the system.
V. Thermal Tests
In Figure 7 Left a test run of in total 66 min is shown, the load is 10, 20 and 30W. Photographs of the setup is
shown in Figure 8 and the schematic overview can be found in Figure 3. There is a slight difference in conductance
between the different load steps. The last power step should be used to determine the ΔT value, which is extracted to
14.5 °C @ 30 W in this case. The reason for this power step choice can be found in the normal behavior of the EHD
Table 3. Component weight. The initial design weight estimates compared
to final EM measured values.
Component Mass, g
Design estimate Measured
Pump core ~20 40
Pump body 95 91
Heat Exchanger cold side 110 116*
Heat Exchanger hot side 84 90.8*
Expansion chamber 110 116
Tubing 30 30
Fluid 100 106†
Electronics/PCB ~5 4
Screws etc. 6 3
Total 560 597
* Larger size of HE due to design change. † Slightly larger fluid volume due
to change in cold side HE.
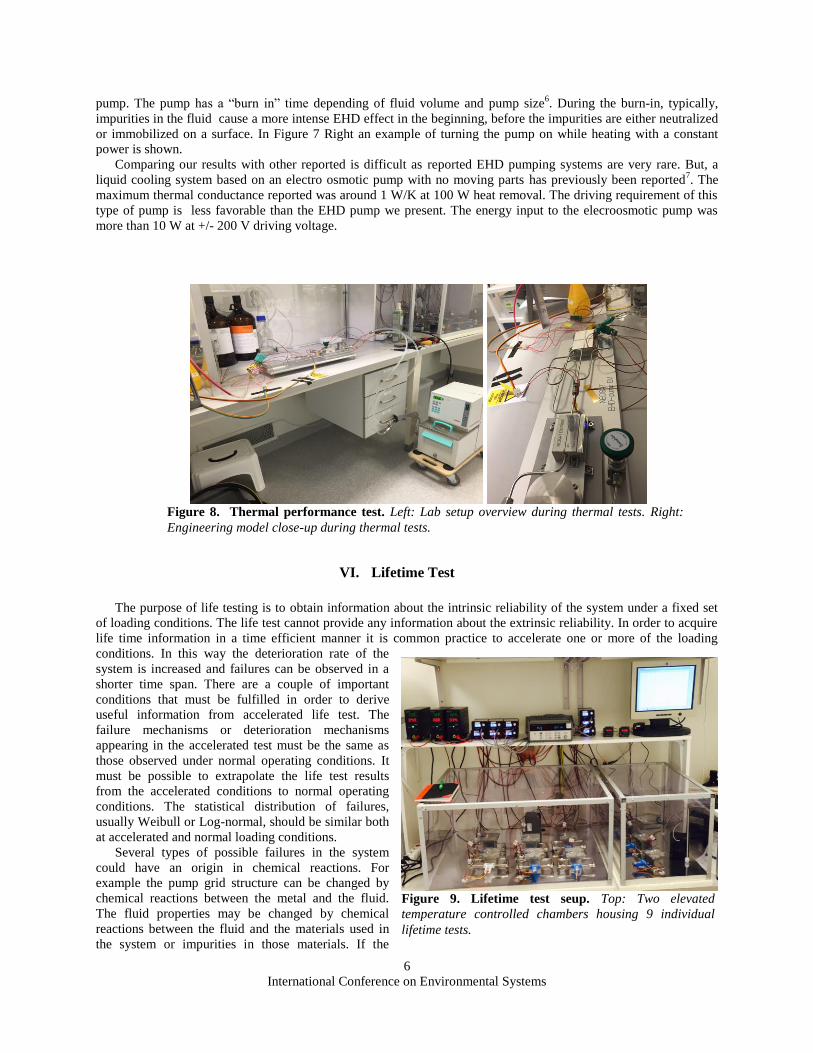
Figure 7. Thermal performance test. Left: The temperature of the two heat exchangers during ramping of the
heater power. Right: EM system test, 10W. Pump turned on after 392s.
0
10
20
30
40
50
2 602 1202 1802 2402 3002 3602
Tem
per
atu
re,
°C
Hea
ter
po
wer
, W
Time, s
ThTlHeater
0
10
20
30
40
50
2 122 242 362
Tem
per
atu
re,
°C H
eter
po
wer
, W
Pu
mp
on
/off
Time, s
Th
Tl
Heater
Pump on/off
International Conference on Environmental Systems
6
pump. The pump has a “burn in” time depending of fluid volume and pump size6. During the burn-in, typically,
impurities in the fluid cause a more intense EHD effect in the beginning, before the impurities are either neutralized
or immobilized on a surface. In Figure 7 Right an example of turning the pump on while heating with a constant
power is shown.
Comparing our results with other reported is difficult as reported EHD pumping systems are very rare. But, a
liquid cooling system based on an electro osmotic pump with no moving parts has previously been reported7. The
maximum thermal conductance reported was around 1 W/K at 100 W heat removal. The driving requirement of this
type of pump is less favorable than the EHD pump we present. The energy input to the elecroosmotic pump was
more than 10 W at +/- 200 V driving voltage.
VI. Lifetime Test
The purpose of life testing is to obtain information about the intrinsic reliability of the system under a fixed set
of loading conditions. The life test cannot provide any information about the extrinsic reliability. In order to acquire
life time information in a time efficient manner it is common practice to accelerate one or more of the loading
conditions. In this way the deterioration rate of the
system is increased and failures can be observed in a
shorter time span. There are a couple of important
conditions that must be fulfilled in order to derive
useful information from accelerated life test. The
failure mechanisms or deterioration mechanisms
appearing in the accelerated test must be the same as
those observed under normal operating conditions. It
must be possible to extrapolate the life test results
from the accelerated conditions to normal operating
conditions. The statistical distribution of failures,
usually Weibull or Log-normal, should be similar both
at accelerated and normal loading conditions.
Several types of possible failures in the system
could have an origin in chemical reactions. For
example the pump grid structure can be changed by
chemical reactions between the metal and the fluid.
The fluid properties may be changed by chemical
reactions between the fluid and the materials used in
the system or impurities in those materials. If the
Figure 8. Thermal performance test. Left: Lab setup overview during thermal tests. Right:
Engineering model close-up during thermal tests.
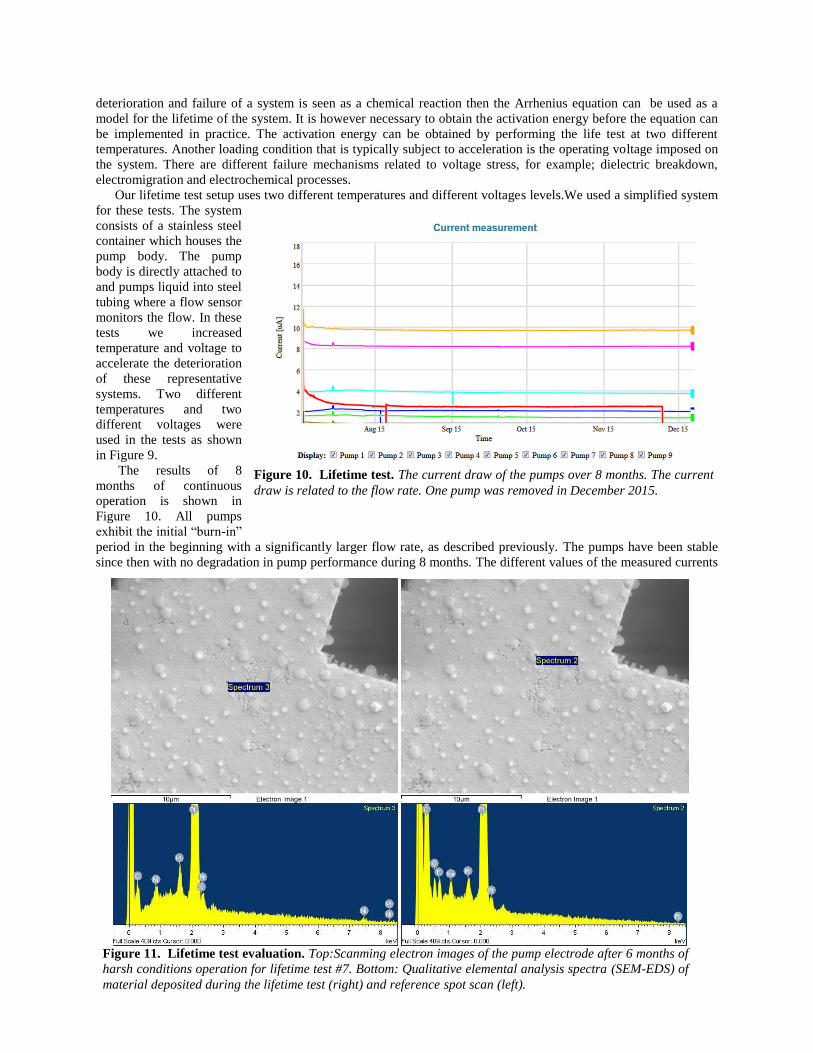
Figure 9. Lifetime test seup. Top: Two elevated
temperature controlled chambers housing 9 individual
lifetime tests.
International Conference on Environmental Systems
7
deterioration and failure of a system is seen as a chemical reaction then the Arrhenius equation can be used as a
model for the lifetime of the system. It is however necessary to obtain the activation energy before the equation can
be implemented in practice. The activation energy can be obtained by performing the life test at two different
temperatures. Another loading condition that is typically subject to acceleration is the operating voltage imposed on
the system. There are different failure mechanisms related to voltage stress, for example; dielectric breakdown,
electromigration and electrochemical processes.
Our lifetime test setup uses two different temperatures and different voltages levels.We used a simplified system
for these tests. The system
consists of a stainless steel
container which houses the
pump body. The pump
body is directly attached to
and pumps liquid into steel
tubing where a flow sensor
monitors the flow. In these
tests we increased
temperature and voltage to
accelerate the deterioration
of these representative
systems. Two different
temperatures and two
different voltages were
used in the tests as shown
in Figure 9.
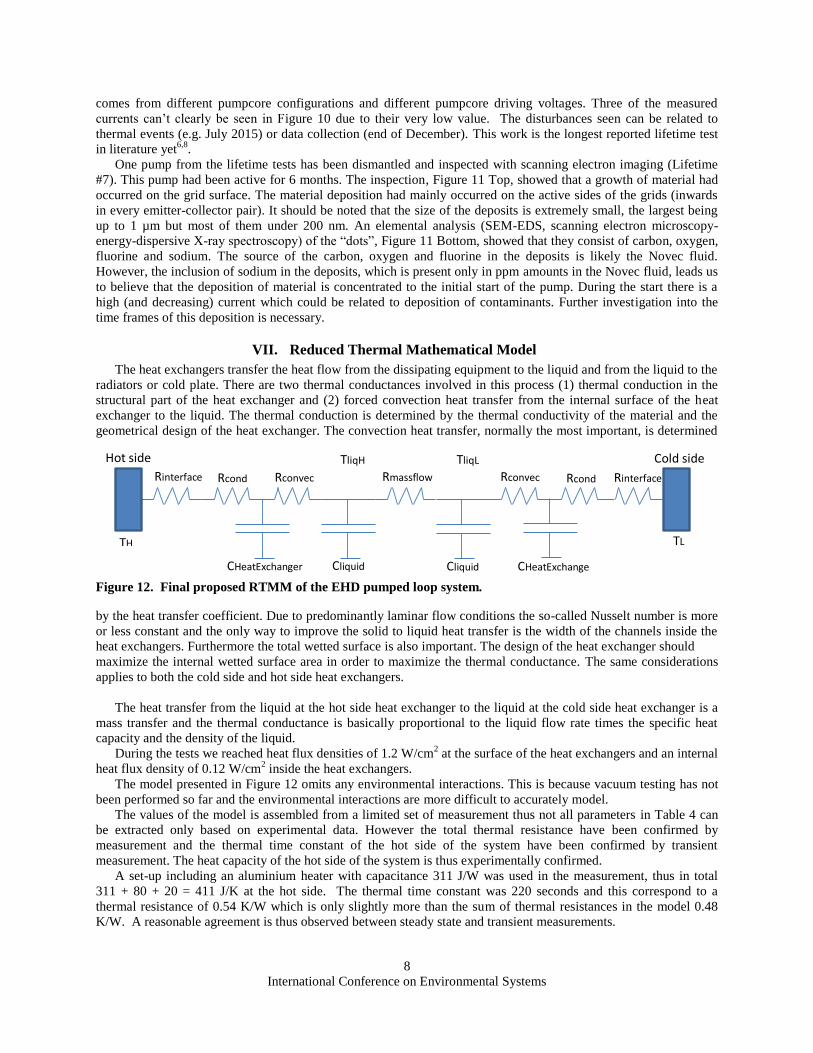
The results of 8
months of continuous
operation is shown in
Figure 10. All pumps
exhibit the initial “burn-in”
period in the beginning with a significantly larger flow rate, as described previously. The pumps have been stable
since then with no degradation in pump performance during 8 months. The different values of the measured currents
Figure 10. Lifetime test. The current draw of the pumps over 8 months. The current
draw is related to the flow rate. One pump was removed in December 2015.
Figure 11. Lifetime test evaluation. Top:Scanming electron images of the pump electrode after 6 months of
harsh conditions operation for lifetime test #7. Bottom: Qualitative elemental analysis spectra (SEM-EDS) of
material deposited during the lifetime test (right) and reference spot scan (left).
International Conference on Environmental Systems
8
comes from different pumpcore configurations and different pumpcore driving voltages. Three of the measured
currents can’t clearly be seen in Figure 10 due to their very low value. The disturbances seen can be related to
thermal events (e.g. July 2015) or data collection (end of December). This work is the longest reported lifetime test
in literature yet6,8
.
One pump from the lifetime tests has been dismantled and inspected with scanning electron imaging (Lifetime
#7). This pump had been active for 6 months. The inspection, Figure 11 Top, showed that a growth of material had
occurred on the grid surface. The material deposition had mainly occurred on the active sides of the grids (inwards
in every emitter-collector pair). It should be noted that the size of the deposits is extremely small, the largest being
up to 1 µm but most of them under 200 nm. An elemental analysis (SEM-EDS, scanning electron microscopy-
energy-dispersive X-ray spectroscopy) of the “dots”, Figure 11 Bottom, showed that they consist of carbon, oxygen,
fluorine and sodium. The source of the carbon, oxygen and fluorine in the deposits is likely the Novec fluid.
However, the inclusion of sodium in the deposits, which is present only in ppm amounts in the Novec fluid, leads us
to believe that the deposition of material is concentrated to the initial start of the pump. During the start there is a
high (and decreasing) current which could be related to deposition of contaminants. Further investigation into the
time frames of this deposition is necessary.
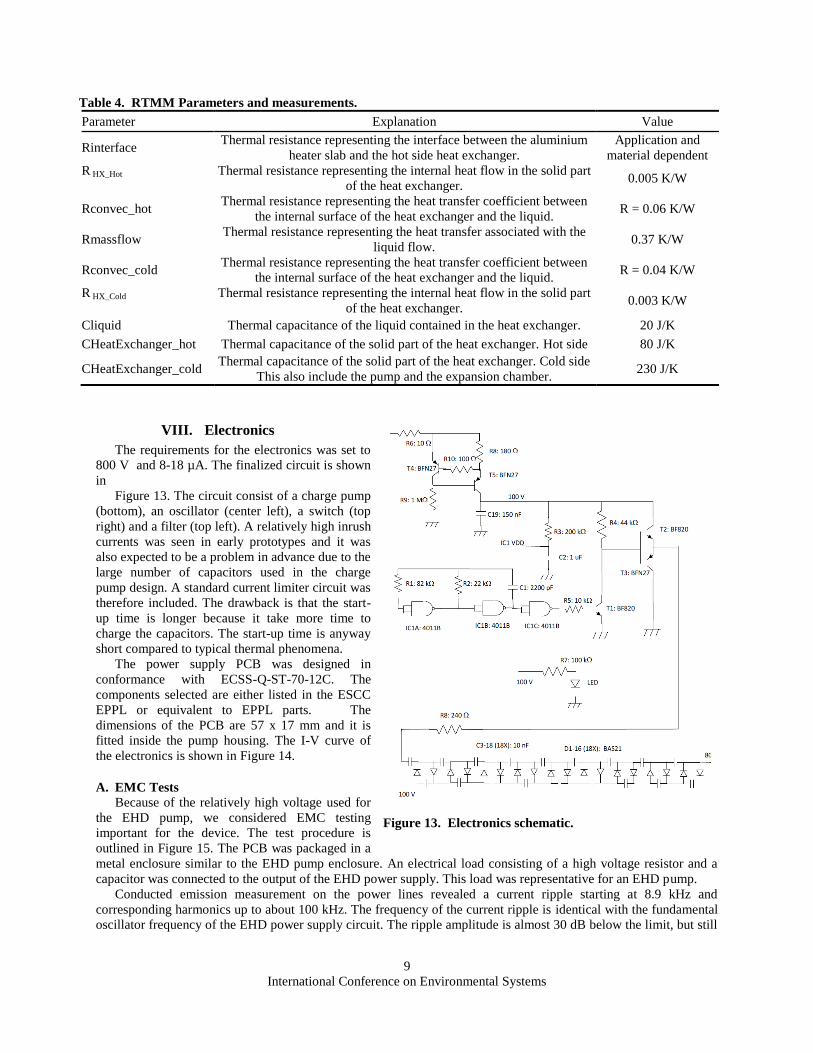
VII. Reduced Thermal Mathematical Model
The heat exchangers transfer the heat flow from the dissipating equipment to the liquid and from the liquid to the
radiators or cold plate. There are two thermal conductances involved in this process (1) thermal conduction in the
structural part of the heat exchanger and (2) forced convection heat transfer from the internal surface of the heat
exchanger to the liquid. The thermal conduction is determined by the thermal conductivity of the material and the
geometrical design of the heat exchanger. The convection heat transfer, normally the most important, is determined
by the heat transfer coefficient. Due to predominantly laminar flow conditions the so-called Nusselt number is more
or less constant and the only way to improve the solid to liquid heat transfer is the width of the channels inside the
heat exchangers. Furthermore the total wetted surface is also important. The design of the heat exchanger should
maximize the internal wetted surface area in order to maximize the thermal conductance. The same considerations
applies to both the cold side and hot side heat exchangers.
The heat transfer from the liquid at the hot side heat exchanger to the liquid at the cold side heat exchanger is a
mass transfer and the thermal conductance is basically proportional to the liquid flow rate times the specific heat
capacity and the density of the liquid.
During the tests we reached heat flux densities of 1.2 W/cm2 at the surface of the heat exchangers and an internal
heat flux density of 0.12 W/cm2 inside the heat exchangers.
The model presented in Figure 12 omits any environmental interactions. This is because vacuum testing has not
been performed so far and the environmental interactions are more difficult to accurately model.
The values of the model is assembled from a limited set of measurement thus not all parameters in Table 4 can
be extracted only based on experimental data. However the total thermal resistance have been confirmed by
measurement and the thermal time constant of the hot side of the system have been confirmed by transient
measurement. The heat capacity of the hot side of the system is thus experimentally confirmed.
A set-up including an aluminium heater with capacitance 311 J/W was used in the measurement, thus in total
311 + 80 + 20 = 411 J/K at the hot side. The thermal time constant was 220 seconds and this correspond to a
thermal resistance of 0.54 K/W which is only slightly more than the sum of thermal resistances in the model 0.48
K/W. A reasonable agreement is thus observed between steady state and transient measurements.
Figure 12. Final proposed RTMM of the EHD pumped loop system.
Hot side Cold side
Rcond Rcond Rconvec Rconvec Rmassflow
TliqH TliqL
Cliquid Cliquid
Rinterface Rinterface
CHeatExchanger CHeatExchange
r
TH TL
International Conference on Environmental Systems
9
VIII. Electronics
The requirements for the electronics was set to
800 V and 8-18 µA. The finalized circuit is shown
in
Figure 13. The circuit consist of a charge pump
(bottom), an oscillator (center left), a switch (top
right) and a filter (top left). A relatively high inrush
currents was seen in early prototypes and it was
also expected to be a problem in advance due to the
large number of capacitors used in the charge
pump design. A standard current limiter circuit was
therefore included. The drawback is that the start-
up time is longer because it take more time to
charge the capacitors. The start-up time is anyway
short compared to typical thermal phenomena.
The power supply PCB was designed in
conformance with ECSS-Q-ST-70-12C. The
components selected are either listed in the ESCC
EPPL or equivalent to EPPL parts. The
dimensions of the PCB are 57 x 17 mm and it is
fitted inside the pump housing. The I-V curve of
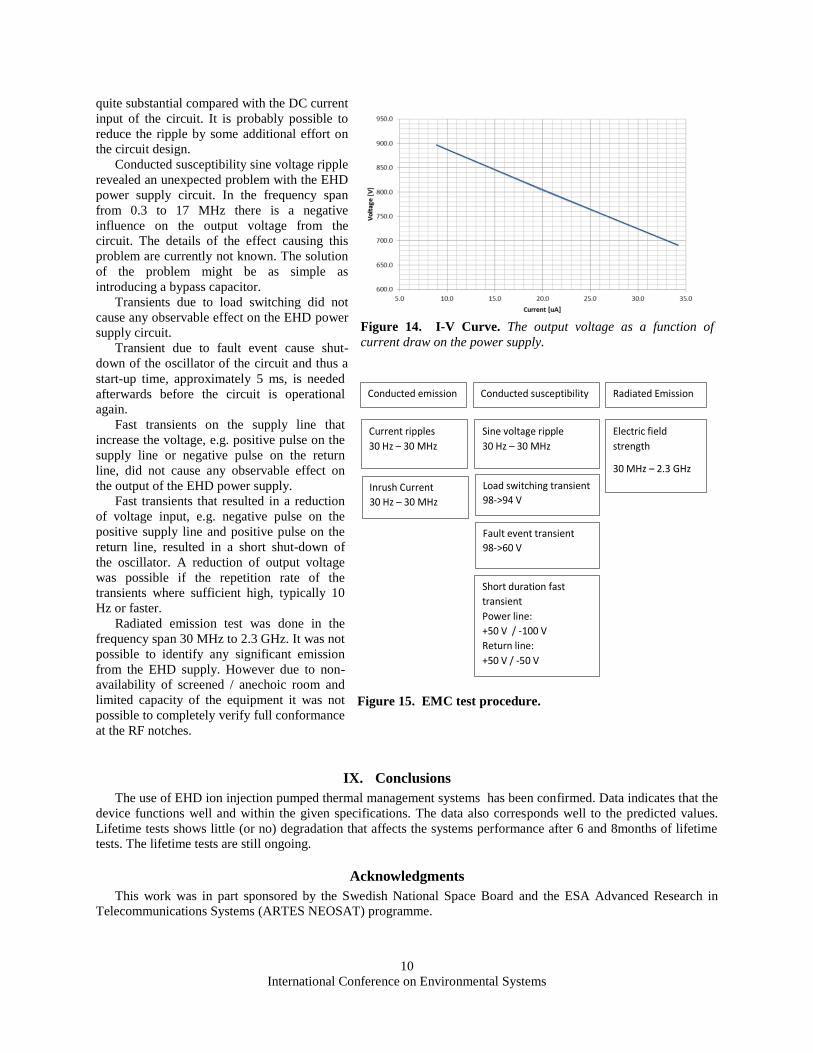
the electronics is shown in Figure 14.
A. EMC Tests
Because of the relatively high voltage used for
the EHD pump, we considered EMC testing
important for the device. The test procedure is
outlined in Figure 15. The PCB was packaged in a
metal enclosure similar to the EHD pump enclosure. An electrical load consisting of a high voltage resistor and a
capacitor was connected to the output of the EHD power supply. This load was representative for an EHD pump.
Conducted emission measurement on the power lines revealed a current ripple starting at 8.9 kHz and
corresponding harmonics up to about 100 kHz. The frequency of the current ripple is identical with the fundamental
oscillator frequency of the EHD power supply circuit. The ripple amplitude is almost 30 dB below the limit, but still
Figure 13. Electronics schematic.
Table 4. RTMM Parameters and measurements.
Parameter Explanation Value
Rinterface Thermal resistance representing the interface between the aluminium
heater slab and the hot side heat exchanger.
Application and
material dependent
R HX_Hot
Thermal resistance representing the internal heat flow in the solid part
of the heat exchanger. 0.005 K/W
Rconvec_hot Thermal resistance representing the heat transfer coefficient between
the internal surface of the heat exchanger and the liquid. R = 0.06 K/W
Rmassflow Thermal resistance representing the heat transfer associated with the
liquid flow. 0.37 K/W
Rconvec_cold Thermal resistance representing the heat transfer coefficient between
the internal surface of the heat exchanger and the liquid. R = 0.04 K/W
R HX_Cold
Thermal resistance representing the internal heat flow in the solid part
of the heat exchanger. 0.003 K/W
Cliquid Thermal capacitance of the liquid contained in the heat exchanger. 20 J/K
CHeatExchanger_hot Thermal capacitance of the solid part of the heat exchanger. Hot side 80 J/K
CHeatExchanger_cold Thermal capacitance of the solid part of the heat exchanger. Cold side
This also include the pump and the expansion chamber. 230 J/K
International Conference on Environmental Systems
10
quite substantial compared with the DC current
input of the circuit. It is probably possible to
reduce the ripple by some additional effort on
the circuit design.
Conducted susceptibility sine voltage ripple
revealed an unexpected problem with the EHD
power supply circuit. In the frequency span
from 0.3 to 17 MHz there is a negative
influence on the output voltage from the
circuit. The details of the effect causing this
problem are currently not known. The solution
of the problem might be as simple as
introducing a bypass capacitor.
Transients due to load switching did not
cause any observable effect on the EHD power
supply circuit.
Transient due to fault event cause shut-
down of the oscillator of the circuit and thus a
start-up time, approximately 5 ms, is needed
afterwards before the circuit is operational
again.
Fast transients on the supply line that
increase the voltage, e.g. positive pulse on the
supply line or negative pulse on the return
line, did not cause any observable effect on
the output of the EHD power supply.
Fast transients that resulted in a reduction
of voltage input, e.g. negative pulse on the
positive supply line and positive pulse on the
return line, resulted in a short shut-down of
the oscillator. A reduction of output voltage
was possible if the repetition rate of the
transients where sufficient high, typically 10
Hz or faster.
Radiated emission test was done in the
frequency span 30 MHz to 2.3 GHz. It was not
possible to identify any significant emission
from the EHD supply. However due to non-
availability of screened / anechoic room and
limited capacity of the equipment it was not
possible to completely verify full conformance
at the RF notches.
IX. Conclusions
The use of EHD ion injection pumped thermal management systems has been confirmed. Data indicates that the
device functions well and within the given specifications. The data also corresponds well to the predicted values.
Lifetime tests shows little (or no) degradation that affects the systems performance after 6 and 8months of lifetime
tests. The lifetime tests are still ongoing.
Acknowledgments
This work was in part sponsored by the Swedish National Space Board and the ESA Advanced Research in
Telecommunications Systems (ARTES NEOSAT) programme.
Figure 14. I-V Curve. The output voltage as a function of
current draw on the power supply.
Figure 15. EMC test procedure.
Conducted emission Conducted susceptibility Radiated Emission
Current ripples
30 Hz – 30 MHz
Inrush Current
30 Hz – 30 MHz
Sine voltage ripple
30 Hz – 30 MHz
Load switching transient
98->94 V
Fault event transient
98->60 V
Short duration fast
transient
Power line:
+50 V / -100 V
Return line:
+50 V / -50 V
Electric field
strength
30 MHz – 2.3 GHz

International Conference on Environmental Systems
11
Fabrice Mena, SC Thermal Engineer at Airbus Defence and Space, Toulouse, 31400, France and Patrick
Hugonnot, Thermal expert at Thales Alenia Space, Cannes, 06150, France are acknowledged for their contribution
to this paper.
References 1Castellanos, A., Electrohydrodynamics, CISM International Centre for Mechanical Sciences Series, Springer-Verlag, Wien,
1998. 2Seyed-Yagoobi, J., “Electrohydrodynamic pumping of dielectric liquids”, Journal of Electrostatics, Vol. 63, No. 6-10, June
2005, pp. 861-869. 3Pearson, M., “Micro-scale EHD conduction-driven pumping and heat transfer enhancement in single- and two-phase
systems”, PhD. Dissertation, Illinois Institute of Technology, Chicago, 2011. 4Pearson M. R., , Seyed-Yagoobi, J., “Experimental study of EHD conduction pumping at the meso- and micro-scale”,
Journal of Electrostatics, Vol. 69, No. 6, Dec 2011, pp. 479-485. 5Patel, V.K., Robinson, F., Seyed-Yagoobi, J., and Didion, J., "Terrestrial and Microgravity Experimental Study of
Microscale Heat-Transport Device Driven by Electrohydrodynamic Conduction Pumping", IEEE Transactions on Industry
Applications, Vol. 49, No. 6, pp. 2397-2401, Nov.-Dec. 2013. 6Bologa, M. K., Kozhukhar, I. A., Malakhov, A. V., and Balokhin, V. L., "Electrohydrodynamic pump service life”
Conduction and Breakdown in Dielectric Liquids,1993., ICDL '93., IEEE 11th International Conference on, pp. 561-565, 1993. 7Berrouche. Y., “Etude théorique et expérimentale de pompes électro-osmotiques et de leur utilisation dans une boucle de
refroidissement de l'électronique de puissance”, Ph.D. Dissertation, Laboratoire Génie Electrique de Grenoble, G2elab, Institut
polytechnique de Grenoble, Grenoble, France, 2008. 8Malakhov, J. V., "The effect of time factor upon the stability of output parameters of electrohydrodynamic converters,"
Dielectric Liquids, 1999. (ICDL '99) Proceedings of the 1999 IEEE 13th International Conference on, pp. 156-159, 1999. 9https://twiki.cern.ch/twiki/bin/view/LHCb/C6K 10Berthe P., Schubert K., Grantier J., Pietsch K., Angelillo P., Price L., “The Multi-purpose Crew Vehicle European Service
Module: a European Contribution to Human Exploration” AIAA