Development of an empirical aging model for Li-ion ...
25
HAL Id: hal-01394977 https://hal.archives-ouvertes.fr/hal-01394977 Submitted on 10 Nov 2016 HAL is a multi-disciplinary open access archive for the deposit and dissemination of sci- entific research documents, whether they are pub- lished or not. The documents may come from teaching and research institutions in France or abroad, or from public or private research centers. L’archive ouverte pluridisciplinaire HAL, est destinée au dépôt et à la diffusion de documents scientifiques de niveau recherche, publiés ou non, émanant des établissements d’enseignement et de recherche français ou étrangers, des laboratoires publics ou privés. Development of an empirical aging model for Li-ion batteries and application to assess the impact of V2G strategies on battery lifetime Martin Petit, Eric Prada, Valérie Sauvant-Moynot To cite this version: Martin Petit, Eric Prada, Valérie Sauvant-Moynot. Development of an empirical aging model for Li-ion batteries and application to assess the impact of V2G strategies on battery lifetime. Applied Energy, Elsevier, 2016, 172 (June), pp.398-407. 10.1016/j.apenergy.2016.03.119. hal-01394977
Transcript of Development of an empirical aging model for Li-ion ...
HAL Id: hal-01394977https://hal.archives-ouvertes.fr/hal-01394977
Submitted on 10 Nov 2016
HAL is a multi-disciplinary open accessarchive for the deposit and dissemination of sci-entific research documents, whether they are pub-lished or not. The documents may come fromteaching and research institutions in France orabroad, or from public or private research centers.
L’archive ouverte pluridisciplinaire HAL, estdestinée au dépôt et à la diffusion de documentsscientifiques de niveau recherche, publiés ou non,émanant des établissements d’enseignement et derecherche français ou étrangers, des laboratoirespublics ou privés.
Development of an empirical aging model for Li-ionbatteries and application to assess the impact of V2G
strategies on battery lifetimeMartin Petit, Eric Prada, Valérie Sauvant-Moynot
To cite this version:Martin Petit, Eric Prada, Valérie Sauvant-Moynot. Development of an empirical aging model forLi-ion batteries and application to assess the impact of V2G strategies on battery lifetime. AppliedEnergy, Elsevier, 2016, 172 (June), pp.398-407. �10.1016/j.apenergy.2016.03.119�. �hal-01394977�
Development of an empirical aging model for Li-ion batteries and application to assess the impact of V2G strategies on battery li/ etime
Martin Petit, Eric Prada, Valérie Sauvant-Moynot
IFP Energies nouvelles, Rond-point de l'échangeur de Solaize, BP3, 69360 Solaize
Abstract ln this paper an empirical capacity fade model for Li-ion batteries has been developed, calibrated
and validated for a NCA/C and a LFP/C Li-ion cell. Based on extensive experimental work, it is able to
describe both cycle and calendar effects on aging. The stress factors taken into account for each
aging mode are the state of charge and the tempe rature for calendar aging, and the temperature and
the current for cycle aging. A simple approach has been adopted in order to instantaneously apply
either cycle aging or calendar aging according to operating conditions and th us accurately mode!
aging effects due to dynamic operating conditions. This model has then been coupled to an
electrothermal model and integrated in a system simulation software application in order to assess
the effect of charging strategies and V2G on battery lifetime. When compared, LFP/C and NCA/C
exhibited different behaviors when submitted to V2G scenarios. Light V2G scenarios led to a low
aging for LFP/C based battery but tended to slightly increase the aging of NCA/C based battery
according to simulations.
1. Introduction

ln order to reduce fossil energy dependence and environmental impact of vehicles, new
regulations encourage car manufacturers towards vehicle electrification. This electrification raises
the issue of energy storage. Li-ion batteries are one of the most promising solutions to store the
energy needed for highly electrified vehicles: hybrid electrical vehicles (HEV), plug-in hybrid vehicles
(PHEV) or full electric vehicles (EV). However, energetic and power performance of Li-ion batteries is
known to decrease during their service lifetime (1).
Although the cost of battery packs is decreasing [2], they comprise a significant proportion of
market vehicle price, which means car manufacturers have to provide a guaranteed longevity
ensuring a safe and sufficient battery performance throughout the vehicle service lifetime.
Therefore, battery aging studies are of particular interest in order to optimize battery systems in
terms of size and cooling requirements, and also to devise management strategies well suited along
the vehicle lifetime. Providing a minimum level of performance is also mandatory to ensure financial
viability for electrified vehicles. For such concerns, modeling is essential to provide car designers with
information and reduce development costs.
White the main microscopie aging phenomena of Li-ion cells have been identified [1,3) and
described, for instance Li plating at low temperature (4), loss of active material at elevated
temperature (5) or solid electrolyte interphase (SEI) growth at the negative electrode/electrolyte
interface [6,7), aging of Li-ion batteries remains difficult to predict [8,9]. ln most aging models,
considering that SEI growth is the main cause of aging for Li-ion batteries with graphite negative
electrode leads to a quadratic evolution shape of the capacity loss in the beginning of the battery lite
as put forward by Spotnitz (10).
To find the main impact factors, research efforts have been dedicated to model macroscopic Li
ion cell capacity loss and impedance increase (11,12). The main aging factors are the state of charge,
SoC, the depth of discharge during cycle, DoD, the temperature, T, and current, /. Another key
impact factor is the battery usage (13) which can be described in two contributions to aging :

Calendar aging (/ = O): the battery is stored without being used so there is no current
through the battery
Cycle aging (/ -:/: 0): the battery is either charged or discharged.
lt has been shown that the two types of aging will lead to different battery behaviors with usually
a higher capacity loss and higher power loss during cycle aging (13].
ln order to model aging phenomena, two different approaches have been put forward in the
literature, which are physical modeling (14-16] and empirical modeling (10,17]. Usually empirical
models will address either calendar aging (10,13] or cycle aging (11]. Sorne other modeling works
include both cycle and calendar aging behaviors [18-20] but the proposed model despite describing
cycle aging does not take into account the charging rate on aging. The resulting model assesses the
capacity loss as a function of time and constant stress factors which has little application in use. lt is
not convenient to use this kind of modeling for system simulation where stress factors are
dynamically varying for instance due to environmental conditions {temperature variations due to
seasons and day and night successions) or due to vehicle use {storage Soc depending on the duty
cycle).
ln this paper, an empirical capacity fade model suitable for system simulation application is
described. This model has been calibrated for two li-ion technologies and validated against
experimental data and is used to assess the usefulness of different charging strategies in order to
preserve the batteries' performance throughout their lifetime.
2. Mode/ development The capacity fade model is based on 2 contributions leading to different capacity lasses in Ah:
Qf0a}5 due to calendar aging and Qf:S~ due to cycle aging.
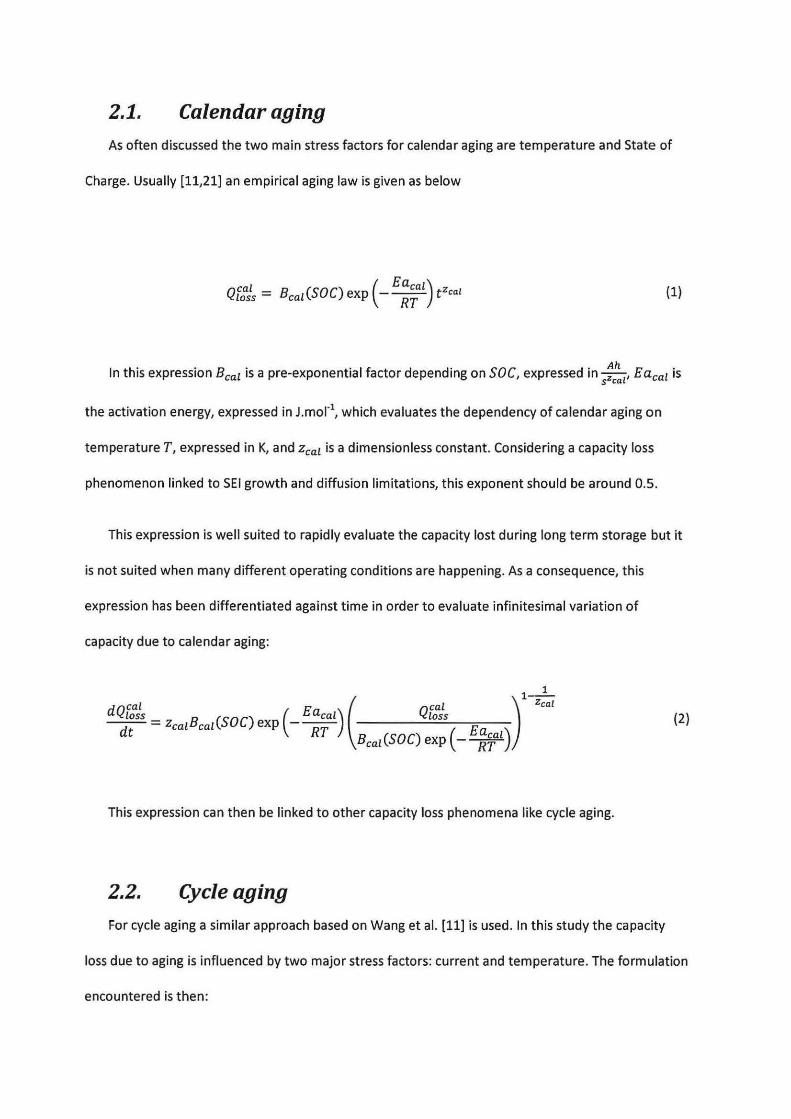
2.1. Calendar aging
As often discussed the two main stress factors for calendar aging are temperature and State of
Charge. Usually [11,21) an empirical aging law is given as below
(1)
ln this expression Bcal is a pre-exponential factor depending on SOC, expressed in :h1, Eacal is
s ca
the activation energy, expressed in J.mor1, which evaluates the dependency of calendar aging on
temperature T, expressed in K, and Zcal is a dimensionless constant. Considering a capacity loss
phenomenon linked to SEI growth and diffusion limitations, this exponent should be a round O.S.
This expression is well suited to rapidly evaluate the capacity lost during long term storage but it
is not suited when many different operating conditions are happening. As a consequence, this
expression has been differentiated against time in order to evaluate infinitesimal variation of
capacity due to calendar aging:
1-1-
dQcal E ( Qcal ) Zcal ~ _ B (SOC) (- acal) loss - Zcal cal exp E dt RT Bca1(SOC) exp (- ~Tal)
(2)
This expression can then be linked to other capacity loss phenomena like cycle aging.
2.2. Cycle aging
For cycle aging a similar approach based on Wang et al. [11) is used. ln this study the capacity
loss due to aging is influenced by two major stress factors: current and temperature . The formulation
encountered is then:

cyc (-Eacyc + al/I) Qloss = Bcyc exp RT AhZcyc (3)
ln this expression, Bcyc is a pre exponential factor in Ah1-zcyc which depends on current, Eacyc
is an activation energy for cycle aging expressed in J.mor1, ais a coefficient for aging acceleration
due to current expressed in J.mor1A1, Zcyc is an exponent constant that should be around 0.5 for
diffusion limited process. Finally, Ah stands for Ah throughput, that is the amount of charge sent into
the cell. As it has been done for calendar aging, this expression has been differentiated against time:
dQ~:S~ III (-Eacyc + alll) ( Q~:S~ )'-,~, (4) ~ = 3600 ZcycBcyc(/) exp RT (-Eacyc + al/I)
Bcyc (/) exp RT
ln this expression, the Ah throughput term, once differentiated, is proportional to the current in
the cell.
2.3. Switch between calendar and cycle aging
Once the influence on aging has been expressed for both behaviors, it is necessary to find a way
to decide what kind of aging is occurring based on the actual operating conditions. The assumption
here is that when the modeling of cycle aging has been performed, calendar aging occurring during
cycle mode is already taken into account. As a consequence, we need to find a condition describing
the switch between calendar and cycle mode.
First, taking as a major phenomenon of capacity loss the SEI formation at the negative electrode,
it is known that the parasitic reaction of SEI formation is accelerated when the negative electrode
potential is lower (i.e. during charge or when the SOC is high). As a consequence it has been assumed
that cycle aging only occurs when the battery is in charge and the current is above a given threshold
Icyc since higher charge current will lead to lower potential at the negative electrode. Furthermore,

in order to assess the fact that diffusion in the cell tends to increase the overpotential when the
charge is longer and then increases the rate of the SEI formation reaction, the current in d~f~
expression (4) is replaced by a filtered current Ï. As a consequence the total capacity loss is
computed as follows:
{
dQcal ~ ~Ï<l
dQ1oss = dt cyc dt dQcyc
~~Ï>l dt cyc
(5)
This given threshold will depend on the battery ability to tackle high charging rates. For example
high power batteries should have a high threshold around lC current whereas high energy batteries
designed for lower charging rates should have a lower threshold.
2.4. Coupling with an electrothermal mode/ of the battery
behavior
ln order to get a global model of the electrothermal behavior of a Li-ion cell, it is necessary to
couple this aging model with an electrothermal model. ln Figure 1 are represented the inputs and
outputs of both models as well as the coupling involved.
The electrothermal model evaluates the state of charge (SOC), the voltage (Veen) and the
temperature (Tceu) of the battery based on the input current (1) and external temperature (Ta). lt
provides the empirical aging model with the SOC and the Tcen allowing it to evaluate the residual
capacity Cres · This residual capacity is then used in the electrothermal model to evaluate the SOC as
follows:
100 f t I SOC = SOCo + 3600 o Cres(t) dt
(6)
3. Experimental validation
3.1. Calibration data
ln order to calibrate the empirical model presented in this paper, extensive experimental data
are needed in order to get a wide range of operating conditions representative of the battery use.
Experimental campaigns have been carried out by research groups in order to assess bath cycle and
calendar behavior of Li-ion batteries [12,18,20-23). Two sets of calibration data are indeed necessary
in order to take into account bath types of aging. ln these sets, experiments highlighting every stress
factor are needed. As a consequence a significant amount of experimental data was needed and was
collected in the literature for calendar aging [24) as well as for cycle aging [11,25).
Thanks to these data, it has been possible to calibrate the capacity loss model on two different
battery technologies:
A123s 2.3 Ah LFP/C cell
Saft VLGP 7 Ah NCA/C cell
The parameters used for these technologies are indicated in Table 1. ln the following section we
will discuss in detail the validation for the A123s model.
3.2. Validation of empirical model
3.2.1. Normalized profiles

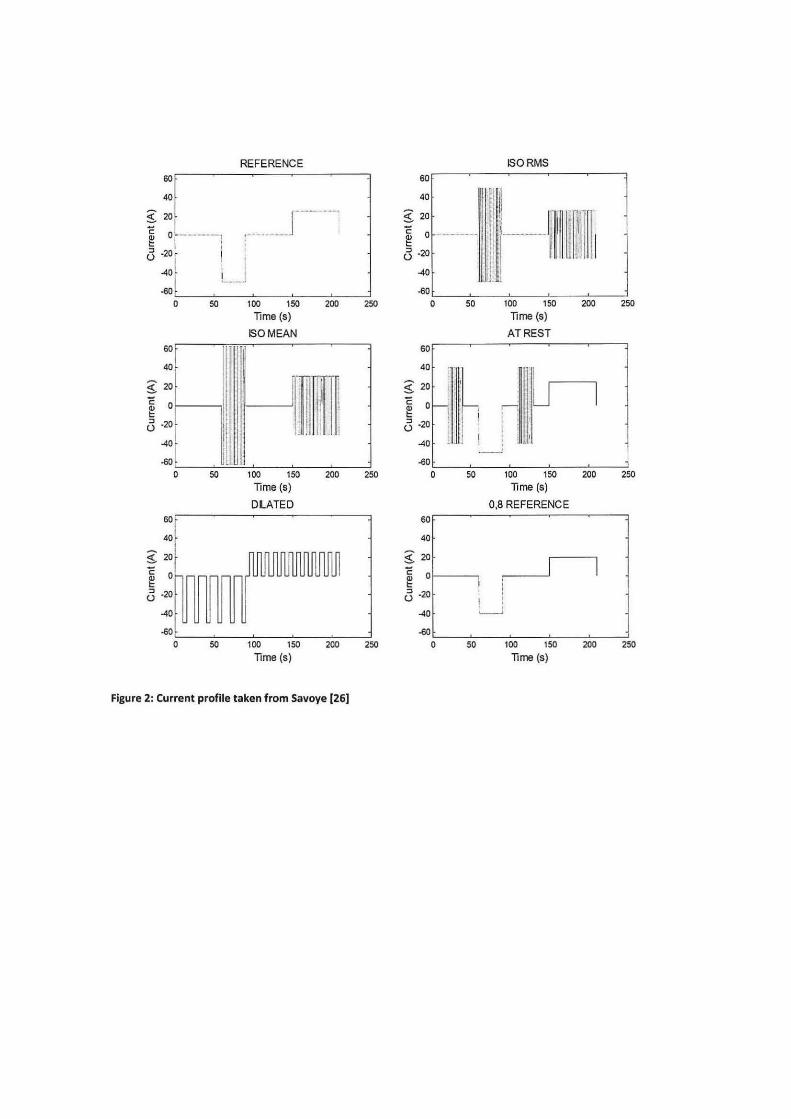
Extensive experimental studies from Savoye [26] have subjected an A123s 2.3 Ah cell to various
cycle conditions in order to evaluate the cycling impact on Li-ion batteries aging. The aim was to
discuss the aging impact in an automotive application and especially the impact of short current
pulses on aging. The current profiles represented in Figure 2 are looped at 25°C and 45°C over more
than 4000 cycles. These current profiles interestingly caver various cycle profiles with highly dynamic
pulses at several different rates (ISO RMS and ISO MEAN), moderately dynamic pulses (DILATED) and
slow solicitations (REFERENCE or 0.8 REFERENCE), as well as mixed sa licitations (AT REST).
The comparison between experimental and simulation results using the empirical aging model
described above is presented in Figure 3. lt shows a good agreement between experimental results
and simulations with less than 5% error for capacity loss lower than 20% except for the ISO MEAN
condition where the model overestimates the capacity loss by 14%. These results seem encouraging
for using this model in automotive applications.
3.2.2. Road profile
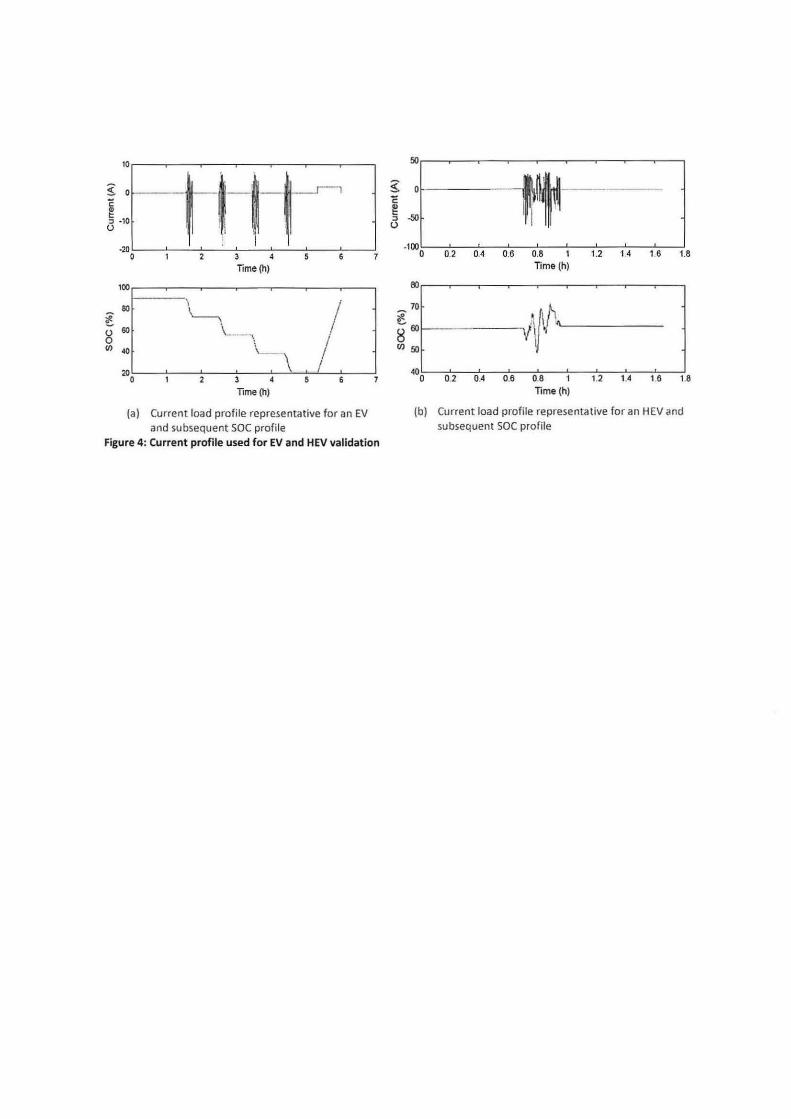
ln order to further validate the empirical model on actual data representative of vehicle use,
aging measurements have been performed at cell level on IFPEN test benches [27]. Two different
load profiles representative respectively of EV and HEV were looped. For the EV load profile (Figure
4-a), the program consisted of 4 charge depleting cycles followed by a constant current charge in
order to get back to the initial SOC. The HEV load profile (Figure 4-b) consists of a charge-sustaining
current profile which maintains the SOC around 60%. The maximum current involved in the HEV
profile is a round 50 A whereas it remains lower than 20 A in the EV profile.
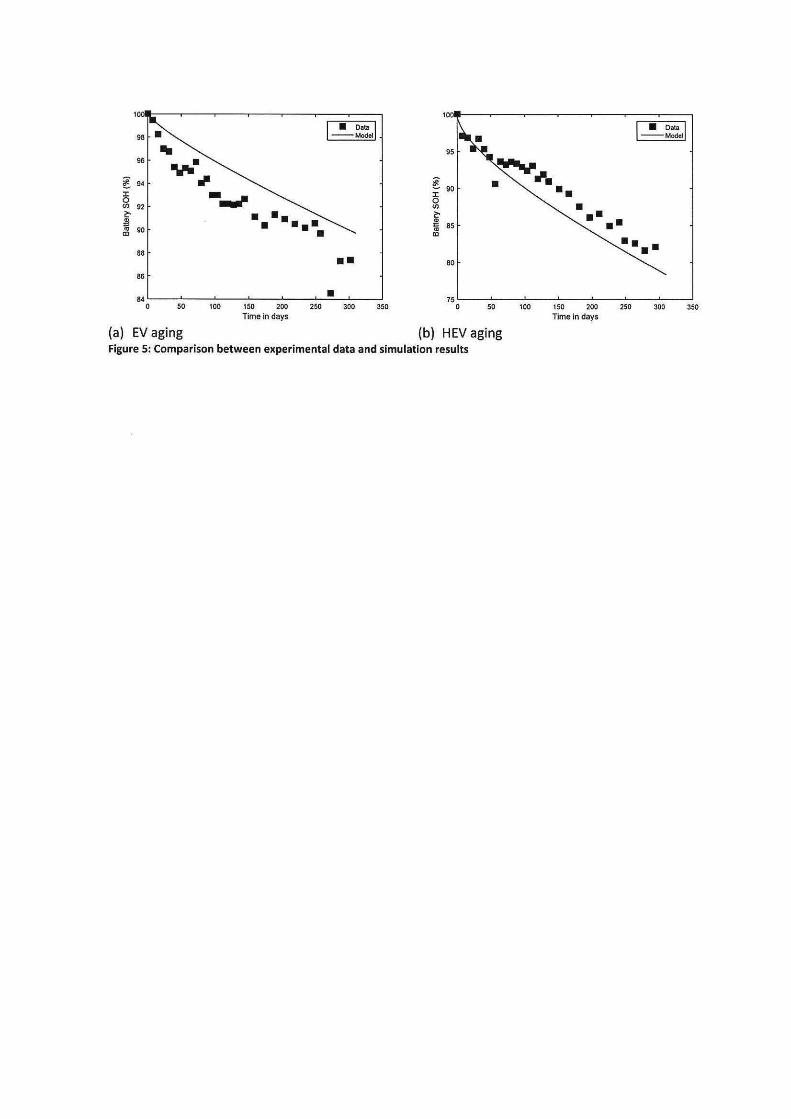
ln Figure 5, it is possible to verify that the model is able to predict accurately capacity loss for
bath aging patterns (EV in Figure 5-a and HEV in Figure 5-b). lt is then possible to use this model in
automotive application.
4. Applications for lifetime prediction
This capacity loss empirical model has been implemented in LMS lmagine.Lab Amesim™
dedicated to system simulation. lt can then be used in realistic operating conditions in order to adapt
the charging strategies taking into consideration the long term issue of aging. ln this scope we
focused on a study that will discuss the impact of the recharge strategy of an electric vehicle fitted
with a LFP-C battery or a NCA-C battery.
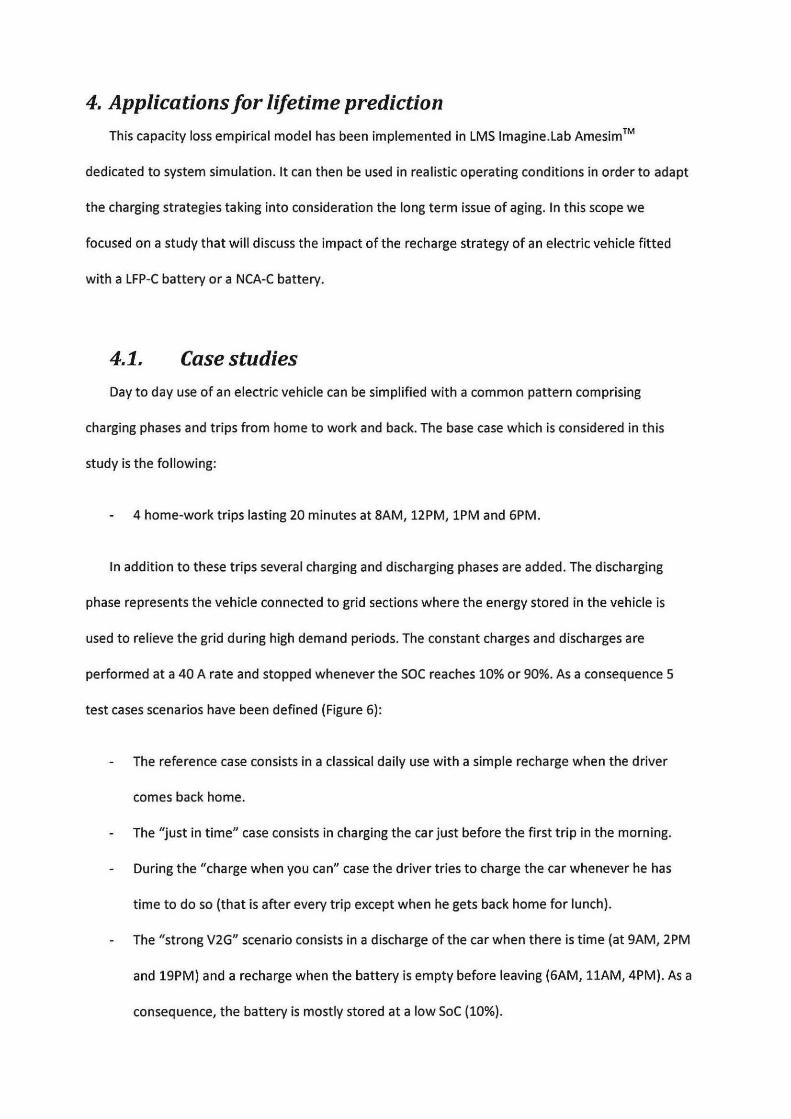
4.1. Case studies
Day to day use of an electric vehicle can be simplified with a common pattern comprising
charging phases and trips from home to work and back. The base case which is considered in this
study is the following:
4 home-work trips lasting 20 minutes at SAM, 12PM, lPM and GPM.
ln addition to these trips several charging and discharging phases are added. The discharging
phase represents the vehicle connected to grid sections where the energy stored in the vehicle is
used to relieve the grid during high demand periods. The constant charges and discharges are
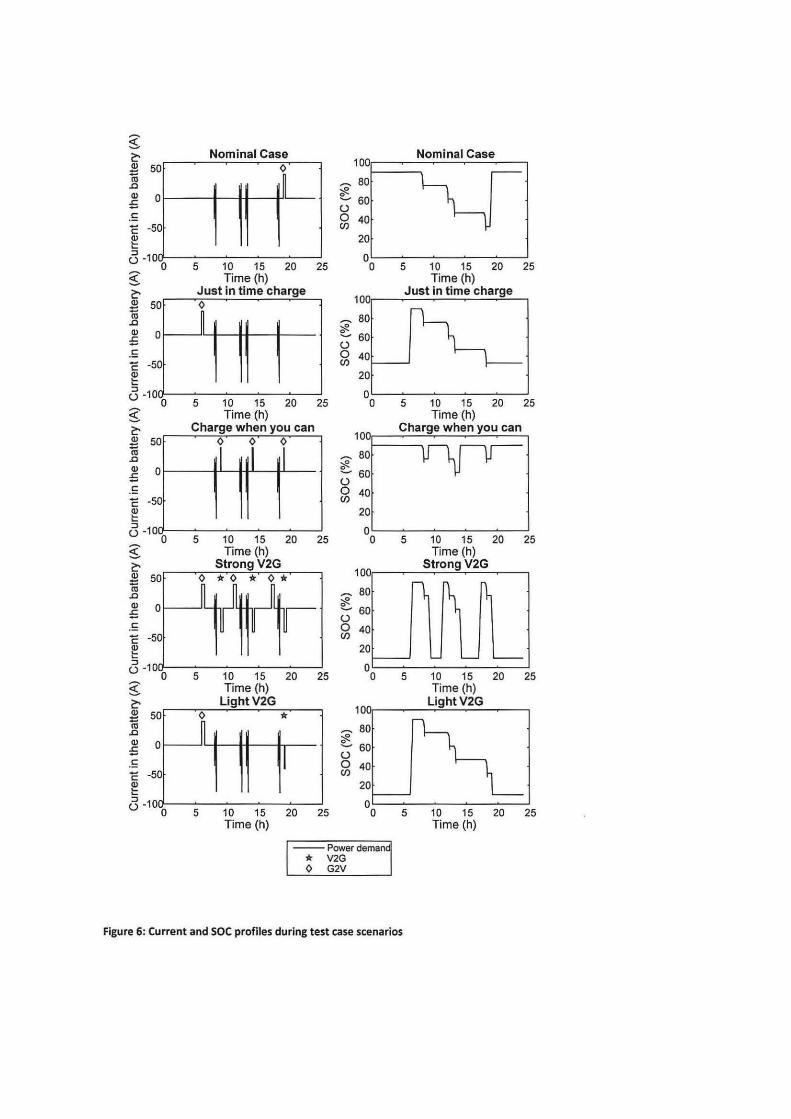
performed at a 40 A rate and stopped whenever the SOC reaches 10% or 90%. As a consequence 5
test cases scenarios have been defined (Figure 6):
The reference case consists in a classical daily use with a simple recharge when the driver
cornes back home.
The "just in time" case consists in charging the car just before the first trip in the morning.
During the "charge when you can" case the driver tries to charge the car whenever he has
time to do so (that is after every trip except when he gets back home for lunch).
The "strong V2G" scenario consists in a discharge of the car when there is time (at 9AM, 2PM
and 19PM) and a recharge when the battery is empty before leaving (GAM, llAM, 4PM). As a
consequence, the battery is mostly stored at a low Soc (10%).
The "light V2G" scenario is only considering a discharge of the battery when the driver cornes
back home at the end of the day.
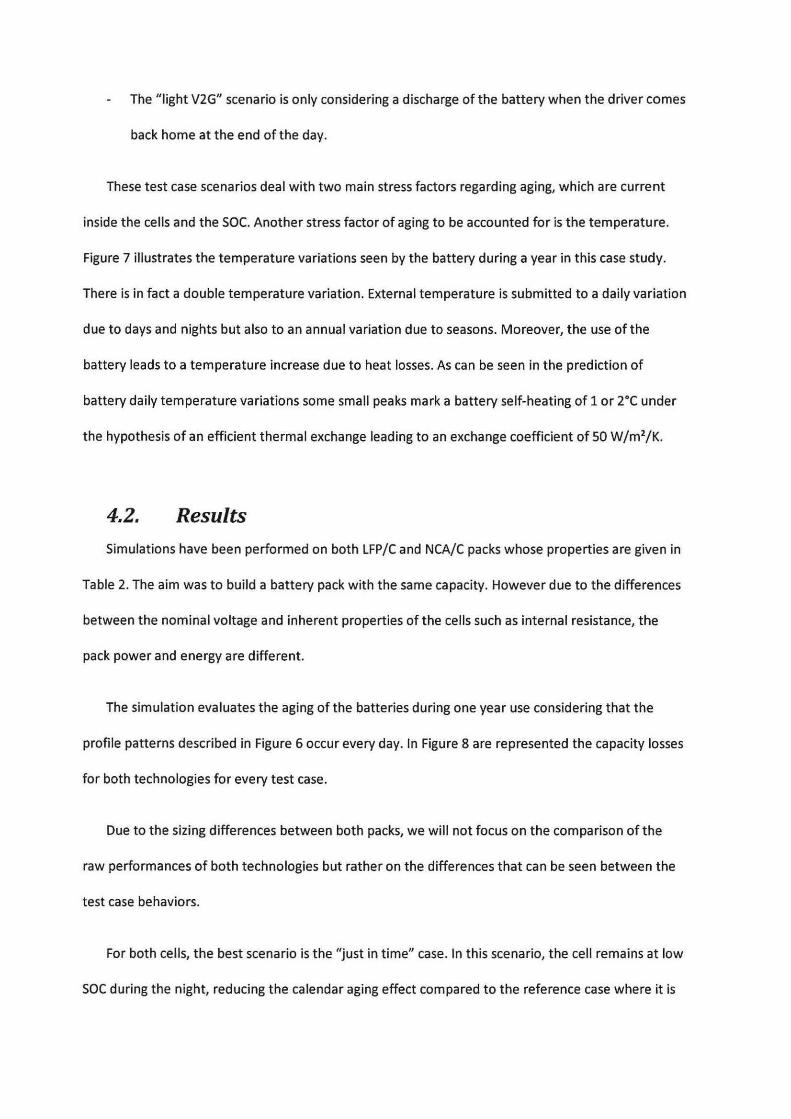
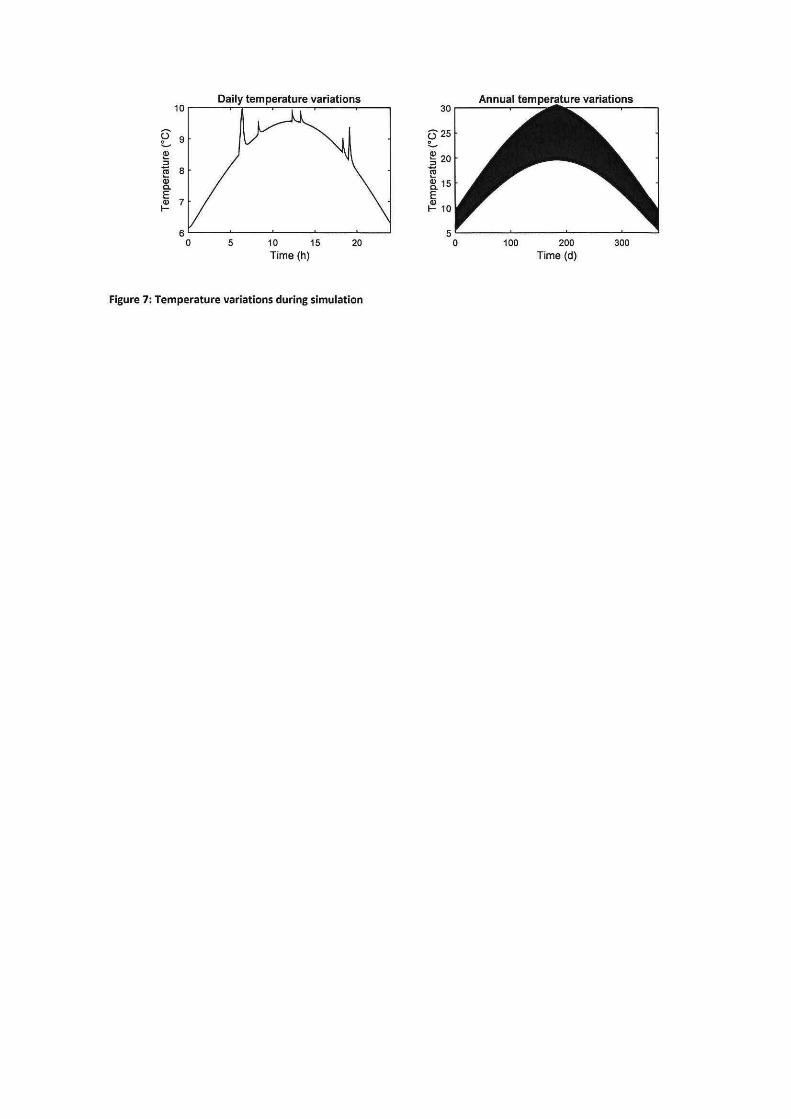
These test case scenarios deal with two main stress factors regarding aging, which are current
inside the cells and the SOC. Another stress factor of aging to be accounted for is the temperature.
Figure 7 illustrates the temperature variations seen by the battery during a year in this case study.
There is in tact a double temperature variation. External temperature is submitted to a daily variation
due to days and nights but also to an annual variation due to seasons. Moreover, the use of the
battery leads to a temperature increase due to heat losses. As can be seen in the prediction of
battery daily temperature variations some small peaks mark a battery self-heating of 1 or 2°C under
the hypothesis of an efficient thermal exchange leading to an exchange coefficient of 50 W/m2/K.
4.2. Results
Simulations have been performed on both LFP/C and NCA/C packs whose properties are given in
Table 2. The aim was to build a battery pack with the sa me capacity. However due to the differences
between the nominal voltage and inherent properties of the cells such as internai resistance, the
pack power and energy are different.
The simulation evaluates the aging of the batteries du ring one year use considering that the
profile patterns described in Figure 6 occur every day. ln Figure 8 are represented the capacity losses
for both technologies for every test case.
Due to the sizing differences between both packs, we will not focus on the comparison of the
raw performances of both technologies but rather on the differences that can be seen between the
test case behaviors.
For both cells, the best scenario is the "just intime" case. ln this scenario, the cell remains at low
SOC during the night, reducing the calendar aging effect compared to the reference case where it is
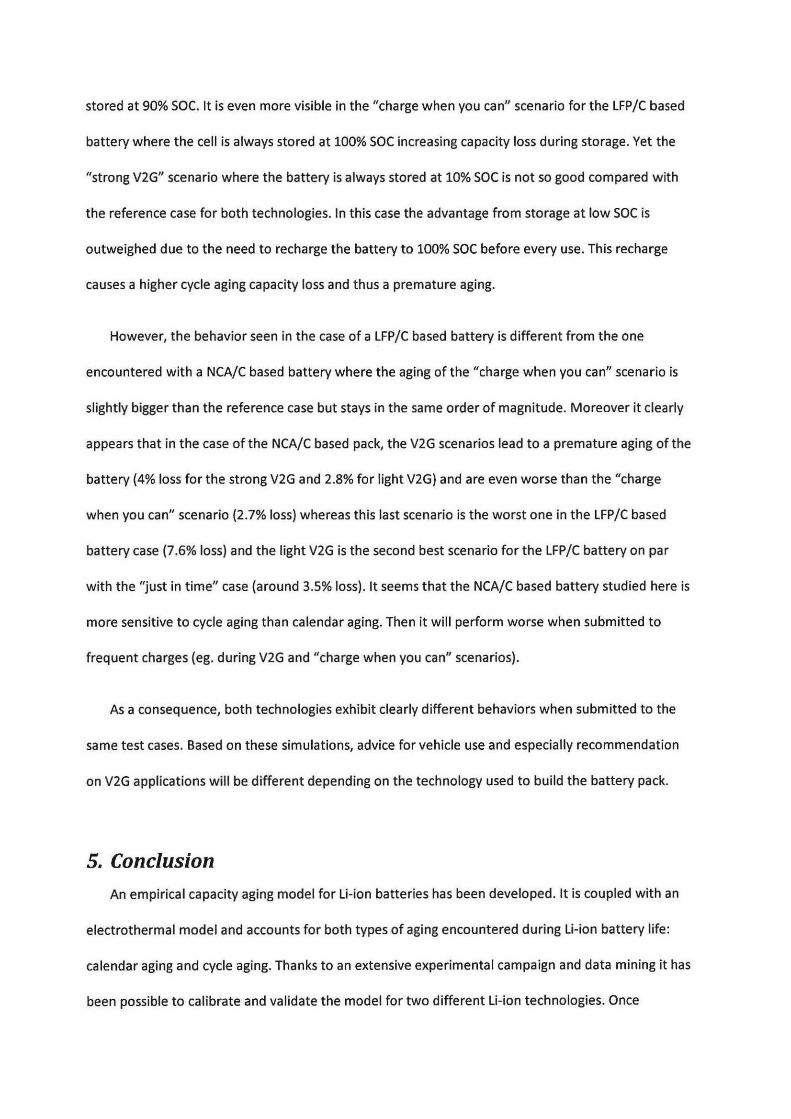
stored at 90% SOC. lt is even more visible in the "charge when you can" scenario for the LFP/C based
battery where the cell is always stored at 100% SOC increasing capacity loss during storage. Yet the
"strong V2G" scenario where the battery is always stored at 10% SOC is not so good compared with
the reference case for both technologies. ln this case the advantage from storage at low SOC is
outweighed due to the need to recharge the battery to 100% SOC before every use. This recharge
causes a higher cycle aging capacity loss and th us a premature aging.
However, the behavior seen in the case of a LFP/C based battery is different from the one
encountered with a NCA/C based battery where the aging of the "charge when you can" scenario is
slightly bigger than the reference case but stays in the same order of magnitude. Moreover it clearly
appears that in the case of the NCA/C based pack, the V2G scenarios lead to a premature aging of the
battery (4% loss for the strong V2G and 2.8% for light V2G) and are even worse than the "charge
when you can" scenario (2.7% loss) whereas this last scenario is the worst one in the LFP/C based
battery case (7.6% loss) and the light V2G is the second best scenario for the LFP/C battery on par
with the "just in time" case (a round 3.5% loss). lt seems that the NCA/C based battery studied here is
more sensitive to cycle aging than calendar aging. Then it will perform worse when submitted to
frequent charges (eg. during V2G and "charge when you can" scenarios).
As a consequence, both technologies exhibit clearly different behaviors when submitted to the
sa me test cases. Based on these simulations, advice for vehicle use and especially recommendation
on V2G applications will be different depending on the technology used to build the battery pack.
5. Conclusion
An empirical capacity aging model for Li-ion batteries has been developed. lt is coupled with an
electrothermal model and accounts for both types of aging encountered during Li-ion battery life:
calendar aging and cycle aging. Thanks to an extensive experimental campaign and data mining it has
been possible to calibrate and validate the model for two different Li-ion technologies. Once
validated, the model has been integrated in a system simulation software application in order to
assess the behavior of the cells when submitted to various test case scenarios. These simulations
showed some major differences between both technologies, the NCA/C based battery proved to be
more sensitive to cycle aging compared to the LFP/C cell leading to a premature aging when
submitted to frequent charges of the V2G scenarios.
This approach proved to be appropriate in order to evaluate the charging strategies that could be
applied to an electrical vehicle in order to reduce its aging and in doing so increase its lifetime and
cost efficiency. lt is then able to accurately model the specific behaviors of both cells used in this
study leading to recommend a light V2G strategy for the LFP/C based cell when it should rather be
avoided in the case of the NCA/C based battery.
This study only focuses on the capacity loss due to aging. However, it is known that batteries also
exhibit resistance increase. This increase has been neglected here since in the case of both cells used
this resistance increase remained low even at the end of life. However, for other cells this may not be
the case. As a consequence further work should be done in order to apply this approach for power
loss.
6. References [1] J. Vetter, P. Novak, M.R. Wagner, C. Veit, K.C. Moller, J.O. Besenhard, M. Winter, M. Wohlfahrt-Mehrens, C. Vogler, A.
Hammouche, J.Power Sources 147 (2005) 269- 281.
[2] B. Nykvist, M. Nilsson, Nature Cliniate change 5 (2015) 329- 332.
[3] M. Broussely, P. Biensan, F. Bonhomme, P. Blanchard, S. Herreyre, K. Nechev, R.J. Staniewicz, J.Power Sources 146
(2005) 90-96.
(4) N. Legrand, B. Knosp, P. Desprez, F. Lapicque, S. Raël, J.Power Sources 245 (2014) 208- 216.
[5] Q. Zhang, Q. Guo, R.E . White, J.Power Sources 165 (2007] 427-435.
[6] M. Kassem, J. Bernard, R. Revel, S. Pélissier, F. Duclaud, C. Delacourt, J.Power Sources 208 (2012) 296-305.

[7] M. Kassem, C. Delacourt, J.Power Sources 235 (2013) 159-171.
[8] J. Groot, M. Swierczynski, A.I. Stan, S.K. KëEr, J.Power Sources 286 (2015) 475-487.
[9] M. Klett, R. Eriksson, J. Groot, P. Svens, K.C. Hogstrom, R.W. Lindstom, H. Berg, T. Gustafson, G. Lindbergh, K. Edstréim,
J.Power Sources 257 (2014) 126-137.
(10] Spotnitz R., J.Power Sources 113 (2003) 72-80.
(11] J. Wang, P. Liu, J. Hicks-Garner, E. Sherman, S. Soukiazian, M. Verbrugge, 1-1 . Tata ria, J. M usser, P. Finamore, J.Power
Sources 196 (2011) 3942-3948.
[12] M. Ecker, N. Nieto, S. Kabitz, J. Schmalstieg, H. Blanke, A. Warnecke, D.U. Sauer. J.Power Sources 248 (2014) 839-851.
[13] 1. Bloom, B.G. Patter, C.S. Johnson, K.L. Gering, J.P. Christophersen, J.Power Sources 155 (2006) 415-419.
[14] J. Newman, K.E. Tho mas-Alyea, Electrochemical Systems (3rd ed.), Jo hn Wiley & Sons, lnc, Hoboken, New Jersey, 2004.
(15] E. Prada, D. Di Domenico, Y. Creff, J. Bernard, V. Sauvant-Moynot, F. Huet, J.Electrochem.Soc. 160 (2013) A616-A628.
(16] M. Safari, M. Morcrette, A. Teyssot, C. Delacourt, J.Electrochem.Soc. 156 (2009) A145- A153.
[17] M. Broussely, S. Herreyre, P. Biensan, P. Kasztejna, K. Nechev, R.J. Staniewicz, J.Power Sources 97-98 (2001) 13- 21.
(18] J. Belt, V. Utgikar, 1. Bloom, J.Power Sources 196 (2011) 10213-10221.
(19] M . Ecker, J.B. Gerschler, J. Vogel, S. Kabitz, F. Hust, P. Dechent, D.U. Sauer, J.Power Sources 215 (2012) 248-257.
[20] J. Schmalstieg, S. Kabitz, M. Ecker, D.U. Sauer, pp. 1-12.
[21] 1. Bloom, B.W. Cole, J.J. Sohn, S.A. Jones, E.G. Polzin, V.S. Battaglia, G.L Henriksen, C. Motloch, R. Richardson, T.
Unkelhaeuser, D. lnge rso ll, H.L Case, J.Power Sources 101 (2001) 238-247.
[22] R.G. Jungst, G. Nagasubramanian, H.L Case, B.Y. Liaw, A. Urbina, T.L. Paez. D.H. Doughty, J.l'ower Sources 119-121
(2003) 870-873.
[23] R.B. Wright, C.G. Motloch, J.R. Belt, J.P. Christophersen, C.D. Ho, R.A. Richardson, 1. Bloom, S.A. Jones, V.S. Battaglia,
G.L. Henriksen, T. Unkelhaeuser, D. lngersoll, H.L. Case, S.A. Rogers, R.A. Sutula, J.Power Sources 110 (2002) 445-470.
(24] S. Grolleau, B. M olina-Concha, A. Delaille, R. Revel, J. Bernard, S. Pelissier, J. Peter, ECS Transactions 45 (2013) 73-81.
[25] P. Gyan, P. Aubret, J. Hafsaoui, F. Sellier, S. Bourlot, S. Zinola, F. Badin, Oil and Gas Science and Technology - Rev. IFP
Energies nouvelles 68 (2013) 137-147.
[26] F. Savoye, Impact des impulsions périodiques de courant sur la performance et la durée de vie des accumulateurs
lithium-ion et conséquences de leur mise en œuvre dans une application transport. PhD, Laboratoire Ampère, 2012.
[27] J. Bernard, R. Revel, D. Audigier, in: Batteries: The International Energy & Power Supply conference and Exhibition,
2013.


l VceJJ -~
Empirical soc
T electrothermal model of a
~ a Li-ion battery T ceU - -
Empirical capacity loss - model -
1
Figure 1: Representation of the coupling between an electrothermal model and the empirical aging model
60
40
g 20
60
40
g 20
ë 0 ê 8 ·20
-40
-60
60
40
g 20
ë 0 ê 8 -20
-40
.so
0 50
1
0 50
0 50
REFERENCE
, ________ _! ____ _ i
100 150 200
Time (s)
ISO MEAN
1 ~ l 1
100 150 200
Time (s)
DLATED
100 150 200
Time (s)
Figure 2: Current profile taken from Savoye (26)
250
250
250
60
40
g 20
ë o ê 8 ·20
-40
ISORMS
.so,__~--'-~~-'-~~--'-~~-'--~--' 0
60
40
g 20
ë 0 ê 8 ·20
-40
50 100 150 200 250
Time (s)
AT REST
.so ,__~--'-~~-'-~~--'-~~-'-~--' 0 50 100 150 200 250
Time (s)
0,8 REFERENCE 60
40
g 20
ë o ê 8 -20
-40
-60 0 50 100 150 200 250
Time (s)

REFERENCE 10 -
"· ,, . 0 :c 8
0 C/)
0 ~ 7 ~
0 ~ 6
50
""' · ·.
·····-.•.. , ··; --..
.... . • DATA .... • .... DATA
--MODEL
0 1000 2000 3000 4000 5000
:c 0 C/)
~ ~ CO ro
:c 0 C/)
~ ~ CO ro
Cycle Number ISO MEAN
\ DATA • 90 \ • ... DATA • --MODEL 80
70
60
50 0
--90
80
70
60
50 0
\ \. • • ' ..... ., .... .,
'· "-' ··
1000 2000 3000 4000 5000
Cycle Number DILATED
' ' , ... ., ·--... -, ____ ' ,,
• DATA
... DATA --MODEL
1000 2000 3000 4000 5000 Cycle Number
ISO RMS 10
'· ' ~ 90 -,, . ~ "' ,··... . :c 80 '·· -·--···---! 0 •• C/)
~ 70 ~ • DATA CO 60 .... DATA ro
--MODEL 50
0 1000 2000 3000 4000 5000 Cycle Number
AT REST 10 ~
\ • DATA 0 '~ ... DATA
~ 9 ;,g ~
'-0 :c 8 0
C/)
~ 7 0 .si
0 -ro 6 ro
5 0 0
-
',~' --MODEL
'., ' ... ....... ......... ., ''• ....... 1000 2000 3000 4000 5000
Cycle Number
10 r-. .. __
··•·-·-0
0 :c 8 0 C/)
0 ~ 7 ~ ~ 6 0
0 5 0
... --..... •• • DATA
... DATA -- MODEL
1000 2000 3000 4000 5000 Cycle Number
Figure 3: Comparison between experimental data from Savoye [26) and simulation results
10 50
g 0
t-~1r g 0 w---ë ë
CU li! 5 -10
::; -50 u u
-20 -100 0 3 4 0 0.2 0.4 0.6 0.8 1 1.2 1.4 1.6 1.8
Time (h) Time (h)
100 OO
80 \
/ 70
if ~ ~ ~ 0
8 60 800 / (/) 40 \ !/) 50
20 \ 400
0 2 3 4 6 0.2 0.4 0.6 0.8 1 1.2 1.4 1.6 1.8
Time (h) Time (h)
(a) Current load profile representative for an EV (b) Current load profile representative for an HEV and
and subsequent SOC profile subsequent SOC profile
Figure 4: Current profile used for EV and HEV validation
98 • 1~~=~1 l_!__ ~:~ I .. 95 96 ..,,.. ~
l 94 r/A ~ • JA. 90 •• :i: -.... :i:
0 0 (J) 92 (J)
~ ~
~ ~ 85 90 "' "' "' 88 •• 80
86
84 • 75 0 50 100 150 200 250 300 350 0 50 100 150 200 250 300 350
Time in days Time in days
{a) EVaging (b) HEV aging Figure 5: Comparison between experimental data and simulation results
0
.E ë -5 ~
0
... 8 -10
0 g ~ ~ 5 0 ro .0 Q) 0 = .E ë -5 0
~ 8-10 g ~
0
2 5 (ij
0
.0 (1) 0 = .E
0
.E ë -50 ~
Nominal Case <>
~
5 10 15 20 25 Time (h)
Just intime charge <>
~
5 10 15 20 25 Time (h)
Charge when you can <> <> <>
1 1 1
5 20 25
:; (.)-1 0L~0-~5~-1~0-~15-~2~0--'25
g Time (h)
100 Nominal Case
........ 80 ~ ~ 60 (.)
0 40 en 20
0 0 5 10 15 20 25
Time (h)
100 Just in time charge
........ 80 ~ ~ 60 (.) 0 40 en
20
0 0 5 10 15 20 25
Time (h)
10 Charge when you can
~ 80
~ 60 (.) 0 40 en
20
0 0 5 10 15 20 25
Time (h)
100 Strong V2G
~ 80 ~ ~ 60 (.)
0 40 en 20
5 25
~ LightV2G ~ 5 0 ] *
10 15 20 Time (h)
LightV2G 1011.---~---.-'"--~-~---.
ro .0
(1) 0 = .E ë -5 0
~ 8 -10
0 5
1
10 15 20 Time (h)
~ 80 ~ ~ 60 (.)
0 40 en 20
0'---~-~-~-~--' 25 0 5 10 15 20 25
Time (h)
--Power deman * V2G 0 G2V
Figure 6: Current and SOC profiles during test case scenarios
5 10 15 20 Time (h)
Figure 7: Temperature variations during simulation
30
e: 25
!!! 20 .a ~ :g_ 15 E Cil 1- 10
s~~~~~~~~~~~~~~~~
0 100 200 300 Time (d)
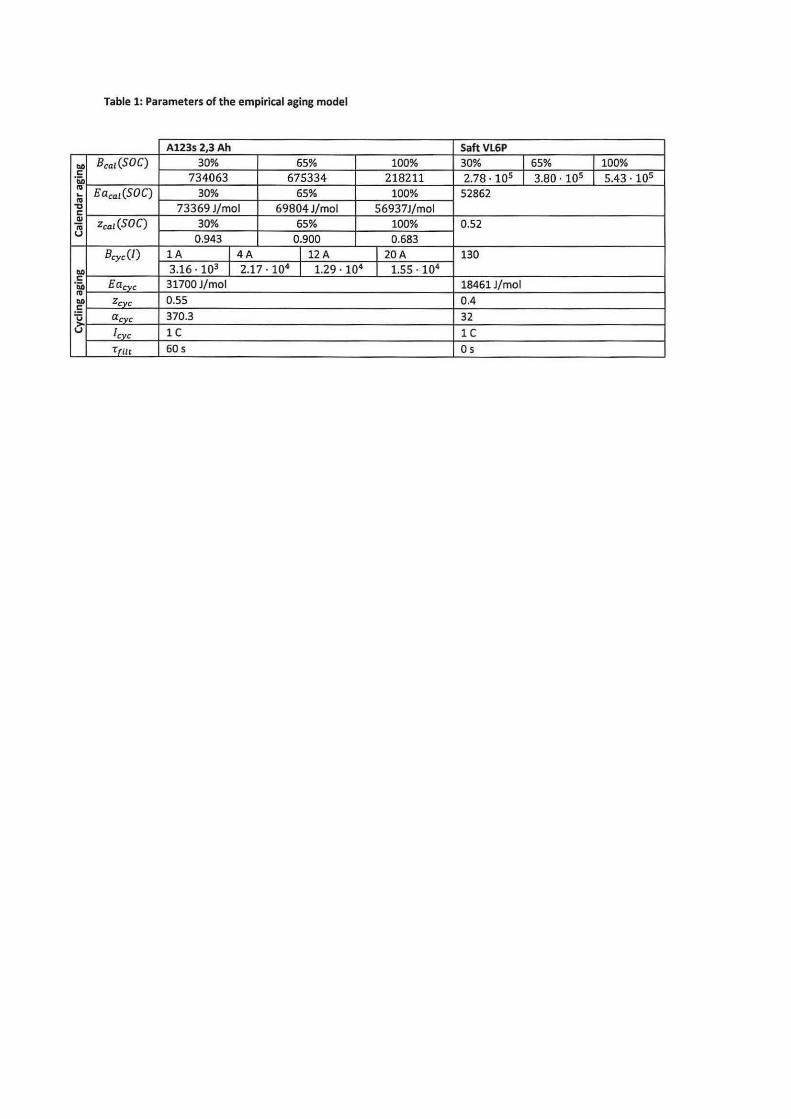
Table 1: Parameters of the empirical aging model
A123s 2,3Ah SaftVL6P
bO Bca1(SOC) 30% 65% 100% 30% 1 65% l 100% c
734063 675334 218211 2.78 · 105 1 3.80 · 105 1 5.43 · 105 ·a.o "' Eaca1(SOC) 30% 65% 100% 52862 ... "' "tJ 73369J/mol 69804J/mol 56937J/mol c Qj
Zca1(SOC) 30% 65% 100% 0.52 "'iii u 0.943 0.900 0.683 Bcyc(/) lA l4A 1 12 A 1 20A 130
bO 3.16. 103 1 2.17. 104 1 1.29 · 104 1 1.55 · 104
c Eacvc 31700J/mol 18461J/ mol ïio
"' bO Zcvc 0.55 0.4 .5
370.3 32 ü acvc ('; fcvc lC lC
Tfilt 605 Os

Table 2: Battery pack properties for simulations
Chemistry of battery cells LFP/C NCA/C Capacity of the battery 2.3Ah 2.3Ah Number of cells in series 100 100 Number of parallel branches 10 10 Power of the pack 384kW 189kW Energy of the Pack 7600Wh 8280Wh Nominal Voltage of the pack 320V 360V

B
7
6
~ 5 ~ tn tn 0
.È' 4 u ('O o. ('O
u 3
2
0 LFP/C
~ Nominal case l'''""'':i'if'il Just in lime charge mIIIIIIIl Charge when you can - strongV20 ~LightV20
NCNC
Figure 8: Capacity loss for both battery technologies after 1 year cycle according to every scenario