DEVELOPMENT OF A TL-3 F-SHAPE TEMPORARY CONCRETE …
88
Midwest State's Regional Pooled Fund Research Program - Fiscal Year 1995 NDOR Research Project Number SPR-3(017) DEVELOPMENT OF A TL-3 F-SHAPE TEMPORARY CONCRETE MEDIAN BARRIER Submitted by Ronald K. Faller, P.E. Research Associate Engineer Barry T. Rosson, Ph.D., P.E. Assistant Professor John R. Rohde, Ph.D., P.E. Associate Professor Richard P. Smith Graduate Research Assistant Kenneth H. Addink Graduate Research Assistant MIDWEST ROADSIDE SAFETY FACILITY Center for Infrastructure Research Civil Engineering Department University of Nebraska-Lincoln 1901 "Y" Street, Building "C" Lincoln, Nebraska 68588-0601 (402) 472-6864 Submitted to IOWA DEPARTMENT OF TRANSPORTATION 800 Lincoln Way Ames, Iowa 50010
Transcript of DEVELOPMENT OF A TL-3 F-SHAPE TEMPORARY CONCRETE …

Midwest State's Regional Pooled Fund Research Program - Fiscal Year 1995NDOR Research Project Number SPR-3(017)
DEVELOPMENT OF A TL-3 F-SHAPE
TEMPORARY CONCRETE MEDIAN BARRIER
Submitted by
Ronald K. Faller, P.E.Research Associate Engineer
Barry T. Rosson, Ph.D., P.E.Assistant Professor
John R. Rohde, Ph.D., P.E.Associate Professor
Richard P. SmithGraduate Research Assistant
Kenneth H. AddinkGraduate Research Assistant
MIDWEST ROADSIDE SAFETY FACILITYCenter for Infrastructure Research
Civil Engineering DepartmentUniversity of Nebraska-Lincoln1901 "Y" Street, Building "C"
Lincoln, Nebraska 68588-0601(402) 472-6864
Submitted to
IOWA DEPARTMENT OF TRANSPORTATION800 Lincoln Way
Ames, Iowa 50010

MwRSF Research Report No. TRP-03-64-96December 1996

i
DISCLAIMER STATEMENT
The contents of this report reflect the views of the authors who are responsible for the facts and
the accuracy of the data presented herein. The contents do not necessarily reflect the official views or
policies of the Iowa Department of Transportation, the State Highway Departments participating in the
Midwest State's RegionalPooled Fund Research Program, nor the FederalHighwayAdministration. This
report does not constitute a standard, specification, or regulation.

ii
ACKNOWLEDGMENTS
The authors wishto acknowledge severalsources that made this project possible:(1) the Midwest
States Regional Pooled Fund Program funded by the Iowa Department of Transportation, Kansas
Department ofTransportation, MissouriHighwayand TransportationDepartment, Minnesota Department
of Transportation, Nebraska Department of Roads, and South Dakota Department ofTransportationfor
sponsoring this project; (2) MwRSF personnelfor constructing the barrier and conducting the crash tests;
and (3) Dr. Maher Tadros, P.E. - former Director of the Center for Infrastructure Researchand Dr. Samy
Elias, P.E. - Associate Dean for Engineering Research, University of Nebraska-Lincoln for matching
support.
A special thanks is also givento the followingindividuals who madeacontributionto the completion
of this research project.
Midwest Roadside Safety Facility
D.L. Sicking, Ph.D., P.E., MwRSF Director and Assistant ProfessorB.G. Pfeifer, P.E., Research Associate EngineerJ.C. Holloway, Research Associate EngineerK.L. Krenk, Field Operations ManagerE.A. Keller, Computer Technician IIM.L. Hannau, Laboratory Mechanic IMark Bierman, Former C.E. Graduate Student Undergraduate and Graduate Assistants
Iowa Department of Transportation
David Little, P.E., Design Methods Engineer
Kansas Department of Transportation
Ron Seitz, P.E., Road Design Squad Leader

iii
Minnesota Department of Transportation
Ron Cassellius, P.E., Research Program Coordinator
Missouri Department of Transportation
Pat McDaniel, P.E., Design Special Assignments Engineer
Nebraska Department of Roads
Leona Kolbet, Research CoordinatorKen Sieckmeyer, P.E., Transportation Planning Manager
South Dakota Department of Transportation
David Huff, P.E., Research Engineer
Federal Highway Administration
Jack Latterell, P.E., Iowa Division OfficeMilo Cress, P.E., Nebraska Division OfficeJohn Ballantyne, P.E., Region VII
Dunlap Photography
James Dunlap, President and Owner

iv
ABSTRACT
A temporaryconcrete median barrier (CMB) was designed and tested for compliance under the
Test Level 3 (TL-3) guidelines specified in the Recommended Procedures for the Safety Performance
Evaluation of Highway Features, NationalCooperative HighwayResearchProgram(NCHRP) Report
No. 350. The barrier is built to the new metric standards and has a traditional pin and loop configuration
for interconnection. The objective of this research project was to develop and evaluate a standardized,
temporary concrete barrier design while addressing the concerns for safety, economy, structural integrity,
constructability, ease of installation, and maintenance. The resulting F-shape barrier segment is 3,800-mm
long, a length that reduced the number of connections while limiting the weight of the barriers to ease
handling. Full-scale crash testing demonstrated severalcriticaldesign features. First, the connections need
to be tight initially as practicable to limit deformation and rotation of the barriers,. Secondly, the pin needs
to restrain the longitudinalbarrier forces. Full-scale compliance testing of the finaldesign demonstrated that
the barrier was capable of successfully redirecting the 2000-kg vehicle. The vehicle demonstrated
significant roll after contact withthe barrier, whichis evidenced ina majorityof other concrete barrier tests.
This barrier provides economical work zone protection applicable in a variety of situations, where TL-3
test criteria is warranted.

v
TABLE OF CONTENTSPage
DISCLAIMER STATEMENT . . . . . . . . . . . . . . . . . . . . . . . . . . . . . . . . . . . . . . . . . . . . . . . . . . . . i
ACKNOWLEDGMENTS . . . . . . . . . . . . . . . . . . . . . . . . . . . . . . . . . . . . . . . . . . . . . . . . . . . . . . . ii
ABSTRACT . . . . . . . . . . . . . . . . . . . . . . . . . . . . . . . . . . . . . . . . . . . . . . . . . . . . . . . . . . . . . . . . . iv
TABLE OF CONTENTS . . . . . . . . . . . . . . . . . . . . . . . . . . . . . . . . . . . . . . . . . . . . . . . . . . . . . . . . vList of Figures . . . . . . . . . . . . . . . . . . . . . . . . . . . . . . . . . . . . . . . . . . . . . . . . . . . . . . . . . . viiList of Tables . . . . . . . . . . . . . . . . . . . . . . . . . . . . . . . . . . . . . . . . . . . . . . . . . . . . . . . . . . . ix
1 INTRODUCTION . . . . . . . . . . . . . . . . . . . . . . . . . . . . . . . . . . . . . . . . . . . . . . . . . . . . . . . . . . . . 11.1 Problem Statement . . . . . . . . . . . . . . . . . . . . . . . . . . . . . . . . . . . . . . . . . . . . . . . . . . . . . 11.2 Objective and Scope . . . . . . . . . . . . . . . . . . . . . . . . . . . . . . . . . . . . . . . . . . . . . . . . . . . 1
2 BACKGROUND . . . . . . . . . . . . . . . . . . . . . . . . . . . . . . . . . . . . . . . . . . . . . . . . . . . . . . . . . . . . . 3
3 PERFORMANCE EVALUATION CRITERIA . . . . . . . . . . . . . . . . . . . . . . . . . . . . . . . . . . . . . . 4
4 BARRIER DESIGN . . . . . . . . . . . . . . . . . . . . . . . . . . . . . . . . . . . . . . . . . . . . . . . . . . . . . . . . . . . 7
5 DESIGN NO. 1 DETAILS . . . . . . . . . . . . . . . . . . . . . . . . . . . . . . . . . . . . . . . . . . . . . . . . . . . . . . 9
6 TEST CONDITIONS . . . . . . . . . . . . . . . . . . . . . . . . . . . . . . . . . . . . . . . . . . . . . . . . . . . . . . . . 146.1 Test Facility . . . . . . . . . . . . . . . . . . . . . . . . . . . . . . . . . . . . . . . . . . . . . . . . . . . . . . . . . 146.2 Vehicle Tow and Guidance System . . . . . . . . . . . . . . . . . . . . . . . . . . . . . . . . . . . . . . . . 146.3 Test Vehicles . . . . . . . . . . . . . . . . . . . . . . . . . . . . . . . . . . . . . . . . . . . . . . . . . . . . . . . . 146.4 Data Acquisition Systems . . . . . . . . . . . . . . . . . . . . . . . . . . . . . . . . . . . . . . . . . . . . . . . 17
6.4.1 Accelerometers . . . . . . . . . . . . . . . . . . . . . . . . . . . . . . . . . . . . . . . . . . . . . . . 176.4.2 Rate Transducer . . . . . . . . . . . . . . . . . . . . . . . . . . . . . . . . . . . . . . . . . . . . . . 226.4.3 High-Speed Photography . . . . . . . . . . . . . . . . . . . . . . . . . . . . . . . . . . . . . . . 236.4.4 Pressure Tape Switches . . . . . . . . . . . . . . . . . . . . . . . . . . . . . . . . . . . . . . . . 26
7 CRASH TEST NO. 1 . . . . . . . . . . . . . . . . . . . . . . . . . . . . . . . . . . . . . . . . . . . . . . . . . . . . . . . . . 277.1 Test ITMP-1 . . . . . . . . . . . . . . . . . . . . . . . . . . . . . . . . . . . . . . . . . . . . . . . . . . . . . . . . 277.2 Test Description . . . . . . . . . . . . . . . . . . . . . . . . . . . . . . . . . . . . . . . . . . . . . . . . . . . . . . 277.3 Vehicle Damage . . . . . . . . . . . . . . . . . . . . . . . . . . . . . . . . . . . . . . . . . . . . . . . . . . . . . . 287.4 Barrier Damage . . . . . . . . . . . . . . . . . . . . . . . . . . . . . . . . . . . . . . . . . . . . . . . . . . . . . . 287.5 Occupant Risk Values . . . . . . . . . . . . . . . . . . . . . . . . . . . . . . . . . . . . . . . . . . . . . . . . . 28

vi
7.6 Discussion . . . . . . . . . . . . . . . . . . . . . . . . . . . . . . . . . . . . . . . . . . . . . . . . . . . . . . . . . . 28
8 BARRIER MODIFICATIONS (DESIGN NO. 2) . . . . . . . . . . . . . . . . . . . . . . . . . . . . . . . . . . . 40
9 CRASH TEST NO. 2 . . . . . . . . . . . . . . . . . . . . . . . . . . . . . . . . . . . . . . . . . . . . . . . . . . . . . . . . . 449.1 Test ITMP-2 . . . . . . . . . . . . . . . . . . . . . . . . . . . . . . . . . . . . . . . . . . . . . . . . . . . . . . . . 449.2 Test Description . . . . . . . . . . . . . . . . . . . . . . . . . . . . . . . . . . . . . . . . . . . . . . . . . . . . . . 449.3 Vehicle Damage . . . . . . . . . . . . . . . . . . . . . . . . . . . . . . . . . . . . . . . . . . . . . . . . . . . . . . 459.4 Barrier Damage . . . . . . . . . . . . . . . . . . . . . . . . . . . . . . . . . . . . . . . . . . . . . . . . . . . . . . 459.5 Occupant Risk Values . . . . . . . . . . . . . . . . . . . . . . . . . . . . . . . . . . . . . . . . . . . . . . . . . 459.6 Discussion . . . . . . . . . . . . . . . . . . . . . . . . . . . . . . . . . . . . . . . . . . . . . . . . . . . . . . . . . . 46
10 SUMMARY AND CONCLUSIONS . . . . . . . . . . . . . . . . . . . . . . . . . . . . . . . . . . . . . . . . . . . 56
11 RECOMMENDATIONS . . . . . . . . . . . . . . . . . . . . . . . . . . . . . . . . . . . . . . . . . . . . . . . . . . . . . 59
12 REFERENCES . . . . . . . . . . . . . . . . . . . . . . . . . . . . . . . . . . . . . . . . . . . . . . . . . . . . . . . . . . . . 67
13 APPENDICES . . . . . . . . . . . . . . . . . . . . . . . . . . . . . . . . . . . . . . . . . . . . . . . . . . . . . . . . . . . . . 69APPENDIX A - ACCELEROMETER DATA ANALYSIS . . . . . . . . . . . . . . . . . . . . . . . 69APPENDIX B - RATE TRANSDUCER DATA ANALYSIS . . . . . . . . . . . . . . . . . . . . . . 76

vii
List of FiguresPage
1. Temporary F-Shape CMB System, Design No. 1 . . . . . . . . . . . . . . . . . . . . . . . . . . . . . . . . . . . . 102. Connection Details, Design No. 1 . . . . . . . . . . . . . . . . . . . . . . . . . . . . . . . . . . . . . . . . . . . . . . . . 113. Reinforcement Details, Design No. 1 . . . . . . . . . . . . . . . . . . . . . . . . . . . . . . . . . . . . . . . . . . . . . 124. Pin and Rebar Connection, Design No. 1 . . . . . . . . . . . . . . . . . . . . . . . . . . . . . . . . . . . . . . . . . . 135. Test Vehicle, Test ITMP-1 . . . . . . . . . . . . . . . . . . . . . . . . . . . . . . . . . . . . . . . . . . . . . . . . . . . . . 156. Vehicle Dimensions, Test ITMP-1 . . . . . . . . . . . . . . . . . . . . . . . . . . . . . . . . . . . . . . . . . . . . . . . 167. Test Vehicle, Test ITMP-2 . . . . . . . . . . . . . . . . . . . . . . . . . . . . . . . . . . . . . . . . . . . . . . . . . . . . . 188. Vehicle Dimensions, Test ITMP-2 . . . . . . . . . . . . . . . . . . . . . . . . . . . . . . . . . . . . . . . . . . . . . . . 199. Vehicle Target Locations, Test ITMP-1 . . . . . . . . . . . . . . . . . . . . . . . . . . . . . . . . . . . . . . . . . . . 2010. Vehicle Target Locations, Test ITMP-2 . . . . . . . . . . . . . . . . . . . . . . . . . . . . . . . . . . . . . . . . . . 2111. Location of High-Speed Cameras, Test ITMP-1 . . . . . . . . . . . . . . . . . . . . . . . . . . . . . . . . . . . 2412. Location of High-Speed Cameras, Test ITMP-2 . . . . . . . . . . . . . . . . . . . . . . . . . . . . . . . . . . . 2513. Summary of Test Results and Sequential Photographs, Test ITMP-1 . . . . . . . . . . . . . . . . . . . . . 3014. Additional Sequential Photographs, Test ITMP-1 . . . . . . . . . . . . . . . . . . . . . . . . . . . . . . . . . . . 3115. Documentary Photographs, Test ITMP-1 . . . . . . . . . . . . . . . . . . . . . . . . . . . . . . . . . . . . . . . . . 3216. Documentary Photographs, Test ITMP-1 . . . . . . . . . . . . . . . . . . . . . . . . . . . . . . . . . . . . . . . . . 3317. Impact Location, Test ITMP-1 . . . . . . . . . . . . . . . . . . . . . . . . . . . . . . . . . . . . . . . . . . . . . . . . . 3418. Vehicle Damage, Test ITMP-1 . . . . . . . . . . . . . . . . . . . . . . . . . . . . . . . . . . . . . . . . . . . . . . . . . 3519. Barrier Damage, Test ITMP-1 . . . . . . . . . . . . . . . . . . . . . . . . . . . . . . . . . . . . . . . . . . . . . . . . . 3620. Damage at Barrier Ends (Back Side), Test ITMP-1 . . . . . . . . . . . . . . . . . . . . . . . . . . . . . . . . . 3721. Damage at Barrier Ends (Traffic Side), Test ITMP-1 . . . . . . . . . . . . . . . . . . . . . . . . . . . . . . . . 3822. Cracks in Barrier Segment No. 9, Test ITMP-1 . . . . . . . . . . . . . . . . . . . . . . . . . . . . . . . . . . . . 3923. Barrier Modifications and Connection Details, Design No. 2 . . . . . . . . . . . . . . . . . . . . . . . . . . . 4124. Barrier Retrofit, Design No. 2 . . . . . . . . . . . . . . . . . . . . . . . . . . . . . . . . . . . . . . . . . . . . . . . . . . 4225. Modified Pin and Rebar Connection . . . . . . . . . . . . . . . . . . . . . . . . . . . . . . . . . . . . . . . . . . . . . 4326. Summary of Test Results and Sequential Photographs, Test ITMP-2 . . . . . . . . . . . . . . . . . . . . . 4727. Additional Sequential Photographs, Test ITMP-2 . . . . . . . . . . . . . . . . . . . . . . . . . . . . . . . . . . . 4828. Documentary Photographs, Test ITMP-2 . . . . . . . . . . . . . . . . . . . . . . . . . . . . . . . . . . . . . . . . . 4929. Documentary Photographs, Test ITMP-2 . . . . . . . . . . . . . . . . . . . . . . . . . . . . . . . . . . . . . . . . . 5030. Impact Location, Test ITMP-2 . . . . . . . . . . . . . . . . . . . . . . . . . . . . . . . . . . . . . . . . . . . . . . . . . 5131. Vehicle Damage, Test ITMP-2 . . . . . . . . . . . . . . . . . . . . . . . . . . . . . . . . . . . . . . . . . . . . . . . . . 5232. Barrier Damage, Test ITMP-2 . . . . . . . . . . . . . . . . . . . . . . . . . . . . . . . . . . . . . . . . . . . . . . . . . 5333. Damage at Barrier Ends (Back Side), Test ITMP-2 . . . . . . . . . . . . . . . . . . . . . . . . . . . . . . . . . 5434. Damage at Barrier Ends (Traffic Side), Test ITMP-2 . . . . . . . . . . . . . . . . . . . . . . . . . . . . . . . . 5535. Connection Details, Design No. 3A . . . . . . . . . . . . . . . . . . . . . . . . . . . . . . . . . . . . . . . . . . . . . 6136. Reinforcement Details, Design No. 3A . . . . . . . . . . . . . . . . . . . . . . . . . . . . . . . . . . . . . . . . . . . 6237. Reinforcement Bend Diagrams, Design No. 3A . . . . . . . . . . . . . . . . . . . . . . . . . . . . . . . . . . . . . 6338. Connection Details, Design No. 3B . . . . . . . . . . . . . . . . . . . . . . . . . . . . . . . . . . . . . . . . . . . . . 64

viii
39. Reinforcement Details, Design No. 3B . . . . . . . . . . . . . . . . . . . . . . . . . . . . . . . . . . . . . . . . . . . 6540. Reinforcement Bend Diagrams, Design No. 3B . . . . . . . . . . . . . . . . . . . . . . . . . . . . . . . . . . . . . 66A-1. Graph of Longitudinal Deceleration, Test ITMP-2 . . . . . . . . . . . . . . . . . . . . . . . . . . . . . . . . . 70A-2. Graph of Longitudinal Occupant Impact Velocity, Test ITMP-2 . . . . . . . . . . . . . . . . . . . . . . . 71A-3. Graph of Longitudinal Occupant Displacement, Test ITMP-2 . . . . . . . . . . . . . . . . . . . . . . . . . 72A-4. Graph of Lateral Deceleration, Test ITMP-2 . . . . . . . . . . . . . . . . . . . . . . . . . . . . . . . . . . . . . 73A-5. Graph of Lateral Occupant Impact Velocity, Test ITMP-2 . . . . . . . . . . . . . . . . . . . . . . . . . . . 74A-6. Graph of Lateral Occupant Displacement, Test ITMP-2 . . . . . . . . . . . . . . . . . . . . . . . . . . . . . 75B-1. Graph of Roll, Pitch, and Yaw Angular Displacements . . . . . . . . . . . . . . . . . . . . . . . . . . . . . . 77

ix
List of TablesPage
1. NCHRP Report 350 Evaluation Criteria for 2000P Pickup Truck Crash Test (1) . . . . . . . . . . . . . 62. Summary of Safety Performance Evaluation Results . . . . . . . . . . . . . . . . . . . . . . . . . . . . . . . . . . 58

1
1 INTRODUCTION
1.1 Problem Statement
Severaldifferent temporaryconcretemedianbarrier (CMB) designs are currently inuse throughout
the United States, generally consisting of the New Jerseysafetyshape, and more recently the F-shape and
single-slope barriers. Throughout the Midwest states, temporary concrete barrier configurations differ
significantly insteel reinforcement, connectiondetails at joints,segment length, and barrier handling features.
Consequently, contractors that work inmultiple statesmusteithermaintain inventories ofseveral temporary
concrete barrier designs, or theymust seek approval tousealternatedesigns ona project-by-project basis.
However, the structural adequacy, as well as the safety performance, of some of the current designs are
questionable, and none of these designs have beenevaluated to determine if theymeet the crash test safety
standards provided in the National Cooperative Highway Research Program(NCHRP) Report No. 350,
Recommended Procedures for the Safety Performance Evaluation of Highway Features (1).
Therefore, a needexists to develop and evaluate one, standardized, temporaryconcrete barrier design that
meets safety standards, potentially reduces barrier costs by using only one configuration, and improves
conditions for contractors to work in multiple states using the same barrier.
1.2 Objective and Scope
The objective of this researchproject was to develop and evaluate one, standardized, temporary
concrete barrier design while addressing the concerns for safety, economy, structural integrity,
constructability, ease of installation, and maintenance. The temporary concrete barrier

2
was developed to meet the Test Level 3 (TL-3) safety performance criteria provided in NCHRP Report
No. 350.
The Midwest Roadside Safety Facility (MwRSF), in cooperation with the State Highway
Departments of Iowa, Kansas, Minnesota, Missouri, Nebraska, and South Dakota, undertook the task
of reviewing the literature, selecting a specific barrier shape, redesigning and/or modifying the barrier (i.e.,
steel reinforcement, connections), conducting static component tests, and performing compliance tests on
the barrier. Two full-scale vehicle crash tests were performed using Chevrolet C-20 pickup trucks,
weighing approximately 2,000 kg (4,409 lbs). The target impact speed and angle were 100 km/h (62.1
mph) and 25 degrees, respectively. Finally, the test results were analyzed,evaluated and documented, with
conclusions and recommendations made that pertain to the safety performance of the temporary CMB.

3
2 BACKGROUND
Over the years, several researchstudies have been conducted to evaluate the safety performance
of various temporary CMB designs, such as the New Jersey safety shape, F-shape, and single-slope
barrier (2,3). Almost all of these designs incorporate precast concrete barrier units, many of which have
successfully passed NCHRP Report No. 230 impact standards (4). Barrier designs were tested with
segment lengths ranging from 2,438 to 9,144 mm with the 2,438 to 6,096 mmrange as the most common
lengths.
Crash tests on the different temporary barrier designs have been conducted with various
connections at the joints withmixed results - such as pin and rebar, pin and wire rope, tongue and groove,
hinge plates, and vertical I-beams. Structural analyses of these connection designs have also been
performed to determine preferred configurations and ultimate capacities (5,6,7,8). The overall capacityof
the temporary concrete barrier system is generally limited by the strength of the joint details, since the
capacity of the connection is often less than that of the barrier section located away from the ends.

4
3 PERFORMANCE EVALUATION CRITERIA
Longitudinalbarriers, suchas temporaryCMB's,must satisfy the requirementsprovidedinNCHRP
Report No. 350 (1) inorder to be accepted for use on new construction projects or as a replacement for
existingbarriersnotmeetingcurrent safetystandards. According to Test Level3 (TL-3) ofNCHRP Report
No. 350, longitudinalbarriersmust be subjected to two full-scale vehicle crash tests: (1) a 2,000-kg pickup
truck impacting at a speed of 100.0 km/hr and at an angle of 25 degrees; and (2) an 820-kg small car
impacting at anspeed of100.0 km/hr and at an angle of20 degrees. However, the 820-kg small car crash
test was deemed unnecessary for several reasons. First, rigid New Jersey safety shape barriers when
impacted by small cars have been shown to meet safety performance standards (2,9). Second, small car
crash tests conducted on temporary New Jersey safety shape CMB's have also resulted in little barrier
movement (10). Third, computer simulationmodeling ofsafetyshapebarriershasrevealed that the F-shape
CMB offers a slight improvement in safety performance over the New Jersey safety shape (11). Finally,
a small car crash test was successfully conducted on a rigid, F-shape bridge rail; and therefore, it was
reasoned to be a valid indicator of the safety performance of the F-shape temporary CMB (12).
Evaluation criteria for full-scale vehicle crash testing are based on three appraisal areas: (1)
structural adequacy; (2) occupant risk; and (3) vehicle trajectory after collision. Criteria for structural
adequacyare intended to evaluate the ability of the railing to contain, redirect, or allow controlled vehicle
penetration in a predictable manner. Occupant risk evaluates the degree of hazard to occupants in the
impacting vehicle. Vehicle trajectory after collision is a measure of the potential for the post-impact
trajectoryof the vehicle to cause subsequent multi-vehicle accidents, therebysubjecting occupants ofother
vehicles to undue hazard or to subject the occupants of the impacting vehicle to secondary collisions with

5
other fixed objects. These three evaluationcriteria are defined inTable 1. The full-scale vehicle crash tests
were conducted and reported in accordance with the procedures provided in NCHRP Report No. 350.

6
Table 1. NCHRP Report 350 Evaluation Criteria for 2000P Pickup Truck Crash Test (1).
StructuralAdequacy
A. Test article should contain and redirect the vehicle; the vehicle should notpenetrate, underride, or override the installation although controlled lateraldeflection of the test article is acceptable.
Occupant Risk
D. Detached elements, fragments or other debris from the test articleshould not penetrate or show potential for penetrating theoccupant compartment, or present an undue hazard to othertraffic, pedestrians, or personnel in a work zone. Deformations of,or intrusions into, the occupant compartment that could causeserious injuries should not be permitted.
F. The vehicle should remain upright during and after collision althoughmoderate roll, pitching, and yawing are acceptable.
VehicleTrajectory
K. After collision it is preferable that the vehicle's trajectory not intrude intoadjacent traffic lanes.
L. The occupant impact velocity in the longitudinal direction should notexceed 12 m/sec and the occupant ridedown acceleration in thelongitudinal direction should not exceed 20 G's.
M. The exit angle from the test article preferably should be less than 60percent of test impact angle, measured at time of vehicle loss of contactwith test devise.

7
4 BARRIER DESIGN
The F-shape sectionwas selected for use as the TL-3 temporarybarrier; since, the F-shape offers
a slight improvement in safety performance from the New Jersey safety shape with its slight reduction in
vehicle roll angles, vehicular climb heights, and increased vehicle stability(11,12). Inaddition, the F-shape
is becoming more widely used by the various States' Departments of Transportation. In order to comply
with the recent Federal legislation to use the International System (SI) of units, the barrier was designed
and tested using actual metric-sized steel reinforcement and also followed the metric cross-sectional
dimensions as provided in the Task Force 13 report, A Guide to Standardized Highway Barrier
Hardware (13).
A parametric study performed by the Texas Transportation Institute (TTI) determined barrier
sensitivity to various factors, such as joint moment capacity, barrier length, static and sliding friction
coefficients between ground and barrier, barrier mass, and connection slack (5). The research results
showed that for larger joint moment capacities, lateralbarrier deflections were smallest for segment lengths
of3,048 mmand 9,144 mmand largest forlengths approximately 6,096-mm long. Similarly, the 3,658 and
9,144-mm long segment lengths provided smaller lateral deflections than the 6,096 mm length for an
increase inconnectionslack between barriers. Therefore, a 3,800-mm segment lengthwas chosenfor the
F-shape barrier based on three factors. First, it provided an increased capabilityover 6,096-mm segment
lengths for limiting lateral barrier deflections. Second, the 3,800-mm segment length should be easier to
handle fortemporaryusethanthe longer lengthCMB's. Finally, a 3,800-mm long F-shape provided a 30%
increase in weight above the 3,048-mm long New Jersey safety shape, but maintained contractor's ability
to lift and install the barriers with currently used equipment.

8
A pin and rebar connection type was selected for joining the barrier segments. Prior research
showed that the pin and rebar connection provided adequate structural capacity for resisting a 2,041-kg
sedan impacting at a speed of 96.6 km/hr and an angle of 25 degrees (7). However, the strength of the
connection is based on preventing the pin from deforming significantly and pulling out of the rebar loops
while under load. Inadditionto providing load capacity, using a pin retainer was also considered important
to eliminate the possibility of pin removal due to vandalism, resulting in a serious safety issue. Finally, this
connectiontype was approximately 50% less expensive thanotheravailable connections that could provide
the necessary required strength.
An objective of the research project was to develop a barrier that could be used in temporary as
well as permanent applications. Therefore, additionalfeatures were included inthe barriersegment allowing
it to be used in both temporary and permanent applications.

9
5 DESIGN NO. 1 DETAILS
A 61.97-m long barrier system was constructed on a concrete surface located at the MwRSF
outdoor test site, as shown in Figure 1. The barrier system consisted of sixteen F-shape CMB sections,
each measuring 3,800-mm in length. Design details for the joint connections and steel reinforcement are
shown in Figures 2 and 3, respectively. Photographs of the pin and rebar connectionare shown in Figure
4. Note that the cavities located at the barrier ends in Design No. 1 were intended for making a rigid
connection between barrier segments when the barrier was installed in permanent applications.
The actual 28-day concrete compressive strengths of the various barrier segments were all in
excess of 41.37 MPa, while the minimum concrete compressive strength for the design mix was 31.03
MPa. All steel reinforcement complied with the ASTM A615M specification, resulting ina minimumyield
stressof400 MPa. The metric steelbars were obtained fromCowin SteelCo. Ltd. inWinnipeg, Manitoba,
Canada.
.- ) -
. -
- -
Figure I. Temporal)" F-Shape eMB System. Design No. I
10
r-190 .L_
.!o j_
t1 f-1
I
...... ......
0 0
36()0
0 0 0
Side View
~ Ll_...! JL--..essmm.m;;;c::,-(£so
r~so~ l I -
~
-
~6 200 ~~
~ 1•4o 1
666 l l
AIR j_ f;-T
ll; t7 r
11 75 sro---1
60
Jso so
00
?6
140
End View
I ropprox. eo mm 1----...---l
648 L Rod 32mm 9 l5mm ,.J~ (A36)
0
Connection Detail
Figure 2. Connection Derails. Design No. 1
~ (il ~=cos
35mm .F-if-eentered on pJol~
Top & Bottom Plate (A36)
?6 R .r•u '=ff- tJ
Pin (Grode 8)
CF"' 1/8"" Cotter Pin (2 each)
Detail "A" Isometric

" .. 11"'1 ... -r"· I "' I ... I ... I ... . ... I ... I ... I . ~ --r·-I
.L I I I I ' I I I I I I : I
_J ..........
(t) ... ""'· ... J I .-- !'--tow 010 L ....
... I MIW l.ooP WI ......... ~ v- t Yr. IO\ISTIII!'Jf' 0) 1 .. ......... \ lOW ~ ........ L
S1111fM't
f'.:ow tool' *""'~ ........ . " /)~"'"' " I
i}
th
m r ffi ± a r-(Z) IIIII Ullft. tAA\ _.J i:i " '
I ... ... ... ...
-N
"~-----1--11\
INTERIOR STIRRUP tNO STIRRUP ( tlrtt 2. •aeh end)

'-.
.<
-.
Figure 4. Pin and Rebar COMeClion. Design No.
n
•
-

14
6 TEST CONDITIONS
6.1 Test Facility
The testing facility is located at the Lincoln Air-Park on the NW end of the Lincoln Municipal
Airport and is approximately 8.0 km NW of the UniversityofNebraska-Lincoln. The site is protected by
an 2.44-m high chain-link security fence.
6.2 Vehicle Tow and Guidance System
A reverse cable towsystemwitha 1:2 mechanicaladvantage was used to propel the test vehicles.
The distance traveled and the speed of the tow vehicle are one-half that ofthe test vehicle. The test vehicle
was released from the tow cable before impact with the bridge rail. A fifth wheel, built by the Nucleus
Corporation, was located on the towvehicle and usedinconjunctionwitha digitalspeedometer to increase
the accuracy of the test vehicle impact speed.
A vehicle guidance system developed by Hinch (14) was used to steer the test vehicle. A guide-
flag, attached to the front-left wheel and the guide cable, was sheared off before impact. The 9.5-mm
diameterguide cable was tensioned to approximately 13.3 kN, and supported laterally and vertically every
30.48 m by hinged stanchions. The hinged stanchions stood upright while holding up the guide cable, but
as the vehicle was towed down the line, the guide-flagstruck and knocked each stanchion to the ground.
The vehicle guidance system was approximately 457.2-m long.
6.3 Test Vehicles
For test ITMP-1, a 1985 Chevrolet C-20 ¾-ton pickup truck was used as the test vehicle. The
test inertial and gross static weights were 2,000 kg. The test vehicle is shown in Figure 5, and vehicle
dimensions are shown in Figure 6.

Figure 5_ Test Vehicle, Test ITMP-l
15

D :e: 3/5/96 • •
Tes Number: _~I T..l..llMJ..I.P_-!1_ Ac-del : C-20
Make: C heycolet Vehit:le W .#: 1 GCGC24M9 FS 18q789
Ti e Si e: I 12.3.5/85 R 1 6 Year: 1 985 Odometer: 74023
L?'
T t n m
IL accele,omete ',;
I
I !)
d~+-----e------~-
I. 9 VlreQr c --.:..!...::.=--'----l
Weight (Mass) - Ibs ( g)
Curb Test Inertial G o ss
Front 2MQ ( 11 98) 244-6 ( 1 09) 2446
Real' 2260 ( , Q25) 196.ll (891 , 1964-
Totcl :1SQQ L~223) 44'Q (2QQ:)j ~:1 i Q
Figure 6 . chic] Dimens i,on , lTMP- l
16
Stotic
(t 09)
(B91)
(2 000)
Vehicle Ceome ry - inches
CI 76 b 7:"1
c 2 0 d 50
e 131 f 29 g 28 1 582
12,5 27
k 20 28
m 66 n 66
c 50 p 3,5
q 3 r 1 7 _ ,~
s HL75 t 78_5
Wheel Cente Height 15
Engine Yi>e V-8
Engine Si~ e ---""",,,J 5""""0'--__ _
Transmission Type:
Auta otic or ~nu~
tWD o r @ 0 4WO

17
For test ITMP-2, a 1986 Chevrolet C-20 ¾-ton pickup truck was used as the test vehicle. The
test inertial and gross static weights were 2,005 kg. The test vehicle is shown in Figure 7, and vehicle
dimensions are shown in Figure 8.
The Elevated Axle Method (15) was used to determine the vertical component of the center of
gravity. This method converts measured wheel weights at different elevations to the locationof the vertical
component of the center of gravity. The longitudinal component of the center of gravity was determined
using the measured axle weights. The location of the final centers ofgravityare shown in Figures 6 and 8.
Square, black and white-checkered targets were placed on the vehicle to aid in the analysis of the
high-speed film, as shown inFigures 5, 7, 9 and 10. One target was placed on the center of gravity at the
driver's side door and on the roof of the vehicle. The remaining targets were located for reference so that
they could be viewed from the high-speed cameras for film analysis.
The front wheels of the test vehicle were aligned for camber, caster, and toe-in values of zero so
that the vehicles would track properly along the guide cable. Two 5B flash bulbs were mounted on the
hood of the vehicles to pinpoint the time of impact withthe bridge railing on the high-speed film. The flash
bulbs were fired by a pressure tape switch mounted on the front face of the bumper. A remote controlled
brake system was installed in the test vehicle so the vehicle could be brought safely to a stop after the test.
6.4 Data Acquisition Systems
6.4.1 Accelerometers
One biaxial piezoresistive accelerometer system witha range of±200 g's (Endevco Model 7264)
was used to measure the acceleration in the longitudinal and lateral directions. Two

" ,," -·.ITMP-2
Figure 7. Test Vehicle, Test lTMP-2
~ '. n
18
.~
/\ ~ : \ . . ' • ,

Dote 5/9/96 Test Number: lIMP 2 Model. Custom Delu xe
Mo~e CHEVY V,,,iCI,LO,. lGCEC2 4H56F423544
Tire Size LI235/85R16 Y,or: 1986 Odometer: 93561
T ,,--,-; ,..-', 1"
. __ . • • , L 1 r ... ~ .. "-', ' ......... '
0<<01'''0'''''.''
, ~
< ,
-±- -.--±
WeigM ( MO SS) - ", (Kg)
Cu rb Test IM'tiol Gros, Siotic
Front 2513 fl J 40) 2164 (J J 17) 2464 (111 Zl
Reor 1920 (8W 19.,7 (M6) ]957 (886)
Totol '4JJ (20] 1) 4~2] (2005) U21 ( 2005)
Figure 8, Vehicle Dimensions, Tesl ITMP-2
19
Vehic le Geometry i~ch es
, 77,13 0 73 38
, 2 14- 38 , 52
• 1 :!! 1 1,J 31 5
• 29 , 58 3
20 2 1 13
< 20 27
• 65 5 • 65 13
, 46 , 3 38
, 31 88 , 17 38
• 20 25 , 76 38
Wheel Cen ter Height 1 5
EnQine Type --.!Yl..=lBL __ _ Engine Size ~3l:Qu.:5,--__ _
Tr onsmission Type
Automatic or~o~u.i]>
FWD or (RWD) 0' 4WQ

a --....t-- b ---+--- - c ~---i
~- h ----1---
TEST 0 . : ITM -
TA GET GEOMETRY ( inches)
a 32 -25 b 26 .5 e 48 f 48
73 J 42
c 1 04 .5 d 48 9 33.75 58 _2 k 28 42
Figure 9. Vehicle Target t..ocatioo!>, Test ITMP-l
20

~- e---I
I--- d---i
1-
c _.. b ---1----- C -------1
T: S-- No. : ITM P- 2
TARGET GEOM TRY (f ches)
a 32 .5 b 27 c -- d 4 L .5
e 67 .25 , 68 38 h 58.3-g . 72 .. 75 42.5 k 29 I 43 . .5 I J
Flgure 10. Vehi.cle Target Locatio·1l!S, Test ITMP-2
21

22
accelerometers were mounted in each of the two directions and were rigidly attached to a metal block
mounted at the center of gravity. Accelerometer signals were received and conditioned by an onboard
Series 300 Multiplexed FM Data Systembuilt by MetraplexCorporation. The multiplexed signalwas then
transmitted to the Honeywell 101 Analog Tape Recorder. Computer software, "EGAA" and "DADiSP"
were used to digitize, analyze, and plot the accelerometer data.
A backup triaxial piezoresistive accelerometer systemwith a range of ±200 G's was also used to
measure the acceleration in the longitudinal, lateral, and vertical directions at a sample rate of 3,200 Hz.
The environmental shock and vibration sensor/recorder system, Model EDR-3, was developed by
Instrumented Sensor Technology (IST) of Okemos, Michigan. The EDR-3was configured with 256 Kb
ofRAM memory and a 1,120 Hz filter. Computer software, "DynaMax 1 (DM-1)" and "DADiSP"were
used to digitize, analyze, and plot the accelerometer data.
6.4.2 Rate Transducer
A Humphrey 3-axis rate transducer with a range of 250 deg/sec in each of the three directions
(pitch, roll, and yaw) was used to measure the rates ofmotionof the test vehicle. The rate transducer was
rigidly attached to the vehicles near the center of gravity of the test vehicle. Rate transducer signals were
received and conditioned by an onboard Series 300 Multiplexed FM Data System built by Metraplex
Corporation. The multiplexed signal was then transmitted by radio telemetry to a Honeywell 101 Analog
Tape Recorder. Computer software, "EGAA" and "DADiSP"were used to digitize, analyze, and plot the
rate transducer data.

23
6.4.3 High-Speed Photography
For test ITMP-1, five high-speed 16-mm cameras, with operating speeds of approximately 500
frames/sec, were used to film the crash test. A Red Lake Locam with a wide-angle 12.5-mm lens was
placed above the test installation to provide a field of view perpendicular to the ground. A Red Lake
Locam with a 76-mm lens was placed downstream fromthe impact point and had a field of view parallel
to the barrier. A Red Lake Locam with a 12.5 to 75-mm zoom lens was placed on the traffic side of the
barrier and had a field of view perpendicular to the barrier. ARed Lake Locamwitha 12.5-mm lens was
placed upstream and behind the barrier. A Red Lake Locamwitha 12.5 to 75-mm zoom lens was placed
on the back side of the bridge rail and had a field of view perpendicular to the barrier. A schematic of all
five camera locations for test ITMP-1 is shown in Figure 11.
For test ITMP-2, five high-speed 16-mm cameras, with operating speeds of approximately 500
frames/sec, were used to film the crash test. A Red Lake Locam with a wide-angle 12.5-mm lens was
placed above the test installation to provide a field of view perpendicular to the ground. A Red Lake
Locam with a 76-mm lens was placed downstream fromthe impact point and had a field of view parallel
to the barrier. A Red Lake Locam with a 12.5 to 75-mm zoom lens was placed on the traffic side of the
barrier and had a field of view perpendicular to the barrier. A Red Lake Locamwitha 12.5 to 75-mm lens
was placed downstreamand behind the barrier. A Red Lake Locamwitha 12.5 to 75-mm zoomlens was
placed on the back side of the bridge rail and had a field ofview perpendicular to the barrier. A schematic
of all five camera locations for test ITMP-2 is shown in Figure 12.

Locom No.2 ~SVHS No.2 12.5- 75mm Zoom Set 0 20mm
Locom No.t10.74mJ 12.5mm Lens 1 7.75~Locom No.3
-.L Ove< Heocl Locom No.4 2.49m 18 .59m 76mm l ens
""""' __ ,_,..,.,'14~"?~==::~~~~~~~~~-6 1 .08m-----------l=
48.77m
SVHS No. I i (Ponnin9)
l ocom No.5 12.5-75rnm Zoom Set 0 25mm
Figure ll, LQcation of High-Speed Cameras, Test ITMP-1
SVHS No.3

f--------28.6Sn--------l
Locon No l w/ %001\
i 1555n
SVHS No.I
loco" No.S
'
O..P' H<>o<l. t'l'.,M., Locon No.4
.-""""""""~""'-------.,:---:-~~~~~~!inft~~'-~~~~~~~~~~~- 7""" t..ens
4. ;roo.
SVHS No..? I Locon No.5 0C • I leon.
Pigure 12 . Location of lligh-Specd Cameras , Test ITMP-2
BSJ•n---------------------S~VH~S~N~o~J~e:
JS "'"'

26
A white-colored grid, approximately 1,220-mm square, was painted on the concrete surface on
the traffic side of the bridge rail to provide a visible reference systemfor use in the analysis of the overhead
high-speed film. The film was analyzed using the Vanguard Motion Analyzer. Actual camera speed and
camera divergence factors were considered in the analysis of the high-speed film.
6.4.4 Pressure Tape Switches
For test ITMP-1, five pressure-activated tape switches, spaced at 1.52-mintervals, were used to
determine the speedofthe vehicle before impact. For test ITMP-2, three pressure-activated tape switches,
spaced at 1.52-m intervals, were used to determine the speed of the vehicle before impact. Each tape
switch fired a strobe light which sent an electronic timing signal to the data acquisition system as the left
front tire of the test vehicle passed over it.Testvehicle speeds were determined fromelectronic timingmark
data recorded on "EGAA"software. Strobe lights and high-speed film analysis are used only as a backup
in the event that vehicle speeds cannot be determined from the electronic data.

27
7 CRASH TEST NO. 1
7.1 Test ITMP-1
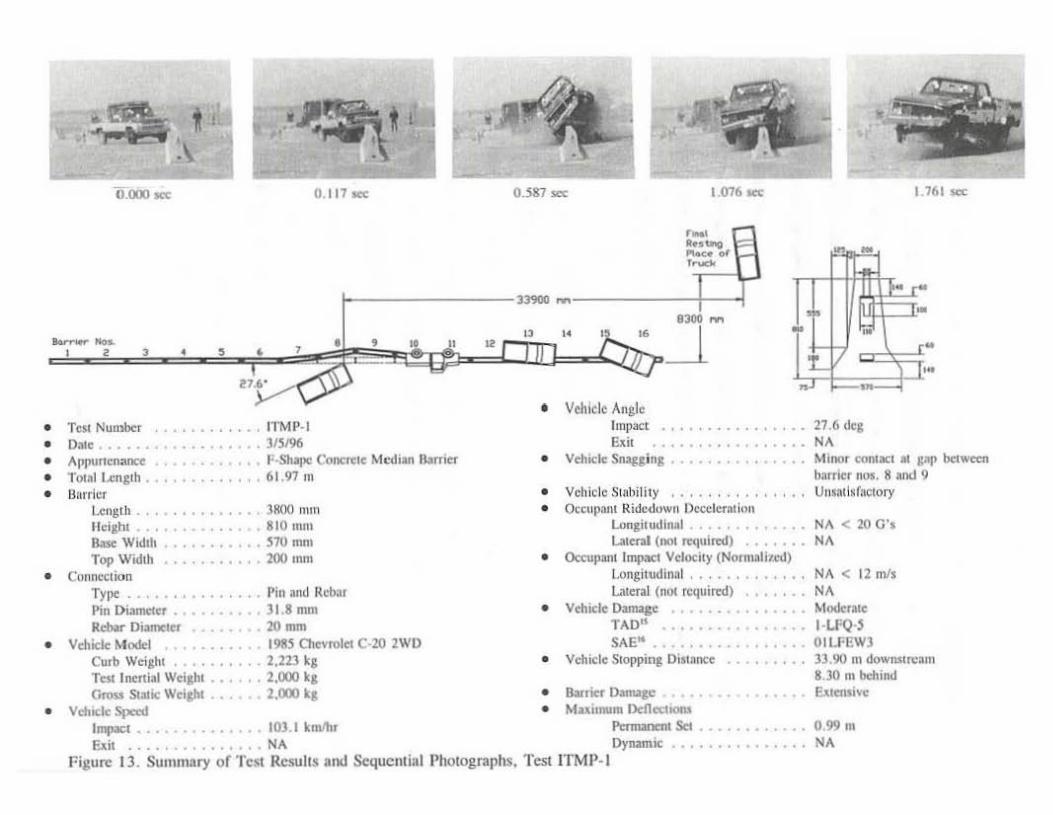
The 2,000-kg pickup truck impacted the concrete barrier (Design No. 1) at a speed of 103.1
km/hr and an angle of 27.6 degrees. A summary of the test results and the sequential photographs are
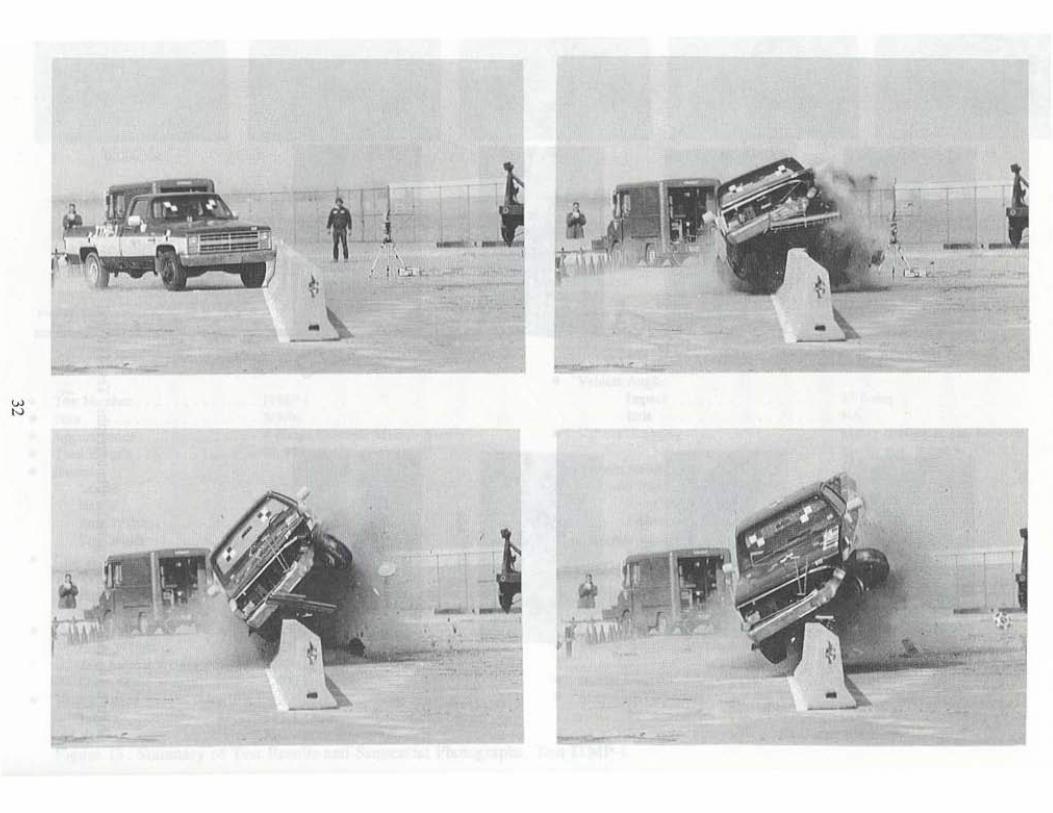
shown inFigure 13. Additionalsequentialphotographs are shown inFigure 14. Documentaryphotographs
of the crash test are shown in Figures 15 and 16.
7.2 Test Description
Initialimpact occurred 1.15 m upstream from the centerline of the gap betweenbarrier nos. 8 and
9, as shown inFigure 17. After impact, the left-front tire of the vehicle became airborne as it beganto climb
the face of the barrier, and the left-front corner of the vehicle was crushed inward. In addition, the traffic-
side face of barrier no. 9 was uplifted off the ground. Shortly thereafter, the left-front tire was deflated as
it passed the gap between barrier nos. 8 and 9. The front tires then turned sharply left toward the barrier
as the vehicle continued to climb the barrier's front face. The front bumper became dislodged as it neared
the top of the barrier. Subsequently, the right-front tirebecame airborne.The left-rear tire was also deflated
as it passed the gap betweenbarrier nos. 8 and 9. At 0.284 sec, the vehicle was parallel to the barrier with
the undercarriage positioned above the top of the barrier. The vehicle continued to travel parallel to and
above the barrier, reaching anapproximate maximumroll angle 47.5 deg at 0.587 sec. with the right-front
tire on the front face of the barrier. The vehicle's undercarriage then contacted the top of the barrier and
continued to travel on the barrier's top with the left-side tires behind the barrier. The vehicle came off the
end of the barrier system with the left-rear tire contacting the ground behind the barrier, and the left-front
wheelbecame dislodged. The vehicle came to rest 33.90 m downstream from impact and 8.30 m behind

28
the barrier, as shown in Figure 13.
7.3 Vehicle Damage
Vehicle damage was moderate, as shown in Figure 18. The front bumper and left-front quarter
panel were crushed inward. The left-front wheel assembly was dislodged during the impact as the outer
steel rimfractured fromthe inner regionattached to the wheelhub. The steel frame was slightlybent inward
near the front with a slight twist along its length from front to rear. Maximum occupant compartment
deformations to the floorboard were 127 mm of longitudinal displacement near the center firewall region
and a vertical displacement of 32 mm and 51 mm near left-side floorpan and center hump, respectively.
The deformations to the floorboardwerejudgedinsufficient tocause serious injuryto the vehicle occupants.
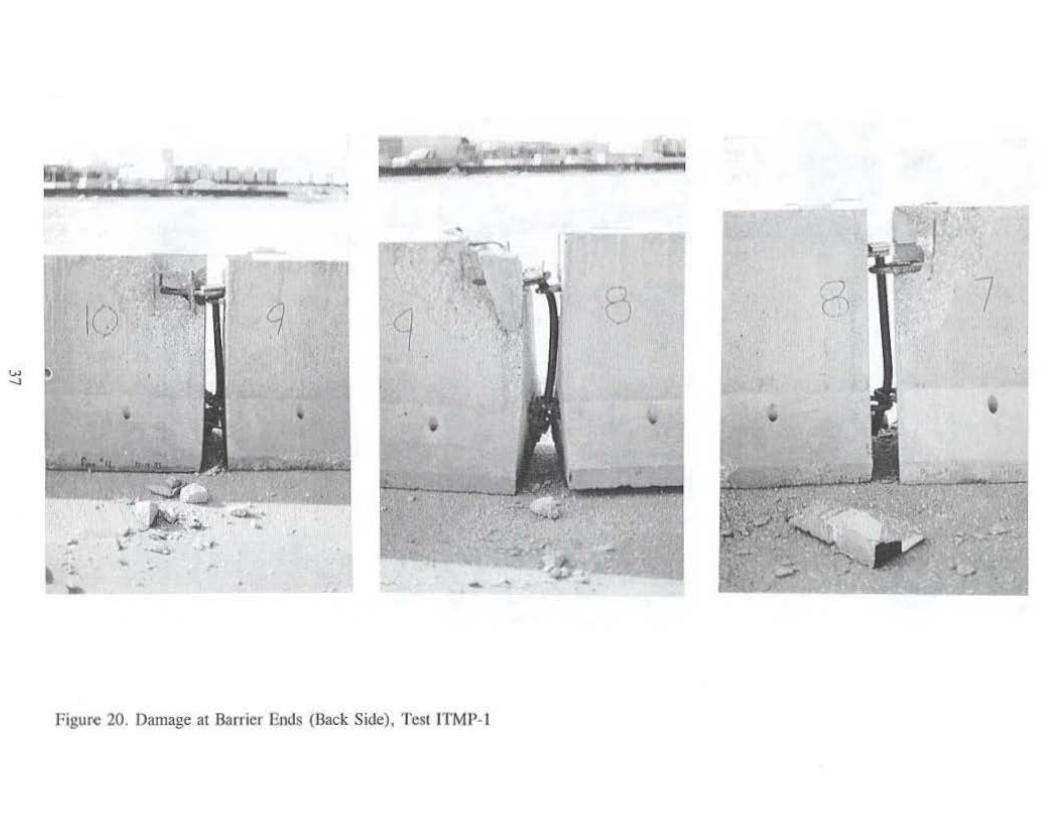
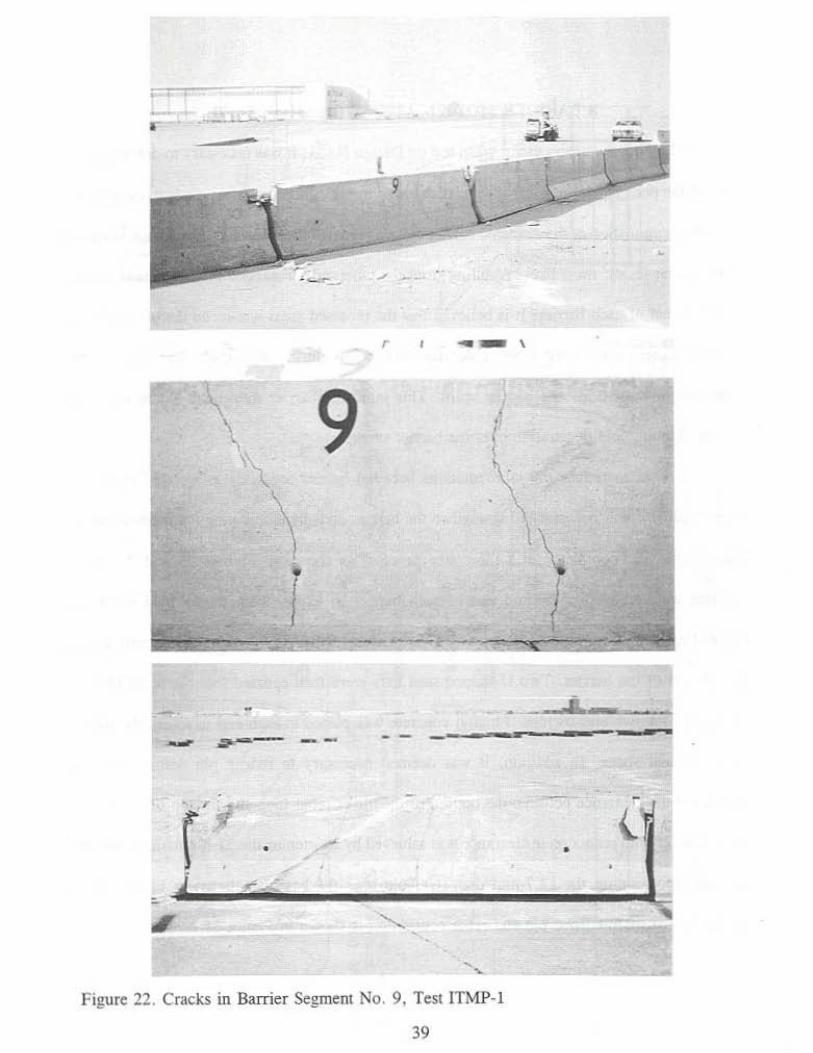
7.4 Barrier Damage
Barrier damage was extensive, as shown in Figures 19 through 22. Concrete damage consisted
of tire marks, scrapes, gouges, spalling, and fractured concrete pieces. The ends ofbarriers nos. 7 through
10 were cracked and fractured at various locations, and two cracks were also observed to extend through
barrier no. 9. Ten of the steel connector pins were also deformed, ranging from slight to extensive. The
maximum permanent set deflection of the barrier was 0.99 m.
7.5 Occupant Risk Values
During the crash test, the data acquisition systems malfunctioned, and no electronic accelerometer
data was obtained for the determination of occupant risk.
7.6 Discussion
The analysis of the test results for test ITMP-1showed that the barrier did not adequately contain
and redirect the vehicle; since, the vehicle overrode the barrier system and came off the barrier system's

29
end with the left-rear wheel contacting the concrete surface behind the barrier. Deformations to the
occupant compartment were evident but not considered excessive enough to cause serious injuries to the
occupants. The vehicle remained upright bothduring and after the collisionand with moderate vehicle roll.
However, test ITMP-1 conducted on Design No. 1 was determined to be unacceptable according to the
NCHRP Report No. 350 criteria.
• •
0.000_
Te!I N~,oo., DM~ •..
t .\
'~t l ~J':\
I1'MP· J 31~196
0. 111_
, 1
O.jlJ] ...,
• Vduele Angle Impac' Eli.
1016 _
• Al'JIUncn~ ,,-Shape Conc~le Mrdi ... Ibni .. 61.97 on
• Vehocle ~In,
• Toull.mglh . 11. "ie, • • Vehicle SI"bility , . "., . . . ,
Length Utili" Bare Wid,h Top WIdlh
.1Il00 nl1l1
1110 11m' '70 mn> 100mm
• (kcupanL Rido.:oown lJ«clcr.lin" lon,iludinll l.aIeral (l'1l)I mt",rcd)
• CQI1r.ecliun
• Oc:cupvn [~ Vdoo;:"Y (Normallttd) l.{lngil\ldln~1 , .. , . .
•
•
T,~ Pin D.arneI~r
Pin and RoI:hll J1.8 mm
RtbM"~' 20 nun Vehicle: lot,., I93S C10evmltl C- 20 2WD
Cu,b Wti"" 2,223 k. Tei! Incniill Wcl,hl 2,000 t,
•
•
Ui .... 1 (Il0l rtquiml) Vdlic:k 1nrm&C
TAD"
"'" Vehicle SI"""in, Di".""e
GrosI Sialic: Wti"" 2.000 t, • Bauier thma&" VeI".::k Sprcd • Mu. ....... Ddlft;!"""
1...-. . 103.1 km/h, f'mna1mt ScI Ell! .. .. NA DylWllic
Fig"",, 13. SUllmlary of Test RcsuilJ ROO Sc:quclllLaI Pholographs, Test ITMI'- I
276 dc, N'
•
1161 sec
MillO' CXIIIIIIC1 .til PI' btlWrttl
Iwricr 1l0III, 8 anoJ \I U" •• ,llrllCl.,ry
NA < lOG",
" NA < 12"",
" Moderate HJ'Q-' OIU'f.Wl 31.90 nl dowm.lream 830m behind EJ,lmIJ...,
099 .. N'
mholton
Typewritten Text
30

0.000 sec
0.020 sec
0.039 sec
0.137 sec
Figure 14. Additional Sequential Photographs. Test ITMp· \
31
0.186 soc
0.245 sec
0.284 sec
. , -, , I ( :;'.1:.
-,
_.
mholton
Typewritten Text
Figure 15. Documentary Photographs, Test ITMP-1

w v>
-
Figure 16. Documentary Photographs, Tesl lTMP-1
-·
I

,
J
-
, ,
Figure 17. Impact Location, Test ITMP·\
34

- --Figure 18. Vehicle Damage, Test ITMP-l
35

Figure 19. BaTTier Damage, Test ITMP-l
36
7
... .... •
• -
Figure 20. Damage at Barrier Ends (Back Side), Test ITMP-1

-- .. -- -- ----- r --\
\. -\ I
Figure 21. Damage at Barrier Ends (Traffic Side). Test [TMP-J
-r -- , -' ... --
, -- ,
\ 9 , , • \ I
,
\ \ • I I
- - _ _ _---=-=- ~i ::::i: -
'of f • .- • /
< 4._ ... ,. .. -,;;' ___________ _
Figure 22 . Cfac~ in Barrier SegJll(:nt No. 9. Test ITMP-\
19

40
8 BARRIER MODIFICATIONS (DESIGN NO. 2)
Following the unsuccessful crash test on Design No. 1, it was necessary to determine the cause of
the poor barrier performance so that design modifications could be made to the system. A careful
examination of the damaged barrier system revealed that considerable damage occurred at the barrier
joints, most likely resulting from the inherently weakened recessed areas located at the top end of each
barrier. It is believed that the recessed areas weakened the pin and rebar connection causing the rebar
loops to deformsignificantly during the impact, thus allowing for excessive joint rotations and barrier uplift.
This joint and barrier movement led to increased vehicle climbing and penetrationover the barrier system.
Inorder to reduce the joint rotations betweenbarrier segments as well as to prevent barrier uplift,
it was necessary to strengthen the barrier ends by eliminating the recessed areas. This retrofit was
completed ina three step process, as shown inFigures 23 and 24. First, concrete was removed at the top
end of each barrier to expose both the verticalshear and longitudinalreinforcement. Second, verticalholes
were drilled in the exposed concrete regionat eachend of the barrier. Two U-shaped steelbars were then
epoxied into the holes to close the tops of the two end-stirrups. Finally, concrete was placed at each end
to return the barrier to its originalshape. Inaddition, it was deemed necessary to reduce pin deformations
bydecreasing the clearance between the bottom of the lower rebar loop and the top of the bottomplate.
This 25-mm reduction in clearance was achieved by shortening the 31.8-mm diameter steel pin and
repositioning the 12.7-mm diameter hole near the base, as shown in Figure 23. A photograph of the
modified pin and rebar connection is shown in Figure 25.

~ -
~
Relro'it Step One Cut "wO)I concrete 010"9 doll~ line (ovoid rebar),
1 I-'~-
0 0
.......... ·r
Connection Detail
~.
...,
~ ~
Retrofit St"p Two Drill holes and insert 2 "If-shoped bors to ·clos.- Ihe <!nd sli'NpS.
Retrol it Step Three Fill wilh concrete to complete retrola.
~,~ ,w
'"
>"'-< _~J!' ----Top &: Bottom
Plot .. (..0.36)
n -13mm II
Bolt & Nut (Grode 8)
Detail "8"
Figure 23. Barrier Modifications an<.l Connections Details, L>csign No.2
,,~.~ 200
~
" . :r:.. '"
,,- $70--I
End View
~
Rebar Details

- -• .:: "j" - ..- .;., ..
Figure 24. Barrier Retrofit , Design No.2
42

...... "-~...... ... ...
•
Figure 25. /'o.·lodified Pin and Rebar Connection. Design No.2
43
•
44
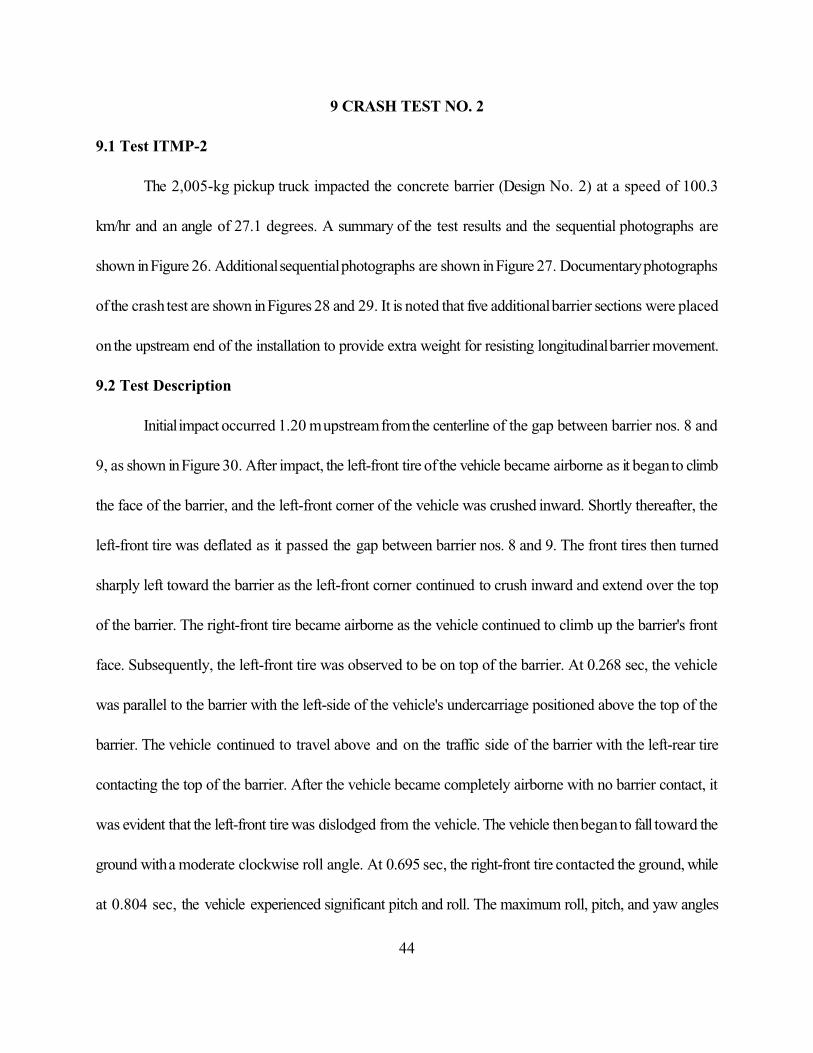
9 CRASH TEST NO. 2
9.1 Test ITMP-2
The 2,005-kg pickup truck impacted the concrete barrier (Design No. 2) at a speed of 100.3
km/hr and an angle of 27.1 degrees. A summary of the test results and the sequential photographs are
shown inFigure 26. Additionalsequentialphotographs are shown inFigure 27. Documentaryphotographs
of the crash test are shown inFigures 28 and 29. It is noted that five additionalbarrier sections were placed
on the upstream end of the installation to provide extra weight for resisting longitudinalbarrier movement.
9.2 Test Description
Initialimpact occurred 1.20 mupstreamfromthe centerline of the gap between barrier nos. 8 and
9, as shown inFigure 30. After impact, the left-front tire of the vehicle became airborne as it beganto climb
the face of the barrier, and the left-front corner of the vehicle was crushed inward. Shortly thereafter, the
left-front tire was deflated as it passed the gap between barrier nos. 8 and 9. The front tires then turned
sharply left toward the barrier as the left-front corner continued to crush inward and extend over the top
of the barrier. The right-front tire became airborne as the vehicle continued to climb up the barrier's front
face. Subsequently, the left-front tire was observed to be on top of the barrier. At 0.268 sec, the vehicle
was parallel to the barrier with the left-side of the vehicle's undercarriage positioned above the top of the
barrier. The vehicle continued to travel above and on the traffic side of the barrier with the left-rear tire
contacting the top of the barrier. After the vehicle became completely airborne with no barrier contact, it
was evident that the left-front tire was dislodged from the vehicle. The vehicle thenbeganto fall toward the
ground witha moderate clockwise roll angle. At 0.695 sec, the right-front tire contacted the ground, while
at 0.804 sec, the vehicle experienced significant pitch and roll. The maximum roll, pitch, and yaw angles

45
of 48.7, 22.8, and 64.3 degoccurred at 0.836, 1.61, and 1.34 sec after impact, respectively. The vehicle
then became airborne as the right-front tire bounced into the air. The left-rear tire recontacted the barrier,
and then the left-front wheel hub struck the ground. The vehicle came to rest 55.15 m downstream from
impact and 19.86 m away from the traffic-side face of the barrier, as shown in Figure 26.
9.3 Vehicle Damage
Vehicle damage was moderate, as shown in Figure 31. The front bumper and left-front quarter
panel were crushed inward. The left-front wheel assembly was dislodged during the impact as the outer
steel rim fractured fromthe inner region attached to the wheel hub. The steel frame was bent inward near
the front with a significant twist along its length from front to rear. Maximum occupant compartment
deformations to the floorboard were 55 mmoflateraldisplacement near the firewall and botha verticaland
longitudinal displacement of 38 mm near the center hump behind the gear shift. The deformations to the
floorboard were judged to be insufficient to cause serious injury to the vehicle occupants.
9.4 Barrier Damage
Barrier damage was minor, as shown in Figures 32 through 34. Concrete damage was mostly
cosmetic, consisting of tiremarks,scrapes,gouges,and minor spalling. Nine steelpins were also deformed,
ranging from slight to extensive. The maximum permanent set deflection of the barrier was 1.14 m.
9.5 Occupant Risk Values
The normalized longitudinaland lateraloccupant impactvelocitiesweredeterminedtobe 7.2 m/sec
and 5.3 m/sec, respectively. The maximum 0.010-sec average occupant ridedown decelerations in the

46
longitudinal and lateral directions were 7.6 g's and 10.5 g's, respectively. It is noted that the occupant
impact velocities and occupant ridedown decelerations were within the suggested limits provided in
NCHRP Report No. 350. The results of the occupant risk, determined from accelerometer data, are
summarized inFigure 26. Results are shown graphically inAppendixA. The resultsfromthe rate transducer
are shown graphically in Appendix B.
9.6 Discussion
The analysis of the test results for test ITMP-2 showed that the barrier contained and redirected
the vehicle with controlled lateral displacement of the barrier. Minor deformations to the occupant
compartment were evident but not considered excessive enough to cause serious injuries to the occupants.
The vehicle remained upright both during and after the collisionand with significant vehicle roll, pitch, and
yaw angular displacements. Therefore, test ITMP-2 conducted on Design No. 2 was determined to be
acceptable according to the NCHRP Report No. 350 criteria.

~ • • • • •
•
•
•
0.000 $CC
ITMP-2 ,.""
0 .099 $CC O.S:16 sec O.!lO4 sec
• Tes1 Number D"'o ... AJlPu!icruu'lCe nx.1 l..cnglh . H.rrier
F-Shapc Concrete Median !I.uric,
81.52 m • • •
Vehicle Angle ImpXI
""il Vehicle SM"ing Vehiele SlObilily
l.tnSlh . . lIeighl . Base Width Top WK!lh
CoonetliOll Type ...
3800 mm 810 mOl 570 mm 2((J mm
Pin and Rebar Pin Oi.,,-.:Io, .... . .. . . 31.8 mm Reb.r DiamtlCT . ___ 20 mm
Vch"'lt MO<k1 ........ __ . 1986 Cbcvrol<1 C·lO 2 WO Cuw Weighl ........ . . 2,011 k, TCSl Incn ... , Wel,hl .... . . 2.005 k& Grots Stalic Weighl . . 2.005 k&
Vehicle Speed Impact .•..... . . .. . . , 100.3 kmillr 10, ;, . " . , ... , NA
Figure 26. SUl1ul\ary or Test Resulls an<J Scqll~l\l i a l
•
•
•
Occupml! Ridcdown 1>«<:lc,"l ion
LongitLldin.11 u,efll (Il0l rc1luircd)
Occur.1ll ImpllCl Velocity (Nofm~lized) Longitudinal. ullcral (1'IOl required)
Vchiele D.m,," ... TAD" .. SAE"
Vchi<:leSloppil\& OUI~
• Ihrritr n.ma~ .. Mat;mu", t)cnctloon~
I'tnnancnl Sec • Oyn~onic
PhOlographs, Tesl ITMP-2
•
rrM480
$CC
27 .1 NA N"~ Mo.giTl.l
Q
, ,~ ,
7.6 G', < 20 G'$ 10.3 G',
7.2 mi. < 12 ml, ~ . 3 mi. M<>tkme l-U:O.~
OILFEW)
~~ . 15 m doWRlI","m 19.86 m lateral Minimal
1.14 m 1.1~ m

0.000 sec
0.04\ sec
Figure 27. Additional Sequential Photographs. Test ITMp·2
48
0_266 ~
0.354 sec
0.393 sec

t
•
Figure 28. Documentary Photographs, Test ITMP-2

o I ,
mholton
Typewritten Text
Figure 29. Documentary Photographs, Test ITMP-2

•
I , . - ~
, ~,. ' .' , . _ or
,
·li \ - ~ .-
Figure: 30. Imp,ict Location. Test ITMP-2
51

1 -
•• - :=-----~--...... ~-"=_.l
Figure 31. Vehicle Damage. Test IThlP-2
"
-~-~'. ~ .,... ..

.. -
=--
Figure 32 . Barner Damage, Test lTMP-2
53
• • •
• •
I
figure 33. Damage a1 Barrier l::nds (Back Side), Test lTMP-2

. .. . : ~ .
• t.. •
figure 34. Damage at Barrier ends (Traffic Side). Test lTMP-2

56
10 SUMMARY AND CONCLUSIONS
Astandardized, temporaryconcretemedianbarrier was developed and full-scale crashtestedwhile
addressing the concerns for safety, economy, structural integrity, constructability, ease of installation, and
maintenance. However, the compromise betweeneconomy and performance in the design ofa temporary
concrete medianbarrier is verydifficult, since the Test Level 3 (TL-3) criteria ofNCHRP Report No. 350
provide for a very stringent test of the barrier system. Therefore, the success of the barrier design was
based largely on the capacity of the pinned connectionand the subsequent reduction of the rotation of the
barrier system.
Two crash tests were performed according to TL-3 of NCHRP Report No. 350. The first crash
test, test ITMP-1, was performed with unsatisfactory results, resulting in extensive barrier damage. The
barrier did not adequately contain and redirect the vehicle; since, the vehicle overrode the barrier system
and came off the barrier system's end with the left-rear wheel contacting the concrete surface behind the
barrier. Following this crash test, the temporaryconcrete barrier was modified, and a retest, test ITMP-2,
was successfully performed on the modified barrier system. The temporary CMB was determined to be
acceptable according to the TL-3 crash test conditions of NCHRP Report No. 350, although significant
vehicle roll, pitch, and yaw motions were encountered and are typical of the majority of other concrete
barrier tests. A summary of the safety performance evaluation is provided in Table 2.
The initial barrier design incorporated several features that allowed the barrier system to rotate
excessively during impact. Two of these features were the open annulus adjacent to the rebar loops, and
a gap between the retainer pin and the bottom loop of the system. The open annulus on the barrier ends
were initially intended to provide space for steel reinforcement cast-in-place, allowing the barrier to have

57
incremental stiffness at the top of the joints of permanent installations. The rotation of the barrier caused
the vehicle to intrude on the space immediately behind the barrier, a situationthat was determined to cause
the first test to be designated a failure.
Systemmodifications for test ITMP-2 were not extensive, theyincluded fillingthe openannulus on
the ends of the barrier, and reducing the lengthof the pin to decrease the barrier deformation. With these
two modifications, the barrier system was substantially stiffer, redirecting the vehicle with significantly less
intrusionon the work space. Damage to the barriers was also substantially reduced, withthe replacement
of the pins and straightening of rebar loops being the only necessary requirement for continued use.
It cannot be overemphasized that the success of this barrier system is entirely based on limiting
rotation of the barriers and assuring that the connectionwithstands the longitudinal loading. These criteria
require that the connection be retained in a manner described in the report, and that the size of the loops
and rods located on the ends of the barrier are not altered in a manner that increases barrier rotations.

Table 2. Summary of Safety Performance Evaluation Results
EvaluationFactors
Evaluation Criteria TestITMP-1
TestITMP-2
StructuralAdequacy
A. Test article should contain and redirect the vehicle; the vehicle should not penetrate,underride, or override the installation although controlled lateral deflection of the testarticle is acceptable.
U S
OccupantRisk
D. Detached elements, fragments or other debris from the test article should notpenetrate or show potential for penetrating the occupant compartment, orpresent an undue hazard to other traffic, pedestrians, or personnel in a workzone. Deformations of, or intrusions into, the occupant compartment that couldcause serious injuries should not be permitted.
M S
F. The vehicle should remain upright during and after collision although moderate roll,pitching and yawing are acceptable.
M M
VehicleTrajectory
K. After collision it is preferable that the vehicle's trajectory not intrude into adjacent trafficlanes.
S S
L. The occupant impact velocity in the longitudinal direction should not exceed 12 m/secand the occupant ridedown acceleration in the longitudinal direction should not exceed20 G's.
S S
M. The exit angle from the test article preferably should be less than 60 percent of testimpact angle, measured at time of vehicle loss of contact with test devise.
S S
S - (Satisfactory)M - (Marginal)U - (Unsatisfactory)
mholton
Typewritten Text
58

59
11 RECOMMENDATIONS
Following the successful completion of the research objective, finaldesign drawings (Design No.
3A) were developed for the TL-3 temporaryconcrete medianbarrier, as shown in Figures 35 through 37.
It is noted that the retrofit procedure, used inDesign No. 2 to fill the cavities at the barrier ends, is no longer
needed for constructing new barriers. Therefore, modifications were made to the steel reinforcement
located at the barrier ends. First, the end stirrups were closed at the upper end, and only one type of
verticalstirrup was required throughout the entire barrier length. Second, the L-shaped bars were removed
at the barrier ends and replaced by extending the top longitudinal bar to the full barrier length. In addition,
the diameter of the transverse liftingholeswasincreased from50 to 100 mmand constructed witha section
of steel pipe cast into the concrete. However, this design contains the vertical dowel holes located at the
barrier's base and the same quantity and location of vertical stirrups used in the original barrier design.
During the completion of the final design drawings, the Iowa Department of Transportation
requested that considerationbe givenfor the placement of transverse, rectangular slots in the middle region
of the barrier's base. These openslots would be used for lifting the concrete barrier withstandard, forklift-
type construction equipment. Therefore, a second final design (Design No. 3B) was completed that
included this feature, as shown in Figures 38 through 40. However, inclusion of such slots required that
modifications be made to the steel reinforcement located near the barrier's base. First, the bottom
longitudinal bars were raised 75 mmand the shape of the vertical stirrups was changed slightly to provide
the necessary concrete

60
cover above the slots. Second, the verticaldowelholes were removed, thus allowing for a reduction in the
vertical stirrups located around the three interior dowel holes.

38
~50 -
,-190 j_
() (J
~· 3! - 0 0 0 0
]ISO I ,-190 j_
0
f--.•50 350-300-l . 800
S1de V1ew End View
~ ~ oppfox.. 80mm
> ;>
0 0
.. _,
Connection Deloil
Figure 35. Connection Dela ils , Design No. 3A
823
II , 15mm ,. J
Rod 32mm 0 (A36)
~
l~mm.J~Lgs conlered on plote
Top & Bottom Plate (A.36)
Detail "C"
JS:r 1-
J} 13mm 0
Boll & Nut (Grode 8)
lsometeric

rt·"-r'"l'"-1 ·~ I ... I ...
I I I I I
T
.,
~ 'i
(o) ow.-wj r ""· 1CIIil STitiM"
'-ttt~ t.OO"W
I
' til
m i:i ••
Ill
1.-... t=:'M ... I ... "' 1'10fCS1 t All 4 111'1• tul6111 or• lll m"'.
;-t ... Win',.J\III!Ioii'J
TYPICAl STIRRUP SECJION A- A
... f-.....;. __ ,,. ___ ~
Figure 36. Reinforcement De1ai ls, Design No. 3A
-I "' ... I I
C>)o .. _w\ vu-·
r
SIDE VIEW
Symetrlc ob out
¢..
(;I) IW '-""' Mil\
...
... '" I
... _.......,_
toer.. ... ' ""
m ·t Ill
I "'
A -
I '"l"'l'"f I I I
·- ~ ........ ., .... T'l
../
m •
I >M -.. ..,_
- A
_ A
I I !~v:s· JlliiiiW
;·w-~•~ r tOll AIC. ~ (IIIDIII.!OIIf')
i I I v
• I I
I
i • • 1'>
I
I t.W Wo4...., ~) •wor..,. .J
-TOP VIEW A
•
'" r,. •
J

All measurements ore In mm.
r---------------------------------------------------------vzo•---------------------------------------------------------,
lA 15-1 0 J720 mm
r---------------------------------------------------------------->720----------------------------------------------------------------~
lA 10-2 0 3720 mm
... "' lruo
~ • ~ l' -
14111 1$0U.P~ • 0
}-U II
I .,,_ .. v-Wbii~ W
v , /
lA 20-1 0 •&JO mm lA. 20-2 • 4860 mm lA. 10- 1 0 1990 mm
Figure 37. Reinforcement Bend Diagrams, Design No. 3A

380
,--190 ...L -
0 0 - r75 T
190 I
175-l I 71 5 -'-
Side View
~ ~ opprox. 80mm
< > < ;>
. ' .J Sec Ooto<l Ci"
Connection Deta il
Figure 38. Connection Details, Design No. 3B
1:9-;6.,;m;;;;m;v-- (1E60
623
II I
ISmmfi J
Rod 32mm 0 (A36)
~ rr.;:)l ~Js
3Smm •~-+centered 01' piole
Top & Bottom Plate (A36)
De to i I "C"
o I 3B-i f-
11 13mm 0
Bol t & Nut (Grode 8)
~50
555
-· J ]i~o j 650
. rt-~-r~=j 75 ~ 570
End View
lsometer ic

·t
y i
~~- ---------·--------~j~~ u•l*l'" I ... I .. .. I I !I I "II"' I I
I .. ....... t .............. .,.. a.-.
rYPICAL STIRRUP S(CfiOH A·A
r E!:
...
,,,,,. __ } rw. ,.., .,.,..
'""----h
• !.
I I w---+-•n ..
r"'""' " ... _,
r- -----r ----+ -----I/ \ -f- ----------J I ...
"
[HO vttw
Figure 39. Reinforcement Details, Design No. 3B
..
I
l SlOE VIEW
Symelric about
..
,, .. _ ... \
(.t) lW '*"" ..,.,
J U" I '" ... ..
f I , ... "~· """ (IYfiCAI. ( '"'-·"'' 1/ I
I
I I I
....................
~::::-... ·--...,
~
-'- L :~! •
... "
- A
A .... -rmlwtt. tWit (II!OI!IICJII)
I _]_
,.L
""•• Wilt ... t'UI"'CtO -\WW.,j
-TOP VIEW A
I .L
I J r ~
___l
J

All moasuromonts are In mm.
~--------------------------------------------------------------- »n•-----------------------------------------------------------------
lA 1 5-I 0 3720 mm
lA 10-2 C 3720 mm
"""'--....(1011 ..,)• to-
~----------71••----------~ , .. ... ~ , ..
•
l vrwt1MW
uo-j ... \ v
\ .Y
.. ,,.w
lA 20-1 0 4630 mm lA 20-2 0 4860 mm lA 10-1 0 1720 mm
Figure 40. Reinforcement Bend Diagrams, Design No. 3B
67
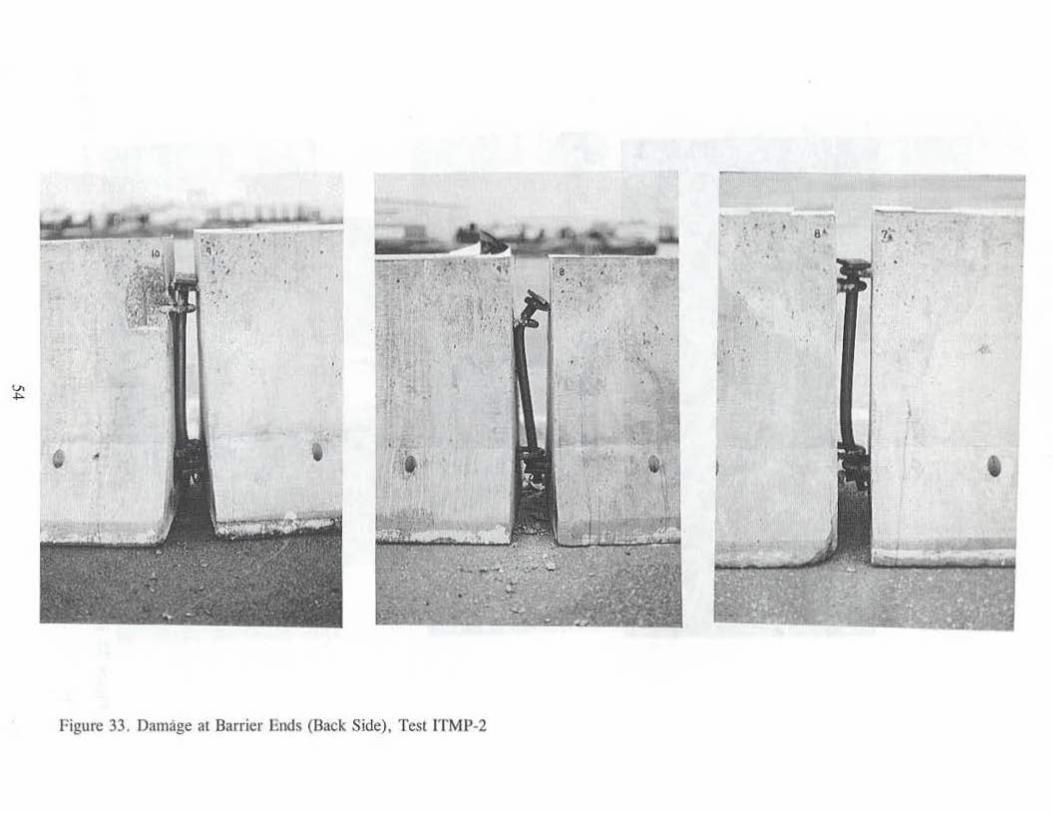
12 REFERENCES
1. Ross, H.E., Sicking, D.L., Zimmer, R.A. and Michie, J.D., Recommended Procedures for theSafetyPerformance Evaluation of HighwayFeatures,National Cooperative Research Program(NCHRP) Report No. 350, Transportation Research Board, Washington, D.C., 1993.
2. Bronstad, M.E., Calcote, L.R.,and Kimball, C.E., Jr.,Concrete Median Barrier Research - Vol.2 Research Report, Report No. FHWA-RD-77-4, Submitted to the Offices of Research andDevelopment, Federal Highway Administration, Performed by Southwest Research Institute,March 1976.
3. Beason, W.L., Ross, H.E., Jr., Perera, H.S., and Marek, M., Single-Slope Concrete MedianBarrier, Transportation Research Record No. 1302, Transportation Research Board, NationalResearch Council, Washington D.C., 1991.
4. Michie, J.D., Recommended Procedures for the Safety Performance Evaluation of HighwayAppurtenances, NationalCooperative HighwayResearch Program (NCHRP) Report No. 230,Transportation Research Board, Washington, D.C., March 1981.
5. Ivey, D.L., Ross, H.E., Hirsch, T.J., Buth, C.E., and Olson, R.M., Portable Concrete MedianBarriers: Structural Design and Dynamic Performance, TransportationResearch Record No.769, Transportation Research Board, National Research Council, Washington D.C., 1980.
6. Ivey, D.L., Buth, C.E., Robertson, R.G., Koppa, R.J., Beason, W.L., Pendleton, O.J., and Ross,H.E., Jr., Barriers in Construction Zones - Volume I: Summary Report, Final Report to theOfficeofResearch, FederalHighwayAdministration, PerformedbyTexasTransportationInstitute,Texas A&M University, April 1985.
7. Beason, W.L.,and Ivey, D.L., Structural Performance Levels for Portable ConcreteBarriers,TransportationResearch Record No. 1024, Transportation Research Board, NationalResearchCouncil, Washington D.C., 1985.
8. Graham, J.L.,Loumiet,J.R., and Migletz, J., Portable ConcreteBarrierConnectors,ReportNo.FHWA-TS-88-006, Final Report to the Office of Implementation, Federal HighwayAdministration, Performed by Graham-Migletz Interprises, Inc., Independence, MO, November1987.
9. Buth, C.E., Campise, W.L., Griffin III, L.I., Love, M.L., and Sicking, D.L., Performance Limitsof Longitudinal Barrier Systems - Volume I: Summary Report , FHWA/RD-86/153, FinalReport to the Federal Highway Administration, Office of Safety and Traffic Operations R&D,Performed by Texas Transportation Institute, Texas A&M University, May 1986.

68
10. Fortuniewicz, J.S., Bryden, J.E., and Phillips, R.G., Crash Tests of Portable Concrete MedianBarrier for MaintenanceZones, Report No. FHWA/NY/RR-82/102, FinalReport to the Officeof Research, Development, and Technology, Federal HighwayAdministration, Performed by theEngineering Researchand Development Bureau, New York State Department ofTransportation,December 1982.
11. Mak, K.K., and Sicking, D.L., Rollover Caused by Concrete Safety Shape Barrier - VolumeI: Technical Report and Volume II: Appendices, Report Nos. FHWA-RD-88-219/220,Performed for the Office ofSafetyand Traffic Operations R&D, FederalHighwayAdministration,Performed by the Texas Transportation Institute, Texas A&M University, January 1989.
12. Buth, C.E., Hirsch, T.J., and McDevitt, C.F., Performance Level 2 Bridge Railings,Transportation ResearchRecord No. 1258, Transportation Research Board, National ResearchCouncil, Washington D.C., 1990.
13. A Guide to Standardized Highway Barrier Hardware, Task Force 13 Report, Subcommitteeon New Highway Materials, AASHTO-AGC-ARTBA Joint Committee, May 1995.
14. Hinch, J., Yang, T-L, and Owings, R., Guidance Systems for Vehicle Testing, ENSCO, Inc.,Springfield, VA, 1986.
15. Taborck, J.J., "Mechanics of Vehicles - 7", Machine Design Journal, May 30, 1957.
16. Vehicle Damage Scale for Traffic Invest igators, Second Edition, Technical Bulletin No. 1,Traffic Accident Data (TAD) Project, National Safety Council, Chicago, Illinois, 1971.
17. CollisionDeformation Classification - Recommended Practice J224 March 1980,HandbookVolume 4, Society of Automotive Engineers (SAE), Warrendale, Pennsylvania, 1985.

69
13 APPENDICES
APPENDIX A - ACCELEROMETER DATA ANALYSIS
Figure A-1. Graph of Longitudinal Deceleration, Test ITMP-2
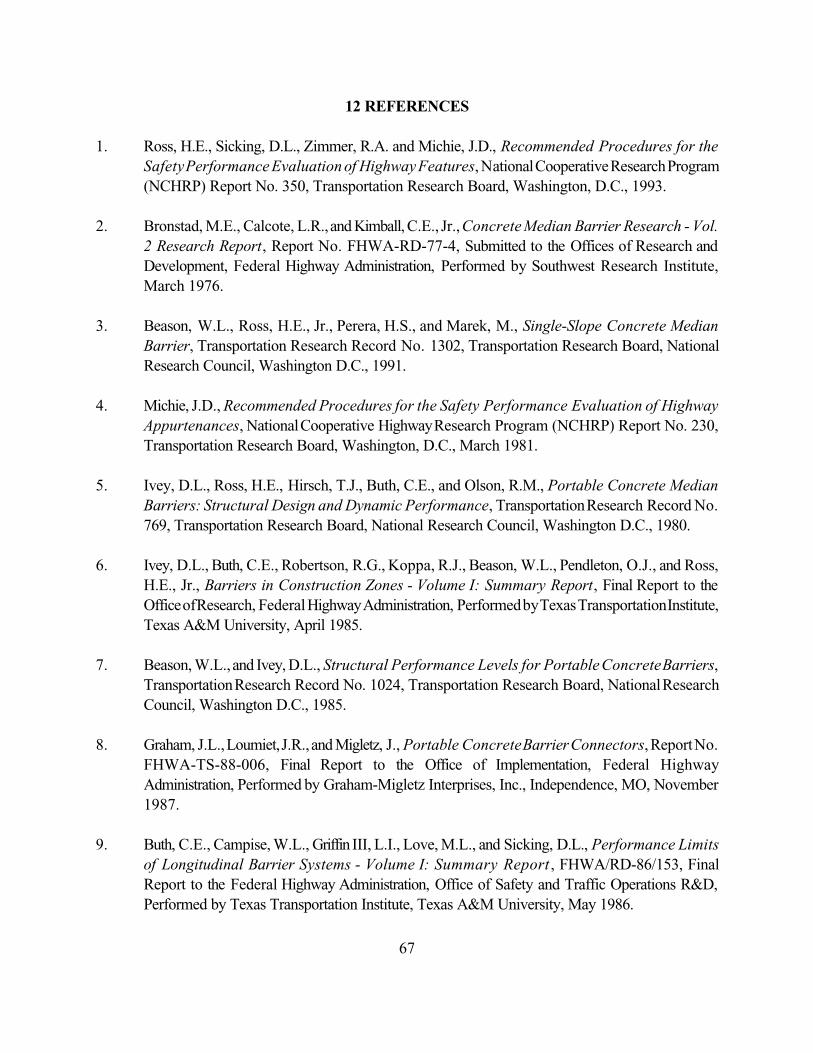
Figure A-2. Graph of Longitudinal Occupant Impact Velocity, Test ITMP-2
Figure A-3. Graph of Longitudinal Occupant Displacement, Test ITMP-2
Figure A-4. Graph of Lateral Deceleration, Test ITMP-2
Figure A-5. Graph of Lateral Occupant Impact Velocity, Test ITMP-2
Figure A-6. Graph of Lateral Occupant Displacement, Test ITMP-2

LONGITUDINAL DECELERATION - TEST IT HP-2
I 5 . 0 · ~ -
10.0 :- - - J·
5. () ~/ - -8 V\
~ 1\ {\ fl
A ,r .r I'(\ if' _..J " 0 0 v v v v v v v
-5. 0 -
0.00 0. 1 0 0. 20 0. 30 0. 4 0 0. 50 '""le
I ~
Pigure A· l. Graph of Longitudinal Deceleration, Tr.st ITMP-2
LONGIT UDIN AL OCC UPA NT I l"l PA CT VEL DC IT Y - TEST ITMP - 2
so o · -
40. 0 """'-__ . rv I /
30. 0
.// ' /
~ 20. 0 If ._,_
1 0 . 0 I ll
-
./ 0 . 0 - _.-'
-0 . 0 0 0. 1 0 0 . 20 0 . 30
Sec 0 . 4 0 0. 50
Figure A-2 . Graph of Longitudinal Occupant Impact Velocity, Test ITMP-2

LONGITUOINnL OCCUPANT DISPLAlEMENT - TEST ITMP-2
100.0 I v
80.0 I -
/
60. 0 ~ --
_, tv
/ 40. 0 v
20. 0 /
/ -
/ 0 . 0-
-20.0 - I-
-0. 0 0 0 . 10 1), 20 0 .)0 () <10 ,..,_ ; li
Figur: A-3. Graph of Longitudinal Occupant Displacement, Test ITMP-2

LATERAL DECELERA TION - TEST ITMP -Z --·
1 5 f1 - ~ - -
I 0 (\ - -
5 . 0 - /'J_ 1/ --
0. 0
"' \ v'V\ v ~ 1\ J\ J\ r\rv J\;'1 /\; '-1
v v v v
VII
-5. 0 - - -
0. 00 0. 10 0. 20 0 . 30 ~
0. 40 0. 50
-Figure J\-4. Graph of Lateral Deceleration, Test ITMP-2

LATERAL OCC UPANT I MPA CT VE LOCITY - TES T ITI'1P- Z
40. 0 -
30.0
~ / ' ~
'/ /,/ -
;'
20. 0 v 1 D. 0 I
0. 0 - --.
1-0. 00 0. 10 0. 20 o. 30 0. 40 0 . 50
.« - -
Figure A-5, Graph of Lateral Occupamlmpact Velocity, Test ITMP-2

L n TERRL OCC lJ flRf\1 T D [ SPL RCEI"IEN 1· - r EST 1 r MP-2
80. 0
II --
1- -- / -- - -
v 60 0
- ~ v --
/
v v / -
40 0
z
20. 0
0. 0
- 20. 0
-o. 00 0. I 0 0. 20 0. 30 ~
0. 40 0 . 50
Figure A-6. Graph of Lateral Occupant Displacement, Test ITMP-2

76
APPENDIX B - RATE TRANSDUCER DATA ANALYSIS
Figure B-1. Graph of Roll, Pitch, and Yaw Angular Displacements, Test ITMP-2

LJZB I I MP - 2 ROLL . Pl r CH ' RND YAW nNG ULnR Dl SPLACE MCNT S
------1
r -· ·-·····
y,~w
' ' ·····~···· ~ · ··· ··· ··· ······· ·t·········" -------~ '
60.
i : :
0 - ····················· ··· ·-~·-······· ······ ··· ··· ··· ···i·· ··· ··· ··· ··· ···· · •···· l '
!ROl l
,. ' I ' i '
' ' ,--t---_..-/,' -~· '/' ' . ' '
i f i j _..-;-
40. 0- ' . . ................................. ·· ·: ~- -· ··· -~ - - .. ~-
20. 0 . . ' . . . : ... . ... --·-·-·-·-····: . ·--............. ·-·-·-· ..
! l .. :
'
/~ i i ~ ... ! .. .. . .. .. .. . ·1· ... . . ~-.. . - ~ PIT~· ·-• ............. l.... . .. .. ... '· .. .
: ; ~ . . . ' -~.;-·-----~ . I .
i -20. 0 ..................... , .... - ........... , ............... , ... ..
0. 0
~ . i !
~-------- ·----1----+-----+----~------~----~· 0. 0 0 . 2 0 4 0. 6 0 8 I . 0 1 . 2 1 . ~ 6
Figure B-1. Gmph of Roli ,.Pitch, and Yaw Angular Displacements, Test ITMP-2