Development of a New Method For Designation of Mental ...
49
UNIVERSITY OF NORTH CAROLINA AT CHAPEL HILL Development of a New Method For Designation of Mental Health Professional Shortage Areas HHSH-230200532038C Final Report Joseph P. Morrissey, Ph.D. Kathleen C. Thomas, Ph.D. Alan R. Ellis, MSW T. Robert Konrad, Ph.D. Cecil G. Sheps Center for Health Services Research University of North Carolina at Chapel Hill 725 Martin Luther King Jr. Blvd. Chapel Hill, NC 27599-7590 Tel. 919/966-5829 Fax 919/966-1634 [email protected] December 21, 2007 Prepared under contract HHSH-230200532038C with the Bureau of Health Professions, Health Resources and Services Administration, Department of Health and Human Services.
Transcript of Development of a New Method For Designation of Mental ...

UN
IVE
RSI
TY
OF
NO
RT
H C
AR
OL
INA
AT
CH
AP
EL
HIL
L
Development of a New Method
For Designation of Mental Health Professional Shortage Areas HHSH-230200532038C Final Report Joseph P. Morrissey, Ph.D. Kathleen C. Thomas, Ph.D. Alan R. Ellis, MSW T. Robert Konrad, Ph.D. Cecil G. Sheps Center for Health Services Research University of North Carolina at Chapel Hill 725 Martin Luther King Jr. Blvd. Chapel Hill, NC 27599-7590 Tel. 919/966-5829 Fax 919/966-1634 [email protected] December 21, 2007 Prepared under contract HHSH-230200532038C with the Bureau of Health Professions, Health Resources and Services Administration, Department of Health and Human Services.

i
Acknowledgements The project team takes full responsibility for this report and the method that is described here. We would like to acknowledge the guidance of our project officer, Andy Jordan, MSPH, Chief, Shortage Designation Branch, Bureau of Health Professions, Health Resources and Services Administration and our advisory board, Michael Almog, PhD, New York University; David Bergman, JD, Director of Legal and Government Affairs, American Association for Marriage and Family Therapy; Tim Dall, MS, Vice President, The Lewin Group; Sheron R. Finister, PhD, Chief Executive Officer, SRF Consulting; John C. Fortney, PhD, Professor, Department of Psychiatry, University of Arkansas for Medical Sciences; Nancy P. Hanrahan, PhD, RN, Assistant Professor, University of Pennsylvania School of Nursing; Sharon M. Jackson, MSW, LCSW, BCD, Director, Human Services Program, Fontbonne University; Nina Gail Levitt, EdD, Associate Executive Director for Education Policy, American Psychological Association; Ronald W. Manderscheid, PhD, Director, Mental Health and Substance Use Programs, Constella Group; Noel A. Mazade, PhD, Executive Director, National Association of State Mental Health Program Directors Research Institute; Bradley K. Powers, PsyD, Director of Underserved Populations Program, Forest Institute of Professional Psychology; Richard M. Scheffler, PhD, Director, The Nicholas C. Petris Center on Health Care Markets and Consumer Welfare, University of California Berkeley; Laura Schopp, PhD, Associate Professor, Department of Health Psychology, University of Missouri-Columbia; Lynn Spector, MPA, Bureau of Primary Health Care, Health Resources and Services Administration; Marvin Swartz, MD, Professor and Head, Division of Social and Community Psychiatry, Duke University Medical Center; and Josh Wilk, PhD. Director, Workforce Studies, American Psychiatric Association. We also gratefully acknowledge the particular contributions of several groups and individuals: Tim Dall, Rick Harwood, and others at the Lewin Group, for their earlier work on this topic and for sharing results and insights with us; Dr. Charles Holzer III at the University of Texas Medical Branch, for his contributions in the area of prevalence estimation; Dr. Josh Wilk and staff at the American Psychiatric Association, for providing practice pattern data; Marlene Wicherski and Drs. Jessica Kohout and Lynn Bufka at the American Psychological Association, for providing membership and practice pattern data; Becky Corbett, Charles Housen, and Dr. Tracy Whitaker at the National Association of Social Workers, for providing membership counts and advice; Dr. Paul Wing at the University at Albany Center for Health Workforce Studies, for consultation; David Bergman at the American Association of Marriage and Family Therapists, for providing membership and licensure counts as well as other useful data and referrals; Dr. Nancy Hanrahan at the University of Pennsylvania School of Nursing, for providing certification counts and practice pattern data; Jim Fitch, Scott Barstow, and Emily Wisniewski at the American Counseling Association, for providing licensure counts and advice; Dr. Mark Holmes, Dr. Tom Ricketts, Jennifer Groves, and Randy Randolph of the Cecil G. Sheps Center for Health Services Research for consultation; Drs. Olivia Silber Ashley, Bob Bray, and J. Valley Rachal of Research Triangle Institute, for advice about data sources; Tina McRee at the University of California at San Francisco Center for the Health Professions, for sharing advice and data on the California mental health workforce; Dr. Harold Goldsmith, for consultation; Dr. Barbara Van Horne at the Association of State and Provincial Psychology Boards, for consultation; Drs. Edward Norton and Gary Koch of the University of North Carolina School of Public Health, for consultation; Robert McConville of the Cecil G. Sheps Center for Health Services Research, for diligently searching for information on mental health planning and workforce data; Dr. Sarah Curtis of the University of Durham (England), for consultation; Bruce Peterson at the Oak Ridge National Laboratories Center for Transportation Analysis, for advice about the use of their intercounty distance matrix; Susan Shafer at the National Board for Certified Counselors, for consultation; Susanne Phillips at the University of California, Irvine, for consultation; and Drs. Linda Beeber, Victoria Soltis-Jarrett, and Cheryl Jones at the University of North Carolina School of Nursing, for consultation.

ii
Contents Page Acknowledgements .................................................................................................... i Contents ..................................................................................................................... ii List of Tables and Figures ....................................................................................... iii Executive Summary .................................................................................................. iv Overview .................................................................................................................... 1 1. What is a mental health professional shortage area (MHPSA) and how are areas designated? ........................................................................................ 1 2. Limitations of the current MHPSA designation method.................................... 2 3. Rationale for a new MHPSA method ................................................................... 4 4. Challenges measuring need and supply in the area of mental health ............. 4
4.1 Measuring need for mental health services .................................................... 4 4.2 Measuring supply of mental health services ................................................... 5 4.3 Choosing a geographic unit for designation .................................................... 5
5. The new MHPSA method ..................................................................................... 6 5.1 Schematic overview ........................................................................................ 6 5.2 Making designations at the county level ......................................................... 6 5.3 Measuring SMI prevalence ............................................................................. 7 5.4 Need for mental health professionals ............................................................ 10 5.5 Supply of mental health professionals .......................................................... 15 5.6 Geographic smoothing and MHPSA scoring ................................................. 19 5.7 Shortage scores ............................................................................................ 21
6. Impact assessment and sensitivity analyses ................................................... 26 6.1 Impact assessment ....................................................................................... 26 6.2 Sensitivity analyses ....................................................................................... 28
7. Caveats ................................................................................................................ 29 7.1 Appropriateness of data and methods used to estimate prevalence of SMI ................................................................................................................ 29 7.2 Mental health service use as a measure of need .......................................... 31 7.3 The role of primary care providers in meeting mental health needs ............. 31 7.4 The supply of mental health professionals .................................................... 31 7.5 The impact of travel on local mental health need and workforce supply ............................................................................................................ 32 7.6 The logic underlying the shortage score ....................................................... 32 7.7 What the shortage scores do not measure ................................................... 33
8. Summary and Recommendations ..................................................................... 33 8.1 Summary ....................................................................................................... 33 8.2 Recommendation for a Designation Threshold ............................................. 33 8.3 Next Steps..................................................................................................... 35
9. References ........................................................................................................... 37

iii
List of Tables and Figures Page Tables Table 1. Population-to-provider ratio thresholds for MHPSA designation ........ 2 Table 2. Estimates of the prevalence of SMI by source ...................................... 9 Table 3. Two-stage logit model predicting serious mental illness ................... 11 Table 4. Estimated SMI prevalence at the state and county levels .................. 10 Table 5. Time spent with mental health providers by serious mental illness (SMI) status, data source, and provider category................................ 13 Table 6. Percent time in direct patient contact and data source by provider type .......................................................................................................... 14 Table 7. Characteristics of supply data by provider type ................................. 17 Table 8. Mean hours worked per week by provider type ................................... 18 Table 9. County-level summary of FTE estimates for mental health providers (N=3,140) ............................................................................... 19 Table 10. State-level summary of FTE estimates for mental health providers (N=51) .................................................................................... 19 Table 11. Counties with unmet need by provider category................................. 21 Table 12. Impact of the new MHPSA method on designation ............................. 26 Table 13. Results of logistic regression models predicting loss and gain of designation .............................................................................................. 27 Table 14. Psychiatrists and other mental health professional FTEs per 100,000 population: A comparison of provider-to-population ratios from multiple sources ............................................................................ 36 Figures Figure 1. Counties currently designated as geographic shortage areas ............ 3 Figure 2. Schematic representation of the new mental health professional shortage area designation method ......................................................... 6 Figure 3. Distance decay functions for weighting supply and need of nearby counties ...................................................................................... 20 Figure 4. Quartiles of % non-prescriber need unmet among counties with non-prescriber shortage ........................................................................ 22 Figure 5. Quartiles of prescriber need unmet among counties with prescriber shortage ................................................................................ 23 Figure 6. Quartiles of % overall need unmet among counties with overall
shortage ................................................................................................... 24 Figure 7. Quartiles of % overall need unmet among counties in the top quartile of overall shortage .................................................................... 25 Figure 8. Effects of varying travel time radius ..................................................... 30

iv
Executive Summary Mental health professional shortage area designation
The Health Resources and Services Administration (HRSA) Bureau of Health Professions has contracted with the Cecil G. Sheps Center for Health Services Research, University of North Carolina at Chapel Hill, to develop a new method for designating mental health professional shortage areas (MHPSAs) in the United States. HRSA uses professional shortage area designations to target resources to areas with high healthcare needs. For mental health, shortage designations are used to target National Health Service Corps placements, J-1 visa placements for foreign-trained physicians, and the 10% Medicare incentive for psychiatrists. The two-year contract for this project does not provide resources to conduct primary data collection; we were directed to use the best available data on mental health needs and workforce availability in developing a new method to identify under-served areas. Furthermore, the new method is limited to adults (ages 18 and over) and to six professional groups identified by HRSA, and excludes substance use disorders.
This report describes the current method used for designating MHPSAs and presents a rationale for developing a new method along with the challenges particular to mental health services that are faced in making such designations. The report profiles national county-level need for mental health services, provides counts of the mental health professional workforce, locates workforce shortages, and assesses the impact of the new method, both in terms of the overall distribution of shortage designations across the country and in terms of county-level designation changes. Recommendations for future methodological refinements are highlighted.
Findings: Mental health professional shortages across the U.S.
Findings indicate that nearly one in five counties (17.5%) in the U.S. has unmet need for non-prescribers and nearly every county (96.2%) has unmet need for prescribers and therefore some level of unmet need overall. The new method identifies 53% more counties with unmet need than are currently designated using the current method (96.2% compared to 62.8% of all U.S. counties). When using a designation threshold that maintains at 62.8% the proportion of counties with geographic designations, the new method is more likely than the current method to designate rural counties; frontier counties; and those that have lower population density, lower per capita income, more people over 65, and fewer people in the 18-24 age range; counties outside the Northeast; and those that do not currently have facility designations. We recommend that HRSA continue to allow an application process so that a state or county can document shortage using superior local data that meet HRSA's chosen designation threshold. Next steps
The new method provides a sound basis for mental health professional area shortage designation. The report discusses several avenues for further refinement and expansion that could be considered in the future: refinements that enhance the ease of use by states and counties, analyses that could facilitate periodic updates of shortage scores, and expansions of scope. The recommendations include the creation of a web-based calculator for shortage designation; the development of a toolkit for local needs assessment; the comparison of results with state and local assessments, the development of a method for frequent updates of prevalence estimates using social indicators; and the expansion of the method to include children and additional groups of adults, non-physician prescribers, additional mental health professional groups, and the need for and supply of substance abuse treatment.

v
Methods This project compiled county-level information on mental health service needs and workforce
supply based upon available epidemiological data in order to develop a meaningful formula for linking and weighting these data to identify under-served areas.
Estimating the need for mental health services in small geographic areas for the entire U.S. is challenging because (1) national surveys are not designed to generate small area estimates, and (2) no national utilization survey contains adequate samples of both individuals with and without serious mental illness (SMI). To address these limitations, estimates from different surveys were combined. First, the National Comorbidity Survey Replication (NCSR) was used to estimate a logistic model that predicts serious mental illness (SMI) status from demographic characteristics. This was applied to Census data to estimate the prevalence of SMI by county (n=3,141 counties) yielding a county mean prevalence of 4.0%. Utilization rates for prescribers and non-prescribers from individuals with SMI in the NCSR (n=377 with SMI) who used some mental health service were imputed to the population with SMI by county. Use rates were drawn from users only under the assumption that some service use is appropriate for all individuals with SMI. This process was repeated for those without SMI in the Medical Expenditure Panel Survey (MEPS, n=16,418). Utilization rates for prescribers and non-prescribers from individuals without SMI in the MEPS were imputed to the population without SMI by county. Here, use rates were drawn from the entire sample of individuals without SMI since it is reasonable that some portion of this group would not use services. These imputations yielded county-level estimates of need for each type of mental health provider. Both of these surveys provide detailed information on use of multiple types of mental health providers. Utilization was recorded in terms of visit minutes which were translated into provider full time equivalents. Need estimates were deflated to adjust for that portion of need met by primary care providers, based on newly proposed primary care health professional shortage area scores.
Supply data currently available at the small area level are limited. Drawing from professional
associations, state licensure boards, and national certification boards, the project compiled county-level supply data on clinical psychiatrists, psychologists, social workers, advanced practice psychiatric nurses, marriage and family therapists, and professional counselors. Workforce counts were cleaned and summed to identify full time equivalent counts of prescribers (counted as psychiatrists) and non-prescribers (all others) by county. These counts of prescribers and non-prescribers were used to represent the volume of met need by county.
In order to account for travel between counties, a smoothing technique was used to adjust each county's workforce supply and need estimates by those of surrounding counties. Supply and need for each county was estimated as the weighted average of supply and need for the central county and surrounding counties, with surrounding county counts weighted by an inverse distance function.
Each county-level shortage was calculated as the difference between the workforce need
and supply estimates. The shortage score represents unmet need as a proportion of total need in a county. Three scores were calculated: for prescribers, non-prescribers and all mental health providers.

1
Overview The Health Resources and Services Administration (HRSA) Bureau of Health Professions
(BHPr) has contracted with the Cecil G. Sheps Center for Health Services Research, University of North Carolina at Chapel Hill, to develop a new method for designating mental health professional shortage areas (MHPSAs) in the United States. In the past, the Sheps Center also developed new methods for designating primary care and dental shortage areas (Ricketts, Goldsmith, Holmes, et al, 2007; Ricketts, 2005). HRSA uses professional shortage area designations to target resources to areas with high healthcare needs. For mental health, shortage designations are used to target National Health Service Corps placements, J-1 visa placements for foreign-trained physicians, and the 10% Medicare incentive for psychiatrists. The two-year contract for this project does not provide resources to conduct primary data collection; we were directed to use the best available data on mental health needs and workforce availability in developing a new method to identify under-served areas. Furthermore, the new method is limited to adults (ages 18 and over) and to six professional groups identified by HRSA, and excludes substance use disorders.
This report explains what professional shortage areas are and how HRSA uses these
designations. It describes the current method used for designating MHPSAs and its limitations. We present a rationale for developing a new method for designating MHPSAs along with the challenges particular to mental health services that are faced in making such designations. We describe the methods used to develop county-level estimates of need for mental health services and workforce supply and how these estimates were incorporated into a new MHPSA score. The report describes the impact of the new method, both in terms of the overall distribution of shortage designations across the country and in terms of county-level designation changes. The report concludes by acknowledging the limitations of the new approach and suggesting recommendations for future refinements.
1. What is a mental health professional shortage area (MHPSA) and how are areas designated?
Mental health professional shortage area designations identify areas that do not have an adequate supply of mental health professionals to meet the needs of their populations. The current MHPSA method designates shortages based on geographic areas (currently 35 percent of designations), population groups (3 percent of designations), and facilities (62 percent of designations) as follows:
• A geographic area is designated when its population-to-provider ratio exceeds given
thresholds (Table 1). Five types of mental health providers are included: psychiatrists, psychologists, social workers, advanced practice psychiatric nurses, and marriage and family therapists. HRSA uses the term 'core' providers to refer to these professional groups. When an area can document high needs, the thresholds are lower. High needs are determined by the prevalence of poverty, youth, old age, and substance abuse.
• A population group designation is obtained when barriers are documented that limit a
group’s access to the area’s supply of mental health providers and when population-to-provider ratios for that group exceed the high-need thresholds.
• A facility designation is obtained when a community mental health center or other public
or nonprofit private mental health facility, state or county mental hospital, or federal or state correctional institution documents insufficient capacity to meet the needs of its clientele based on its client-to-provider ratios. In addition, automatic Facility HPSAs,
2
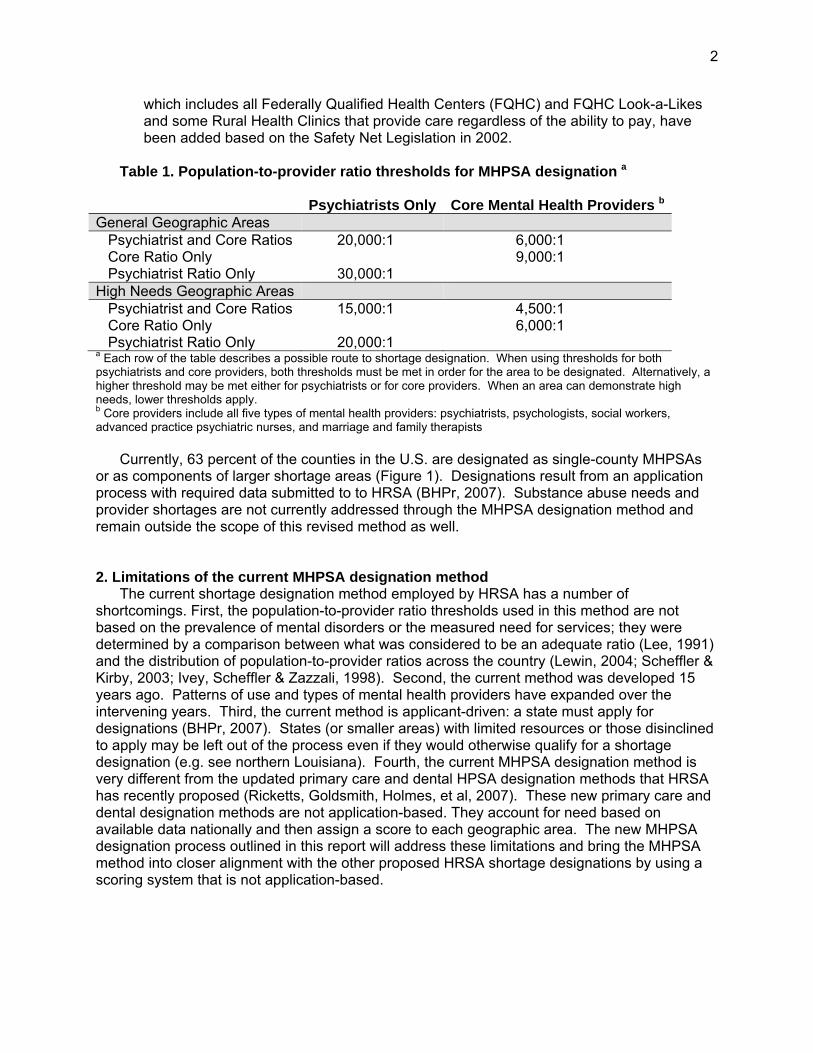
which includes all Federally Qualified Health Centers (FQHC) and FQHC Look-a-Likes and some Rural Health Clinics that provide care regardless of the ability to pay, have been added based on the Safety Net Legislation in 2002.
Table 1. Population-to-provider ratio thresholds for MHPSA designation a
Psychiatrists Only Core Mental Health Providers bGeneral Geographic Areas Psychiatrist and Core Ratios 20,000:1 6,000:1 Core Ratio Only 9,000:1 Psychiatrist Ratio Only 30,000:1 High Needs Geographic Areas Psychiatrist and Core Ratios 15,000:1 4,500:1 Core Ratio Only 6,000:1 Psychiatrist Ratio Only 20,000:1 a Each row of the table describes a possible route to shortage designation. When using thresholds for both psychiatrists and core providers, both thresholds must be met in order for the area to be designated. Alternatively, a higher threshold may be met either for psychiatrists or for core providers. When an area can demonstrate high needs, lower thresholds apply. b Core providers include all five types of mental health providers: psychiatrists, psychologists, social workers, advanced practice psychiatric nurses, and marriage and family therapists
Currently, 63 percent of the counties in the U.S. are designated as single-county MHPSAs or as components of larger shortage areas (Figure 1). Designations result from an application process with required data submitted to to HRSA (BHPr, 2007). Substance abuse needs and provider shortages are not currently addressed through the MHPSA designation method and remain outside the scope of this revised method as well. 2. Limitations of the current MHPSA designation method
The current shortage designation method employed by HRSA has a number of shortcomings. First, the population-to-provider ratio thresholds used in this method are not based on the prevalence of mental disorders or the measured need for services; they were determined by a comparison between what was considered to be an adequate ratio (Lee, 1991) and the distribution of population-to-provider ratios across the country (Lewin, 2004; Scheffler & Kirby, 2003; Ivey, Scheffler & Zazzali, 1998). Second, the current method was developed 15 years ago. Patterns of use and types of mental health providers have expanded over the intervening years. Third, the current method is applicant-driven: a state must apply for designations (BHPr, 2007). States (or smaller areas) with limited resources or those disinclined to apply may be left out of the process even if they would otherwise qualify for a shortage designation (e.g. see northern Louisiana). Fourth, the current MHPSA designation method is very different from the updated primary care and dental HPSA designation methods that HRSA has recently proposed (Ricketts, Goldsmith, Holmes, et al, 2007). These new primary care and dental designation methods are not application-based. They account for need based on available data nationally and then assign a score to each geographic area. The new MHPSA designation process outlined in this report will address these limitations and bring the MHPSA method into closer alignment with the other proposed HRSA shortage designations by using a scoring system that is not application-based.

3
Figure 1. Counties currently designated as geographic shortage areas

4
3. Rationale for a new MHPSA method The new MHPSA designation method has been developed to accomplish the following three
goals: 1. To reflect current mental health needs and workforce supply, 2. To yield a continuous score for each county, and 3. To make the MHPSA scoring process more consistent with those proposed for primary
and dental care
The new method will measure mental health need more directly than does the current method. It reflects current patterns of mental health service use for all populations and current estimates of the prevalence of serious mental illness (SMI). It also broadens the workforce scope to include licensed professional counselors. The new method will assign a shortage score to each county. It also allows for an application process to correct any mis-designation by the new method. Any shortage not designated centrally under the new method may be documented by the county or state using locally available data, and a shortage designation can be requested through an application to HRSA. These changes bring the new MHPSA designation scores in line with the proposed new primary care and dental scoring processes, reflecting each county's need for and supply of mental health services. 4. Challenges measuring need and supply in the area of mental health
There is a special set of considerations involved in measuring mental health needs and workforce supply that must be addressed in any new method.
4.1 Measuring need for mental health services Shortage designation methodologies for primary care, dental, and mental health start with
the measurement of need. Four issues make the measurement of need uniquely challenging in the area of mental health. First, not everyone needs mental health services, and there is great variation in level of need among those who do (Mechanic, 2003; Ciarlo & Tweed, 1992; Shapiro, Skinner, Kramer et al., 1985). People with diagnosed mental disorders are more likely to need mental health services than do those without (Shapiro, Skinner, Kramer et al., 1985). Second, the prevalence of mental disorders varies across population sub-groups defined by age, race, gender, education, marital status, and income (Kessler, Berglund, Demler et al., 2005; Breslau, Aguilar-Gaxiola, Kendler et al., 2005; Goldsmith, Holzer & Manderscheid, 1998; Muntaner, Eaton, Kiala et al., 1998). Third, some of the need for mental health services is met not by mental health professionals, but by primary care physicians who see about 50 percent of those with mental health needs and provide about 21 percent of all mental health visits (Regier, Shapiro, Kessler et al., 1984). Fourth, among people with and without SMI, there is a mismatch between the level of need and the amount of services received. Although 4-6 percent of the population has SMI (depending on definitions), only about half of those who receive mental health care have SMI, and half (54 percent) of those with SMI never receive care within the reference period (Kessler, Demler, Frank, et al., 2005; Wang, Berglund & Kessler, 2001; Katz, Kessler, Frank, Leaf & Lin, 1997). On the one hand, individuals with serious mental illness tend to lack insight about their need for services (Kessler, Berglund, Bruce et al., 2001). On the other, reductions in stigma among the well-off have turned mental health services into something of a consumer good (Katz, Kessler, Frank, Leaf & Lin, 1997; Sturm, Ingel & Anderyeva, 2003; Zuvekas, 2001). These considerations are particularly relevant in measuring the need for mental health services and in targeting mental health services, and make normative 'utilization-based' estimates of need challenging.

5
The new method for MHPSA designation addresses these issues by defining SMI based on diagnosis and impairment, generating county-level estimates of SMI prevalence, estimating the need for mental health services among people with SMI (based on average utilization among those who actually receive services) and without SMI (based on average utilization overall), and adjusting (based on the primary care HPSA score) for the amount of need that is likely to be met by primary care physicians. Each of these procedures is described in detail below.
4.2 Measuring supply of mental health services Similarly, measuring the supply of mental health services is uniquely challenging. The new
method follows HRSA’s current definition of the professional mental health workforce, which includes six different types of providers: psychiatrists, psychologists, social workers, advanced practice psychiatric nurses, licensed professional counselors, and marriage and family therapists. (It may be appropriate to expand this definition; Section 7.4 discusses some mental health provider groups that are not included.) For all but psychiatrists, there is a lack of valid and reliable national county-level data. For the new method, data from national certification, state licensure, and national professional association membership records had to be compiled, cleaned, and adjusted to match state-level counts in order to develop a national county-level profile of the mental health professional workforce.
We recognize that each profession brings a unique philosophy and focus to the care and
treatment of mental illness. Local treatment modalities—Assertive Community Treatment (ACT), for example (Phillips, Burns, Edgar et al., 2001)—can capitalize on the strengths of each profession in order to provide individualized multidisciplinary treatment. On a national scale, practice patterns and workforce data are too fluid to allow the precise matching of roles with actors in each county. It is clear, however, that prescribers (those who have the authority to prescribe medications) and non-prescribers (those who do not have the authority to prescribe medications) are not functionally substitutable, so the new method was developed to distinguish these categories. This implies that need for a non-prescriber may be filled by any type of non-prescriber. (In the overall shortage score, prescribers and non-prescribers have equal weight, to reflect that each group plays an equally critical role in treatment.) For prescribers, the currently available data include only psychiatrists. However, the generic term is used in order to highlight the fact that better national workforce data would allow the inclusion of psychologists (in two states) and advanced practice psychiatric nurses (in all states, and independently in 14 states) as prescribers. Psychologists, social workers, advanced practice psychiatric nurses, licensed professional counselors, and marriage and family therapists are counted as non-prescribers here.
4.3 Choosing a geographic unit for designation Our goals for a choice of geographic unit for designation were that the geographic unit be
feasible and meaningful. A county-level indicator met both of these goals. First, the county is the smallest geographic unit for which the full array of workforce data is available. Second, the county was chosen as a meaningful local government entity. Although there is substantial variation in mental health services planning across the U.S. and local government authority for mental health planning has eroded since federal funding was block granted in 1980, counties often hold responsibility for mental health service planning, particularly in the West (Center for Mental Health Services, 2004; U.S. Department of Health and Human Services, 1999). Where states are not organized into counties (e.g., the parishes of Louisiana or the boroughs of Alaska), Federal Information Processing Standards (FIPS) codes identify equivalent entities so that these codes can be used across multiple national datasets (National Institute of Standards and Technology, 2002). In the case of one new county Broomfield, Colorado, the limited data available for the county was assigned to the surrounding counties in proportion to their

6
populations, because key data sources necessary for shortage estimation predated the forming of the new county.
The new method also addresses the fact that mental health clients or providers may travel
long distances to the services they receive or provide (e.g. Fortney, Owen & Clothier, 1999; Fortney, Rost, Zhang et al., 1999; Marcus, Fortney, Olfson et al., 1997; Marcus, Olfson, Fortney et al. 1997). Each county’s need and supply estimates are adjusted for the need and supply in nearby counties by taking into account typical commute times. 5. The new MHPSA method
5.1 Schematic overview The new MHPSA scores are developed in three basic steps (Figure 2). First, county-level
estimates of need for mental health services by individuals with and without SMI are generated and summed to estimate total county need for mental health services. Second, county-level estimates of workforce supply are generated, compiled into the supply of prescribers and non-prescribers, and summed to estimate total county supply. Third, the scores are calculated by expressing unmet need as a proportion of total county need. Three scores are generated for each county: a prescriber score, a non-prescriber score, and a total mental health professional shortage score. Figure 2. Schematic representation of the new mental health professional shortage area
designation method
5.2 Making designations at the county level The new method uses the county as the primary geographical unit for shortage designation.
This is consistent with the current method in that many counties are currently designated as shortage areas or as components of larger shortage areas. It is also consistent with the fact that local public service planning and delivery often conform to county boundaries. However, this choice of geographical unit raises some issues that need to be addressed: (1) travel across county boundaries for mental health services, (2) the possible need for smaller units in metropolitan or large counties, and (3) the possible need for larger units that aggregate adjacent counties with small populations.
SMI Need Non-SMI Need Prescribers Non-Prescribers
Total Need Total Supply
Scores:Prescriber
NonprescriberTotal
SMI Need Non-SMI Need Prescribers Non-Prescribers
Total Need Total Supply
Scores:Prescriber
NonprescriberTotal

7
According to 2000 Census data, the median county land area is 616 square miles, corresponding to an approximate radius of 14 miles. The tenth and ninetieth percentiles are 288 and 1847 square miles, corresponding to approximate radii of 10 and 24 miles respectively. The approximate radius of a county that is between the tenth and ninetieth percentiles in land area is well within the typical travel radius for mental health services, suggesting that boundary crossing for mental health services is likely. For this reason, the new method uses a geographic smoothing method to take into account the need and supply in nearby counties. This method is described in detail in a later section of this report.
In metropolitan or large, densely-populated counties it may be necessary to use smaller
geographical units for shortage designation. For example, residents of a particular small area may be underserved by the mental health workforce of the larger metropolitan area that contains it. Although it might be possible to make reasonably accurate estimates of need at the level of a sub-county unit such as the ZIP Code Tabulation Area, designation of such small areas would be impractical for a number of reasons: (1) a large amount of boundary crossing can be expected to occur between such small areas, making it difficult to associate supply and need with the appropriate geographical areas; (2) ZIP codes do not define coherent residential, work, or service areas, making locally defined geographical units more appropriate than centrally defined areas; (3) ZIP codes are subject to frequent change; (4) central designation would be complicated by the need to treat metropolitan and non-metropolitan regions differently; (5) it is unclear how boundary crossing between metro and non-metro regions would need to be addressed; and (6) although workforce counts for most professions were obtained at the level of the ZIP code, they are probably much more accurate on the county level than on the ZIP code level because in many cases the provider’s address corresponds to a home address rather than a practice location.
On the other hand, counties with small populations may not be able to support enough
mental health providers to meet their needs. In such cases it may be necessary to designate shortage areas that combine multiple counties. Although the 1963 Community Mental Health Centers Act led to the definition of mental health catchment areas for planning and service delivery, these catchment areas do not reflect the current organization and delivery of either public or private mental health providers and are no longer used in the majority of states. Therefore, as with the sub-county units discussed in the previous paragraph, these multiple-county areas could most appropriately be defined by state personnel familiar with the region’s mental health service system rather than by a single algorithm that is applied uniformly across the country.
In the sections that follow, the county is used as the geographical unit for the estimation of
prevalence, need, and supply and for the assignment of MHPSA scores and designations. We propose that states be allowed to request the designation of sub-county or multiple-county areas through an application process.
5.3 Measuring SMI prevalence Prevalence estimation was conducted in collaboration with Dr. Charles Holzer, III, at the
University of Texas Medical Branch in Galveston, Texas (e.g. Diamond, Wang, Holzer, et al.. 2001; Swanson, Holzer, Ganju, et al., 1990; Myers, Weissman, Tischler, Holzer, et al., 1984). Dr. Holzer contributed significantly to the operational definition of serious mental illness and generated county-level prevalence estimates by applying the predicted probabilities from demographic models to cross-tabulations of Census population estimates, as described below.

8
The county-level prevalence of individuals with SMI was estimated with data from the National Comorbidity Survey Replication (Kessler, Berglund, Chiu, et al., 2004) by using demographic variables to predict SMI status and then applying the predicted probabilities to Census population estimates (U.S. Census Bureau, 2003) using synthetic estimation procedures (Heady, Clarke, Brown, 2003; Holzer, Jackson & Tweed, 1981). The NCSR is a nationally representative survey (N=9,282) with in-depth information on individuals with mental disorders. It contains detailed information about diagnoses and limitations due to mental disorders as well as resulting mental health service utilization. It provides the most recent national data on the distribution of psychiatric disorders in the general population (Kessler, Berglund, Chiu et al., 2004).
Although the NCSR uses the Composite International Diagnostic Interview (CIDI) to
diagnose mental disorders, psychiatric diagnosis is difficult, and using survey variables to operationalize a definition of SMI remains a complex task.
SMI status depends on diagnosis (or symptom severity), functional impairment, and duration
but there is no commonly accepted algorithm to operationalize this definition (U.S. Department of Health and Human Services, 1999). To be classified as having SMI here, a respondent had to meet criteria for one of the following diagnoses: bipolar I, bipolar II, mania, major depressive disorder, agoraphobia, generalized anxiety disorder, hypomania, major depressive disorder, panic disorder, post-traumatic stress disorder, social phobia, and specific phobia. In addition, we required a high level of disability: either the inability to carry out normal activities due to mental health problems for at least 120 days in the past year, or a mean self-rated impairment level of 7 on a 10-point scale across four dimensions: home, work, relationships, and social life. Finally, in order to include only those whose disorders had lasted at least 12 months, we required that the age of onset be at least two years less than the respondent’s age. Using criteria that require significant functional impairment allowed us to include a broad list of diagnoses.
A number of diagnoses were not included because they are less severe: adult separation
anxiety disorder, attention deficit disorder, bipolar sub-threshold, conduct disorder, dysthymia, intermittent explosive disorder, oppositional defiant disorder, panic attack, and separation anxiety disorder. Substance use disorders were excluded because of the difficulty of measuring the substance abuse treatment workforce. Also, we were unable to incorporate psychotic disorders into the inclusion criteria because the NCSR did not include full criteria to diagnose psychotic disorders, its psychosis screening questions are subject to false positives, and the section did not include questions about functional impairment. In fact, Kessler and colleagues did not make the NCSR non-affective psychosis variable publicly available because it was “not sufficiently robust to be used in analysis” (Harvard School of Medicine, 2005). However, among NCSR respondents identified as reporting possible psychotic symptoms, the weighted prevalence of SMI according to our criteria was 12%, compared to 3.6% among respondents not reporting such symptoms. This provides a level of confidence that individuals with actual psychotic disorders with functional impairment are being identified by the SMI status variable as having SMI.
This definition yields a national SMI prevalence estimate of 3.9 percent, which is in line with
national estimates derived from other sources (Table 2). Prevalence estimates drop as the definition of mental illness narrows and as recall intervals are reduced. Estimates derived from the 1990 National Comorbidity Survey (NCS) and the NCSR that are based on the broadest definition, “any mental disorder,” range from 24 to 32 percent. The National Survey on Drug Use and Health (NSDUH) and the Behavioral Risk Factor Surveillance System (BRFSS) yielded

9
prevalence estimates of 9% and 11.3% for “frequent” and “serious” distress respectively. Based on the National Health Interview Survey (NHIS), the prevalence of “serious distress in the past 30 days” is estimated at 2.9 percent.
Table 2. Estimates of the prevalence of SMI by source
Data Source Definition of Mental Illness Recall period National Prevalence Estimate Source
2001 NCSR any mental disorder 12 months 32.4% (SE: 1.1) a 1990 NCS any mental disorder 12 months 24.3% b 2003 NSDUH serious distress (measured with the K6) 12 months 11.3% c 1993 BRFSS frequent distress (14 days out of 30) 30 days 9.0% (95% CI: 8.9, 9.1) d 1990 NCS serious mental illness 12 months 6.2% a 2001 NCSR serious mental illness 12 months 5.7% e 1990 NCS serious mental illness 12 months 5.4% f 2001 NCSR serious mental illness (current study) 12 months 3.9% g 2006 NHIS serious distress (measured with the K6) 30 days 2.9% (95% CI: 2.6, 3.3) h
a Kessler et al., 2007 b Kessler et al., 2001 c Substance Abuse and Mental Health Services Administration, 2006a d Zahran et al., 2005 e Kessler et al., 2005 f Kessler et al, 1996 g Current study. This estimate does not directly take into account substance use orders or psychosis,
and includes only those individuals with substantial functional impairment. h Pleis & Lethbridge-Çejku, 2006
Our SMI prevalence estimate is lower than most published estimates (Kessler, Berglund,
Demler, et al., 2007; Kessler et al., 2001; Substance Abuse and Mental Health Services Administration, 2006a; Zahran, Kobau, Moriarty et al., 2005; Kessler, Berglund, Demler, et al., 2005; Kessler, Berglund, Zhao, et al., 1996; Pleis & Lethbridge-Çejku, 2006). In particular, it is lower than the NCS- and NCSR-based estimates of SMI prevalence published by Kessler and colleagues. The algorithms used to generate those estimates are not publicly available. However, based on published verbal descriptions, this difference in SMI prevalence estimates is consistent with three apparent differences in the criteria used: (1) because HRSA required us either to include substance use in both supply and need estimates or to exclude it from both, and because data on the substance abuse treatment workforce are limited, we ignored substance abuse disorders in identifying individuals with SMI; (2) for reasons cited above, we did not deem it appropriate to include psychosis screen information in the SMI criteria; and (3) among people with major mental disorders, we focused on those with significant functional impairment in order to estimate need among that group. We have attempted to identify a group of people who have both serious disorders and a level of functional impairment that necessitates significant service use.
County-level estimates of SMI prevalence were generated by using the NCSR to model the
probability of SMI status in relation to demographic predictors, and then applying the predicted probabilities to county sub-populations based on demographic data from the U.S. Census (U.S. Census Bureau, 2003). A two-stage logit model was used to generate the predicted probabilities, because (1) poverty level is an important predictor of SMI status; (2) in the NCSR data, poverty level is available only for respondents to the second segment (“Part II”) of the survey instrument, 61% of all respondents; and (3) Part II participation is strongly associated with SMI status (e.g., among NCSR respondents with SMI, 99% responded to Part II). In order

10
to maximize use of the available information, the probability of Part II participation was predicted as a function of age, sex, race, marital status, and educational level. Then, given Part II participation, the probability of SMI status was predicted as a function of poverty level along with the other demographic predictors. The predicted probabilities from the two models were combined to yield overall predicted probabilities of SMI status (based on all six predictors) that were not conditional on Part II participation. The set of predictors was limited to demographic variables in order to avoid reinforcing any disparities related to other predictors (e.g., region). Interaction terms were not included in the logit models in order to yield a conservative representation of the variation in prevalence and to avoid problems that would have been caused by small cell sizes for many combinations of predictor values. Table 3 presents the results of the two models.
The predicted probabilities from the two-stage demographic logit model were applied to the 5 percent Public Use Microdata Sample (PUMS) Files of the 2000 Census (U.S. Census Bureau, 2003) to generate estimates of SMI prevalence for all of the county sub-populations defined by the possible combinations of demographic predictors. Estimates were updated to match the July 2006 population estimates for each combination of age, sex, and race (U.S. Census Bureau, 2007). The updated estimates were aggregated to yield county-level estimates of SMI prevalence. These estimates reflect important variation in SMI prevalence across states and counties (Table 4). Table 4. Estimated SMI prevalence at the state and county levels Level Number Minimum Maximum Mean S.D.State 51 3.2% 4.5% 3.8% 0.3 County 3,140 2.5% 9.0% 4.0% 0.5
Because these prevalence rates were estimated from NCSR sample data rather than being measured for the entire household population, they are subject to sampling error. In order to estimate the effect of sampling variation on the prevalence estimates, Dr. Holzer randomly selected 88 half-samples from the NCSR data and generated prevalence estimates from each of the half-samples. We examined the variation in these half-sample prevalence estimates. One indicator of the amount of variation is the width of the 95% confidence interval around the prevalence estimate for each county or state. (Technically, for each area, the confidence interval that we constructed surrounds the prevalence estimate based on the mean log odds of having SMI across the 88 half-samples.) At the state level the width of the 95% confidence interval ranges from 0.6 to 1.8 with a mean and median of 0.9. At the county level it ranges from 0.5 to 4.2 with a mean and median of 1.2.
5.4 Need for mental health professionals Need for mental health professionals was estimated separately for individuals with and
without SMI, based on the mental health service utilization of each group. Because the NCSR is the most appropriate data source for people with SMI and the Medical Expenditure Panel Survey (MEPS) is the most appropriate data source for people without SMI (see descriptions below), both datasets were used. Both provide detailed information on service use and types of mental health providers.
Need for mental health services among people with SMI was estimated using NSCR data on
outpatient services, along with the definition of SMI given above. The NCSR contains data from a large sample of individuals with SMI (n=377). Under the assumption that every individual with SMI should be receiving outpatient mental health services at some time over the course of a

11
Table 3. Two-stage logit model predicting serious mental illness
Effect
Model 1 a (Weighted N=9,282)
Model 2 b (Weighted N=5,495)
df Wald Chi-square OR (95% CI) df
Wald Chi-square OR (95% CI)
Test of global null hypothesis (Beta=0)
14 428.11 **** 17 446.43 ****
Age (reference 65+) 6 105.07 **** 6 85.08 **** 18-20 2.28 (1.74,2.99) 2.13 (1.11,4.08) * 21-24 2.37 (1.83,3.09) * 3.86 (2.27,6.57) 25-34 2.28 (1.93,2.71) * 5.52 (3.02,10.10) * 35-44 2.04 (1.71,2.42) 6.58 (3.78,11.43) * 45-54 2.64 (2.10,3.31) * 5.75 (3.42,9.67) * 55-64 1.71 (1.42,2.07) * 3.67 (1.90,7.09) Female (reference Male) 1 29.95 **** 1.34 (1.21,1.49) * 1 6.03 * 1.47 (1.08,2.00) *Race/ethnicity (reference White) 3 22.34 **** 3 12.64 ** Hispanic 0.82 (0.68,0.98) 0.58 (0.40,0.83) * Black 0.75 (0.64,0.87) 0.78 (0.55,1.11) Other 0.73 (0.60,0.89) 1.32 (0.81,2.14) *Marital status (reference Never married)
2 5.38 2 21.21 ****
Married/cohabiting 0.98 (0.86,1.11) 0.67 (0.51,0.89) * Separated/widowed/divorced 1.10 (0.95,1.28) 1.38 (0.91,2.08) *Education (reference >=16 years) 2 35.71 **** 2 8.96 * 0-11 years 1.44 (1.26,1.64) * 1.94 (1.26,3.01) * 12-15 years 1.16 (1.06,1.28) 1.72 (1.13,2.61) Income as percentage of Federal Poverty Guideline (reference 300+)
3 46.69 ****
0-99 3.16 (2.26,4.42) * 100-199 1.83 (1.22,2.74) 200-299 1.24 (0.86,1.78) *a Model 1 predicts NCSR Part II participation; overall fit is significant according to a likelihood ratio test, p<0.0001. b Model 2 predicts serious mental illness, given NCSR Part II participation; overall fit is significant according to a likelihood ratio test, p<0.0001. * p<.05, ** p<.01, *** p<.001, **** p<.0001

12
year, the estimate of need for mental health services was the mean number of visit hours among service users. Although this method ultimately measures unmet need for mental health professionals, visits to primary care providers for mental health care were included at this stage in order to estimate the full extent of need for mental health services. The role of primary care providers is addressed below, at the end of this step of the method.
Using the provider categories defined in the NCSR instrument, separate estimates were generated for prescribers (psychiatrist, general practitioner, or family doctor) and for non- prescribers (psychologist, social worker, counselor, or other mental health professional such as a psychotherapist or mental health nurse). For each of these two provider categories, Table 5 shows the proportion of respondents who are service users and the mean total hours of visits.
Because the NCSR survey obtained utilization data only from individuals who met diagnostic criteria, the NCSR was not the ideal source for estimating need among people without SMI. Instead, for this population, need was estimated using the 2000 Medical Expenditure Panel Survey (MEPS; Cohen, 1997). The MEPS provides detailed health service utilization data on the non-institutionalized civilian population. It contains enough information on diagnosis and limitations to exclude individuals who appear to have SMI (i.e., those with ICD-9 codes 295-301 or 312 who rated their conditions as “serious” in any data collection round; weighted proportion 2.1% or respondents), yielding a very large sample of those without SMI (n=16,418). The MEPS data contain detailed information on health service use including visits, minutes, and provider type. Based on self-report data, mental health visits were defined as outpatient visits involving a possible mental health provider (physician, nurse, nurse practitioner, psychologist, social worker, or other) and one of the following: psychotherapy, a psychotherapeutic drug, or a diagnosis of a mental disorder. As with the SMI population, primary care providers are included because the goal here is to estimate the total need for mental health services. Because it is not appropriate to assume that every individual without SMI should be receiving outpatient mental health services over the course of a year, the estimate of need for providers was the mean number of visit hours overall (not only among service users). For both prescribers and non-prescribers, Table 5 shows the proportion of respondents who are service users and the mean total hours of visits.
For people without SMI, the proportion seeing a mental health provider in the past year
(9.2% in the MEPS sample and 10.6% in the NCSR sample) may at first glance appear to be an underestimate. For example, published estimates based on the NCSR Part II sample indicate that 17.9% of the population (including people with SMI) received mental health services in the past year (Druss, Wang, Sampson, & Olfson, 2007; Wang, Lane, Olfson, & Pincus, 2005). Additional information may help to put the 10.6% figure into perspective. For example, Wang and colleagues (2005) estimated that only 8.8% of the population saw a mental health specialist in the past year, and that 15.3% saw either a mental health specialist or a general medical practitioner. Our estimates exclude inpatient services as well as nurses (because their specialty cannot be determined), general health care providers other than physicians, hotlines, religious or spiritual advisors, support groups, self-help, and complementary and alternative medical professionals. Given this information, it seems appropriate that our service use estimates for people without SMI fall between the 8.8% and 15.3% figures, and closer to the lower (mental health specialist) estimate.
Visit hours needed for the SMI and non-SMI populations were converted to FTEs of prescribers and non-prescribers using practice pattern data from a variety of sources (Table 6). Prescriber visit minutes were converted to FTEs assuming that they spend 60.4% of their time in direct patient contact. Non-prescriber visit minutes were converted to FTEs using the mean across

13
Table 5. Time spent with mental health providers by serious mental illness (SMI) status, data source, & provider category a
Group (Data source) n
Number (%) seeing mental health provider in past year
Mean (95% CI) hours per year with prescribers
Mean (95% CI) hours per year with non-prescribers
Overall Users Overall Users non-SMI (MEPS) 16,408 1,509 (9.2%) 0.21 (0.18,0.24) 2.27 (1.98,2.55) 0.13 (0.09,0.16) 1.35 (1.02,1.68) non-SMI (NCSR) 8,811 938 (10.6%) 0.16 (0.13,0.19) 1.49 (1.20,1.78) 0.17 (0.11,0.22) 2.30 (1.49,3.12) SMI (NCSR) 356 188 (52.6%) 2.26 (1.74,2.79) 4.38 (3.40,5.37) 4.94 (2.68,7.19) 10.54 (5.46,15.63)
a Shading indicates that the statistics in the cell were not used in need estimation but were used for sensitivity analyses.

14
non-prescribers, assuming that they spend 70.5% of their time in direct patient contact. This was considered appropriate for several reasons: there is not a one-to-one correspondence between the mental health professions and the MEPS and NCSR provider types; there is little variation in direct contact time across provider types; representative practice pattern data were not available for licensed professional counselors or advanced practice psychiatric nurses; and each type of non-prescriber is assumed to be equally useful in meeting an area’s need for non-prescribers.
Table 6. Percent time in direct patient contact and data source by provider type Provider Type
Percent Time in Direct Contact
Data Source
Psychiatrists 60.4% APA National Survey of Psychiatric Practice (2002)
Psychologists 64% CSAT Practitioner Services Network II (2003) a
Social workers 69% NASW Survey of Licensed Social Workers (2006) b
Marriage & family therapists 78.6% CSAT Practitioner Services Network II (2003) a
All non-psychiatrist professions 70.5% a Center for Substance Abuse Treatment, 2003. b Center for Health Workforce Studies & Center for Workforce Studies, 2006.
For people with and without SMI in each county, need for prescribers and non-prescribers was calculated according to the following formulas:
100____%
/000,2min/60__min_
_2005_100
_
_contactclientdirectintime
yrhrhryearperneeded
populationestimatedprevalenceSMI
neededFTE
SMI
SMI×
×⎟⎠⎞
⎜⎝⎛ ×
=
100____%
/000,2min/60__min__2005_
100_100
_ contactclientdirectintimeyrhrhr
yearperneededpopulationestimatedprevalenceSMI
neededFTE
SMInon
SMInon×
×⎟⎠⎞
⎜⎝⎛ ×
−
=
−
−
In the numerator of each equation, the parenthesized term represents the number of people
for whom the estimate is being generated, based on population estimates for 2005 (U.S. Census Bureau, 2006). This is multiplied by the number of provider hours needed per person per year. The product in the numerator is divided by the proportion of prescriber or non-prescriber time spent in direct client contact (which would be the same as multiplying by the number of actual FTEs needed for 2,000 hours per year of direct client contact). For each provider category (prescribers and non-prescribers), the sum of the SMI and non-SMI need estimates was used as a preliminary county-level estimate of total need.
Need for these mental health providers is further adjusted to account for that portion of need that is met by primary care providers. Primary care providers account for about 21 percent of all

15
mental health visits; however, the scope of their mental health practice is constrained by their mental health training and the physical health issues competing for their limited time (Leigh, Stewart & Mallios, 2006; Bhugra & Flick, 2005; McLellan & Meyers, 2004; Simon, 2002; Regier, Shapiro, Kessler et al., 1984; Burns, Scott, Burke et al.,1983). Also, primary care providers tend to see a mix of patients with less severe mental health problems than the problems of clients seen by mental health professionals (Uebelacker, Wang, Berglund et al., 2006; Klinkman, Schwenk & Coyne, 1997). In order to acknowledge the role of primary care providers in addressing mental health need while estimating conservatively the appropriate size of their contribution, the need estimate is reduced by 15 percent in those counties where there is an adequate supply of primary care physicians (i.e., no primary care shortage). This percentage is pro-rated based on the proportion of the county’s primary care need that is met, according to the primary care HPSA score. (Adjustments are made based on the HPSA scores from the newly proposed method, which were generated based on 1998 data. These adjustments can be updated once more recent primary care HPSA data become available.)
5.5 Supply of mental health professionals Several sources of provider supply data were explored. The Bureau of Labor Statistics has
employer-reported data on psychologists, social workers, family therapists, psychiatrists, and psychiatric nurses. These data were not used due to several limitations: (1) counts would have to be disaggregated from state and Metropolitan Statistical Area level; (2) the counts do not distinguish among levels of professional education; (3) they reflect positions rather than professions; and (4) self-employed providers are excluded. The Census and the Area Resource File (BHPr, 2005) contain counts of nurses, psychologists, and social workers. However, these counts are available only from areas with a population of at least 50,000. (Also, they may not distinguish among educational levels or between clinical mental health and other specialties within each profession.) The best available data were licensing counts from state boards, certification counts from national credentialing organizations, and membership counts from professional associations. Once the best available county-level counts were obtained for each profession, they were subjected to data cleaning and validity checks, scaled to match the best available state-level counts, and converted to Full Time Equivalent (FTE) units.
Even the best available counts have their limitations. County-level licensing counts would
probably be the best approximation to the number of clinically active providers in most professions, but licensing data are not standardized or centrally collected and therefore are difficult to obtain or update. Duplicate records exist because some individuals have licenses in multiple professions or states, and de-duplication may not be possible even within a particular state. Furthermore, licensing data may not include information about provider specialties and their release may be inhibited by confidentiality rules or by the lack of resources available to state boards. Certification and professional association membership are not required for clinical practice; therefore, their associated data sources yield undercounts of clinically active providers. This is especially true of membership data, and of certification data in states where licensure is required. All three types of data include inactive practitioners (especially in the case of membership data), although professional licensure usually requires continuing education and periodic license renewal, so licensing data may be less affected by this limitation. Finally, most of the available datasets lack consistent, up-to-date information on practice locations; do not include information about multiple practice locations; and do not even indicate whether the recorded address is a work address.
Despite these limitations, it was possible to generate a reasonable approximation of the
distribution across counties of providers in each mental health profession. For advanced practice psychiatric nurses (APPNs), as well as psychologists and social workers, licensing

16
data were not used because centrally collected county-level licensing counts were not publicly available. For APPNs the best data source identified was a collection of certification data provided in 2003 by the American Nurses Credentialing Center (ANCC). Based on these data, counts at the ZIP code level were generated at the University of Pennsylvania School of Nursing and were converted to county-level counts using a table of approximate ZIP-to-FIPS associations. Membership data were not used for nursing because the American Nurses Association does not record specialty and the American Psychiatric Nurses Association has data only for a subset of psychiatric nurses. For licensed professional counselors (LPCs), the American Counseling Association (ACA) provided licensing information for 38 states; this information was summarized at the ZIP code level and converted to county-level counts. For the other 13 states, certification data from the National Board of Certified Counselors’ website were aggregated to the ZIP code level and converted to county-level counts. Similarly, for marriage and family therapists (MFTs), the American Association of Marriage and Family Therapists provided county-level counts based on licensing data where available (26 states) and data on clinical members otherwise (25 states). For psychiatrists, data from the AMA Masterfile on individual general psychiatrists were used. The Masterfile is an excellent source of data on physicians in general and psychiatrists in particular. Residents and those in non-patient-care were excluded, and office address (rather than home address) was used where available. ZIP codes were converted to counties in order to generate counts. For psychologists, the American Psychological Association provided age, sex, and ZIP code data on clinical members; ZIP codes were converted to counties and county-level counts of licensed clinically active members were generated. For social workers (SWs), the National Association of Social Workers (NASW) provided counts of MSW-level members at the ZIP code level; these counts were converted to county-level counts.
Each dataset was subjected to data cleaning in order to exclude those with an inactive,
suspended, or non-clinical license and to correct discrepancies between ZIP code and other address components. In cases where county-level counts for a given profession were available from multiple sources, these counts were compared (i.e., for MFTs, 2006 membership vs. 2003 membership and licensing counts; for LPCs, NBCC certification vs. ACA licensing counts; for SWs, NASW membership counts vs. approximate licensing counts provided by the Center for Health Workforce Studies at the State University of New York at Albany). Also, extreme values at the county and state levels were identified and examined; as a part of this process, state-level counts were compared across professions. As a further validity check, county-level counts were aggregated to the state level and compared to the counts in Mental Health, United States, 2004 (Center for Mental Health Services [CMHS], 2006). In general the correlations were quite high, largely because similar data sources were used in this project and in the chartbook. For psychology and social work, state-level totals were also compared to licensing counts collected from the state boards. Any suspect counts were investigated and corrected to the extent possible.
After data cleaning, county-level counts for professions requiring the use of multiple data
sources were scaled such that, when aggregated to the state level, they matched the best available state-level counts of clinically active providers. For MFTs this involved scaling the membership counts to match the Mental Health, US, 2004 chartbook (CMHS, 2006)—except in the case of New Hampshire, where the count of 66 from the state licensing board’s website was used instead of the 785 appearing in the chartbook. For LPCs, state-level counts from the ACA’s annual survey of state licensing boards were used. For the four states where these counts were unavailable, the chartbook counts were inflated by 3%, because on average the state-level ACA counts exceeded the chartbook counts by 3%. (This is probably due to

17
increases over time in the number of licensees in each state and to the fact that the ACA counts were more recent than the chartbook counts.)
Because psychology counts were based on membership data and therefore known to be
underestimated, they were also scaled. Specifically, psychology counts were increased by a factor of 1.896, which is the estimated ratio of licensed clinically active psychologists to licensed clinically active APA members based on data provided by the APA and estimates reported in Mental Health, United States, 2004. This type of scaling was not necessary for the social work membership counts because only 52% of licensed social workers specialize in mental health (Center for Health Workforce Studies & Center for Workforce Studies, 2006). Table 7 summarizes the data source(s) used for each profession, the results of comparing to the chartbook, and the scaling factors used. In most cases our data source is the same as that used in the chartbook; slight deviations from a perfect correlation of 1.0 are due to our use of more recent data where available. Table 7. Characteristics of supply data by provider type
Provider a Data type b Data source c
Correlation withMHUS2004 d counts (state level) Scaling at state level
APPN C ANCC 2003 1.00 N/A LPC L ACA 2005-6 (38 states) 0.98 ACA 2006 (47 states) C NBCC 2006 (13 states) 0.59 MHUS2004 * 1.03 (4 states) MFT L AAMFT 2003 (26 states) 1.00 MHUS2004 M AAMFT 2006 (25 states) 0.90 Psychiatrist M AMA 2005 1.00 N/A Psychologist M APA 2006 0.97 * 1.896 e SW M NASW 2006 1.00 N/A a APPN=advanced practice psychiatric nurse, LPC=licensed professional counselor, MFT=marriage and family therapist, SW=social worker. b C=certification, L=licensing, M=membership (in professional association) c ANCC=American Nurses’ Credentialing Association, ACA=American Counseling Association, NBCC=National Board of Certified Counselors, AAMFT=American Association of Marriage and Family Therapists, AMA=American Medical Association, APA=American Psychological Association. d MHUS2004=Mental Health, United States, 2004 (New Hampshire MFT count corrected from 785 to 66). e 1.896 = estimated ratio of licensed clinically active psychologists to licensed clinically active APA members based on data provided by the American Psychiatric Association and estimates reported in Mental Health, United States, 2004.
Once county-level provider counts were established, these counts were converted to FTE units based on the mean hours worked per week by members of each profession according to available practice pattern data (Table 7). It should be kept in mind that these means include both full-time and part-time providers. For psychologists, the American Psychological Association provided mean hours by age and sex from its 2003 PracticeNet survey, and these means were used along with provider age and sex to estimate FTE. For psychiatrists, the American Psychiatric Association provided mean hours by age and sex from the 2002 National Survey of Psychiatric Practice, and these were used in the same way. For APPNs, an overall

18
mean was estimated from ANCC data by obtaining the frequency distribution of an ordinal “hours worked” variable (for which each response category corresponded to a range of hours per week) and calculating a weighted average based on the midpoints of the response categories. For the remaining professions, estimates of the overall mean number of hours worked were calculated from the data sources cited in Table 7 (above), using a weighted average across groups of providers who worked in private settings, organizational settings, or both. Overall means were used to convert county-level counts to FTE (Table 8).
Table 8. Mean hours worked per week by provider type
Provider Age Sex Mean hours worked per week APPN 34.7 LPC 37.2 MFT 32.4 Psychiatrist under 45 F 38.1 under 45 M 48.2 45-54 F 39.1 45-54 M 51.1 55-64 F 41.6 55-64 M 47.9 65+ F 31.3 65+ M 31.8 Psychologist under 45 F 36.0 under 45 M 40.5 45-54 F 38.6 45-54 M 43.0 55+ F 34.8 55+ M 41.0 F 36.5 M 41.7 under 45 37.5 45-54 40.6 55+ 37.9 SW 36.9
Where possible, alternate data sources were identified and the results were compared. The
2000 National Sample Survey of Registered Nurses (Health Resources and Services Administration, n.d.) yielded a mean of 31.9 hours among 1,099 advanced practice nurses (including those with non-psychiatric specialties). For social workers (including those outside the behavioral health field), a weighted average of 35.2 hours was calculated based on means reported for males and females in a report on the NASW Survey of Licensed Social Workers (Center for Health Workforce Studies & Center for Workforce Studies, 2006). Tables 9 and 10, at the county and state levels respectively, summarize the FTE estimates for mental health providers.

19
Table 9. County-level summary of FTE estimates for mental health providers (N=3,140) Provider Min. Median Max. Mean S.D. Sum Individuals APPN 0.0 0.0 296.0 2.8 11.4 8,741 LPC 0.0 4.3 1,779.8 31.9 102.9 100,294 MFT 0.0 0.7 6,945.9 16.0 152.5 50,158 Psychiatrist 0.0 0.0 1,670.0 11.0 55.0 34,462 Psychologist 0.0 0.0 2,405.8 19.2 94.3 60,185 SW 0.0 3.0 3,120.0 31.7 135.0 99,559 FTE APPN 0.0 0.0 256.6 2.4 9.8 7,577.8LPC 0.0 4.0 1,655.2 29.7 95.7 93,273 MFT 0.0 0.6 5,626.2 12.9 123.6 40,628 Psychiatrist 0.0 0.0 1,722.0 11.7 57.6 36,638 Psychologist 0.0 0.0 2,317.0 18.6 90.6 58,388 SW 0.0 2.8 2,878.2 29.2 124.5 91,843 Table 10. State-level summary of FTE estimates for mental health providers (N=51) Provider Min. Median Max. Mean S.D. Individuals APPN 9.0 113.0 901.0 171.4 181.5LPC 94.0 1,300.0 12,800 1,966.5 2,168.3MFT 20.0 342.0 26,855 983.5 3,731.1Psychiatrist 36.0 379.0 4,869.0 675.7 947.8Psychologist 94.8 492.9 8,421.2 1,180.1 1,561.3SW 81.0 1,016.0 15,005 1,952.1 2,562.8FTE APPN 7.8 98.0 781.1 148.6 157.3LPC 87.4 1,209.0 11,904 1,828.9 2,016.5MFT 16.2 277.0 21,753 796.6 3,022.2Psychiatrist 39.0 403.2 5,166.4 718.4 996.0Psychologist 93.8 480.6 8,100.8 1,144.9 1,504.8SW 74.7 937.3 13,842 1,800.8 2,364.2
5.6 Geographic smoothing and MHPSA scoring Each county-level need and supply estimate was adjusted using a smoothing method that
accounts for travel across county boundaries for mental health services. The maximum amount of time that people travel is about 60 minutes (Fortney, Owen & Clothier, 1999; Fortney, Rost, Zhang et al., 1999). Therefore, for a given index county, the need and supply estimates of counties within a 60-minute radius were weighted and added to the estimates for the index county. The weights were generated using an exponential distance decay function exp(βd) such that a county zero minutes from the index county would receive a weight of one, and a county 60 minutes from the index county would receive a weight close to zero (0.1). Travel times were measured using the inter-county distance matrix developed at the Oak Ridge National Laboratories, which estimates the travel times between county population centroids (Center for Transportation Analysis, 2006). Figure 3 shows several distance decay functions including the selected function (indicated by a solid curve marked with solid circles), with a

20
Figure 3. Distance decay functions for weighting supply and need of nearby counties

21
maximum travel radius of 60 minutes and a beta value of -0.038. After this distance decay function was used to weight county need and supply estimates, the weighted estimates were further scaled so that the national need and supply totals for prescribers and non-prescribers were unchanged by the smoothing process.
5.7 Shortage scores Finally, a county’s unmet need for mental health services is measured as the difference
between its need and supply estimates. Shortage is determined separately for prescribers and non-prescribers, as well as overall, and is expressed as the percentage of total county need that is unmet. Table 11 provides statistics on the percentage of need unmet at the county level. Table 11. Counties with unmet need by provider category
Provider category
Number (%) of counties with unmet need (N=3,140)
% need unmet a
Min. Median Max. Mean S.D. Non-prescriber 550 (17.5%) -1589 -132 100 -170 197Prescriber 3019 (96.2%) -123 74 100 67 31Overall 3020 (96.2%) 0 33 100 35 21Current whole-county MHPSAs (for comparison)
1972 (62.8%)
a For prescribers and non-prescribers, negative numbers indicate a surplus of providers. Overall shortage, however, can not be negative because it is defined as the sum of prescriber shortage (if >0) and non-prescriber shortage (if >0).
Based on the smoothed need and supply estimates, almost one out of five counties in the U.S. have unmet need for non-prescribers, and nearly every county has unmet need for prescribers (and therefore some level of unmet need overall). The new method identifies far more counties with unmet need than does the current set of MHPSA designations. Because the new method measures unmet need as a continuous variable, this can be addressed simply by selecting an appropriate threshold for geographic shortage designation. Section 8.2 provides recommendations for selecting a threshold.
Figures 4, 5 and 6 group counties with unmet need into quartiles and show the geographic
distribution of counties within each quartile. Figure 7 provides a more fine-grained picture of the areas with the highest levels of shortage by starting with the counties in the top quartile of percentage-of-overall-need-unmet, dividing those counties into quartiles, and showing their geographic distribution.

22
Figure 4. Quartiles of % non-prescriber need unmet among counties with non-prescriber shortage

23
Figure 5. Quartiles of % prescriber need unmet among counties with prescriber shortage

24
Figure 6. Quartiles of % overall need unmet among counties with overall shortage

25
Figure 7. Quartiles of % overall need unmet among counties in the top quartile of overall shortage

26
6. Impact assessment and sensitivity analyses To assess the full implications of using the new method for MHPSA designation, we carried
out an impact assessment comparing the new method with the current method. Sensitivity analyses were also conducted to evaluate the robustness of the new method to alternative modeling assumptions. These procedures are described below.
6.1 Impact assessment It is important to understand the impact of the new method on current MHPSA designations.
Based on the constraint that the number of whole-county geographic designations should remain constant, Table 12 shows the impact of the new MHPSA method on designation. Among the 1972 counties that are currently designated, 1,537 (78%) would also be designated under the new method. This indicates that the new method and the current application-based designation process are in agreement to a large extent. The remaining 435 currently designated counties (22%) would be replaced by 435 of the counties that are not currently designated. To the extent that the new model is correct, it has identified a large number of counties that have a high degree of shortage, but have not been designated through the current application-based process. Table 12. Impact of the new MHPSA method on designation
Frequency Percent Row Pct Col Pct
Current whole-county MHPSA
No Yes Total
New MHPSA
No 733
23.34 62.76 62.76
43513.8537.2422.06
116837.20
Yes 435
13.85 22.06 37.24
153748.9577.9477.94
197262.80
Total 1168 37.20
197262.80
3140100.00
For counties that are currently designated (N=1972), we examined the bivariate
relationships between county characteristics and loss of designation. For counties that are currently non-designated (N=1168), we examined the bivariate relationships between county characteristics and gain of designation. We considered the following predictors: population; median age; percentage of population ages under 18, 18-24, 25-44, 45-64, and 65-plus; males per 100 females; per capita income; percentage of population Asian, Black, White, White non-Hispanic, Hawaiian/Pacific Islander, Multiple races, and other race; total county area; population density; status as a frontier county (fewer than seven persons per square mile); status as a metropolitan statistical area (MSA); current part-county designation; and current facility designation.
Variables that had significant bivariate relationships with loss or gain of designation (|r| ≥
0.1 for continuous variables and p<.05 for categorical variables) were included in logistic regression models predicting loss and gain. (Part-county designation was not included in the model predicting loss of designation, because the sample for this model is the group of counties with whole-county designations. Also, median age and percentage of population between 25-44

27
years of age were excluded because including them in the set of age variables would have caused collinearity problems.) Beginning with the full model, the predictor with the highest p-value above .05 was removed from the model; this step was repeated until all remaining predictors had p-values less than .05. The results appear in Table 13.
Table 13. Results of logistic regression models predicting loss and gain of designation a
Odds Ratio (95% CI) Loss Gain Population (thousands, 2000) 0.995 (0.991, 0.999) % population ages 18-24 (2000) 1.040 (1.003, 1.079) 0.939 (0.891, 0.989) % populations ages 65+ (2000) 0.956 (0.919, 0.995) 1.056 (1.008, 1.105) Per capita income (thousands, 1999) 1.204 (1.145, 1.265) 0.846 (0.803, 0.891) Rural-urban continuum code (2003) b 0.782 (0.733, 0.834) 1.189 (1.102, 1.284) Population density (persons per square mile, 2000)
1.002 (1.000, 1.003) 0.999 (0.998, 1.000)
Frontier county 0.617 (0.393, 0.967) 3.103 (1.253, 7.682) Northeast county 5.273 (2.883, 9.643) 0.300 (0.177, 0.509) Facility designation 1.527 (1.153, 2.023) 0.716 (0.526, 0.976) a Loss model predicts loss of designation among counties currently designated as MHPSAs, assuming that the number of whole-county designations will remain constant (N=1972). Gain model predicts gain of designation among counties not currently designated as MHPSAs (N=1168), with the same assumption. b Rural-Urban Continuum Code is a rough indicator of rurality and ranges from 1-9, with 1 indicating the most populous metropolitan areas and 9 indicating the least populous non-metropolitan areas.
The logistic regression results indicate that, relative to the current designations, the new method is more likely to designate rural counties, frontier counties, and those that have less population density, lower per capita income, more people over 65, and fewer people in the 18-24 age range. The new method is also more likely to designate counties outside the Northeast and those that do not currently have facility designations. The likelihood of designating low-income, rural, and frontier counties may reflect the identification of shortages that were previously unacknowledged, and may be appropriate given the well-known difficulty of delivering mental health services in rural areas. The effect of population on loss of designation is difficult to interpret and, in fact, the bivariate relationship between these two variables is in the opposite direction (i.e., counties with large populations were more likely to lose and less likely to gain designation). Other predictors in the models may be associated with loss and gain of designation largely through their association with variables related to rurality. Presence of a facility designation is negatively associated with rurality, and being in the Northeast is strongly associated with lower rurality, lack of frontier status, higher population density, higher per capita income, and presence of a facility designation.
The results of this impact analysis give no reason for alarm, but do suggest that it would be
appropriate for HRSA to be mindful of certain issues as the agency decides upon a score threshold for MHPSA designation, considers applications from counties, and plans further development of the scoring method: (1) The association of facility designation with loss and gain of whole-county designation may be due in part to the fact that the new method necessarily counts as available those mental health professionals who work in designated facilities. Collecting counts of licensed prescribers and non-prescribers who work in designated facilities,

28
and incorporating this information into the scoring method, would alleviate this problem. Meanwhile, this information may need to be considered on a case-by-case basis as part of the application process. (2) Compared to counties in other regions, those in the Northeast are substantially more likely to lose and less likely to gain designation. Although the new method does not appear to be unfairly biased in this direction, applications will need to be considered carefully in order to ensure the absence of bias. Aside from the application process, additional consultation or collaboration with counties in different regions of the country may help to give a richer perspective on the impact of the new method, its fairness, the degree to which designations should be subject to review, and the determination of an appropriate threshold for shortage designation.
6.2 Sensitivity analyses The shortage estimates presented here are based on a number of assumptions that deserve
consideration. We conducted sensitivity analyses to check five key assumptions: 1. SMI prevalence is variable (vs. constant), 2. Need among people with SMI is best represented by utilization among service users (vs.
overall), 3. The MEPS (vs. NCSR) is the appropriate data source for estimating provider minutes
needed by people without SMI, 4. It is appropriate to expect 15% of mental health visit time to be provided in primary care,
and 5. The appropriate maximum travel radius for mental health services is 60 minutes.
We relaxed these assumptions one at a time. Given the constraint that the number of whole-county geographic designations should remain constant, we examined the impact on several indicators:
• threshold for shortage designation • percentage of currently designated counties that would lose designation • percentage of currently designated counties that would gain designation • percentage of shortage areas that are non-metropolitan counties • percentage of population that would be living in shortage areas
Assuming constant SMI prevalence had little effect. Using a constant prevalence resulted in
a change of less than 1% in each of the indicators. Estimating need based on the overall mean level of utilization among people with SMI
(instead of the mean among service users) reduced the designation threshold from 28.5% to 27.3% of need unmet (i.e., making this change would result in shortage estimates that are very slightly lower, so the designation threshold would need to be lowered very slightly in order to maintain the same number of designations). This different approach to need estimation would change the other four indicators by less than 1%.
Using the NCSR as the data source for estimating provider minutes needed for people
without SMI would result in lower shortage estimates and would therefore reduce the designation threshold from 28.5% to 23.0% of need unmet. It would reduce the percentage of population in shortage very slightly, from 24.4% to 23.4%. Making this adjustment would change the remaining indicators by less than 1%.
We tested a range of possible values for the maximum percentage of mental health care
that can appropriately be met by primary care providers: 0%, 5%, 10%, 15%, 20%, 25%, and

29
30%. Assuming that no mental health need is appropriately met in primary care would increase the shortage estimates, resulting in a slightly higher designation threshold: 30.9% of need unmet (instead of 28.5%). Other indicators would be changed by less than 1%. In contrast, assuming that up to 30% of mental health need can be met in primary care (pro-rated according to the amount of primary care need that is met in each county) would decrease the shortage estimates, resulting in a slightly lower designation threshold of 25.1%, and would decrease the percentage of population living in shortage areas very slightly, from 24.4% to 23.8%. Other indicators would be changed by less than 1%.
Finally, we tested a range of possible values for the maximum travel time radius within which
the need and supply estimates were smoothed to account for travel across county boundaries: 15, 30, 45, 60, 75, 90, 105, and 120 minutes (Figure 8). Varying the travel radius affected several indicators: (1) As the radius increased, the threshold for shortage designation decreased (ranging from 37.7% to 23.3%), because extremely high shortage levels were smoothed out. (2) The percentage of currently designated counties that would lose designation ranged from 21.7% to 24.8%, and the percentage of currently non-designated counties that would gain designation ranged from 36.6% to 41.9%. Both of these indicators appear to be minimized (and therefore the amount of agreement between the new method and the current whole-county designations is maximized) at a radius between 45 and 60 minutes. (3) The percentage of shortage areas that are non-metropolitan counties varied from 78.0% to 82.3%. This indicator appears to be maximized at a radius between 45 and 60 minutes. (4) As the radius increased, the percentage of population living in shortage areas increased (ranging from 16.5% to 32.9%). Increasing the maximum travel time has the effect of creating larger and larger clusters of counties that are homogeneous with respect to shortage level (i.e., high-shortage and low-shortage clusters of counties). Because some of the high-shortage clusters are in high-population regions, this has the effect of increasing the number (and proportion) of people living in shortage areas.
To summarize, relaxing each of the first four key assumptions did not affect our results
appreciably. There were small changes in the threshold for shortage designation, but the group of counties designated remained essentially the same. Varying the travel radius affected the degree to which shortage was concentrated in clusters of counties and therefore affected which counties were designated. Because the research literature provides clear justification for a 60 minute travel radius, and widening the radius would mask shortages in rural areas, we are satisfied with the current scoring mechanism. We also note that a radius of 60 minutes results in a level of agreement with current designations that is close to the maximum.
7. Caveats The method described above presents a set of rational decisions using data that are
currently available in order to generate scores in a timely and efficient manner. This required a number of assumptions and compromises that are highlighted for users in the following sections.
7.1 Appropriateness of data and methods used to estimate prevalence of SMI The NCSR data were used as the basis of the estimate of SMI prevalence because they are
the most current and in-depth data on mental disorders across the U.S. Although we recognize that data refinements come at a high cost, there are several that would greatly improve the data for its use in generating shortage scores. First, there are only about 350 individuals with SMI in the NCSR dataset. A larger sample, and one that included individuals who are homeless or

30
Figure 8. Effects of varying travel time radius

31
living in institutions, would be preferable. In addition, there are several measures that would benefit from refined definitions. As discussed in section 5.3, psychotic disorders are handled differently from other diagnoses in the NCSR. Prevalence estimation would be more transparent if the handling of these disorders were consistent with that of other diagnoses. The race/ethnicity measure offers little subtlety (Black, White, Hispanic, other). As the knowledge base on the association between race/ethnicity and SMI prevalence grows, increased distinctions in race/ethnicity in SMI prevalence estimates will be particularly important. Income was not collected for most of the low/no impairment sample, so SMI prevalence was modeled using a 2-stage logit model to avoid potential problems with imputing income. To the extent that the first stage model is mis-specified, the prevalence estimates may be biased. Since poverty status is an important predictor of SMI status, it would be preferable to collect income data for the entire survey sample. Finally, the predictors in the prevalence model were restricted to demographic factors in order to avoid reinforcing geographic disparities. For example, we wanted to avoid having practice pattern variations across regions lead to variations in estimated need. Again, to the extent that the model is mis-specified, the prevalence estimates may be biased; however, fit statistics give us confidence that this is not the case (see section 5.3).
7.2 Mental health service use as a measure of need Unfortunately, standard measures of need for mental health treatment do not yet exist
(Center for Mental Health Services, 2004). Our goal here was a moderate normative standard of need for mental health services: need was measured based on utilization. In an effort to avoid drastically underestimating need for individuals with SMI, their need was measured based on use among users. This is still likely to be a conservative measure of need, based on suboptimal rates of service use in this group. The sensitivity analyses described above confirm that restricting the estimate to use among users for individuals with SMI had minimal impact on the ultimate scores. Despite our moderate stance, the resulting shortage scores indicate widespread shortage. This outcome would not be useful to HRSA except for the fact that the new scores provide a continuous measure of shortage, an advantage of the new method over the current one. HRSA can choose any cut-off threshold that it needs in order to meet fiscal constraints.
7.3 The role of primary care providers in meeting mental health needs
As discussed in section 5.4, there are few standards to account for the role of primary care providers in meeting mental health needs. The President's New Freedom Commission on Mental Health stressed that mental disorders often go undiagnosed or under-treated in primary care, and in response, the Mental Health System Transformation grants from SAMHSA (Substance Abuse and Mental Health Services Administration) support integration with primary care as a major goal (New Freedom Commission on Mental Health, 2003; Substance Abuse and Mental Health Services Administration, 2006b). In the face of this effort toward change, the new method seeks to account for the role of primary care in meeting mental health needs without overestimating its impact. Sensitivity analyses indicate that varying the percentage of mental health needs met through primary care, from none up to a generous estimate, actually has minimal impact on the ultimate shortage designations, which lends confidence that the chosen value is reasonable.
7.4 The supply of mental health professionals The supply data on mental health professionals constructed for this report represent the
most comprehensive, detailed and up-to-date information on the mental health workforce that we are aware of. Numerous validity checks lend confidence that these data reflect the distribution of the mental health workforce. However, to the extent that the necessity for data construction failed to generate correct counts for counties, some counties may receive shortage scores that are too low. The mental health professions may find this motivates national data collection. The quality of scores would be improved if supply data included the following:

32• Clean licensure data from all states • Practice (not home) addresses and hours/week worked at each location • De-duplication of licenses in multiple states or professions • Indication of clinically active status • Hours worked per week • Hours per week in direct contact with clinical clients • Prescriber status (for psychologists and advanced practice psychiatric nurses)
With regard to the mental health workforce, it should also be noted that the group of mental
health professions defined by HRSA and used in this new method does not include pastoral counseling, clinical sociology, or psychosocial rehabilitation. There are approximately 3,000 pastoral counselors in the U.S., and those at the Fellow and Diplomate levels of certification (as opposed to the initial level) appear to have training comparable to that of the non-prescribers included in HRSA’s list of professions (Center for Mental Health Services, 2006; American Association of Pastoral Counselors, 2005). Clinical sociology is a much smaller profession, with only 14 clinically active Certified Clinical Sociologists as of December 2004 (Center for Mental Health Services, 2006). The psychosocial rehabilitation field has about 100,000 practitioners, approximately 26,000 of whom have a masters or doctoral degree, but only about 2,400 are Certified Psychiatric Rehabilitation Practitioners (Center for Mental Health Services, 2006; U.S. Psychiatric Rehabilitation Association, 2007). Many providers in these fields may be licensed in mental health professions such as counseling. Those who are not are excluded from our provider counts.
7.5 The impact of travel on local mental health need and workforce supply The report provides detailed discussion of the rationale and impact of smoothing shortage
scores using a 60 mile travel radius. The choice of an hour travel time is supported by the literature, minimizes unrecognized pockets of shortage and maximizes agreement with current shortage designations. A limitation of this smoothing technique is that it does not account for the fact that tertiary medical centers may draw people from a wider radius than other provider organizations. Since workforce data represent, to some extent, place of work, the smoothing may underestimate shortage scores in areas that contain these large centers. Counties with large medical centers may need to apply for shortage designation based on documentation of catchment areas that reflect longer travel times.
7.6 The logic underlying the shortage score We recognize that each profession brings a unique philosophy and focus to the care and
treatment of mental illness. Local treatment modalities—Assertive Community Treatment (ACT), for example (Phillips, Burns, Edgar et al., 2001)—can capitalize on the strengths of each profession in order to provide individualized multidisciplinary treatment. On a national scale, practice patterns and workforce data are too fluid to allow the precise matching of roles with actors in each county. It is clear, however, that prescribers and non-prescribers are not functionally substitutable, so the new method was developed to distinguish these categories. This implies that need for a non-prescriber may be filled by any type of non-prescriber. In the overall shortage score, prescribers and non-prescribers have equal weight, to reflect that each group plays an equally critical role in treatment. For prescribers, the currently available data include only psychiatrists. However, the generic term is used in order to highlight the fact that better national workforce data would allow the inclusion of psychologists (in two states) and advanced practice psychiatric nurses (in all states, and independently in 14 states) as prescribers.
7.7 What the shortage scores do not measure It is important to keep in mind several issues about the delivery of mental health services
that are not addressed by the new method or the resulting shortage scores and designations.

33First, the need estimates and provider counts do not distinguish between public sector services (where the greatest impairment exists) and private practice (where many consumers have less serious disorders). It is likely that the actual shortages in the public sector are greater than those in the private sector. Second, the new method does not assess the extent to which an appropriate continuum of care exists for mental health or the degree to which other needs such as housing are being met. Third, simply comparing estimated need to estimated workforce supply does not address the quality of care or the degree to which practices are evidence-based. All of these issues are important in determining whether an area’s mental health services are adequate to meet the needs of consumers.
8. Summary and Recommendations 8.1 Summary The new mental health professional shortage area designation method has been developed
to accomplish the following goals using available data in a timely manner: 1. To reflect current mental health needs and workforce supply 2. To yield a continuous score for each county, and 3. To make the MHPSA scoring process more consistent with those proposed for primary
and dental care Findings indicate that nearly one in five counties in the U.S. has unmet need for non-
prescribers, and nearly every county has unmet need for prescribers (and therefore some level of unmet need overall). The new method identifies far more counties with unmet need than does the current designation method: the new method is more likely to designate rural counties; frontier counties; those that have lower population density, lower per capita income, more people over 65, and fewer people in the 18-24 age range; counties outside the Northeast; and those that do not currently have facility designations. We recommend that HRSA continue to allow an application process, so that a state or county can document shortage using superior local data that meet HRSA's chosen designation threshold.
8.2 Recommendation for a Designation Threshold
Many researchers have attempted to measure the need for mental health professionals, psychiatrists, or physicians. They have used several different approaches (Council on Graduate Medical Education [COGME], 2000; Schroeder, 1996; Tarlov, 1986; Dial, Bergsten, Haviland, & Pincus, 1998):
(1) need: supply required for appropriate treatment, given disease prevalence and time
requirements (variables typically measured by expert consensus); (2) demand: supply required to match current levels of utilization (variables typically
measured using nationally representative surveys); (3) sociodemographic (“trend”): local supply predicted from demographic and economic
variables in a model (e.g., local distribution of age and socioeconomic status, presence of training programs, distribution of related professionals);
(4) economic indicator: assessment of the adequacy of local supply using one or more key variables (e.g., number of job openings, typical income relative to that of other professions); and
(5) benchmarking: comparison of an area’s supply with that of an exemplary area (e.g., using hospital referral regions or catchment areas) or with health maintenance organization (HMO) staffing patterns.
Estimates from the need and demand models may be adjusted in order to delineate more accurately the population that would benefit from treatment, the portion of disease requiring treatment, or the portion of disease for which there is a reasonable expectation of identification and treatment given the available resources (Tarlov, 1986; COGME, 2000).

34
Most assessments can be categorized either as need-based (approach 1) or demand-based (approaches 2-4) (Blumenthal, 2004). Benchmarking may be a mixture of the two. For example, Goodman and colleagues (1996) compared local areas in Georgia to one HMO and two areas with low physician-to-population ratios. The comparison is to demand (i.e., current utilization) in specific settings, but there is an implicit judgment that a particular level of demand is appropriate (i.e., equals need).
Each approach has its limitations (COGME, 2000; Cooper, Getzen, McKee, & Laud, 2002).
The need model is dependent on accurate measurement of disease prevalence, the amount of time required for treatment, and the number of professionals necessary to provide a given amount of care (Cooper & Getzen, 2002). The demand model is dependent on accurate measurement of utilization (including the amount of provider work time devoted to patient care and to other activities). The sociodemographic and economic indicator models are subject to problems with the availability of local data; furthermore, the economic indicator model is subject to short-term market fluctuations. The demand-based models (approaches 2-4) and the benchmarking model are dependent on assumptions about what level of utilization or demand is appropriate (Reinhardt, 2002; Barer, 2002). This is an issue especially in the case of health care, because there is evidence that physicians may induce demand for treatment, or at least that “demand and supply interact in unusual ways in medicine” (Garber & Sox, 2004, p. 733). Also, demand for health care depends not only on health status but also on social preferences and economic well-being (Cooper, 2002; Cooper, 2003), and on the organization and financing of care (e.g., presence and type of managed care).
It is particularly difficult to quantify the need for mental health professionals. The total
number of providers needed and the number needed within each profession depend on staffing patterns. There are many different ways in which the mental health professions can be combined to form appropriate staffing patterns, depending not only on the organization and financing of care in general (e.g., presence and type of managed care) but also on the working relationships among the mental health professions (e.g., integrated vs. independent practice) (Cooper, 2002). Furthermore, the need for mental health providers depends on the amount of mental health need that is met (or should be met) by primary care providers, a question which has not been answered definitively.
In psychiatry and mental health (as distinguished from health care in general), the existing
estimates and projections of need have been generated using the need or benchmarking methods. A few authors, including Cooper and colleagues (2002), have used demand-based methods to project need for physicians. However, these estimates are not specific to psychiatry or mental health and they are only distantly related to measures of need.
In developing the new method, we used a combination of the need and demand methods.
Estimates of disease prevalence and current utilization were generated from nationally representative survey data, and it was assumed that those in mental health treatment are receiving an adequate amount of treatment, but the utilization estimates were adjusted in order to include people who are in need of treatment but who are not currently receiving treatment. Under the new method, because an area’s score is expressed as the percentage of the area’s need that is unmet, there is an implicit cutoff (0%) above which an area is deemed to have unmet need. However, this implicit cutoff is a theoretical threshold only, an expression of what should take place under ideal conditions. In terms of meeting needs for health care, what should happen differs from what is likely to happen (Tarlov, 1986; Cooper et al., 2002). In order to plan intervention and to make decisions about resource allocation, a practical threshold is needed.

35Table 14 uses actual or implied provider-to-population ratios (i.e., numbers of provider FTEs
per 100,000 population) to compare the implicit theoretical threshold and two potential practical thresholds with the current national provider supply and with previous estimates of need. The table is sorted in descending order by total mental health professionals per 100,000 population and then by psychiatrists per 100,000 population. It is impossible to determine based on the existing estimates what is a typical or appropriate ratio for a rational service area or for a busy mental health practice. The estimates based on closed-panel HMOs are problematic because (1) the SMI prevalence is likely lower in those patient populations than in the general household population; (2) those organizations are much less common in today’s market than they were in the 1980’s and 1990’s; and (3) HMOs have a financial incentive to provide minimal, but not necessarily optimal, levels of care. However, the provider-to-population ratios that correspond to potential practical thresholds A and B (47.5 and 43.9 respectively) are about half of the national ratio of 109.6 mental health provider FTEs per 100,000 population, which implies that providers in areas meeting those designation thresholds would serve about twice the expected population.
Consistent with the scoring used in the new method, the selected designation threshold
would be expressed as a minimum percentage of need that must be unmet in order for an area to qualify. Using Threshold A (at least 28.5% of need unmet) would result in designating the same number of counties that currently have whole-county designations. Using Threshold B (at least 34% of need unmet) would result in designating 75% of those counties, reducing the likelihood of false positives and achieving an optimal balance between the efficiency afforded by central designation and the flexibility of the application process. Threshold B is therefore recommended.
Consistent with the equal weighting of prescribers and non-prescribers, Threshold B should
be applied to the overall score (i.e., percentage of overall need unmet). The overall score can also be used as an indicator of relative shortage levels among designated areas. Once specific areas are targeted for intervention or for the distribution of resources, the prescriber and non-prescriber scores can be used as an aid in thinking about local priorities.
8.3 Next Steps The new method presented here provides a sound basis for mental health professional area
shortage designation currently. In addition, there are several avenues for further refinement and expansion that could be considered: refinements that enhance the ease of use by states and counties, analyses that could facilitate periodic updates of scores, and expansions of scope.
One of the primary goals of the new MHPSA method was to yield a continuous score for
each county so that each county would not need to make an application to gain designation. There are further refinements that could reduce the burden of application for those states or counties that have unique local circumstances not captured by the new national MHPSA scores. First, a web-based calculator could be developed which would identify county-level estimates for mental health workforce and need, so that a county could compare MHPSA score components to local data and calculate a new shortage score based on that local data to determine if an application would be beneficial. Second, it would be possible to develop a tool kit of assessment protocols to guide states in checking and obtaining improved local data. For example, the tool kit could provide guidance in counting public sector mental health providers and public sector clients (Medicaid recipients and those without health insurance such as individuals who are homeless or not citizens). Finally, an in-depth comparison of MHPSA

36Table 14. Psychiatrists and other mental health professional FTEs per 100,000 population: A comparison of provider-to-population ratios from multiple sources
Method Sample Psychiatrists Other MH professionals Total
Ratio of non-psychiatrists to psychiatrists Source
US supply, 2003-2006 12.2 97.4 109.6 8.0 supply data used in developing new method 1, 2 NCSR, Census, MEPS a 30.1 36.4 66.5 1.2 new method (implicit theoretical cutoff) 1, 2 NCSR (for SMI and non-SMI),
Census a 26.0 39.3 65.3 1.5 new method (alternate scenario using NCSR for
both SMI and non-SMI) 1 need in 1990, projected in 1980
by GMENAC c 19.5 ----- ----- ----- Mulhausen & McGee, 1989
5 13 HMOs with enrollment < 80,000
12.7 37.3 50.0 mean 10.4 Dial et al., 1998
US supply, 1992 12.0 ----- ----- ----- Weiner, 1994 1, 2 NCSR, Census, MEPS a ~47.5 new method (practical Threshold A, keeping
constant 62.8% of counties in shortage [max. 71.5% of need met])
1, 2 NCSR, Census, MEPS a ~43.9 new method (practical Threshold B, keeping 75% of 62.8% of counties in shortage [max. 65.97% of need met], allowing others to apply for designation)
5 17 group-model HMOs 6.3 25.2 31.5 mean 4.9 Dial et al., 1998 5 closed-panel staff-model HMO,
1993 6.8 23.8 30.6 3.5 Scheffler & Ivey, 1998 b
5 30 HMOs overall 6.8 22.9 29.7 3.4 (mean 4.5)
Dial et al., 1998
5 17 HMOs with enrollment >= 80,000
6.3 22.1 28.4 mean 4.2 Dial et al., 1998
5 13 staff-model HMOs 8.3 16.5 24.8 mean 3.4 Dial et al., 1998 5 closed-panel group-model HMO,
1992 4.8 17.4 22.2 3.6 Scheffler & Ivey, 1998 b
5? 5.0-6.7 16.7-22.2 current MHPSA designation criteria (high-need) 5? 3.3-5.0 11.1-16.7 current MHPSA designation criteria (normal) 5 Kaiser Portland, 1992 d 4.8 ----- ----- ----- Weiner, 1994 5 7 large closed-panel HMOs,
1983 3.8
(rge 1.9-4.6) ----- ----- ----- Mulhausen & McGee, 1989
5 mental health carve-out plan, 1995
----- ----- ----- 4.0 Scheffler & Ivey, 1998 b
a NCSR = National Comorbidity Survey Replication; MEPS = Medical Expenditure Panel Study. For practical thresholds A and B, ratios presented are approximate. b Data are from 1992-1995. For each of the 2 HMOs, we selected statistics from the year in which the HMO had the largest overall provider-to-population ratio. Ratios for non-psychiatrists are calculated based on statistics presented in Table 1 and Figure 1. Because the carve-out is not a closed-panel plan, the data did not allow calculation of provider-to-population ratios. c Graduate Medical Education National Advisory Committee.

37d Possibly based on Scheffler & Ivey’s (1998) closed-panel HMO.

38
scores and scores generated with local data from a few representative states across the U.S. could provide insights about designation limitations and further strategies states and counties could use to apply for shortage designations when the national scoring method falls short. For example, in states where advanced practice psychiatric nurses have prescriptive authority, licensure data could be used to determine which psychiatric nurses are prescribing.
Another primary goal of the new MHPSA method was to ensure that the new scores
reflected current mental health needs by using available data in a timely manner. It would be desirable for the scores to be updated regularly, so that they retain their relevance. Unfortunately, the epidemiological surveys upon which they are based are extremely expensive and unlikely to be repeated frequently. An alternative and much less expensive strategy for updates would be to use social indicators (e.g. small area poverty, prevalence of substance abuse and homelessness) to estimate county prevalence of serious mental illness in the U.S., an approach that is routine in the U.K. (Glover, Arts & Wooff, 2004; McCrone & Jacobson, 2004; Glover, Robin, Emami et al., 1998). The goal would be to determine the role of social indicators in predicting county prevalence of serious mental illness in the US based on current epidemiological surveying and then develop a protocol for updating MHPSA scores in the interim until the epidemiological data are updated.
As federal and state funders plan for future data collection efforts, it will be important to
consider the ways in which the scope of the new method could be expanded to represent more fully the needs of counties. It would be desirable to expand the analysis to include children, perhaps using the upcoming National Comorbidity Survey on Adolescents when it becomes available. It would also be meaningful to expand the scope to account for the needs of adults who are homeless or living in institutions. Given the importance of access to medications for individuals with mental health needs, it would be worth exploring the feasibility and impact of expanding the definition of mental health professional workforce to include non-physician prescribers (advanced practice psychiatric nurses and psychologists) as well as pharmacists. As for non-prescribers, the inclusion of additional mental health professional groups with sufficient clinical training should also be considered. Finally, although there are unique challenges associated with assessing the needs and workforce for substance abuse services, this deserves future attention.
9. References American Association of Pastoral Counselors (2005). About pastoral counseling. Retrieved
December 5, 2007, from http://www.aapc.org/about.cfm Barer, M. (2002). New opportunities for old mistakes. Health Affairs, 21(1), 165-166. Bhugra, D., & Flick, G. (2005). Pathways to care for patients with bipolar disorder.
Bipolar Disorders, 7(3):236-45. Blumenthal, D. (2004). New steam from an old cauldron—The physician-supply debate. NEJM,
350(17), 1780-1787. Breslau, J., Aguilar-Gaxiola, S., Kendler, K., Su, M., Williams, D., & Kessler, R. (2005).
Specifying race-ethnic differences in risk for psychiatric disorder in a USA national sample. Psychological Medicine, 35, 1-12.
Bureau of Health Professions, Health Resources and Services Administration, U.S. Department of Health and Human Services. (2005). User Documentation for the Area Resource File. Washington, DC: Author.
Bureau of Health Professions (BHPr), Health Resources and Services Administration, U.S. Department of Health and Human Services. (2007). How to apply for health professional area designation. Retrieved May 31, 2007, from http://bhpr.hrsa.gov/shortage/hpsapply.htm

39
Burns, B., Scott, J., Burke, J., & Kessler, L. (1983). Mental health training of primary care residents: A review of recent literature (1974-1981). General Hospital Psychiatry, 5(3):157-69.
Center for Health Workforce Studies (School of Public Health, University at Albany) & Center for Workforce Studies (National Association of Social Workers). (2006). Licensed Social Workers in the U.S., 2004: Volume 2 Supplement. Retrieved July 20, 2006, from http://workforce.socialworkers.org/studies.asp
Center for Mental Health Services. (2006). Mental Health, United States, 2004. Manderscheid, R. W., and Berry, J. T., Eds. DHHS Pub No. (SMA) 06-4195. Rockville, MD: Substance Abuse and Mental Health Services Administration.
Center for Mental Health Services. (2004). Mental Health, United States, 2002. Manderscheid, R. W., and Berry, J. T., Eds. DHHS Pub No. (SMA) 04-3938. Rockville, MD: Substance Abuse and Mental Health Services Administration.
Center for Substance Abuse Treatment (Substance Abuse and Mental Health Services Administration). (2003). Practitioner Services Network II (PSN II) Initiative: Summary of findings. Unpublished document.
Center for Substance Abuse Treatment (Substance Abuse and Mental Health Services Administration). (n.d.). Practitioner Research Network (PRN): Summary of initiative and findings. Unpublished document.
Center for Transportation Analysis (Oak Ridge National Laboratory). (2006). County-to-county distance matrix. Retrieved February 21, 2007, from http://cta.ornl.gov/transnet/SkimTree.htm
CFR (1993) Health Professional Shortage Area Mental Health Designation Criteria, 42 Code of Federal Regulations (CFR), Chapter 1, Part 5, Appendix C, October 1, pp. 34-48.
Ciarlo, J. and Tweed, D. (1992). Implementing indirect needs-assessment models for planning state mental health and substance abuse services, Evaluation and Program Planning, 15, 195-210.
Cohen, J. (1997) Methodology Report #1: Design and Methods of the Medical Expenditure Panel Survey Household Component, Agency for Health Care Policy and Research, Rockville, MD. Available at http://www.meps.ahrq.gov/data_files/publications/mr1/mr1.shtml
Cooper, R. A., Getzen, T. E., McKee, H. J., & Laud, P. (2002). Economic and demographic trends signal an impending physician shortage. Health Affairs, 21(1), 140-154.
Cooper, R. A., & Getzen, T. E. (2002). The coming physician shortage. Health Affairs, 21(2), 296-298.
Cooper, R. A. (2002). There’s a shortage of specialists. Is anyone listening? Academic Medicine, 77(8), 761-766.
Cooper, R. A. (2003). Where is psychiatry going and who is going there? Academic Psychiatry, 27(4), 229-234.
Council on Graduate Medical Education (COGME). (2000). Evaluation of specialty physician workforce methodologies. Washington, DC: US Health Resources and Services Administration.
Dial, T. H., Bergsten, M. H. A., Haviland, M. G., & Pincus, H. A. (1998). Psychiatrist and nonphysician mental health provider staffing levels in health maintenance organizations. American Journal of Psychiatry, 155(3), 405-408.
Diamond, P. M., Wang, E. W., Holzer, C. E. 3rd, Thomas, C., & Cruser, des Anges. (2001) The prevalence of mental illness in prison. Administration and Policy in Mental Health, 29(1), 21-40.
Druss, B. G., Wang, P. S., Sampson, N. A., & Olfson, M. (2007). Understanding mental health treatment in persons without mental diagnoses: Results from the National Comorbidity Survey Replication. Archives of General Psychiatry, 64(10), 1196-1203.
Fortney JC, Owen R, Clothier J (1999) Impact of travel distance on the disposition of patients presenting for emergency psychiatric care. Journal of Behavioral Health Services Research, 26(1):104-8.

40
Fortney J, Rost K, Zhang M, Warren J. (1999) The impact of geographic accessibility on the intensity and quality of depression treatment. Medical Care, 37(9):884-93.
Garber, A. M., & Sox, H. C. (2004). The U.S. physician workforce: Serious questions raised, answers needed. Annals of Internal Medicine, 141(9), 732-734.
Glover, G., Arts, G., & Wooff, D. (2004). A needs index for mental health care in England based on updatable data, Social Psychiatry and Psychiatric Epidemiology, 39, 730-738.
Glover, G., Robin, E., Emami, J., & Arabscheibani, G. (1998) A needs index for mental health care. Social Psychiatry and Psychiatric Epidemiology, 33, 89-96.
Goldsmith, H., Holzer, C., & Manderscheid, R. (1998). Neighborhood characteristics and mental illness. Evaluation and Program Planning, 21, 211-225.
Goodman, D. C., Fisher, E. S., Bubolz, T. A., Mohr, J. E., Poage, J. F., & Wennberg, J. E. (1996). Benchmarking the US physician workforce: An alternative to needs-based or demand-based planning.
Harvard School of Medicine. (2005). NCS-R: Answers to frequently asked questions. Retrieved December 4, 2007, from http://www.hcp.med.harvard.edu/ncs/faqncsr.php
Heady, P., Clarke, P., Brown, G., Ellis, K., Heasman, D., Nennell, S., Lonhurst, J., & Mitchell, B. (2003) Model-based small area estimation Series No. 2: Small area estimation project report, Office for National Statistics, U.K.
Health Resources and Services Administration (U.S. Department of Health and Human Services). (n.d.) National Sample Survey of Registered Nurses, 2000. Retrieved June 5, 2006, from http://datawarehouse.hrsa.gov/nursingsurvey.htm
Holzer, C., Jackson, D., & Tweed, D. (1981). Horizontal synthetic estimation: a strategy for estimating small area health related characteristics. Evaluation and Program Planning, 4(1), 29-34.
Ivey, S., Scheffler, R. & Zazzali, J. (1998). Supply dynamics of the mental health workforce: implications for health policy. Milbank Quarterly, 76(1):25-58.
Katz, S., Kessler, R., Frank, R., Leaf, P., & Lin, E. (1997). Mental health care use, morbidity, and socioeconomic status in the United States and Ontario. Inquiry, 34, 38-49.
Kessler, R., Berglund, P., Bruce, M., Koch, J., Laska, E., Leaf, P., Manderscheid, R., Rosenheck, R., Walters, E., & Wang, P. (2001). The prevalence and correlates of untreated serious mental illness. Health Services Research, 36(6), 987-1007.
Kessler, R. C., Berglund, P., Chiu, W. T., Demler, O., Heeringa, S., Hiripi, E., Jin, R., Pennell, B. E., Walters, E. E., Zaslavsky, A., & Zheng, H. (2004) The US National Comorbidity Survey Replication (NCS-R): Design and field procedures. International Journal of Methods in Psychiatric Research, 13(2), 69-92.
Kessler, R., Berglund, P., Demler, O., Jin, R., Merikangas, K., & Walters, E. (2005). Lifetime prevalence and age-of-onset distributions of DSM-IV disorders in the National Comorbidity Survey Replication. Archives of General Psychiatry, 62, 593-768.
Kessler, R. C., Berglund, P. A., Zhao, S., Leaf, P. J., Kouzis, A. C., Bruce, M. L., Friedman, R. M., Grossier, R. C., Kennedy, C., Narrow, W. E., Kuehnel, T. G., Laska, E. M., Manderscheid, R. W., Rosenheck, R. A., Santoni, T. W., & Schneier, M. (1996). The 12-month prevalence and correlates of serious mental illness, In Manderscheid, R. W., & Sonnenschein, M. A. (Eds.), Mental health, United States, 1996 (DHHS Publication No. (SMA) 96- 3098, pp. 59–70). Washington, DC: U.S. Government Printing Office.
Kessler, R., Berglund, P., Demler, O., Jin, R., Merikangas, K., & Walters, E. (2007). Twelve-month prevalence of DSM-IV/WMH-CIDI disorders by sex and cohort. Retrieved December 3, 2007, from http://www.hcp.med.harvard.edu/ncs/ftpdir/table_ncsr_12monthprevgenderxage.pdf
Kessler, R. C., Demler, O., Frank, R. G., Olfson, M., Pincus, H. A., Walters, E. E., Wang, P., Wells, K. B., & Zaslavsky, A. M. (2005). Prevalence and treatment of mental disorders, 1990 to 2003. New England Journal of Medicine, 352, 2515-23.

41
Kessler, R. C., Berglund, P., Chiu, W. T., Demler, O., Heeringa, S., Hiripi, E., Jin, R., Pennell, B. E., Walters, E. E., Zaslavsky, A., & Zheng, H. (2004). The US National Comorbidity Survey Replication (NCS-R): Design and field procedures. International Journal of Methods in Psychiatric Research. 13(2), 69-92.
Klinkman, M., Schwenk, T., & Coyne, J. (1997). Depression in primary care--more like asthma than appendicitis: The Michigan Depression Project. Canadian Journal of Psychiatry, 42(9), 966-73.
Lee, R. (1991). Current approaches to shortage area designation. Journal of Rural Health, 7(4 Suppl), 437-50.
Leigh, H., Stewart, D., & Mallios, R. (2006). Mental health and psychiatry training in primary care residency programs. Part II. What skills and diagnoses are taught, how adequate, and what affects training directors' satisfaction? General Hospital Psychiatry, 28(3), 195-204.
The Lewin Group (2004). Designation of mental health professional shortage areas: assessment, analysis and recommendations. [Preliminary draft report.]
Marcus SC, Fortney JC, Olfson M, Ryan ND. (1997) Travel distance to outpatient treatment for depression. Psychiatr Services, 48(8):1005.
Marcus SC, Olfson M, Fortney JC, Ryan ND. (1997) Travel distance to subspecialty and general mental health services. Psychiatr Services, 48(6):775.
McCrone, P., & Jacobson, B. (2004). Indicators of mental health activity in London: Adjusting for sociodemographic need. London: London Development Centre for Mental Health.
McLellan, A., & Meyers, K. (2004). Contemporary addiction treatment: a review of systems problems for adults and adolescents. Biological Psychiatry, 56(10), 764-70.
Mechanic, D. (2003). Is the prevalence of mental disorders a good measure of the need for services? Health Affairs, 22(5), 8-20.
Mulhausen, R., & McGee, J. (1989). Physician need: An alternative projection from a study of large, prepaid group practices. JAMA, 261(13), 1930-1934.
Muntaner, C., Eaton, W., Diala, C., Kessler, R. & Sorlie, P. (1998). Social class, assets, organizational control and the prevalence of common groups of psychiatric disorders. Social Science and Medicine, 47(12), 2043-2053.
Myers, J. K., Weissman, M. M., Tischler, G. L., Holzer, C. E. 3rd, Leaf, P. J., Orvaschel, H., Anthony, J. C., Boyd, J. H., Burke, J. D. Jr., Kramer, M., et al. (1984) Six-month prevalence of psychiatric disorders in three communities 1980 to 1982. Archives of General Psychiatry, 41(10), 959-67.
National Institute of Standards and Technology (2002). Counties and Equivalent Entities of the United States, Its Possessions, and Associated Areas. Federal Information Processing Standards Publication 6-4.
New Freedom Commission on Mental Health (2003). Achieving the Promise: Transforming Mental Health Care in America. Final Report. DHHS Pub. No. SMA-03-3832. Rockville, MD.
Phillips, S., Burns, B., Edgar, E., Mueser, K., Linkins, K., Rosenheck, R., Drake, R., & McDonel Herr, E. (2001). Moving Assertive Community Treatment into standard practice. Psychiatric Services, 52, 771-779.
Pleis, J. R., & Lethbridge-Çejku, M. (2006). Summary health statistics for U.S. adults: National Health Interview Survey, 2005. National Center for Health Statistics. Vital Health Stat, 10(232).
Regier, D., Shapiro, S., Kessler, L., & Taube, C. (1984). Epidemiology and health service resource allocation policy for alcohol, drug abuse, and mental disorders. Public Health Reports, 99(5), 483-92.
Reinhardt, U. E. (2002). Analyzing cause and effect in the U.S. physician workforce. Health Affairs, 21(1), 165-166.
Ricketts, T. C., Goldsmith, L. J., Holmes, G. M., Randolph, R. M., Lee, R., Taylor, D. H., & Ostermann, J. (2007). Designating places and populations as medically underserved: a

42
proposal for a new approach. Journal of Health Care for the Poor and Underserved, 18(3), 567-89.
Ricketts, T. C. (2005). Workforce issues in rural areas: A focus on policy equity. American Journal of Public Health, 95(1), 42–48.
Scheffler, R., & Ivey, S. L. (1998). Mental health staffing in managed care organizations: A case study. Psychiatric Services, 49(10), 1303-1308.
Scheffler, R., & Kirby, P. (2003). The occupational transformation of the mental health system. Health Affairs, 22(5), 177-88.
Schroeder, S. A. (1996). How can we tell whether there are too many or too few physicians?: The case for benchmarking. JAMA, 11(22), 1841-1843.
Shapiro, S., Skinner, E., Kramer, M., Steinwachs, D., & Regier, D. (1985). Measuring need for mental health services in a general population. Medical Care, 23(9), 1033-1043.
Simon, G. (2002). Evidence review: Efficacy and effectiveness of antidepressant treatment in primary care. General Hospital Psychiatry, 24(4), 213-24.
Sturm, R., Ingel, J., & Anderyeva, T. (2003). Geographic disparities in children's mental health care. Pediatrics, 112(4), 308-315.
Substance Abuse and Mental Health Services Administration. (2006a). Results from the 2005 National Survey on Drug Use and Health: National Findings (Office of Applied Studies, NSDUH Series H-30, DHHS Publication No. SMA 06-4194). Rockville, MD: Author.
Substance Abuse and Mental Health Services Administration. (2006b). Transforming Mental Health Care In America, The Federal Action Agenda: First Steps. Available at http://www.samhsa.gov/Federalactionagenda/NFC_execsum.aspx
Swanson, J. W., Holzer, C. E. 3rd, Ganju, V. K., & Jono, R. T. (1990). Violence and psychiatric disorder in the community: Evidence from the Epidemiologic Catchment Area surveys. Hospital and Community Psychiatry, 41(7), 761-70.
Tarlov, A. R. (1986). HMO enrollment growth and physicians: The third compartment. Health Affairs, 5, 23-35.
Uebelacker, L., Wang, P., Berglund, P., & Kessler, R. (2006). Clinical differences among patients treated for mental health problems in general medical and specialty mental health settings in the National Comorbidity Survey Replication. General Hospital Psychiatry, 28(5), 387-95.
U.S. Census Bureau (2003). Census 2000 Public Use Microdata Sample (PUMS). [Technical Documentation.] Washington, DC: Author.
U.S. Census Bureau. (2006). County total population, population change and estimated components of population change: April 1, 2000 to July 1, 2005. Retrieved July 24, 2006, from http://www.census.gov/popest/datasets.html
U.S. Census Bureau. (2007). Population estimates data sets. Available from http://www.census.gov/popest/datasets.html
U.S. Department of Health and Human Services. (1999). Mental Health: A Report of the Surgeon General. Rockville, MD: U.S. Department of Health and Human Services, Substance Abuse and Mental Health Services Administration, Center for Mental Health Services, National Institutes of Health, National Institute of Mental Health.
U.S. Psychiatric Rehabilitation Association (2007). Certification home page. Retreived December 5, 2007 from http://www.uspra.org/i4a/pages/index.cfm?pageid=3925
Wang, P., Berglund, P., & Kessler, R. (2001). Recent care of common mental disorders in the United States. Journal of General and Internal Medicine, 15, 284-292.
Wang, P. S., Lane, M., Olfson, M., & Pincus, H. A. (2005). Twelve-month use of mental health services in the United States: Results from the National Comorbidity Survey Replication. Archives of General Psychiatry, 62, 629-640.
Weiner, J. P. (1994). Forecasting the effects of health reform on US physician workforce requirement: Evidence from HMO staffing patterns. JAMA, 272(3), 222-230.

43
Zahran, H. S., Kobau, R., Moriarty, D. G., Zack, M. M., Holt, J., & Donehoo, R. Health-related quality of life surveillance, United States, 1993-2002. MMWR Surveillance Summaries, October 28, 2005 / 54(SS04):1-35. Atlanta: Centers for Disease Control and Prevention.
Zuvekas, S. (2001) Trends in mental health services use and spending, 1987-1996. Health Affairs, 20(2), 214-224.