Development of a model of subjective feelings for the ...
13
Journal of Engg. Research Vol. 9 No. (3B) September 2021 pp. 209-221 DOI : 10.36909/jer.v9i3B.8357 Development of a model of subjective feelings for the front visual quality during automobile driving Sanghyun Kwon*, Sung Hee Ahn*, Woonjoon Kim** and Myung Hwan Yun* *Department of Industrial Engineering, Seoul National University, 08826, 1 Gwanak-ro Gwanak-gu, Seoul, South Korea **Division of Future Convergence (HCI Science Major), Dongduk Women’s University, 02748, 60 Hwarang-ro, 13-gil, Seongbuk-gu, Seoul, South Korea **Corresponding Author: [email protected] Submitted: 01/09/2019 Revised: 15/05/2020 Accepted: 10/08/2020 ABSTRACT The main goal of this study is to develop a model of subjective feelings for frontal visibility, often called the feeling of ‘openness’, for automobile drivers. Moreover, this study proposed a method to overcome the limitations of the rating scale method, although it has been used in a great number of studies. To this end, eight potential design variables of automobiles were extracted from 25 candidate design variables. A questionnaire for evaluating the openness of an automobile was developed based on these variables. By using this questionnaire, a user experiment was conducted to investigate a relationship between the feeling of openness of automobiles and the design variables. Twenty-six participants evaluated the feeling of openness and the perceived rate of the design variables for 30 automobiles. The results showed that the variables such as the height of headlining, the height of cluster housing, the inclination angle of wind shield, and the volume of A-pillar were the critical design variables affecting the feeling of openness of the automobiles. Moreover, the optimal perceived level of each design variable was found out. The results of this study can be applied to designing automobile interior for good frontal visibility. Keywords: Frontal visibility; Openness; Automobile design; Affective/Kansei engineering. INTRODUCTION New products have been generally designed and developed to meet functional demands, which are diverse, complex, and complicated. Companies had competitively made their efforts on improving functions; however, products were no longer differentiated by functional features, making their concentration shifted to emotional aspects in designing industrial products (Kim et al., 2018). In other words, the product can be superior in market if it systemically meets the demands of customers in respect to emotional elements (Nagamachi, 1995). Recently, expertise in human factors has been increasingly applied to reflect the emotional demands of users in designing or evaluating the products (Han et al., 2004; Kim et al., 2006; Kim et al., 2019; Jordan, 1998; Park et al., 2019; Yun et al., 2003). Representing affective/Kansei engineering, the cases can be considered as an attempt to substitute design variables for customers’ emotional properties by understanding users’ feeling based on their psychological state and analyzing them through statistical techniques (Nagamachi, 2002; 2008; Moon et al., 2019). The approach of affective/Kansei engineering has been developed and applied to various product designs, and many studies have been conducted in the field of automobile design (Kim et al., 2019; Ryu et al., 2020). Much research have been done regarding diverse feelings, especially related to vision, as they are emphasized in designing. Among the vision-based feelings, visual openness is important, because it enormously affects information cognition and decision making, as well as emotional satisfaction. The reason is that ninety percent of sensory
Transcript of Development of a model of subjective feelings for the ...

Journal of Engg. Research Vol. 9 No. (3B) September 2021 pp. 209-221 DOI : 10.36909/jer.v9i3B.8357
Development of a model of subjective feelings for the front visual quality during automobile driving
Sanghyun Kwon*, Sung Hee Ahn*, Woonjoon Kim** and Myung Hwan Yun*
*Department of Industrial Engineering, Seoul National University, 08826, 1 Gwanak-ro Gwanak-gu, Seoul, South Korea**Division of Future Convergence (HCI Science Major), Dongduk Women’s University, 02748, 60 Hwarang-ro, 13-gil, Seongbuk-gu, Seoul, South Korea**Corresponding Author: [email protected]
Submitted: 01/09/2019Revised: 15/05/2020Accepted: 10/08/2020
ABSTRACTThe main goal of this study is to develop a model of subjective feelings for frontal visibility, often called the feeling
of ‘openness’, for automobile drivers. Moreover, this study proposed a method to overcome the limitations of the rating scale method, although it has been used in a great number of studies. To this end, eight potential design variables of automobiles were extracted from 25 candidate design variables. A questionnaire for evaluating the openness of an automobile was developed based on these variables. By using this questionnaire, a user experiment was conducted to investigate a relationship between the feeling of openness of automobiles and the design variables. Twenty-six participants evaluated the feeling of openness and the perceived rate of the design variables for 30 automobiles. The results showed that the variables such as the height of headlining, the height of cluster housing, the inclination angle of wind shield, and the volume of A-pillar were the critical design variables affecting the feeling of openness of the automobiles. Moreover, the optimal perceived level of each design variable was found out. The results of this study can be applied to designing automobile interior for good frontal visibility.
Keywords: Frontal visibility; Openness; Automobile design; Affective/Kansei engineering.
INTRODUCTIONNew products have been generally designed and developed to meet functional demands, which are diverse, complex,
and complicated. Companies had competitively made their efforts on improving functions; however, products were no longer differentiated by functional features, making their concentration shifted to emotional aspects in designing industrial products (Kim et al., 2018). In other words, the product can be superior in market if it systemically meets the demands of customers in respect to emotional elements (Nagamachi, 1995).
Recently, expertise in human factors has been increasingly applied to reflect the emotional demands of users in designing or evaluating the products (Han et al., 2004; Kim et al., 2006; Kim et al., 2019; Jordan, 1998; Park et al., 2019; Yun et al., 2003). Representing affective/Kansei engineering, the cases can be considered as an attempt to substitute design variables for customers’ emotional properties by understanding users’ feeling based on their psychological state and analyzing them through statistical techniques (Nagamachi, 2002; 2008; Moon et al., 2019). The approach of affective/Kansei engineering has been developed and applied to various product designs, and many studies have been conducted in the field of automobile design (Kim et al., 2019; Ryu et al., 2020).
Much research have been done regarding diverse feelings, especially related to vision, as they are emphasized in designing. Among the vision-based feelings, visual openness is important, because it enormously affects information cognition and decision making, as well as emotional satisfaction. The reason is that ninety percent of sensory

Development of a model of subjective feelings for the front visual quality during automobile driving210
information comes from vision (Drury and Clement, 1978). The studies of visual openness were done on the field of residential environment. Oh and Lee (1997) regarded openness as a system of perceiving target view and concluded that the openness was closely related to the price of houses. In other words, the openness added more value for the users and acted as the factor satisfying the users more. Other studies defined the openness as the state of securing a clear view (Yoon et al., 2000; Lee and Suh, 1999). In the studies conducted to evaluate the openness, Silbernagel and Moeur (2001) suggested a regression model for the openness of view by analyzing 2D and 3D versions of graphic data. These studies, however, only focused on outside prospect or scenery and quantitatively measured the degree of the openness of virtual spaces, so that they did not evaluate the openness in cognitive aspects.
The openness should be considered as a critical factor for vehicle design because visual tasks during driving are intricately connected to drivers’ failure, which leads acute dangers (Sanders and McCormick, 1987; Owsley et al., 1991). In addition, since people rely on their visual information for about 90% of decision making on the drive (Hanson, 2000; Kang et al., 1998), the openness, which affects vision field, can be regarded as an important feeling. This signifies that feelings related to vision are needed to be considered for drivers to collect external information easily in designing vehicles.
Some previous studies related to the vision in vehicles have focused on visibility and fall into two categories: 1) exterior visibility in the aspect of security of visual perception, and 2) interior visibility in the aspect of interior components (Woodson et al., 1992; Haslegrave, 1993; Labiale, 1993). Although the studies assessed interior or exterior visibility, they discussed it from an ergonomics perspective not considering the openness from an emotional perspective.
Tanoue et al. (1997) concerned the in-vehicle openness, and in the study, visual oppression and spaciousness were selected as the affective factors that impact driver’s comfort in the vehicle, and their relationship was investigated. Nonetheless, the study did not find the influential variables and the relationship between the variables and the in-vehicle openness. The goal of this study hereby was to discover the relationship using the methodology of affective/Kansei engineering.
Under the affective/Kansei engineering methods, the design variables are subjectively assessed by the users (participants), so the variance of the collected data tends to be large. Therefore, it is required to reset the level of each design variable, by grouping the levels that had same effects on the dependent variable into a same group. Through the grouping or clustering, levels of the design variables should be modified reflecting sensitivity of users.
The methods used for clustering could be compartmentalized into ‘multiple comparison analysis’, which compares all means and ‘multivariate analysis’. An affective/Kansei engineering study on interior materials of a vehicle (You et al., 2006) is one of the examples that conducted multiple comparison analysis. In the study, the results were analyzed using analysis of variance (ANOVA) tests with satisfaction as a dependent variable and design variables scaled in categorical or continuous variable types of as independent variables. Based on the results, the levels of the significant variables were clustered using Duncan’s post hoc test. In the case of multivariate analysis, a study deducted an appropriate number of clusters using the result of k-means clustering on a pilot test with educational data (Shin and Sohn, 2001).
When the design variables were evaluated subjectively, participants’ individual dispositions should be considered, because the result tends to show an arbitrary trend without any descriptive significance (You et al., 2006). Also, the participants usually judge the object as a form of visual information subjectively in the evaluation experiment, in which the consequential ambiguity depreciates the reliability of the results. Therefore, it is required to group the level of design variables and modify the number of groups properly verifying the descriptive significance of the variables.
This study aimed to find critical design variables for perceiving the openness during driving and suggest a modeling method. Especially, the method to make evaluation results by subjective metrics was proposed to suitable for statistical analysis. The selection of critical variables was conducted by two steps: ANOVA for eliminating insignificant variables to visual openness, and a quantification theory type I for the model of subjective feelings in front visual.

211Sanghyun Kwon, Sung Hee Ahn, Woonjoon Kim and Myung Hwan Yun
METHODThe overall procedure of the experiment was as follows. Firstly, design variables, which could be perceived by
drivers from driver’s seat, were selected. Secondly, a questionnaire was developed by using these design variables. Lastly, a subjective evaluation experiment of within-subject design was conducted.
Grouping the design variable levelsIn this study, an improved method was suggested for handling measured data and systematic modeling, which
are commonly perceived as the disadvantage of affective/Kansei engineering. To solve the problems caused by rating the design variables subjectively the method to group the variable levels was introduced by applying ANOVA and clustering method. The levels of the variables were grouped when the result of clustering was descriptively interpretable. K-means clustering method was used due to its convenience to change the number of clusters. The whole process is shown in Figure 1.
Figure 1. Procedure for clustering design variables.
Design variables of a vehicleTo select design variables that affect the openness, all variables, which can be perceived while driving and took
candidate variables through previous literature reviews, as well as customer reviews related to the vehicles, were collected (You et al., 2006; Yang et al., 2015). Moreover, the variables that could be seen from the driver’s seat were listed through the actual car ride. Among all variables collected, the variables that gained a majority vote by five people who had expertise in human factors and vehicle interior were nominated. The list of candidate design variables is shown in Table 1.

Development of a model of subjective feelings for the front visual quality during automobile driving212
Table 1. The candidate design variables perceived from driver’s seat.
Design variables Descriptions
The exposure amount of ceramic coating The amount of visible ceramic coating on the edge of wind shield
Overhead console volume The size of overhead console at the ceiling above the car
Headlining height Height of the headlining at the boundary between the ceiling and wind shield
Distance to headlining Distance to the headlining at the boundary between the ceiling and wind shield for a driver
Headroom height Clearance from driver’s head to ceiling
Inside mirror position Distance between inside mirror and driver
Cluster housing height Height of cluster housing behind the wheel
Cluster housing depth Depth of cluster housing behind the wheel
Distance to wind shield Distance to wind shield for a driver
Wind shield inclination angle Perceived inclination angle of wind shield from a driver’s seat
A-pillar inclination angle Perceived inclination angle of A-pillar from a driver’s seat
A-pillar size Perceived size of A-pillar perceived from a driver’s seat
Distance to outside mirror Perceived distance to outside mirror from a driver
Gauge cluster volume Perceived volume of a gage cluster
Center console box height Perceived distance to the center console box
Center part of steering wheel Perceived volume of the center of the wheel
Door height Perceived height of the door
Door trim volume Perceived volume of the door trim
Door space Distance to the door from a driver
Center fascia inclination angle Perceived inclination angle of center fascia from a driver’s seat
Center fascia volume Perceived volume of center fascia from a driver’s seat
Sun visor volume Perceived volume of the sun visor above a driver
Mounting stay volume Width of mounting stay of the inside mirror
Distance to steering wheel Perceived distance to the wheel for a driver
The exposure amount of hood The amount of visible hood behind the wind shield
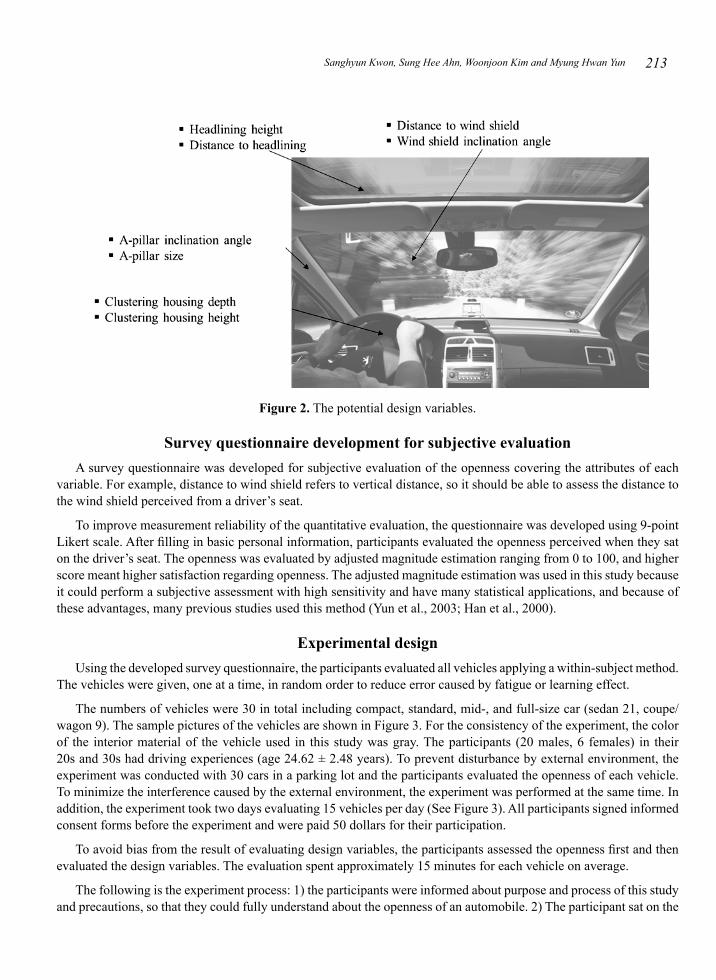
After nominating the candidate variables, focus group interviews (FGI), including five ergonomics engineers and two interior designers, were performed to select the potential design variables for the openness. Based on the results, the number of variables was narrowed down to eight, and they are as follows: Headlining height (HY), Distance to headlining (HX), Cluster housing height (CY), Cluster housing depth (CX), Distance to wind shield (WX), Wind shield inclination angle (WA), A-pillar inclination angle (AA), and A-pillar size (AV). They are shown in Figure 2.
213Sanghyun Kwon, Sung Hee Ahn, Woonjoon Kim and Myung Hwan Yun
Figure 2. The potential design variables.
Survey questionnaire development for subjective evaluationA survey questionnaire was developed for subjective evaluation of the openness covering the attributes of each
variable. For example, distance to wind shield refers to vertical distance, so it should be able to assess the distance to the wind shield perceived from a driver’s seat.
To improve measurement reliability of the quantitative evaluation, the questionnaire was developed using 9-point Likert scale. After filling in basic personal information, participants evaluated the openness perceived when they sat on the driver’s seat. The openness was evaluated by adjusted magnitude estimation ranging from 0 to 100, and higher score meant higher satisfaction regarding openness. The adjusted magnitude estimation was used in this study because it could perform a subjective assessment with high sensitivity and have many statistical applications, and because of these advantages, many previous studies used this method (Yun et al., 2003; Han et al., 2000).
Experimental designUsing the developed survey questionnaire, the participants evaluated all vehicles applying a within-subject method.
The vehicles were given, one at a time, in random order to reduce error caused by fatigue or learning effect.
The numbers of vehicles were 30 in total including compact, standard, mid-, and full-size car (sedan 21, coupe/wagon 9). The sample pictures of the vehicles are shown in Figure 3. For the consistency of the experiment, the color of the interior material of the vehicle used in this study was gray. The participants (20 males, 6 females) in their 20s and 30s had driving experiences (age 24.62 ± 2.48 years). To prevent disturbance by external environment, the experiment was conducted with 30 cars in a parking lot and the participants evaluated the openness of each vehicle. To minimize the interference caused by the external environment, the experiment was performed at the same time. In addition, the experiment took two days evaluating 15 vehicles per day (See Figure 3). All participants signed informed consent forms before the experiment and were paid 50 dollars for their participation.
To avoid bias from the result of evaluating design variables, the participants assessed the openness first and then evaluated the design variables. The evaluation spent approximately 15 minutes for each vehicle on average.
The following is the experiment process: 1) the participants were informed about purpose and process of this study and precautions, so that they could fully understand about the openness of an automobile. 2) The participant sat on the

Development of a model of subjective feelings for the front visual quality during automobile driving214
driver’s seat within the range of individual optimal frontal visual field. 3) They performed subjective assessments after paying attention to the front, upper, lower, side visual field for 10 to 20 seconds. The participant was ordered to watch the upper and lower part as seeing traffic lights and the bottom of the crash pad, respectively. Similarly, looking the side part was for the situation to look out of the car, right and left during driving. 4) The participants were not allowed to withdraw their eyes to other direction during the experiment and assessed immediately not to be biased.
Figure 3. The sample vehicles used in the experiment.
Inferring and modeling affective/Kansei variablesAfter the experiment, statistical analysis was performed using the collected data. Based on the results, the critical
design variables were drawn, and a model of subjective feelings was suggested. The detailed method used for this analysis was as follows. First, the descriptive statistics of the design variables and the openness for each participant and vehicle were analyzed. Second, ANOVA tests were conducted to find significant difference among the levels of the variables. Third, the levels of the variables were modified through a new grouping method suggested in this study; by applying k-means clustering method, the levels were bundled into two to four clusters for each variable. Then, for all cases, it was tested whether the clusters were significantly different regarding the openness. Finally, the openness was analyzed with modified levels of variables by applying quantification theory type I. According to this, the effect of the design variables and variable levels were calculated by comparing partial correlation coefficient. All statistical analyses were performed using IBM SPSS Statistics Version 23 (IBM Corp., Armonk, NY) and SAS 9.3 (SAS Institute, Cary, NC).

215Sanghyun Kwon, Sung Hee Ahn, Woonjoon Kim and Myung Hwan Yun
RESULTSDescriptive statistical analysis
The value of Cronbach’s alpha was calculated as a measure of reliability for the rating of the design variables of each vehicle. The alpha coefficient ranges in value from 0 to 1 and can be used to describe the reliability of factors extracted from dichotomous (that is, questions with two possible answers) and/or multi-point formatted questionnaires or scales (Santos, 1999). When Cronbach’s alpha value is greater than 0.6 - 0.7, it refers to as high reliability of the test result; when the value falls between 0.6 and 0.35, it is considered as fair reliability, and the value smaller than 0.35 is taken as low reliability (Nunnally, 1967). The alpha of the results of the survey was 0.684, and it means that the reliability of participants’ ratings was sufficiently acceptable.
Regarding the mean value of the design variables evaluated by each participant, the average difference between the maximum and the minimum values was 0.87, which was less than 10% for 9-point scale. This infers that the difference due to the individual variations was small comparing to other statistical results so that the individual dispositions were relatively small showing rationality of the experiment. Consequently, this would contribute the quality of the evaluation result.
Verification of significance of design variable for the openness To find critical design variables, which gave statistically significant effects on the openness among the eight,
ANOVA tests were conducted (α = 0.05) having the openness as a dependent variable and the design variables as independent variables. Assumptions such as independence, normality and homogeneity of variances were all satisfied. The result showed that all design variables had statistically significant effects on the openness (p ≤ 0.05).
Clustering and regrouping design variable levelsAs mentioned in the previous section, all eight potential design variables were significant, so the levels of the
variables had to be grouped together if they affected the openness. To this end, cluster analyses were conducted repeatedly, with varying the number of clusters from two to four for each variable. After clustering, ANOVA tests were performed to verify the number of clusters, in which the design variables had statistically significant effect on the openness.
For ANOVA tests, each design variable was selected as an independent variable and the openness was selected as a dependent variable. Duncan’s post hoc tests were also conducted to verify significant differences between the clusters. The clusters, which were not significantly different, were grouped together and used as a group in the final model. Table 2 shows the result of ANOVA and post hoc tests.
The design variable levels were regrouped based on statistical analysis and descriptive interpretability for each number of clusters. The regrouping of specific design variable levels was conducted in the following steps.
1) Only the numbers of clusters that had significant effects on the openness based on the results of the ANOVA were considered. The following cases were not considered; CY: k=2, WA: k=2, AA: k=2 or 3, and AV: k=3.
2) The cases were not considered either when descriptive interpretation was impossible because grouping did not satisfy mutual exclusiveness (when one cluster belonged to greater than or equal to two groups) based on the results of the Duncan’s post hoc test. As a result, HX: k=4, CX: k=3, WX: k=4, and AV: k=4 was not considered.
3) To verify the descriptive interpretability, whether the design variables and openness had linear or quadratic relationships was examined. The cases without a significant relationship were not considered based on the previous literature (You et al. 2006). Therefore, when the subjective response changed sharply in a narrow range due to a cubic relationship (WA: k=4), the case was not considered, because the relationship between the design variable and openness could not be explained simply.

Development of a model of subjective feelings for the front visual quality during automobile driving216
4) Finally, the appropriate numbers of clusters for each design variable were selected by analyzing the relationship trends between the number of the data for each cluster and openness. For example, in the case of the Headlining height, only 2 and 3 were considered for the appropriate cluster numbers, and the cluster number 2 was selected because 2 was more evenly distributed than 3 in terms of the number of the data. In terms of space before and after Cluster housing, the classified group was incorporated into the cluster number 2 because it was the only cluster number that remained through the above procedure.
Table 2. Statistical significance for each cluster.
Design variablesNumber of
clusters 2 3 4
Cluster 1 2 1 2 3 1 2 3 4
Headlining height (HY)significance O O O
Post hoc result A B A A B A A A B
Distance to headlining (HX)significance O O O
Post hoc result A B A B B A A/B B/C C
Cluster housing height (CY)significance X O O
Post hoc result - - A B B A B B B
Cluster housing depth (CX)significance O O O
Post hoc result A B A B A/B A B A/B A/B
Distance to wind shield (WX)significance O O O
Post hoc result A B A B B A A A/B B
Wind shield inclination angle (WA)significance X O O
Post hoc result - - A B A A B A B
A-pillar inclination angle (AA)significance X X O
Post hoc result - - - - - A A A B
A-pillar size (AV)significance O X O
Post hoc result A B - - - A/B A A B
Note: O indicates the statistically significance by the results of ANOVA, and X indicates no significance.
Development of an openness modelQuantification theory type I was conducted with the final potential design variables as independent variables and
the openness as a dependent variable. The modeling was performed by eliminating design variables in the order of those having the lowest value among design variables, whose F-value of Type III sum of squares (SS) was less than 1 by referring Heo (1998) study. Finally, the model of subjective feelings was formed by considering the design variables, whose F-value of Type III SS was greater than or equal to 1 as critical design variables.
The results of the features of each design variable focusing on centered values showed that group 1 of Cluster housing height had the most positive effect on the openness, which means that the openness increased the most when Cluster housing height increased. In addition, the variable with the greatest negative effect on the openness was the group 1 of Distance to wind shield, which means that the openness decreased when the windshield was closer to driver’s seat.

217Sanghyun Kwon, Sung Hee Ahn, Woonjoon Kim and Myung Hwan Yun
Table 3. Results of quantification theory type I for design variables.
Design Variable Variable Level
Quantified Value
Centered Value
Partial Correlation Coefficient Range
Headlining height (HY)1 -2.72 -1.54
0.23 2.722 0 1.18
Distance to headlining (HX)1 1.53 0.76
0.11 1.532 0 -0.76
Cluster housing height (CY)1 3.19 2.87
0.16 3.192 0 -0.32
Cluster housing depth (CX)1 2.08 1.46
0.156 2.082 0 -0.62
Distance to wind shield (WX)1 -2.86 -1.81
0.19 2.862 0 1.05
Wind shield inclination angle (WA)
1 -1.71 -0.12
0.25 3.022 -3.02 -1.42
3 0 1.59
A-pillar inclination angle (AA)1 -0.6 -0.04
0.03 0.602 0 0.56
A-pillar size (AV)1 -3.06 -1.22
0.28 3.062 0 1.83
Because the model based on the quantification theory type I included dummy variables, it could indicate the influence of each variable level, but the effect of each design variable had to be derived from additional calculations. The range indicates the importance of design variables based on the maximum and the minimum values among centered value of each level, and the partial correlation coefficient is expressed as (Type III SS)/(Type III SS + Error SS), where Error SS is 670.7438. All partial correlation coefficients and the range values are shown in Table 3.
The results of the partial correlation coefficients and ranges showed that the groups with a large effect and a small effect showed similar trends, although the orders of the magnitude of effects varied. The group with a large effect consisted of the Headlining height, Cluster housing height, and A-pillar size, while the group with a small effect consisted of the Distance to headlining and A-pillar inclination angle. The following Table 3 shows the results of quantification theory type I with the model consisting of eight design variables, variable levels, quantified values, centered values, the partial correlation coefficients, and ranges.
In this study, among the design variables whose F-value of Type III SS was smaller than 1 based on the results of quantification theory type I, the variable with the smallest F-value of Type III SS was eliminated, and then quantification theory type I was performed again. The model was reconducted repeatedly until a model consisting of design variables whose F-values were greater than or equal to 1 was finally established.
As a result, the A-pillar inclination angle, the Distance to the headlining, the Cluster housing depth, and the Distance to the wind shield were eliminated, and finally the Headlining height, the Cluster housing height, the Wind shield inclination angle, and the A-pillar size were selected as the critical variables. Quantification theory type I was then performed again with only the variables selected as the critical variables as independent variables and the openness as a dependent variable. The error SS of the final model was 719.4223. The following Table 4 shows the

Development of a model of subjective feelings for the front visual quality during automobile driving218
Type III Error SS of the finally derived critical design variables. The F-values of all the design variables were larger than 1.
The results of the features of design variables focusing on centered values in Table 5 showed that the level 1 of Cluster housing height was the factor that had the greatest effect on the openness with the greatest centered value of 3.97, which means that the openness increases with a greater cluster housing height. Level 2 of Wind shield inclination angle was found to be very influential in decreasing the openness, as its centered value was smallest among the design variables at -1.91.
The effect of each design variable on the openness was determined with partial correlation coefficients and ranges, as shown in Table 5. The comparisons between partial correlation coefficients and ranges indicate that the two types of statistics showed the same trend regarding the order of magnitudes of effects excluding Cluster housing height. In both cases, the order of the magnitudes of effects was wind shield inclination angle > A-pillar size > Headlining height. However, Cluster housing height was the most influential variable in terms of ranges, but the least influential variable in terms of partial correlation coefficients.
While the partial correlation coefficient results were derived while the influence of extra variances was excluded, the ranges were calculated with the model itself. The difference in the orders between the effects derived from the model and the partial correlation coefficients is since the Error SS of the model was relatively large compared to the Type III SS. Because quantification theory type 1 does not assume a specific probability model, the ranges are suggested as being a more appropriate expression method when an explanation related to the model is required. On the other hand, the partial correlation coefficients are suggested as being more appropriate to use when analyzing the influences of individual design variables.
Table 4. Results of quantification theory type I for influential variables.
Design Variable DF Type III SS Mean Square F p-value
Headlining height (HY) 1 52.04 52.04 1.74 0.200
Cluster housing height (CY) 1 43.79 43.79 1.46 0.239
Wind shield inclination angle (WA) 2 81.12 40.56 1.35 0.277
A-pillar size (AV) 1 57.01 57.01 1.90 0.181
Table 5. Results of quantification theory type I for influential variables.
Design Variable Variable Level
Quantified Value
Centered Value
Partial Correlation Coefficient Range
Headlining height(HY)
1 -2.71 -1.540.26 2.71
2 0.00 1.17
Cluster housing height(CY)
1 4.41 3.970.24 4.41
2 0.00 -0.44
Wind shield inclination angle(WA)
1 -1.49 0.41
0.32 3.802 -3.80 -1.91
3 0.00 1.90
A-pillar size(AV)
1 -2.95 -1.180.27 2.95
2 0.00 1.77

219Sanghyun Kwon, Sung Hee Ahn, Woonjoon Kim and Myung Hwan Yun
CONCLUSION
The purpose of this study was to derive critical vehicle design variables that have a significant effect on openness perceived in the driving position and to determine the relationship between design variables and the openness. The candidate design variables for perceptions in the driving position were derived from vehicle interior packaging variables, and the final potential design variables were selected among the candidate variables through the FGI and vehicle test. After selecting the candidate design variables, a questionnaire enabling subjective evaluation was developed. Using the questionnaire, a subjective evaluation experiment of within-subject design, in which 26 subjects rated openness and the design variable levels of 30 vehicles, was conducted. In this study, experiments were not conducted on all types of sedans and coupes currently on the market. When compared with the previous studies that tried to grasp the various types of affects in automobiles, it can be seen that the number of samples is similar (You et al., 2006) or rather small (Montignies et al., 2010; Yang et al., 2015; Kim et al., 2018). However, to derive a more general model of perceived openness in vehicle, it will be necessary to carry out research by adding more samples in the future.
This study analyzed statistical significance and descriptive interpretability to improve the limitations of existing common affective/Kansei engineering analytic methods. Finally, Headlining height, Cluster housing height, Wind shield inclination angle, and A-pillar size were selected as design variables. Moreover, appropriate cluster numbers for each design variable were derived, and design variable levels were grouped and restructured. The cluster analysis and application of quantification theory type 1 were performed to address the limitations of existing subjective data, including data inconsistencies, large variations across individual dispositions, and data types inappropriate for existing statistical models. This facilitated the selection of design variables that significantly influenced the openness and the determination of the effect of each design variable on the openness.
The results of the experiment showed that the magnitude of the effect of key design variables on the openness was in the following order: Cluster housing height > Wind shield inclination angle > A-pillar size> Headlining height. The results suggested that the height of the end of the headlining had the greatest effect, and the negative correlation of lower height was associated with increased openness. In addition, Wind shield inclination angle was also found to have a large effect, in which the angle and openness had a U-shape relationship, indicating the least openness in a specific angle range.
The limitations of this study were as follows. First, in the case of the sample, since the study is carried out on actual vehicles, there may be a slight difference in the color of the interior material of each manufacturer even if it is the same gray. Second, the purpose of this study is to identify the subjective feeling of openness in a vehicle through a qualitative methodology. In the future, it will be possible to carry out a study to compare the results of this study with a research on the subjective feeling in a vehicle by utilizing physiological measurement such as electromyography (EMG) and electroencephalogram (EEG).
The results of this study are expected to contribute to design variable and variable level considerations for improving openness when designing a vehicle that is linked to driver safety. In addition, the methods of modeling of variables for subjective feeling proposed in this study are expected to improve the systemization of affective/Kansei engineering methods in various products where subjective openness is expected to be important, such as HMD-VR (Rhiu et al., 2020) and Social Robot (Kim et al., 2020) in the future. Moreover, this study can be applied to handling the subjectively-rated variables. Future studies are needed regarding the potential effects of demographic factors (e.g., age and gender) on openness based on the findings of this study.
ACKNOWLEDGMENTThis study was supported by the Dongduk Women’s University grant.

Development of a model of subjective feelings for the front visual quality during automobile driving220
REFERENCESAltinsoy, M.E. & Jekosch. U. 2012. The semantic space of vehicle sounds: Developing a semantic differential with regard to
customer perception. Journal of the Audio Engineering Society, 60(1/2): 13-20.
Drury, C.G., & Clement, M.R. 1978. The effect of area, density, and number of background characters on visual search. Human Factors: The Journal of the Human Factors and Ergonomics Society, 20(5): 597-602.
Han, S.H., Yun, M.H., Kim, K., & Kwahk, J. 2000. Evaluation of product usability: development and validation of usability dimensions and design elements based on empirical models. International Journal of Industrial Ergonomics, 26(4):477-88.
Han, S.H., Kim, K., Yun, M.H., Hong, S.W., & Kim, J. 2004. Identifying mobile phone design features critical to user satisfaction. Human Factors and Ergonomics in Manufacturing & Service Industries, 14(1): 15-29.
Hanson, L. 2000. Computerized tools for human simulation and ergonomic evaluation of car interiors. Paper presented at the Proceedings of the Human Factors and Ergonomics Society Annual Meeting, 44(38): 836-839.
Haslegrave, C. 1993. Visual aspects in vehicle design. Automotive Ergonomics, 79-98.
Heo, M.H. 1998. Quantification Method I. II. III. IV. Seoul, Korea: Jahyou Academy.
Jordan, P.W. 1998. Human factors for pleasure in product use. Applied Ergonomics, 29(1): 25-33.
Kang, S.M., Paik, S.Y., & Park, P. 1998. A Study of Automotive IP Design based on the Driver`s Cognitive Characteristics. Korean Journal of the science of Emotion & sensibility, 1(2): 81-91.
Kim, I.K., Lee, C., & Yun, M.H. 2006. A Comparison of Modeling Methods for a Luxuriousness Model of Mobile Phones. Journal of The Ergonomics Society of Korea, 25(2): 161-71.
Kim, W., Ryu, T., Lee, Y., Park, D., & Yun, M.H. 2015. Modelling of the Auditory Satisfaction Function for the Automobile Door Opening Quality. The Japanese Journal of Ergonomics, 51: S478-S483.
Kim, W., Ko, T., Rhiu, I., & Yun, M.H. 2019. Mining affective experience for a kansei design study on a recliner. Applied ergonomics, 74: 145-153.
Kim, W., Lee, Y., Lee, J.H., Shin, G.W., & Yun, M.H. 2018. A comparative study on designer and customer preference models of leather for vehicle. International Journal of Industrial Ergonomics, 65: 110-21.
Kim, W., Park, D., Kim, Y.M., Ryu, T., & Yun, M.H. 2018. Sound quality evaluation for vehicle door opening sound using psychoacoustic parameters. J. Eng. Res 6: 176-190.
Kim, W., Ryu, T., Park, D., & Yun, M.H. 2019. Analysis of customers’ satisfaction with automobile exterior panel stiffness: focus on the hood and doors of mid-sized sedan. Journal of Engineering Research, 7(2).
Kim, W., Kim, N., Lyons, J.B., & Nam, C.S. 2020. Factors affecting trust in high-vulnerability human-robot interaction contexts: A structural equation modelling approach. Applied Ergonomics, 85: 103056.
Labiale, G. 1993. Visual detection of in-car warning lamps as a function of their position. Vision in Vehicles, 4: 291-9.
Lee, W.J., & Suh, J.Y. 1999. Estimating of High-rise Apartment Openness by 3D Simulation program. The Journal of GIS Association of Korea, 7(1): 29-37.
Montignies, F., Nosulenko, V., & Parizet, E. 2010. Empirical identification of perceptual criteria for customer-centred design. Focus on the sound of tapping on the dashboard when exploring a car. International Journal of Industrial Ergonomics, 40(5): 592-603.
Moon, S., Park, S., Park, D., Kim, W., Yun, M.H., & Park, D. 2019. A Study on Affective Dimensions to Engine Acceleration Sound Quality Using Acoustic Parameters. Applied Sciences, 9(3): 604.
Nagamachi, M. 1995. Kansei engineering: a new ergonomic consumer-oriented technology for product development. International Journal of Industrial Ergonomics, 15(1): 3-11.
Nagamachi, M. 2002. Kansei engineering as a powerful consumer-oriented technology for product development. Applied Ergonomics, 33(3): 289-94.
Nagamachi, M. 2008. Perspectives and the new trend of Kansei/affective engineering. The TQM Journal, 20(4): 290-8.

221Sanghyun Kwon, Sung Hee Ahn, Woonjoon Kim and Myung Hwan Yun
Nunnally, J.C. 1967. Psychometric theory, 226: McGraw-Hill New York.
Oh, K., and Lee, W. 1997. Estimating of the Value of Landscape Visibility Within Apartment Housing Prices. Journal of the Korea Planners Association, 32(3): 139-51.
Owsley, C., Ball, K., Sloane M.E., Roenker, D.L., & Bruni J.R. 1991. Visual/cognitive correlates of vehicle accidents in older drivers. Psychology and aging, 6(3): 403.
Park, D., Park, S., Kim, W., Rhiu, I., & Yun, M.H. 2019. A comparative study on subjective feeling of engine acceleration sound by automobile types. International Journal of Industrial Ergonomics, 74: 102843.
Rhiu, I., Kim, Y.M., Kim, W., & Yun, M.H. 2020. The evaluation of user experience of a human walking and a driving simulation in the virtual reality. International Journal of Industrial Ergonomics, 79: 103002.
Ryu, T., Son, B., & Kim, W. 2020. Analysis of perceived exertion and satisfaction in the opening and closing of tailgates of SUVs. International Journal of Industrial Ergonomics, 80: 103033.
Sanders, M.S., & McCormick, E.J. 1987. Human factors in engineering and design: McGRAW-HILL book company.
Santos, J.R.A. 1999. Cronbach’s alpha: A tool for assessing the reliability of scales. Journal of extension, 37(2): 1-5.
Shin, H.W., & Sohn, S.Y. 2001. Comparing Classification Accuracy of Ensemble and Clustering Algorithms Based on Taguchi Design. Journal of the Korean Institute of Industrial Engineers, 27(1): 47-53.
Silbernagel, J., & Moeur, M. 2001. Modeling canopy openness and understory gap patterns based on image analysis and mapped tree data. Forest Ecology and Management, 149(1): 217-33.
Tanoue, C., Ishizaka, K., & Nagamachi, M. 1997. Kansei Engineering: A study on perception of vehicle interior image. International Journal of Industrial Ergonomics, 19(2): 115-28.
Woodson, W.E., Tillman, B., & Tillman, P. 1992. Human factors design handbook: information and guidelines for the design of systems, facilities, equipment, and products for human use.
Yang, E., Ahn, H.J., Kim, N.H., Jung, H.S., Kim, K.R., & Hwang, W. 2015. Perceived interior space of motor vehicles based on illusory design elements. Human Factors and Ergonomics in Manufacturing & Service Industries, 25(5): 573-84.
Yoon, J.S., Sim, M.K., Lee, K.H., & Koo, A.H. 2000. A Study on Words Representing Human Visual Sensibility in Residential Environment. Korean Journal of the science of Emotion & sensibility, 3(2): 67-74.
You, H., Ryu, T., Oh, K., Yun, M.H., & Kim, K.J. 2006. Development of customer satisfaction models for automotive interior materials. International Journal of Industrial Ergonomics, 36(4): 323-30.
Yun, M.H., Han, S.H., Hong, S.W. & Kim, S. 2003. Incorporating user satisfaction into the look-and-feel of mobile phone design. Ergonomics, 46(13-14): 1423-40.