Development of a discovery-based organic chemistry lab module ...
135
Development of a discovery-based organic chemistry lab module: Evaluation of student attitudes and ability to interpret spectroscopy By Leah J. Martin A Dissertation Submitted in Partial Fulfillment of the Requirements for the Degree of Doctor of Philosophy in Mathematics and Science Education Chemical Education Concentration Middle Tennessee State University December, 2014 Dissertation Committee: Dr. Norma Dunlap, Chair Dr. Dana Fuller Dr. Pat Patterson Dr. Amy J. Phelps Dr. Michael J. Sanger
Transcript of Development of a discovery-based organic chemistry lab module ...

Development of a discovery-based organic chemistry lab module: Evaluation of student
attitudes and ability to interpret spectroscopy
By
Leah J. Martin
A Dissertation Submitted in Partial Fulfillment
of the Requirements for the Degree of
Doctor of Philosophy in Mathematics and Science Education
Chemical Education Concentration
Middle Tennessee State University
December, 2014
Dissertation Committee:
Dr. Norma Dunlap, Chair
Dr. Dana Fuller
Dr. Pat Patterson
Dr. Amy J. Phelps
Dr. Michael J. Sanger

ii
I want to dedicate this dissertation to my mother, husband, and family whose
encouragement and faith contributed to the completion of this research.

iii
ACKNOWLEDGMENTS
I first want to thank God for all the many answered prayers during this time,
especially for patience. Thanks to my wonderfully supportive family for allowing me to
take time away from home to work on this research. Luke Martin has been extremely
patient and understanding of my time spent away. Brenden and Gabe Martin have pulled
the extra weight at home surpassing my expectations.
I offer my sincere gratitude to Dr. Norma Dunlap, my major professor for her
encouragement, patience, and unending support. She has been there from the beginning
with kind and persistent words, pushing me towards completion when necessary. This
research would not have been possible without her leadership and dedication to
education. She is an inspiring educator who truly believes in continually improving
students’ experiences and their understanding of organic chemistry. I want to thank Dr.
Dana Fuller for her service on my dissertation committee, all the extra help with the
statistical analysis of the research, and the much needed encouragement. I am very
grateful for the multiple meetings of an hour, sometime more, guiding me through the use
of SPSS and helping me with the interpretation of data. I also want to thank Dr. Michael
Sanger, Dr. Amy Phelps, and Dr. Pat Patterson for being on my committee, helping me
prepare for the presentations on this research, the thoughtful comments and professional
advice. A special thanks to Dr. Pat Patterson for the many years of mentoring and help
with not only this research, but my career and health.

iv
This dissertation could not have been completed without the cooperation of the
organic faculty, especially Dr. Handy, Dr. Friedli, and Dr. Stewart, who contributed to
the validation of the survey used in this research. They have all been very supportive of
conducting this research and improving the organic laboratories. I offer a special thanks
to Dr. Handy for his encouragement. I also want to thank his graduate student Zack
Taylor, who is always working, for making sure I made it safely to my jeep the many
evenings I stayed on campus late.
Finally, I would like to thank the MSE program and Department of Chemistry for
financial support during this degree program.

v
ABSTRACT
Laboratories are a central component of the undergraduate organic chemistry
curriculum. For years, educators have questioned the effectiveness of laboratories in
science classes, their impact on students’ learning, and what constitutes an effective
laboratory experience. This research examines the addition of a discovery-based (guided
inquiry) component to the traditional organic chemistry laboratories at Middle Tennessee
State University and its effect on students’ abilities to interpret NMR spectroscopy and
their attitudes toward the laboratory.
Students in two groups of organic chemistry laboratories were compared. One
group used the traditional stand-alone laboratories on the topics of distillation,
chromatography and spectroscopy. In the traditional laboratories, students were given
the same step-by-step instructions and the outcomes of the laboratory experiments were
known. The other group used a three-week discovery-based unit on terpene isolation and
characterization incorporating the same three topics. Although the students were
provided with basic procedures, each group of students used similar, but not identical
procedures. The outcomes of this unit were predictable, but often unspecified to the
students.
At the end of the term, students’ understanding of spectroscopy and their attitudes
toward the laboratory were measured using a survey. The survey grouped the
spectroscopy content into four categories: predicting number of signals, splitting patterns,
fitting spectroscopic data to chemical structures, and assigning signals on a spectrum to

vi
the atoms in a given structure. The students’ attitudes toward spectroscopy and the
laboratory in general were measured using a Likert scale. Although there were no
significant differences in the spectroscopy content knowledge of the two groups, students
in the discovery-based laboratory generally scored higher on the content portion of the
survey. Students from the discovery-based laboratory also had stronger opinions,
whether positive or negative, about their ability to interpret 1H-NMR than the students in
the traditional lab. Anecdotal evidence suggests that the nature of the discovery-based
unit led students and instructors to think more critically about separation techniques and
interpretation of spectral data.
vii
TABLE OF CONTENTS
PAGE
LIST OF TABLES .......................................................................................................................... ix
LIST OF FIGURES ......................................................................................................................... x
LIST OF APPENDICES ................................................................................................................. xi
CHAPTER I: INTRODUCTION .................................................................................................... 1
Introduction .................................................................................................................................. 1
Experiential Learning................................................................................................................... 3
Experiential learning and science laboratories in higher education ....................................... 5
Background of Study ................................................................................................................... 7
Laboratory styles ..................................................................................................................... 8
Students’ attitudes .................................................................................................................. 10
Statement of Purpose ................................................................................................................. 13
CHAPTER II: REVIEW OF RESEARCH IN ORGANIC CHEMISTRY LABS........................ 14
Research on Lab Styles in Organic Chemistry .............................................................................. 14
Research on Students’ Attitudes in Organic Chemistry Labs ........................................................ 16
CHAPTER III: METHODOLOGY .............................................................................................. 22
Introduction ................................................................................................................................ 22
Overview of Population Used for Study .................................................................................... 23
Traditional Labs ......................................................................................................................... 25
Discovery-Based Lab ................................................................................................................. 26

viii
Instrument .................................................................................................................................. 28
Data Analysis ............................................................................................................................. 32
Content knowledge ................................................................................................................. 33
Attitudes ................................................................................................................................. 34
Grades .................................................................................................................................... 35
CHAPTER IV: RESULTS AND CONCLUSIONS ..................................................................... 36
Content-Based Questions Results .............................................................................................. 36
Multiple choice/short answers ............................................................................................... 36
Assigning signals on given spectrum ..................................................................................... 36
Content-based analysis by instructor ..................................................................................... 38
Attitude Question Results .......................................................................................................... 40
Predicted Grades Compared to Actual Grades .......................................................................... 42
Limitations of the Study............................................................................................................. 42
Discussion .................................................................................................................................. 44
Content-based portion of the survey ...................................................................................... 44
Attitude portion of the survey ................................................................................................. 46
Conclusions ................................................................................................................................ 47
Future work ............................................................................................................................ 50
REFERENCES .............................................................................................................................. 52
APPENDICES ............................................................................................................................... 62

ix
LIST OF TABLES
TABLE PAGE
Table 1: Summary of laboratory styles ......................................................................9
Table 2: General lab schedules ..................................................................................23
Table 3: Chemical shifts of p-anisaldehyde and eugenol ..........................................31
Table 4: Likert-scale questions related to attitude .....................................................32
Table 5: Chi-square of independence: Multiple choice/short answer content items. 37
Table 6: Results for multiple choice/short answer items based on instructors ..........38
Table 7: Results for interpretation of spectra based on individual instructors ..........39
Table 8: Chi-square test of independence on students’ attitude items .......................41
Table 9: Residuals of individual significant Likert items ..........................................41
Table 10: Quality points assigned for grades .............................................................42

x
LIST OF FIGURES
FIGURES PAGE
Figure 1: Common compounds isolated in the discovery-based unit .......................27
Figure 2: Example questions on predicting number of signals .................................29
Figure 3: Example questions on splitting patterns in 1H-NMR ................................29
Figure 4: Example questions on fitting spectral data to structure .............................30

xi
LIST OF APPENDICES
APPENDICES PAGE
APPENDIX A: Publication in Advances in Teaching Organic Chemistry ...............63
APPENDIX B: Instructional Review Board Approval ..............................................75
APPENDIX C: Traditional Distillation Lab ..............................................................76
APPENDIX D: Traditional Column Chromatography Lab .......................................86
APPENDIX E: Traditional Spectroscopy Lab ...........................................................92
APPENDIX F: Discovery-Based Lab Unit................................................................98
APPENDIX G: Survey ..............................................................................................105
APPENDIX H: Spectroscopy of Essential Oils .........................................................113
APPENDIX I: Screen Plot for Factor Analysis of Likert Scale Survey ....................124

1
CHAPTER I: INTRODUCTION
Introduction
Middle Tennessee State University (MTSU) has the largest undergraduate
enrollment of any university in Tennessee. In 2012 the undergraduate enrollment was
approximately 22,300 students, which was 88 percent of the university’s total enrollment.
(Office of Institutional Effectiveness, Planning and Research, 2012).
Each Fall semester approximately 300 students enroll in CHEM 3010, the first
organic chemistry class in a two course sequence. The CHEM 3010 course has a
required laboratory component, which is CHEM 3011. Students who enroll in organic
chemistry are typically pre-professional or science majors in their sophomore or junior
year. The overall course is worth four credit hours including the laboratory component,
which comprises about 25 percent of the overall course grade. For the laboratory
component, students meet once a week for three hours, and they are required to complete
pre-lab exercises before coming to lab as well as write a lab report due one week after the
completion of lab.
Because of the Complete College Tennessee Act (CCTA) passed in 2010, part of
MTSU’s funding formula is now linked to student retention and graduation. Since
colleges that produce more degrees are rewarded with more money, MTSU and other
colleges in Tennessee have a strong vested interest in having students successfully
complete courses in which they are enrolled to advance towards degree completion
(Kelderman, 2012). Since the academic majors in science, technology, engineering, and

2
mathematics (STEM) are inherently challenging, it is important to keep students engaged
in their course work so that they will succeed and eventually graduate (Barr, Gonzalez, &
Wanat, 2008). For example, during the 2013-2014 academic year, approximately 20
percent of students withdrew from or failed CHEM 3010. This requires students to either
repeat it at a later time or change majors. Indeed, the new funding formula has been a
catalyst for the university to explore and promote experiential learning techniques across
the disciplines.
Effective organizations are mission driven. The mission of MTSU and the
College of Basic and Applied Sciences (CBAS) emphasizes student engagement and
experiential learning. Part of the university’s mission statement notes that the university
is “committed to preparing students to thrive in their chosen professions and a changing
global society.” (Retrieved April 8, 2014, from http://www.mtsu.edu/about/mission.php).
Experiential learning is also a central component of the CBAS mission statement. The
CBAS mission states:
“Within an environment that values excellent teaching and fosters
initiatives in research and public service, the mission of the College of Basic and
Applied Sciences at MTSU is to:
• Prepare individuals for successful careers in scientific and technical fields in
industry, teaching, government, and health services.
• Provide general education through exposure and exploration of natural sciences,
applied sciences, and mathematics.

3
• Provide "hands-on" experience with state-of-the-art materials and equipment.
• Promote the development and practice of critical thought and expression.
• Develop basic knowledge and promote attitudinal skills and other abilities needed
for further graduate or professional study.”
(Retrieved April 8, 2014, from http://www.mtsu.edu/cbas/mission_statement.php)
The organic chemistry lab provides a perfect opportunity for students to gain
"hands-on" experience with a variety of materials and equipment. The nature of the
course and lab requires students to think critically. With the exposure to instrumentation
and scientific thinking, students should be more prepared to excel in the scientific
technical field or continue on in graduate studies. Because of funding and mission, it is
imperative to continually examine and assess the structure, pedagogical techniques, and
learning outcomes of organic chemistry labs at this time and at this university.
Experiential Learning
Although experiential learning has been practiced to some extent for the past
thirty years, its application to higher education has never been more important than in the
current academic setting that emphasizes student retention. Made popular by John Kolb
in the 1980s, experiential learning is described as “learning by doing”. It is based on
social and cognitive psychology and philosophy. Kolb developed cycles of the
experiential learning model (ELM) based on previous pedagogical and cognitive

4
development research by John Dewey (1938), Jean Piaget (1971), and Kurt Lewin
(Marrow, 1975).
Kolb (1984) credited Dewey for his philosophical perspective of pragmatism and
his progressive education movement. Dewey has often been recognized for his
contributions to the philosophy of learning through experience and its relation to learning
theory (Waks, 2013). He was a pioneer of the pedagogical methods of experiential
learning and reflective thought. Dewey’s progressive education theory places the
emphasis of teaching and learning away from the teacher-centered lectures and focuses
on the student’s experience, ideally in activities that are relevant to their lives. Dewey is
often referred to as the father of modern education based on his progressive approach.
Jean Piaget, who is well known for his study of cognitive development in
children, proposed that children learn through interactions between themselves and their
environment (Kolb,1984). He defined four stages of childhood development from birth to
adulthood. Sensory motor is the first stage, ranging from birth to two years of age.
Children experience and manipulate objects in this stage. The second stage is the
preoperational stage, where children learn through pretend play. This stage usually
occurs around two to seven years of age. During the concrete operational stage, age
eight to eleven, children think more logically, but their thoughts can still be rigid, and
they struggle with abstract and hypothetical thinking. Finally in adolescence to
adulthood they reach the formal operational stage. This is the stage where they increase
their logic and can use deductive reasoning, leading to better understanding of abstract

5
ideas. Piaget’s work stopped at adolescence, but Kolb and others have extended his
research to adult learning, as people are lifelong learners (Malerstein & Ahern, 1979).
Kolb also credited Kurt Lewin for his contribution to action research through
social psychology. Studying group dynamics, Lewin developed the laboratory training
method and the T-group training, which were fact-finding cycles of experience, data
collection, and observations (Glassman, Erdem, & Bartholomew, 2013; Kolb, 1984). His
ideas of cycles shaped the action research method, which uses a cycle of planning, action,
data collection, and reflection.
From these works, Kolb (1984) derived three models of the experiential learning
method (ELM). The models outlined a holistic approach to learning and all have four
main cycles: concrete experience, reflective observation, abstract conceptualization or
hypothesis, and active experimentation. Kolb credits this model for the emphasis on
learning through doing, "the process whereby knowledge is created through the
transformation of experience” (Kolb, 1984, p. 38). Traditional ELM in formal education
has been around for many years. Apprenticeships, internships, work study programs,
cooperative education, studio arts, laboratory studies, and field study are all examples of
what is considered traditional ELM.
Experiential learning and science laboratories in higher education
Experiential learning is at the heart of science laboratories in higher education.
The idea that students are learning how to be scientists by being given the experience in

6
an actual lab setting is a driving force of the importance of science laboratories. Students
are experiencing scientific phenomena first-hand rather than merely thinking about
scientific principles in the abstract. Chemistry labs are experience-based and are natural
places for social interactions and the cycle of ELM. Laboratories provide a hands-on,
collaborative environment. The labs are typically designed so that students have smaller
groups to actively engage in learning and naturally build educational communities for
students. Providing students with a sense of involvement is strongly linked to retention
(Tinto, 2005).
Although the purposes of science laboratories in higher education are debated,
most will agree that there is a need for students to have an opportunity for experiential
learning (Johnstone, 1977; Hofstein & Lunetta, 1982; Kirschner & Meester, 1988;
Hofstein & Mamlok-Naaman, 2007; Reid & Shah, 2007). The purpose of labs has
shifted from the Industrial Revolution of the 1800s, when the goal was to turn out skilled
workers for industry or research laboratories (Reid & Shah, 2007). As education evolved
with the advancement of technology and instrumentation, the role of labs has shifted as
well. A recent national survey assessed faculty goals for the undergraduate chemistry
laboratories (Bruck & Towns, 2013). This survey revealed that there were some
universal goals, but the emphasis varied according to discipline. The study categorized
undergraduate labs into five disciplines: general chemistry, organic chemistry, analytical
chemistry, physical chemistry, and upper-division chemistry. Some goals were universal
across disciplines, such as, research experience, critical thinking, and experimental

7
designs. Group work or team work is emphasized less in the organic chemistry
laboratories than in other disciplines. However, developing techniques, keeping accurate
notebooks, and writing reports are emphasized more in organic laboratories than in other
disciplines.
The emphasis for all disciplines is in line with the overall goals of the organic labs
at MTSU. The major focus is the hands-on aspect of lab, so that students may think more
critically and gain problem-solving skills that follow them in and out of the classroom.
This aligns with the CBAS’s mission statement that places emphasis on experiential
learning and hands-on practice with state of the art equipment.
Background of Study
In the wake of changes in the funding formula and mission, that are designed to
promote quality education, educators are continually looking for ways to improve student
learning and pedagogical practices. This idea of continual improvement drives research
for better teaching methods in organic chemistry laboratories. Can the organic
laboratories be more effective? Are the laboratories designed in such a way that students
are actively engaged and enjoying the learning process? Are they retaining the
knowledge that they have gained? These questions suggest that there are many different
ways to improve organic laboratories with experiential learning in the laboratory setting.
The scope of this research is to determine if there are better ways to achieve this than the
current laboratory curriculum.

8
Nuclear magnetic resonance (NMR) spectroscopy is the primary tool used by
organic chemists for determining molecular structures. In 2004 MTSU received a
National Science Foundation (NSF) grant for hands-on-learning to purchase a 300MHz
NMR for student use. Since then, interpretation of spectroscopy has become a major
component of both the lecture and the laboratory at MTSU. Many of the laboratories in
organic chemistry are designed so that the students attain hands-on experience with the
latest scientific equipment. The students are getting the hands-on experience, but are
they understanding and able to interpret spectroscopy? In an attempt to make the
laboratories more effective in reaching this learning goal, this research looks at student
outcomes for the interpretation of spectroscopy and their attitudes towards the laboratory.
There are many different ways to approach experiential learning in lab, so it is important
to determine what makes an effective laboratory.
Laboratory styles
Domin’s review of laboratory styles (1999) classified chemistry lab instructional
styles based on outcome, approach, and procedure. The outcome is either predetermined
or undetermined. If it is predetermined, then it is predetermined by the instructor only or,
in some cases, by both instructor and student. Domin (1999) defines the approach as
either deductive, “in which students apply a general principle toward understanding a
specific phenomenon”, or inductive, where “observing particular instances, students drive
the general principle” (p. 543). The procedure is either given to the student via lab
manual or instructor, or it is generated by the student. Domin classified chemistry

9
laboratory instructional styles into four categories: expository, inquiry, discovery, and
problem-based. These four styles are summarized below in Table 1.
Table 1
Summary of laboratory styles
Outcome Approach Procedure
Expository Predetermined Deductive Given
Inquiry Undetermined Inductive Student generated
Discovery Predetermined Inductive Given
Problem-based Predetermined Deductive Student generated
Expository, also known as cookbook, verification, or traditional style, is the style
used most often in undergraduate chemistry laboratories. Domin (1999) defined this type
of lab as a deductive approach where students are given a problem and step-by-step
instructions on how to reach a pre-determined outcome that both student and instructor
know. The concepts addressed in the laboratory are covered in lecture before the lab is
performed. The advantages of this lab style include the ease of lab preparation and
training of teaching assistants, however expository labs involve little critical thinking
(Gallet, 1998; Pavelich & Abraham, 1979; Hofstein & Lunetta, 1982).
Inquiry style labs have undetermined outcomes and use an inductive approach.
The procedure is generated by the students, who take the role of the scientists as
undergraduate researchers. Although this lab style has been credited with keeping
students engaged and having an overall positive attitude toward the lab, it can be difficult

10
to implement (Merritt, Schneider, & Darlington, 1993; Kern &Carpenter, 1984; Ajewole,
1991). Students are learning new concepts and also using unfamiliar lab equipment and
techniques. Because students have not had opportunities to practice novel techniques,
this style has been criticized for placing too much demand on the short-term memory
(Linn, 1977; Herron & Herron, 1971; Lunetta & Tamir, 1981).
Problem-based labs have predetermined outcomes that generally only the
instructor knows and this approach uses a deductive reasoning. The instructor asks a
question or series of questions and the students are asked to answer based on their current
understanding of the concepts, which have already been covered in the course. Materials
are given to students, but they generate the procedure.
Discovery styles have predetermined outcomes that generally only the instructor
knows. The approach is inductive by nature, and a general procedure is given to the
students. Ideally, students perform the lab before the material is presented in lecture,
aiding in the discovery of the results. This style has been criticized because of the extra
time needed and the possibility that the desired outcome might not be discovered (Peters,
1967).
Students’ attitudes
A person’s attitude can affect his or her ability to succeed at tasks and their
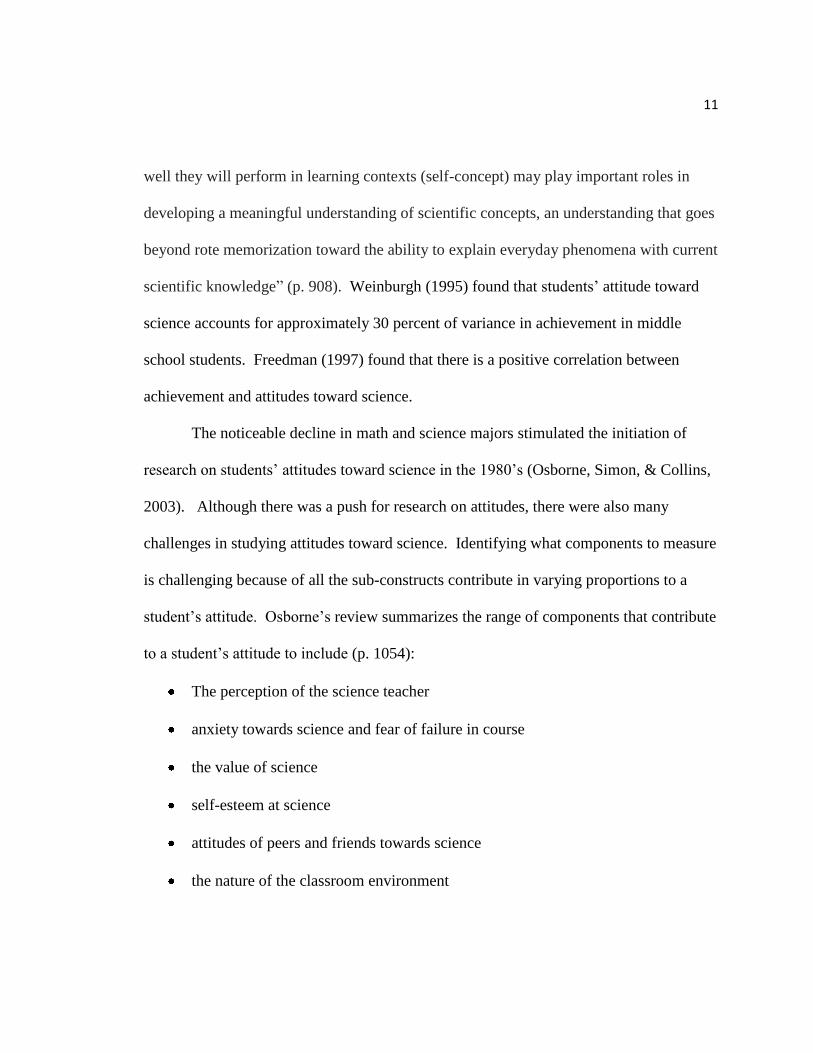
overall enjoyment or how much they get out of an experience. Nieswandt (2007) stated
that “Students’ interests and attitudes toward science as well as their perceptions of how
11
well they will perform in learning contexts (self-concept) may play important roles in
developing a meaningful understanding of scientific concepts, an understanding that goes
beyond rote memorization toward the ability to explain everyday phenomena with current
scientific knowledge” (p. 908). Weinburgh (1995) found that students’ attitude toward
science accounts for approximately 30 percent of variance in achievement in middle
school students. Freedman (1997) found that there is a positive correlation between
achievement and attitudes toward science.
The noticeable decline in math and science majors stimulated the initiation of
research on students’ attitudes toward science in the 1980’s (Osborne, Simon, & Collins,
2003). Although there was a push for research on attitudes, there were also many
challenges in studying attitudes toward science. Identifying what components to measure
is challenging because of all the sub-constructs contribute in varying proportions to a
student’s attitude. Osborne’s review summarizes the range of components that contribute
to a student’s attitude to include (p. 1054):
The perception of the science teacher
anxiety towards science and fear of failure in course
the value of science
self-esteem at science
attitudes of peers and friends towards science
the nature of the classroom environment

12
achievement in science
Another notable challenge in studying attitudes toward science is the relationship
between behavior and attitudes. Glasman and Albarracín (2006) concluded that attitudes
that are easy to access and are predictors of future behavior. This has great implications.
If students come into a course confident, their behavior will reflect the confidence and
they have more potential to succeed. This also suggests that if they lack confidence, then
their behavior will be determined by their negative attitude and, without intervention,
they may not have great academic success.
One of the main challenges in research of student attitudes is determining or
developing an appropriate instrument. With so many factors that influence attitudes
toward science including gender, personality, structural variability, and curriculum
variables, researchers must consider many different aspects when choosing the correct
instrument and there are many limitations in developing an appropriate instrument.
Instruments have been criticized because they only measure one aspect of an individual’s
view, and they usually do not take into account most of the factors that can be influential
(Osborne et al., 2003).
Bandura (1997) defines self-efficacy as a person’s belief in their ability and
capabilities. So in academia, this translates to a student’s expectation or belief in their
ability to achieve, often in terms of grades (Bong & Skaalvik, 2003). Students tend to
overestimate their ability in terms of grades. This is particularly true of students with

13
lower GPA’s and students in lower division courses compared to ones with higher GPA’s
or ones in upper division courses (Nowell & Alston, 2007).
Statement of Purpose
The purpose of this research was to investigate potential improvements to the
organic chemistry laboratory. This research looked at the specific learning objective of
interpretation of spectroscopy in the organic chemistry laboratory. The control group
used the current laboratory curriculum at MTSU, which is a series of stand-alone
expository labs designed to teach several separation techniques, and NMR spectroscopy.
The treatment group participated in a multi-week discovery-based unit that covered the
same techniques. The discovery-based unit was designed in a multi-week series, not
stand alone individual laboratories.
This research also looked at students’ attitudes toward the laboratory in general
and specifically toward the spectroscopy content component. Students’ predictions of
their expected final lab grades and lecture grades were also compared to their actual
grades earned in both the laboratory and course to see how their opinions compared to
their actual ability. Although most studies on curriculum variables show little if any
meaningful information on effect (positive or negative) attitude (Osborne et al., 2003),
this research was designed to determine if there was a difference in attitudes between the
two groups and if there was an impact on achievement, as perceived from the student, to
the actual grade earned.

14
CHAPTER II: REVIEW OF RESEARCH IN ORGANIC CHEMISTRY LABS
Research on Lab Styles in Organic Chemistry
Dunlap and Martin (2012) published an overview of discovery-based labs in
organic chemistry that have occurred in the last fifteen years. The entire article is listed
in Appendix A. In summary, the article placed the organic discovery-based laboratories
into three categories:
Identifying unknowns
“Unknowns” are samples given to the students with no identification.
Students use various means to determine the identities of the unknowns.
Reaction analysis
This category is the analysis of the conversion of one compound to
another based on reaction type.
Isolation and purification
Techniques are used to purify mixtures and isolate pure compounds.
Identifying unknowns can be expository in nature, but there was an example lab
published in which the design made the laboratory discovery-based. In the discovery-
based lab, multiple structures were given that were structurally similar, giving rise to
more discussion and critical thinking. Melting point, infrared spectroscopy (IR), and
NMR were used to determine the identity of the unknown (Glagovich & Shine, 2005).
There were also several “unknown” laboratories reported that involved reactions where
15
the reactant was an unknown and, based on the identification of the product obtained
through spectral data such as IR and NMR, the reactant was identified. These reactions
included oxidation of unknown alcohols, nitration of unknown arenes, dehydration of
unknown alcohols, and nucleophilic additions to unknown carbonyl compounds (Dunlap,
Mergo, Jones, & Martin, 2006; Dragojlovic & Nielsen, 2003; McElveen, Gavardinas,
Stamberger & Mohan, 1999; Rosenberg, 2007).
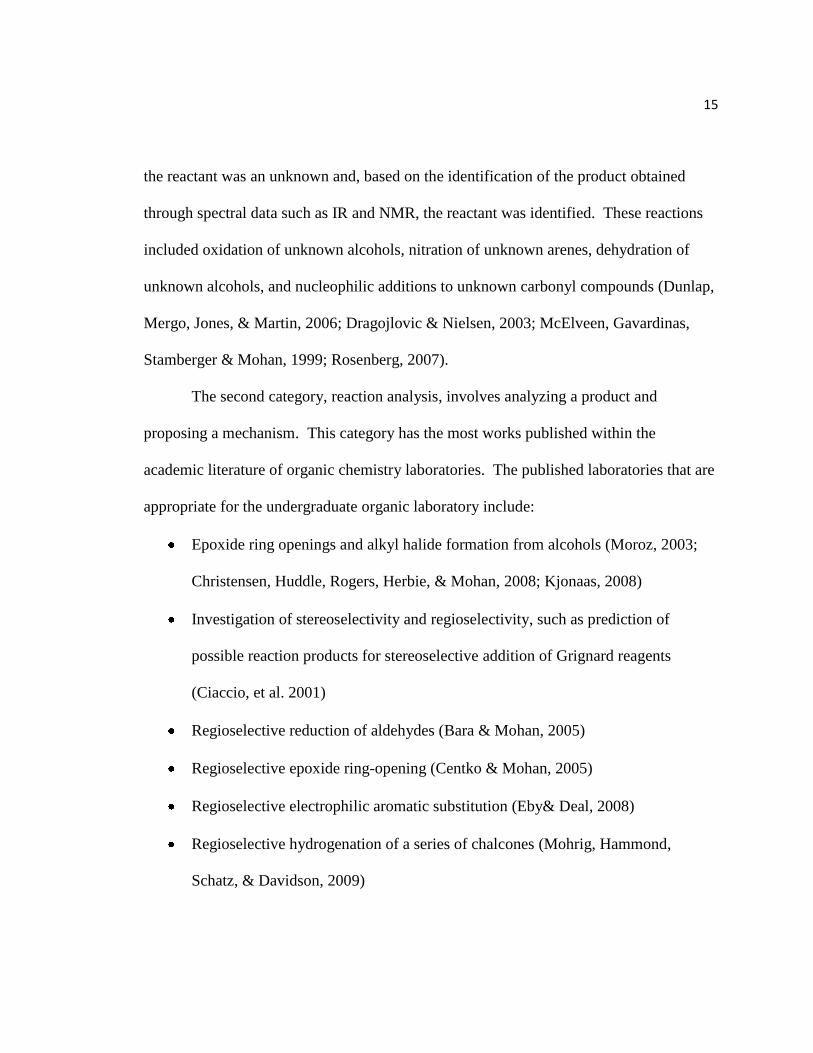
The second category, reaction analysis, involves analyzing a product and
proposing a mechanism. This category has the most works published within the
academic literature of organic chemistry laboratories. The published laboratories that are
appropriate for the undergraduate organic laboratory include:
Epoxide ring openings and alkyl halide formation from alcohols (Moroz, 2003;
Christensen, Huddle, Rogers, Herbie, & Mohan, 2008; Kjonaas, 2008)
Investigation of stereoselectivity and regioselectivity, such as prediction of
possible reaction products for stereoselective addition of Grignard reagents
(Ciaccio, et al. 2001)
Regioselective reduction of aldehydes (Bara & Mohan, 2005)
Regioselective epoxide ring-opening (Centko & Mohan, 2005)
Regioselective electrophilic aromatic substitution (Eby& Deal, 2008)
Regioselective hydrogenation of a series of chalcones (Mohrig, Hammond,
Schatz, & Davidson, 2009)

16
The final category of organic discovery-based labs is isolation and purification.
The common techniques taught are distillation, recrystallization, and chromatography.
Most labs involving isolation and purification are extensions of traditional labs that have
been designed so that students use different reagents or use different techniques to purify
their samples, and then they compare their results (Horowitz, 2003). Stoub (2009)
published a laboratory where students purify a “poisoned” Excedrin sample using these
isolation and purification techniques. Another laboratory has students isolate two
isoflavones, osajin and pomiferin, from osage orange fruits (Whaley, et al., 2007).
From the published discovery-based laboratories in organic chemistry, few had
thorough assessments of the effectiveness. Although it was speculated that students were
more enthusiastic in discovery-based labs, and that they were more independent in lab,
most had only informal assessments based on observations of students’ questions in class.
(Horowitz, 2003; Whaley, et al., 2007). Stoub (2004) used informal observations, but
also used student evaluations, end of the year assessments, and notebook reflections to
assess the effectiveness of his laboratories. Perhaps the most in-depth assessment was
done by Mohrig (2009), who had students take an anonymous online survey giving their
perceptions and their opinion of the effectiveness of the laboratory. It also addressed the
effectiveness of the teaching assistants.
Research on Students’ Attitudes in Organic Chemistry Labs
There are few actual studies that focus only on students’ attitude in the organic
chemistry laboratory. Most studies in organic chemistry focus on attitudes in the
17
chemistry course or in general science laboratoriess. For example, there have been
studies comparing the effect of anxiety on students’ overall chemistry attitude, organic
chemistry achievement, and self efficacy (Kurbanoğlu, 2013; Kurbanoğlu & Akin, 2012),
research on the effect of Process-Oriented, Guided-Inquiry (POGIL) lecture techniques
and students’ attitudes on their performance in the POGIL class (Chase, Pakhira, &
Stains, 2013), and gender differences related to attitude (Turner & Lindsay, 2003). Two
heavily studied areas related to student attitudes in organic chemistry courses involve the
use of computers and on-line homework (Parker & Loudon, 2013), and the use of
attitudes as predictors for computer-based education (Kevin, Liberty, & Texas
University, 1975).
Studies looking directly at attitudes in the organic chemistry laboratory are
limited. Cooper and Kerns (2006) studied how students’ attitudes and perceptions were
affected by type of lab they participate in, whether traditional or problem-based. They
used qualitative assessments such as observations, video tapes, interviews, and open-
ended questionnaires to determine effectiveness. Ten participants from the problem-
based laboratories were randomly chosen to be interviewed for approximately thirty
minutes and were asked about laboratories, science classes, teaching assistants,
professors, and laboratory course they were taking. Example questions were “What has
been your best lab experience? Why? What did you enjoy the most or least?” (Cooper &
Kerns, 2006, p. 3). From theses interviews, a theme about student groups and instructors
emerged. The students perceived both peer groups and instructors as either good or bad.

18
Students from both groups answered the open-ended questionnaire. Both
problem-based and traditional groups liked the overall atmosphere and hands-on aspect
of the laboratory. Students in the problem-based labs viewed the role of the instructor
and students differently than that of the traditional laboratories. The problem-based
group viewed the role of the instructor as a guide to help students toward the correct
conclusions, whereas the traditional laboratory viewed the role of the instructor as
supervisor. The role of the student in the problem-based laboratory was to figure out why
and to understand versus the traditional laboratory where the student role was much more
passive in nature. The researchers concluded that students in the problem-based
laboratory group were more confident and self-reliant than in the traditional group.
A study at Seattle University looked at organic chemistry laboratory students’
attitude toward safety in the laboratory (Alaimo, Langenhan, Tanner, & Ferrenberg,
2010). The traditional laboratory safety training was presented the first day of class with
a four module lay out. The safety modules included topics of risk management, chemical
toxicity, chemical spill and waste collection, and safety equipment. In the traditional
laboratory, the instructor included lab safety and waste disposal as part of the laboratory
briefing for each individual experiment at the time they were performed.
The safety-team curriculum used the same modules the first day of class, but
added a hands-on activity. There were different samples of chemicals at each laboratory
station that the students had to dispose of properly. Each student was provided with
gloves that had been treated with commercial glow powder, of which the students were
19
unaware. After their waste disposal activity and lab station clean up, a black light was
used to see contamination on door handles, student clothes, notebooks, and other areas in
the laboratory. Instead of having the instructor do the safety briefing as part of the
weekly experiment, two to three students were assigned to safety teams weekly. Their
duties were to present a five minute safety presentation that detailed hazards and risks
associated with that day’s experiment. They also made handouts that outlined the four
safety areas: chemical hazards, procedural hazards, personal protective equipment (PPE),
and waste collection. Although the laboratory instructor was responsible for the overall
laboratory safety, the safety team would take turns walking through the laboratory to
ensure appropriate PPE, proper labeling, and no experiments were left unattended. They
were in charge of post laboratory inspection which entailed that all areas of the laboratory
were properly cleaned and equipment was put away.
The instrument used to measure attitudes was a 37-item questionnaire composed
of two parts; multiple choice/true-false questions, and five-point Likert-scale questions.
The participants were from three groups: 1) the safety-team organic lab section, 2) the
traditional organic lab section from the previous year, and 3) a section of general
chemistry that used the traditional style for safety. Participants voluntarily and
anonymously took the survey. The safety-team group performed either better or the same
as the two traditional groups. Breaking it down by discipline, the safety-group did thirty
percent better than the traditional organic laboratories and fifty-seven percent better than
the traditional general chemistry laboratories. All other questions were not significantly

20
different, indicating there was no differences between the groups. Based on informal
observations, the researchers concluded that students who participated in the safety-team
group exhibited “increased sophistication with respect to PPE use, waste collection, and
lab cleanliness” and they sensed an overall more professional atmosphere in the
laboratory (p. 860).
This next study could fall under computer animations research however, the
animations used were directly related to organic chemistry lab and were designed as a
pre-lab exercise for an extraction of caffeine from an aqueous solution lab. Supasorn,
Jones, and Vibuljan (2008) designed two very similar interactive animations on organic
extractions to show the molecular level of extractions. One was narrated only and the
other used written text. This research compared advantages of different delivery
strategies, text or oral narrative information, within simulations on content knowledge of
extractions and attitudes.
First semester organic chemistry students were randomly assigned to each group,
where they watched the animation as a pre-laboratory exercise. A six question pre and
post-cognitive test about organic extraction was used to assess content knowledge on
lower-order cognitive skills involving simple recall or simple application, and higher-
order cognitive skills which require synthesis and analysis. A sixteen item Likert-scale
questionnaire and two open-ended questions were used to assess students’ attitudes
toward the animations and lab. It was found that students in the written text group
performed higher on the lower-order cognitive skills section, the students in the narrative

21
had more positive attitudes toward the value of the instructional animation tool in
general.
As summarized in the preceding section, there has been a great deal of research in
students’ attitude in lab in general chemistry. However, the research is limited in the
organic chemistry lab. Some of the research from general chemistry may be
transferrable, but more research is needed in this area.
22
CHAPTER III: METHODOLOGY
Introduction
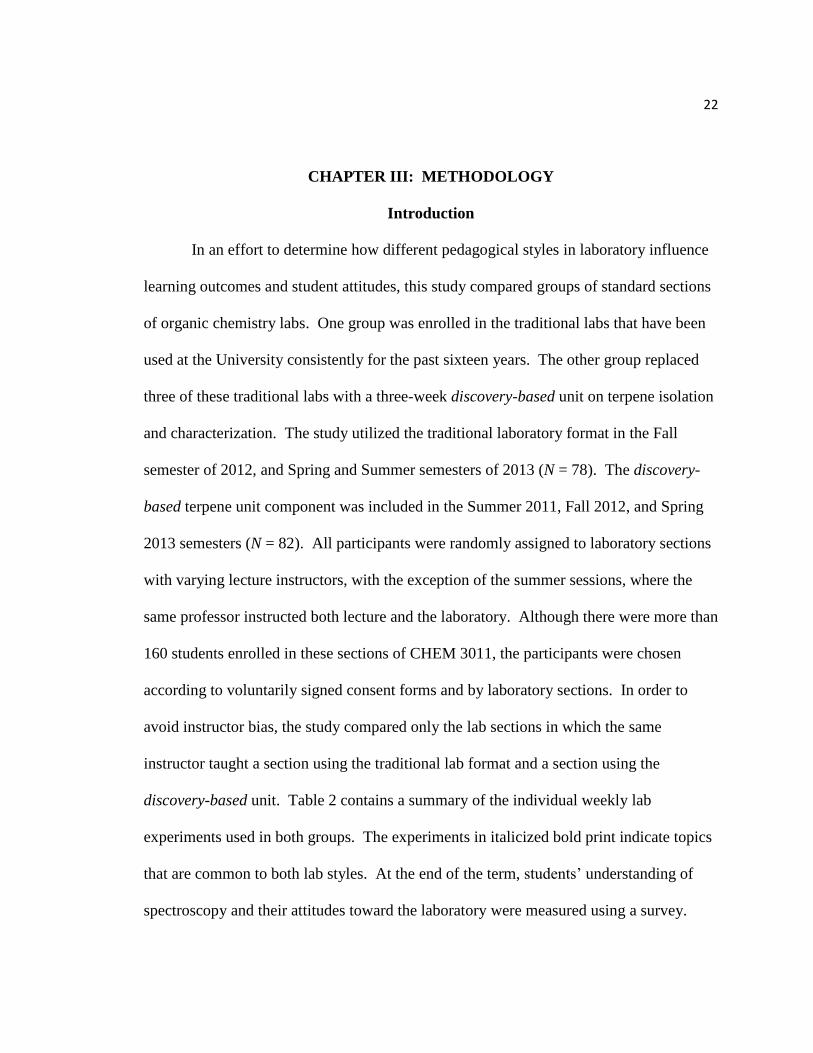
In an effort to determine how different pedagogical styles in laboratory influence
learning outcomes and student attitudes, this study compared groups of standard sections
of organic chemistry labs. One group was enrolled in the traditional labs that have been
used at the University consistently for the past sixteen years. The other group replaced
three of these traditional labs with a three-week discovery-based unit on terpene isolation
and characterization. The study utilized the traditional laboratory format in the Fall
semester of 2012, and Spring and Summer semesters of 2013 (N = 78). The discovery-
based terpene unit component was included in the Summer 2011, Fall 2012, and Spring
2013 semesters (N = 82). All participants were randomly assigned to laboratory sections
with varying lecture instructors, with the exception of the summer sessions, where the
same professor instructed both lecture and the laboratory. Although there were more than
160 students enrolled in these sections of CHEM 3011, the participants were chosen
according to voluntarily signed consent forms and by laboratory sections. In order to
avoid instructor bias, the study compared only the lab sections in which the same
instructor taught a section using the traditional lab format and a section using the
discovery-based unit. Table 2 contains a summary of the individual weekly lab
experiments used in both groups. The experiments in italicized bold print indicate topics
that are common to both lab styles. At the end of the term, students’ understanding of
spectroscopy and their attitudes toward the laboratory were measured using a survey.

23
This research format was approved by seven members of the MTSU Chemistry
Department as well as by the Institutional Review Board (see Appendix B).
Table 2
General lab schedules
Traditional Discovery-based
CHECK IN, including safety worksheet CHECK IN, including safety worksheet
Crystallization and Melting Point Crystallization and Melting Point
Distillation of Cyclohexane/Toluene and
Gas Chromatography
Distillation of Cyclohexane/Toluene and
Gas Chromatography
Column Chromatography/Isolation of
Caffeine
Column Chromatography/Isolation of
Caffeine
Molecular Modeling of Isomers Molecular Modeling of Isomers
Infrared/NMR Spectroscopy Steam distillation of terpenes/TLC Synthesis of 1-Bromobutane Column chromatography/data collection Elimination of Cycloalkanols/NMR NMR analysis/product identification Spartan Modeling of Subst. and Elim Spartan Modeling of Subst. and Elim
Spartan Modeling of Alkene Reactions Elimination of Cycloalkanols/NMR and
Alkene Epoxidation Alkene Epoxidation The experiments in italicized bold print indicate topics that are common to both lab styles
Both group’s lab grades were determined by formal lab report write-ups and three
quiz grades. The reports were formatted with an introduction, table of reagents,
procedure, observations, calculations, results and conclusion, and they were graded on a
ten point scale. Both groups were graded using the same scale.
Overview of Population Used for Study
Although there are typically a total of nine CHEM 3011 sections in the Fall and
two in the Spring and Summer sessions per year at MTSU, only four sections were used

24
for each group in this study. The four sections of CHEM 3011 assigned as the traditional
laboratory were taught by four separate instructors, all of whom also taught a section of
the discovery-based laboratory. The instructors were coded using letters A through D.
The Fall 2012 sections were taught by instructor A (N = 21) and instructor D (N = 21).
The Spring semester 2013 laboratory was taught by instructor C (N = 21), and the
Summer sections both 2011 and 2013, were taught by instructor B (N = 15).
At the end of each semester, the students filled out a survey that was designed to
measure their ability to interpret spectroscopy as well as their attitudes about the
laboratory. Regardless of their laboratory section and instructor, all students in all
sections received five extra credit points for submitting a fully completed survey to
ensure that the students would take the survey seriously.
The sections of CHEM 3011 that participated in the discovery-based laboratory
data were taught by the same four instructors who taught the traditional sections applied
in this study. The Fall 2012 sections were taught by instructor A (N = 16) and instructor
D (N = 19). The Spring semester 2013 laboratory was taught by instructor C (N = 32),
and the Summer semester section was taught by instructor B (N = 15). At the end of each
semester, the students were given the same survey designed to measure their ability to
interpret spectroscopy and their attitudes about the laboratory. These students also
received the five extra credit points for total completion of the survey.

25
Traditional Labs
The traditional laboratories covered separation techniques and spectroscopy in
separate laboratory activities. These were unrelated individual experiments performed in
one three-hour lab period per experiment. In the distillation laboratory, students
separated a 50:50 mixture of cyclohexane and toluene via simple or fractional distillation.
The laboratory experiment provided step-by-step instructions, and students knew what
the outcome should have been. Gas chromatography was used to obtain percent
composition of the separated components (see Appendix C).
Extraction and chromatography were the other separation techniques students
learned in CHEM 3011. In the traditional laboratory, students extracted caffeine from
instant tea and purified the caffeine using column chromatography (see Appendix D).
They used thin-layer chromatography (TLC) to calculate a retention factor (Rf ), which
was used to validate that the recovered compound was caffeine. Again, students were
given step-by-step instructions, and they knew that they were all going to isolate the same
compound, caffeine.
In these traditional laboratories, lab instructors taught spectroscopy using a
“cookbook” approach to identify an unknown (see Appendix E). A table of possible
structures was given, and students systematically ruled out possibilities by process of
elimination based on data obtained by infrared spectrometry (IR) and nuclear magnetic
resonance (NMR) spectroscopy. Functional groups were identified using IR, and NMR
was used to further characterize and identify their unknown.

26
Discovery-Based Lab
The discovery-based unit (see Appendix F) focused on separation and purification
methods as well as spectroscopy, which are typical components of the undergraduate
organic chemistry laboratory curriculum. Rather than three unrelated experiments,
students carried their initial material through a three week sequence. This laboratory
sequence combined some separation and purification methods and spectroscopy into one
three-week guided inquiry sequence. Techniques included steam distillation, extraction,
TLC, column chromatography, and NMR spectroscopy. After conducting some initial
research, students chose common herbs and spices used in kitchens, grown in gardens, or
purchased from local grocery stores. In the first week students carried out steam
distillation of an herb or spice, using short-path distillation equipment, to separate the
volatile components or essential oil from the plant material. Students were encouraged to
bring in materials of interest to them, as long as there was some distinguishable odor.
They were also required to carry out pre- laboratory research to find two to five expected
volatile compounds from their chosen plant material. At the end of the distillation, the
organic material was separated from the water by liquid-liquid extraction.
The second week focused on chromatography, both TLC and column. Lab
instructors guided students to find a TLC system in which the component from week one
had an Rf of 0.25-0.75. They had access to several ethyl acetate/hexane mixtures to aid
them in identifying the number of components present. Based on their TLC data, they
chose which solvent to use for a gradient column, and then isolated the individual

27
compounds. In the second week, students also collected 1H NMR,
13C NMR, and in
some cases Distortionless Enhancement by Polarization Transfer (DEPT), Correlation
Spectroscopy (COSY), and Heteronuclear Multiple Quantum Coherence (HMQC) data.
Going back to the original pre- laboratory assignment, they determined which compounds
they had isolated. Some common compounds isolated are shown in Figure 1. For
instance, linalool and linalool acetate were found in lavender, basil was a source of
eugenol, and rosemary has several components: α-pinene, pinene, and borneol.
linalool linalool acetate
OCH3
OH
eugenol borneol
alpha-pinene
O
(S)-carvone
O
(R)-carvone
HO
thymol
pinene
cinnamaldehyde
OH
H
O
H
HO
O
O
H H
Figure 1. Common compounds isolated in the discovery-based unit.
In the third week, students presented their spectral data, as well as their methods,
to each other in class. This included crude percent recovery and the percent recovery of

28
each component of their crude sample, Rf of each component, and the structure(s) of
major components based on spectroscopy. Like the traditional laboratory grade, the
grade was based on written reports and quizzes.
Instrument
The survey used to measure students’ ability to interpret spectroscopy and
attitudes toward organic chemistry laboratoriess was internally validated by five organic
chemistry professors and two chemical education professors at Middle Tennessee State
University. The survey originally contained nine short answer/multiple choice questions,
two actual 1H spectra of para-anisaldehyde and eugenol, and fifteen Likert-scale
questions about students’ attitudes in lab. The entire survey can be found in Appendix G.
The survey items were carefully designed to represent four sub-sets of skills:
predicting number of NMR signals, splitting patterns, fitting data to a possible structure,
and assigning signals on a given spectrum to a given chemical. The first sub-set was
based on the ability of students to predict the number of signals expected for a given
compound for both 1H-NMR and
13C-NMR (see Figure 2). These questions were
designed to measure students’ ability to identify planes of symmetry and chemically
equivalent carbons or hydrogens in given molecules.
The second sub-set required students to recognize splitting patterns in 1HNMR
(see Figure 3). The hydrogens on carbon five are next to two equivalent hydrogens.

29
For each of compounds, A, B, and C, indicate how many signals would be seen in either
the 1H or
13C-NMR spectrum, whichever is listed. (Just give the number of signals, NOT
the splitting or chemical shift).
Compound A Compound B Compound C 1H-NMR
1H-NMR
13C-NMR
O
Figure 2. Example questions on predicting number of signals.
What would be the splitting pattern for the hydrogens on carbon 5 in a 1H-NMR?
1- doublet
2- triplet
3- quartet
4- multiplet (complex)
What would be the splitting pattern for the hydrogens on carbon 4 in a 1H-NMR?
1- doublet
2- triplet
3- quartet
4- multiplet (complex)
Figure 3. Example questions on splitting patterns in 1H-NMR.
The hydrogens on carbon four are next to non-equivalent hydrogens. If students
understood the “n + 1” rule, ideally they chose “triplet” and “multiplet” respectively as
their answer.
The third sub-set of questions required students to fit 1HNMR or
13C NMR data
to a given structure (see Figure 4). Students were given a chart for their use of chemical
5
4

30
shifts for both 1H-NMR and
13C-NMR. They were not being measured on their ability to
memorize chemical shifts but rather to apply them. This sub-set required more higher-
order thinking skills on the part of the student. They needed to recognize not only the
number of signals, but they were also expected to be able to understand the chemical
environment to determine an estimate of the chemical shift. Splitting patterns and
integration values were also included in the data set for the 1H-NMR question.
Which 13C-NMR data matches the following compound?
1- 16, 21, 41, 205
2- 16, 41, 75
3- 16, 41, 205
4- 16, 21, 41, 75
OH
1- 20, 25, 28, 29, 32, 35, 62
2- 20, 25, 32, 64
3- 20, 25, 28, 69, 72, 110, 120
4- 20, 25, 32, 110
Which 1H-NMR data matches the following compound?
1- 1.3 (t, 3H), 1.6 (t, 2H), 3.8 (t, 2H), 2.0 (s, 6H), 2.8 (broad s)
2- 1.3 (t, 3H), 1.6 (m, 2H), 1.8 (t, 2H), 2.0, 3.8 (t, 6H), 2.8 (broad s)
3- 1.3 (t, 3H), 1.6 (m, 2H), 1.8 (t, 2H), 2.0 (s, 3H), 2.1 (s, 3H), 2.8 (broad s)
4- 1.3 (t, 3H), 1.6 (m, 2H), 1.8 (t, 2H), 2.0 (s, 6H), 2.8 (broad s)
Figure 4. Example questions on fitting spectral data to structure.
The final sub-set of questions dealt with assigning signals on a given spectrum.
For this, the survey provided a 1H NMR spectrum of p-anisaldehyde and eugenol (see
H
O
OH

31
Appendix G). Students identified as many signals as they could based on the labeled
compounds. These questions were assessed separately because there was not a single
correct answer. Of the two spectra, p-anisaldehyde was considered to be the easiest to
interpret. This compound had six assigned groups of hydrogens to label whereas eugenol
had eight. The chemical shifts are summarized in Table 3.
Table 3
Chemical shifts of p-anisaldehyde and eugenol.
p-anisaldehyde
H3CO
O
3.6 (s, 3H), 6.9 (d, 2H), 7.8 (d, 2H), 9.8 (s, 1H)
Eugenol
OCH3
OH
3.2 (d, 2H), 3.9 (s, 3H), 5.1 (m, 2H), 5.5 (s, 1H), 6.0 (m, 1H), 6.7 (d, 2H), 6.9 (d, 1H)
In addition to the survey questions that measured spectroscopy content, the survey
also included questions designed to assess student attitudes about organic chemistry
laboratoriess. There were thirteen Likert-scale questions, broken down into two factors:
1) students’ attitudes about spectroscopy content, and 2) students’ attitudes about the
laboratory in general. The Likert-scale was based on a scale of one to five, in which one
was strongly disagree, two was disagree, three was undecided, four was agree, and five

32
was strongly agree. All questions are presented in Table 4, where the asterisk indicates
questions that were worded negatively, where “strongly disagree” is favorable and coded
reversely to reflect that in the analysis.
Table 4
Likert-scale questions related to attitude.
Factor: Students’ attitude about spectroscopy content
The labs enhanced my ability to interpret 1HNMR
The labs enhanced my ability to interpret 13
CNMR
The labs enhanced my ability to interpret IR
*The labs did not help me learn spectroscopy
Factor: Students’ attitude about the lab in general
The lab design made interpreting spectra meaningful and gave a sense of purpose
How much did you like the overall lab
I found this semester labs to be fun
*I found this semester labs to be confusing
*I found this semester labs to be frustrating
This semester, lab has increased how much I like science in general
This lab has helped me gain useful knowledge
I have benefited from taking this lab
I learned interesting new things in lab
Questions cut from analysis
The labs were easy
The labs were challenging
* indicates statements that were reverse coded
Data Analysis
Statistical results were generated using Microsoft EXCEL and SPSS software and
the significance was set at an alpha level of 0.05. The multiple choice/ short answer

33
questions were coded with one being a correct response and zero being an incorrect
response. Cronbach’s alpha was used for reliability on the multiple choice/short answer
content questions. This test measured the internal consistency of the instrument.
Desirable alpha values are close to one and indicate greater internal consistency; values
of 0.7 or higher are preferred (Nunnally, 1978, p. 245). The item-total correlation was
used to determine if any questions in the survey had responses that varied differently than
other questions, which could affect the overall reliability of the instrument. One of the
original short answer/multiple choice questions was not included in the survey analysis
based on the correlated item-total correlation (0.030). Items that correlate near zero are
generally discarded (Nunnally, 1978, p. 263). Once the question was removed, the
Cronbach alpha went from 0.65 to 0.68.
Content knowledge
The independent samples t-test was used to analyze the differences in the total
percent correct score on the multiple choice/short answer section of the survey between
the traditional laboratory and discovery-based laboratory. The independent samples t-test
was also used for the two questions that involved assigning signals on a spectrum of p-
anisaldehyde and eugenol. Cohen’s d analysis was used on the content-based questions,
for the multiple choice/short answer and the two spectra items to measure effect size.
Cohen’s d examines the ratio of the differences in means to the pooled variance for
practical significance, no longer using sample size, which could affect the power of the

34
study. Cohen (1992) defines a small d effect size as 0.20, medium as 0.50, and a large as
0.80.
A chi-square test of independence was used to test each multiple choice/short
answer item. This test was used to test for differences in distributions of responses
between the two groups. A Cohen’s w was used on each chi-square test of independence
to measure effect size. Cohen (1992) defines a small w effect size as 0.10, medium as
0.30, and a large as 0.50.
Attitudes
For the Likert section of the survey, the questions were coded numerically, one
was strongly disagree, two was disagree, three was undecided, four was agree, and five
was strongly agree. Factor analysis with a Promax rotation was used to group the survey
questions. Two factors were selected based on the eigenvalues (see Appendix I)
(O’Connor, 2000). The questions were categorized into two factors: attitudes about lab
in general (nine questions) and attitudes about spectroscopy content (four questions).
Two questions were not highly correlated with either factor, so they were not used in the
analysis. See Table 4 for the factor items. Independent samples t-tests were used to
compare the means of the two factors between traditional and discovery-based lab
students. The Cohen’s d was also reported.
A chi-square test of independence was used to see if the distributions of item
responses for a given item differed between the traditional lab group and the discovery-
based lab group (Howell, 2013). For the questions with significant chi-square test

35
statistics, the residuals with an absolute value near or greater than two were used to
determine how the responses differ between the two groups. The Cohen’s w was also
reported.
Grades
The independent samples t-test was used to analyze the difference in students’
self-reported expected grades in both CHEM 3011 laboratory and CHEM 3010 lecture
and their actual grades earned. The grades were given quality points based on the scale
outlined in Table 5 which ranged from zero for an F to four for an A. The Cohen’s d was
also reported.

36
CHAPTER IV: RESULTS AND CONCLUSIONS
Assessment of the effect of the discovery-based unit was carried out using a
survey that included content-based questions measuring students’ abilities to interpret
spectroscopy and attitude-based questions. The statistical analysis was divided into three
categories: content-based questions (multiple choice/short answer and assigning signals),
attitude-based questions, and content-based questions analyzed by each instructor
involved in the study.
Content-Based Questions Results
Multiple choice/short answers
There were eight multiple choice/short answer content-based questions included
in this analysis. No significant differences were found between the traditional laboratory
participants’ overall score (N = 78, M = 47.92, SD = 27.58) and the discovery-based
laboratory participants’ overall score (N = 82, M = 49.39, SD = 27.14), t(158) = 0.34, p =
0.865, d = 0.05). Additionally when each multiple choice/short answer item was
compared, there were no significant differences between the two groups’ responses to
any question. The results for the individual items are summarized in Table 5.
Assigning signals on given spectrum
The two spectra questions were analyzed separately then the multiple choice/short
answer section because these had multiple correct responses. The p-anisaldehyde
spectrum was scored on a scale from zero to six, with six indicating that all signals were

37
identified correctly. The eugenol spectrum was scored in a similar way, with eight
indicating all signals identified correctly.
Table 5
Chi-square of independence: Multiple choice/short answer content items
% Correct
Question Structure Traditional Discovery-
based
χ 2
p w
Students indicate how
many signals would be
seen in either the 1H or
13C-NMR
O
57.7 % 70.7 % 2.96 0.085 0.14
48.7 % 41.5 % 0.85 0.357 0.07
52.6 % 43.9 % 1.20 0.273 0.09
Students match 13
C-
NMR data to the
compounds
OH
52.6 % 54.9 % 0.09 0.769
0.02
38.5 % 36.6 % 0.06 0.806 0.02
Students match 1H-
NMR to the compound
35.9 % 34.1 % 0.05 0.826 0.02
Students predict the
splitting pattern for the
hydrogen on the
numbered carbon 4 or 5
for a 1H-NMR
34.6 % 48.8 % 3.30 0.069 0.14
62.8 % 64.6 % 0.05 0.811 0.02
df = 1 N = 160
There was no significant difference between the traditional laboratory
participants’ score for the p-anisaldehyde spectrum (N = 78, M = 55.77, SD = 31.99) and
4
5

38
the discovery-based laboratory participants’ score (N = 82, M = 63.82, SD = 28.43),
t(158) = 1.69, p = 0.122, d = 0.27. The results were similar for the eugenol spectrum;
traditional laboratory (N = 78, M = 24.04, SD = 19.92) and the discovery-based
laboratory (N = 82, M = 29.73, SD = 25.20), t(158) = 1.58, p = 0.093, d = 0.25, indicating
no significant difference.
Content-based analysis by instructor
To avoid instructor bias, the groups were also compared based on individual
instructors. This study only included data from paired sections with the same instructor
teaching a traditional laboratory and a discovery-based laboratory. Although there were
no significant differences for the multiple choice/short answer part of the survey, all the
means, with exception of instructor B, are higher for the discovery-based group than the
traditional group. The results are summarized in Table 6.
Table 6
Results for multiple choice/short answer items based on instructors
Traditional Discovery-based t p d
Instructor A M = 44.64
SD = 31.52 N = 21
M = 48.44
SD = 24.10 N= 16
0.40 0.691 0.14
Instructor B M = 71.67
SD = 20.30 N =15
M = 68.33
SD = 21.06 N = 15
-0.44 0.662 0.16
Instructor C M = 36.90
SD = 24.52 N = 21
M = 41.41
SD = 30.53 N = 32
0.57 0.574 0.16
Instructor D M = 45.24
SD = 21.82 N = 21
M = 48.68
SD = 21.61 N = 19
0.50 0.619 0.16
39
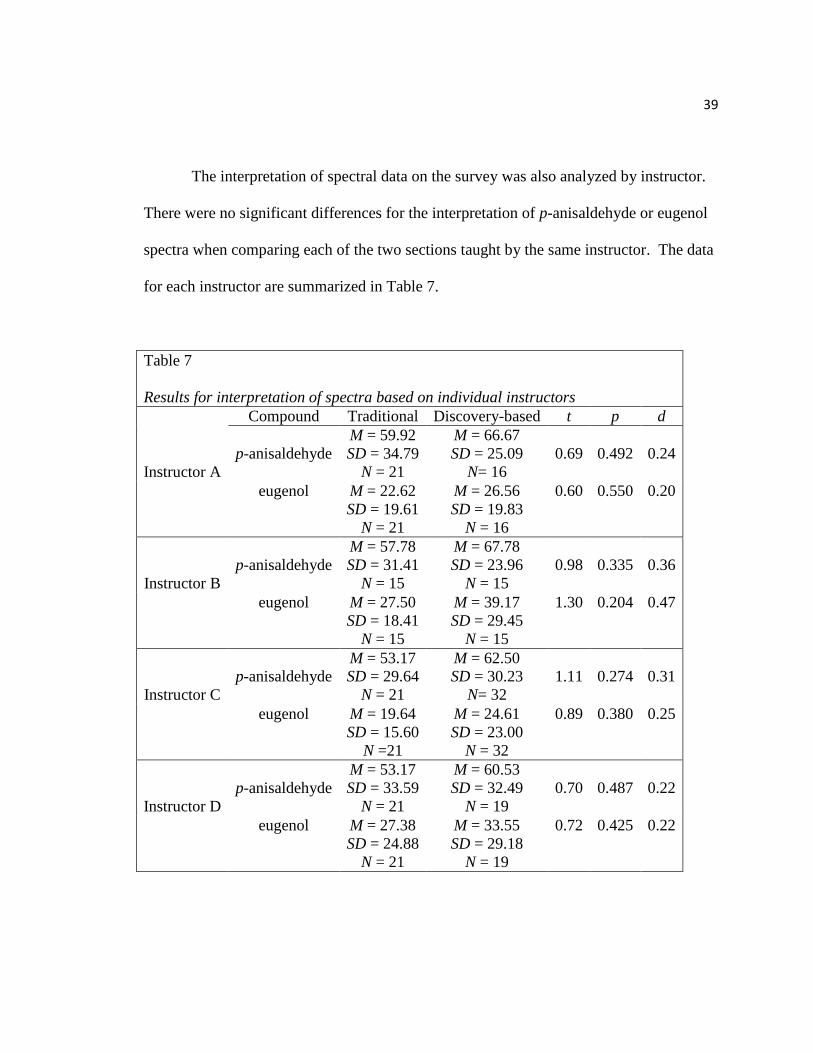
The interpretation of spectral data on the survey was also analyzed by instructor.
There were no significant differences for the interpretation of p-anisaldehyde or eugenol
spectra when comparing each of the two sections taught by the same instructor. The data
for each instructor are summarized in Table 7.
Table 7
Results for interpretation of spectra based on individual instructors
Compound Traditional Discovery-based t p d
Instructor A
p-anisaldehyde
M = 59.92
SD = 34.79
N = 21
M = 66.67
SD = 25.09
N= 16
0.69
0.492
0.24
eugenol M = 22.62
SD = 19.61
N = 21
M = 26.56
SD = 19.83
N = 16
0.60 0.550
0.20
Instructor B
p-anisaldehyde
M = 57.78
SD = 31.41
N = 15
M = 67.78
SD = 23.96
N = 15
0.98
0.335
0.36
eugenol M = 27.50
SD = 18.41
N = 15
M = 39.17
SD = 29.45
N = 15
1.30 0.204 0.47
Instructor C
p-anisaldehyde
M = 53.17
SD = 29.64
N = 21
M = 62.50
SD = 30.23
N= 32
1.11
0.274
0.31
eugenol M = 19.64
SD = 15.60
N =21
M = 24.61
SD = 23.00
N = 32
0.89 0.380
0.25
Instructor D
p-anisaldehyde
M = 53.17
SD = 33.59
N = 21
M = 60.53
SD = 32.49
N = 19
0.70
0.487
0.22
eugenol M = 27.38
SD = 24.88
N = 21
M = 33.55
SD = 29.18
N = 19
0.72 0.425
0.22

40
Attitude Question Results
Students’ attitudes were measured using Likert-scale questions. From the factor
analysis Promax rotation, the questions were divided into two factors: attitudes about the
laboratory in general, and attitudes about ability to interpret spectroscopy. For the factor
of attitudes about the laboratory in general, there were no significant differences between
the traditional laboratory participants’ responses (N = 78, M = 3.42, SD = 0.65) and the
discovery-based laboratory participants’ responses (N = 82, M = 3.50, SD = 0.77), t(158)
= 0.72, p = 0.473, d = 0.16. The same is true regarding the factor for students’ attitude
about interpretation of spectroscopy in the traditional laboratory (N = 78, M = 3.57, SD =
0.71) and the discovery-based laboratory participants responses (N = 82, M = 3.35, SD =
1.04), t(158) = 1.60, p = 0.111, d = 0.29.
Each Likert-scale item was compared individually. These results are summarized
in Table 8, with the significant items in bold face. Of the nine questions, two were found
to be significantly different: the item regarding students’ ability to interpret 1H-NMR, χ
2
(4, N = 160) = 16.01, p = 0.003 and the item regarding students’ ability to interpret IR, χ2
(4, N = 160) = 18.47, p = 0.001. The residuals for these significant items are listed in
Table 9.

41
Table 8
Chi-square test of independence on students’ attitude items
Attitudes toward the laboratory in general
χ2
p w
The lab design made interpreting spectra meaningful and gave a
sense of purpose
3.09 0.543 0.07
How much did you like the overall lab 3.18 0.528 0.07
I found this semester labs to be fun 4.60 0.331 0.08
I found this semester labs to be confusing 6.71 0.152 0.10
I found this semester labs to be frustrating 2.35 0.642 0.06
This semester, lab has increased how much I like science in general 4.81 0.308 0.09
This lab has helped me gain useful knowledge 4.72 0.317 0.09
I have benefited from taking this lab 9.39 0.052 0.12
I learned interesting new things in lab 3.75 0.441 0.08
Attitudes toward spectroscopy
The labs enhanced my ability to interpret 1HNMR 16.01 0.003 0.16
The labs enhanced my ability to interpret 13
CNMR 8.97 0.062 0.12
The labs enhanced my ability to interpret IR 18.47 0.001 0.17
The labs did not help me learn spectroscopy 3.16 0.532 0.07
Bold items are significantly different; df = 4, N = 160
Table 9
Residuals of individual significant Likert items
strongly
disagree
disagree un-
decided
agree strongly
agree
The labs
enhanced my
ability to interpret 1HNMR
Traditiona
l lab
-1.85
(N = 0)
-0.19
(N = 12)
0.96
(N = 15)
1.05
(N = 45)
-1.67
(N = 6)
Discovery
-based lab
1.80
(N = 7)
0.18
(N = 14)
-0.94
(N = 9)
-.102
(N = 34)
1.63
(N = 18)
The labs
enhanced my
ability to interpret
IR
Traditiona
l lab
-2.18
(N = 2)
-0.98
(N = 13)
0.47
(N = 19)
1.78
(N = 40)
-0.59
(N = 4)
Discovery
-based lab
2.13
(N = 15)
0.96
(N = 22)
0.46
(N = 16)
-1.73
(N = 22)
0.57
(N = 7)

42
Predicted Grades Compared to Actual Grades
The difference in students’ perceptions of their abilities based on self-reported
expected grades in laboratory and lecture actual abilities based on course grades was not
significant. The grades were assigned quality points based on the scale outlined in Table
10, which ranged from zero for an F to four for an A. The results for the comparison of
the expected laboratory grade to the actual laboratory grade for traditional laboratory and
discovery-based laboratory grade are shown respectively: (N = 78, M = 0.20, SD = 0.80);
(N = 82, M = 0.04, SD = 0.59), t(158) = 1.46, p = 0.145, d = 0.23. The comparison for
the overall expected lecture grade for the traditional (N = 78, M = 0.38, SD = 0.97)
compared to the discovery-based (N = 82, M = 0.29, SD = 0.80), t(158) = 0.70, p = 0.486,
d = 0.10 also indicated no significant differences in the groups.
Table 10
Quality points assigned for grades
Letter grade Percentage Quality Points
A 90-100 % 4
B 80-89 % 3
C 70-79 % 2
D 60-69 % 1
F below 60 % 0
Limitations of the Study
The participants in this study came from the population at Middle Tennessee State
University, which is a regional comprehensive university in the Southeastern United

43
States. Most of MTSU’s undergraduate students are from Tennessee, with the largest
population coming from public high schools in the Middle Tennessee region. As a result
the results of this study may not be generalizable to other populations.
Although all students enrolled in CHEM 3011 filled out the survey, the sample
size was limited to students in sections where the instructors taught both a section of the
discovery-based lab and the traditional lab. This was done to avoid laboratory instructor
bias when analyzing the results. One of the laboratory instructors taught a section of the
discovery-based laboratory in the summer of 2011 and taught the traditional laboratory in
the summer of 2013. The time delay may have muted some differences. Also, during the
summer sessions, the course instructor was the laboratory instructor and a professor with
years of teaching experience that the other instructors in the study did not have. The
study did not take into account the different lecture instructors during the Fall and Spring
semesters. Since student enroll in lab separately from lecture, this study focused only on
laboratory instructors. There could be some lecture instructor influences in the results;
however answering this question was not in the scope of this research.
The reliability of survey based on the Cronbach alpha was 0.68, which was close
to the preferred minimum 0.70. Having more questions on the survey may have
increased the reliability, but the survey was designed to be given in lab where time was
limited. The students’ had to fully complete the survey for the extra credit points, take a
final comprehensive test, and check out in one class period.

44
The teaching experience of the GTAs is another limitation. Although the GTAs
who were instructing these laboratories were extremely competent, it is clear based on
instructor B’s survey averages that more teaching experience may enhance student
learning. The GTAs were not as comfortable commenting on the presentations, so an
organic professor was present for the final laboratory period in the discovery-based
sections. It is unclear whether this impacted student learning.
Discussion
Content-based portion of the survey
For the multiple choice/short answer section of the survey, the individual
questions were analyzed; two questions approached statistical significance and had small
effect sizes. One question asked students to predict how many signals would be seen in
the 13
C-NMR for furan (p = 0.085, w = 0.14). The other question asked them to predict
the splitting pattern for the hydrogen on carbon four on 2-methylbut-2-ene (p = 0.069, w
= 0.14). For both questions, the discovery-based laboratory participants scored higher,
13.0 % higher and 14.2 % higher than the traditional laboratory participants, respectively.
These questions represented different sub-sets of skills; predicting number of signals and
splitting patterns. Since the other multiple choice questions did not approach statistical
significance or had small effect sizes, the students’ performance on these questions were
comparable for the two laboratory groups. It was, however, interesting that the

45
discovery-based laboratory performed higher on the two questions exhibiting a small
effect size.
Although there was no significant difference on the multiple choice/short answer
survey overall, when the results were analyzed based on individual laboratory instructors,
the mean percent correct for three of the four (Instructors A, C, and D) instructors was
higher for the discovery-based laboratory. For instructor B, however, the traditional
laboratory scored higher. There are several differences between instructor B and the
other three instructors that could account for the different student performances. First,
the two sections taught by instructor B occurred in the Summer of 2011 (discovery-
based) and in Summer of 2013 (traditional), a much larger time interval than the other
three instructors. Second, instructor B taught the lecture and the laboratory for these
students, the other three laboratory instructors did not teach the lecture. Third, instructor
B was a tenured faculty member with many years of teaching experience in the organic
chemistry class and laboratory; the other three laboratory instructors were graduate
students.
The discovery-based laboratory had a higher percentage correct on the spectra
assignment portion of the survey. Although there was no significant difference between
the groups, both spectra scores were higher for the discovery-based group and both
comparisons had a small effect size, indicating that there was a practical difference. For
the p-anisaldehyde spectrum, the discovery-based group scored 8.05 % higher than the
traditional laboratory (t(158) = 1.69, p = 0.122, d = 0.27). For the spectrum of eugenol,

46
the discovery-based participants scored 5.69 % higher than the traditional laboratory
(t(158) = 1.58, p = 0.093, d = 0.25). These differences in percentage correct could be the
difference of letter grade in many cases. When analyzed by individual instructors, the
improved performance of the discovery-based group was true for all the instructors, so
this effect seems to be independent of instructor. The improved performance ranged
from 3.94 % to 10.0 % for the four instructors.
Attitude portion of the survey
The individual Likert questions about students’ attitudes were analyzed, and only
two questions were significantly different. Both of the significant questions were in the
factor of attitudes towards spectroscopy. Although there were no significant differences
between the groups, there was a small effect size for this factor, indicating a practical
significance (t(158) = 1.60, p = 0.111, d = 0.29).
Based on the residual results, the discovery-based participants were more likely to
strongly agree or strongly disagree with the statement that suggested the laboratory
enhanced students’ ability to interpret 1H-NMR. This could be due to the students’
experience with the presentation aspect of the discovery-based laboratory. Many students
identified their components and interpreted their spectral data correctly. However, there
were many students who prepared for the presentation, but their spectral data did not
confirm the component they claimed to isolate. These students received feedback from
their peers and instructors, and they had the opportunity to re-analyze their data. Due to
the pressure of presenting, and the nature of the discovery-based laboratory, students

47
could not just use the process of elimination to identify what compound was represented
in the spectra. The added pressure may be the reason why students in the discovery-
based laboratory have stronger opinions about their ability to interpret spectroscopy,
whether negative or positive.
The residuals on the question dealing with interpretation of IR indicated that the
traditional laboratory had a higher confidence for interpreting IR. The traditional
participants had exposure to the IR in the unknown laboratory. The discovery-based
participants could not collect an IR spectrum on their oil because the amount of oil
recovered was too small. The only exposure these students would have had with IR was
in their lecture course. This result then, is not surprising, and indicates that the
participants in both groups took the survey seriously.
There was no significant difference in students’ self-efficacy of grades in either
group. This was surprising as literature indicates that students’ tend to overestimate their
grades. This was the final question on the survey, and after the intensity of trying to
answer questions based on spectroscopy, it may be reasonable to suggest that students’
confidence in their grade was lowered.
Conclusions
In conclusion, a discovery-based laboratory component was introduced into
several sections of the organic chemistry laboratories at MTSU and compared to sections
of the traditional laboratory. The goal was to continue to provide experiential learning

48
and improve the laboratory in a way that would lead students to think more critically.
The learning objective measured was students’ ability to interpret spectroscopy.
Traditional laboratories are practical. Because of the ease in preparation and the
mass number of students that come through organic chemistry laboratory, the majority of
the organic laboratories at MTSU have been predominantly the traditional laboratories.
Traditional laboratories have been criticized for not being as effective as other laboratory
styles in aiding students to reason more critically (Domin,1999). Gaddis and Schoffstall
(2007) suggest that discovery-based laboratories can be easily incorporated for large
laboratory sections. Mohrig (2004) suggests recasting traditional laboratory experiments
so that a question or problem comes first, and he goes on to suggest practical ways of
transforming many traditional laboratories to discovery-based laboratory format.
The results from this research indicate that there is an advantage to including
discovery-based laboratory components into the organic chemistry curriculum at MTSU.
Although there were few significant differences, the means for spectroscopy questions
were consistently higher in the discovery-based groups. This indicates that the trend is a
better understanding of NMR spectroscopy. Also student’s attitudes were significantly
different for the discovery-based group for their overall confidence in interpreting
spectroscopy, whether negative or positive. This could indicate that students’ were
thinking more critically. Freedman (1997) found a correlation between achievement and
attitudes toward science. This would be interesting to analyze as future research for this
study.

49
With so few publications about the effectiveness of organic laboratories, there is a
need for research on different laboratory styles in this field. Students can be influenced
by their laboratory experiences. Cooper and Kerns (2006) point out the change in
students’ perception of their role in a problem-based laboratory was less passive than in a
traditional laboratory setting. Mohrig et al. (2009) found that the post-lab discussions in
a discovery-based chalcones laboratory really added to his students’ critical thinking
skills as they analyzed their results. The research findings presented here support the
overall idea that other laboratory styles are more effective than the traditional
laboratories, and this research is a needed addition to the current literature.
During the semesters that this research was conducted, there were very competent
GTAs. Informally, they expressed that they thought the students enjoyed the laboratories
more as a whole, and they enjoyed teaching the laboratories more. However, there was
more chaos because not everyone was doing the same thing at the same time, especially
during week two. They also observed the critical thinking process in week three when
the spectral data was presented and analyzed. Students exhibited greater critical thinking
skills in the discovery-based laboratory presentations than the simple process of
elimination required in the traditional unknown laboratory, where they turned in a written
repost without class discussion. Anecdotal evidence suggests that not only did the
students think more critically in the discovery-based laboratory, they also seemed more
engaged in the laboratory.

50
The ability to interpret NMR varied among the GTA’s, and new GTAs without
much research experience may find the interpretation aspect of this laboratory
challenging. With this in mind, this laboratory would be better suited if the choice of
herbs and spices was limited to ones previously tested so the GTA’s could better be
prepared.
Future work
There are areas of this research that can be expanded. Now that the laboratories at
MTSU are equipped with more sensitive infrared spectrometers, it is possible to add IR
analysis to this laboratory. The addition would give the students access to more state of
the art equipment that is now available. For GTA training purposes, the lab also needs to
be revised to limit the herbs and spices for student use.
Anecdotal evidence shows heightened interest in the lab for the instructor and
higher levels of student engagement in the discovery-based sections. A formal
assessment such as interviews or open-ended questionnaires given to instructors and
students regarding their perceptions of the effectiveness of the laboratories would be an
interesting addition. The attitude portion of the survey indicates students in the
discovery-based laboratories had stronger opinions in their ability to interpret
spectroscopy. It is speculated that this could be due to the pressure of presenting data to
their peers and instructors. It would be interesting to incorporate a presentation in a
traditional laboratory and see if the attitudes are similar.

51
There will be continued research on the effectiveness of the organic chemistry
laboratories at MTSU. This is a student-centered university and it is imperative that there
is ongoing research to ensure that students are engaged, thinking critically, and having
opportunities to use state of the art equipment in science.

52
REFERENCES
Ajewole, G. (1991). Effects of discovery and expository instructional methods on the
attitude of students to biology. Journal of Research in Science Teaching, 28, 401-
409.
Alaimo, P. J., Langenhan, J. M., Tanner, M. J., & Ferrenberg, S. M. (2010). Safety teams:
An approach to engage students in laboratory safety. Journal of Chemical
Education, 87, 856-861.
Allen, J. B. (1986). Guided inquiry laboratory. Journal of Chemical Education, 63, 533-
34.
Ault, A. (2002). What's wrong with cookbooks? Journal of Chemical Education, 79,
1177.
Bandura, A. (1997). Insights. Self-efficacy. Harvard Mental Health Letter, 13, 4-6.
Baru, A. R., & Mohan, R. S. (2005). The discovery-oriented approach to organic
chemistry. 6. Selective reduction in organic chemistry: Reduction of aldehydes in
the presence of esters using sodium borohydride. Journal of Chemical Education,
82, 1674-1675.
Barr, D., Gonzalez, M., & Wanat, S. (2008). The leaky pipeline: Factors associated with
early decline in interest in premedical studies among underrepresented minority
undergraduate students. Academic Medicine: Journal of the Association of
American Medical Colleges, 83, 503-511.

53
Bong, M., & Skaalvik, E. M. (2003). Academic self-concept and self-efficacy: How
different are they really? Educational Psychology Review, 15, 1-40.
Bruck, A., & Towns, M. (2013). Development, implementation, and analysis of a
National survey of faculty goals for undergraduate chemistry laboratory. Journal
of Chemical Education, 90, 685-693.
Centko, R., & Mohan, R. (2001). The discovery-oriented approach to organic chemistry.
4. Epoxidation of p-methoxy-trans-beta-methylstyrene - An exercise in NMR and
IR spectroscopy for sophomore organic laboratories. Journal of Chemical
Education, 78, 77-79.
Chase, A., Pakhira, D., & Stains, M. (2013). Implementing Process-Oriented, Guided-
Inquiry Learning for the first time: Adaptations and short-term impacts on
students' attitude and performance. Journal of Chemical Education, 90, 409-416.
Christensen, J. E., Huddle, M. G., Rogers, J. L., Herbie, Y., & Mohan, R. S. (2008). The
discovery-oriented approach to organic chemistry. 7. Rearrangement of trans-
stilbene oxide with bismuth trifluoromethanesulfonate and other metal triflates.
Journal of Chemical Education, 85, 1274-1275.
Ciaccio, J. A., Bravo, R. P., Drahus, A. L., Biggins, J. B., Concepcion, R. V., & Cabrera,
D. (2001). Diastereoselective synthesis of (+/-)-1,2-diphenyl-1,2-propanediol.
Journal of Chemical Education, 78, 531-533.
Cohen, J. (1992). A power primer. Psychological Bulletin, 112, 155-159.

54
Cooper, M. M., & Kerns, T. S. (2006). Changing the laboratory: Effects of a laboratory
course on student's attitudes and perceptions. Journal of Chemical Education, 83,
1356-1361.
Dewey, J. (1938). Experience and education, by John Dewey. New York, The Macmillan
company, 1938.
Domin, D. S. (1999). A review of laboratory instruction styles. Journal of Chemical
Education, 76, 543-547.
Dragojlovic, V., & Nielsen, J. (2003). Oxidation of an unknown cycloalkene,
cycloalkanol, or cycloalkanone to a dicarboxylic acid: A discovery oriented
experiment for organic chemistry students. Abstracts of Papers of The American
Chemical Society, 223, U337.
Dunlap, N. N., & Martin, L. J. (2012). Discovery-based labs for organic chemistry:
Overview and effectiveness. ACS Symposium Series, 1108, 1-12.
Dunlap, N. K., Mergo, W., Jones, J. M., & Martin, L. (2006). Use of 13C-NMR in a
dehydration experiment for organic chemistry. Chemical Educator, 11, 378-379.
Eby, E., & Deal, S. (2008). A green, guided-inquiry based electrophilic aromatic
substitution for the organic chemistry laboratory. Journal of Chemical Education,
85, 1426-1428.
Freedman, M.P. (2002). The influence of laboratory instruction on science achievement
and attitude toward science across gender differences. Journal of Women and
Minorities in Science and Engineering, 8, 191–200.

55
Gaddis, B. A., & Schoffstall, A. M. (2007). Incorporating guided-inquiry learning into
the organic chemistry laboratory. Journal of Chemical Education, 84, 848-851.
Gallet, C. (1998). Problem-solving teaching in the chemistry laboratory: Leaving the
cooks. Journal of Chemical Education, 75, 72-77.
Glagovich, N. M., & Shine, T. D. (2005). Organic spectroscopy laboratory: Utilizing IR
and NMR in the identification of an unknown substance. Journal of Chemical
Education, 82, 1382-1384.
Glasman, L. R., & Albarracín, D. (2006). Forming attitudes that predict future behavior:
A meta-analysis of the attitude-behavior relation. Psychological Bulletin, 132,
778-822.
Glassman, M., Erdem, G., & Bartholomew, M. (2013). Action research and its history as
an adult education movement for social change. Adult Education Quarterly, 63,
272-288.
Hart, C., Mulhall, P., Berry, A., Loughran, J., & Gunstone, R. (2000). What is the
purpose of this experiment: Or can students learn something from doing
experiments? Journal of Research in Science Teaching, 37, 655-675.
Herron, M. D., & Herron, J. D. (1971). Nature of scientific enquiry. School Review, 79,
171-212.
Hofstein, A., & Lunetta, V. N. (1982). Role of the laboratory in science teaching:
Neglected aspects of research. Review of Educational Research, 52, 201-217.

56
Hofstein, A., & Mamlok-Naaman, R. (2007). The laboratory in science education: The
state of the art. Chemistry Education Research and Practice, 8, 105-107.
Horowitz, G. (2003). A discovery approach to three organic laboratory techniques:
Extraction, recrystallization, and distillation. Journal of Chemical Education, 80,
1039-1041.
Howell, D. C. (2013). Statistical methods for psychology (8th ed.). Belmont, CA, US:
Wadsworth.
Johnstone, A. H., & Wood, C. A. (1977). Practical Work in Its Own Right. Education in
Chemistry.
Kelderman, E. (2012). With state support now tied to completion, Tennessee colleges
must refocus. Chronicle of Higher Education, 59, A16-A18.
Kern, E. L., & Carpenter, J. R. (1984). Enhancement of student values, interests and
attitudes in earth science through a field-oriented approach. Journal of Geological
Education, 32, 299-305.
Kevin, R. C., Liberty, P. r., & Texas Univ., A. E. (1975). Students' personality, attitude,
and learning style as predictors of performance in an undergraduate organic
chemistry course using computer-based education. ERIC, EBSCOhost (accessed
November 11, 2014).
Kirschner, P. A., & Meester, M. M. (1988). The laboratory in higher science education:
Problems, premises and objectives. Higher Education, 17, 81-98.

57
Kjonaas, R. F. (2008). A discovery-based experiment involving rearrangement in the
conversion of alcohols to alkyl halides. Journal of Chemical Education, 85, 100-
101.
Kolb, D. A. (1984). Experiential learning : Experience as the source of learning and
development / David A. Kolb. Englewood Cliffs, N.J. : Prentice-Hall.
Kurbanoğlu, N., & Akin, A. (2012). The relationships between university students’
organic chemistry anxiety, chemistry attitudes, and self-efficacy: A structural
equation model. Journal of Baltic Science Education, 11, 347-356.
Kurbanoğlu, N. (2013). The effects of organic chemistry anxiety on undergraduate
students in relation to chemistry attitude and organic chemistry achievement.
Journal of Baltic Science Education, 12, 130-138.
Linn, M. C. (1977). Scientific reasoning: Influences on task performance and response
categorization. Science Education, 61, 357-369.
Lunetta, V. N., & Tamir, P. (1981). An analysis of laboratory activities: Project physics
and PSSC. School Science and Mathematics, 81, 635-42.
Malerstein, A. J., & Ahern, M. M. (1979). Piaget's stages of cognitive development and
adult character structure. American Journal of Psychotherapy, 33, 107-118.
Marrow, A. (1975). The T-group experience : An encounter among people for greater
self-fulfillment / Alfred J. Marrow. New York : P. S. Eriksson, 1975.

58
McElveen, S. R., Gavardinas, K., Stamberger, J. A., & Mohan, R. S. (1999). Nitration of
unknown organic compounds. (The Discovery-oriented approach to organic
chemistry, part 1). Journal of Chemical Education, 76, 535-536.
Merritt, M. V., Schneider, M. J., & Darlington, J. A. (1993). Experimental design in the
general chemistry laboratory. Journal of Chemical Education, 70, 660-662.
Middle Tennessee State University. (2014). College of basic and applied science mission
statement [Data file]. Retrieved from
http://www.mtsu.edu/cbas/mission_statement.php
Middle Tennessee State University. (2014). University mission statement [Data file].
Retrieved from http://www.mtsu.edu/about/mission.php
Mohrig, J. R. (2004). The problem with organic chemistry labs. Journal of Chemical
Education, 81, 1083.
Mohrig, J. R., Hammond, C., & Colby, D. A. (2007). On the successful use of inquiry-
driven experiments in the organic chemistry laboratory. Journal of Chemical
Education, 84, 992-998.
Mohrig, J. R., Hammond, C., Schatz, P. F., & Davidson, T. A. (2009). Synthesis and
hydrogenation of disubstituted chalcones: A guided-inquiry organic chemistry
Project. Journal of Chemical Education, 86, 234-239.
Monteyne, K., & Cracolice, M. S. (2004). What's wrong with cookbooks? A reply to
Ault. Journal of Chemical Education, 81, 1559-1560.

59
Moroz, J. W. (2003). A series of small-scale, discovery-based organic laboratory
experiments illustrating the concepts of addition, substitution, and rearrangement.
Journal of Chemical Education, 80, 1319-1321.
Nieswandt, M. (2007). Student affect and conceptual understanding in learning
chemistry. Journal of Research in Science Teaching, 44, 908-937.
Nowell, C., & Alston, R. M. (2007). I thought I got an A! Overconfidence across the
economics curriculum. The Journal of Economic Education, 38, 131-142.
Nunnally, J. C. (1978). Psychometric theory / Jum C. Nunnally. New York, NY :
McGraw-Hill.
O'Connor, B. P. (2000). SPSS and SAS programs for determining the number of
components using parallel analysis and Velicer's MAP test. Behavior Research
Methods, Instruments & Computers, 32, 396-402.
Office of Institutional Effectiveness, Planning, and Research. (2012). 2012 fact book.
Retrieved from Middle Tennessee State University website:
http://www.mtsu.edu/iepr/factbook/factbook12/Fact_Book_Fall_2012.pdf
Osborne, J., Simon, S., & Collins, S. (2003). Attitudes towards science: A review of the
literature and its implications. International Journal of Science Education, 25,
1049-1079.
Parker, L., & Loudon, G. (2013). Case study using online homework in undergraduate
organic chemistry: Results and student attitudes. Journal of Chemical Education,
90, 37-44.

60
Pavelich, M. J., & Abraham, M. R. (1979). Inquiry format laboratory program for general
chemistry. Journal of Chemical Education, 56, 100-103.
Peters, R. S. (1967). The concept of education; edited by R. S. Peters. London, Routledge
& K. Paul: New York, Humanities P.
Piaget, J. (1971). The theory of stages in cognitive development. Measurement and
Piaget. New York, NY: McGraw-Hill.
Reid, N., & Shah, I. (2007). The role of laboratory work in university chemistry.
Chemistry Education Research and Practices, 8, 172-185.
Ricci, R. W., & Ditzler, M. A. (1991). Discovery chemistry: A laboratory-centered
approach to teaching general chemistry. Journal of Chemical Education, 68, 228-
231.
Rosenberg, R. E. (2007). A guided-inquiry approach to the sodium borohydride reduction
and Grignard reaction of carbonyl compounds. Journal of Chemical Education,
84, 1474-1476.
Schepmann, H. G., & Mynderse, M. (2010). Ring-closing metathesis: An advanced
guided-inquiry experiment for the organic laboratory. Journal of Chemical
Education, 87, 721-723.
Stoub, D. G. (2004) Discovery-based purification of Excedrin. Chemical Educator, 9,
281-284.

61
Supasorn, S., Suits, J. P., Jones, L. L., & Vibuljan, S. (2008). Impact of a pre-laboratory
organic-extraction simulation on comprehension and attitudes of undergraduate
chemistry students. Chemistry Education Research and Practice, 9, 169-181.
Tinto, V. (2005). Reflections on retention and persistence: Institutional actions on behalf
of student persistence. Studies in Learning, Evaluation, Innovation &
Development, 2, 89-97.
Turner, R. C., & Lindsay, H. A. (2003). Gender differences in cognitive and noncognitive
factors related to achievement in organic chemistry. Journal of Chemical
Education, 80, 563-568.
Waks, L. (2013). John Dewey and the challenge of progressive education. International
Journal of Progressive Education, 9, 73-83.
Weinburgh, M. H. (2000). Gender, ethnicity, and grade level as predictors of middle
school students' attitudes toward science. ERIC, EBSCOhost (accessed October 4,
2014).
Whaley, W. L., Rummel, J D., Zemenu, E., Li, W., Yang, P., Rodgers, B. C.,Bailey, J.,
Moody, C. L., Huhman, D. V., Maier, C. G.-A., Sumner, L. W., & Starnes, S. D.
(2007). Isolation and characterization of osajin and pomiferin: Discovery
laboratory exercises for organic chemistry. Chemical Educator, 12, 179-184.

62
APPENDICES

63
APPENDIX A
Publication in Advances in Teaching Organic Chemistry
-
Norma Dunlap* and Leah J. Martin Chemistry Department, Middle Tennessee State University,
Murfreesboro, TN 37132 *E-mail: [email protected]
Although more common in general chemistry courses, a number of discovery-based or guided-
inquiry laboratory experiments in organic chemistry have been reported over the past fifteen
years. These are generally believed to be an improvement over traditional “cookbook”
experiments, with increased student interest and engagement. A survey of the chemical
education literature gives many examples, with most falling into one of just a few categories.
Examples from each of these categories are summarized, as well as examples that focus on
assessment of student learning and perceptions.
Introduction
Laboratories are a central component of the undergraduate organic chemistry
curriculum, where students are taught techniques, research skills, and support for lecture
material. For years educators have been looking at the effectiveness of science laboratories and
the impact on student's learning, and there are many opinions on what constitutes an effective
lab. Chemistry labs have been classified as expository, problem-based, inquiry or discovery (1).
The types of lab share similarities but differ in respect to outcome, approach and procedure,
and there have been debates on which type of lab is most effective (2,3,4,5). Expository, also
known as cookbook, verification, or traditional style, is the predominant laboratory style used in
undergraduate organic chemistry laboratories. This type of lab has been defined as a deductive
approach where students are given a problem and step-by-step instructions on how to reach a
pre-determined outcome. The concepts covered in the laboratory will have been covered in
lecture before the lab is performed. Although the majority of undergraduate labs use an
expository approach, the method has been criticized by many educators and researchers.
Advantages include ease of lab preparation and training of TAs, however expository labs involve

64
little critical thinking (6,7,8). Increasingly, organic laboratories have incorporated some
discovery, or guided inquiry-based labs. These are seen as more practicable labs than open
inquiry and problem-based experiments, where students are expected to develop a procedure.
In a typical discovery or guided-inquiry experiment, students follow a given procedure, collect
their data, make observations and draw conclusions based on their results. The outcome varies
from predetermined to undetermined. This is a more inductive approach than the expository
labs, and develops critical thinking skills.
In discovery-based labs, the instructor does not give step-by-step instruction, but may
give a general procedure. Students are playing the role as the discoverer in lab with less
“guidance” from the instructor (1). Some evidence suggests that students learn more and are
more engaged in a guided-inquiry lab or a discovery based lab than in the traditional, cookbook
lab setting (9). Discovery labs are inductive in nature, illustrate the scientific method, and
connect theory with empirical data (10). Admittedly, students’ attitudes towards the labs vary;
most would agree that their “problem solving skills” were used more, but they also found the
laboratories more frustrating and difficult (11). Most of these studies have been conducted in
general chemistry labs, but these open the idea that changing the traditional lab structure in
organic chemistry may deepen students’ understanding of the subject.
As there are educators that are “pro-discovery”, there are criticisms of the style as well.
It has been argued that if a student does not have basic knowledge of the material to be
learned, they are unable to make the “correct” discovery, and it is unclear how a group of
students can discover the same thing. Also, discovery labs are more time consuming and more
challenging in regard to training of teaching assistants (11).
Although most of the research in the area of effectiveness of different lab types on
student learning has been focused in the general chemistry laboratory courses, some studies
have been published for the undergraduate organic chemistry laboratory. The goal of this
chapter is to summarize representative examples of published discovery-based organic
chemistry labs that can be implemented into the undergraduate curriculum, as well as the scant
research that has been done on the effectiveness of discovery labs in the organic chemistry
laboratory.
Summary of discovery and guided-inquiry labs
A survey of discovery and guided-inquiry labs specific for organic chemistry fall, for the
most part, into a few different categories. These are: labs involving identification of unknowns,
65
labs involving reaction analysis, and labs involving isolation and/or purification. Several
published laboratory manuals have incorporated multi-step and guided-inquiry experiments;
however the focus of this chapter is on experiments published in journals (12, 13).
Labs involving identification of unknowns
Identification of unknowns lends itself well to discovery and guided-inquiry. The extent
of critical thinking on the part of the student depends on how much is "unknown". For instance
a common expository lab involves giving a table of compounds with ten different melting points
and asking students to identify an unknown by a melting point. This would involve learning lab
techniques, but little in the way of critical thinking. However, expanding the number of
compounds in the table, as well as the extent of analysis, and including compounds with
similarities leads to a more discovery-based approach. An example of this is the identification of
a series of unknowns based on melting point analysis as well as IR and NMR spectroscopy (14).
From a list of eighty-one compounds, students narrow down the possibilities based on melting
point or boiling point. An IR is taken and analyzed in order to further narrow the possibilities by
functional group. Final determination is based on NMR spectroscopy.
More advanced use of unknowns involves the reaction of an unknown, and then
analysis of spectral data for identification of the product, and therefore of the starting material.
A number of labs have been published using this approach, including functional group oxidation,
aryl nitration, alcohol dehydration and nucleophilic addition to carbonyls. These are
summarized in Figure 1.

66
Figure 1. Examples of labs involving reaction and analysis of an unknown.
In the first case, students are given an unknown that may be either an alkene, alcohol or
ketone, with twelve possible structures (15). The first task is to identify the functional group by
chemical tests and IR. The oxidation method proposed by the student is dependent on the
functional group, and analysis of the carboxylic acid product is done by NMR. Although
students are all carrying out the same reaction, they will obtain different products, and will need
to analyze properties of the products and then work back to identify the starting material. The
next two are variations of typical expository labs done in nearly every undergraduate organic
Cycloalkene, cycloalkanol or cycloalkanone
RuCl3/NaIO4
or
KMnO4/OH-
dicarboxylic acid
Oxidation of unknown
Nitration of unknown
R HNO3, H2SO4 R
NO2
Student analysis of functional group: mp/IR Student analysis of product: mp
Student analysis of product: 1H-NMR and 13C-NMR
Dehydration of unknown
H2SO4, heat
n
R
N = 1 or 2
R = H or CH3
n
R
N = 1 or 2
R = H or CH3
OH
Student analysis of product: 13C-NMR
Nucleophilic addition to unknown
NaBH4
or
PhMgBr
Student analysis of product: IR, physical properties
Ph
O
R
R = H, Ph, OEt, OCOPh
no reactionaddition of one H or Phaddition of two H or Ph
Possibilities:

67
chemistry lab. Nitration of methyl benzoate, as well as dehydration of cyclohexanol are
standard labs. Modification of both of these to include four unknown starting materials, and
analysis of the product by NMR adds the element of discovery (16,17). Students must analyze
the spectroscopic data of the product in order to work back to the identification of the starting
unknown. A final example is that of sodium borohydride and Grignard addition to unknown
carbonyl compounds. The unknowns include an aldehyde, a ketone, an ester and an anhydride.
Students carry out both reactions and analyze whether or not a reaction has occurred, as well as
identity of a product in order to work back to identification of the unknown (18).
Labs involving reaction analysis
Most of the published labs fall into this category and vary with the extent of discovery
by the student. Several procedures result in various products based on mechanism, and the
student's "discovery" involves both product analysis and proposal of mechanism. There are a
few examples in which a rearranged product may be observed, either in an epoxide ring
opening, or in an alkyl halide formation from an alcohol (19,20,21). Several more advanced labs
have been reported, including a sulfinate to sulfone rearrangement, and a ring-closing
metathesis (22,23). These are perhaps best suited for an upper level advanced synthesis lab, as
they both deal with reactions not commonly covered in the typical two-semester organic
sequence. Figure 2 gives examples of published labs that involve inquiry on the students’ part
on reaction mechanism, due to rearrangement that occurs during the reaction.

68
Figure 2. Labs involving analysis of a rearranged product.
Several other labs involve the investigation of stereoselectivity and/or regioselectivity of
a reaction, and are summarized in Figure 3.
Rearrangement of epoxide via silver catalysis
Ph Ph
Ph
CH2Cl2, HCl
bleachPh
Ph Ph
PhPh
Cl Cl
Ag+, H2O, MeOH
Ph Ph
PhPh
Ph O
PhPh
OPh
BF3Ag+, H2O
acetone
Rearrangement of epoxide via silver catalysis
Ph
Ph
Ph
Ph
O Ph O
HPh
Ph O
Ph
mCPBA M(OTf)nor
Students vary reaction conditions and analyze by NMR, IR, MS
Students vary reaction conditions and analyze by NMR
Rearrangement of sulfinate to sulfone
R
OR'
(9 variations)
LiAlH4
or
LiAlD4
R
R'
H(D)
OH
ClS(O)ArR
R'
H(D)
O
SO Ar
SR
R'
H(D)
S
Ar
R'
(D)H
R
O
Ar
Oor
heat
Students vary reaction conditions and analyze by NMR
Rearrangement during substitution reaction
OHNaBr, H2SO4
Br
Bror
OH Br
BrNaBr, H2SO4
OH HCl, ZnCl2Cl
Cl
or
or
Students react different substrates, analyze by 13C-NMR and share data

69
Figure 3. Labs involving analysis of stereoselective and regioselective reactions.
The discovery on the part of the student in these labs relies mainly on prediction of
possible reaction products, and use of physical or spectroscopic techniques for verification. For
example, in the addition of a Grignard reagent to racemic benzoin, all students carry out the
same reaction, and determine the product based on melting point, with a discussion of
diastereoselectivity (22). An example of a regioselective reaction has students using one of two
possible substrates, each with an aldehyde and an ester funtional group. Analysis of the product
by NMR spectroscopy is used in order to identify which group(s) were reduced (23). Other
examples of prediction and verification of regioselectivity in reactions include epoxide ring-
opening and electrophilic aromatic substitution (24,25). Another example that falls into this
category is the synthesis and regioselective hydrogenation of a series of chalcones (26).
O
PhPh
HO1. MeMgI
2. H2O, H+
OH
PhPh
HO OH
MePh
HOH H PhMe or
Student analysis by mp, NMR
Stereoselective Grignard addition
Regioselective reduction
CHO
OMe
AcO
or
CHO
MeO2C
NaBH4
CH2OH
OMe
AcO
or
CH2OH
MeO2C
(no reduction of esters)Student analysis by TLC, NMR
Regioselective epoxide ring-opening
mCPBA
Student analysis by NMR
MeO MeO
OArCO2H
Me
MeO
orH
OO
HHO
Cl
Me
MeO
HOH
HO
O
Cl
Regioselective electrophilic aromatic substitution
Student analysis by IR, mp
OH2N
OH NaI NaOCl
OH2N
OH
OH2N
OHor
I I

70
Labs involving purification
Several labs have been published that are an extension of the traditional purification
labs involving distillation, recrystallization and chromatography. Varying techniques and/or
samples lends the element of discovery to these labs. One example combines extraction,
recrystallization and distillation into one experiment. Students perform the experiments with
variable conditions for each technique, and share and discuss results (27). Another example
involves the purification of “poisoned” Excedrin using extraction, chromatography and
spectroscopy (28). Students’ interest is heightened by the use of a familiar medicine. Another
example is that of the isolation of components of plants by extraction, purification by
chromatography and spectroscopic identification (29).
Discovery-based or research-like laboratory courses
Most ambitious are the reports of entire courses developed on the basis of guided-
inquiry labs. Of the published reports, a common feature is the development of technique using
expository-type labs, followed by a multi-week combined experiment. By using the expository
labs first, students gain confidence in their abilities before proposing and carrying out a multi-
week discovery-based project. In one example, after gaining experience, students propose a
multi-step synthesis, carry it out, and then write a formal report on their results (30). In another
example, all students carry out a multi-week synthetic research project using a Wittig reaction,
halogenation, elimination and then formation of metalloles (31). While perhaps the most
interesting for students, these are challenging for the instructor.
Summary of effectiveness of discovery and guided-inquiry labs
In many of the labs outlined in this chapter, informal observations were used to assess
the effectiveness of the guided-inquiry labs and student learning. The instructors observed the
questions that students asked during the lab, and concluded that the students in the guided-
inquiry labs exhibited more independent thinking than in a traditional lab setting. It was also
observed that students took more responsibility for what they were learning, felt the labs were
more entertaining, and found the labs more rewarding than traditional labs (27,13,29).
Others, such as Stoub’s purification lab, not only used informal observations, but also
used student evaluations, end of year assessments, and reflections in a notebook to assess the
effectiveness of the lab (28). Again, it was found that students asked deeper questions based on

71
a deeper understanding of the laboratory, they took ownership of their work, and generally
enjoyed the lab. There was no statistical analysis reported, but the laboratory handouts,
student discussion questions, and instructor notes are provided in the supplemental material.
Miller and Leadbeater measured student learning versus students’ perception of
learning in their guided inquiry lab (32). A WebCT pre-laboratory test was given as a measure of
prior knowledge of the material covered, which was broken down into three components:
microwave energy, biodiesel, and esterification. The same test was given as a post-laboratory
test to see if knowledge was gained. There was a statistical difference in scores on the pre-test
vs. post-test, suggesting that the laboratory had a positive impact on students’ understanding of
the content. Along with the pre and post-test, a five point Likert-scale survey was administered
which linked the test results to students’ perception of their content comprehension. This
survey was administered via WebCT before and after the laboratory as well. Their confidence
from participating in this lab gave mixed results. In comparing the pre- and post-test, a
statistical significance was observed for: comprehension of action of microwave energy in
heating a reaction, knowledge of differences in microwave equipment, the concept of biodiesel,
the actual synthesis and reaction conditions, and the students’ abilities to interpret 1H NMR.
However, there was no statistical significance shown for: properties of biodiesel, mechanism of
esterification, and trans-esterification.
Another very thorough assessment was carried out in Mohrig’s three-week inquiry-
based project for the synthesis and hydrogenation of disubstituted chalcones (26). Students
synthesized and purified a disubstituted chalcone the first week. The second week was based on
the regioselective hydrogenation of the chalcones, including analysis by TLC, IR, NMR, and GC-
MS. For the final week students presented their data to their peers. The instructor acted as a
research facilitator, and asked probing questions to assess understanding. Other students in the
section typically added to the discussion for possible interpretations and general laboratory
procedures. After input from others in the class on the presentations, the students wrote a
formal lab report. Upon completion of the unit, students took an anonymous online survey to
reflect their perception of the effectiveness of the laboratory. From the 547 students that
participated in the free response survey, only 10% didn’t like the experiment, while the aspects
that students like the most were: use of spectroscopy (29%), diversity of lab skills (14%),
approach allowing time for repetition (10%). The study also addressed issues involved in TA
training. Although there was a weekly meeting and most TA’s had taught guided-inquiry labs
prior to this lab unit, the enthusiasm and amount of preparation influenced the results of this
study. Results of questioning the participating students about the TA’s showed that 32% of TA’s
made the student reason through problems on their own, 62% asked questions and “guided”
72
the student in the proper direction, 3% answered all questions and corrected all problems, and
3% of the TAs did not know how to answer the questions.
Although there are many informal observations about the effectiveness of inquiry-based
labs summarized in this chapter, there are few examples with formal assessment of the
effectiveness. There is clearly a need for further research on the effect on student learning and
attitudes toward organic chemistry, as well as a need to investigate TA training and their
perceptions, as well as faculty. More research documenting and statistically analyzing aspects
of the published guided-inquiry organic chemistry labs would also be helpful.
References
1. Domin, D. S. A review of laboratory instruction styles. J. Chem. Educ. 1999, 76, 543-547.
2. Ault, A. What’s wrong with cookbooks? J. Chem. Educ. 2002, 79, 1177.
3. Mohrig, J. R. The problem with organic chemistry labs. J. Chem. Educ. 2004, 81, 1083-1085.
4. Monteyne, M.; Cracolice, M. S. What’s wrong with cookbooks? A reply to Ault. J. Chem. Educ. 2004, 81, 1559-1560.
5. Hart, C.; Mulhall, P.; Berry, A.; Loughran, J,l Gunstone, R. What is the purpose of this experiment? Or can students learn something from doing experiments? J. Res. Sci. Teach. 2000, 37, 655-675.
6. Gallet, C. Problem-solving teaching in the chemistry laboratory: leaving the cooks. J. Chem. Educ. 1998, 75, 72-76.
7. Pavelich M.J.; Abraham M.R. An inquiry format laboratory program for general chemistry. J. Chem. Educ. 1979, 56, 100-103.
8. Hofstein, A.; Lunetta, V. N. The role of the laboratory in science teaching: neglected aspects of research. Rev. Ed. Res. 1982, 52, 201-217.
9. Allen J.B. Guided inquiry laboratory. J. Chem. Educ. 1986, 6, 533-534.
10. Ricci R. W.; Ditzler M. A. Discovery Chemistry a laboratory-centered approach to teaching general chemistry. J. Chem. Educ. 1991, 3, 228-231.
11. Peters R.S. The concept of education; London, Routledge & K. Paul: New York, 1967.
73
12. Mohrig, J. R.; Hammond, C. N.; Schatz, P. F.; Morrill, T. C. Modern projects and experiments in organic chemistry: Miniscale and Williamson microscale, 2nd ed; W. H. Freeman: New York, 2003.
13. Lehman, J. W. Microscale operational organic chemistry; Pearson Education, Inc: New Jersey, 2004.
14. Glagovich, N. M.; Shine, T. D. Organic spectroscopy laboratory: utilizing IR and NMR in the identification of an unknown substance. J. Chem. Educ. 2005, 82, 1382-1384.
15. Nielsen, J. T.; Duarte, R.; Dragojlovic, V. Oxidation of an unknown cycloalkene, cycloalkanol, or cycloalkanone to a dicarboxylic acid: a discovery oriented experiment for organic chemistry students. Chem. Educ. 2003, 8, 241-243.
16. McElveen, S. R.; Gavardinas, K.; Stamberger, J. A.; Mohan, R. S. The discovery-oriented approach to organic chemistry. 1. Nitration of unknown organic compounds. J. Chem. Educ. 1999, 76, 535-536.
17. Dunlap, N. K.; Mergo, W.; Jones, J. M.; Martin, L. Use of 13C-NMR in a dehydration experiment for organic chemistry. Chem. Educ. 2006, 11, 378-379.
18. Rosenberg, R. E. A guided-inquiry approach to the sodium borohydride reduction and Grignard reaction of carbonyl compounds. J. Chem. Educ. 2007, 84, 1474-1476.
19. Christensen, J. E.; Huddle, M. G.; Rogers, J. L.; Yung, H.; Mohan, R. S. The discovery-oriented approach to organic chemistry. 7. Rearrangement of trans-stilbene oxide with bismuth trifluoromethanesulfonate and other metal triflates. J. Chem. Educ. 2008, 85, 1274-1275.
20. Moroz, J. S.; Pellino, J. L.; Field, K. W. A series of small-scale, discovery-based organic laboratory experiments illustrating the comcepts of addition, substitution, and rearrangement. J. Chem. Educ. 2003, 80, 1319-1321.
21. Kjonaas, R. A.; Tucker, R. J. F. A discovery-based experiment involving rearrangement in the conversion of alcohols to alkyl halides. J. Chem. Educ. 2008, 85, 100-101.
22. Ball, D. B.; Mollard, P.; Voigtritter, K. R.; Ball, J. L. Rearrangements of allylic sulfinates to sulfones: a mechanistic study. J. Chem. Educ. 2010, 87, 717-720.
23. Schepmann, H. G.; Mynderse, M. Ring-closing metathesis: and advanced guided-inquiry experiment for the organic laboratory. J. Chem. Educ. 2010, 87, 721-723.
22. Ciaccio, J. A.; Bravo, R. P.; Drahus, A. L.; Biggins, J. B.; Concepcion, R. V.; Cabrera, D. Diastereoselective synthesis of (+/-)-1,2-diphenyl-1,2-propanediol. J. Chem. Educ. 2001, 78, 531-533.

74
23. Baru, A. R.; Mohan, R. S. The discovery-oriented approach to organic chemistry. 6. Selective reduction in organic chemistry: reduction of aldehydes in the presence of esters using sodium borohydride. J. Chem. Educ. 2005, 82, 1674-1675.
24. Centko, R. S.; Mohan, R. S. The discovery-oriented approach to organic chemistry. 4.
Epoxidation of p-methoxy-trans- -methylstyrene. J. Chem. Educ. 2001, 78, 77-79.
25. Eby, E.; Deal, S. T. A green, guided-inquiry based electrophilic aromatic substitution for the organic chemistry laboratory. J. Chem. Educ. 2008, 85, 1426-1428.
26. Mohrig, J.R.; Hammond, C.N.; Schatz, P.F.; Davidson, T.A. Synthesis and hydrogenation of disubstituted chalcones. J. Chem. Educ. 2009, 86, 234-239.
27. Horowitz, G. A discovery approach to three organic laboratory techniques: extraction, recrystallization, and distillation. J. Chem. Educ. 2003, 80, 1039-1041.
28. Stoub, D. G. Discovery-based purification of Excedrin. Chem. Educ. 2004, 9, 281-284.
29. Whaley, W. L.; Rummel, J D.; Zemenu, E.; Li, W.; Yang, P.; Rodgers, B. C.; Bailey, J.; Moody, C. L.; Huhman, D. V.; Maier, C. G.-A.; Sumner, L. W.; Starnes, S. D. Isolation and characterization of osajin and pomiferin: discovery laboratory exercises for organic chemistry. Chem. Educ. 2007, 12,
30. Davis, D. S.; Hargrove, R. J.; Hugdahl, J. D. A research-based sophomore organic chemistry laboratory. J. Chem. Educ. 1999, 76, 1127-1130.
31. Newton, T. A.; Tracy, H. J.; Prudente, C. A research-based laboratory course in organic chemistry. J. Chem. Educ. 2006, 83, 1844-1849.
32. Miller, T. A.; Leadbeater, N. E. Microwave assisted synthesis of biodiesel in an undergraduate organic chemistry course. Chem. Educ. 2009, 14, 98-104.

75
APPENDIX B
Instructional Review Board Approval

76
APPENDIX C
Traditional Distillation Lab
Distillation: Separation of a Mixture of Cyclohexane and Toluene
Summary: In this experiment, you will carry out both a simple distillation and a fractional
distillation of a mixture of cylohexane and toluene. The distilled product will be analyzed for
purity by gas chromatography.
Techniques learned: purification by distillation
analysis by gas chromatography
While crystallization is the most important technique for purifying solid
compounds, distillation is the most important technique for purifying two liquid
compounds. Distillation is one of the oldest and most important operations of chemistry.
The origins of distillation are as old as civilization: it was discovered many years ago
that more potent beverages could be made by heating a dilute alcohol solution and
condensing the vapors.
Distillation is the process of vaporizing a liquid out of one container and then
condensing the vapors back to liquid in a second container, known as the receiver. The
liquid that is condensed is the distillate. Distillation exploits the difference in boiling
points between two liquids. The boiling point is defined as the temperature at which the
vapor pressure of a liquid is equal to the external pressure applied to the surface of the
liquid. In an open container this external pressure is atmospheric pressure.
Consider the behavior of a mixture of two miscible (soluble) liquids. According
to Dalton’s Law, the total vapor pressure exerted by a mixture of two liquids is given by
the sum of the partial pressures exerted by the individual components. Using Rauolt’s
Law, the pressure exerted by the individual components is equal to the product of the
vapor pressure of the component times its mole fraction. Combining Rauolt’s and
Dalton’s Law yields:
PT = XAPA + XBPB
where PT = total pressure
XA = mole fraction of compound A

77
PA = vapor pressure of compound A
XB = mole fraction of compound B
PB = vapor pressure of compound B
When a mixture boils, the composition of the vapor is different from the
composition of the liquid. This is the key to distillation. At a given temperature the
vapor phase is richer in the more volatile component than is the boiling liquid with which
the vapor is in equilibrium.
Using the vapor liquid curve shown below consider the separation of a mixture
containing 22% cyclohexane and 78% toluene.

78
Cyclohexane has a boiling point of 81 oC and toluene a boiling point of 111
oC. When
the mixture containing 22% cyclohexane/78% toluene is heated to its boiling point of 101 oC (point A), the vapor contains 35% cyclohexane/65 % toluene (point B). If this vapor
is condensed, the condensate (point C) would contain 35% cyclohexane/65% toluene.
The condensate contains a much higher percentage of the more volatile cyclohexane and
the material left in the original flask has been enriched in toluene. The boiling point of
the material in the original flask will rise. As the distillation continues the boiling point
of the liquid in the flask will continue to rise and approach the boiling point of toluene. If
the vaporization process takes place only one time, this process is known as simple

79
distillation. For samples that contain compounds that differ in boiling point by less than
40 oC, simple distillation will not result in separation into pure components. Separation
of these mixtures requires a technique known as fractional distillation.
Fractional distillation
Let us return to the original condensate and consider what happens to it. If the
lower part of the distilling column is maintained at a higher temperature than the upper
part of the column, the condensate will be partially revaporized as it flows down the
column. As the original condensate (point C) is revaporized, the composition of the
vapor becomes 58% cyclohexane and 42% toluene (point D). If this vapor were
condensed, it would have the composition of point E. If this condensate were vaporized,
the vapor (point F) would have a composition of 78% cyclohexane/22% toluene. If this
process were repeated over and over again, pure cyclohexane would eventually emerge
from the distillation column and be condensed in the receiver vial.
This repetitive process is equivalent to performing a number of simple
distillations within the column and is known as fractional distillation. With each
vaporization/condensation cycle, the vapor phase produced in each step becomes
increasingly richer in the more volatile component. The condensate that flows down the
column correspondingly becomes richer in the less volatile component. Each of these
vaporization/condensation cycles is known as a theoretical plate. A measure of the
efficiency of a fractional distillation column is HETP or height equivalent to a
theoretical plate and is the vertical length of a column required to achieve one
theoretical plate. Using a column of sufficient length, packed with an appropriate
material, it is possible to separate mixtures whose component boiling points differ by
only 2-3 oC degrees.
During a fractional distillation of a binary liquid mixture, the head temperature
(the temperature at the top of the column) ideally should rise to the normal boiling point
of the more volatile component and remain there until that component is completely
removed. The head temperature may then drop somewhat, indicating that the more
volatile component has been removed. If additional heat is provided, the less volatile
component will begin to distill, and the now higher head temperature should remain
constant until all of the second component has distilled. A distillation should not be

80
stopped if this small drop in temperature occurs. In fact, your experimental results are
likely to look different from the ideal graph on the next page due to poor insulation in the
microscale apparatus.
In a laboratory fractional distillation apparatus, a column is packed with an inert
material on which successive condensations and vaporizations take place. You will be
using a copper sponge.
To ensure a successful distillation a number of details must be considered. One of
the most important considerations in a fractional distillation is the rate at which
distillation occurs. The tendency is to distill the sample as fast as possible. This impulse
must be resisted. Implicit in the above discussion is that equilibrium is established
between the vapor and liquid phase. If the distillation is carried out too fast, liquid-vapor
equilibrium will not be established and the components will not separate cleanly.
Another consideration to ensure a smooth distillation is to include a boiling chip in the
distilling flask. Sometimes local superheating occurs that causes the solution to bump or
splash. To avoid this, the use of a boiling chip is required. The boiling chips are made of
75
80
85
90
95
100
105
110
115
0 20 40 60 80 100
Tem
pe
ratu
re (
oC
)
Distillate Volume (drops)
Fractionaldistillation
Simple distillation

81
a porous inert material. Small air bubbles trapped in the pores prevent superheating by
providing nuclei for bubble formation. A third consideration is the size of the distilling
flask. This flask should be no larger that twice the volume of liquid to be distilled. Use
of a larger flask will result in excessive loss of material due to the large vapor volume
and high glass surface area. The additional glass area also acts as a condenser making it
difficult for the material to rise in the column. A final consideration is the correct
placement of the thermometer. The thermometer should be positioned where the top of
the mercury-containing bulb is level with the bottom of the side arm leading to the
receiver vials. If the position of the thermometer is incorrect the measured boiling point
will be wrong. If it is too high, the temperature that is shown on the thermometer will be
low. You will be measuring the temperature of the air rather than the temperature of the
vapor phase.
Finally two safety precautions must be observed. First never heat a closed
system. As you heat the apparatus, the gas within the system begins to expand. As the
gas continues to expand there may be a rapid increase in pressure that could result in the
system coming apart. Therefore in adding the copper sponge to the fractionating column,
make sure you do not plug the column. A second consideration is to always stop a
distillation before the flask becomes completely dry. When the flask is dry, its
temperature may rise quickly. Some organic substances, especially alkenes and ethers,
may contain peroxides as impurities that could be concentrated and can explode when
dry.
In today’s experiment you will be conducting two distillations. In the first you
will separate a mixture of toluene and cyclohexane to become familiar with the technique
of distillation. In the second distillation you will carry out a fractional distillation. You
will graph both distillations, and will analyze the collected fractions by gas
chromatography.
Gas Chromatography (GC)
This is the first example of chromatography that you will be exposed to in this lab. Other
types that will follow are thin-layer chromatography (TLC) and column chromatography.

82
All of these follow the same basic principle for separation of mixtures: the mixture is
dissolved in a mobile phase (either a gas or liquid) and passed through a stationary phase
(the column). Based on physical properties of the components of the mixture, such as
boiling point and polarity, the components will pass through the stationary phase at
different rates. Thus, they elute from the column at different times. The gas
chromatograph instrument consists of a high-temperature injection port (where the
sample is volatilized), an oven that contains a coiled metal or glass column packed with
firebrick, and a detector at the end of the column. This column is an inert support for a
low molecular-weight polymer such as Carbowax (the stationary phase). The mobile
phase is helium gas, which acts as a carrier for the mixture being analyzed. In practice, a
small (1 l) dilute sample is injected. It dissolves in the Carbowax, and the volatile
components evaporate and are swept along the column by the helium, where they
redissolve in the Carbowax, reevaporate and are carried further along the column until
they eventually reach the detector, an electrically heated tungsten wire. When an organic
sample contacts the wire, it heats up, affecting the electrical resistance. The
chromatogram records the current vs. time. The time for a particular component to elute
is the retention time. The integrator then integrates the area under the signal to give
relative percentages of each component of the mixture. An example of the separation of
a mixture of cyclohexane and toluene is shown below.
Procedure
D e t e c t o r c u r r e n t
0
Time (min)
4 8
The retention time of component A is 4 minutes, and of B is 8 minutes.
AB

83
Note: Half of the lab will do the simple distillation and the other half will do the
fractional distillation. Your TA will tell you which one you are doing (the only
difference is the use of a Vigreaux column for the fractional distillation). You will
find a group and share data for whichever distillation you are NOT doing.
Distillation
1. Obtain a mixture of cyclohexane/toluene (5.0 mL) from the front of the lab and
transfer it to the 10 mL round bottom flask. Add a boiling chip to the flask and assemble
the distillation apparatus as directed by your TA. For the fractional distillation, assemble
the distillation apparatus with a Vigreaux column inserted between the distillation flask
and the distillation head. Placement of the thermometer bulb is critical in this experiment
as discussed earlier. The bulb of the thermometer should be just below the sidearm of the
distilling head.
2. Lower the distillation apparatus into the sand bath to heat the sample. The receiver
vial should immersed in an ice bath to cool the distilled vapors and the end of the
condenser side arm should be inside the receiver vial to minimize the vapors released to
the lab.
3. Continue heating the sample until distillation begins. Two conditions are required for
a successful experiment:
a. The distillation rate should be slow in order to ensure the temperature
registering on the thermometer does not lag behind the vapor temperature. A
steady distillation rate of 3-4 drops per minute is good. If a drop of liquid cannot be
seen suspended from the end of the thermometer, the rate of distillation is too fast.
The rate of distillation may be controlled by adding or removing sand from around
the flask with a glass stirring rod (NOT METAL and NEVER use a thermometer!!).
b. A constant distillation rate. Do not continually adjust the distillation rate
once you have started collecting data.

84
4. Record the temperature as every other drop distills (note: you are counting the drops
coming out the end of the vacuum distillation adapter, NOT the drops on the
thermometer). Continue collecting data until approximately 0.5 mL are left in the round
bottom flask. (Note: approximately 21 drops/mL) To stop the distillation raise the
apparatus out of the sand and allow it to cool. After the data has been collected, plot the
drop number vs. temperature.
You should have three vials ready and labeled (F1-F3). Collect the distillate as it
condenses into receiver vials. Discard the first few drops as the temperature is rising (this
is called the fore-run). Once the temperature is constant (within about 3-4˚C), collect the
first fraction into a vial labeled F1. When the temperature drops and then begins to rise,
switch to F2 until the temperature levels out again. Once it has leveled out, collect the
drops into a vial labeled F3.
5. Take a GC trace of vials F1 and F3. Your TA will explain how to use the GC. The
GC trace should have two peaks: one for cyclohexane and one for toluene. It will also
integrate the area under each peak. To calculate your % composition, add up the total
area for the cyclohexane and toluene peaks and calculate the % of each. Identify the
components based upon the GC trace (and bp), and report the percent composition of the
two components. Turn in the GC trace of F1 and F3 with your lab report.
Lab Report: use the worksheet provided, which includes the following sections:
I. Introduction: a summary of the concept of distillation and the purpose of the lab,
including structures of toluene and cyclohexane and the bp of each one
III. Procedure and Observations (parts I, II and the Procedure part of III should be
completed before lab). Observations should include any deviations from procedure and
relevant observations-this is what you will use to write up your results. The observations
are recorded during lab and don't need to be complete sentences.
IV. Results: This is basically a summary of your observations and should be written after
the lab, in complete sentences. This should include the graphs for the simple and
fractional distillations (drop # vs. temperature), GC trace and percent compositions of F1
and F3.

85
V. Conclusions: a brief summary of what you learned from this lab, and discussion of the
purity of recovered cyclohexane and toluene, including what you may have done to
improve the purity.
Bring the worksheet to lab and turn in the completed worksheet as your lab report
for this experiment.

86
APPENDIX D
Traditional Column Chromatography Lab
Isolation of Caffeine by Column Chromatography
Summary: Caffeine will be isolated from tea using liquid-liquid extraction and then
purified by column chromatography
Techniques: liquid-liquid extraction, TLC and column chromatography
The isolation of compounds with pharmacological properties from plants is a vital
area of activity in the pharmaceutical industry. Many of these isolations are based on the
differences in solubility of various compounds for different solvents. In today’s
experiment you will first take advantage of caffeine’s solubility in water to extract it from
either instant tea or tea leaves and then separate it from other water soluble compounds
such as tannins by extraction with an organic solvent. A final purification of the caffeine
utilizing column chromatography will be carried out and the purity of sample determined.
Caffeine is one of the most widely used drugs in the world. Its role as a stimulant
has been known for thousands of years. However the pure compound was not isolated
until 1821 by Pierre Jean Robiquet. It is present in coffee beans, tea leaves, and cocoa
beans, where it may represent up to 5% of the mass. It has a number of physiological
effects including stimulating respiration, heart rate and the central nervous system. In
addition it acts as a vasodilator and a diuretic. Many popular stay-awake preparations
N
N N
N
O
H3C
O
CH3
CH3
Caf feine

87
contain caffeine as the main ingredient. Overuse of caffeine has several side effects such
as insomnia, restlessness, headaches, and muscle tremors.
Caffeine is a member of a class of bitter tasting compounds known as alkaloids.
Alkaloids are compounds isolated from plant sources that possess a basic nitrogen. Many
alkaloids have pharmacological properties and include nicotine, cocaine, morphine, and
strychnine. Structurally caffeine belongs to a class of nitrogenous bases called purines.
Other purines include the DNA components adenine and guanine.
We have already covered two methods of purifying organic compounds: recrystallization
and distillation. Today’s experiment introduces two new purification techniques,
extraction and column chromatography. Extraction is a chemical operation based on the
distribution or partitioning of a substance between two phases. The two most common
types of extraction are liquid-liquid and solid-liquid. In liquid-liquid extraction a sample
is placed in a mixture of two immiscible (insoluble) solvents. In many cases the two
Isolation of Caffeine from Tea Leaves
Tea
Caffeine
Tannin Saltsin Water
CH2Cl2Na 2CO 3
Water
Isoluble CellularMaterial
Tea Leaves
Caffeine andother
compoundsin CH2Cl2
Chromatography

88
solvents are water and some organic solvent such as ether or methylene chloride. The
substance will partition itself based on its relative solubility in the two solvents. A
measure of this distribution is known as the partition coefficient (K).
For example, the solubility of caffeine in water is 2.2 mg/mL at 25 oC and in
dichloromethane (methylene chloride) is 89 mg/mL. The partition coefficient is therefore
40. Knowledge of the distribution factor allows one to determine the efficiency of a given
extraction. As an example suppose 50 mg of caffeine was removed from 1 g of tea leaves
into 50 mL of water during an initial extraction process. We now wish to purify the
caffeine by extracting it into 20 mL of dichloromethane. How much of the caffeine is
transferred to the dichloromethane layer and how much remains in the original water
layer? If X is the caffeine extracted into the dichloromethane layer then 50 - X is the
caffeine remaining in the water layer.
Solving for X reveals that 47.1 mg of caffeine is transferred to the dichloromethane layer
while 2.9 mg remains in the water layer.
There are a number of practical considerations in picking an extraction solvent.
The extracting solvent must not react chemically with the components of the mixture.
Also the extracting solvent must be insoluble in the original solvent. The extracting
solvent must selectively remove the desired compound from the original solution, and
finally the solvent must be easily removed from the solute.
In addition to liquid-liquid extraction, another form of extraction is solid-liquid in
which a solid is treated with a solvent in a beaker or Erlenmeyer flask followed by
filtration of the extracted solvent from the solid. This is the procedure for the first
extraction of caffeine from the tea leaves.
So
Sw= =
Co
CwK
solubility of X in organic layer (g/mL)
solubility of X in w ater layer (g/mL)=
KD = 40 =
50
X
20
50 -X

89
Even after the second extraction, the isolated caffeine is still not pure. This can
be seen in the slight green tinge of the isolated caffeine, as pure caffeine is a white
crystalline solid. Therefore the caffeine requires at least one more purification step.
Several are available. One is recrystallization, and another is sublimation. During
sublimation a solid samples vaporizes into the gas phase without passing through the
liquid phase. Sublimation is not a general technique since many compounds do not
sublime. However if sublimation is possible, the purification proceeds with using a
solvent or any transfer steps resulting in a reduction in sample loss.
Another more general method is chromatography, particularly column
chromatography. Column chromatography is similar to thin layer chromatography in
that it is a liquid-solid adsorption technique. Its main purpose is to separate the
components of a complex mixture. However column chromatography is easily scaled up
for preparative applications unlike thin layer chromatography. In column
chromatography, a vertical glass tube is packed with a polar adsorbent along with a
solvent. Many of the packing materials used for column chromatography are the same as
those used for thin layer chromatography. The sample is added to the top of the column;
then additional solvent is passed through the column to wash the components of the
sample down the column. As the sample descends the column the sample interacts with
the stationary and mobile phases. The relative strengths of those interactions determine
the speed at which the sample moves down the column. Fractions are collected as the
column is eluted and analyzed for the presence of the desired compound. For further
information on various mobile and stationary phases see the discussion on thin layer
chromatography in the preceding experiment.
Reference
Taber, Douglass F. and Hoerrner R. Scott “Column Chromatography: Isolation of
Caffeine” Journal of Chemical Education, 1991, 68(1), 73.
Procedure
1. Weigh 2.0 g of instant tea and place in a 50 mL beaker.
2. Add 10 mL of distilled water and 1.1 g of anhydrous Na2CO3. Mix thoroughly and
allow the mixture to sit for 10 minutes.

90
3. NOTE: liquid-liquid extractions are usually carried out in a separatory funnel,
however in this case the mixtures forms intractable emulsions; so for ease of separation
this will be carried out in a centrifuge tube - centrifuging the mixture facilitates
separation of the layers. Transfer the contents of the beaker to your centrifuge tube and
add 2 mL of CH2Cl2 (dichloromethane). After putting the snap-cap on the centrifuge
tube, extract the caffeine into the organic layer by inverting the tube several times to mix
the two layers.
4. In the event that the two layers do not separate cleanly, centrifuge the samples for a
few minutes. (MAKE SURE THE CENTRIFUGE IS BALANCED!) Use a pipet to
remove the organic layer containing the caffeine and transfer it to an Erlenmeyer flask.
Note: dichloromethane is more dense than water, so the organic layer is the bottom layer.
5. Carry out the extraction two more times and combine the CH2Cl2 from all three
extractions in a small erlenmeyer flask.
6. Dry the organic layer by adding calcium chloride until the liquid is no longer cloudy.
7. Pipet the solution into a 50 mL round-bottom flask (with 19/22 joint) and concentrate
the sample to about 0.5 mL under reduced pressure on the rotary evaporator.
Purification by Column Chromatography
8. Preparation of column
Fill the column about 1/2 full with alumina. If available, add a thin layer of sea sand to
the top of the column (this step is not crucial). Fill the column with CH2Cl2 and let it
drain to the top of the sand, while tapping gently to release air bubbles. The solvent level
should be just even with the top of the upper layer of sand - if it is too low there will be
air bubbles in the column, and if it is too high then your caffeine sample will diffuse up
into the solvent rather than go onto the column.
9. Dissolve the caffeine sample in a minimum volume of CH2Cl2, SAVE one drop in a
clean vial for a TLC sample, and add all of the remainder to the top of the column.
Allow the liquid to drain to the top of the sand. Rinse the flask with an additional 0.5 mL
of dichloromethane and add that to the column, then allow it to drain to the top of the
sand.
10. Fill the column with 5% ethyl acetate/CH2Cl2. Allow it to drain to the top of the
sand, while collecting the eluent into a clean container (small beaker or erlenmeyer).

91
(Note: you can make the column drain faster by CAREFULLY squeezing air through a
pipet bulb placed on the top of the column). Next, fill the column with 10% ethyl
acetate/CH2Cl2, allow it to drain into a separate container. Repeat with 20%, 40%, and
60% ethyl acetate/CH2Cl2. Each container is one "fraction" from the column.
11. Check the purity of the fractions by TLC: prepare a TLC plate with lanes for each
fraction and one lane for your crude caffeine. Develop the plate (as you did in the TLC
lab) with 5% methanol/ethyl acetate, visualize with UV and identify the fractions
containing the caffeine.
12. Combine the fraction(s) containing caffeine and remove all of the solvent under
reduced pressure on the rotavap (tare your flask first!). Determine the weight of caffeine
isolated and calculate the mass percent caffeine in tea.
Lab Report:
Your report for this experiment should include:
I. Introduction: a summary of the concepts of extraction and column chromatography
and the purpose of the lab
II. Table: structure and properties of caffeine
III. Procedure and Observations (parts I, II and the Procedure part of III should be
completed before lab). Observations should include any deviations from procedure and
relevant observations-this is what you will use to write up your results. The observations
are recorded during lab and don't need to be complete sentences. This may include
drawings of TLC plates, although this can be by calculations.
IV. Calculations: Rf calculations and percent recovery.
V. Results and Conclusions: This is basically a summary of your observations and
should be written after the lab, in complete sentences. This should include Rf value for
caffeine, as well as column results (which fractions contained caffeine), and the percent
recovery of caffeine from the tea.

92
APPENDIX E
Traditional Spectroscopy Lab
Infrared Spectroscopy and NMR to Identify an Unknown
Techiques: IR spectroscopy, NMR spectroscopy
Purpose: To identify a simple unknown compound using 1
H and 13
C NMR, and IR. First, use
IR to identify which type of functional group is present in both a solid and a liquid unknown.
Then, obtain specific information on number and type of unique carbons (13C NMR) and
connectivity and types of protons (1H NMR) to assign a full structure to the liquid unknown.
Infrared spectroscopy is one of the fastest methods for determining information about
molecular structure on a wide variety of samples. It is especially useful for identifying
functional groups present in a molecule. However, the pattern of absorptions in each spectrum
is as unique as a fingerprint for a given compound, so it can also be used as an indication of
whether a reaction formed the desired product. Infrared data is measured in units of frequency
= c, conventionally given in units of cm-1 (although physicists use m). We will be using
Fourier-transform instruments, which collect data from 400-650 cm-1 all at once, then
transform it to a y scale expressed in % transmittance (0-100) or absorbance (0-1). Next
semester, you will be responsible for measuring IR spectra of many of your products to turn in
with your laboratory reports.
IR Interpretation. The identity of a functional group and its environment within the molecule
determine the position and intensity of absorption bands. Generally, there are 4 major regions
of the spectrum to look for clues (Table 2-7 in Solomons and Fryle).
Sample Preparation. One of the great things about IR is that it can be measured on samples in
nearly every physical state. Samples as diverse as industrial stack gases to thin films of paint
on aluminum cans may be analyzed quickly. The two IR’s in the organic instrument room are
equipped with standard sample compartments for measuring solids and liquids, the normal
physical states for our products. Liquids. Normally, liquids are measured neat (without
solvent) or in solvent between NaCl or AgCl plates, which do not absorb in the IR region of
interest. However, salt plates are hygroscopic or light sensitive and fragile.

93
In our lab, both IR's have a special apparatus called a single-bounce attenuated total
reflection apparatus (ATR) to collect data for liquid and some solid samples. The ATR is very
convenient because it almost completely cuts out sample preparation. The principle behind
this technique is based on the use of mirrors to direct the IR beam into the crystal at an angle
that causes it to bounce off onto another mirror that delivers the beam to the detector. The
geometry of the apparatus is such that the energy of the IR beam is affected by absorptions in
the thin layer just above the crystal face (~1 m). If the IR beam “sees” a sample of air (as it
does in the background), absorbances due to water vapor and perhaps CO2 (if you breathed on
the sample) are present. If something else is in close contact with the crystal, absorbance due
to that material will be detected.
Since many of the functional groups that are easily identified by IR will not be discussed
thoroughly until CHEM 3020, we will only consider spectra for the following functional
groups in this lab: alkanes, aromatics, alkynes, alkenes, alcohols, nitriles, aldehydes, and
ketones, amines, and esters. Your unknown will be one of the structures given below:
KETONES: O
OO O O
ALDEHYDES:
H H H
O
O OH
O H
OH
O
ALCOHOLS:
OH
OH
OH
OH
OH
HO
CARBOXYLIC ACIDS:

94
OH
HOOH
O
O
OH
O
O
CARBOXYLIC ESTERS:
OCH3
OCH3
OO
H3COO
O
OCH3
O
OO
AMINES:
NH2
NH2 NH2 HN
NH2
HN
Procedure: NMR spectroscopy
1. Find your assigned liquid unknown (make sure you use the same sample number for both the
IR and NMR!!!). Go to the NMR room (back of DSB 216). In order to save time, NMR
samples of the unknowns have already been prepared for you in CDCl3. Add your sample to the
queue. The only change in procedure from the elimination laboratory is that you will push the
[carbon/DEPT 135 and proton] buttons instead of only [carbon]. Each sample normally takes
<10 minutes to run and print.
3. Use Tables 14.5 and 14.5 (Smith) to assign peaks to protons in your simple organic liquid
unknown. Recall that CDCl3 has residual protons and these appear at 7.26 ppm in the proton
spectrum, along with the TMS reference peak at 0.00 ppm. In 13C NMR, the solvent shows up in
a large triplet at 77.00 ppm.
4. You can verify whether you have assigned your unknown correctly by modeling the 1H and
13C spectra using ChemDrawUltra (instructions also provided previously).
IR Instructions

95
Don't look into the IR beam, since it can damage your eyes.
Taking an IR spectrum
1. Take a background spectrum by selecting the Background key with an empty
compartment and clean ATR crystal (this will most likely be done by your TA and
does not need to be repeated for each sample).
START HERE FOR CHEM 3011 and 3021.
2. Place one drop of liquid on the ATR crystal. (be careful not to breathe into the sample
compartment).
3. Collect the spectrum by clicking on the "collect sample" icon.
4. Select the "top" spectrum from the grid at the bottom of the screen.
5. AT THIS POINT, THE NEXT USER CAN CLEAN THE ATR AND PLACE
HIS/HER SAMPLE ON THE CRYSTAL
6. Choose Peak label.
7. Print (twice if needed). The next user is ready to go.
NMR Interpretation Hints
In order to have more time for interpretation, the NMR samples of each liquid unknown
are already prepared. Each team will set up 1H and 13C NMR and DEPT 135
experiments. This will take about 10 minutes once the sample is in the NMR. After this,
you should begin to interpret the spectra.
All the liquid unknowns have simple structures (and one functional group). The best
approach to fully solving the unknown structure is to:
1. Look at the IR for clues about functional groups.
2. Count the number of unique carbons in the 13
C NMR spectrum and get an idea about
the environment of the carbons (e.g. aromatic, carbonyl, etc.). Remember that the

96
DEPT spectrum will have NO quaternary carbons, CH/CH3 will point up and CH2
will point down. NOTE: the instrument doesn't really "know" which signals are
CH/CH3 and which are CH2 so it automatically phases the largest signal "up".
SOMETIMES the largest signal is actually a CH2, so the DEPT will be inverted. This
usually occurs when there are long alkyl chains. Think about what makes sense...for
instance if you see one "down" signal and many "up" signals in the alkyl region, you
may have an inverted DEPT.
3. Look at the 1H NMR spectrum to get an idea about the environment of the protons
(from ppm values), connectivity (from multiplicity), and ratios of protons in each signal
(from integration) in the molecule (see below for brief descriptions).
There are a few tricky aspects for the beginner in analyzing an unknown.
1. Symmetrical molecules. Some molecules will appear to have fewer carbons and
protons (usually 1/2) than expected due to symmetry of the molecule. For example,
diethyl ether, CH3CH2OCH2CH3, shows 2 carbons in the 13
C spectrum and 2 groups of
protons in a ratio of 2:3 at 3.5 and 1.1 ppm, respectively. This would first lead one to
suspect that the molecule was ethanol, but no alcohol proton is present. This could be
confusing without the IR spectrum, which shows that there is an ether C-O stretch
and no alcohol O-H stretch.
2. Extra peaks: Don't forget that NMR solvents are deuterated. In 13C samples run in
CDCl3, deuteriums split the carbon into a large triplet at 77.00 ppm. Residual protons
in the NMR solvent show up in 1H NMR as well. For example, TMS protons appear
at 0 ppm, and residual CHCl3 in CDCl3 results in a singlet at 7.26 ppm.
3. Missing peaks. Occasionally, peaks will be partially cut off on the high ppm
(downfield) side of the spectrum in proton or carbon (ask your TA if you think that it
has happened to you). Note that unusually broad peaks can indicate the presence of
exchangeable protons such as those in alcohols or carboxylic acids.
Chemical Shifts:
The value on the x axis (chemical shift) for each peak or group of peaks is a good
indicator of the proton (or carbon) environment in a molecule. Apply the usual rules to

97
interpreting 1H and 13C spectra. Remember, protons near two functional groups are
affected by both (e.g. in benzyl bromide, C6H5CH2Br, the methylene protons appear at
4.10 ppm, much further downfield than expected for either benzylic or bromoalkane
protons.
Integration:
Integrals will be reported on your spectrum. You will usually need to scale this so that the
smallest signal = 1 proton.
Multiplicity:
If the splitting (s, d, t, m, etc.) is not clear in your 1H spectrum, ask your TA to expand
the region of interest in the spectrum so that you can look at it more closely.
Multiplicity is useful for determining connectivity (n+1 rule).
Report: Write a normal report, including introduction, procedure, results, and
conclusions. The results section should include printouts of: IR spectra, 1H and 13C
NMR spectra of your liquid sample. Include also a ChemDraw Ultra 1H and 13C model
of your liquid unknown. Instead of a discussion section, label the peaks on the spectra
that support identification of your IR functional group and those that support the presence
of either an aromatic or aliphatic skeleton. For example, for a peak at 1730 cm-1, write
C=O above the peak. Draw the structure of the proposed compound on your NMR
spectra and draw lines from protons in the molecule (drawn on your spectra) to peak or
group of peaks in the spectrum. For example, a 13C line at 210 ppm could correspond to a
carbonyl carbon (C=O) in a ketone, so draw a line from your proposed ketone structure
from the carbonyl carbon to the line at 210 ppm. NOTE: If you just turn in spectra with
no analysis by YOU (not just ChemDraw Ultra) and no support for your structural
assignment, you will NOT get a good grade!!

98
APPENDIX F
Discovery-Based Lab Unit
Terpene Isolation Unit
The volatile oils of many plant materials contain terpenes. Terpenes are hydrocarbons
that may or may not be oxygenated. They are all formed biosynthetically from isoprene,
or 2-methyl-1,3-butadiene, which is one of nature’s most common building blocks. The
C5H8 units are linked head-to-tail and may be linear or cyclic. Many terpenes are chiral,
and some have distinctive odors. The most common combinations are monoterpenes,
which have two isoprene units, sesquiterpenes, with three units and diterpenes, with four
units. Some examples of each, with the isoprene units numbered, are shown below.
In this three-week unit, you will isolate a terpene from a plant source by steam
distillation. You will then carry out further purification if necessary. This is to be
Terpenes
isoprene(2-methyl-1,3-butadiene)
isoprene unit: isoprene unitscombine in linear or cyclic form; they may contain double bonds or oxygens
1
2
3
4
Monoterpene: two isoprene units (C10)
OH
1'2'
3'4'
1
2
3
4
grandisol
Sesquiterpene: three isoprene units (C15) Diterpene: four isoprene units (C20)
H
H
-cadinene
1
2
3
4
1'
2'
3' 4'
1"
2"
3"
4" O
OH
O
AcO
O
HO
O
Ph
OAc
HO
Baccatin (precursor to taxol)
12
3
4
1'2'
3'
4'1"
2"3"
4"
1*2*
3*4*

99
determined by TLC, and column chromatography if needed. You will then collect IR,
NMR and optical rotation of your pure terpene. Assignment of all signals will provide
valuable practice in NMR spectroscopy. At the end of the unit, the class will assemble a
table including structures, supporting data, and per cent recovery.
The materials isolated in this unit will be your starting material for reactions in the next
unit, so recovery is important!
Week 1 Pre-lab exercise:
For the chosen plant materials, identify the expected major component(s). Include
structure and boiling point. Identify the isoprene units.
Week 1 Steam Distillation of Terpenes from Herbs/Spices
In this experiment, you will use the same steam distillation procedure that is used for the
isolation of R-(+)-limonene, although you will use different plant materials. Possible
plant materials that will be available include spearmint, caraway, lavender, rosemary and
coriander seed. You may also try a different plant or spice, but you will need to have it
prepared (ground up) before lab, and also have an idea what to expect as the major
component.
Taken in part from:
http://academic.bowdoin.edu/courses/s05/chem226/laboratory/images/limonene.pdf
Isolation of Limonene by Steam Distillation
This technique basically involves boiling orange peel in water, but to understand why this
works we need to delve into distillation theory a bit. Distillation is the process of heating
and vaporizing a liquid, and condensing and collecting the vapor. In the distillation of a
pure substance the temperature of the system will stay constant (at the boiling point of the
liquid) as long as there is both liquid and vapor in the system. Remember that the
boiling point is defined as when the vapor pressure of a liquid equals the applied
pressure. You have already carried out a distillation of a mixture of MISCIBLE liquids.

100
However, limonene is not soluble in water. Therefore when you boil orange peel and
water, the limonene droplets are not miscible in the water and the two liquids exert their
own vapor pressure independent of each other. These two pressures (from water and
limonene) commonly exert pressure against the atmospheric pressure, and when the sum
of the two partial pressures equals 760 mm Hg, boiling occurs. So if water boils at 100˚C
at 760 mm, and limonene boils at 176˚C at 760 mm Hg, when you are heating a non-
miscible mixture of the two, the combined pressure exerted by the two liquids will reach
760 mm Hg below the boiling point of either of them! This technique is called steam
distillation – used for distilling high boiling materials at a temperature below their boiling
points. OF COURSE MUCH WATER DISTILLS THIS WAY TOO, SO YOU STILL
HAVE TO SEPARATE THE LIMONENE FROM THE WATER. Since they are not
miscible this will be done by liquid-liquid extraction using water and dichloromethane.
You will be using a short-path distillation set-up, which will allow for distillation of
larger volumes than the one in the yellow kit. A picture is given below:
1 Still pot 2 Short-path distillation head
3 Thermometer 4 Distillate receiver
5 Connection to vacuum or inert gas 6 Coolant inlet
7 Coolant outlet 8 Connection to vacuum or inert gas

101
Procedure:
1. If you are using seeds, grind them in a mortar/pestle. Leaves can be chopped or put
whole into the distillation pot. You will want enough to fill the flask about ½
(approximately 2 cups of leaves).
2. Weigh out plant material.
3. Place the material and 150ml H2O in a 250ml round-bottom flask, along with a couple
of boiling chips.
4. Attach the 24/40 to 14/20 adapter, short-path distillation head and a 100ml flask for
collection.
5. Heat to boiling, record temp. and collect as much liquid as possible in 2hrs.
6. Pour the collected water/oil mixture into a separatory funnel. Add 15ml CH2Cl2, shake
and separate. Collect the bottom (organic) layer. Add a second 15ml to the separatory
funnel, shake, separate and combine the two organic layers. Add calcium chloride to dry
the organic layer. Transfer to a tared round-bottom flask and evaporate the
dichloromethane on the rotavap. Record final weight of oil, calculate % yield of crude
oil.
7. TLC: run two TLC plates in different eluting solvents (1:15 ethyl acetate/hexane and
1:3 ethyl acetate hexane). Record in notebook, with Rf values.
Weeks 2 and 3
Purification of Terpenes from Herbs/Spices and Data Collection
There are two main objectives this week. The first is purification, if necessary, of your
oil collected last week. Purity should be have been determined by TLC, and if there is
more than one major component, you will need to do column chromatography. The
second objective is to collect spectroscopic data. You will collect both IR and NMR
data. Also, IF your yield of material was < 300mg you may want to distill more material.

102
This can be set up at the beginning of lab and continue while you work with your oil from
last week.
Week 2. PRE-LAB
Build structures of two expected products on ChemDraw, and model the NMR spectra.
Week 2 Procedure:
1. Pack the chromatography column with silica gel (about 2/3 full), and add hexane to
wet the silica.
2. Dissolve your crude oil in about 0.5ml CH2Cl2. Save one drop for TLC, pipet
remaining material onto the column. Rinse the flask with another 0.5 ml CH2Cl2 and add
to top of column. Drain to top of silica. Fill with hexane and elute 4x with hexane.
3. TLC fractions 1-4. If no compound has come out, you will elute next with ethyl
acetate/hexane mixtures, increasing the polarity each time (higher % of ethyl acetate).
This will be different for each student.
4. Collect the appropriate fractions, evaporate and record weight.
5. Collect NMR (1H, COSY and 13C if enough compound is present).
Week 3 Procedure:
1. Analyze all NMR data. Propose structures and explain how spectroscopy supports
your assignment.
Spectroscopy basics:
IR: Infrared spectroscopy is one of the fastest methods for determining information
about molecular structure on a wide variety of samples. It is especially useful for
identifying functional groups present in a molecule. However, the pattern of absorptions
in each spectrum is as unique as a fingerprint for a given compound, so it can also be
used as an indication of whether a reaction formed the desired product. Infrared data is
measured in units of frequency = c, conventionally given in units of cm-1. We will be
using Fourier-transform instruments, which collect data from 4000-650 cm-1 all at once,
then transform it to a y scale expressed in % transmittance (0-100) or absorbance (0-1).

103
IR Interpretation. The identity of a functional group and its environment within the
molecule determine the position and intensity of absorption bands. Generally, there are 4
major regions of the spectrum to look for clues (Ch. 13 in Smith).
Sample Preparation. One of the great things about IR is that it can be measured on
samples in nearly every physical state. Samples as diverse as industrial stack gases to
thin films of paint on aluminum cans may be analyzed quickly. The two IR’s in the
organic instrument room are equipped with standard sample compartments for measuring
solids and liquids, the normal physical states for our products. Liquids. In our lab, both
IR's have a special apparatus called a single-bounce attenuated total reflection apparatus
(ATR) to collect data for liquid and some solid samples. The principle behind this
technique is based on the use of mirrors to direct the IR beam into the crystal at an angle
that causes it to bounce off onto another mirror that delivers the beam to the detector.
The geometry of the apparatus is such that the energy of the IR beam is affected by
absorptions in the thin layer just above the crystal face (~1 m). If the IR beam “sees” a
sample of air (as it does in the background), absorbances due to water vapor and perhaps
CO2 (if you breathed on the sample) are present. If something else is in close contact
with the crystal, absorbance due to that material will be detected.
NMR Interpretation: NMR provides far more information than IR. 13C-NMR, in
combination with DEPT135 tells you how many unique carbons are in the compound, and
of those, how many are C, CH, CH2 or CH3. Also, the chemical shift gives valuable
information about any functional groups that are present. 1H-NMR tells how many
unique hydrogens are in the compound, information about functional groups based on
chemical shift, as well as a “map” based on spin-spin splitting. You will need to assign
as many signals as you possibly can for your structure.
Extra peaks: Don't forget that NMR solvents are deuterated. In 13C samples run in
CDCl3, deuteriums split the carbon into a large triplet at 77.00 ppm. Residual protons in

104
the NMR solvent show up in 1H NMR as well. For example, TMS protons appear at 0
ppm, and residual CHCl3 in CDCl3 results in a singlet at 7.26 ppm.
13C-NMR: Count the number of unique carbons in the 13
C NMR spectrum and get an
idea about the environment of the carbons (e.g. aromatic, carbonyl, etc.). Remember that
the DEPT spectrum will have NO quaternary carbons, CH/CH3 will point up and CH2
will point down. NOTE: the instrument doesn't really "know" which signals are CH/CH3
and which are CH2 so it automatically phases the largest signal "up". SOMETIMES the
largest signal is actually a CH2, so the DEPT will be inverted. This usually occurs when
there are long alkyl chains. Think about what makes sense...for instance if you see one
"down" signal and many "up" signals in the alkyl region, you may have an inverted
DEPT.
1H NMR: The value on the x axis (chemical shift) for each peak or group of peaks is a
good indicator of the proton (or carbon) environment in a molecule. Apply the usual rules
to interpreting 1H and 13C spectra. Remember, protons near two functional groups are
affected by both (e.g. in benzyl bromide, C6H5CH2Br, the methylene protons appear at
4.10 ppm, much further downfield than expected for either benzylic or bromoalkane
protons.
Integration:
Integrals will be reported on your spectrum. You will usually need to scale this so that the
smallest signal = 1 proton.
Multiplicity:
If the splitting (s, d, t, m, etc.) is not clear in your 1H spectrum, ask your TA to expand
the region of interest in the spectrum so that you can look at it more closely. Multiplicity
is useful for determining connectivity (n+1 rule).

105
APPENDIX G
Survey

106

107

108

109
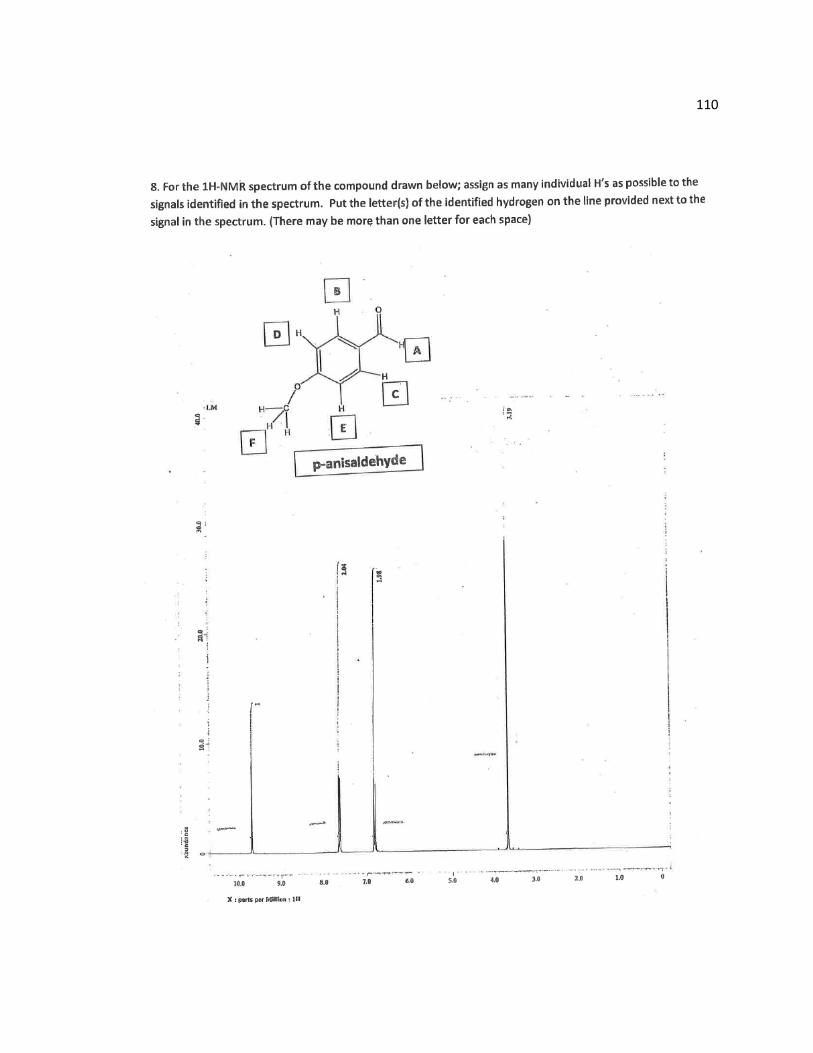
110

111

112

113
APPENDIX H
Spectroscopy of Essential Oils

114

115

116

117

118

119

120

121

122

123

124
APPENDIX I
Screen Plot for Factor Analysis of Likert Scale Survey