
Development of a Decision Support System Framework for ...
27
sustainability Article Development of a Decision Support System Framework for Cultural Heritage Management Eleonora Di Matteo 1 , Paolo Roma 1, *, Santo Zafonte 1 , Umberto Panniello 2 and Lorenzo Abbate 1 Citation: Di Matteo, E.; Roma, P.; Zafonte, S.; Panniello, U.; Abbate, L. Development of a Decision Support System Framework for Cultural Heritage Management. Sustainability 2021, 13, 7070. https://doi.org/ 10.3390/su13137070 Academic Editor: Asterios Bakolas Received: 31 March 2021 Accepted: 10 June 2021 Published: 23 June 2021 Publisher’s Note: MDPI stays neutral with regard to jurisdictional claims in published maps and institutional affil- iations. Copyright: © 2021 by the authors. Licensee MDPI, Basel, Switzerland. This article is an open access article distributed under the terms and conditions of the Creative Commons Attribution (CC BY) license (https:// creativecommons.org/licenses/by/ 4.0/). 1 Management & Economics Research Group, Department of Engineering, Università degli Studi di Palermo, Viale delle Scienze, 90128 Palermo, Italy; [email protected] (E.D.M.); [email protected] (S.Z.); [email protected] (L.A.) 2 Department of Management, Mathematics and Mechanics, Politecnico di Bari, Viale Japigia 182/B, 70126 Bari, Italy; [email protected] * Correspondence: [email protected] Abstract: Decision support systems (DSSs) have been traditionally identified as useful information technology tools in a variety of fields, including the context of cultural heritage. However, to the best of our knowledge, no prior study has developed a DSS framework that incorporates all the main decision areas simultaneously in the context of cultural heritage. We fill this gap by focusing on design-science research and specifically by developing a DSS framework whose features support all the main decision areas for the sustainable management of cultural assets in a comprehensive manner. The main decision-making areas considered in our study encompass demand management, segmentation and communication, pricing, space management, and services management. For these areas, we select appropriate decision-making supporting techniques and data management solutions. The development of our framework, in the form of a web-based system, results in an architectural solution that is able to satisfy critical requirements such as ease of use and response time. We present an application of the innovative DSS framework to a museum and discuss the main managerial implications and future improvements. Keywords: decision support systems; cultural heritage management; information technology; sus- tainability 1. Introduction Cultural heritage can be everything tangible and intangible that constitutes evidence of the value of a civilization. This category can include objects of art, books, documents, everyday objects, clothes, scientific instruments, opera foundations, museums, theatres, festivals, archives, and archaeological sites. It can also encompass parks, libraries, churches, and monuments of various kinds and types. In spite of the notable pre-COVID-19 growth of the travel and tourism sector [1], the fragmented nature of information on cultural heritage has made it difficult to plan strategic actions based on empirical evidence with the aim of increasing the economic and social sustainability of cultural heritage systems [2]. This leads to a lack of evidence-based strategies, inefficient use of resources, and missed opportunities, which make it difficult to face the current and future challenges of recovering from the COVID-19 pandemic and preserving and promoting cultural assets in an economically, environmentally, and socially sustainable way, as well as making heritage education accessible, participatory, and cross-cultural (e.g., [2,3]). These challenges, along with the increasing complexity and variety of management operations and their difficult analysis and control, give rise to the need for Information Technology (IT) tools that are capable of supporting the decision-making process for managing cultural heritage. Decision support systems (DSSs) have been traditionally identified as useful IT tools in a variety of fields, including the context of cultural heritage [3]. DSSs have indeed been shown to be able to confer competitive advantages [3]. They successfully increase Sustainability 2021, 13, 7070. https://doi.org/10.3390/su13137070 https://www.mdpi.com/journal/sustainability
Transcript of Development of a Decision Support System Framework for ...

sustainability
Article
Development of a Decision Support System Framework forCultural Heritage Management
Eleonora Di Matteo 1 , Paolo Roma 1,*, Santo Zafonte 1 , Umberto Panniello 2 and Lorenzo Abbate 1
�����������������
Citation: Di Matteo, E.; Roma, P.;
Zafonte, S.; Panniello, U.; Abbate, L.
Development of a Decision Support
System Framework for Cultural
Heritage Management. Sustainability
2021, 13, 7070. https://doi.org/
10.3390/su13137070
Academic Editor: Asterios Bakolas
Received: 31 March 2021
Accepted: 10 June 2021
Published: 23 June 2021
Publisher’s Note: MDPI stays neutral
with regard to jurisdictional claims in
published maps and institutional affil-
iations.
Copyright: © 2021 by the authors.
Licensee MDPI, Basel, Switzerland.
This article is an open access article
distributed under the terms and
conditions of the Creative Commons
Attribution (CC BY) license (https://
creativecommons.org/licenses/by/
4.0/).
1 Management & Economics Research Group, Department of Engineering, Università degli Studi di Palermo,Viale delle Scienze, 90128 Palermo, Italy; [email protected] (E.D.M.);[email protected] (S.Z.); [email protected] (L.A.)
2 Department of Management, Mathematics and Mechanics, Politecnico di Bari, Viale Japigia 182/B,70126 Bari, Italy; [email protected]
* Correspondence: [email protected]
Abstract: Decision support systems (DSSs) have been traditionally identified as useful informationtechnology tools in a variety of fields, including the context of cultural heritage. However, to the bestof our knowledge, no prior study has developed a DSS framework that incorporates all the maindecision areas simultaneously in the context of cultural heritage. We fill this gap by focusing ondesign-science research and specifically by developing a DSS framework whose features supportall the main decision areas for the sustainable management of cultural assets in a comprehensivemanner. The main decision-making areas considered in our study encompass demand management,segmentation and communication, pricing, space management, and services management. For theseareas, we select appropriate decision-making supporting techniques and data management solutions.The development of our framework, in the form of a web-based system, results in an architecturalsolution that is able to satisfy critical requirements such as ease of use and response time. We presentan application of the innovative DSS framework to a museum and discuss the main managerialimplications and future improvements.
Keywords: decision support systems; cultural heritage management; information technology; sus-tainability
1. Introduction
Cultural heritage can be everything tangible and intangible that constitutes evidenceof the value of a civilization. This category can include objects of art, books, documents,everyday objects, clothes, scientific instruments, opera foundations, museums, theatres,festivals, archives, and archaeological sites. It can also encompass parks, libraries, churches,and monuments of various kinds and types. In spite of the notable pre-COVID-19 growth ofthe travel and tourism sector [1], the fragmented nature of information on cultural heritagehas made it difficult to plan strategic actions based on empirical evidence with the aim ofincreasing the economic and social sustainability of cultural heritage systems [2]. This leadsto a lack of evidence-based strategies, inefficient use of resources, and missed opportunities,which make it difficult to face the current and future challenges of recovering from theCOVID-19 pandemic and preserving and promoting cultural assets in an economically,environmentally, and socially sustainable way, as well as making heritage educationaccessible, participatory, and cross-cultural (e.g., [2,3]). These challenges, along with theincreasing complexity and variety of management operations and their difficult analysisand control, give rise to the need for Information Technology (IT) tools that are capable ofsupporting the decision-making process for managing cultural heritage.
Decision support systems (DSSs) have been traditionally identified as useful IT toolsin a variety of fields, including the context of cultural heritage [3]. DSSs have indeedbeen shown to be able to confer competitive advantages [3]. They successfully increase
Sustainability 2021, 13, 7070. https://doi.org/10.3390/su13137070 https://www.mdpi.com/journal/sustainability

Sustainability 2021, 13, 7070 2 of 27
organizational control and individual productivity through their ability to manipulate dataaccurately and consistently [4]. In addition to this, they reduce costs and facilitate the iden-tification of measures that make a process more efficient and productive, creating usefulscenarios [3,5–7]. DSSs reduce work time by helping users to plan efficiently and improvethe level of customer engagement, thus saving time and money [8–10]. For instance, in theconstruction industry, DSSs have supported downtown development while preservingexisting cultural buildings, identifying restoration priorities constrained by a predefinedbudget, defining adaptive reuse strategies, and analyzing and storing information regard-ing changes in the historical building layout [3,5,6,11–13]. In the sustainable environmentalcontext, Trovato et al. [7] have designed a system that aims to help in landscape decisionmaking for the protection of natural and cultural heritage. Other DSSs have supporteddecisions for museum institutions by presenting graphs, statistics, and maps on visitormovement, optimizing exhibition project planning for art museums, capturing visitor data,and evaluating candidates for museum ambassador roles [9,10,14].
However, to the best of our knowledge, the extant literature has developed DSSframeworks for cultural heritage management that exclusively focus on specific deci-sion areas/problems without taking a comprehensive perspective that simultaneouslyincorporates all the main decision areas of interest for a manager in the cultural heritageenvironment. To fill this research gap, improve the decision-making process in the contextof cultural heritage, and better respond to the above current and future challenges in thisenvironment, this paper focuses on design-science research [15] and develops an innovativeDSS framework for the sustainable management of cultural assets as one output of anongoing research project: the IDEHA—“Innovations for data processing in the CulturalHeritage sector”—project (code ARS01_00421, http://www.ponricerca.gov.it/opportunita/progetti-di-ricerca-industriale-e-sviluppo-sperimentale/cultural-heritage/ (accessed on11 June 2021)), a large nation-level Italian research program funded by the Ministry ofEducation, University, and Research. Specifically, we propose a DSS framework basedon the study of the macro-processes of cultural heritage work, including the analysis ofthe interconnections between them considering the logic of the access and valorization ofcultural heritage, the management of cultural heritage, and the examination of significantprofessional profiles. The main decision-making areas considered in our study includedemand management, segmentation and communication, pricing, space management, andservice management. In each of these areas, we identify the crucial issues and design thetools and methodologies that can support cultural heritage managers in making interre-lated decisions. In some cases, we rely on tools that already exist in the literature andcombine them in a novel way. In some other cases, we develop them ad hoc.
We highlight that our study is fully connected to sustainability issues. Indeed, main-taining active and functioning cultural assets is the foundation of cultural sustainability,i.e., preserving cultural heritage, beliefs, and practices. Sustainability involves “ensuringthe continued contribution of heritage to the present through the thoughtful managementof change” that is “responsive to the historical environment and the social and culturalprocesses that created it” [16]. In the same vein, the “sustainable management of culturalheritage is considered important not just in guiding decisions about heritage conservationbut most of all in offering the necessary long-term and holistic framework for interpretinghow economic, social, cultural, and biological systems fit together” [17]. DSSs help achievethis goal by supporting managers to make the best decisions for the given cultural heritagesite and as such are capable of increasing social and economic sustainability [3,18]. Havingan active cultural asset means ensuring equitable and inclusive education and promotingworthwhile work. A DSS can promote economic sustainability as the manager can leverageresources, investments, technological development, and institutional changes in harmony.
We select museums as our setting given that they incorporate numerous economic,cultural, social, and sustainable aspects that require careful decision making from themanager side and due to their clear relevance. The system is designed to support theintuition of the museum manager with the possibility of obtaining useful information from

Sustainability 2021, 13, 7070 3 of 27
a strategic–operational point of view, as well as meeting the need for the improvement ofthe daily management decision-making processes in the industry. The designed DSS aimsat assisting relevant specific museum issues. The decisions that the system supports involvemonitoring average visitor inflow and future values through demand forecasting. It aidsin the development of effective strategies that consider the preferences and differences ofindividual visitors with the use of segmentation. The DSS suggests the optimum sellingprices of admission tickets in a way that ensures a fair balance between supply and demand.The system bolsters the maximization of the number of visitors simultaneously within themuseum by preventing congestion or underutilization of halls. Finally, it strives to ensurethat the user has control over general museum information such as average visiting time,use of communication channels, hourly distribution of visits, and other useful information.To meet the characteristics of adaptability, flexibility, interactivity, efficiency, and ease of useof a DSS, the system has been conceived and developed as a Web Application. This choicehas also allowed the advantages of distribution, updating, security, scalability, and accessderiving from the Web App architecture itself to be embraced. Overall, our DSS frameworkand implementation can provide useful guidelines to researchers and practitioners on howto design DSSs in multiple contexts of cultural heritage management.
The remainder of the paper is organized as follows. In Section 2, we review therelevant literature on DSSs. In Section 3, we propose our DSS framework. In Section 4, weapply and implement our framework to the case of museums. In Section 5, we providemanagerial implications in the context of cultural heritage, and in Section 6 we presentthe conclusions.
2. Literature Review
Decision support systems emerged from the strong interest generated by the develop-ment of personal computers, computer networks, large database systems, and the strongexpansion of computer-based models.
From the analysis of recent literature, several DSS definitions have emerged. In 2003,Marakas [19] defined it as: “A decision support system is a system under the control ofone or more decision makers that assists in the activity of decision making by providing anorganized set of tools intended to impose a structure on portions of the decision-makingsituation and improve the ultimate effectiveness of the decision outcome”. More simply,in 2005, Turban et al. [20] describe it as “... an approach for support decision-making”and finally, in 2007, Morge [21] identified DSSs as “computer-based systems that supportdecision-making activities including expert systems and multi-criteria decision analysis”.In essence, a DSS is a computer architecture that helps the user to make decisions butwithout substituting him/her. It does not provide an optimal solution, and even if it does,such a solution is then evaluated by the manager who is the final decision maker—that is,a DSS stands in the middle of the decision-making process as a decision aid. The DSS usesa data processing system and an information management system to interactively providesupport. In the system, all the information needed to understand the issue is alwaysavailable. It is possible to explore the data from different points of view according to theuser’s needs. Additionally, a user can evaluate the scenarios resulting from the choices.Similar to the above definitions, Nelson Ford [22] suggests that a DSS is an interactivesystem that helps decision makers utilize data and models to solve unstructured or semi-structured problems. As such, it differs in terms of objectives, operational differences, andusers, from Expert Systems (ESs), which are instead problem-solving computer programsthat achieve good performance in a specialized problem domain that is considered difficultand requires specialized knowledge and skills. Similar differences are pointed out byPfeifer and Lüthi [23].
As we can notice from the above definitions, they do not give an absolute description ofwhat a DSS consists of. However, they define the general characteristics of a DSS. Accordingto Turban et al. [20], a DSS functions as a support for decision makers, mainly in semi-structured and unstructured situations combining computerized information and human

Sustainability 2021, 13, 7070 4 of 27
judgment. The DSS should provide support to all decision makers at each managementlevel and try to integrate levels [20]. Moreover, the decision is the result of a negotiationbetween several individuals, so it must support communication between decision makers.A fundamental element that a DSS must have is adaptability and flexibility over time, i.e., itshould accommodate a range of decision-making styles and processes [20]. Finally, Turbanet al. [20] suggest that a DSS provides access to a diversity of data sources, formats, andtypes because one can use a DSS as a stand-alone tool for a decision maker or it can bedeployed within an organization using the web and network technologies.
While adhering to the general definition, many DSSs have distinctive features thatcreate classifications. In 1980, Alter proposed a taxonomy of DSSs based on the degree towhich output can directly determine the decision. It is related to a spectrum of genericoperations that can be performed by a DSS [24]. Alter [24] conducted a field study of 56DSSs that he classified into seven distinct types: file drawer system, data analysis system,analysis information systems, accounting, and financial models, representational models,optimization models, and suggestion models. The increasing emergence of more and morediverse DSSs allowed reformulating of the taxonomy proposed by Alter [24] to keep thenumber of categories manageable in a new modern framework, consisting of data-driven,model-driven, and knowledge-driven DSSs [4].
The above discussion refers to DSSs in general. However, this paper focuses on thedevelopment of a DSS framework for cultural heritage management. Then, a naturalquestion in our context relates to the role of DSS in the management of cultural heritage. Inthis regard, Prieto et al. [3] have developed a system that can help in the city center’s devel-opment, as it tries to develop global urban preventive conservation strategies capable ofminimizing heritage buildings’ deterioration and reducing the cost of isolated interventionsagainst hazards through urban plans and preventive conservation programs. Taking intoconsideration tangible and intangible cultural heritage, this tool includes a multi-scenarioanalysis, assessing environmental risks. It considers static-structural risks together withhistorical data related to the monuments’ life cycle, based on historical records, assessingthe degree of vulnerability of the building over time [3]. Kim et al. [11] have analyzed howdecision makers or executors often make decisions on which heritage is prioritized to berestored within the limited budget. However, very few tools are available to determineappropriate restoration priorities for the diverse historical heritage, perhaps due to a lackof systematized decision-making aids [11]. Their study proposes an alternative decisionsupport model to prioritize restoration needs within the executable budget, through amodel constructed on the stochastic analytic hierarchy process (S-AHP) and knowledge-based experience curve (EC) [11]. In the construction industry field, the identification ofappropriate artifact restoration activities, especially for cultural properties, depends onthe prior experience of the workers and companies involved [5]. The increasing numberof restoration projects dictates the need to support experience-based problem diagnosticsand facilitate the identification of appropriate restoration measures [5]. Grama et al. [5]designed an application as a case-based reasoning decision support system. This DSSallows the user to describe the current problems and proposes similar cases, previouslystored in the database, and the actions taken in those situations [5]. In this way, it helpsthe user to identify the causes of defects and appropriate corrective actions using specificknowledge from previous experiences to solve new problems, in a very similar way to howhumans rely on their previous experience [5]. The European Union identifies the culturalheritage of cities as the main driver of development strategies. From this perspective,adaptive reuse can play a decisive role in terms of increasing the life cycle of heritage andas an urban strategy that is capable of generating new economic, cultural, and social values.
Della Spina [12,13] has proposed a decision support tool, which constitutes an in-tegrated evaluation model. It is based on the combined use of multi-criteria techniquesand economic-financial analysis, with the aim to classify the adaptive reuse strategies anddefine the most suitable scenario of an unused cultural heritage asset. Mustafa et al. [6]have highlighted the potentials of Building Information Modelling (BIM) as a decision

Sustainability 2021, 13, 7070 5 of 27
support system for cultural heritage management. Their paper finds that by modeling theinformation captured by the 3D laser scanner and utilizing the existing data, BIM is capableof helping managers to retrieve, analyze and store important information in a more efficientand productive process, focusing on the changes in the historical building’s layout [6].Additionally, in recent years, the intensification of tourism, the rapid growth of urbansettlements, rural abandonment, and the adoption of various agricultural techniques areprofoundly and rapidly changing the landscape character of the eastern Mediterranean [7].A landscape risk assessment model (LRA) and a decision support system (LDSS) have beendeveloped through the MedScapes-ENPI project [7]. The “LRA-LDSS” model aimed todevelop a tool that helps in landscape decision making for the protection of the naturaland cultural heritage of the eastern Mediterranean area [7]. This DSS model has beendeveloped to enable users and stakeholders to generate useful scenarios in the planningprocess of selected areas and for landscape risk assessment [7].
Some studies have focused on museums specifically. Ali et al. [8] implemented ageographic information system (GIS), which is among the foremost useful sorts of DSS,to support the tourism sector and the activity of museum tourism in Khartoum, Sudan.It is a comprehensive application that presents geoinformatics data of the city and itsanalyses and outputs, such as histograms of visitors in previous years and the probabilityof visitors to disperse [8]. Additionally, this system provides comprehensive decisionsupport for the province of Khartoum: it does not only offer a subsidy to local tourismplanners, resulting in reduced working time, but also helps tourists to efficiently plan theirtourist trip to Khartoum by providing useful information on accurate maps, statistics, andvirtual reality images [8]. In the same vein, Lee et al. [14] have realized a DSS model tooptimize scheduling exhibition projects for art museums. During 2003–2008, only 55% ofthe area of all galleries in the Taipei Fine Arts Museum was utilized [14]. When it comesto the performance and utility of an art museum, the goal of exhibition scheduling isto maximize the percentage usage of the total gallery area [14]. As the combinations ofpossible exhibitions for all galleries at any given time are numerous, it is challenging forthe art museum’s planner to make an optimal decision [14]. Thus, they have developeda decision support model using genetic algorithms, called SCHeduling Exhibitions forMuseum of Art (“SCHEMA”), where the galleries are the resource that the exhibitionsutilize in the sequence of their priority values [14].
A museum should be aware of several factors that can improve its services, andone of these is the experience of visitors during their visits. Budiarto et al. [8] haveproposed a new approach to monitoring the behavior of museum visitors through theimplementation of a computer vision software called “Eyeface”. The software was used tocapture visitor data, including demographic information and engagement level data [9].It performs the functions of a DSS, as its data are used by the museum to reorganize itsexhibition, which can improve the level of visitor engagement [9]. Moreover, a DSS formuseums was designed for the purpose of evaluating candidates to fill the role of museumambassador [10]. Using the TOPSIS multi-criteria method, such a DSS is able to determinethe most suitable candidate, saving time and money for selection [10].
As pointed out earlier, the above studies in the context of cultural heritage (e.g.,museums) focus on specific decision areas/problems and, to the best of our knowledge,there is no prior study developing a DSS framework that incorporates all the main decisionareas simultaneously in the context of cultural heritage. We fill this gap by grounding ourstudy in design-science research [15] and by developing a DSS framework, whose featuressupport all the main decision areas for sustainable management of cultural assets in acomprehensive manner.
3. Decision Support System Framework
The DSS framework for cultural heritage management presented in this study has beendeveloped within the “Innovations for data processing in the Cultural Heritage sector”—IDEHA—project (code ARS01_00421, http://www.ponricerca.gov.it/opportunita/progetti-
Sustainability 2021, 13, 7070 6 of 27
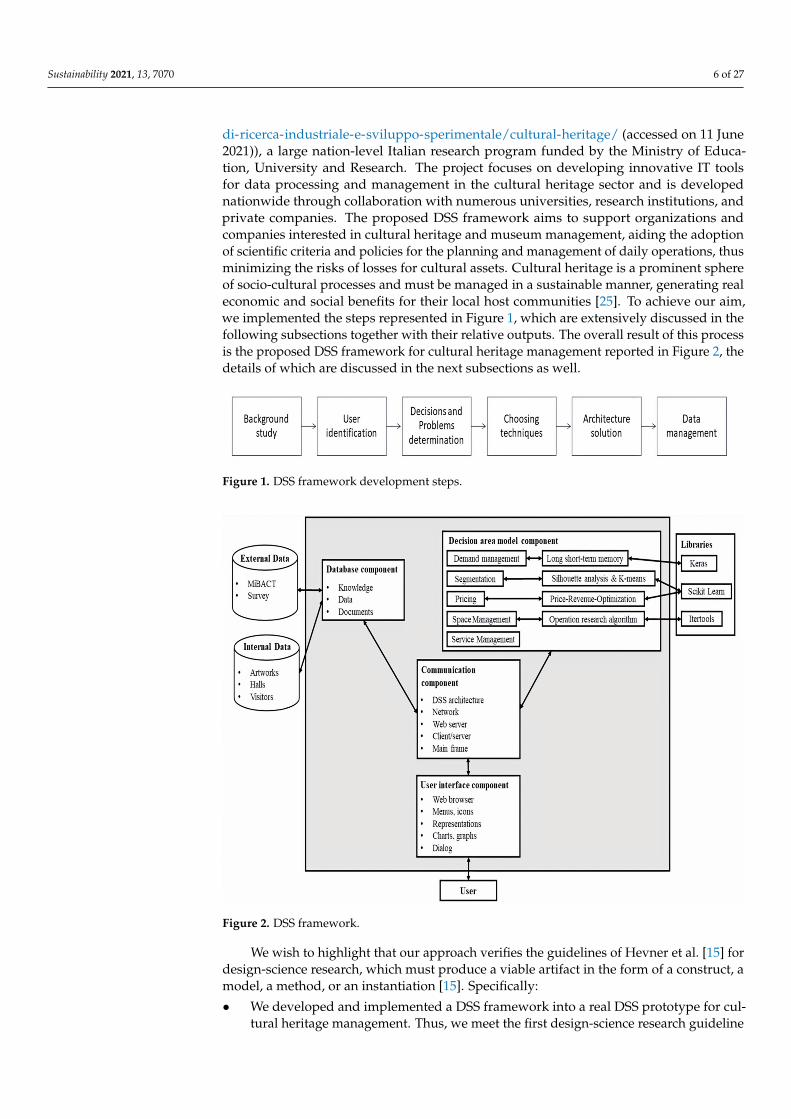
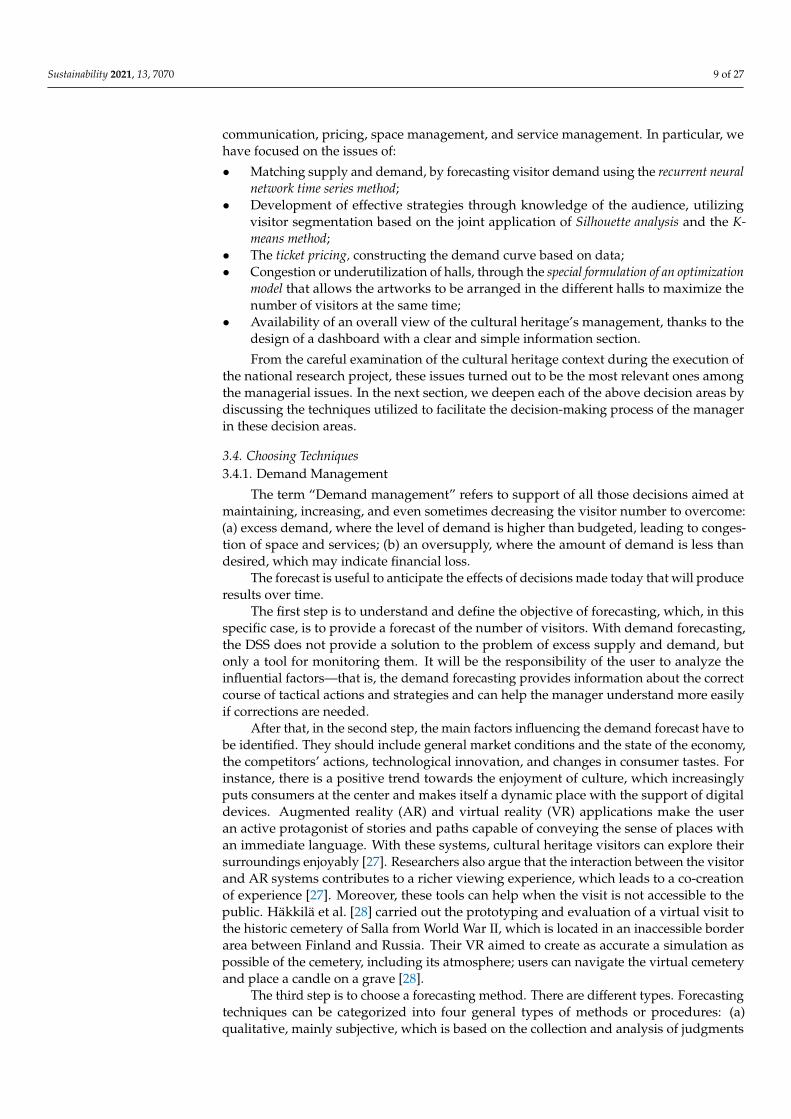
di-ricerca-industriale-e-sviluppo-sperimentale/cultural-heritage/ (accessed on 11 June2021)), a large nation-level Italian research program funded by the Ministry of Educa-tion, University and Research. The project focuses on developing innovative IT toolsfor data processing and management in the cultural heritage sector and is developednationwide through collaboration with numerous universities, research institutions, andprivate companies. The proposed DSS framework aims to support organizations andcompanies interested in cultural heritage and museum management, aiding the adoptionof scientific criteria and policies for the planning and management of daily operations, thusminimizing the risks of losses for cultural assets. Cultural heritage is a prominent sphereof socio-cultural processes and must be managed in a sustainable manner, generating realeconomic and social benefits for their local host communities [25]. To achieve our aim,we implemented the steps represented in Figure 1, which are extensively discussed in thefollowing subsections together with their relative outputs. The overall result of this processis the proposed DSS framework for cultural heritage management reported in Figure 2, thedetails of which are discussed in the next subsections as well.
Figure 1. DSS framework development steps.
Figure 2. DSS framework.
We wish to highlight that our approach verifies the guidelines of Hevner et al. [15] fordesign-science research, which must produce a viable artifact in the form of a construct, amodel, a method, or an instantiation [15]. Specifically:
• We developed and implemented a DSS framework into a real DSS prototype for cul-tural heritage management. Thus, we meet the first design-science research guideline

Sustainability 2021, 13, 7070 7 of 27
of producing a viable artifact, given that our study focuses on developing a frameworkand a prototype of DSS for the cultural heritage context.
• The second guideline is related to problem relevance, suggesting that the technology-based solutions have to deal with important and relevant business problems. Theproblem addressed by this study is certainly relevant because we are developinga DSS framework with a number of features that support important decisions forsustainable management of cultural heritage, as discussed in the Introduction andLiterature Review sections.
• Third, the utility, quality, and efficacy of a design artifact is demonstrated because theprototype is already implemented and available as one of the outputs of the nationalresearch project carried out by numerous universities, research centers, and culturalheritage institutions, as mentioned earlier in this section.
• Fourth, regarding the research contribution guideline, we contribute significantlybecause in the extant literature there is lack of a DSS framework that comprehensivelytakes into account the main decision areas of interest for a manager in the culturalheritage environment.
• Fifth, regarding the research rigor, our approach is rigorous because we performedextensive research to develop the most suitable framework for the context of use, i.e.,cultural heritage, and took into consideration the main approaches utilized in theliterature in the field of DSSs with respect to both the models/techniques and thearchitectural structure/solutions, as extensively described below in this section.
• Sixth, the design follows a search process (sixth guideline) as architectural solutionsand techniques are grounded in a rigorous study of existing DSSs for cultural assetmanagement and in the iteration of the cycle of observed system use and impact,problem identified, and solution posed and implemented.
• Finally, regarding the last guideline, i.e., communication of research, there are activitiescarried out in this respect, because, as we have pointed out, this research is part of alarger national research project on information technology in cultural heritage fundedunder a competitive national research program in Italy and carried out by numer-ous universities, research centers and cultural heritage institutions. Therefore, bothtechnology-oriented and management-oriented audiences are (and will be) involvedin the dissemination of the results.
3.1. Background Study
The first step in the development of this DSS framework is to explore the contextwhere the system will operate. In this regard, we follow the macro-processes categorizationof International Concilium of Museums [26], which consists of the following traditionalmacro-processes of work that characterize the field of cultural heritage: “Identification andprotection of cultural heritage”, “Access to and valorization of cultural heritage”, “Conservation ofcultural heritage”, “Management of cultural heritage” [26]. The processes most closely relatedto our DSS framework development are the last two. For each of the four macro-processes,the areas of activity (ADA) and the related activities were identified, in line with the sameguidelines provided by the International Concilium of Museums [26]. In particular, withregard to “Access to and valorization of cultural heritage”, the following areas of activity [26]have guided us in the identification of the most important decision-making areas at anoperational level for our DSS:
• ADA 2.1 “Enhancement of cultural heritage” includes everything that regards the defini-tion of the institutional mission and the care of relations with other institutes, bodies,and external stakeholders. It also concerns the design of routes and spaces, such as thedefinitions of exhibition criteria and the design, evaluation, updating of informationsystems, including IT;
• ADA 2.2 “Promotion of cultural goods and services” deals with the analysis of the de-mand and supply of cultural services and the definition of the marketing plan forcommunication and promotion;

Sustainability 2021, 13, 7070 8 of 27
• ADA 2.3 “Design and implementation of cultural activities” deals with the activities ofdefining objectives, identifying resources and constraints, planning, and taking careof administrative aspects.
With regard to “Management of cultural heritage”, the following area of activity [26]has guided us in the identification of the most important decision-making areas at anoperational level for our DSS:
• ADA 4.1 “Management of the cultural institution” includes everything related to planningand management of services, spaces, safety, goods and resources, as well as the designof the cultural project of the institution.
3.2. User Identification
An in-depth analysis of cultural heritage workforce was necessary to determinethe user identification. Concerning professional profiles, to define a unitary referenceframework for the certification of professional skills, in Italy, Legislative Decree no. 13 of2013 launches a reorganization of the system of professional qualifications, in line with theEuropean Union system. Each region was assigned a certain professional field and the Lazioregion has been given the task of defining the professional profiles of culture [26]. From theanalysis of the professional profiles, now there is no specific training path and the numerousexisting degrees do not offer the possibility to obtain adequate training in the cultural fieldand museology [26]. The necessary skills are acquired through field experience or trainingdays, conferences, congresses, and/or masters, but the diversity of these learning methodsdoes not guarantee the homogeneity skills, leading to a high degree of specialization, butlacking a general vision [26]. With specific regard to museums, the organizational modelof state museums identified by the Ministerial Decree of 23 December 2014 envisages, inaddition to the directorate, the presence of four functional areas: care and managementof collections, study, teaching, and research; marketing, fundraising, services, and publicrelations; administration, finance, and management of human resources; facilities, fittings,and security [26]. Additionally, it includes the following professional figures [26]:
• Director, who is the guardian and interpreter of the institution’s identity and mission,by the guidelines of the responsible administration. She/he is responsible for thecultural asset management as a whole, and the implementation and development ofits cultural and scientific project;
• Responsible for mediation and educational services, who deals with educational projects,identifying communication and mediation methods, using appropriate and functionaltools for the different target groups of the educational action;
• Responsible for the management and care of the collections, with responsibility for theconservation, security, management, and enhancement of the collections;
• Logistics and Security Manager, who is responsible for activities aimed at ensuring thesafety of people and properties, both movable and immovable;
• Communicator, who is the person who has to observe the correct and adequate com-munication of the mission, information about the heritage and its activities;
• Digital Strategy Director, a transversal professional profile who designs, supports andcoordinates the digital aspects related to the management, conservation, communica-tion, and accessibility.
The user of the DSS will be the director, called the manager from now on, becausethanks to her/his responsibilities, she/he has a comprehensive understanding of thecultural heritage. Moreover, this is in line with the typical user of a DSS, which needs to bean apical figure of the organization, according to Nelson Ford [22].
3.3. Decision Areas Definition
Based on the careful analysis of the above areas of activity as well as the activities ofmain professional profiles in cultural heritage (and specifically museums), we have focusedon five critical types of decisions in this context: demand management, segmentation and
Sustainability 2021, 13, 7070 9 of 27
communication, pricing, space management, and service management. In particular, wehave focused on the issues of:
• Matching supply and demand, by forecasting visitor demand using the recurrent neuralnetwork time series method;
• Development of effective strategies through knowledge of the audience, utilizingvisitor segmentation based on the joint application of Silhouette analysis and the K-means method;
• The ticket pricing, constructing the demand curve based on data;• Congestion or underutilization of halls, through the special formulation of an optimization
model that allows the artworks to be arranged in the different halls to maximize thenumber of visitors at the same time;
• Availability of an overall view of the cultural heritage’s management, thanks to thedesign of a dashboard with a clear and simple information section.
From the careful examination of the cultural heritage context during the execution ofthe national research project, these issues turned out to be the most relevant ones amongthe managerial issues. In the next section, we deepen each of the above decision areas bydiscussing the techniques utilized to facilitate the decision-making process of the managerin these decision areas.
3.4. Choosing Techniques3.4.1. Demand Management
The term “Demand management” refers to support of all those decisions aimed atmaintaining, increasing, and even sometimes decreasing the visitor number to overcome:(a) excess demand, where the level of demand is higher than budgeted, leading to conges-tion of space and services; (b) an oversupply, where the amount of demand is less thandesired, which may indicate financial loss.
The forecast is useful to anticipate the effects of decisions made today that will produceresults over time.
The first step is to understand and define the objective of forecasting, which, in thisspecific case, is to provide a forecast of the number of visitors. With demand forecasting,the DSS does not provide a solution to the problem of excess supply and demand, butonly a tool for monitoring them. It will be the responsibility of the user to analyze theinfluential factors—that is, the demand forecasting provides information about the correctcourse of tactical actions and strategies and can help the manager understand more easilyif corrections are needed.
After that, in the second step, the main factors influencing the demand forecast have tobe identified. They should include general market conditions and the state of the economy,the competitors’ actions, technological innovation, and changes in consumer tastes. Forinstance, there is a positive trend towards the enjoyment of culture, which increasinglyputs consumers at the center and makes itself a dynamic place with the support of digitaldevices. Augmented reality (AR) and virtual reality (VR) applications make the useran active protagonist of stories and paths capable of conveying the sense of places withan immediate language. With these systems, cultural heritage visitors can explore theirsurroundings enjoyably [27]. Researchers also argue that the interaction between the visitorand AR systems contributes to a richer viewing experience, which leads to a co-creationof experience [27]. Moreover, these tools can help when the visit is not accessible to thepublic. Häkkilä et al. [28] carried out the prototyping and evaluation of a virtual visit tothe historic cemetery of Salla from World War II, which is located in an inaccessible borderarea between Finland and Russia. Their VR aimed to create as accurate a simulation aspossible of the cemetery, including its atmosphere; users can navigate the virtual cemeteryand place a candle on a grave [28].
The third step is to choose a forecasting method. There are different types. Forecastingtechniques can be categorized into four general types of methods or procedures: (a)qualitative, mainly subjective, which is based on the collection and analysis of judgments

Sustainability 2021, 13, 7070 10 of 27
and opinions; (b) time series, using historical demand data: statistical and adaptive; (c)causal or econometric, use relationships between demand and other factors to develop theforecast; (d) simulation, which mimics consumer choices and/or combines time series andcausal methods.
When selecting and evaluating the applicability of a particular method, the literaturesuggests analyzing many factors, such as the convenience, which is easy and inexpensivebut risky, the market popularity, what others are doing, and the structured judgment,which experts recommend [29]. Additionally, the statistical criteria, the relative trackrecords, and the guidelines from previous research have to be considered [29]. Based onthese criteria and a literature review, the following time series forecasting methods wereconsidered: autoregressive integrated moving average (ARIMA), Seasonal Auto RegressiveIntegrated Moving Average (SARIMA), and Long short-term memory (LSTM). While allthese methods are valid and exhibit both advantages and disadvantages, we opted for thelatter method for the simplicity of implementation in the DSS under a deep learning logic.Indeed, long short-term memory networks are particular recurrent neural networks (RNN)utilized in the sector of deep learning. Unlike classic feed-forward networks where thedata provided are static, the type of data that the RNN is capable of processing is a timesequence or time series [30]. In essence, the LSTM is a recurrent neural network where “thebasic unit in the hidden layer of an LSTM network is the memory block, which containsone or more memory cells and a pair of adaptive, multiplicative gating units which gateinput and output to all cells in the block” [31]. The advantage of LSTM over standardRNNs is as follows. The standard RNNs fail to learn in the presence of time lags that arenot particularly small, e.g., greater than 5–10 discrete time steps between relevant inputevents and target signals [30,31]. In contrast, LSTM solves complex time-consuming lagtasks that have never been solved by previous RNN algorithms because it is not affectedby the back-flow errors [31,32]. Indeed, compared to RNNs, LSTMs have the advantage oflearning long-term dependencies. Remembering information for long periods is practicallytheir default behavior [30]. Their operation is based on the backpropagation algorithm,i.e., backward error propagation; the basic idea of this is to update the weights inside thenetwork according to the error made in predicting the output. This value is calculated asthe difference between the desired output value and the output value of the network forthe same input. The goal is to minimize this error.
LSTM allows us to understand the relationships between the factors as it models thedegree of influence exerted on demand by each of the different factors and to implement itover a shorter time. Additionally, it has a limited need for data [33]. On the other hand,although random methods have greater explanatory power, insufficient data would lead toa loss of this characteristic [33]. Moreover, tourism demand can be volatile and it is sensitiveto catastrophic influences, e.g., COVID-19 [34]. As tourism behavior is complex, and thereis a wide choice of variable forecasts, econometric-type models have often been found tobe inaccurate [35]. Both random and non-random methods require a considerable amountof time and money. Practical considerations have shown that the ARIMA and SARIMAmethods require careful data analysis for pre-processing, such as statistical parameters thatrequire an end-user training background. To make the DSS framework more usable formanagers, it was decided to omit the above-mentioned techniques and focus on LSTM.In support of our choice, Lee et al. [36] demonstrated that deep learning models can besuccessfully used to predict cultural visitor flow.
To ensure the accuracy of the prediction, the DSS processes the Root Mean SquareError (1) (RMSE) [37]. This is a widely used measure as it is an ideal measure for makingbusiness decisions through its easy interpretation: a lower RMSE value implies a betterresult. Additionally, the RMSE is a good measure for comparing models where the meanerror is not zero because it penalizes the distortions arising from it [38]. The last peculiarityis the scale effect, i.e., its ability to “weigh” larger errors more heavily. Thus, the larger the
Sustainability 2021, 13, 7070 11 of 27
difference between the predicted and the actual values, the higher the RMSE value and thelower the prediction accuracy. The RMSE is calculated as in (1).
RMSE =
√√√√ n
∑t=1
(Ft − Dt)2
n(1)
where Ft is the estimated demand in period t and Dt is the actual demand in the sameperiod. It is noteworthy that the DSS not only presents the demand management sectionfor all visitors but, through an option, it is also possible to forecast demand for each type ofticket (full, reduced, group reduced, and free), thus allowing us to estimate the demand fordifferent customer segments.
3.4.2. Segmentation and Communication
Nowadays, one of the most crucial aspects of the cultural heritage context is communi-cation [39]. If you are not able to position your service or product, it will certainly not havea positive impact on the market. Therefore, it is necessary to study and understand thecustomers, i.e., the visitors. The communication process, also in the cultural heritage field,is an essential activity for the achievement of strategic objectives and the performance ofmanagement functions in an organization [40]. The most critical aspect is in the dialoguebetween the heritage and its visitors, given that it aims to contribute to the cultural growthof the community through the creation and transmission of knowledge [40]. This contribu-tion must be based on a constant and profitable relationship. However, it is very difficultfor a cultural heritage site to reach and attract all the consumers who could be part of itsmarket because potential consumers are too numerous and diverse. They have differentneeds, wishes, and preferences. Therefore, cultural institutions will try to focus on theirstrengths and target particular consumer segments. They need to divide their market intosegments, i.e., groups of individuals with similar characteristics that can be targeted with asimilar marketing strategy [41]. Segmentation criteria are various. A good segmentationsystem can also be a combination of different factors, e.g., geographic and demographicones [41]. In this case, from a careful analysis of the cultural heritage context, the mainattributes that discriminate consumers can be summarized in:
• Socio-demographic and geographic aspects: sex, age, educational qualification andprofession, geographic origin;
• General culture consumption: the number of museums, cultural heritage sites, exhibi-tions and theme parks visited; the number of screenings at the cinema, plays, musicalconcerts and dance performances attended; reading of books and newspapers; use ofthe internet and radio, and whether they actively participate in cultural activities;
• Cultural visit behavior: the visitor’s communication channels, frequency and moti-vation for the visit, the eventual reservation, the accompaniment, the (multimedia)supports used (e.g., audio guide), the type of ticket, the time and duration of the visit,participation in extra activities, the importance of themes and artworks, informationmaterials, tours, ancillary services (cafeteria, souvenir store), and professionalism ofthe staff;
• Overall assessment of satisfaction regarding the visiting experiences.
The system should provide the user with the possibility of obtaining representativegraphs of the groups of visitors and the characteristics associated with each group, and agraph of the averages of the attributes for each identified cluster should be displayed.
To obtain a clustering of the visitors based on the segmentation factors available fromfiles appropriately loaded into the system, two statistical techniques were jointly used:Silhouette analysis and the K-Means method. The first technique is used to identify of thenumber of clusters. Such a number is then used by the second technique (i.e., K-Meansalgorithm), which allows one to obtain the profiles of the segments by computing themeans of each segmentation variable for each cluster. Therefore, the combined use of

Sustainability 2021, 13, 7070 12 of 27
these two tools happens in two steps: the Silhouette analysis provides the indication of thenumber of clusters, whereas the K-Means method uses such a number to come up with theallocation of units in clusters and the profiles of each segment.
Silhouette analysis is useful to determine the optimal number of clusters in termsof cohesion and separation, i.e., the measure of the “distance” between units within andbetween clusters, respectively.
The analysis involves calculating Coefficient (2):
s(i) =b(i)− a(i)
max(b(i), a(i))(2)
where a(i) is the average dissimilarity of unit i calculated with respect to all other unitsassigned to the same cluster; b(i) is the minimum average dissimilarity of unit i calculatedwith respect to all other clusters. Its value is between 1 and −1.
Having this information and the number of clusters from the Silhouette analysis, theDSS moves on with the analysis through the K-Means method, whose goal is to minimizethe total intra-cluster variance [42,43]. It is a non-hierarchical method, which allows a setof objects to be divided into K clusters based on their attributes. The literature has arguedthat K-Means clustering is a practical and useful tool for exploring differences amongmuseum visitors. K-Means clustering is a well-accepted method in social science research,often utilized in data processing and social network analysis because it is an exploratorymethod, providing guiding results for further confirmatory research [42,43]. The outputof the K-Means method is a graph and/or table in which the averages of each variableare reported for each identified cluster. Figure 3 reports an example with some of thepreviously described segmentation variables. In this case, the K-means algorithm allocatesunits (i.e., customers) in two clusters (this number is obtained by means of the Silhouetteanalysis) and provides the profile of two clusters showing the average values of the twoclusters for each variable utilized in the segmentation.
Figure 3. Plot of means for each cluster in K-Means method.
These techniques allow the user to have a segmentation that allows them to understandthe characteristics of customers and then choose a communication strategy that bettermatches such characteristics.
3.4.3. Pricing
To participate in the activities of the given cultural heritage site, visitors are very oftenasked to pay an entrance fee. For this reason, the third decision area is Pricing, which isbased on traditional profit maximization. Based on classical micro-economic principles,
Sustainability 2021, 13, 7070 13 of 27
the procedure for predicting the optimum price was formulated, calculated in a specificmonth of the year, selected by the user. Once the ticket type and date have been selected,the system, based on the uploaded historical data (including variable costs), will displaythe price–demand curve for each segment and the optimal price.
In detail, the following steps are followed:
(1) Approximation of the demand function through a straight line d− α ∗ p using linearregression for each segment (e.g., full ticket, reduced ticket, group ticket). The use oflinear regression is for simplicity because managers of cultural heritage often do nothave statistical backgrounds.
(2) Calculation of the profit function π(p) for determining the optimal price p fromtextbook micro-economics:
π(p) = (p− c) ∗ d(p) ≈ (p− c) ∗ (d− α ∗ p) (3)
where d(p) ≈ (d− α ∗ p) is the above demand function approximated through astraight line from linear regression and c is the marginal cost incurred by the culturalheritage organization.
(3) Calculation of the first order condition π’(p) = 0 to find the optimal price given theestimated form of the demand and the marginal cost.
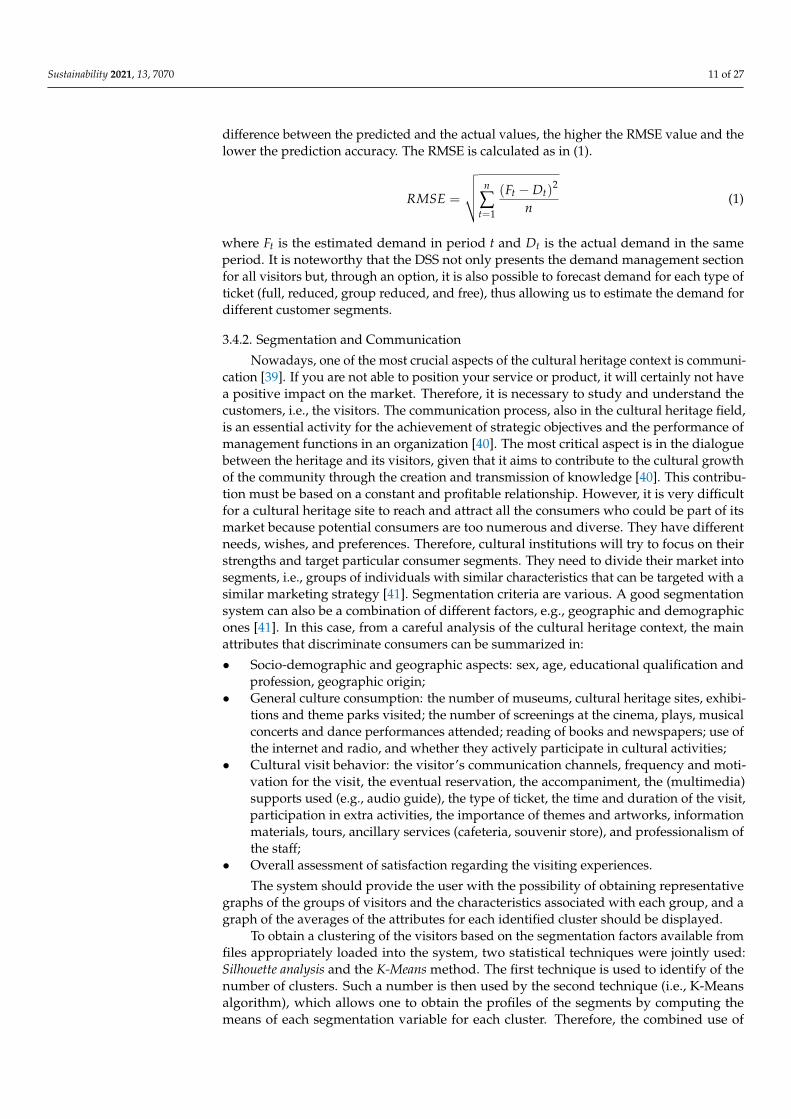
An example is shown in Figure 4. The equation of the regression line is:
d(p) ≈ 5767− 592.6 p (4)
and considering an estimated marginal cost of EUR 5, the optimal price of the full ticket is:
p =α ∗ c + d
2α=
1519.734 + 56.117 ∗ 52 ∗ 56.117
≈ 7.35 € (5)
Figure 4. Price–demand curve of the full ticket on June using data over the 2002–2019 period.
For this example of pricing decisions, we used a marginal cost of EUR 5 following anaverage indication provided from cultural heritage organizations. Of course, this value(as well as those of all other variables) can vary depending on the size and structure of thecultural heritage site. Each organization will use its own marginal cost.
Using this methodology and equipping the system with this tool allows the user togain numerous advantages and support to her/his decisions. The price–demand curve
Sustainability 2021, 13, 7070 14 of 27
is useful to monitor the presence of anomalous points in the price–demand relationship.Moreover, with the optimal price calculation, the user can better discriminate individualsegments and adjust the price of the admission ticket. Practicing good price discrimination,through continuous data collection over time, helps make proper decisions to effectivelyreach targeted segments [44].
Knowing the optimal price ensures that the decision support system can help in im-proving economic performance. If the current price is lower than the optimal recommendedprice, the user might consider increasing it to likely increase profits. Conversely, if thecurrent price is higher, the decision would be to decrease the price and run promotions toincrease demand. Finally, price optimization is useful for predicting the behavior of poten-tial buyers when the price of a product or service changes. We remark that the DSS yieldsan optimal price considering data-driven demand function and variable costs, but beingthe output of a simplified economic model, the final decision on which price to set for eachsegment of customers is left to the manager, who can always opt for the price suggestionsprovided by the DSS or use them as starting points for more informed decisions.
3.4.4. Space Management
The fourth decision-making area is defined as “Space Management”, which refers tothe organization of the allocation of the artworks and the visit routes. The importance ofthis type of decision is pivotal as it favors a better visitor experience and more efficientwork. Indeed, the main problem is related to the congestion of the areas that show highattractiveness and vitality with consequent positive economic impact but, at the sametime, possibly worsen the quality of the visiting experience. The optimization modelimplemented in the DSS provides a valid support to the decision about the allocation ofthe artworks in the various halls in a way that congestion is reduced and attractiveness ismaximized. However, as pointed out for the pricing decision area already, the managerhas an extensive understanding of the context, considering, for example, the buildingfloor plan and visitor routes, and she/he is the final decision maker that can take thearrangement of exhibitions provided by the DSS as a valuable suggestion to combine withmore qualitative considerations.
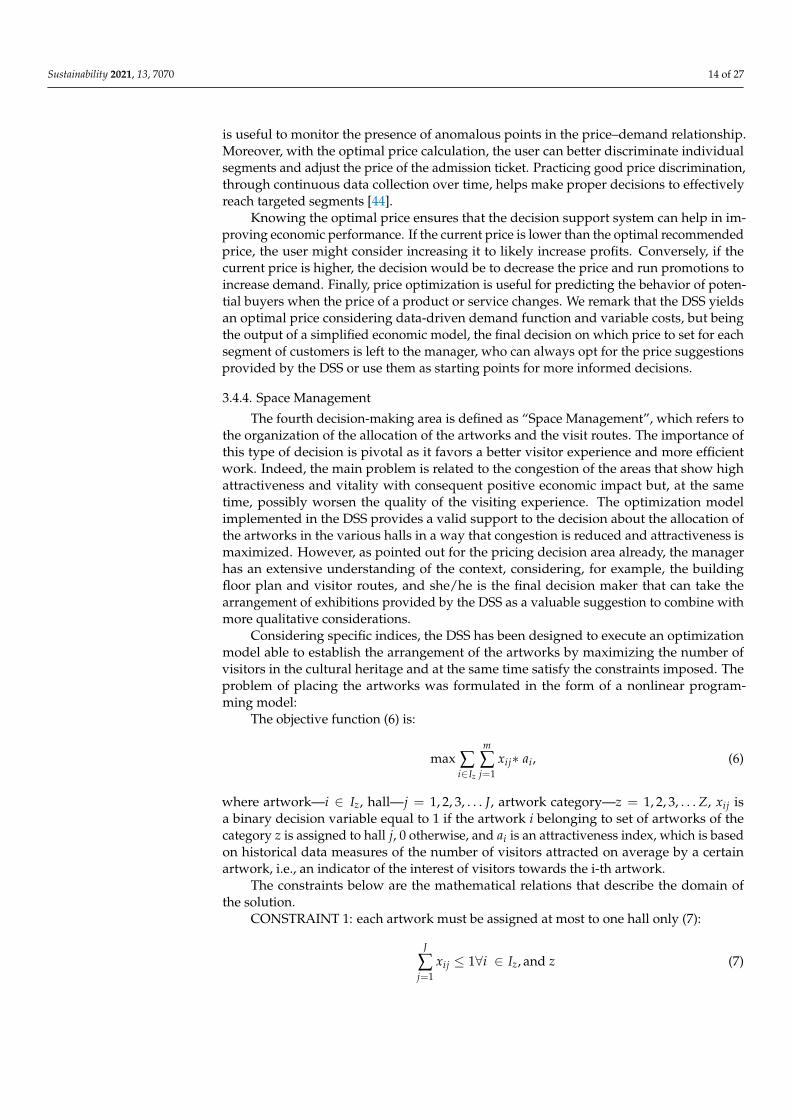
Considering specific indices, the DSS has been designed to execute an optimizationmodel able to establish the arrangement of the artworks by maximizing the number ofvisitors in the cultural heritage and at the same time satisfy the constraints imposed. Theproblem of placing the artworks was formulated in the form of a nonlinear program-ming model:
The objective function (6) is:
max ∑i∈Iz
m
∑j=1
xij∗ ai, (6)
where artwork—i ∈ Iz, hall—j = 1, 2, 3, . . . J, artwork category—z = 1, 2, 3, . . . Z, xij isa binary decision variable equal to 1 if the artwork i belonging to set of artworks of thecategory z is assigned to hall j, 0 otherwise, and ai is an attractiveness index, which is basedon historical data measures of the number of visitors attracted on average by a certainartwork, i.e., an indicator of the interest of visitors towards the i-th artwork.
The constraints below are the mathematical relations that describe the domain ofthe solution.
CONSTRAINT 1: each artwork must be assigned at most to one hall only (7):
J
∑j=1
xij ≤ 1∀i ∈ Iz, and z (7)

Sustainability 2021, 13, 7070 15 of 27
CONSTRAINT 2: artworks placed in the same hall must not exceed the occupiablehall space (8):
Z
∑z=1
∑i∈Iz
xij ∗ ci ≤ Cj ∀j (8)
where ci and Cj are the occupancy indices of the artwork and the hall, respectively. Thefirst is obtained by considering the sum of the m3 of the artwork itself and the volumemeasured around it to avoid the artworks being too close together and to the public; thesecond is the available m3 of the hall itself. These values are normalized on a scale from 1to 10, where 1 is the minimum value and 10 is the maximum value.
CONSTRAINTS 3–4: only artworks in the same thematic category may be placed inthe same hall (9):
Z
∑z=1
yjz ≤ 1 ∀j (9)
where yjz are binary variables equal to 1 if the given thematic category z is assigned to thehall j and they are related to the variables xij through the following set of constraints (10):
∑i∈Iz
xij ≤ yjz Iz ∀j, z (10)
where, with some reuse of notation, Iz also indicates the size of each thematic category, i.e.,the number of artworks belonging to the same category.
CONSTRAINT 5: each hall must have a maximum capacity equal to the maximumnumber of people it can accommodate (Aj) (11).
Z
∑z=1
∑i∈Iz
xij ∗ ai ≤ Aj ∀j (11)
CONSTRAINT 6: the index of inflow of the single hall (12) is within a certain percent-age P of the average index of inflow of all the halls (13–14). The last constraint allows us totake into consideration the arrangements of halls whose variance is less than a percentageof the average value that is considered acceptable to avoid large inflow unbalance. Byindicating with Fj the inflow index of the single hall and with F the average inflow indexof all the halls, we will have:
Fj =Z
∑z=1
∑i∈Iz
xij ∗ ai , (12)
F =∑J
j=1 Fj
m, (13)
Then, the sixth constraint is:
J
∑j=1
(Fj − F
)2 ≤ P ∗ F2 , (14)
To solve the formulated optimization problem, different methods, including geneticalgorithms, have been used to solve the problem and check the goodness of the solutionsby comparing it with the optimal solution obtained by enumerating all possible solutions.
3.4.5. Services Management
The last decision-making area, “Service Management”, serves to monitor the servicesthat can be basic, complementary, and ancillary. The complementary services, i.e., thosesupporting the visitor, include pre-sales of entrance tickets, whereas the ancillary servicescover the analysis of private activities and cafeteria. In sum, the system also providesinformation through graphs, for example, regarding the percentages of frequent visitors

Sustainability 2021, 13, 7070 16 of 27
and the main communication channels. In particular, the dashboard refers to a set ofgraphical objects that, when structured and displayed in a certain manner, allow access ata glance to real-time and very important information, of different natures and complexity.Ease of reading and immediacy are therefore of fundamental importance. Therefore,the system must offer the possibility of extrapolating management information from thestatistical graphs obtained from the uploading and processing of data. By integratingall the information in the system, the manager can come up with a decision regarding aparticular service.
In the case of opening and closing hours, we are interested in how the user canview the time of arrival of visitors. The system creates a histogram showing the visitornumber at each interval considered, to understand the times with the highest and lowestfrequency. The study of the duration of the visit could provide food for thought, e.g., ifthe interval is too wide, one could consider reducing the number of artworks exhibited.The system presents the minimum, average, and maximum values of the duration of thevisit. For communication channels, the user analyzes what and how much visitors knowabout the cultural site. By processing the information about the visitors’ number fromeach communication channel used, the system creates a pie chart: the size of the circularsector is directly proportional to the number of visitors received through that channelof communication. Additionally, the system presents a line graph for each alternative,showing the number of visitors over time.
The dashboard will help analyze additional activities or private events. The systemdisplays a bar graph showing the type and number of participants of the events that tookplace in that month. The DSS extrapolates the information about the frequent visitors, i.e.,the number of visitors who visit the cultural institution more than once, and shows a linegraph containing the percentage of repeat visitors as time progresses. To avoid long queuesat the ticket offices and the entrance, many institutions often decide to provide pre-saleand reservation services. This strategy is applied as well to obtain information about theexpected demand. The system anticipates that the user wants to know the number ofvisitors, by segment, who use this service.
Finally, to offer a service that is as complete as possible, the cultural site is equippedwith cafeteria (and souvenir store) services. After extrapolating and analyzing the infor-mation, the DSS displays the visitors’ number who use these services and their averageexpenditure. The DSS can create a bar graph showing the trend of these values.
3.5. Architecture Solution
The network architecture at the base of the DSS consists of a Client, a web server, anda Rest Server.
The web server acts as an intermediary between the client and the REST Server, i.e.,the Client makes a Hypertext Transfer Protocol (HTTP) call to the web server and waits fora response. In turn, the web server, after properly processing the received data, issues a callto the REST Server, which performs calculation routines depending on the received requestand returns the data in the form of JavaScript Object Notation (JSON) strings. Finally, theweb server extracts the necessary information from the incoming data and transmits it tothe client.
For the implementation of the software at the base of the system, we chose an inte-grated development environment widely used in web programming and the Java world.Such an Integrated Development Environment (IDE) is Eclipse. Thanks to the integratedfeatures of Eclipse, it was easy to download and install the Apache Tomcat ApplicationServer on which the Web Application modules were subsequently loaded. For the manage-ment and design of the system, Eclipse offers several build systems with different featuresand basic functionality. Among the tools taken into consideration, Maven was the bestchoice in terms of dependency management and updating. In Maven, the description ofthe build process, its dependencies on external modules and components, the order ofoperations, the directories and plugins needed, are carried out through an XML file. Maven

Sustainability 2021, 13, 7070 17 of 27
automatically downloads all necessary Java libraries and plugins from one or more reposi-tories (such as Maven2 Central Repository) and saves them in a local cache. Maven projectsare configured using a Project Object Model, which is saved in a file called pom.xml.
For the realization of the back-end, in the case of the web server, the Java EnterpriseEdition platform has been used. Therefore, the dynamic web Java Server page (JSP), Servlet,and the associated Java classes have been realized.
In the case of the Server Rest, it was decided to use the web micro-framework Flask,written in Python. Flask was designed to build RESTful and allowed to develop andintegrate Python modules that contain the calculation routines implemented with the helpof the different software libraries available in the machine learning domain. In addition, inorder to guarantee the retrieval of information through REST requests, it was necessary todevelop a server interface for the transfer of files through File Transfer Protocol (FTP).
For the realization of the code executed by the browser of the client device, we decidedto use a free template named material dashboard based on HTML5, CSS3, and bootstrapand inspired by Google’s material design. Material dashboard makes use of lighting andmotion effects. The overall layout resembles blocks on layers of different levels so thatdepth and order are evident. Navigation remains mainly on the left sidebar and contentis on the right within the main panel. The individual pages are made dynamic by theuse of the JavaScript programming language that allows scripts to be executed withinthe browser.
To manage data persistence and to perform data insertion, modification, and dele-tion queries, the relational Database Management System (DBMS) MySQL based on theStructured Query Language (SQL) query language was used. The database design phasewas accomplished through the use of a free software package, called MySQL Workbench,which integrates visual tools for modeling, creating, and maintaining MySQL databaseswithin a single environment. To obtain the database connection from the Java code, theMaven dependency for the Java Database Connectivity (JDBC) driver was inserted in thepom.xml file.
The need to develop machine learning algorithms has led to the choice and use oftwo main open-source machine learning libraries: Keras and Scikit Learn. Keras is ahigh-level neural network library, written in Python, able to run on TensorFlow or Theanoand designed to allow rapid prototyping of deep neural networks. Additionally, ScikitLearn (sklearn) is a Python language library that provides algorithms for classification,regression, clustering, support vector machines, and others. The Keras library was usedto build an LSTM network, while the Scikit Learn library was leveraged for clusteringand linear regression algorithms. In addition to the machine learning libraries, the Jerseyframework was used to create the REST service. This framework provides support for theJAX-RS API (JAVA API for RESTful Web Services) and serves as a reference implementation.For the extrapolation and manipulation of JSON data produced by the REST server, itwas preferred to use the org.json library able to simplify the process of conversion ofJSON strings to the object-oriented world. Finally, to implement the “Space Management”requirement, which provides support for the combinatorial calculation of the allocation ofthe artworks, we chose to use Itertools, a module present in the Python standard library.
3.6. Data Management
The functionalities implemented in the system require data from which to processthe information to be shown to the user. Depending on the decision area and the selectedtechnique, the data can be classified into the following categories: price–demand series,segmentation variables, space management, and numerical information for the dashboard.
In the current version of the DSS, except for the values relating to the artworks andhalls, which can be entered manually into the system by the user, the system requires thedata to be entered through a file in “CSV” format. This choice serves to impose a veryprecise arrangement and format of the data in addition to simplifying the operations ofuploading and saving the data themselves.

Sustainability 2021, 13, 7070 18 of 27
Although the system helps ensure data consistency (for instance, providing warningswrong formats), it is the responsibility of the user to make sure that the data are reliable,correct, and consistent. Indeed, the data regarding some input parameter may not alwaysbe reliable either because the actual value may be unknown due to uncertainty or becausethe user makes some mistake in data collection or saving. For instance, some data areobtained through a different software tool and are (automatically) uploaded in the systemthrough a file. If the data are not reliable, the system can do little except highlight warningsin case of a wrong format. This is where the role of the user in checking the data becomesrelevant. After all, the DSS does not substitute the user, but can support the decision-making process. In fact, in these cases, once the correct information becomes available,the user can always modify the data and re-run the analyses with the corrected value.Moreover, in the presence of uncertainty, the user can also hypothesize different scenarioswith different values of one or more input parameters (e.g., what-if analysis) and see howchanges in the parameters affect the outcomes.
However, we note that DSS does significantly help the user in decisions characterizedby uncertainty. For instance, as explained, it supports demand forecasting and pricingdecisions, which are by their nature characterized by the presence of uncertainty. Demandforecasting helps the user in having a reasonable idea of what demand to expect in order toorganize operations. Similarly, pricing is a decision made under uncertainty as the optimalprice depends on the expected demand. Thus, again, the demand forecasting supported bythe DSS helps the user in finding a price to set in the presence of uncertainty.
Regarding the “Demand Management” decision area, it is necessary to provide theDSS with a file containing the historical series of data related to the demand trend overtime. Each ticket type has a file including the time variable and the demand quantity. Thedata, which are displayed in the dashboard, include, among others:
• Number of visitors per hour, which links the time (hour) and the number of visitors(integer);
• Number of visitors per communication channel, which links the name of the commu-nication channel (string) and the number of visitors (integer);
• Additional activities, which links the type of activity (string) and the number ofparticipants (integer);
• Number of repeat visitors (those who have previously visited), which links time (date)and number of repeat visitors (integer);
• Presale flow by segment, which links time (date) and quantity of presale for eachsegment (integer);
• Number of visitors and average cafeteria and restaurant expenditure, which link time(date), amount of service visitors (integer), and value of expenditure (integer).
The fundamental input for the “Pricing” analysis is the file containing the price–demand series determined by the price (number) and demand (integer), distinguishedfor each ticket type and month of interest. This file will be naturally available to thegiven cultural heritage site from the historical records of demand (see above the demandmanagement module) and ticket prices. From demand and prices series, a demand curvecan be estimated, as discussed in the previous subsection. Together with the variable costinformation uploaded using a similar file, the demand curve allows one to compute theprice that maximizes profits.
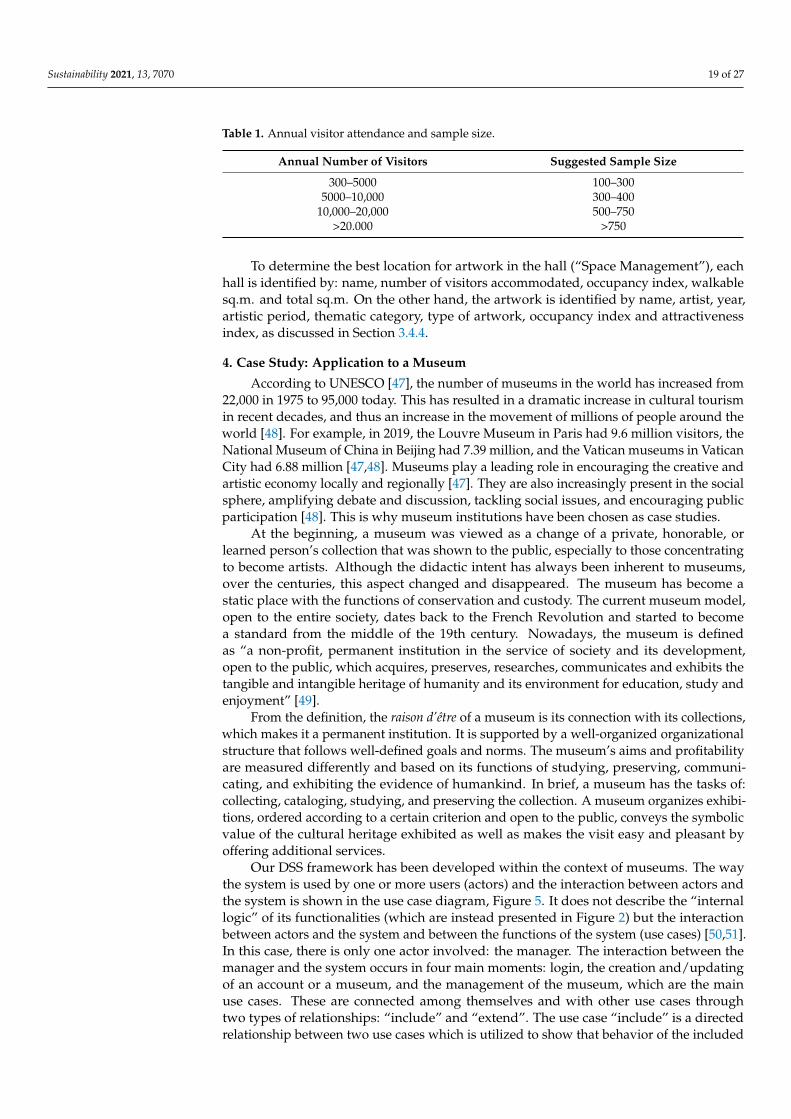
As for the data needed for the “Segmentation and Communication” decision area, it isnecessary to use variables that characterize the behavior of museum visitors. These are thevariables identified in the Section 3.4.2. We assumed that these variables are derived from asurvey. Indeed, in the cultural heritage sector, most of the surveys have been implementedmainly through this methodology—only 2% are observational surveys [45]. To ensurethe validity of the data, the survey must be developed based on a systematic sample.The literature suggests the relationship between the number of visitors per year and thesuggested sample size, Table 1 [46]. In our pilot study discussed in the next section, weconsidered an annual number of visitors of less than 5000 and a sample size of 100.
Sustainability 2021, 13, 7070 19 of 27
Table 1. Annual visitor attendance and sample size.
Annual Number of Visitors Suggested Sample Size
300–5000 100–3005000–10,000 300–400
10,000–20,000 500–750>20.000 >750
To determine the best location for artwork in the hall (“Space Management”), eachhall is identified by: name, number of visitors accommodated, occupancy index, walkablesq.m. and total sq.m. On the other hand, the artwork is identified by name, artist, year,artistic period, thematic category, type of artwork, occupancy index and attractivenessindex, as discussed in Section 3.4.4.
4. Case Study: Application to a Museum
According to UNESCO [47], the number of museums in the world has increased from22,000 in 1975 to 95,000 today. This has resulted in a dramatic increase in cultural tourismin recent decades, and thus an increase in the movement of millions of people around theworld [48]. For example, in 2019, the Louvre Museum in Paris had 9.6 million visitors, theNational Museum of China in Beijing had 7.39 million, and the Vatican museums in VaticanCity had 6.88 million [47,48]. Museums play a leading role in encouraging the creative andartistic economy locally and regionally [47]. They are also increasingly present in the socialsphere, amplifying debate and discussion, tackling social issues, and encouraging publicparticipation [48]. This is why museum institutions have been chosen as case studies.
At the beginning, a museum was viewed as a change of a private, honorable, orlearned person’s collection that was shown to the public, especially to those concentratingto become artists. Although the didactic intent has always been inherent to museums,over the centuries, this aspect changed and disappeared. The museum has become astatic place with the functions of conservation and custody. The current museum model,open to the entire society, dates back to the French Revolution and started to becomea standard from the middle of the 19th century. Nowadays, the museum is definedas “a non-profit, permanent institution in the service of society and its development,open to the public, which acquires, preserves, researches, communicates and exhibits thetangible and intangible heritage of humanity and its environment for education, study andenjoyment” [49].
From the definition, the raison d’être of a museum is its connection with its collections,which makes it a permanent institution. It is supported by a well-organized organizationalstructure that follows well-defined goals and norms. The museum’s aims and profitabilityare measured differently and based on its functions of studying, preserving, communi-cating, and exhibiting the evidence of humankind. In brief, a museum has the tasks of:collecting, cataloging, studying, and preserving the collection. A museum organizes exhibi-tions, ordered according to a certain criterion and open to the public, conveys the symbolicvalue of the cultural heritage exhibited as well as makes the visit easy and pleasant byoffering additional services.
Our DSS framework has been developed within the context of museums. The waythe system is used by one or more users (actors) and the interaction between actors andthe system is shown in the use case diagram, Figure 5. It does not describe the “internallogic” of its functionalities (which are instead presented in Figure 2) but the interactionbetween actors and the system and between the functions of the system (use cases) [50,51].In this case, there is only one actor involved: the manager. The interaction between themanager and the system occurs in four main moments: login, the creation and/updatingof an account or a museum, and the management of the museum, which are the mainuse cases. These are connected among themselves and with other use cases throughtwo types of relationships: “include” and “extend”. The use case “include” is a directedrelationship between two use cases which is utilized to show that behavior of the included

Sustainability 2021, 13, 7070 20 of 27
use case (the addition) is inserted into the behavior of the including (the base) use case. Forexample, from Figure 5, the use case “Calculate price” is included in the use case “ManageMuseum”. “Extend” is a directed relationship that specifies how and when the behaviordefined in a usually supplementary (optional) extending use case can be inserted intothe behavior defined in the extended use case. For instance, from Figure 5, the use case“Update Account” turns out to be optional with respect to “Login”.
Figure 5. Use case diagram of the DSS.
The system functionalities defined during the framework analysis phase are high-lighted. The start page is the login page that allows access to the system by enteringcredentials in a form. Once logged in, the system redirects the user to the museum’s man-agement page, where it is possible to access a selected museum and modify data, halls, andartworks and, also, a side navigation bar will be visible to access the main functions of thesystem, which relate to the main decision areas extensively discussed in Section 3. In fact,from Figure 3, forecast demand relates to demand management, segment visitors relates tosegmentation and communication, calculate price relates to pricing, place artworks relatesto space management, and view dashboard shows all plots and includes also servicesmanagement. Next, the data upload page provides the user with the option to select filesfor processing external data, reminding her/him about the format that the data in the filemust satisfy.
Using the dashboard, the museum manager can consult relevant information si-multaneously. After selecting the relevant month, the DSS shows simple, colorful, andeasy-to-understand graphs. In Figure 6, we show one example: the histogram of averagevisitors per hour.

Sustainability 2021, 13, 7070 21 of 27
Figure 6. Dashboard interface.
The “Demand Management” section (Figure 7) contains the basic elements to querythe system about the demand forecast, as extensively discussed in Sections 3.4.1 and 3.6.The system will respond by showing a graph of the demand trend over time, and it will bepossible to see how the trained model approximates the true data, taking into account that20% of the uploaded dataset is used as a test set. In addition to the approximation obtained,the page shows the value predicted by the model, which is the day after the last day inthe dataset and the RMSE error. To conduct our simulation exercise for the decision areademand management, data were retrieved from the statistics office of the Italian Ministryof Cultural Heritage and Activities and Tourism (http://www.statistica.beniculturali.it/(accessed on 11 February 2021)), which provides by type of museum institute monthlygross revenue and monthly demand for paying and non-paying customers. Then, wefollowed the procedure already discussed in Sections 3.4.1 and 3.6.
Figure 7. Demand management interface.

Sustainability 2021, 13, 7070 22 of 27
Figure 8 exhibits an example output of the “Segmentation and Communication”module, namely the clusters obtained using subsequently Silhouette analysis and the K-Means method and the cluster averages for the individual segmentation variables presentedin Sections 3.4.2 and 3.6.
Figure 8. Segmentation and communication interface.
In the “Pricing” decision area, Figure 9, after selecting the month and type of ticketand starting the calculation, the DSS displays the price–demand curve and the estimatedoptimal price, following the procedures discussed in Sections 3.4.3 and 3.6.
Figure 9. Pricing interface.
The “Space Management” section initially shows a summary of the halls and artworksentered into the system. As illustrated in Figure 10, by scrolling down and clicking on the

Sustainability 2021, 13, 7070 23 of 27
“Calculate” button, the system yields and reports the allocation of artworks to the halls, asthe output of the optimization model provided in Section 3.4.4.
Figure 10. Space management interface.
5. Discussion
According to Power [4], once a DSS is implemented, it creates a competitive advantageif used and becomes a strength of the organization, if the organization is the sole ownerand if the advantage provided is sustainable for at least three years, which is possiblein the context of cultural heritage where the use of information technology (IT) and thatof managerial tools are not well-developed. DSS can potentially help a firm in creatingan advantage by providing many benefits, including improving personal efficiency andreducing staff needs, expediting problem-solving and increasing organizational control [4].In some cases, DSSs can reduce costs where decision makers have high turnover andtraining is slow and cumbersome, and in situations where activities, departments, andprojects are poorly controlled [4]. For this reason, an advantage of our DSS is that it allowsthe user to organize, inspect, and control cultural heritage quickly and clearly. Additionally,DSSs can create a major cost advantage by increasing efficiency or eliminating value-chainactivities, improving individual productivity [4], especially in an industry such as culturalheritage where managers do not typically have business education backgrounds. Oneof the ways people can become more effective decision makers is to help them be moreefficient in manipulating data, in improving consistency and accuracy, and to allow themto spend more on the substantive aspects of the jobs [4]. In this regard, our DSS has theadvantage of having easy-to-read charts and easy-to-understand technique outputs. TheDSS allows a person either to perform the same task in a shorter time or perform the sametask more thoroughly in the same time span [22]. Moreover, a DSS can be used to help acompany in better focusing on a specific customer segment, thus leading to an advantage inmeeting that segment’s needs [4]. By tracking customers, a DSS can make it easier to servea specific customer group with targeted services [4]. Our DSS framework, for instance,incorporates segmentation techniques that are at the core of segmenting the market andtargeting specific customer segments.
In spite of the positive managerial implications above, there is still some resistancein the use of DSS in the context of cultural heritage. First, as we have mentioned above,managers may have insufficient computer training, and training cost could be higher than

Sustainability 2021, 13, 7070 24 of 27
the competitive advantage achieved [4]. Second, some managers argue that using a DSSwill decrease their status and force them to do a secretary’s work. Nevertheless, usinga DSS is not the job of a secretary or personal assistant [4]. Third, many DSSs increaseinformation overload, which may be a major problem for managers who already receivetoo much information [4].
There are various improvements and future research works that can be made. Inour context, it will be necessary to monitor the innovative DSS during its application inthe working environment of a museum. This means analyzing how it improves businessperformance through specific indicators and detecting what type of tools are the mostused and which ones are difficult to understand. One disadvantage is that, in somecircumstances, the user will have to find the data externally and enter it into the systemas a file, making sure that the data are reliable and have acceptable consistency, especiallyin case of data uncertainty (though the system helps in this regard warning, for instance,about wrong formats). While in some cases this issue is unavoidable, as explained earlier,such limitation offers room for future developments. For instance, a potential solutionto these problems (at least partially), which the project IDEHA is working on, consists ofusing some sensors inside the museum, whose main task is to receive and accumulate dataon visitors, artworks, and halls within a special database. It is possible to install a Bluetoothsensor within each detectable area, called a node (in this case, the area around an artwork).Each time the visitor’s mobile device enters in a detectable area, the sensor will continueto receive a signal output from the device until the tolerance distance is exceeded. Thesensor will record the time between the instant of check-in and the instant of check-out. Thedifference between these two moments will be the dwell time that is used for the algorithmof placing the artworks in the halls. Future research could also focus on incorporating toolsin parallel or allowing the use of different methods for predicting demand. Finally, theefficiency of the decision support system could be increased by training machine learningmodels with larger datasets as well as using more complex models, which include, forinstance, real options [52].
6. Conclusions
In this article, we have proposed and implemented (at the level of prototype) aninnovative and comprehensive DSS for the management of a cultural asset (e.g., a museum)that is able to simultaneously consider all the main decision areas in a fairly simple manner,supporting the decision maker constantly. Our approach identifies tools and techniquesthat support the economic and social structure of a cultural organization through demandmanagement, optimal pricing, space management, and visitor segmentation, respectively.Overall, this paper helps clarify which characteristics a DSS framework for cultural heritageshould possess to be as complete and effective as possible while being very simple anduser-friendly at the same time. Moreover, this paper also explains how the DSS frameworkshould be implemented in practice.
The development, in the form of a web-based system, resulted in an architecturalsolution that includes a client, a web server, and a REST server. This choice has allowedus to satisfy some critical requirements such as ease of use, response time of the system,modularization, and scalability. It has made it possible to offer a diversified service, as wellas a valid aid for museum management and strategic operational decisions. The productis a system that meets the needs of improvement of decision-making processes that arecarried out at the strategic level by the cultural heritage manager. As the case study shows,the support that the system offers extends to wide areas and focuses on solving problemsthat occur in the management of cultural heritage.
In conclusion, we report again the definition of a decision support system, which isa computer architecture that helps the user to make decisions but without replacing him.Thus, it is evident that a DSS in the cultural heritage management of one’s daily work doesnot mean surrendering responsibility to a machine and lose freedom but rather to work incommon agreement with it, to take suggestions into consideration, and to ensure rational

Sustainability 2021, 13, 7070 25 of 27
and more informed decisions. A DSS is configured as an added value that should never belacking in an organization, both public and private ones, that would like to improve moreand more and aim for excellence in cultural heritage management.
Author Contributions: Conceptualization, E.D.M., P.R., S.Z., U.P. and L.A.; methodology, E.D.M.,P.R., and S.Z.; software, S.Z.; validation, E.D.M., P.R., and S.Z.; formal analysis, E.D.M., P.R., andS.Z.; data curation, E.D.M., P.R., and S.Z.; writing—original draft preparation, E.D.M., P.R., and S.Z.;writing—review and editing, E.D.M., P.R., S.Z., U.P. and L.A.; supervision, P.R., U.P., and L.A.; projectadministration, P.R.; funding acquisition, P.R. All authors have read and agreed to the publishedversion of the manuscript.
Funding: This research was funded by PON Program Innovation and Research 2014–2020-ItalianMinistry of Education, University and Research, grant number ARS01_00421, http://www.ponricerca.gov.it/opportunita/progetti-di-ricerca-industriale-e-sviluppo-sperimentale/cultural-heritage/ (ac-cessed on 2 August 2019).
Institutional Review Board Statement: Not applicable.
Informed Consent Statement: Not applicable.
Conflicts of Interest: The authors declare no conflict of interest. The funders had no role in the designof the study; in the collection, analyses, or interpretation of data; in the writing of the manuscript, orin the decision to publish the results.
References1. World Travel and Tourism Council. Travel & Tourism—Global Economy Impact & Trends 2020. 2020. Available online:
https://wttc.org/Research/Economic-Impact (accessed on 29 January 2021).2. Loulanski, T.; Loulanski, V. The sustainable integration of cultural heritage and tourism: A meta-study. J. Sustain. Tour. 2011, 19,
837–862. [CrossRef]3. Prieto, A.J.; Macias-Bernal, J.M.; Silva, A.; Ortiz, P. Fuzzy decision-support system for safeguarding tangible and intangible
cultural heritage. Sustainability 2019, 3953. [CrossRef]4. Power, D.J. Decision Support Systems: Concepts and Resources for Managers; Greenwood Publishing Group: Westport, CT, USA, 2002.5. Grama, C.; Urosevic, L.; Wuerthele, M. CBR based problem diagnostics application as a decision support system in the cultural
heritage objects restoration. In Proceedings of the 15th WSEAS International Conference on Recent Researches in System Science,Corfu, Greece, 14–16 July 2011; pp. 131–136.
6. Mustafa, M.H.; Ali, M.; Ismail, K.M.; Hashim, K.S.H.Y.; Suhaimi, M.S.M. BIM backed decision support system in the managementof heritage building. Int. J. Built Environ. Sustain. 2019, 6, 63–71. [CrossRef]
7. Trovato, M.G.; Ali, D.; El Halabi, A.; Meouche, S. Landscape risk assessment model and decision support system for the protectionof the natural and cultural heritage in the Eastern Mediterranean Area. Land 2017, 6, 76. [CrossRef]
8. Ali, T.; Subair, S.; Aleisa, H. Museum tourism in Khartoum, analysis and decision Sudan: A geoinformatics support system.In Proceedings of the International Conference on Image Processing, Computer Vision, and Pattern Recognition (IPCV). TheSteering Committee of The World Congress in Computer Science, Computer Engineering and Applied Computing (WorldComp),Las Vegas, NV, USA, 17–20 July 2017; pp. 153–158. [CrossRef]
9. Budiarto, A.; Pardamean, B.; Caraka, R.E. Computer vision-based visitor study as a decision support system for museum.In Proceedings of the 2017 International Conference on Innovative and Creative Information Technology (ICITech), Salatiga,Indonesia, 2–4 November 2017; pp. 1–6. [CrossRef]
10. Wibowo, S.; Tyas, M.A.; Nada, N.Q.; Novita, M. Decision support system museum ambassadors using Topsis method. In IOPConference Series: Materials Science and Engineering; IOP Publishing: Bristol, UK, 2020; p. 12037. [CrossRef]
11. Kim, C.J.; Yoo, W.S.; Lee, U.K.; Song, K.Y.; Kang, K.I.; Cho, H. An experience curve-based decision support model for prioritizingrestoration needs of cultural heritage. J. Cult. Herit. 2010, 11, 430–437. [CrossRef]
12. Della Spina, L. Adaptive sustainable reuse for cultural heritage: A multiple criteria decision aiding approach supporting urbandevelopment processes. Sustainability 2020, 12, 1363. [CrossRef]
13. Della Spina, L.; Giorno, C.; Casmiro Galati, R. An integrated decision support system to define the best scenario for the adaptivesustainable re-use of Cultural Heritage in southern Italy. In Proceedings of the International Symposium: New MetropolitanPerspectives, Italy (online), 26–28 May 2020; pp. 251–267. [CrossRef]
14. Lee, H.Y.; Lin, Y.C. A decision support model for scheduling exhibition projects in art museums. Expert Syst. Appl. 2010, 37,919–925. [CrossRef]
15. Hevner, A.R.; March, S.T.; Park, J.; Ram, S. Design science in information systems research. MIS Q. 2004, 28, 75–105. [CrossRef]16. Matero, F. Preface. In Managing change: Sustainable approaches to the conservation of the built environment. In Proceedings of
the 4th Annual US/ICOMOS International Symposium, Philadelphia, PA, USA, 6–8 April 2001; Teutonico, J.M., Matero, F., Eds.;Getty Conservation Institute: Los Angeles, CA, USA.

Sustainability 2021, 13, 7070 26 of 27
17. Throsby, D. Sustainability in the conservation of the built environment: An economist perspective. In Managing change:Sustainable approaches to the conservation of the built environment. In Proceedings of the 4th Annual US/ICOMOS InternationalSymposium, Philadelphia, PA, USA, 6–8 April 2001; Teutonico, J.M., Matero, F., Eds.; Getty Conservation Institute: Los Angeles,CA, USA; pp. 3–10.
18. Petti, L.; Trillo, C.; Makore, B.N. Cultural Heritage and Sustainable Development Targets: A Possible Harmonisation? Insightsfrom the European Perspective. Sustainability 2020, 12, 926. [CrossRef]
19. Marakas, G.M. Decision Support Systems in the 21st Century; Prentice Hall: Upper Saddle River, NJ, USA, 2003.20. Turban, E.; Aronson, J.E.; Liang, T.P.; Maccarthy, R.V. Decision Support Systems and Intelligent Systems; Pearson Prentice-Hall:
Upper Saddle River, NJ, USA, 2005.21. Morge, M. The hedgehog and the fox. In International Workshop on Argumentation in Multi-Agent Systems; Springer: Honolulu, HI,
USA, 2007. [CrossRef]22. Nelson Ford, F. Decision support systems and expert systems: A comparison. Inf. Manag. 1985, 8, 21–26. [CrossRef]23. Pfeifer, R.; Lüthi, H.-J. Decision Support Systems and Expert Systems: A Complementary Relationship? In Expert Systems and
Artificial Intelligence in Decision Support Systems; Springer: Lunteren, The Netherlands, 1987; pp. 41–51.24. Alter, S. Decision Support Systems: Current Practice and Continuing Challenges; Addison-Wesley Pub.: Reading, MA, USA, 1980.25. Pereira Roders, A.; Van Oers, R. Editorial: Bridging cultural heritage and sustainable development. J. Cult. Herit. Manag. Sustain.
Dev. 2011, 1, 5–14. [CrossRef]26. International Concilium of Museums Italia. Professionalità e Funzioni Essenziali del Museo alla luce della Riforma dei Musei
Statali. In COM Italia; Jalla, D., Ed.; ICOM ITALIA: Milan, Italy, 2017; Available online: http://www.icom-italia.org/wp-content/uploads/2018/06/ICOMItalia.SMN_.Quaderno2.novembre.2017.pdf (accessed on 22 February 2021).
27. Tscheu, F.; Buhalis, D. Augmented reality at cultural heritage sites. In Information and Communication Technologies in Tourism 2016;Bilbao, Spain; Inversini, A., Schegg, R., Eds.; Springer: Cham, Switzerland, 2016; pp. 607–619. [CrossRef]
28. Häkkilä, J.; Hannula, P.; Luiro, E.; Launne, E.; Mustonen, S.; Westerlund, T.; Colley, A. Visiting a virtual graveyard: Designingvirtual reality cultural heritage experiences. In Proceedings of the 18th International Conference on Mobile and UbiquitousMultimedia, Pisa, Italy, 26–29 November 2019; pp. 1–4. [CrossRef]
29. Armstrong, J.S. Selecting Forecasting Methods. In Principles of Forecasting: A Handbook for Researchers and Practitioners; Armstrong,J.S., Ed.; Springer: Berlin/Heidelberg, Germany, 2009; pp. 365–385. [CrossRef]
30. Gers, F.A.; Schraudolph, N.N.; Schmidhuber, J. Learning precise timing with LSTM recurrent network. J. Mach. Learn. Res. 2002,3, 115–143.
31. Gers, F.A.; Schmidhuber, J.; Cummins, F. Learning to forget: Continual prediction with LSTM. Neural Comput. 2000, 12, 2451–2471.[CrossRef]
32. Hochreiter, S.; Schmidhuber, J. Long short-termmemory. Neural Comput. 1997, 9, 1735–1780. [CrossRef]33. Goh, C.; Law, R. The methodological progress of tourism demand forecasting: A review of related literature. J. Travel Tour. Mark.
2011, 28, 296–317. [CrossRef]34. Song, H.; Bastian, Z.G.; Vera, S.L. Combining statistical and judgmental forecasts via a web-based tourism demand forecasting
system. Int. J. Forecast. 2013, 29, 295–310. [CrossRef]35. Petropoulos, C.; Nikolopoulos, K.; Patelis, A.; Assimakopoulous, V. A technical analysis approach to tourism demand forecasting.
Appl. Econ. Lett. 2005, 12, 327–333. [CrossRef]36. Lee, W.; Lee, D. Cultural Heritage and the Intelligent Internet of Things. J. Comput. Cult. Herit. 2019, 12, 1–14. [CrossRef]37. Law, R.; Li, G.; Fong, D.K.C.; Han, X. Tourism demand forecasting: A deep learning approach. Ann. Tour. Res. 2019, 75, 410–423.
[CrossRef]38. Nau, R. Forecasting with Moving Averages. Fuqua School of Business, Duke University, 1–3. 2014. Available online: https:
//people.duke.edu/~rnau/Notes_on_forecasting_with_moving_averages--Robert_Nau.pdf (accessed on 29 January 2021).39. Ke, X.; Yifei, L.; Xiaoxiao, M. An evaluation model to assess the communication effects of intangible cultural heritage. J. Cult.
Herit. 2019, 40, 124–132. [CrossRef]40. Nielsen, J.K. Museum communication and storytelling: Articulating understandings within the museum structure. Mus. Manag.
Curatorship 2017, 32, 440–455. [CrossRef]41. Kotler, N.G.; Kotler, P.; Kotler, W.I. Museum Marketing and Strategy: Designing Missions, Building Audiences, Generating Revenue and
Resources; John Wiley & Sons: Hoboken, NJ, USA, 2008.42. Di Pietro, L.; Guglielmetti Mugion, R.; Mattia, G.; Renzi, M.F. Cultural heritage and consumer behaviour: A survey on Italian
cultural visitors. J. Cult. Herit. Manag. Sustain. Dev. 2015, 5, 61–81. [CrossRef]43. Krantz, A.; Korn, R.; Menninger, M. Rethinking museum visitors: Using K-means cluster analysis to explore a museum’s audience.
Curator Mus. J. 2009, 52, 363–374. [CrossRef]44. Roma, P.; Zambuto, F.; Perrone, G. The role of the distribution platform in price formation of paid apps. Decis. Support Syst. 2016,
91, 13–24. [CrossRef]45. Parca, S. Il sistema informativo sul pubblico dei luoghi della cultura statali. Contesto, Obiettivi, Strumento d’Indagine. The
Public Information System of State Cultural Places. Context, Objectives, Investigation Tool. In Primo Colloquio Sulla Valorizzazione:Esperienza, Partecipazione, Gestione; MiBAC: Rome, Italy, 2012; pp. 57–65.
Sustainability 2021, 13, 7070 27 of 27
46. Vitrano, S. La metodologia statistica. In Esperienza E Conoscenza Del Museo: Indagine Sui Visitatori Della Galleria Nazionale D’arteModerna E Contemporanea; Ligozzi, M.M., Mastrandrea, S., Eds.; Mondadori Electa: Rome, Italy, 2008; pp. 44–51.
47. UNESCO. Museums. 2020. Available online: https://en.unesco.org/themes/museums#:~:text=Museums%20are%20more%20than%20places,in%201975%20to%2095%2C000%20today (accessed on 29 January 2021).
48. Statista. Most Visited Art Museums Worldwide in 2019. 2019. Available online: https://www.statista.com/statistics/246293/art-museums-by-total-attendance-worldwide/ (accessed on 22 February 2021).
49. International Concilium of Museums. Statutes. Vienna. p. Art. 3. 2017. Available online: https://icom.museum/wp-content/uploads/2018/07/2017_ICOM_Statutes_EN.pdf (accessed on 29 January 2021).
50. Siau, K.; Lee, L. Are use case and class diagrams complementary in requirements analysis? An experimental study on use caseand class diagrams in UML. Requir. Eng. 2004, 9, 229–237. [CrossRef]
51. Tian, Q.; Ma, J.; Liang, J.; Kwok, R.C.W.; Liu, O. An organizational decision support system for effective R&D project selection.Decis. Support Syst. 2005, 39, 403–413. [CrossRef]
52. Morreale, A.; Robba, S.; Lo Nigro, G.; Roma, P. A real options game of alliance timing decisions in biopharmaceutical researchand development. Eur. J. Oper. Res. 2017, 261, 1189–1202. [CrossRef]


