Development of a Balanced Scorecard in the Investment ...
26
A Work Project, presented as part of the requirements for the Awards of a Master’s Degree in Management from NOVA – School of Business and Economics Development of a Balanced Scorecard in the Investment Department of an Insurance company Yizhe Zhao, No. #2110 A Project carried out under the supervision of: Associate Professor Maria João Major Jan. 18 th , 2016
Transcript of Development of a Balanced Scorecard in the Investment ...

A Work Project, presented as part of the requirements for the Awards of a Master’s
Degree in Management from NOVA – School of Business and Economics
Development of a Balanced Scorecard in the Investment Department of an
Insurance company
Yizhe Zhao, No. #2110
A Project carried out under the supervision of:
Associate Professor Maria João Major
Jan. 18th
, 2016

1
Abstract
In this Work Project, focus will be given to develop a Balanced Scorecard in the
Investment Department in an insurance company in Portugal on the department level in
order to improve the performance measurement in that department. This is an
interventionist research (Suomana et al., 2014) where the researcher acts as a consultant
inside the department and also links the theoretical knowledge with the findings. The
Work Project, along with the Balanced Scorecard developed was developed so as to
provide the director of the department with the tool to evaluate the performance of the
department and set strategic objectives in one year.
Key Words: Balanced Scorecard; Insurance Company; Portugal; department
Content
ABSTRACT ..................................................................................................................... 1 1 – PURPOSE OF THE WORK PROJECT ............................................................................. 2 2 – LITERATURE REVIEW ................................................................................................ 2
2.1 What is the Balanced Scorecard .......................................................................... 2 2.2 How to develop a Balanced Scorecard ................................................................ 4 2.3 Benefits of the Balanced Scorecard ..................................................................... 5 2.4 Criticisms of the Balanced Scorecard ................................................................. 7
3 – METHODOLOGY FOLLOWED IN THE WORK PROJECT ................................................. 8 3.1 Design of the Work Project .................................................................................. 8 3.2 Brief introduction of DIV ................................................................................... 11
4 – FINDINGS AND THE BALANCED SCORECARD ........................................................... 12 4.1 SWOT Analysis of the DIV ................................................................................. 12 4.2 Strategy Map ..................................................................................................... 14 4.3 Balanced Scorecard ........................................................................................... 17
5 – CONCLUSION AND RECOMMENDATIONS OF THE WORK PROJECT ............................ 21 6 – REFERENCES ........................................................................................................... 22 APPENDIX I – DESIGN PLAN OF THE BSC ........................................................................ 24

2
1 – Purpose of the Work Project
The purpose of this work project, which consists of a direct research, is to design a
Balanced Scorecard (hereafter ―BSC‖) for the Investment Department (hereafter ―DIV‖)
in Fidelidade (hereafter ―the company‖), a Portuguese insurance company with the
management located in Lisbon. Such BSC aims to help managers in the Investment
Department to improve efficiency and performance in work and set both financial and
non-financial goals step by step. A little more than one year before the beginning of the
Work Project, the company experienced a shift in ownership, which relatively changed
its strategic planning and short-term objectives and resulted in an incredible turnout.
The director of the Investment Department intends to introduce into the department a
more mature performance measurement system for further improvement. Taking into
consideration the BSC, one of the most popular performance measurement systems
(PMS) in the world, the researcher was asked to mock developing a BSC in the
department and deliver the findings to the director to illustrate the critical objectives of
DIV. Furthermore, the researcher is responsible for supporting the whole process.
Therefore, the design of the BSC for DIV should serve as a pilot project before the
design of the BSC in the rest departments takes place.
In the following part, the literature on the BSC is reviewed. Part three outlines the
methodology followed to develop this Work Project. Part four depicts the Work Project
findings as well as the BSC designed by the researcher and in the final part the main
contributions and further improvement that the present Work Project would bring about
are listed.
2 – Literature Review
2.1 What is the Balanced Scorecard
The concept of Balanced Scorecard was devised by Robert S. Kaplan, Baker
Foundation Professor from Harvard Business School and David P. Norton, founder and
director of the Palladium Group as well as business theorist (Ahn, 2001). Initially, the
BSC developed as a series of critical measures and indicators that provided the
company's top management with a broad view of the business performance (Kaplan et
al., 1992, 2001). Later on, this way of measuring performance turned into a strategic
management technique as the companies started to link corporate strategies with actions

3
by putting in use of the BSC (Kaplan et al., 1996, 2004). Normally, organizations adopt
the BSC for two reasons. Some firms used the BSC as a management by objectives
system, where performance measurement targets are used and compensation is based on
achieving those targets. Some other firms use the BSC as an information system to
provide managers with a tool to improve working performance. Or, both motives are
combined by the managers (Taylor, 2010).
A BSC includes both financial and non-financial measures, which translates corporate
strategy into tangible objectives and performance measures. In other words, this process
will translate the mission and vision of the organization into strategy. The vision
outlines what the organization wants to be, serves as a long-term view and concentrates
on the future of the organization. On the other hand, the mission defines the
fundamental purpose of an organization, describing how it achieves the vision in the
future.
Such performance measures or indicators that are also named Key Performance
Indicators (KPIs) as mentioned above should be numbered varying from 15 to 25 in
each BSC (Kaplan et al., 2008). The organization’s objectives and the KPIs to measure
its achievement are categorized in four perspectives: Financial, Customer, Internal
Business Process and Learning and Growth. The financial perspective aims to answer
the question ―How do we look to shareholders‖ and establishes the long-term financial
goals for organization or business unit. The financial perspective provides most direct
results of the financial performance of the organization. All the rest three perspectives
have an ultimate impact on the financial perspective. As for the customer perspective,
managers are supposed to figure out ―What the customers expect from the company‖.
The Internal Business Process perspective deals with the internal processes within
which the organization or business unit should excel at in order to make sure it delivers
the promised value to customers. The Learning and Growth perspective helps the
managers to set goals so as to create continuous value for the organization.
There are three types of BSC defined by Speckbacker et al. (2003) that are widely
accepted:
(1) Type I BSC: a multi-dimensional framework for strategic performance measurement
that combines financial and non-financial strategic objectives;
(2) Type II BSC: a Type I BSC that describes strategy by introducing a Strategy Map;
(3) Type III BSC: a Type II BSC that also implements strategy by defining objectives,
measurements, targets, frequencies and incentives.

4
Therefore, it is not difficult to reach the conclusion that the Type III BSC is the most
complete one, which will also be adopted in this Work Project.
Organizations adopt a Strategy Map to set strategic objectives, which also illustrates the
relationships between the objectives across the four perspectives of the BSC. The BSC
and the Strategy Map are consistent and the latter will provide the readers with a direct
diagram illustrating how the strategies are interrelated (Kaplan et al., 2008). It can be
concluded from previous researches and studies that the successful execution of a
strategy requires three components which were designed as ―Describe the Strategy‖,
―Measure the Strategy‖ and ―Manage the Strategy‖ ((Kaplan et al., 1996, 2001, 2004).
This leads Kaplan et al. (2004), to formulate the following equation:
[Describe the strategy] + [Measure the strategy] + [Manage the strategy] = Breakthrough
results.
In order to manage the strategy, measurement and description of the strategy from earlier
phases are essential. With the Strategy Map effectively describing the strategy of the
organization from the perspective of the BSC framework by using the causal links
(Kaplan, 2004), the equation can be rewrote as:
[Strategy Map] + [BSC] + [Appropriate Organizations] = Breakthrough results
A well-developed strategy map can, to a great extent, portray the company’s strategy
and the measurement of success for this specific strategy (Knapp, 2001). However,
recent studies encounter various difficulties in developing Strategy Maps in the
organizations. One of the biggest problems is that not all the objectives have causal
relationships and by implementing such a concept on purpose, it seems ―wrong‖ not to
discover such cause-and-effect relationships (Nørreklit, 2000, 2003; Nørreklit et al.,
2008). Another difficulty facing the managers is that people is hard to evaluate and
define. The organizations are made of by employees and while the Strategy Map is
aiming to set objectives for the organizations, the most subjective factor - the behavior
of employees is left from the center of discussion (Almqvist, 2006).
2.2 How to develop a Balanced Scorecard
In order to develop a BSC as a performance measurement system for one organization
or for one business unit, several steps should be taken in order to achieve expected
outcome. (Niven, 2006) First of all, it is necessary to conduct a deep and thorough
background study on this organization, which also includes the mission and vision of

5
the organization, the strategies and competitive position using internal records and
external sources. The more the researcher understands about the organization, the easier
it is for him to customize the BSC to suit the organization.
After gathering all the necessary information about the organization itself, it is
important to inform the employees and the managers in the organization what the BSC
is and its functions in the organization. It makes no sense to develop the BSC with
nobody understanding its essence and need. Once the employees are educated about this
performance measurement tool, their idea of the corporate strategy will be strengthened
and the resistance towards its implementation will relatively drop, which will help
improve the performance measurement system in the long run. At the same time,
sufficient support from the management level will strongly help during such a phase
(Ahn, 2001).
Thirdly, the information generated in the first step will be analyzed and translated so
that a clear status of the organization will be presented. Then, a Strategy Map with the
strategic objectives can be developed. The Strategy Map can communicate to everyone
in the organization what is critical to the success in the four perspectives of the BSC
with a direct diagram (DeBusk et al., 2003). Then each of the strategic objectives in the
Strategy Map will be translated into metrics in order to execute strategy and the
measures of these objectives will be created in this way. After that, the targets,
initiatives and frequencies will be set in order to gather feedback on whether the
measuring process is yielding satisfactory results or not (DeBusk et al., 2003).
Just the corporate level implementation is far from sufficient to build a complete and
successful performance measurement system in one organization. To enable the
employees to demonstrate how they can make a difference, it is important to cascade the
BSC method to the lower-level directions and departments (Niven, 2006; Ahn, 2001). In
this way, employees in the specific business units can discover actions reachable in the
tailored departmental BSC.
2.3 Benefits of the Balanced Scorecard
The financial and non-financial perspectives of the BSC are all involved in the
development of the organization so that non-linear performance breakthroughs are
expected (Banker, 2000). Organizations are no longer satisfied with just improving the

6
financial performance but are more and more concerned with the development and
culture-building in the long run (Almqvist, 2006).
Balanced Scorecard is ―balanced‖ due to its even distribution and harmony in design
(Sundin, 2010). There are three main characteristics with which the BSC enables
balancing multiple objectives in organizations according to Sundin (2010). The first is a
systematic and deep recognition of the stakeholders in the organization. The
understanding of the stakeholders helps managers comprehend ―for whom the
performance should be measured‖ (Kaplan, 1992). With such a base, the second
characteristic is to bring together in a single management report the most critical ones of
the seemingly unrelated elements of an organization’s competitive advantages. The
KPIs are grouped into the four perspectives and the relationship will be observed clearer.
Finally, the perceived relationship resides in the Strategy Map of the BSC, enabling
recognition and equilibrium of the mutual dependence of strategic objectives. The BSC
is in this way ―balanced‖ (Geuser, 2009).
What is worth mentioning is that the BSC focuses on the infrastructure-building of the
organization and emphasizes it the base of the design (Maltz et al., 2003).The Learning
and Growth perspective has full attention on the infrastructure of the organizations as
the intended purpose of this perspective is to strengthen the intangible assets values and
organizations capacity in the long term (Grembergen, 2001). The strategic objectives of
the Learning and Growth perspective are the drivers to achieve desired results in the
other three perspectives and aim to enhance employee capacities, information systems
capacities and employee motivation and alignment at work. Necessary skills should be
provided to enhance employee capacities and to align employee s personal goals with
the ones of the organization and in order to realize such purpose, information serves as a
base to facilitate such linkage, requiring IT systems to adjust at the same
time(Martinsons, 1999). With suitable IT systems, the Learning and Growth perspective
can focus on the growth and development of the employees, strengthening the corporate
values from inside.
The BSC is also linked to the compensation systems and performance evaluation
systems in many organizations. In the past, the incentive plans and rewards were
normally related to the financial indicators at work (Banker, 2000). With the
non-financial indicators included, employees can be evaluated from multiple angels and
in this way, productivity is enhanced. According to Banker, more attention given to the

7
customer-satisfaction-oriented nonfinancial measures is expected to result in increased
revenues in the research conducted in the hospitality industry.
2.4 Criticisms of the Balanced Scorecard
Bunches of case studies can support the normative statements but there still remains
little empirical evidence on whether the usage of BSC is truly associated with improved
organizational performance (Geuser el al., 2009) or, whether the BSC will actually
work. According to a KPMG report, cited by Almqvist (2006), more than 70% of
scorecard implementations fail. This is an astonishing proportion and the reason for
failing is mainly due to the failure to make a real difference inside the organizations
using the performance measures suggested.
What is commonly agreed is that the effectiveness of the BSC is hard to evaluate. Few
studies assess directly the financial performance after the implementation of the BSC in
the organization according to Nørreklit et al. (2008). It is also hard to examine the
effectiveness due to the fact that all the non-financial perspectives demand long-term
observation and the characteristics of the organizations also affect the final performance.
BSCs are not often implemented at the start-up stage of the organizations, which
indicates that the corporate culture and hidden problems are already formed when the
management intends to improve performance. Whether the implementation of such a
management system can shake the hidden problems deeply, with the organization
finally surviving the changing process or just breeze from the surface is still a
mysterious area waiting for further studies to improve.
Thirdly, since the BSC emphasizes implementing the strategic objectives in a ―balanced‖
way, few competitive advantages are highlighted. All that the BSC provides to the
organizations is a ―balanced‖ development in the long-term but in reality, many
managers believe that sometimes only by seizing the opportunities with the most
powerful advantages over the competitors can one organization survive in the business
world. The equilibrium may not strengthen the advantages of the organizations. From
this perspective, the BSC seems too mild when dealing with corporate strategies. On the
other hand, different business units have specific functions and focus so the all of the
four perspectives may seem too overwhelmed (Mooraj, 1999).
At the same time, Salem et al. (2012) compared BSC as a PMS with other
commonly-accepted PMSs and pointed out that the focus of the BSC is still on the

8
financial perspective since all the targets are supposed to be expressed in numbers and
ratios to evaluate performance. The influence of the competitors and the environment is
neglected in the BSC too since more focus is given to the internal characteristics of the
organization itself (Maltz, 2003).
According to the study of Maltz (2003), the lack of focus on human resources makes
BSC incomplete and many companies, after some years of using BSC, added one
dimension to compensate such an issue. More orientation on the development of the
employees will serve as a critical component to the success of the organizations. People
development plans such as scholarships given to employees to develop human capital in
the organizations today are more and more welcomed.
Nørreklit, (2000, 2003; see also, Nørreklit et al., 2008) criticized that the suggested
cause-and-effect relationship between the four perspectives in the BSC is problematic as
Kaplan and Norton failed to prove that there are both logical and causal phenomena
between the relationships of the perspectives. Normally, cause-and-effect relationships
involve a time lag, which is not discussed in the BSC and such lack of time lag
influences the relationship between development and operations in a negative way. On
the other hand, not all the leading indicators have the same exact influence on the
lagging ones. Nørreklit (2000) believes that there is interdependence between the four
perspectives instead of what was initially proposed by Kaplan and Norton.
There is no definitive understanding if the BSC is flawless or problematic (Nørreklit,
2000). Since the BSC is a very flexible tool, it is supposed to be adjusted and corrected
in practice. The effectiveness of the BSC in the organizations and business units should
always be discussed in the future to improve the design and benefit more users.
3 – Methodology followed in the Work Project
3.1 Design of the Work Project
This section contains a description of the methodology used to conduct a qualitative case
study of the Balanced Scorecard in DIV. The components of this section are stated in the
following order: the overall objective of the study, research questions, design, data
collection as well as analysis methods (Yin, 2009; Ryan et al., 2002).
To begin with, the overall objective of the Work Project is to design a Balanced Scorecard
in the Investment Department in Fidelidade. This is an Interventionist Research where the
9
researcher acts as a kind of consultant in the organization in order to investigate for
sufficient data for the study conducted (Yin, 2009). The interventionist researcher will
normally extend the case study methodology by communicating with organizations to
solve actual problems (Dumay, 2010). The emic and etic perspectives of the
interventionist research should always be balanced (Suomana et al., 2014). The emic
perspective focuses on studying behavior from inside the system while the etic
emphasizes that the researcher links the findings with theoretical frame. It is urged that
the researcher research the literature of BSC and develop the BSC of DIV at the same
time.
The research question involved in this Work Project is – ―What are the objectives and the
corresponding performance measurements, targets and initiatives to establish for the BSC
of DIV in the following year?‖
To design the case study, DIV was chosen by the researcher as this department is
currently operating with no systematic performance measurement system. At the same
time, the director of the department intended to implement the BSC in order to better
evaluate the performance of the department. The introduction of BSC is supposed to
witness a difference in strategy making and performance evaluation. The Work Project
was conducted under the direction of the director of DIV and supported by the director of
the Human Resources Department (Hereafter DRH) and two representatives in DIV. The
CFO of the company was also interviewed at the beginning phase to help the researcher
have a better idea of the financial status of the insurance company in general. In this way,
the researcher was actively participating in the design of the BSC, coordinating meetings,
producing support documents for the department as well as ensuring that the purposes for
the various phases of the project were met on time (see Design plan of the BSC in
Appendix I).
The Design Plan for DIV clearly illustrates the phases, which the researcher and the
director followed in order to achieve the intended purpose of the Work Project. Phase A
was designed to understand the environment where locates DIV. In Phase B, the
information, mission and organizational structure of DIV were discussed and at the end of
this phase, a SWOT analysis was presented. Phase C was conducted to translate the
strategies concluded from the SWOT analysis into objectives with the use of a Strategy
Map. At the same time, corresponding measurements were selected by the director and
the researcher. Phase D and E were designed to set the targets and frequencies of the

10
measurements, which after a week’s time was finalized. The work was presented to the
director at the end of November, 2015.
The main sources of the collected evidence were 3 semi-structured interviews (See
Agenda of the Work Project in appendix II), 5 discussion meetings, external
documentation such as Yearly Report 2014 and monthly report of June 2015 and
internally prepared documents from the representatives with data and graphs.
Semi-structured interviews took place at the very start of the project so that the researcher
could get a general and brief idea of the functions and responsibilities of the company.
The CFO, the director of DIV and the director of DRH were interviewed with each
interview taking about one hour and a half on average. After the first two semi-structured
interviews and the first two discussion meetings, a BSC design plan as well as the SWOT
analysis were devised and proposed by the researcher to the director. The SWOT analysis
was conducted to present the current situation and potentials of the department. One
Discussion meeting was arranged between the researcher and the director of DIV to
choose the objectives and corresponding KPIs. The draft Strategy Map was later
proposed by the researcher on October 28th,
2015, which shows the interdependence
among the objectives selected. The director eliminated some of the proposed objectives
and replaced with new ones in the following week, in order to better align these objectives
with strategy and mission of the department. Then the researcher sets targets and
frequencies of the KPIs and finalized the project with the help of the two representatives
in the rest discussion meetings. The researcher contacted the director of DIV through
phone-calls and emails regularly since the latter could not always be available to meet
personally.
Data triangulation was adopted to ensure the credibility of the collected evidence by
interviewing different people with different tasks and job definitions in the DIV (Yin,
2009; Ryan et al., 2002). Note-taking and tape-recordings were used during the
interviews, some of which in Chinese, some in English due to the structure of the
company. There is no transcript due to the length of the meetings and interviews. The
interviews and discussion meetings provided qualitative data such as concepts, opinions
and attitude towards the design. An inductive approach was adopted to analyze the data
involved, as the inductive approach shall be used when qualitative research is the major
design of the inquiry (Merriam, 2005). Quantitative data, such as the Market Share Ratio,
Solvency Ratio and Gross Premiums, was also provided in the process to adjust with the
targets in the BSC designed. The internally prepared documents and opinions of the

11
director were also carefully analyzed and referred to by the researcher during the Work
Project to define the targets of the KPIs. The researcher analyzed the data either
individually or with the representatives during discussion meetings and communicated
through informal conversations to arrange the meetings and discussions.
3.2 Brief introduction of DIV
Fidelidade has been providing businesses in Portugal since 1808. As the leader in
national insurance market in both life and non-life sectors, Fidelidade wins countless
prizes in the industry. According to the monthly report of the company in August 2015,
the company has already become an undisputed leader with total 30% share of
Portuguese insurance market in both life and non-life sectors according to the monthly
report of June, 2015. By going international, suggested by the new Chinese shareholders,
the Fosun Group and supporting the Insurance business with investment in hospital Luz
Saude, Fidelidade seized the opportunity to grow and expand in the long run. And this
principle is also what DIV is focusing on. DIV deals mainly with the company’s
investment management. Reserves generated by the insurance business are used for
investment until they are needed for pay-outs. In addition, equity capital buffers help to
ensure that the company has adequate funds to pay claims or benefits in scenarios in
which actual pay-outs are larger than the reserved. Therefore, the investments include
reserves for expected claims and benefits as well as shareholders’ capital that act as an
additional buffer for unforeseeable events. In DIV, teams are mainly responsible for
portfolio management. The mission of DIV is to control investments, to execute
transactions and to control the transactions on the portfolios. The vision is to generate
more income for the company under Solvency II, a European Directive that codifies and
harmonizes the EU insurance regulation. And this Directive is urging European insurers
to meet the minimum criteria and stay away from insolvency with the qualitative and
quantitative requirements.
There are three teams managed directly by the director and one senior manager in DIV,
the Investments and Financial Products team, the Reporting team and the Database and
Settlements team, each being leaded by one team manager and 4 or 5 team members.
The Investments and Financial Products team focuses on portfolio management, and
DIV has currently more than 300 portfolios in process: unit-linked portfolios,
profit-sharing portfolios and others (fixed-income portfolios and nonlife related

12
portfolios, etc.). The team is also responsible for designing financial products. The
Reporting team, which is relatively small with only 3 team members, delivers Internal
Investment Reports to the department, analyzing the exposure to some companies listed.
At the same time, weekly and monthly reports are sent by the Reporting team to give
different information concerning transactions and the foreign exchange exposure. The
Database and Settlements team records all the transactions made by DIV, checks with
the depository bank, provides support and data for the Accounting Department and Risk
Department, evaluates the portfolios and settles the counterparties. The asset
management part is supported by three parties: DIV, the Fosun team and one asset
management team out of the company where DIV only analyzes the data instead of the
investments. DIV has to report to the Executive Committee from the Fosun group
regularly. The company adopts the concept of BSC as a performance measurement tool,
however, the director of DIV is not currently adopting the concept and he also believes
that the department is rather centralized due to the quality of decision-making and team
work in investments.
4 – Findings and the Balanced Scorecard
4.1 SWOT Analysis of the DIV
In order to develop a BSC in a company or in one department of the company, the
strategies must be studied and understood so that the mission and vision of the company
or the department can be translated into strategic objectives and then be observed and
executed through day to day work. The process of developing a SWOT analysis will
help the company or the department devise the strategies, thus leading to more clear
strategic objectives to be developed (Lee et al., 2000). By first implementing the SWOT
analysis to develop a set of strategies that makes sense, the SWOT analysis will serve as
a stepping stone towards the actual implementation of the BSC. It is critical to start with
a SWOT analysis before discussing with the director from the DIV about the mission
and the vision. A SWOT, which stands for Strengths, Weaknesses, Opportunities and
Threats, is an analytical framework that can help one company face its challenges and
find potential markets to fit in. Here below is the SWOT analysis of the DIV:
Strength
Long history in Portuguese market
With a long history, the insurance company leaves the consumers a reliable image
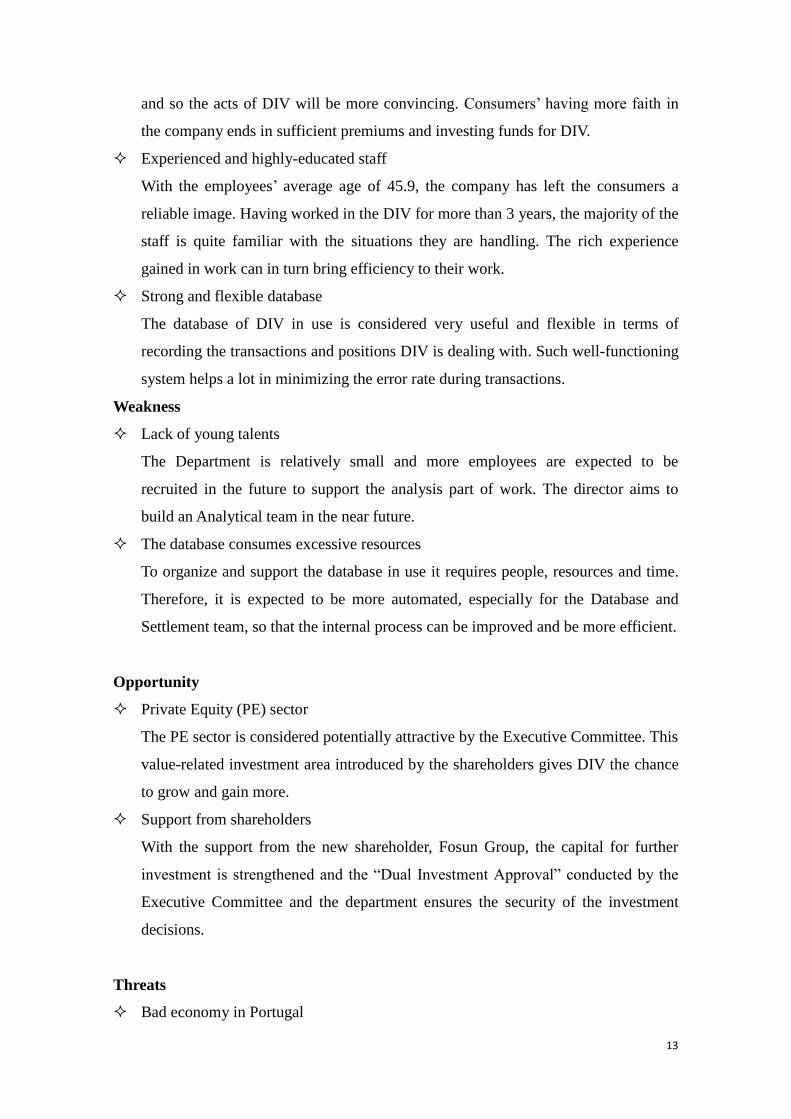
13
and so the acts of DIV will be more convincing. Consumers’ having more faith in
the company ends in sufficient premiums and investing funds for DIV.
Experienced and highly-educated staff
With the employees’ average age of 45.9, the company has left the consumers a
reliable image. Having worked in the DIV for more than 3 years, the majority of the
staff is quite familiar with the situations they are handling. The rich experience
gained in work can in turn bring efficiency to their work.
Strong and flexible database
The database of DIV in use is considered very useful and flexible in terms of
recording the transactions and positions DIV is dealing with. Such well-functioning
system helps a lot in minimizing the error rate during transactions.
Weakness
Lack of young talents
The Department is relatively small and more employees are expected to be
recruited in the future to support the analysis part of work. The director aims to
build an Analytical team in the near future.
The database consumes excessive resources
To organize and support the database in use it requires people, resources and time.
Therefore, it is expected to be more automated, especially for the Database and
Settlement team, so that the internal process can be improved and be more efficient.
Opportunity
Private Equity (PE) sector
The PE sector is considered potentially attractive by the Executive Committee. This
value-related investment area introduced by the shareholders gives DIV the chance
to grow and gain more.
Support from shareholders
With the support from the new shareholder, Fosun Group, the capital for further
investment is strengthened and the ―Dual Investment Approval‖ conducted by the
Executive Committee and the department ensures the security of the investment
decisions.
Threats
Bad economy in Portugal

14
Under the depression, many consumers will stop purchasing insurance packages
that are less urgent in the short run and will be more conservative facing investing
choices. The bad economy also leads to higher interest rates in the market, pushing
DIV to invest in unfamiliar foreign portfolios.
Regulations and Rules worldwide
The investing activities are highly regulated by the various governmental and
regulatory authorities in the countries of its operations. These legal proceedings will
consume time of the group’s senior management. If DIV fails to address these
proceedings in an appropriate way, the company will have its reputation harmed
and suffer additional legal risk which in turn, increases the size and number of
claims and damages asserted against the company or subject the company to
enforcement actions, fines and penalties.
Uncertainties concerning Interest Rate
Changes in interest rates can affect the insurance and investment performance.
DIV’s investment portfolio contains interest rate sensitive-investments, such as
corporate bonds. Increase in market interest rates might decrease unrealized capital
gains on fixed income securities of the investment portfolio. Interest rates are
highly sensitive to monetary policies of government, domestic and international
economic and political conditions and other factors beyond the department’s control.
Volatile interest rates may impact the operating performance of the whole company
as its income and investment returns depend on the level of interest rates.
4.2 Strategy Map
When designing the BSC for DIV, the process of ―Translating the strategy‖ (Kaplan et
al., 1996) will take place in the process. ―Translating the strategy‖ means defining
strategic objectives and KPIs (Kaplan et al., 2008). Then, the selected KPIs were chosen
and carefully selected, enabling the ―Communicating process‖ to take place. BSC
objectives were integrated in the process, which also enabled the ―Linking process‖ to
be conducted in the Strategy Map.
The ultimate strategic objective of DIV to contribute is ―to increase profitability of the
company‖, which must make part of the department’s strategic theme ―to enlarge the
international business proportion‖, which is proposed by the director. This strategic

15
objective was integrated in a strategy map developed by the researcher and approved by
the director to gain consensus.
As a matter of fact, DIV is not in direct contact with the insurance-buyers of the
company, the researcher and the director of DIV believed that the clients of DIV are the
shareholders of the company, the Accounting Department and the Risk Department
inside the company, due to the fact that the investment decisions have direct impact on
the rights and benefits the shareholders are enjoying and the two departments use the
results and data provided by DIV. At the same time, in order to emphasize the
importance of human resources management, the fourth perspective was changed from
Learning and Growth to Development and People. This perspective serves to satisfy all
the aspects of the formers and give certain attention to the cultivation of employees.
The Development and People objectives are at the bottom of the Strategy Map, serving
as a foundation as they stand for the long-term improvement in the department. These
objectives are categorized as the slowest to change and improve but are one of the most
crucial in the corporate culture. At the same time, the need for more talented analysts is
also presented. The Internal Business Process objectives and the Customer objectives
are in the middle, presenting many soft evaluation objectives such as satisfaction level
and automation of the database. How the department is expected to work and provide
final results to the internal clients and shareholders can be observed from such
objectives. Finally, the top of the Strategy Map is occupied by the financial objectives.
The financial objectives can directly reflect the performance of DIV by presenting the
figures and ratios.
When designing the BSC for DIV, two ways of strategy implementation approaches
were discussed. The Top-down strategy implementation method suggested by Kaplan et
al. (2008) demands a clear cut system of command and control in the department. A
clear hierarchy of authority will benefit the business unit in designing the BSC.
However, there are studies suggesting repeatedly that the top-down strategy is sterile
and uninspiring as the mass of employees can hardly reach the corporate strategy nor
participate in creation (Hamol, 1996).
On the other hand, the Bottom-up strategy implementation method could gain more
understanding from the view of the target population and service deliverers. Since
Bottom-uppers place more emphasis on describing what objectives would arouse
problem and difficulties in reaching stated objectives (Matland, 1995), it is considered
more reasonable to be adopted in this Work Project.

16
To increase employee capabilities
To minimize cost spent on Investment To shorten
decision-making time To reduce time spent on database management
To increase team leader capabilities
To achieve higher employee satisfaction
To gain high level of shareholder satisfaction
To increase communication with Executive Committee
To increase profitability
To align with the annual budget
To increase the ability to bear risk
To enlarge the international business proportion
To introduce more employees
To increase accuracy
Financial
Customer
Internal Business Process
People & Development
Figure 1: Strategy Map of DIV
At the same time, it’s also proved too difficult for managers and the director to source
strategic objectives directly at the beginning. After discussion, the Bottom-up strategy
implementation was adopted in this Work Project. The BSC contains the most critical
KPIs of the department, as recommended by Kaplan et al. (2008).

17
4.3 Balanced Scorecard
To measure the strategic objectives, 15 KPIs were carefully selected and discussed
through weeks with the director and the representatives of DIV. Furthermore, since the
purpose of developing a BSC for DIV is to improve ultimately the department’s
financial performance, more leverage is given to this perspective. According to the
director, the performance of DIV highly depends on the market, which means it is
meaningless to set financial objectives for more than one year. In this way, the BSC is
designed only for the next year for DIV.
As mentioned earlier, the BSC designed for DIV during this Work Project is classified
as a type-III BSC since this type includes objectives grouped into four perspectives and
mapped in chains of relationships, as well as associated KPIs and targets (Ahn, 2001).
Initiatives, however, are not part of the BSC due to the scope of the Work Project.
Most of the measures in the BSC are set as quantitative as possible so that the director
can evaluate them easily, and it facilitates the result-comparing process at the same time.
Due to the sensitivity of the information, the majority of the measures are set in
percentage in the Work Project. In the BSC, the usage of surveys is proposed by the
researcher to the director as a way to evaluate the satisfaction rates mentioned below.
The targets of the strategic objectives are set mainly by adopting the methods from the
S.M.A.R.T criteria (Doran, 1981), which means that the department objectives should
be targeted specific, measurable, assignable, realistic and time-related. However, it is
also noticed that not all the objectives have to satisfy all the five characteristics from the
S.M.A.R.T criteria since some objectives are relatively hard to measure in terms of
quantitative approach, which reflects one of the disadvantages of the BSC discussed.
What matters most here is the opinion of the director. Former performance and data of
DIV is also taken into consideration in the target-setting process.
The frequencies were also discussed between the researcher and the director of DIV in
order to achieve expected results without adding extra burden to staff involved. Since
the measurements of the financial perspective are mainly the financial ratios used in the
investment market, the frequencies are adopted by using the customized ones currently
adopted in DIV, which are frequently evaluated. At the same time, most of the
objectives from the non-financial perspectives are set to be measured quarterly so that
they can be measured regularly enough to be on track with the intended purpose.

18
Perspective # Objectives Measurement Explanation Target Frequency
Financial 1 To increase
Profitability
Return on
Investment (ROI)
The ROI measures the profitability of the company by revealing how
much profit can be generated with the investment of the shareholders
and is computed as [Gain from investment- Cost of Investment] /
[Cost of Investment]. This is the major financial objective of DIV as
DIV is one of the channels of the company to generate profit.
4% Monthly
Financial 2 To increase
Profitability
Percentage of
Revenue earned
from Investment
The Revenue earned from Investment measures the profitability of
the company but it is different from the ROI in that this KPI can
evaluate horizontally the performance of DIV.
3% Monthly
Financial 3 To align with the
annual budget of
the department
Percentage deviation
from the budgeted
results
DIV should meet the budget proposed. Percent deviation is computed
as [actual costs - budgeted costs]/ [budgeted costs] and should be
checked every month to align with the expected results. The
percentage deviation of the budget will vary due to the number of
projects so the director suggested a 20% floating space for this KPI.
20%
Monthly
Financial 4 To increase the
ability to bear risk
Solvency Ratio The Solvency Ratio is used here by comparing the size of the capital
relative to all risks the insurer has taken [total assets - total liabilities],
applying Solvency II. The lower this KPI is, the higher possibility
there is that the company defaults on its debt obligations.
150% Quarterly
Financial 5 To enlarge the
international
business
proportion
Weight of
International
Business revenues
compared to total
revenues
This KPI is an indicator to illustrate how the internationalization
process of the company goes. With the anti-monopoly practices in the
Portuguese Market, the best idea to invest is to go global, thus the
larger the Weight is, the better the strategies are implemented.
15% Quarterly
Customer 6 To gain a high
level of
shareholder
satisfaction
Percentage of
shareholders
satisfaction
The shareholders are the clients of DIV as their profits are influenced
by the investment strategies of DIV, thus a higher percentage of
satisfaction among shareholders, the more support DIV gains. With a
survey questionnaire assessing shareholder satisfaction in dimensions
such as Performance Evaluation, Communication, Solvency Ratio,
ROI etc., ranging from 1(extremely dissatisfied) to 5(extremely
85% Quarterly

19
satisfied), the Reporting team can come up with the percentage.
Customer 7 To increase
communication
with the
Executive
Committee
Number of working
hours of
communication per
quarter
Investment decisions should be approved through the ―Dual
Investment Approval‖ stage where all the decisions should be
discussed by both the Investment Committee and the Executives
Committee from the shareholders, thus the more communication
guaranteed, the smoother the process will be. It is suggested that DIV
hold one interactive meeting per week to deliver working progress to
the Executive Committee and send a weekly summary report to the
Committee. Each meeting lasts about two hours and a half and the
summary report serves as a 30-minute presentation.
3
hours/
week
Semi-annu
ally
Internal
Business
Process
8 To increase
accuracy
Settlement Error
Rate
Settlement Errors are non-strategic errors that do not reflect the
intended strategy. These errors are fatal if the amount is huge. Both
miss-operations by the employees and the errors caused by the crash
of the system and disconnection of internet are defined as settlement
errors and the Settlement Error Rate is computed monthly as [# of
miss-operations, system & internet errors] / [# of settlements].
0% Monthly
Internal
Business
Process
9 To minimize cost
spent on
Investment
Percentage deviation
from the budgeted
cost spent on
Investment
Behaviors like frequent trading results in higher operating costs in
Investment. To avoid such costs ensures a more efficient process
inside DIV. The percentage is computed as [actual budget- planned
budget]/ [planned budget].
0% Quarterly
Internal
Business
Process
10 To shorten
average
decision-making
time
Time spent on the
decision-making
process per portfolio
Time matters in the investing projects. Efficient process will strongly
enhance the overall performance of DIV as a whole. The Time will be
calculated by [time of decision] – [time when the proposal was
submitted].
< 24
hours
Quarterly
Internal
Business
Process
11 To reduce time
spent on database
management
Percentage of time
reduced on database
management due to
automation
It is time and resource-consuming to support the database by hand. To
introduce more automated tools to the database can optimize the
Internal Process for the Database and Settlement team, leading to
more efficient data utilization process. By computing ([# of total
hours spent by employees on database management before
automation]/ [# of total hours spent by employees on database
20% Monthly

20
management after automation])-1 using the data from timesheet
uploaded to the intranet with the time allocation of each employee,
this measurement can be observed in this way scientifically. The
researcher also proposed adopting a type of timesheet for employees to
allocate their time spent on each project and task to collect the data.
For every work day, eight hours should be allocated by one employee
by adopting the concept of cost centers. In this way, the director could
have a direct idea of the time consumption of all the employees. The
timesheet will be uploaded every half a month individually. Since this
proposal also involves the coordination of other departments, such
process is not included in the BSC under design in this Work Project.
Developme
nt & People
12 To introduce
more employees
Number of new
analysts recruited
With the development of the whole department, it is necessary to
build an analytical team to manage assets in DIV. Due to the quality
of analytical work, the director suggested 6 employees in that team.
6+ Quarterly
Developme
nt & People
13 To increase
employee
capabilities
Number of training
hours
Training provides the employees with essential working knowledge
and helps them strengthen their abilities. The more training hours
attributed to the employees, the more satisfied and secured the
employees feel in the company.
8
hours/
month
Quarterly
Developme
nt & People
14 To achieve higher
employee
satisfaction
Percentage of
employee
satisfaction
This KIP is critical to the building of corporate culture. With a survey
questionnaire assessing employee satisfaction in dimensions such as
Performance Evaluation, Career Development, Communication, Job
performed, Perception on the functioning of other departments,
Sentiment of belonging, Relations with team leaders, Personal &
Professional Relationships and Compensation.
85% Quarterly
Developme
nt & People
15 To increase team
leader capabilities
Number of hours
spent on training for
the team leaders
In DIV, decisions should be made quickly and in the right tract. To
help team leaders gain more knowledge and experience through
different opportunities will benefit the department in the long run.
4
hours/
month
Quarterly
Table 1: BSC of DIV

21
5 – Conclusion and recommendations of the Work Project
The findings of the Work Project include a SWOT analysis, a Strategy Map and a BSC
with 15 KPIs in detailed explanation. With the mission and vision set, the SWOT analysis
points out the strengths and weakness of DIV and emphasizes the opportunities and
threats that the department is about to encounter in the future. In this way, the strategy of
going international appears to be most crucial for now to serve the purpose of enlarging
profitability. After understanding the current situation, the critical KPIs were listed and
analyzed through discussion with the director and the representative. The
interrelationship of the KPIs can be observed in the Strategy Map. Finally, the BSC
designed above illustrated to which KPIs should be given attention in order to improve
the overall performance in the department. The director can adjust and compare the
figures and set further strategic objectives whenever necessary.
The Work Project served its purpose of developing a BSC for DIV to help the managers
enhance performance. The development of the BSC is on the department level and has to
be adjusted if other departments intend to use it as a PMS in the future. The BSC will
serve as a pilot project in the company.
This Work Project also encounters limit actions. Due to the concerns of use of
information suggested by the company, the researcher was unable to get access to the
corporate BSC of the company. This prevented the researcher from departing from the
strategic objectives identified for the overall company when cascading down the BSC
for DIV. Yet the researcher believes that she overcame this limitation by discussing
with the CFO what the main strategic objectives were for Fidelidade in the forthcoming
years. Another limitation of the study was that the financial perspective was still the
most weighted perspective in the BSC proposed, and furthermore that the importance of
some non-financial perspectives could not be fully revealed in terms of quantitative
measures.
For further research, focus can be given to examining the effectiveness of this BSC in
DIV. By conducting empirical research in the department, such as comparing the
performance before and after a year, and using quantitative models, the effectiveness of
the designed BSC can be tested. When implementation occurs, milestones should also be
set with the weights and levels to align with the current system.

22
6 – References
Ahn, Heinz. 2001. ―Applying the Balanced Scorecard Concept: An Experience Report.‖
Long Range Planning, 34 (4): 441–461.
Almqvist, Ulf Johanson Matti Skoog Andreas Backlund Roland. 2006. ―Balancing
dilemmas of the balanced scorecard.‖ Accounting, Auditing & Accountability Journal,
19(6): 842 – 857.
Banker, Rajiv D., Gordon Potter, and Dhinu Srinivasan. 2000. ―An empirical
investigation of an incentive plan that includes non-financial performance measures.‖
The Accounting Review, 75(1): 65–92.
DeBusk, Gerald K, Robert M, Brown and Larry N. Killough. 2003. ―Components
and Relative Weights in utilization of dashboard measurement systems like the
Balanced Scorecard.‖ The British Accounting Review, 35(3): 215-231.
Doran, George T. 1981. ―There's a S.M.A.R.T. way to write management's goals and
objectives.‖ Management Review, 70(11): 35-36.
Dumay, John C. 2010. ―A critical reflective discourse of an interventionist research
project.‖ Qualitative Research in Accounting & Management, 7(1): 46-70.
Geuser, Fabien de, Stella Mooraj and Daniel Oyon. 2009. ―Does the Balanced
Scorecard add value? Empirical evidence on its effect on performance.‖ European
Accounting Review, 18(1): 93–122.
Grembergen, Wim Van. 2001. Information Technology Evaluation Methods and
Management. Hershey PA: Idea Group Inc.
Hamol, Gary. 1996. ―Strategy as revolution‖ Harvard Business Review, July-August.
Kaplan, Robert S., and David P. Norton. 1992. ―The Balanced Scorecard--Measures
That Drive Performance.‖ Harvard Business Review, 70(1): 71–79.
———. 1996. ―Using the Balanced Scorecard as a Strategic Management System.‖
Harvard Business Review, 74(1): 75–85.
———. 2008. ―Mastering the Management System.‖ Harvard Business Review, 86(1):
62–77.
———. 2001. ―Leading Change with the Balanced Scorecard.‖ Financial Executive,
17(6): 64–66.
———. 2004. Strategy maps: converting intangible assets into tangible outcomes.
Boston, MA: Harvard Business School Press.
Knapp, Karl R. 2001. ―The Balanced Scorecard: Historical Development and Context,

23
As Developed by Robert Kaplan & David Norton.‖ Anderson University DBA, summer.
Lee, S.F., and Andrew Sai On Ko. 2000. ―Building balanced scorecard with SWOT
analysis, and implementing ―Sun Tzu's The Art of Business Management Strategies‖' on
QFD methodology.‖ Managerial Auditing Journal, 15(1/2): 68-76.
Maltz, Alan C., Aaron J. Shenhar and Richard R. Reilly. 2003. ―Beyond the
Balanced Scorecard: Refining the Search for Organizational Success Measures.‖ Long
Range Planning, 36: 187–204.
Martinsons, Maris, Robert Davison and Dennis Tse. 1999. ―The Balanced Scorecard:
a foundation for the strategic management of information systems.‖ Decision Support
Systems, 25: 71-88.
Matland, Richard E. 1995. ―Synthesizing the Implementation Literature: The
Ambiguity-Conflict Model of Policy Implementation‖, Journal of Public
Administration Research and Theory, 5(2): 145-174.
Merriam, Sharan B. 2009. Qualitative Research: A Guide to Design and
Implementation. 2nd ed. San Francisco, CA : John Wiley & Sons.
Mooraj, Stella, Daniel Oyon and Didier Hostettlerh. 1999. ―The Balanced Scorecard:
a Necessary Good or an Unnecessary Evil?‖ European Management Journal, 17(5):
481–491.
Niven, Paul R. 2006. Balanced Scorecard Step-By-Step: Maximizing Performance and
Maintaining Results. New York: John Wiley & Sons, Inc.
Nørreklit, Hanne. 2000. ―The balance on the balanced scorecard— a critical analysis
of some of its assumptions‖ Management Accounting Research, 11: 65-88.
Nørreklit, Hanne. 2003. ―The Balanced Scorecard: what is the score? A rhetorical
analysis of the Balanced Scorecard.‖ Accounting,Organizations and Society, 28, 591–
619.
Nørreklit, Hanne, Marten Jacobsen and Falconer Mitchell. 2008. ―Pitfalls in using
the Balanced Scorecard‖ Journal of Corporate Accounting & Finance, 19(6): 65–68.
Ryan, B., R. W. Scapens and M Theobald. 2002. Research Method & Methodology in
Finance and Accounting. 2nd ed. Hamspshire: Cengage Learning EMEA.
Salem, Milad Abdelnabi, Norlena Hasnan and Nor Hasni Osman. 2012. ―Balanced
Scorecard: Weaknesses, Strengths and its abilities as Performance Measurement System
Versus other Performance Measurement Systems.‖, Journal of Environment and Earth
Science, 2(9): 1-9.
Speckbacher, Gerhard, Juergen Bischof, and Thomas Pfeiffer. 2003. ―A Descriptive

24
Analysis on the Implementation of Balanced Scorecards in German-Speaking
Countries.‖ Management Accounting Research, 14(4): 361–388.
Sundin, Heidi, Markus Granlund and David A Brown. 2010. ―Balancing Multiple
Competing Objectives with a Balanced Scorecard.‖ European Accounting Review, 19(2):
203–246.
Suomana, Petri, Jouni Lyly-Yrjänäinen and Kari Lukka. 2014. ―Battlefield around
interventions: A reflective analysis of conducting interventionist research in
management accounting.‖ Management Accounting Research, 25(4): 304-314.
Tayler, W. B. 2010. ―The Balanced Scorecard as a strategy-evaluation tool: the effects
of implementation involvement and a causal-chain focus.‖ The Accounting Review,
85(3): 1095-1117.
Yin, R. K. 2009. Case Study Research: Design and Methods. 4th ed. Thousand Oaks,
CA: Sage Publications.
APPENDIX I – Design Plan of the BSC
Phase A
Description: To understand functions and
specificities of activities of the company,
and to gather data on the general
performance of the company.
Participants: CFO of the company and
researcher
Phase B
Description: To understand the
organizational structure, mission, vision
and functionalities of DIV
Participants: director of DIV, director of
DRH and researcher
Phase C
Description: To source and select
objectives and KPIs among team
managers and the interdependence
between the KPIs
Participants: director of DIV,
representatives and researcher
Phase D
Description: To define measurement
frequencies for KPIs
Participants: Representatives and
researcher
Phase E
Description: To define targets for KPIs
Participants: director of DIV,
representatives and researcher
Phase F
Description: To finalize the BSC and
compare with the former system
Participants: Representatives, HR
manager and researcher
APPENDIX II – Agenda of the Work Project
Date Content Duration
Sept. 8th Kick off meeting and interview with CFO 2 hours
Sept. 22nd
Interview with director of DIV 2 hours

25
Director
Investments &
Financial Products Reporting Database &
Settlements
Senior Manager
September
2015
October
2015
SUN MON TUE WED THU FRI SAT SUN MON TUE WED THU FRI SAT
1 2 3 4 5 1 B 2 B 3
6 7 A 8 A Inter.
CFO
9 A 10 A 11 A
12 4 5 B Dis.
6 B 7 B 8 B 9 B
10
13 14A 15A 16 B
17 B 18 B 19 11 12 B Dis.
13 B 14 B 15 B SWOT
design
plan
16 B
17
20 21 B 22 B Inter.
DIV
23 B 24 B 25 B 26 18 19 B Inter.
DRH
20 B 21 C 22 C
23 C
24
27 28 B 29 B 30 B 25 26 C 27 C 28 C Stra
Map
29 C 30 C 31
November
2015
SUN MON TUE WED THU FRI SAT SUN MON TUE WED THU FRI SAT
1 2 D 3 D 4 D Dis.
5 D 4 D 7 29 30 F Final
BSC
8 9 D 10 E 11 E Dis.
12 E 13 E 14
15 16 E 17 E 18 F Draft
19 F 20 F 21
22 23 F Final
Dis.
24 F 25 F 26 F 27 F 28
APPENDIX III – Organizational Structure of DIV
Oct. 5th Discussion about DIV information 1 hour and 30 minutes
Oct. 12th Discussion about DIV SWOT and design plan 1 hour
Oct. 19th Interview with director of DRH 1 hour
Nov. 4th Conclusion on the Strategy Map and measurements
(KPIs) and discussion about the frequencies and targets
2 hours and 30 minutes
Nov. 11th Discussion about the frequencies and targets 45 minutes
Nov. 23rd
Final discussion about the BSC 1 hour