Development in the supply chain of the Philippine Goat ... · Development in the Supply Chain in...
42
Development in the Supply Chain in the Philippine Goat Industry: An Assessment, Esplana, Abao and Vasquez Page 1 of 42 Development in the Supply Chain of the Philippine Goat Industry: An Assessment 1 Esplana, R. Elmer 2 , Lary Nel B. Abao 3 , Rolando M. Vasquez 4 ______________________________________________________________________________ ABSTRACT The study documents the development of the Philippine Goat Industry within the supply chain. The study used triangulation method that comprising of archival research, key informant interviews, benchmarking, competitiveness and profitability analysis. The study indicates that there have been many improvements in the supply chain of the Philippine goat industry from input supply to consumption. There were also some best practices that can be emulated among the goat industry stakeholders. The study also suggests for more investment opportunities for the goat production. Also, it indicates that the Philippine goat meat (chevon) product is competitive compared with other countries, such as Australia, United States and Canada, in terms of price competitiveness and the goat production is a very profitable entrepreneurial project. This underscores for a better outlook of the industry, in terms of better prices and supply, and higher consumption for both the local, and potentially export market in the coming years. The study results support the goals and objectives of the Department of Agriculture (DA) and Agriculture and Fisheries Modernization Act (AFMA) in contributing to food security, poverty alleviation, improved productivity and increased income and global competitiveness of the livestock sector, in general, and goat industry, in particular. 1 Received the Grand Prize Winner for the Best National R&D AFMA Paper Awards for Socio-economics Category. 19 th National Research Symposium (NRS), Bureau of Agricultural Research, Department of Agriculture, October 6, 2007. The 2007 NRS had a theme “Agriculture and Fisheries R&D Toward Agribusiness Development and Agro-Industrialization.” The main author can be contacted at email address: [email protected] or mobile no. +63 922-8117367. File can also be downloaded online at the CPR Community (Club of Professional Researchers) Website at www.smileyberks.com/cpr. 2 Agriculturist II, Bureau of Animal Industry (BAI) and President of the Club of Professional Researchers (CPR). 3 Agriculturist II, BAI, CPR Treasurer. 4 Agriculturist II, BAI, CPR Member
Transcript of Development in the supply chain of the Philippine Goat ... · Development in the Supply Chain in...

Development in the Supply Chain in the Philippine Goat Industry: An Assessment, Esplana, Abao and Vasquez
Page 1 of 42
Development in the Supply Chain of the Philippine Goat Industry: An Assessment 1
Esplana, R. Elmer2, Lary Nel B. Abao3, Rolando M. Vasquez4 ______________________________________________________________________________
ABSTRACT The study documents the development of the Philippine Goat Industry within the supply chain.
The study used triangulation method that comprising of archival research, key informant
interviews, benchmarking, competitiveness and profitability analysis. The study indicates that
there have been many improvements in the supply chain of the Philippine goat industry from
input supply to consumption. There were also some best practices that can be emulated among
the goat industry stakeholders. The study also suggests for more investment opportunities for the
goat production. Also, it indicates that the Philippine goat meat (chevon) product is competitive
compared with other countries, such as Australia, United States and Canada, in terms of price
competitiveness and the goat production is a very profitable entrepreneurial project. This
underscores for a better outlook of the industry, in terms of better prices and supply, and higher
consumption for both the local, and potentially export market in the coming years. The study
results support the goals and objectives of the Department of Agriculture (DA) and Agriculture
and Fisheries Modernization Act (AFMA) in contributing to food security, poverty alleviation,
improved productivity and increased income and global competitiveness of the livestock sector,
in general, and goat industry, in particular.
1 Received the Grand Prize Winner for the Best National R&D AFMA Paper Awards for Socio-economics Category. 19th National Research Symposium (NRS), Bureau of Agricultural Research, Department of Agriculture, October 6, 2007. The 2007 NRS had a theme “Agriculture and Fisheries R&D Toward Agribusiness Development and Agro-Industrialization.” The main author can be contacted at email address: [email protected] or mobile no. +63 922-8117367. File can also be downloaded online at the CPR Community (Club of Professional Researchers) Website at www.smileyberks.com/cpr. 2 Agriculturist II, Bureau of Animal Industry (BAI) and President of the Club of Professional Researchers (CPR). 3 Agriculturist II, BAI, CPR Treasurer. 4 Agriculturist II, BAI, CPR Member

Development in the Supply Chain in the Philippine Goat Industry: An Assessment, Esplana, Abao and Vasquez
Page 2 of 42
_____________________________________________________________________________ Keywords: Development in the Supply Chain, Assessment of Investment Opportunities in the Goat Industry, Profitability of Goat Production, and Price Competitiveness of Goat Meat _____________________________________________________________________________ I. INTRODUCTION The goat industry in the Philippines has undergone a lot of development since the First National
Small Ruminants Congress in Central Luzon State University in May 2001. In the said congress,
an interim body was formed which initially became the trailblazer for organizing the small
ruminant industry players in the country. There are few local and national associations that
were organized as an offshoot of this congress. One national association is the Federation of
Goat and Sheep Producers Association of the Philippines (FGASPAPI) which was funded
through the support of Livestock Development Council and other livestock agencies including
BAI and Central Luzon State University.
The supply chain as applied to the goat industry in the Philippine is a new concept. There have
been either few or no studies that have been done in the goat industry (in the Philippines) on
documenting and assessing the development based on the supply chain approach.
This study looks at documenting and assessing the development of the goat industry along the
supply chain. This study serves as baseline information for the government, private sector and
industry associations to be aware and updated on the development of the industry in the supply
chain. The study will also help them to identify investment opportunities within the goat
agribusiness supply chain that will support the goals and objectives of the Department of

Development in the Supply Chain in the Philippine Goat Industry: An Assessment, Esplana, Abao and Vasquez
Page 3 of 42
Agriculture toward the attaining of food security, poverty alleviation, improve productivity,
increased income and global competitiveness.
II. OBJECTIVES
The main objective of the study is to document and assess the development of the Philippine goat
industry within the supply chain. Specifically, the study aims to: 1) Provide a baseline
documentation of the developments in the Philippine goat industry from input supply,
production, processing, marketing and consumption; 2) Identify the best practices along the
supply chain approach; 3) Develop competitiveness and profitability analysis of chevon; 4)
Advocate improvement for the inefficiencies, gaps and problems encountered by the industry
along the supply chain; and 5) Recommend strategic directions for the Philippine goat industry.
III. METHODOLOGY The study utilized triangulation method in conducting this study. The components of this method
include: archival research, key informant interviews (one-on-one interview, telephone
interviews/mobile/email communications), benchmarking, competitiveness and profitability
analyses. Below is the framework of the study (Please see Figure 1). The sources of data used
in the study were taken from the Bureau of Animal Industry (BAI) and Bureau of Agricultural
Statistics (BAS). Key informant interviews (KII) were conducted with a representative from the
Federation of Goat and Sheep Producers Association of the Philippines, Inc. and key industry
players in meat processing. To supplement the KII, archival research was done in gathering
existing literature and material from BAI Marketing Development Division (BAI-MDD), printed

Development in the Supply Chain in the Philippine Goat Industry: An Assessment, Esplana, Abao and Vasquez
Page 4 of 42
(published or unpublished) and online publications. Benchmarking was done by documenting the
existing best practices of some goat industry players along the supply chain.
IV. RESULTS AND DISCUSSION Supply Chain: Its importance to the Goat Industry Supply Chain is the core business process in any organization that creates and delivers a product
or service, from concept through development and manufacturing or conversion, and into a
market for consumption. It is called as the “seed to shelf” or “breed to plate” or “farm to fork”
approach. The mission of supply chain,5 as a management approach, is the ability of individual
agribusiness firm/establishment or an industry “to enhance the customer’s experience through
excellence in delivering the right products, services, resources and information seamlessly to the
right place at the right time.” The industry focus of supply chain management includes activities
such as integrated behavior, mutual sharing of information, mutual sharing of risk and rewards,
cooperation, same goal and same focus on serving customers, integration of processes,
5 As quoted from the presentation on Supply Chain Management. Ag BM 460.

Development in the Supply Chain in the Philippine Goat Industry: An Assessment, Esplana, Abao and Vasquez
Page 5 of 42
partnership in building and maintaining long-term relationships among each industry
stakeholder. According to Price Water Coopers “Nowadays, it is supply chains that compete
with other supply chains!”
The framework of goat industry supply chain is presented below in Annex A, which the
researchers used in analyzing the development of the industry along the supply chain. Based on
this framework, supply chain starts from the input supply, production, processing, marketing and
consumption of products and services produced by the individual agribusiness
firm/establishment or an industry (goat). In between of each segment of the supply chain is the
relevance of logistics (both inbound and outbound) that interconnect the supply chain from input
supply up to the consumption level of sold and delivered goods and services by the industry. On
the agribusiness firm level, the inter-firm linkages will fall into different boxes (Annex A), but
some linkages will be more important for the overall competitiveness and dynamics of the chain
than others. There are also some cases that in each stage, one firm can be forward and backward
integrate to maximize its potential in maximizing the company’s or firm’s profitability and
competitiveness.

Development in the Supply Chain in the Philippine Goat Industry: An Assessment, Esplana, Abao and Vasquez
Page 6 of 42
THE GOAT INDUSTRY IN THE PHILIPPINES INPUT SUPPLY
BGoat inventory are increasing by six percent per year
The country’s goat inventory (as of January 1, 2006) was estimated at 3.73 million head, 5.6-
percent higher compared with last year’s headcount.6 Around 38 percent of the goat population
was female breeders, 33 percent were kids, and 29 percent were classified as fatteners and male
breeders. It is important to note that there was an increase of 23% in goat inventory from
January 1, 2003 to January 1, 2007 for an average annual increase of 6% per year. The total
inventory of goat went up from 3,270,441 heads in January 1, 2003 to 4,037,574 heads in
January 1, 2007.
TABLE 1. GOAT: INVENTORY BY FARM TYPE AND BY CLASSIFICATION, PHILIPPINES, JANUARY 1, 2003-2007 (IN HEADS)
2003
(Jan. 1) 2004
(Jan. 1) 2005
(Jan. 1) 2006
(Jan. 1) 2007
(Jan. 1) Backyard 3,255,189 3,340,670 3,514,371 3,708,014 4,007,004 Commercial 15,252 16,954 20,824 26,171 30,570 Total 3,270,441 3,357,624 3,535,195 3,734,185 4,037,574
Source: BAS
On the other hand, Figure 3 shows the top five producing provinces of goat in terms of
inventory. Western Visayas (Region VI) has the most number of goat inventory at 550,431
heads or 15% of the total population. Ilocos Region (Region I) is the second place with 491,435
heads, or 13% of the population. Central Visayas (Region VII) is third with 471,561 heads.
Davao Region is the fourth with the highest inventory at 335,648 heads for 9%. Region IV
(combined CALABARZON and MIMAROPA) is the top five producer of goat at 293,753 heads
at 8%. The small percentage of commercial inventory (not even one percent of the total) of goat
showed that, in general, there are still more effort to be done by the government (DA and
6 Bureau of Agricultural Statistics, Goat Industry Performance Report: January to December 2005, (May, 2006).

Development in the Supply Chain in the Philippine Goat Industry: An Assessment, Esplana, Abao and Vasquez
Page 7 of 42
livestock agencies) and industry associations (particularly FGASPAPI) to encourage goat
farmers to shift from backyard to commercial type of operation to increase and sustain its supply.
Supplier industries are benefiary from the production and processing technology initially adopted by the other livestock commodities The suppliers of the goat industry are those industries, which provide raw material inputs and
processing technology. Raw materials inputs include: breeds, feeds, animal health products and
production technology. Processing technology includes, among others, meat-processing
equipment, packaging materials and other utilities. Since 2001 up to present, more and more
breeder farms are into the business of supplying either imported breed of goat such as Boer,
Saanen, Anglo Nubian, etc., locally borne crossbreed or upgraded goats either from the imported
breed themselves or with the native goats. According to Neo Abalos, the Secretary/Treasurer of
FGASPAPI, and also the head of the goat business of Abalos & Sons Agro Industrial
Corporation, among the different breeder farms of goat, their group have almost already
perfected the crossbreeding of imported breed and upgrading of native and imported goat, to the
extent that they have now a standard size of goat either for breeding or for slaughtering purposes.
FIGURE 3. GOAT: INVENTORY OF TOP PRODUCING REGIONS, PHILIPPINES,
AS OF JANUARY 1, 2006 (IN HEADS)
Region 4Region 11
Region 713%
Region 113%
Region 615%Others
42%

Development in the Supply Chain in the Philippine Goat Industry: An Assessment, Esplana, Abao and Vasquez
Page 8 of 42
Some goat industry stakeholders in the breeding operations has almost perfected the pure breeding crossbreeding, and upgrading operation with standard weight for either breeding or slaughtering purposes Based on their experience, an F1 breed type from purebred imported will give you an estimated
value of P5,000 per head. In every generation, there is an increase of additional peso value of
P5,000. So for F2, it is sold at P10,000 per head while F3, at P15,000 per head, and so on. In
the case of goat feeds, there are some companies that are producing goat feeds, although,
according to him, the goat raising business is not that sensitive to commercial feeds, as goats
normally eat grasses, which they plant as feeds for their goats. In one hectare of land, they can
already pasture and housed at least 100-doe level of different kinds of goats such as imported,
crossbreed and native type. Another advantage of the goat production compared with other
livestock, particularly hog is that, in terms of vaccinating goat or using animal health products,
the goat producers are not too dependent to veterinary health products. Goats are considered as
robust animals. They can easily adopt and survive in Philippine environment free from animal
diseases.
In the Philippines, with the development of the livestock and poultry industry input suppliers,
the goat industry serves as beneficiary for any developments and new trends in the production
and meat processing technology that are being used by other livestock industry commodities.
Although when it comes to artificial insemination (AI) technology, the goat industry, in general,
is not yet adopting this technology in their individual goat farms.
Imported live goats for breeding are increasing but there still more effort to be done to encourage more investment among farmers to shift from backyard to commercial operation to sustain the stable and availability of goat supply There are seven breed type of goats that are being imported as part of the input supply (Please
see Table 2), although only two are the most popular breed type, which are Anglo-Nubian and
Boer. Boer is much larger and efficient meat producer than any other breed of goats (e.g.
Saanen, Anglo-Nubian, etc.). It produced as high as 48 to 60 percent carcass yield compared to
other goat type, which according to one industry player is only from 40 to 43 percent. Data from
the BAI showed that from 2002 to 2006, there are 1,172 Boer types that were imported. On the

Development in the Supply Chain in the Philippine Goat Industry: An Assessment, Esplana, Abao and Vasquez
Page 9 of 42
average, Boer type has been growing by 16 percent per year. Total importation per year during
the same period had been increasing by 72 percent per year. The increase of importation of
imported goat could be attributed to the growing number of local goat farms or breeder farms
that are investing in upgrading and crossbreeding operation of goats. One problem that can be
traced from the importation figure which the researchers gathered is that, there are some goat
importations which are imported at least in two breeds in one shipment that in the declaration of
imports, one breed cannot directly separated from the other. This is the reason why we placed
the notation in Table 2 that says it is “not properly classified.”
Table 2. Imported Goats by Breed Type from 2002 to 2006 (In No. of Heads)
Breed Type 2002 2003 2004 2005 2006 Total African Pygmies 3 0 0 0 0 3 Anglo- Nubian 8 12 9 0 10 39 Boer 112 287 182 383 208 1172 Nigerian Dwarf 3 0 0 0 0 3 Saanen 0 0 0 0 0 0 Spanish Goat 0 3 0 0 0 3 Ten. Fainting 0 3 0 0 0 3 NPC* 0 0 299 947 697 1,943 Total 126 305 490 1330 915 3,166
Source of Basic Data: BAI-NVQS * Not Properly Classified
In terms of country of origin, imported goats came from three countries such as Australia, United
States, and New Zealand. From 2003 to 2006, imported goats from Australia have been
growing by an average of 66 percent per year. On the other hand, imported goats from the
United States had been in the decreasing trend from 2002 to 2006. Total imported goats from
2002 to 2006 were recorded at 3,166 heads (Table 3).
Table 3. Country of Origin of Imported Goats from 2002 to 2006 (In No. of Heads)
Origin 2002 2003 2004 2005 2006 Total Australia 0 223 467 1,304 865 2,859 New Zealand 0 0 0 4 0 4 USA 126 82 23 22 50 303 Total 126 305 490 1,330 915 3,166
Source of Basic Data: BAI-NVQS

Development in the Supply Chain in the Philippine Goat Industry: An Assessment, Esplana, Abao and Vasquez
Page 10 of 42
PRODUCTION Goat Production Performance: Second to the most stable positive growth from 1995 to 2006, although very minimal Total goat volume of production reached 74.82 thousand metric tons liveweight, a decrease of 3.20
percent over 2005 gross output of 77.29 thousand metric tons (Table 4). The average increase in
production of goat, in general, has been increasing only at a minimal of less than one percent per
year, although in terms of other livestock commodities, hog and goats are consistently in the positive
growth per year (Table 4). Aside from hog industry, the goat industry is the second to the most
stable in the volume of production as presented in the Table 4 below from 1999 to 2006. Emerging
growth has been seen in the dairy industry, which has been increasing at an average of four percent
per year since 1999, from the decreased production in 1995 to 1998 by 9.28 percent.
Table 4. Comparison of Livestock Volume of Production (in Thousand Metric Tons)
and Growth Rates from 1995 to 2006
Volume of Production
(1995-1998)
(1999-2002)
(2003-2006) 2005
(In MT) 2006 (MT) % Change Average
GR Average
GR Average
GR Total Volume of
Production 5.35 3.37 1.41 2,241.18 2,296.74 2.48 Carabao (1.18) 3.36 (0.78) 133.52 130.41 -2.33 Cattle 8.77 (1.53) (2.77) 246.75 238.27 -3.44 Hog 5.74 4.38 2.18 1,771.28 1,840.37 3.90 Goat 0.91 0.28 0.71 77.29 74.82 -3.20 Dairy (9.28) 3.95 4.76 12.34 12.87 4.29
Source of Basic Data: BAS Average GR- Growth rate per year
In terms of value of goat production (at constant prices), the same trend could also be observed
in the average yearly growth rates from 1995 to 2006, which is less than five percent per year. In
2006, the total value of production was recorded at P974.16 million (Table 5).

Development in the Supply Chain in the Philippine Goat Industry: An Assessment, Esplana, Abao and Vasquez
Page 11 of 42
Table 5. Comparison of Livestock Value of Production (in constant prices) and Growth Rates from 1995 to 2006
Value of Production
(1995-1998)
(1999-2002)
(2003-2006) 2005
(P Million) 2006
(P Million) % Change Average GR
Average GR
Average GR
Total Value of Production 5.67 3.35 1.39 39,384.58 40,396.74 2.57 Carabao (1.20) 3.36 (0.81) 1,611.59 1,574.05 -2.33 Cattle 8.75 (1.53) (2.76) 4,804.22 4,639.12 -3.44 Hog 5.74 4.38 2.16 31,900.75 33,145.06 3.90 Goat 0.92 0.26 0.62 1,006.32 974.16 -3.20 Dairy (9.32) 3.95 4.76 61.70 64.35 4.29
Source of Basic Data: BAS Average GR- Growth rate per year Major key players have organized themselves into a national federation to consolidate their voices, but the challenge among them is to work further to influence and convince more possible investors/entrepreneurs in the production of goats The major players of the goat and sheep industry are composed of nine member associations of
Federation of Goat & Sheep Producers & Associations of the Philippines, Inc. (Please see Table
6) These associations include the Goat and Sheep Producers of the Philippines, Region IV Small
Ruminants Raisers Association, Misamis Oriental Goat and Sheep Raisers Association,
Zamboanga Peninsula Small Ruminant Council, Cebu Goat and Sheep Raisers Association,
Eastern Visayas Small Ruminant Raisers Association, Masbate Small Ruminants Organization,
SOCKSARGEN Goat and Sheep Raisers Cooperative and Philippine Boers Breeders
Association.

Development in the Supply Chain in the Philippine Goat Industry: An Assessment, Esplana, Abao and Vasquez
Page 12 of 42
Table 6. Major Players Association of the Goat and Sheep Industry Name of Association Location Contact Person Email Address
1. Goat and Sheep Producers of the Philippines
Tarlac Jeff Lim [email protected]
2. Region IV Small Ruminants Raisers Association
Region IV Elmer Rivera [email protected]/ [email protected]
3. Misamis Oriental Goat and Sheep Raisers Association
Misamis Oriental Nani Nietes [email protected]
4. Zamboanga Peninsula Small Ruminant Council
Zamboanga Peninsula
Art Grino [email protected]
5. Cebu Goat and Sheep Raisers Association
Cebu Luis Sanchez [email protected]
6. Eastern Visayas Small Ruminants Raisers Association
Eastern Visayas Lito Rodriguez [email protected]
7. Masbate Small Ruminants Organization
Masbate Jose Ataat [email protected]
8. SOCKSARGEN Goat and Sheep Raisers Cooperative
SOCKSARGEN Gauvian Benzonan [email protected]
9. Philippine Boer Breeders Association
Sixto Villaluz [email protected]
Source of Data: FGASPAPI Table 7 shows the selected private goat farms located in different regions. Of the 44 identified
breeder goat farms, 17 farms are located in Region III. Twelve farms are located in Tarlac, two,
in Nueva Ecija; two, in Pampanga; and one, in Bulacan. There are 10 goat farms in Region VIII,
seven in Leyte and three in Ormoc City. The challenge among the members association of
FGASPAPI is to influence and convince more possible investors/entrepreneurs in the production
of goats to further improve the production goat in the country.
Almost around 1 is 2 goat farms/breeding farms are government-owned farms, but their role should support on how to effectively sustain the production of goats at the farm level

Development in the Supply Chain in the Philippine Goat Industry: An Assessment, Esplana, Abao and Vasquez
Page 13 of 42
Table 7. Selected Private Goat Farms by Regions and Provinces/Cities
and the Available Breed Type
Region Province/City No. of Breed/s Available Farm PbB PbAn BxAn UpB UpAn UpS PbS N xS
NCR QC 1 x x x I Pangasinan 2 x x x x x II Isabela 1 x x III Tarlac 12 x x x x x x Nueva Ecija 2 x x x x x x Bulacan 1 x x x x x Pampanga 2 x x x x x IV Rizal 1 x x x x x x Batangas 1 x x x x x Quezon 1 x x x x x VI Bacolod City 1 x VII Mandaue City* 1 VIII Ormoc City 3 x x x x Leyte 7 x x x x x X Malaybalay City* 1 x x Valencia City* 1 XI Gen. Santos City 2 x x x Sultan Kudarat 1 x x Davao del Sur 1 x x Davao City 1 XII Cotabato 1 x x x x Total 44
Source of Basic Data: BAI Legend: PbB –purebred Boer; PbAn – purebred Anglo Nubian; BxAn – crossbreeding of Boer and Anglo Nubian; UpB – upgraded Boer; UpAn -Upgraded Anglo Nubian; UpS – Upgraded Saanen; PbS- Purebred Saanen; xS-crossbreed Saanen; N- native * Not identified
There are 21 identified government breeder goat farms (Please see Table 8) located in most of
the regions of the country. Region III has the most number of farms (4); followed by Region II
(3). Both Regions VII and Region X have two farms. The most prevalent breed both among the
private and government farms are the purebred Boer type. Boer breed could be found in most of
the major goat producing regions (Region VI, Region III, Region XI, Region IV (Table 7) and
Region VII (Table 8).

Development in the Supply Chain in the Philippine Goat Industry: An Assessment, Esplana, Abao and Vasquez
Page 14 of 42
Table 8. Selected Government Goat Farms by Regions and Provinces/Cities
And the Available Breed Type
Region Province/City No. of Breed/s Available Farm PbB PbAn BxAn UpB UpAn UpS PbS N xS
CAR Baguio City 1 x x I Pangasinan 1 x II Tuguegarao City 1 x Nueva Vizcaya 1 x x Isabela* 1 III Pampanga 1 x Nueva Ecija 3 x x x x x IV Laguna 1 x V Masbate 1 x VI Negros Occidental 1 x VII Negros Oriental* 1 Bohol 1 x x VIII Leyte 2 x IX Zamboanga del Sur 1 x x Basilan 1 x X Misamis Oriental* 1 Bukidnon 1 x XII North Cotabato 1 x x Total 21
Source of Basic Data: BAI Legend: PbB –purebred Boer; PbAn – purebred Anglo Nubian; BxAn – crossbreeding of Boer and Anglo Nubian; UpB – upgraded Boer; UpAn -Upgraded Anglo Nubian; UpS – Upgraded Saanen; PbS- Purebred Saanen; xS-crossbreed Saanen; N- native * Not identified

Development in the Supply Chain in the Philippine Goat Industry: An Assessment, Esplana, Abao and Vasquez
Page 15 of 42
PROCESSING
Goat Products
Goat products and by-products are many and varied.7 The main products are milk and meat (chevon).
According to Southard (2003), the name chevon or goat meat was taken from the French word for
goat, chevre is said to be an excellent flavor similar to beef and venison. Goat milk is used essentially
for the same purposes as cow or carabao milk such as fresh milk, cheese, ice cream, and butter.
Also, because of the milk’s high Vitamin A content, it is increasingly being used in the manufacture
of cosmetics. Goats when properly slaughtered, cleaned, and butchered, can be a source of unique
and delectable meat, which may be used in a wide array of dishes. Goat meat has high water-holding
capacity. As such, it is also a good raw material for processing into different products. By-products,
especially skins, are likewise valuable when processed into leather. Other minor by-products such as
intestines, horns, and hair are processed into high-valued articles and art objects.
Pasteurization of Goat Milk
The fundamental purpose of pasteurization is to ensure that milk is free from disease-producing
microorganisms, with the secondary effect of prolonging the keeping quality of the product.
However, pasteurization does not compensate for the failure to apply recommended sanitary
practices in the production of milk and should not be regarded as the cure-all for poor sanitary
practices in the handling and care of milk.
Slaughtering
The recommended ages for slaughtering goats are between eight months up to two years, although
there are some major goat producers, which subscribe to the idea that to experience the optimum
quality of chevon from either imported crossbreed or upgraded native, slaughtering goats starting
7 The Philippines Recommends for Goat Farming, “Product and By-Product Processing and Utilization,” pp. 85-95.

Development in the Supply Chain in the Philippine Goat Industry: An Assessment, Esplana, Abao and Vasquez
Page 16 of 42
from 9 to 10 months and up to 18 months only is most appropriate and highly recommended age.
Going beyond the said age of goat, chevon odor (goaty smell) will be more noticeable. At 9 to 10
months, crossbreed goat can have a weight of at least 30 kilos already. Also, it is recommended that
before slaughtering the goat, it should not allow the breeding bucks to mix with the females and the
castrated male to avoid the goaty smell in the carcass. Fast the goats first, give plenty of water for
18-24 hours, and allow them to relax. This is for ease in evisceration and cleaning of entrails.
Moreover, expected results in goat meat are longer shelf life and low shrinkage. Prior to the actual
start of slaughtering, wash off dirt from the goat’s body to prevent contamination of the carcass.
During slaughter, do not allow the hair to rub against the flesh because it imparts objectionable odor
and flavor to the meat. The following are the average wholesale yield (Ibarra, 1988) of the different
cuts of chevon, with the above fabrication system. With the slaughter weight of 18.97 kg, you can get
a dressing percentage of 43.16% and boneless recovery of 32.33%.
TABLE 9. PERCENT OF CARCASS OF THE DIFFERENT CUTS OF CHEVON
Cut Percent of Carcass Leg 29.21 Loin 13.33 Rib 15.76 Neck 7.15 Shoulder 12.10 Whole carcass 100.00
As to the assessment of conformation and quality of chevon, these are not yet available
from the Philippine Standards.

Development in the Supply Chain in the Philippine Goat Industry: An Assessment, Esplana, Abao and Vasquez
Page 17 of 42
Goat By-Products
From unpublished data (Ibarra, 1988), the by-product yields of goats are as follows: TABLE 10. BY-PRODUCTS YIELDS OF GOATS
By-Product Weight Slaughter weight, kg 14.81 Blood, g 602 Spleen, g 23 Compound stomach, g 600 Head (uncleaned), g 1,101 Head (cleaned), g 1,067 Hide, g 1,169 Shank (uncleaned), g 404 Shank (cleaned), g 312 Heart, g 60 Kidney, g 53 Intestines, g 775
Goatskins
Goatskins can be processed both on industrial scale and on cottage industry level. The size of
the skin allows it to be processed in small batches or singly in the backyard. In the rural areas, it
is very easy to process the skins even after slaughter for as long as there are readily available
technologies/recipes at hand for the farmers. There is more value when goatskin is converted into
leather, as when it is consumed on the table.
The characteristics of goatskins are: 1) they are generally thinner in substance compared with
cattle hide, carabao hide, and sheep skin. Even then, the fiber structure is tighter; 2) It has a
natural stretch, making it ideal for the manufacture of upper leather when made into leather
shoes. The leather of goats make the shoe durable which, in effect, stays longer serviceable; 3)
Its tough, hard-wearing grain is a basic property looked into when making shoe uppers and for
fancy leather goods such as purses, wallets, and bookbinding leather; 4) Unlike sheepskins,
goatskins have significantly low fat content. The fat usually interferes in the processing, so in
goatskins, decreasing techniques are eliminated. In addition, the tighter fiber structure is not
disoriented when fat is extracted; therefore, it retains its strength and tight grain.

Development in the Supply Chain in the Philippine Goat Industry: An Assessment, Esplana, Abao and Vasquez
Page 18 of 42
Phases of Goatskin Processing
Marketing of Goatskins
Traditionally, hides and skins are sold to tanneries either as raw wet salted or freshly flayed on
the proximity of the tannery from the slaughterhouse, farm, or buying stations. In areas where
tanneries are not easily accessible, skins are sold to hide dealers who in turn sell to tanneries in
wet-salted conditions. Goatskins are sold on a per piece basis. On the other hand, in the tannery
business, finished leather finds market in the footwear/leather craft industry depending on the
type of leather produced and demand of consumers. The following are guidelines in the
marketing of skins: 1) Sell only freshly flayed or properly salted and dried skin. Adopt
recommended flaying procedures and use appropriate tools and equipment in flaying the carcass.
Properly flayed skin commands better prices in tanneries; 2) Sell skins on per kilogram or per
piece basis; and 3) Sort and classify the skins according to grade.
Grading of Goatskins
First Grade Skins. The skins are of pattern; check pieces trimmed back to length not exceeding
7.5cm. Nose, crown, or top of the headpieces is removed, leaving the skin cut-off square
between the cheeks. The shanks are trimmed square at the knee joint. The skins are likewise free
from obvious grain damage, cuts, torn skins, and slippiness. The skin should be clean pelted.
Skins from fallen animals are not included in this grade.
Second Grade Skins. Include cut skins and misshapen skins. The skins are free from torn,
excessive holes, and slippiness. Skins from downers are not included in this grade.
Third Grade Skins. Skins do not conform to the requirements for first or second grade skins.
Development in the Supply Chain in the Philippine Goat Industry: An Assessment, Esplana, Abao and Vasquez
Page 19 of 42
MARKETING Market Centers
The market centers for the cattle and the carabaos are usually in the accredited livestock
“oksyon” markets (LOM) of the Bureau of Animal Industry (BAI), but there are livestock
auction markets in some part of the country where goats are also sold which make the different
livestock “oksyon” markets vital in the marketing of goats in the countryside. About 90-95
percent of livestock markets are being used for goat trading. There are about 156 LOMs spread
strategically all over the Philippines (Please see Table 11). Most of the non-operational livestock
markets are either due to lack of transaction, peace and order situation in the area, or they have
converted the facilities into other economic and livestock-related activities (e.g. slaughterhouse,
feed mill, etc.) The top five regions with the most number of operational LOMs are Western
Visayas (33), Central Visayas (26), Southern Tagalog (12), Ilocos Region & Central Mindanao
(9), and Cagayan Valley and Bicol Region (4). The ranking of the top three regions with the
most number of non-operational livestock markets are located in Ilocos (7), Central Luzon (6)
and Southern Tagalog, Western Visayas, and Western Mindanao (4).

Development in the Supply Chain in the Philippine Goat Industry: An Assessment, Esplana, Abao and Vasquez
Page 20 of 42
Table 11. Operation and Non-operational Livestock “Oksyon Market” in the Philippines,
As of December 2006
Region No. of Accredited Livestock Markets Total Percent Share of Accredited Operational Non-operational to total by Region
CAR 1 0 1 0.64 Ilocos 9 7 16 10.26 Cagayan Valley 4 2 6 3.85 Central Luzon 1 6 7 4.49 Southern Tagalog 12 4 16 10.25 CALABARZON 10 2 12 7.69 MIMAROPA 2 2 4 2.56 Bicol 4 3 7 4.49 Western Visayas 33 4 37 23.72 Central Visayas 26 3 29 18.59 Eastern Visayas 11 1 12 7.69 Western Mindanao 1 4 5 3.21 Northern Mindanao 3 3 6 3.85 Southern Mindanao 1 2 3 1.92 Central Mindanao 9 1 10 6.41 CARAGA 1 0 1 0.64 ARMM 0 0 0 0.00 Total 116 40 156 100.00 Percent Share 74.36 25.64 100
Source of Basic Data: BAI-MDD
Historical trend of supply and disposition of goat
Total supply of live goats in 2005 was estimated at 5.95 million head, 6.98 percent higher than
last year's level (Table 12). The growth in the supply of goat was indicated by the increment in
beginning stocks and in the number of live births, which grew by 5.29 percent and 9.53 percent,
respectively. Of the total supply, 34.7 percent were disposed for meat purposes and about 2.60
percent accounted for deaths and losses. Total number of goats slaughtered posted an increase of
7.30 percent compared with the 2004 level. It was recorded at 2.0 million heads in 2005.

Development in the Supply Chain in the Philippine Goat Industry: An Assessment, Esplana, Abao and Vasquez
Page 21 of 42
TABLE 12. GOAT: SUPPLY AND DISPOSITION, PHILIPPINES, 2003-2005 (NUMBER OF LIVE ANIMALS IN ‘000 HEAD)
ITEMS 2003 2004 2005 %Change 05/04 TOTAL SUPPLY 5,354,842 5,563,242 5,951,759 6.98 Beginning Inventory 3,270,441 3,357,624 3,535,195 5.29 Born Alive 2,084,090 2,205,128 2,415,244 9.53 Imports 311 490 1,320 169.39 Disposition 1,997,218 2,028,047 2,217,574 9.35 Slaughtered 1,892,548 1,922,072 2,062,290 7.3 Death/Losses 104,670 105,975 155,284 46.53 Ending Inventory 3,357,624 3,535,195 3,734,185 5.63
Source: BAS, BAI
Historical trend of prices by market of Goat Products
The annual average farm gate price of live goat in 2005 was Php 65.43 per kilogram (Please see
Table 13). This was lower than the previous year’s price of Php 65.68 per kilogram. The highest
average farm gate price in 2005 was registered during the month of November at Php
67.71/kilogram. This was 4.85 percent lower compared with the price in the same period in
2004. On the other hand, the lowest farm gate price was recorded during the month of December
at an average of Php 57.60/kilogram or 20.45 percent lower than last year's level. Please see also
Figure 4.
TABLE13. GOAT: MONTHLY FARM GATE PRICE (PHILIPPINES) (P/KG.)LIVE WEIGHT)
MONTH FARMGATE PRICE (Live weight) PHILIPPINES Percent Change
2003 2004 2005P 04/03 05/04 Pesos/ Kg. January 58.05 55.51 64.42 (4.38) 16.05 February 57.97 57.34 64.50 (1.09) 12.49 March 58.50 55.38 65.00 (5.33) 17.37 April 58.93 64.55 65.17 9.54 0.96 May 58.74 65.46 65.91 11.44 0.69 June 58.81 65.93 65.44 12.11 (0.74) July 58.46 69.35 66.22 18.63 (4.51) August 57.57 69.43 66.60 20.60 (4.08) September 58.49 70.00 67.61 19.68 (3.41) October 60.18 70.71 66.98 17.50 (5.28) November 58.55 71.16 67.71 20.92 (4.85) December 62.58 72.41 57.60 15.71 (20.45) Annual Ave. 58.85 65.68 65.43 11.61 (0.38)
Source: BAS

Development in the Supply Chain in the Philippine Goat Industry: An Assessment, Esplana, Abao and Vasquez
Page 22 of 42
Live goats are retailed also in some areas in Metro Manila, particularly in some part of Quezon
City, Caloocan City, and Manila, to name some. The live goat prices monitoring in Metro Manila
started in 2003 which is being done by BAI-MDD up to the present while the chevon and other
cuts prices monitoring started in 1999. This activity has been doing by the Bureau of Animal
Industry as part of their support to the goat industry. From 2003 to 2006, the average price on a
per kilo basis of goat has been increasing per year by 3.58 percent. In 2006, average price of live
goat was recorded at P117.71/kg or 1.50 percent higher than 2005 of P115.97/kg.
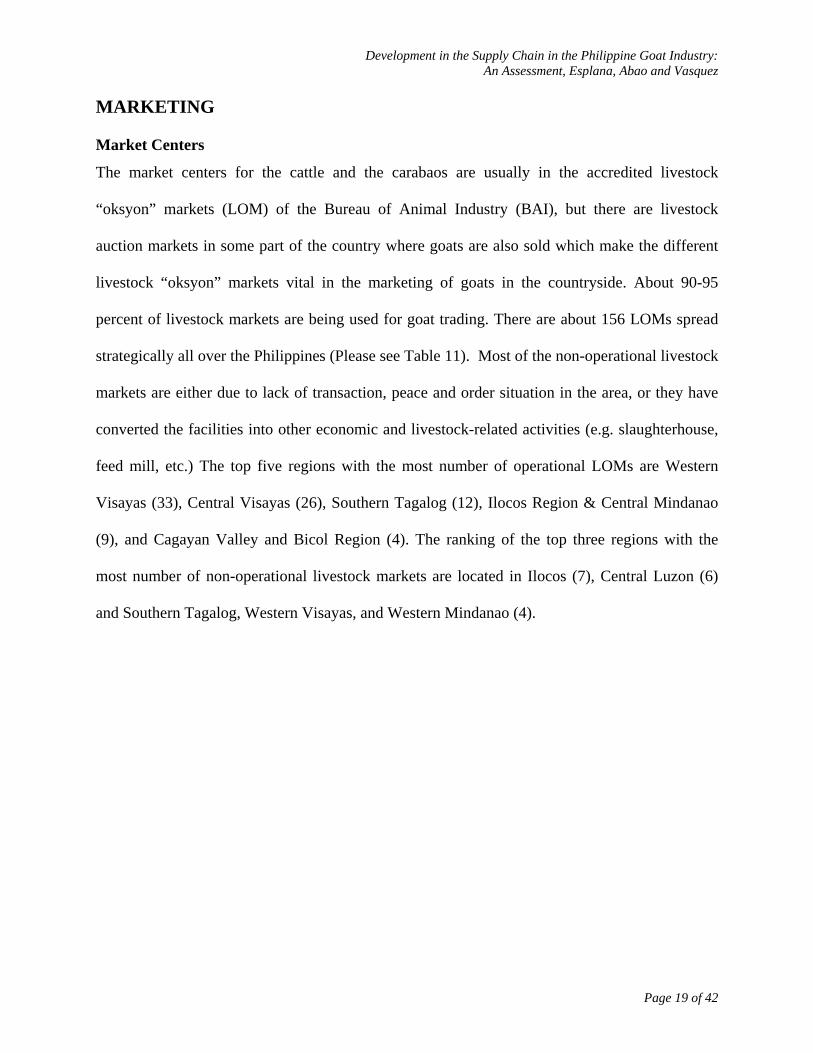
One important observation that we can get from the goat prices are the increasing growth on the
average prices per year of chevon from 1999 to 2006 by more than seven percent per year
(Please see Table 14 & Figure 5). Last year, the average price of chevon went to P208/kg or
8.26-percent higher over 2005. Other part of goat meat such as head, feet and offals had been
increasing by an average of 6.29, 6.44 and 6.80 percent per year, respectively, from 1999 to
2002. The growth is even higher than chevon (7%) for the three cuts from years 2003 to 2006
such 9.55 percent for head, 9.04 percent for feet, and 8.81 percent for offals. The average prices
of the three cuts in 2006 were posted at P122.08/kg for head; P128.08/kg for feet and P119.08/kg
for offals.
FIGURE 4. GOAT: FARM GATE PRICE, (IN PESO LIVEWEIGHT)
PHILIPPINES, 2003-05)
-
1 0 .0 0
2 0 .0 0
3 0 .0 0
4 0 .0 0
5 0 .0 0
6 0 .0 0
7 0 .0 0
8 0 .0 0
nuary
bruary
Marc
hApril
May
June
July
ugust
ember
tober
ember
ember
Pric
e in
PhP
/kg
Live
wei
ght
2 0 0 3 2 0 0 4 2 0 0 5 P
Development in the Supply Chain in the Philippine Goat Industry: An Assessment, Esplana, Abao and Vasquez
Page 23 of 42
Table 14. Live Goat, Goat Meat Prices and Growth Rates from 1999 to 2006 in Metro Manila
Live Goat and Goat Meat 1999-2002 2003-2006 2005 (P/Kg.)
2006 (P/kg.)
% change 2006/2005 Percent GR Percent GR
Live goat NA 3.58 115.97 117.71 1.50
Chevon 7.93 7.11 192.13 208.00 8.26
Head 6.29 9.55 110.58 122.08 10.40
Feet 6.44 9.04 116.58 128.08 9.86
Offals 6.80 8.81 109.58 119.08 8.67 Source of Basic Data: BAI-MDD
Figure 5. Average Monthly Prices of Chevon in Metro Manila (P/Kg.)
130.00
140.00
150.00
160.00
170.00
180.00
190.00
200.00
210.00
220.00
Jan Feb Mar Apr May Jun Jul Aug Sep Oct Nov Dec
Month
(P/K
g.)
199920002001200220032004200520062007
Market Channel and Flows of Goat
BMarket Channels for Goat
A marketing channel describes the movement of a product or commodity from the site of
production to the place of consumption (www.vdacs.virginia.gov). It may include transportation,
handling and storage, ownership transfers, processing, distribution. The principal players in goat
marketing channels are traders who carved out a portion of the trade through shrewdness,
determination, and economic or political leverage. Figures 6 is the marketing channels of goat
that illustrate the flow from the raisers to the retailers in Pangasinan province in 2006 wherein
the goats were sold to Barangay Livestock Assembler-Small Livestock Distributor (BLA-SLD)
and to Provincial Assembler Small Distributor (PLA-SLD).

Development in the Supply Chain in the Philippine Goat Industry: An Assessment, Esplana, Abao and Vasquez
Page 24 of 42
Both types of assembler-distributors brought the animals to the livestock “oksyon” markets
(LOMs) where buyers outside the province and retailers converge. Suppliers outside the
province (SOP) supplied livestock to Inter-Regional Assembler-Large Distributor (IRLA-LLD)
who disposed the ruminants to retailers. From the retailers, meats were sold to the final
consumers.
BFIGURE 6. MARKETING CHANNELS FOR GOATS IN PANGASINAN, 2006
R A IS E R /O P E R A T O R S O P
B L A -S L D
IR L A -L L DB O P
R E T A IL E R
C O N S U M E R
P L A -S L D
Geographic Flow for Goats
Figures 7-8 show the sources and destination points of goats in some areas.8 They illustrate
the flow of goat by location and by province. In Batangas, the major sources of goats were
Lemery, Batangas City, Bauan, and Calatagan. Goats from these areas and from the
provinces of Quezon, Bicol, and Cavite were assembled at the trading centers of Tanauan
City, Batangas City, Lemery, and Padre Garcia.
From these trading centers, livestock were marketed within the province. These were also
sold and brought to the market outlets outside Batangas such as Cavite and Metro Manila.
8 BAS Marketing Costs Structure for Goat (October 2003), “Geographic Flow,” pp. 4-13.

Development in the Supply Chain in the Philippine Goat Industry: An Assessment, Esplana, Abao and Vasquez
Page 25 of 42
BFIGURE 7. GEOGRAPHIC FLOW OF GOAT IN BATANGAS, 2006
D E S T I N A T I O N S
L I V E S T O C K
“ O K S Y O N ”
M A R K E T S
S O U R C E S
B A T A N G A ST a n a u a n C i t y
B a t a n g a s C i t yL e m e r y
P a d r e G a r c i a
M E T R O M A N I L AR E G I O N 1P a n g a s i n a n
R E G I O N 5B i c o l
R E G I O N 4 AB a t a n g a s
C a v i t eQ u e z o n
R E G I O N 4 AB a t a n g a s
C a v i t e
BFIGURE 8. GEOGRAPHIC FLOW OF GOAT IN METRO MANILA, 2006
D E S T I N A T I O N S
T R A D I N G C E N T E R S
S O U R C E S
M E T R O M A N I L AQ u e z o n C i t y M a r i k i n a
M a k a t i C i t y M a n i l a
R E G I O N 5M a s b a t e
R E G I O N 7C e b u
M E T R O M A N I L AQ u e z o n C i t y M a r i k i n a
M a k a t i C i t y M a n i l a
R E G I O N 6B a c o l o d
I l o i l o

Development in the Supply Chain in the Philippine Goat Industry: An Assessment, Esplana, Abao and Vasquez
Page 26 of 42
CONSUMPTION Importation and Exportation of Goat Meat
The Philippines has no record or is not importing goat meat from other countries because we are
self-sufficient in goat meat. Actually, the Philippines has a big potential to export goat meat in
other countries such as the Middle East Countries, particularly, Saudi Arabia and United Arab
Emirates where many Overseas Filipino Workers are working. The goat meat is universally
consumed which are also important in everyday diet in Middle East countries. It is usually
roasted and prepared in accordance with religious beliefs. Some other countries, which are
potential market of our goat meat exports, include Taiwan, Malaysia, Singapore, United States,
and Caribbean, to name some.
Marketing assistance provided to the industry
BDA One-Stop Agribusiness Center (OSAC)
A lot of marketing assistance is provided to the ruminants’ industry. The recent initiative is the
creation of DA of a One-Stop Agribusiness Center (OSAC). OSAC is a virtual mini-mart;
exhibit area, agribusiness information hub, and a training-seminar room rolled into one. At
OSAC, producers and buyers can meet conveniently and forge mutual and hopefully lasting
marketing arrangements. It has an exhibit area where the producers can showcase their fresh and
processed products for the appreciation of prospective Filipino and foreign buyers, and the
general public, as well. OSAC adopts an “exhibit theme” once every two or three months,
coinciding with the regular agriculture-related events (such as Farmers’ and Fisher folk’s Month
in May, and World Food Day in October, etc.) or anniversary celebration of respective DA
Family agencies. In the OSAC training and seminar room, producers and buyers can meet

Development in the Supply Chain in the Philippine Goat Industry: An Assessment, Esplana, Abao and Vasquez
Page 27 of 42
regularly to discuss pressing industry developments, forge marketing agreements, plan
participation, in domestic and international food fair and trade missions, and discuss strategies to
further prop up the competitiveness of Philippine agribusiness. The center aims to facilitate and
strengthen the direct linkages among industry players – all to increase their productivity and
incomes, and expand the domestic and export markets for Philippine farm, fishery, and food
products.
BAI’s National Task Force on Price and Volume Watch
In terms of the support by BAI, MDD regularly hosts a monthly meeting for key public and
private sector participants in the livestock and poultry industry. This is the meeting of the
National Task Force on Price and Volume Watch, a monthly formal gathering of key players in
the livestock and poultry industry. Through this meeting, market matching are initiated and
policies affecting the industry are being created and being recommended to the DA Secretary.
The DA-Agribusiness and Marketing Assistance Service (AMAS) is also involved in market-
matching as it maintains directories of key players in the industry.
Participation of Associations in the Development of the Goat Industry
The Federation of Goat & Sheep Producers & Associations of the Philippines, Inc. has also been
helping the industry since 2001. During May 2001, the 1st National Goat and Sheep Congress in
Nueva Ecija was held. This goat federation consolidated the many voices of the country’s goat
and sheep raisers and serves as the unified voice of the small ruminant sub-sector. FGASPAPI is
recognized as the official representative of the small ruminant industry, as it complements an
active conduit in the development and implementation of programs of the Department of

Development in the Supply Chain in the Philippine Goat Industry: An Assessment, Esplana, Abao and Vasquez
Page 28 of 42
Agriculture. It is also a member of the Livestock Development Council and National Agriculture
and Fishery Council consultation meeting. The address of the Federation is located at 198 M.
Paterno St. San Juan Metro Manila with contact no. 7246994 and email address:
PRICE COMPETITIVENESS ANALYSIS
Price competitiveness analysis is an analysis that compares price of local chevon and the prices
of chevon in other country such as in this case, US, Australia, and Canada. The Philippines is
price competitive to imported goat meat in the current FOB price of $US4 to 5 per kilo of chevon
in Canada at either 30 to 35 percent in-quota tariff rates, at $45 exchange rate (Appendix A).
The table shows that import parity over domestic wholesale price is greater than one. At the
price lower than $US4 to 5 per kilo of chevon, assuming it will be $US 3.0 per kilo for the
Australia goat meat, and assuming that there will be a price quotation that will be like this, the
Philippines is still price competitive. Even if it moves to $US3.5/kg, the Philippine goat meat
will still be competitive (Appendix C).
The scenario of having $3.3 kilo price of goat meat in Canadian market already happened during
2004. This was based on the report of AgVentures, Agriculture Business Profiles of Alberta
Agriculture Food and Rural Development in April 2006. This price will not go back again but
rather will continue to increase further as they estimated it at $ 0.15/kg.increase per year due to
higher demand of goat meat not only in Canada, but also the Middle East, Caribbean, Taiwan,
Malaysia, Singapore, Italy, Greece, and United States. Except in the Middle East, the population
or goat meat eaters in those countries are either came from the ethnic groups located primarily in
Metropolitan areas (predominantly males), the middle to high class wage earners (niche market)

Development in the Supply Chain in the Philippine Goat Industry: An Assessment, Esplana, Abao and Vasquez
Page 29 of 42
group or the health conscious individuals. The average retail price of chevon in Metro Manila,
as of May 2007, was posted at P214/kg. with the price ranges from P195 to P240/kg.
T a b l e 1 5 . A v e r a g e R e t a i l P r i c e s * o f C h e v o n a n d B y - p r o d u c t s , M a y 2 0 0 7
(In P/Kg.)
SELLER/DEALER CHEVON HEAD FEET OFFAL LIVE Average 214.00 130.50 136.50 123.50 120.00 Prevailing 200.00 120.00 120.00 110.00 125.00 Lowest 195.00 120.00 120.00 110.00 110.00 Highest 240.00 145.00 170.00 140.00 125.00
*Price quotations from goat sellers/ dealers and wet markets in Metro Manila Source: Marketing Development Division, BAI
The comparison of local imported chevon is presented below which indicates that local is
slightly cheaper than imported Australian chevon. The Philippines is price competitive with the
United States (Appendix B). US chevon is one of the most expensive chevon in the world (Table
16).
Table 16. Comparison of Local Chevon, Landed Cost of Imported and Wholesale Price In Metro Manila (P/kg.)
Chevon Comparative Prices Landed Cost Wholesale Price Philippine local chevon 200* 215 Australian chevon (imported) 202.58 231.8 212.7 243.4 US chevon (imported) 414.93 479.16 435.68 503.12
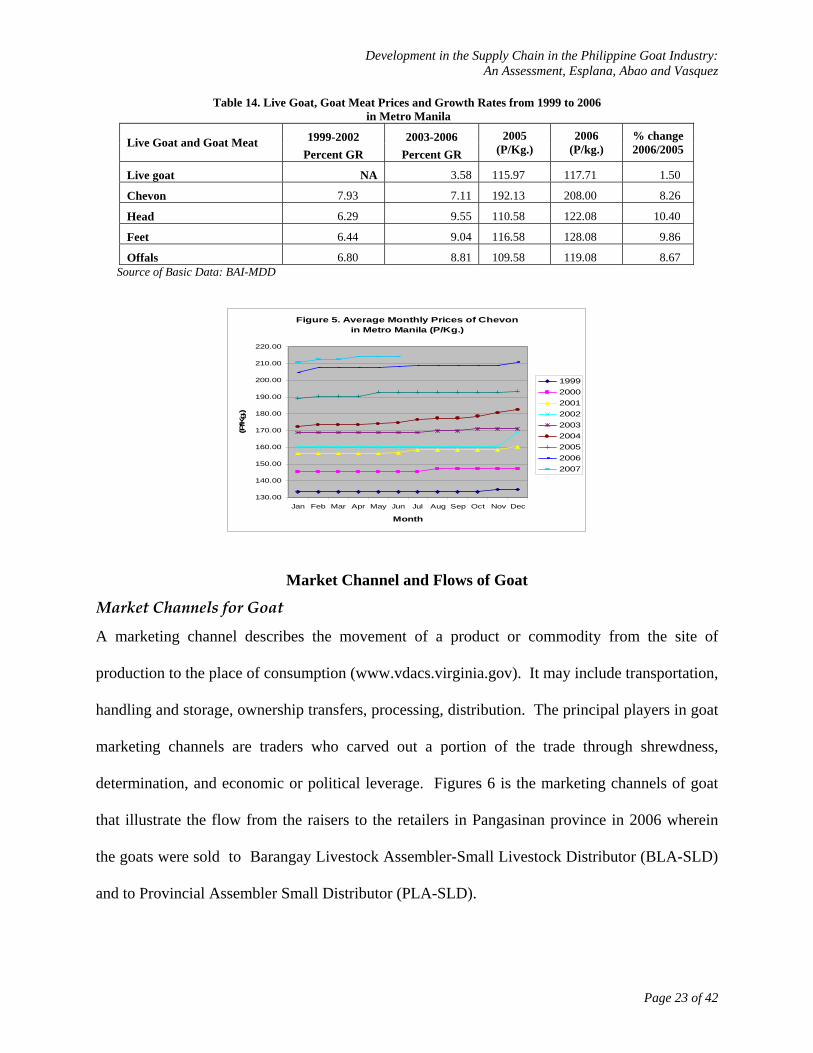
Source: Interview and online quotation price *Prevailing Price Comparison of Goat Meat to Other Meat with 3 oz. roasted in terms of Calories, Total Fat, Saturated Fat and Protein Based on study made by Meat Goats Production, Extension Animal Husbandry, Department of
Animal Science, NCSU, given the similar 3 oz. roasted for the different animal specie, goat has
the lowest calorie, total fat, and saturated fat content. Also, it has higher protein content of 23
grams. This study of NCSU showed that goat meat product is the healthiest meat, among all the
animal specie compared in this study (Table 17).
Development in the Supply Chain in the Philippine Goat Industry: An Assessment, Esplana, Abao and Vasquez
Page 30 of 42
Table 17. Comparison of Goat Meat to Other Meats (3 oz. roasted)
Source: Meat Goats Production, Extension Animal Husbandry, Department of Animal Science, NCSU and USDA
BENCHMARKING According to study done for the Livestock Development Council in May 2004 on “Cross
Country Analysis of the Hog, Broiler and Layer Industry of the Philippines, Thailand, and
Malaysia and Indonesia,” benchmarking is the search for and implementation of best practices.
It has proven to be an instrumental process in transforming unproductive operations into efficient
and profitable one. Appendix G shows the documentation of best practices in the goat industry
from input supply to processing. There is no best practice in the consumption stage.
100-Doe Level Goat Production Investment Opportunity: A Very Profitable Agribusiness
Project for Entrepreneurs
Goat production is a very profitable agribusiness investment. For the 100-doe level investment
of P455,275, an investor will have a potential net income per year of P79,788 for the first year,
P300,676, the second year; P81,398, for the third year; P313,314, for the fourth year, and
P225,661, for the fifth year. The investment opportunity in goat production, using the same
assumption of projects costs and the technical assumption (the researchers did not included due
to limited space) that we used in simulating this analysis, the payback period of investment
(P455,275) is 3 years and 5 months while the Internal Rate of Return or IRR which NPV is zero
is 43 percent (Appendix E). So, technically, goat production is a very profitable business, given
Calories Total Fat (grams)
Saturated Fat (grams) Protein (grams)
Goat 122 2.58 .79 23 Beef 245 16.00 6.80 23 Pork 310 24.00 8.70 21 Lamb 235 16.00 7.30 22 Chicken 12 0 3.50 1.10 21

Development in the Supply Chain in the Philippine Goat Industry: An Assessment, Esplana, Abao and Vasquez
Page 31 of 42
this financial analysis. Appendix D shows the breakdown of project costs while Appendix E
shows the Income Statement of the potential investment in goat production project and the net
income analysis.
V. CONCLUSION AND RECOMMENDATIONS The study presented the development of the goat industry along the supply chain. For the input
supply, the good development is the increasing number of breeder farms that are propagating
purebred, crossbreed or upgraded goats in different parts of the country. The goat industry is
beneficiary for any developments in the raw materials sourcing, and both the production and
processing technology being adopted by other livestock commodities, particularly hogs and
chicken.
In production, the establishment of a unified voice of the goat industry through the Federation of
Goat and Sheep Producers Association of the Philippines is an additional development, which
support in the policy advocacy and lobbying for the interest of the industry. They are also
helping in whatever they can, to improve the genetic and breeding practices of the goat industry
players by regularly conducting national congress in support of the livestock agencies of the
Department of Agriculture. This became the venue for collaborating among the industry
stakeholders such as the private sector, industry associations but even the government agencies
both local and national.
In the processing side, new development, as well as best practices could also be seen in terms of
two pioneer companies such as the canning of goat meat products through the Fortress Food
Manufacturing Corporation and manufacturing of goat milk soap in four variants through the

Development in the Supply Chain in the Philippine Goat Industry: An Assessment, Esplana, Abao and Vasquez
Page 32 of 42
initiative of Golden Farm International Trading Company. Golden Farm International, aside
from being a farm, is also into the Research & Development of goat milk soap products, which
the Filipinos should patronize and be proud of. In terms of marketing, there are some success
stories in the trading operation of goat as well as the support of two biggest livestock “oksyon”
market in the Philippines, one is in Padre Garcia, Batangas and the other one is in Urdaneta,
Pangasinan.
In terms of consumption, goat meat or its products are proven to be the healthiest meat, among
other livestock and poultry meat products based on the study done in the United States. There is
also a big potential for the Philippines to export chevon to other countries, given the price
competitiveness of Philippine goat meat with Australia, United States, and Canada (Appendix A-
C).
The profitability analysis also showed that goat production, in general, is a very profitable
agribusiness investment. For the 100-doe level, the IRR is 43 percent and the payback period is 3
years and 5 months (Appendix E).
In terms of inefficiencies and problems of the industry, the study found that the goat inventory
although increasing at 6 percent per year should be improved to much higher level (10 percent
or higher, particularly the commercial farms) by either encouraging & challenging more Filipino
entrepreneurs to invest in the goat production or helping the farmers to shift from backyard
operation to commercial operation, given the potential profitability that can be derived from
commercial operations (Appendix E & F). This will also support the goals and objectives of the
Development in the Supply Chain in the Philippine Goat Industry: An Assessment, Esplana, Abao and Vasquez
Page 33 of 42
Department of Agriculture and AFMA such as: 1) Securing food security or available supply of
goat meat all times and at reasonable prices; 2) Supporting poverty alleviation by helping in job
generation; 3) improved productivity and increased income from the technology that can be
adopted in the production of goat and processing of chevon and by-products; 4) the call to push
for the export market of either chevon meat or chevon processed and canned products in Asia,
United States, Middle East and Europe where the initial target markets are Filipinos themselves
and the Muslim descent nationalities where goat meat is a favorite daily meal component. There
is some credit issues for existing players which constrains them to expand their operations.
Although the study covered important areas along the supply chain, there is still a need to
further document other success stories.
For the recommendations and strategic directions, the following program and activities should be
pursued as part of the road map of the industry goals such as: 1) continuous development of the
goat genetics of Philippine born, as well as imported goat in the country in either pure breeding,
crossbreeding or upgrading; 2) reviving those non-operational livestock auction markets that can
support the enhancement of the trading of livestock farmers, including goat in the countryside; 3)
continuous partnership of all stakeholders should be done that include the private sector, industry
associations and the government to further improve the goat industry in the country; 4) support
of the government in packaging investment opportunities along the supply chain that will push
for the balanced development in all the stages such as input supply, production, processing,
marketing and consumption of goat meat, meat products and by-products through the utilization
of ACEF funds; 5) promote the potential export market of the Philippine goat meat, goat
processed meat and goat by-products, including non food goat products, like goat milk soap or
other cosmetics-related products from goat; and lastly 6) pursue more researches along the
Development in the Supply Chain in the Philippine Goat Industry: An Assessment, Esplana, Abao and Vasquez
Page 34 of 42
supply chain which are market-driven and customer focused. These researches will serve as
good input for all stakeholders, particularly the private sector, industry associations and the
government themselves, to better improve their policy and business decisions.

Development in the Supply Chain in the Philippine Goat Industry: An Assessment, Esplana, Abao and Vasquez
Page 35 of 42
Appendix A. Price Competitiveness of Locally Produced Goat Meat and Imported Goat Meat in Canada at Different Price Quotation, Different Tariff Rates, Same Exchange Rates, Same Domestic Wholesale Price
At Different Price Quotation (FOB), Tariff Rates and Same Exchange Rates
Carcass, half- Carcass, half- Carcass, half- Carcass, half- Carcasses, and frozen Carcasses, and frozen Carcasses, and frozen Carcasses, and frozen
Price/Kilo Price/Kilo Price/Kilo Price/Kilo
At 30% in-quota tariff At 30% in-quota tariff At 35% in-quota tariff At 35% in-quota tariff
(Per MT) (Per Kg) (Per MT) (Per Kg)
FOB Price (US$ per MT)* 4,000.00 4.00 5,000.00 5.00 4,000.00 4.00 5,000.00 5.00 Freight and Insurance (US$) 450.00 0.45 450.00 0.45 450.00 0.45 450.00 0.45
CIF Manila ($) 4,450.00 4.45 5,450.00 5.45 4,450.00 4.45 5,450.00 5.45 Times Foreign Exchange rate 45.00 45.00 45.00 45.00
CIF Manila (Php) 200,250.00 200.25 245,250.00 245.25 200,250.00 200.25 245,250.00 245.25 Plus Tariff Rate % 0.30 0.30 0.35 0.35
Tariff Cost (Php) 60,075.00 60.08 73,575.00 73.58 70,087.50 70.09 85,837.50 85.84 Plus Handling Distribution Cost (HDC) 750.00 0.75 750.00 0.75 750.00 0.75 750.00 0.75
Total Landed Cost (Php) 261,075.00 261.08 319,575.00 319.58 271,087.50 271.09 331,837.50 331.84 Plus Trading Cost/Margins (TC/M) at 5% 13,053.75 13.05 15,978.75 15.98 13,554.38 13.55 16,591.88 16.59
Domestic Wholesale Import Parity Price (Php) 274,128.75 274.13 335,553.75 335.55 284,641.88 284.64 348,429.38 348.43
Domestic Wholesale Price (Php)^ 200,000.00 200 200,000.00 200 200,000.00 200 200,000.00 200
Import Parity/Domestic Wholesale 1.37 1.68 1.42 1.74 * FOB price quotation, as of May 2007 ^ As of May 2007 Note: Competitiveness exists if import parity/domestic wholesale price is greater than 1.

Development in the Supply Chain in the Philippine Goat Industry: An Assessment, Esplana, Abao and Vasquez
Page 36 of 42
Appendix B. Price Competitiveness of Locally Produced Goat Meat and Imported US Goat Meat at Different Price Quotation, Different Tariff Rates, Same Exchange Rates, Same Domestic Wholesale Price
At Different Price Quotation (FOB), Tariff Rates and Exchange Rates
Carcass, half- Carcass, half- Carcass, half- Carcass, half- Carcasses, and frozen Carcasses, and frozen Carcasses, and frozen Carcasses, and frozen
Price/Kilo Price/Kilo Price/Kilo Price/Kilo
At 30% in-quota tariff At 30% in-quota tariff At 35% in-quota tariff At 35% in-quota tariff
(Per MT) (Per Kg) (Per MT) (Per Kg) (Per MT) (Per Kg) (Per MT)
(Per Kg)
FOB Price (US$ per MT)* 6,580.00 6.58 7,678.00 7.68 6,580.00 6.58 7,678.00 7.68 Freight and Insurance (US$) 500.00 0.50 500.00 0.50 500.00 0.50 500.00 0.50 CIF Manila ($) 7,080.00 7.08 8,178.00 8.18 7,080.00 7.08 8,178.00 8.18 Times Foreign Exchange rate 45.00 45.00 45.00 45.00 CIF Manila (Php) 318,600.00 318.60 368,010.00 368.01 318,600.00 318.60 368,010.00 368.01 Plus Tariff Rate % 0.30 0.30 0.35 0.35
Tariff Cost (Php) 95,580.00 95.58 110,403.00 110.40 111,510.00 111.51 128,803.50 128.80 Plus Handling Distribution Cost (HDC) 750.00 0.75 750.00 0.75 750.00 0.75 750.00 0.75 Total Landed Cost (Php) 414,930.00 414.93 479,163.00 479.16 430,860.00 430.86 497,563.50 497.56 Plus Trading Cost/Margins (TC/M) at 5% 20,746.50 20.75 23,958.15 23.96 21,543.00 21.54 24,878.18 24.88 Domestic Wholesale Import Parity Price (Php) 435,676.50 435.68 503,121.15 503.12 452,403.00 452.40 522,441.68 522.44 Domestic Wholesale Price (Php)^ 200,000.00 200 200,000.00 200 200,000.00 200 200,000.00 200 Import Parity/Domestic Wholesale Price 2.18 2.52 2.26 2.61 * FOB price quotation, as of May 2007 ^ As of May 2007 Note: Competitiveness exists if import parity/domestic wholesale price is greater than 1.

Development in the Supply Chain in the Philippine Goat Industry: An Assessment, Esplana, Abao and Vasquez
Page 37 of 42
Appendix C. Price Competitiveness of Locally Produced Goat Meat and Australian Imported Goat Meat at Different Price
Quotation, Tariff Rates, Exchange Rates, and Same Domestic Wholesale Price
At Different Price Quotation (FOB), Tariff Rates and Exchange Rates
Carcass, half- Carcass, half- Carcass, half- Carcass, half- Carcasses, and frozen Carcasses, and frozen Carcasses, and frozen Carcasses, and frozen
Price/Kilo Price/Kilo Price/Kilo Price/Kilo
At 30% in-quota tariff At 30% in-quota tariff At 35% in-quota tariff At 35% in-quota tariff
(Per MT) (Per Kg) (Per MT) (Per Kg) (Per MT) (Per Kg) (Per MT)
(Per Kg)
FOB Price (US$ per MT)* 3,000.00 3.00 3,500.00 3.50 3,000.00 3.00 3,500.00 3.50 Freight and Insurance (US$) 450.00 0.45 450.00 0.45 450.00 0.45 450.00 0.45 CIF Manila ($) 3,450.00 3.45 3,950.00 3.95 3,450.00 3.45 3,950.00 3.95 Times Foreign Exchange rate 45.00 45.00 45.00 45.00 CIF Manila (Php) 155,250.00 155.25 177,750.00 177.75 155,250.00 155.25 177,750.00 177.75 Plus Tariff Rate % 0.30 0.30 0.35 0.35
Tariff Cost (Php) 46,575.00 46.58 53,325.00 53.33 54,337.50 54.34 62,212.50 62.21 Plus Handling Distribution Cost (HDC) 750.00 0.75 750.00 0.75 750.00 0.75 750.00 0.75 Total Landed Cost (Php) 202,575.00 202.58 231,825.00 231.83 210,337.50 210.34 240,712.50 240.71 Plus Trading Cost/Margins (TC/M) at 5% 10,128.75 10.13 11,591.25 11.59 10,516.88 10.52 12,035.63 12.04 Domestic Wholesale Import Parity Price (Php) 212,703.75 212.70 243,416.25 243.42 220,854.38 220.85 252,748.13 252.75 Domestic Wholesale Price (Php)^ 200,000.00 200 200,000.00 200 200,000.00 200 200,000.00 200 Import Parity/Domestic Wholesale 1.06 1.22 1.10 1.26 * FOB price quotation, as of May 2007 ^ As of May 2007 Note: Competitiveness exists if import parity/domestic wholesale price is greater than 1.

Development in the Supply Chain in the Philippine Goat Industry: An Assessment, Esplana, Abao and Vasquez
Page 38 of 42
Appendix D. Goat Production Projects Costs and Distribution of Equity and Loan (for the 100-Deo level)
Goat Production Project Costs (Amount In Peso) Percentage (%) share
Housing & Equipment 50,000 10.98 Fencing 80,000 17.57 Forage & Pasture Development 20,000 4.39 Prepaid Expenses 50,000 10.98 Stocks Doe (100) 175,000 38.44 Buck (4) 24,000 5.27 Working Capital 56,275 12.36 Total 455,275 100
Distribution of Equity and Loan for the Project
Equity 236,275 52 Loan 219,000 48 Total 455,275 100
Appendix E. Investment Decision & Profitability Analysis
Investment Decision & Profitability Analysis Year 1 Year 2 Year 3 Year 4 Year 5 Gross Profit Per Year (In Peso) 149,750 489,578 152,227 509,022 374,170 Operating Profit Margin (In %) 0.40 0.65 0.41 0.68 0.65 Net Income per year (In Peso) 79,788 300,676 81,398 313,314 225,661
Net Income per month (In Peso) 6648.96
25,056.33
6,783.14
26,109.50
18,805.04
Net Profit Margin per year (In %) 0.21
0.40
0.22
0.42
0.39 Net Present Value at 12% Discount Rate 476,308 Net Present Value at 15% Discount Rate 402,981 Payback Period 3 years & 5 months Internal Rate of Return 43%

Development in the Supply Chain in the Philippine Goat Industry: An Assessment, Esplana, Abao and Vasquez
Page 39 of 42
Appendix F. Projected Income Statement Under Pure Confinement System for 100-Doe Level Projected Income Statement, Years 1-5
Projected Income Statement Under Pure Confinement System for 100-Doe Level Projected Income Statement, Years 1-5
Particulars Project Year Year 1 Year 2 Year 3 Year 4 Year 5
A. Sales Revenues Sale of Stocks 374,850 749,500 374,850 749,500 374,850 Inventory Value of Stocks 199,000 Total Sales Revenues 374,850 749,500 374,850 749,500 573,850 B. Direct Expenses Operating Expenses (OE) Labor 109,500 109,500 109,500 109,500 109,500 Cost of Concentrate 40,680 63,360 40,680 63,360 40,680 Veterinary Drug & Supply 10,700 16,400 10,700 16,400 10,700 Forage & Pasture Maintenance 0.00 4,000 4,000 4,000 4,000 Light & Water 6,000 6,000 6,000 6,000 6,000 Transportation 5,000 5,000 5,000 5,000 5,000 Repair & Maintenance 0.00 10,000 10,000 10,000 10,000 Land Rental 13,800 13,800 13,800 13,800 13,800 Interests on Loans 39,420 31,862 22,943 12,418 0 Total Operating Expenses 225,100 259,922 222,623 240,478 199,680 C. Operating Income 149,750 489,578 152,227 509,022 374,170 Amortization (F&PD) 4,000 4,000 4,000 4,000 4,000 Amortization (Prepaid Expenses) 10,000 10,000 10,000 10,000 10,000 Depreciation 13,000 13,000 13,000 13,000 13,000 Total Indirect Expenses 27,000 27,000 27,000 27,000 27,000 D. Earnings Before Taxes (EBT) 122,750 462,578 125,227 482,022 347,170 Taxes (35% of EBT) 42,963 161,902 43,830 168,708 121,510 D. Net Income 79,788 300,676 81,398 313,314 225,661
Note: This study prepared detailed Financial Analysis that include Cash Flow and Balance Sheet and the assumption used in doing this financial plan of a 100-doe level goat production module, but will not present fully all the documents due to availability of space. This analysis is only a simulation, which shows that goat production is a very profitable agribusiness opportunity.

Development in the Supply Chain in the Philippine Goat Industry: An Assessment, Esplana, Abao and Vasquez
Page 40 of 42
Appendix G. Best Practices in the Different Stages in the Supply Chain
Stages in the Supply
Chain Activities Pioneering Organization/Company/Contact
Person Location of
Agribusiness Establishment
Coverage of Operation Innovation/Creativity/Potential Income Made
Input Supply/ Production
Pure breeding, crossbreeding and upgrading of goat Imported Goat raising
Goat raising
Abalos & Sons Agro Industrial Corp. Head Goat Business, Neo Abalos Ex-Congressman Carlos Padilla Jr. Ketti Chua
Pangasinan Rizal Batangas Isabela Nueva Vizcaya
Cebu City
Breeding & Trading of Livestock Crossbreed native goat with imported goat Boer, Saanen, 400-doe level Crossbreeding of Boer, Africa; Anglo Nubian, Saanen from United States Boer, Anglo Nubian, and Red Boer from Australia
Profit is at P1000 to 2000 per marketable goat for slaughter sold. The selling price of crossbreed goat breeder (F1) is at P5000 per head F2 at 10,000 per head and F3 at 15,000. The higher the level, the higher the profit. 200 purebred and crossbreed breeders of the three types of breeds. Selling price of Purebred bucks, 40,000 per head Sold at P40,000 to P60,000 per head of imported breeder goat.
Processing Development of Processed Chevon Canned Products
Fortress Food Manufacturing Corporation Amelia Coronel, General Manager Golden Farm International Trading Company
Antipolo City Farm site: San Rafael, Bulacan Novaliches
Processed canned chevon such as Chevon Strew, Chevon in Tamarind Soup and Chevon Offals Soup Manufacturing of goat milk soap with variant such as whitening goat milk soap, regular goat milk soap, premium goat milk soap, and sensitive skin goat milk soap
Pioneer in processing canned chevon, initially for local market and eyeing to tap the export market in the coming days, when accreditation requirement has been completed. First goat Halal certified complete processing line from slaughtering to canning. Pioneer in manufacturing goat milk soap from locally produced goat milk.

Development in the Supply Chain in the Philippine Goat Industry: An Assessment, Esplana, Abao and Vasquez
Page 41 of 42
Marketing Livestock Trading Operation Livestock Auction Market Operations
Junar Mejia Padre Garcia LOM Mayor Prudencio V. Gutierrez Urdaneta City LOM Mayor Amadeo Perez
Tara St.., Masbate City, Masbate Padre Garcia, Batangas Brgy. Anonas, Urdaneta City, Pangasinan
Bicol Region , Metro Manila Batangas, Mindoro, Masbate, Bicol Main commodity traded are cattle, carabao, and goat
Major livestock trader of goat in Masbate for Metro Manila market.
One of the best LOMs in the country. The biggest livestock market throughout the country in terms of volume (about 96,200 heads yearly) and income (at least P3.55 million annually). Ninety percent (90%) of the income of the municipality are derived from the LOM. 1,850 animal traded per week Of which 70%, cattle; 20%, carabao, 10% combined horses and other animals.
Revenue of P180,000 to P200,000 comes from animal fees while P35,000 comes from about 35 stalls that are operating within the LOM.
550-600 heads traded cattle per week, 400 heads, carabao; and 140 heads, goats per week.
Source: Interviews & BAI-Livestock Handlers Database 2006.
Annex A. Goat Industry Supply Chain Framework
Input Supply Production Marketing Processing Consumption

Development in the Supply Chain in the Philippine Goat Industry: An Assessment, Esplana, Abao and Vasquez
Page 42 of 42
REFERENCES Alberta Agriculture, Food and Rural Development. Ag-Ventures: Agriculture Business
Profiles. Revised April 2006. Agriculture Magazine. July 2007. Agricultural Utilization Research Institute (AURI). The Feasibility of Meat Goats in
Minnesota: Summary Report. AURI. 1501 State Street Marshall, MN. 56258. Hhttp://www.auri.org. January 20, 2001.
Bureau of Animal Industry. BAI Goat Marketing Bulletin. July 2002. Bureau of Animal Industry. Marketing Development Division Database on Goat
Industry 1999 to 2006. Bureau of Animal Industry. Marketing Development Division Livestock Handlers
Database 2006. Bureau of Agricultural Research. Call for Papers: 19th DA-BAR National Research
Symposium. May 9, 2007. Bureau of Agricultural Statistics. Goat Industry Performance Report: January to
December 2005. May 2006. Bureau of Agricultural Statistics. Marketing Costs Structure for Goat. October 2003. Cluny Exports PTY LTD Agribusiness Specialist. Exporting Australia’s best livestock to
the world. http://www.clunyexports.com.au/?gclid=CMn__Ljf9Y0CFQ-WbgodliBLLQ#.
Esplana, Elmer R. Lary Nel. B. Abao, Cyril L. Soliaban and Fermin M. Diaz. Is RP Ready for the Bird Flu? Socio-economic Impact and Lessons Learned from the Calumpit Incident. June 2006.
Esplana, Elmer. R. Cyril L. Soliaban, Renelle Revilla, Maria Alilia G. Maghirang, and Stevenson S. Ang. Hog Industry Cluster and Analysis: Trends and Emerging Development in the Philippines, FSM 103 Paper submitted to University of Asia and the Pacific in 2005.
Humprey, John. Shaping Value Chains for Development: Global Value Chains in Agribusiness. Deutsche Gesellschaft (GTZ). Federal Ministry for Economic Cooperation and Development. http://www.gtz.de.
Livestock Marketing. Hhttp://www.vdacs.virginia.gov/livestock.goatmarketing.shtml. Livestock Development Council. Proceeding: 1st Small Ruminant Congress. Central
Luzon State University. May 24-25 2001. Philippine Council for Agriculture, Forestry and Natural Resources Research and
Development. The Philippines Recommends for Goat Farming. 2004. Southard, Leland. Livestock, Dairy, and Poultry Outlook. Electronic Outlook from the
Economic Research Service. United States Department of Agriculture. August 26, 2003.
KEY INFORMANT INTERVIEWS Mr. Neo Abalos, Secretary/Treasurer, Federation of Goat & Sheep Producers & Associations of the Philippines, Inc. and Head, Goat Business, Abalos & Sons Agro Industrial Corporation. Ms. Amelia Coronel, General Manager, Fortress Food Manufacturing Corporation. Mrs. Yolanda Raca, Owner, Golden Farm International Trading Company.