Development in Oxyfuel Combustion Technologies...
47
Development in Oxyfuel Combustion Technologies for Oxyfuel Combustion Technologies for Coal Fired Power Plants with CCS (Part 3: Flue Gas Processing and CO2 Processing Unit) (Part 3: Flue Gas Processing and CO2 Processing Unit) Stanley Santos Stanley Santos IEA Greenhouse Gas R&D Programme Cheltenham, UK Instituto de Inginieria UNAM 28 th March 2012 28 March 2012
Transcript of Development in Oxyfuel Combustion Technologies...
Development in Oxyfuel Combustion Technologies forOxyfuel Combustion Technologies for
Coal Fired Power Plants with CCS(Part 3: Flue Gas Processing and CO2 Processing Unit)(Part 3: Flue Gas Processing and CO2 Processing Unit)
Stanley SantosStanley SantosIEA Greenhouse Gas R&D Programme
Cheltenham, UK
Instituto de Inginieria UNAM28th March 201228 March 2012

Oxyfuel Perspective…Oxyfuel Perspective…
What is the best a to manage the nonWhat is the best way to manage the non-CO2 components to meet any CO2
specification requirement and maximize some of the implicit advantages i.e. p gefficiency and zero emissions ?
22
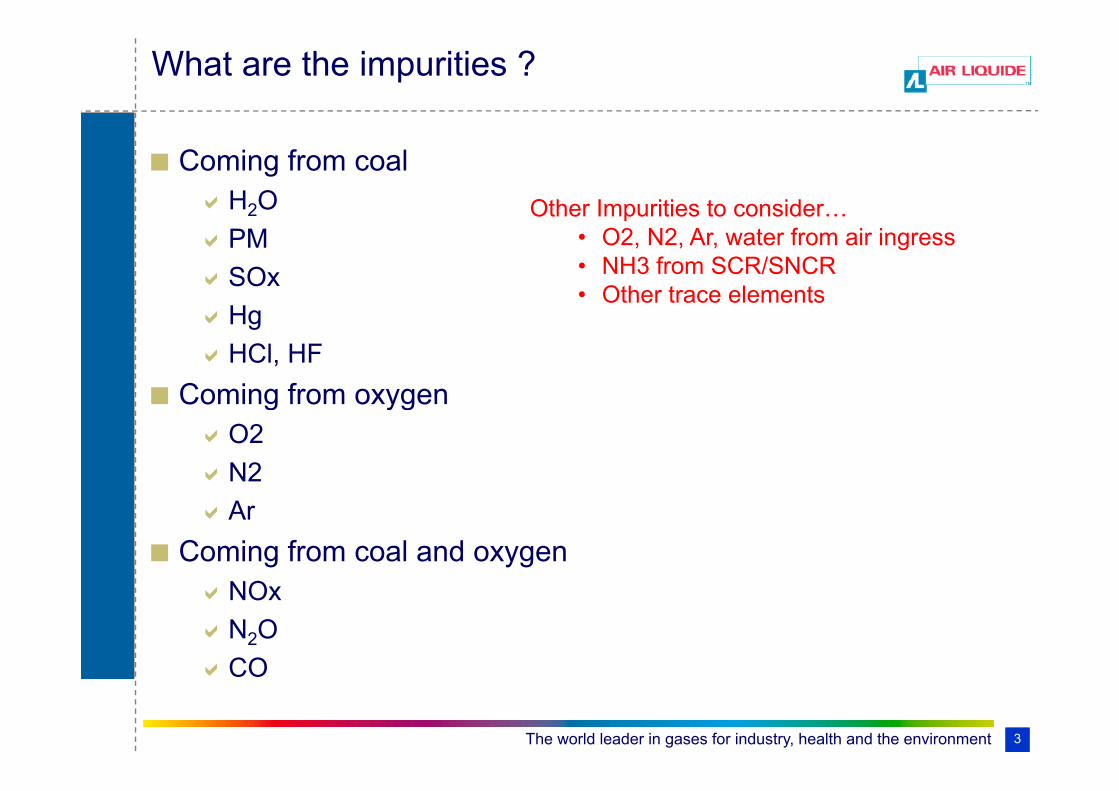
What are the impurities ?
Coming from coalH2O Other Impurities to consider…PMSOxH
Other Impurities to consider…• O2, N2, Ar, water from air ingress• NH3 from SCR/SNCR• Other trace elements
HgHCl, HF
Coming from oxygenComing from oxygenO2N2Ar
Coming from coal and oxygenNOxN2OCO
The world leader in gases for industry, health and the environment 3
CO
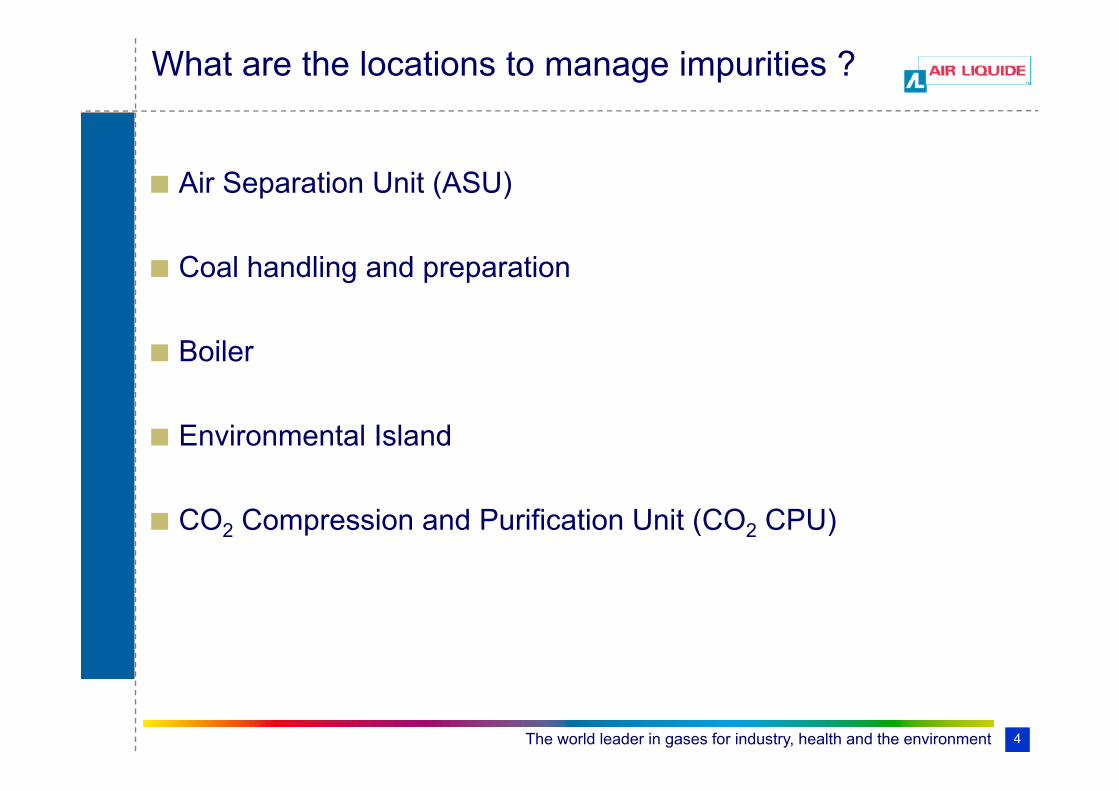
What are the locations to manage impurities ?
Air Separation Unit (ASU)
Coal handling and preparation
Boiler
Environmental Island
CO2 Compression and Purification Unit (CO2 CPU)
The world leader in gases for industry, health and the environment 4
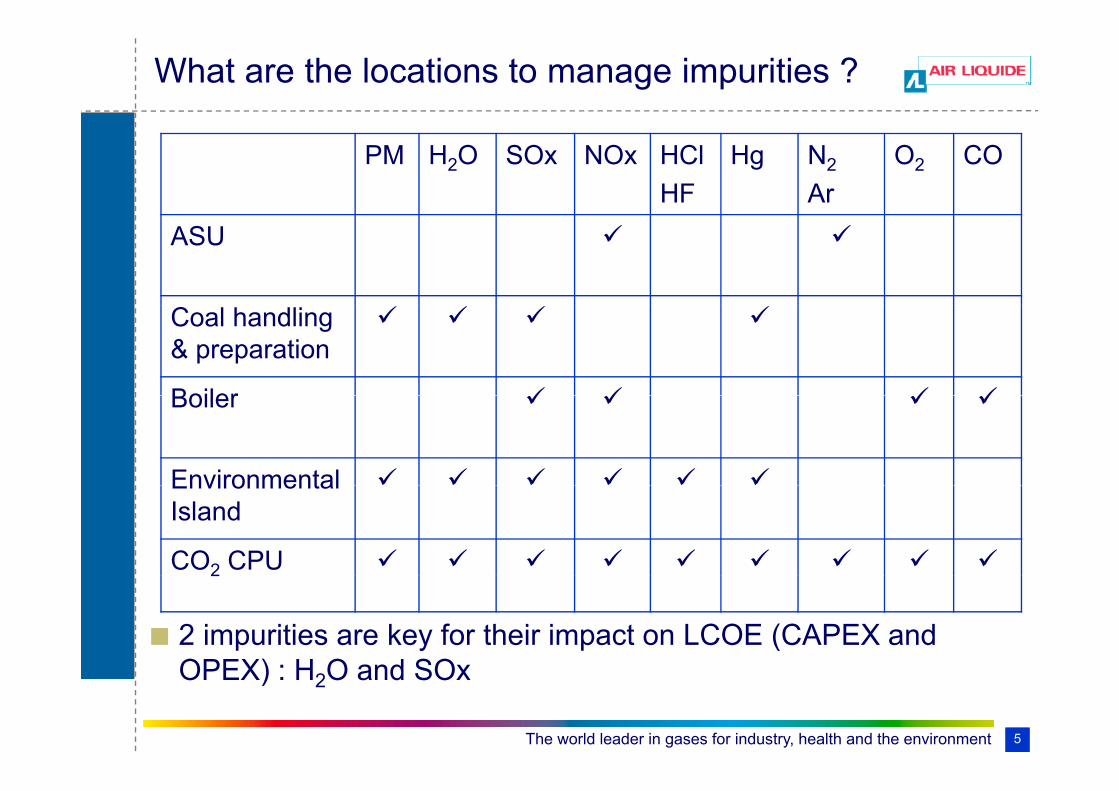
What are the locations to manage impurities ?
PM H2O SOx NOx HClHF
Hg N2
ArO2 CO
ASU
Coal handling & preparation
BoilerBoiler
EnvironmentalEnvironmental Island
CO2 CPU2
2 impurities are key for their impact on LCOE (CAPEX and OPEX) : H O and SOx
The world leader in gases for industry, health and the environment 5
OPEX) : H2O and SOx
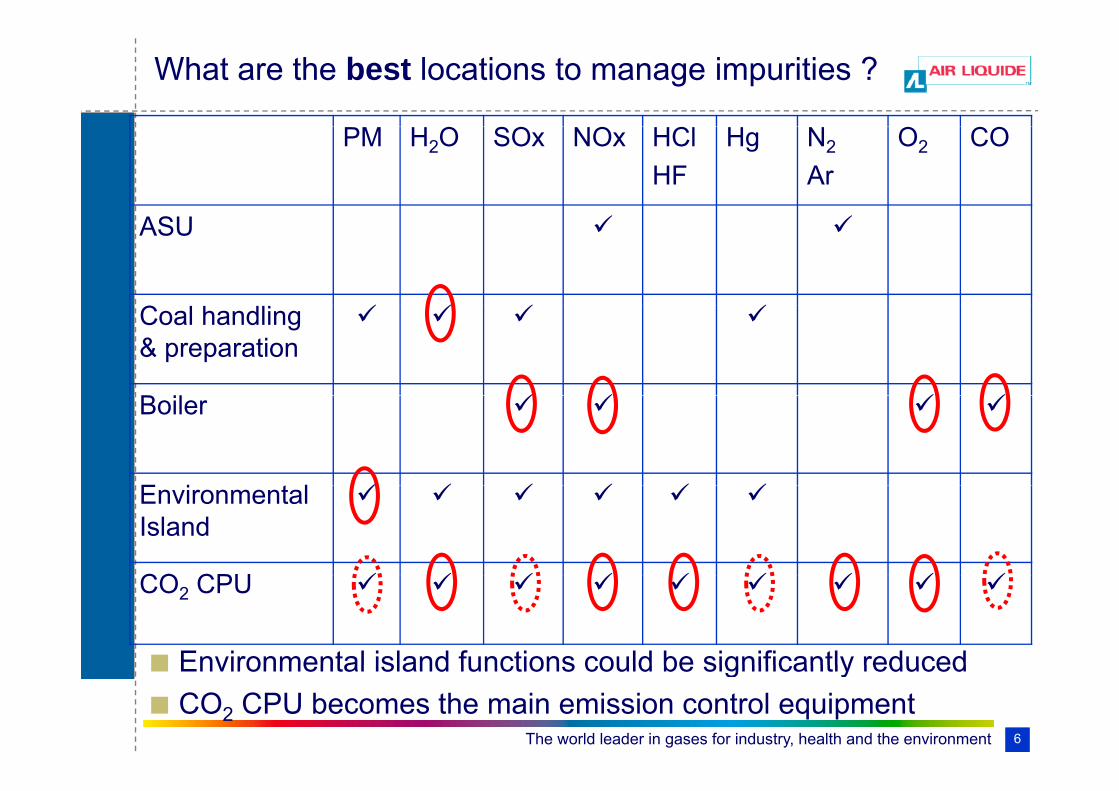
What are the best locations to manage impurities ?
PM H2O SOx NOx HClHF
Hg N2
ArO2 CO
ASU
C l h dliCoal handling & preparation
B ilBoiler
E i t lEnvironmental Island
CO CPUCO2 CPU
Environmental island functions could be significantly reduced
The world leader in gases for industry, health and the environment 6
Environmental island functions could be significantly reducedCO2 CPU becomes the main emission control equipment

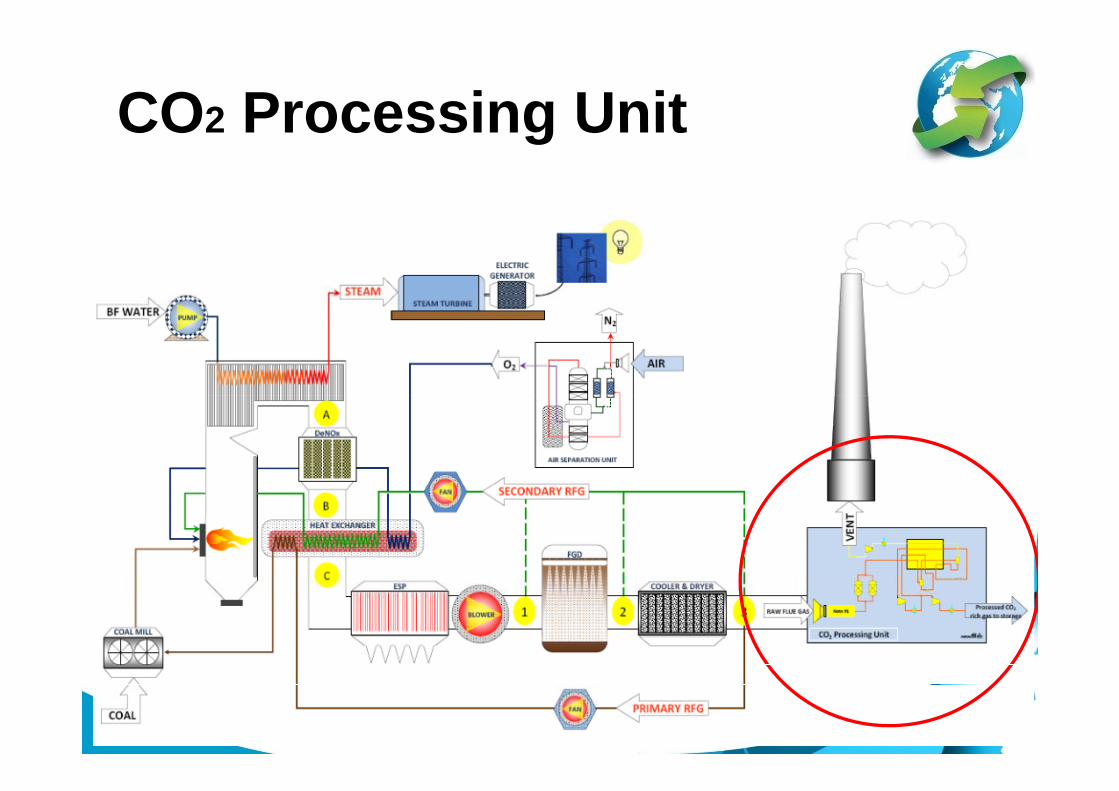
Flue Gas Processing UnitFlue Gas Processing Unit
7

Flue Gas Processing Units(Summary of Results @ Schwarze Pumpe Pilot Plant)
Test on Electrostatic Precipitator (ESP)• Test on Electrostatic Precipitator (ESP)• Completed and Results better than expected as
compared to air firing.• Test on Flue Gas Desulphurisation (FGD)Test on Flue Gas Desulphurisation (FGD)
• Different design – with external oxidation tank.SO2 l ( hi d t 99 7% l)• SO2 removal (achieved up to 99.7% removal)
• SO3 removal (achieved ~65% reduction)
8

Process overviewThe Oxyfuel pilot plant Schwarze Pumpe
Confidentiality - Medium (C2)
9 | 2nd Oxyfuel Combustion Conference | 2011.09.05

Experiences from the pilot plantImpact on slurry chemistry
• No major differences have been encountered.• No negative impact of higher CO2 partial pressure on reaction system.
- CO2 seems to enhance the limestone/chalk dissolution- Degassing of dissolved CO2 in the external reaction tank.
• Slightly lower pH during Oxyfuel operation• Higher moisture content led to water condensation in pre-cooler during Oxyfuel conditions.
Water condensation could be prevented by reduction of cooling duty to avoid local sub coolingWater condensation could be prevented by reduction of cooling duty to avoid local sub-cooling.
2141540 1510
200
220
240
1500
1650
1800
166
1143 1123
140
160
180
1050
1200
1350Oxyfuel Air-firing
Samples taken during operation withouthydrocyclone Actual
98,8 94,25
60
80
100
120
4 0
600
750
900
hydrocyclone. Actualvalues (especiallyChloride) are expected to be higher.5,89
0,456,3 4,55
220 248
0
20
40
60
0
150
300
450
Confidentiality - Medium (C2)
10 | 2nd Oxyfuel Combustion Conference | 2011.09.05
pH Gypsum [%]
Carbonate [%]
HCO3 [mg/l]
Nitrate [mg/l]
Chloride [mg/l]
Desity[mg/cm³]

Experiences from the pilot plantImpact of the operating conditions on the removal rate – Slurry flow rate
Confidentiality - Medium (C2)
11 | 2nd Oxyfuel Combustion Conference | 2011.09.05
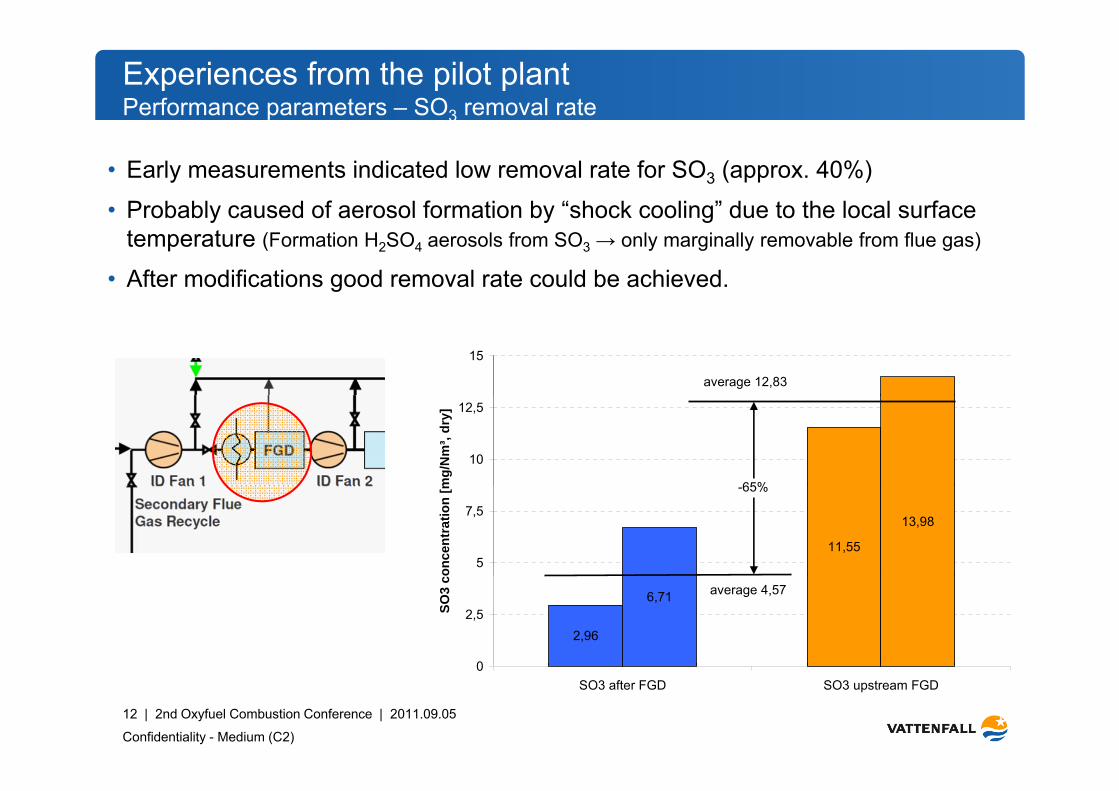
Experiences from the pilot plantPerformance parameters – SO3 removal rate
• Early measurements indicated low removal rate for SO3 (approx. 40%)
• Probably caused of aerosol formation by “shock cooling” due to the local surfaceProbably caused of aerosol formation by shock cooling due to the local surface temperature (Formation H2SO4 aerosols from SO3 → only marginally removable from flue gas)
• After modifications good removal rate could be achieved.
15
average 12,83
10
12,5
mg/
Nm
³, dr
y]
65%
11,55
13,98
5
7,5
once
ntra
tion
[m -65%
2,96
6,71
0
2,5SO3
co
average 4,57
Confidentiality - Medium (C2)
12 | 2nd Oxyfuel Combustion Conference | 2011.09.05
0SO3 after FGD SO3 upstream FGD
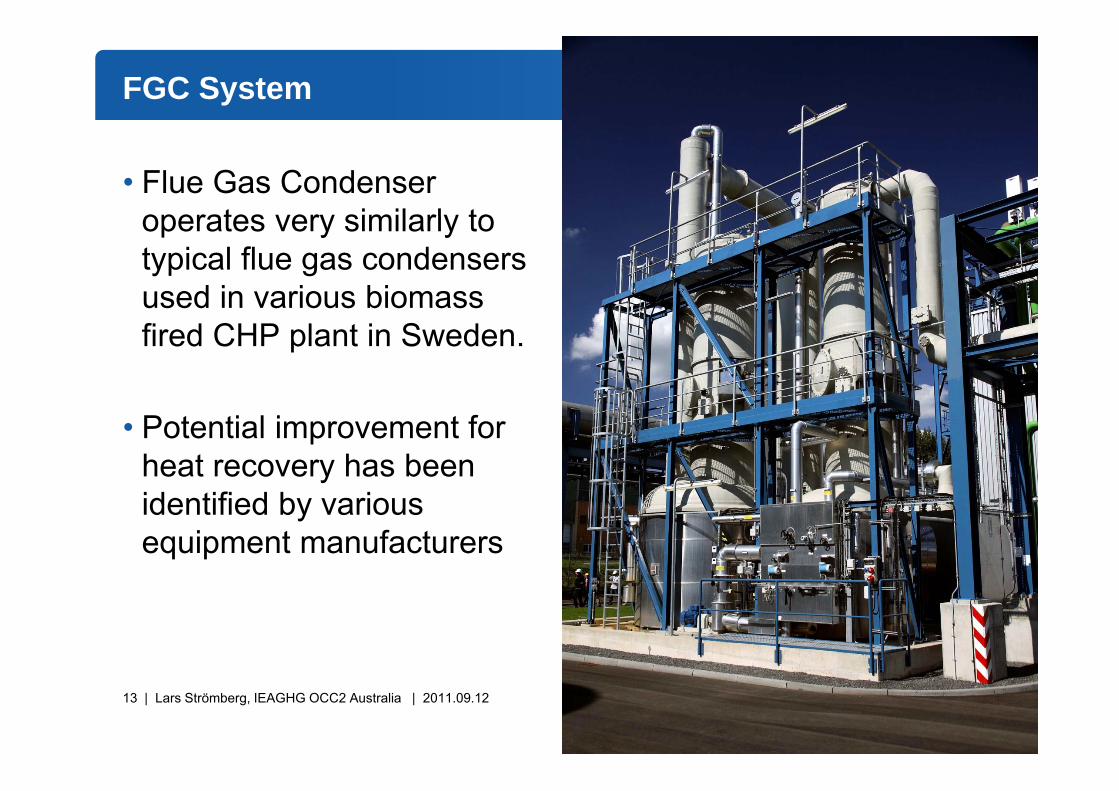
FGC System
• Flue Gas Condenser operates very similarly tooperates very similarly to typical flue gas condensers used in various biomassused in various biomass fired CHP plant in Sweden.
• Potential improvement for heat recovery has been identified by various equipment manufacturers
13 | Lars Strömberg, IEAGHG OCC2 Australia | 2011.09.12
CO2 Processing UnitCO2 Processing Unit
14
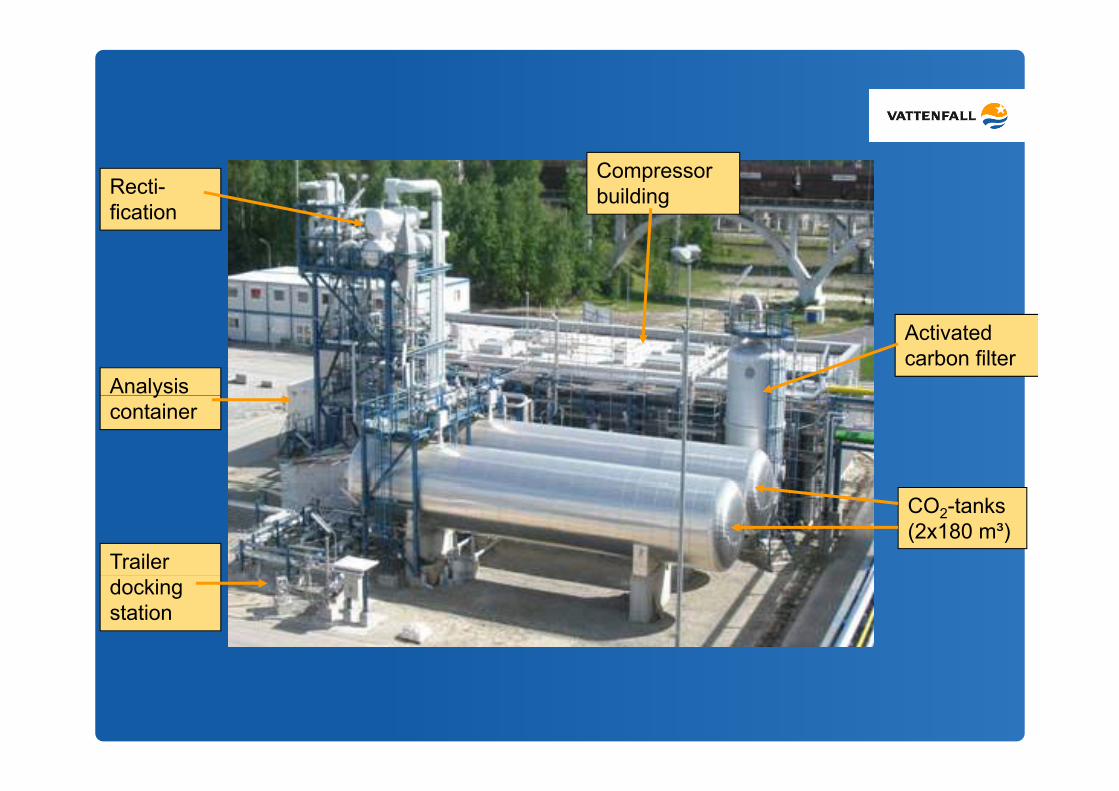
Recti-fication
Compressor building
fication
Activated carbon filter
Analysis ycontainer
CO2-tanks(2x180 m³)
Trailer docking station

Overview of Development of CPU th l t 5CPU over the last 5 years...• Recognition of the NOx and SOx reaction by Air• Recognition of the NOx and SOx reaction by Air
Products (presented during GHGT Conference –June 2006)June 2006)• This has led to the rapid technology development among
the industrial gas producersthe industrial gas producers.• Identification of potential impact of Hg to the
operation of the CPUoperation of the CPU.• Development of the use of impure CO2 as
refrigerant driven mostly by reducing energy penalty.
16
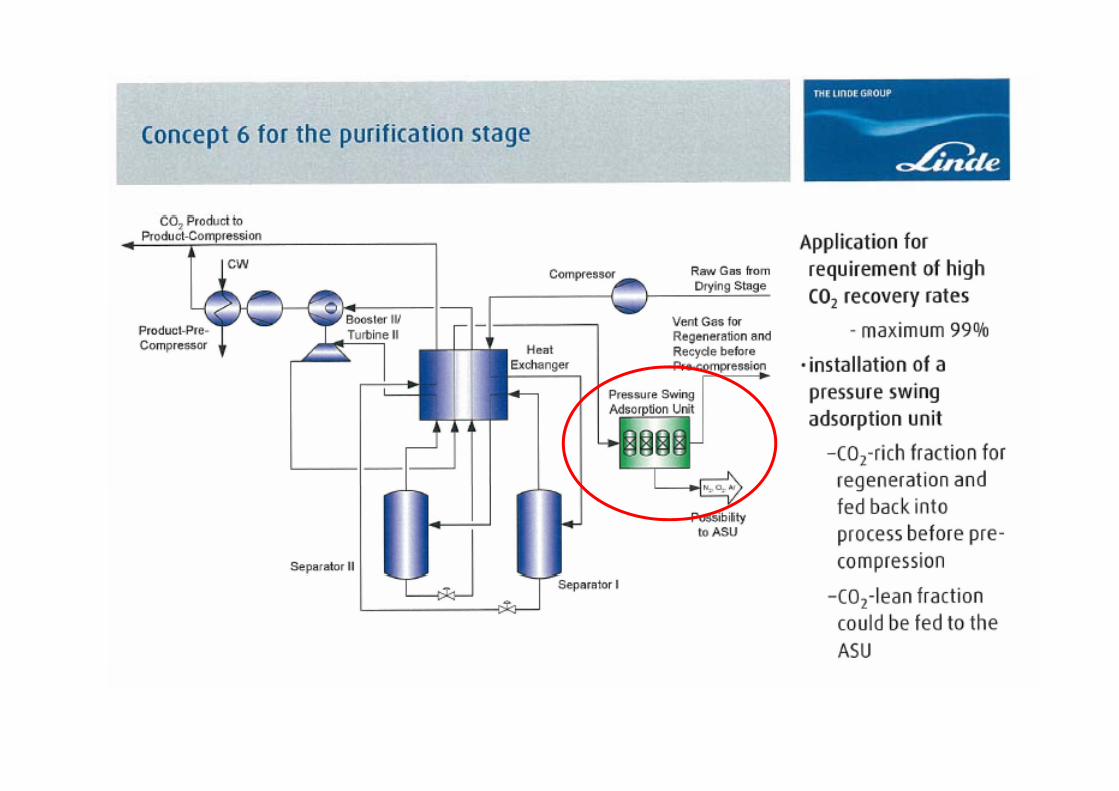
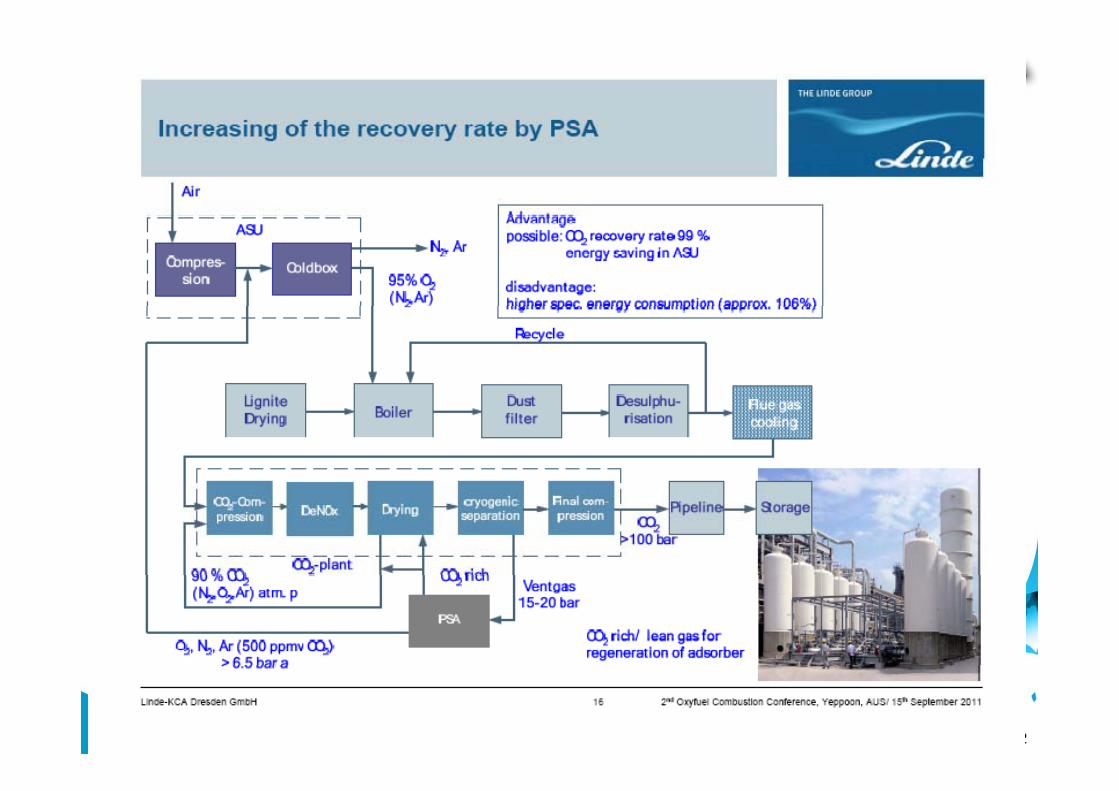
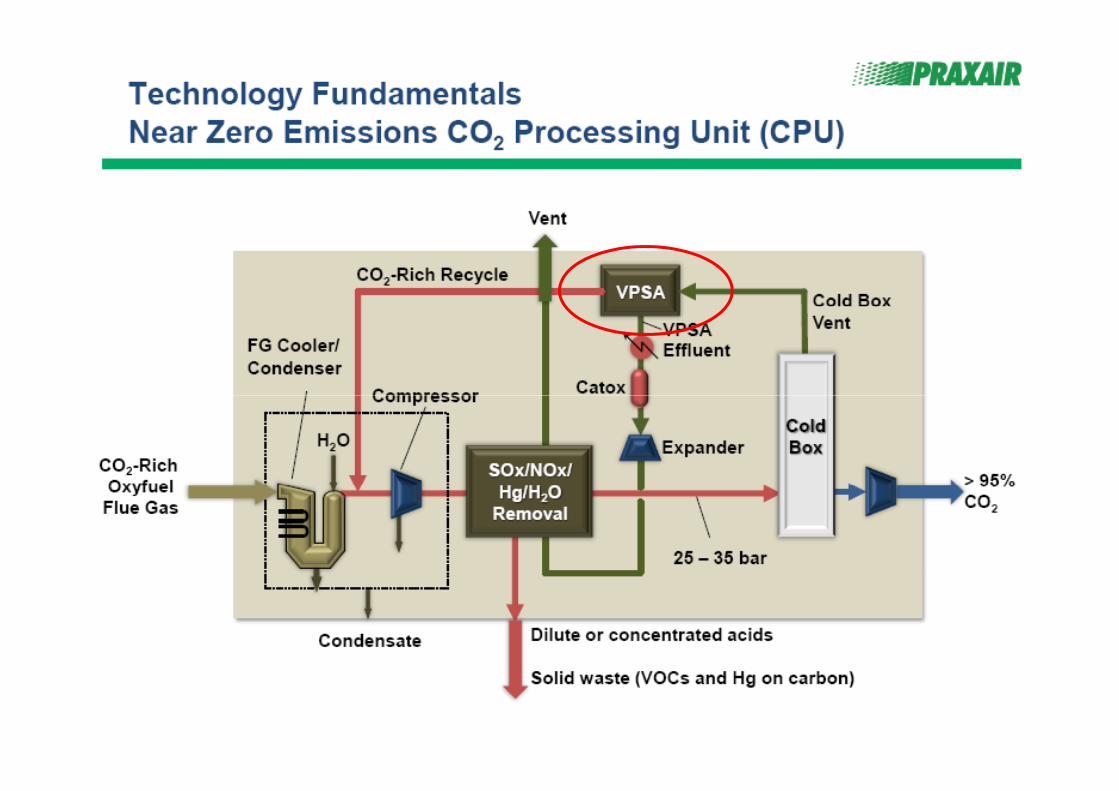
• Work on further recovery of CO2 in the vent of CPU.
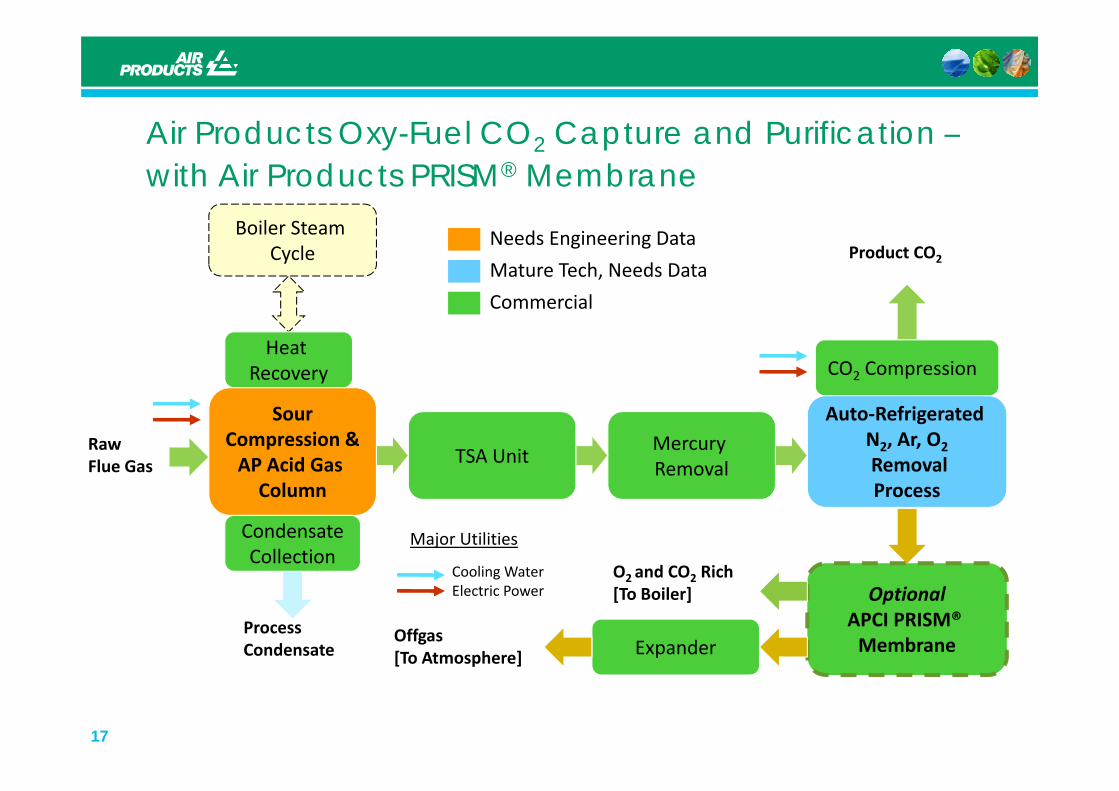
Ai P d t O F l CO C t d P ifi ti Air Products Oxy-Fuel CO2 Capture and Purification –with Air Products PRISM® Membrane
Product CO2
Boiler Steam Cycle
Commercial
Mature Tech, Needs Data
Needs Engineering Data
Heat Recovery CO2 Compression
Commercial
Raw Flue Gas
SourCompression &AP Acid Gas C l
TSA UnitMercury Removal
Auto‐Refrigerated N2, Ar, O2RemovalPColumn
CondensateCollection
Process
O2 and CO2 Rich
Major Utilities
Cooling Water
Offgas[To Atmosphere]
Process Condensate
OptionalAPCI PRISM® Membrane
O2 and CO2 Rich[To Boiler]
Cooling WaterElectric Power
Expander
17
[ p ]

NOx SO2 Reactions in the CO22 2Compression System
We realised that SO2, NOx and Hg can be removed in the CO2We realised that SO2, NOx and Hg can be removed in the CO2compression process, in the presence of water and oxygen. SO2 is converted to Sulphuric Acid, NO2 converted to Nitric Acid:Acid:
– NO + ½ O2 = NO2 (1) Slow– 2 NO2 = N2O4 (2) Fast– 2 NO2 + H2O = HNO2 + HNO3 (3) Slow2 NO2 H2O HNO2 HNO3 (3) Slow– 3 HNO2 = HNO3 + 2 NO + H2O (4) Fast– NO2 + SO2 = NO + SO3 (5) Fast– SO3 + H2O = H2SO4 (6) FastSO3 + H2O H2SO4 (6) Fast
Rate increases with Pressure to the 3rd power– only feasible at elevated pressure
No Nitric Acid is formed until all the SO2 is convertedPressure, reactor design and residence times, are important.
18

CO2 Compression and Purification System –2Removal of SO2, NOx and Hg
SO2 removal: 100% NOx removal: 90-99%1.02 bar 30°C67% CO28% H2O
30 bar to DriersSaturated 30°C76% CO28% H2O
25% InertsSOx
224% Inerts
BFW15 bar
Water
NOx BFW
Condensate
30 barcw
cw
cw
Dilute H2SO4
Dilute HNO3
19
2 4 HNO3
Hg

The effect of Pressure on SO2 and NO Conversion (1 l/ i 7 d 14 b )
D
NO Conversion (1 sl/min, 7 and 14 barg)Presented at the 9th International Conference on Greenhouse Gas Control Technologies (GHGT-9) “Purification of Oxyfuel-Derived
CO2”, Vince White, Laura Torrente-Murciano, David Sturgeon, and David Chadwick, Washington, D.C., November 2009
CMFC
D
From NRTF
CondensateSeparator
A B
Flue Gas CoolerReactor
Compressor &Receiver
7 bar g14 bar g
Inlet
After Compressor &
ReceiverInlet
After Compressor &
Receiver ConversionConversion
gg
(Point A) (Point C) (Point A) (Point C)
ppm SO2 900 20 98% 950 150 84%
20
ppm NOx 520 50 90% 390 120 68%

K L i f I i l C ll Key Learnings from Imperial College Work• NO oxidation rate confirmed to increase rapidly with increased pressure• At low temperature (~ 30‐50 °C), SO2 oxidation to SO3 / H2SO4 only occurs at an appreciable rate in presence of NO2 and a condensed phase
• Significant conversion can occur even with very small liquid phase volumes (i.e., very low L/G ratios)(i.e., very low L/G ratios)
– Speculation that condensation creates a fine mist with large interfacial surface area, and that reaction is occurring at the interfaceSpeculation that reactions are accelerated at low pH– Speculation that reactions are accelerated at low pH
• Recognized need to develop internal capability to explore broader range of parameters and to increase rate of data generation
21

DOE/NETL C ti A t DOE/NETL Cooperative Agreement: Air Products’ Sour Compression PDU
Side View of PDU
Acid Reactor (C102) • 1st campaign Jan 2010
• 2nd campaign April‐May 2010
22
2 campaign April May 2010
U.S. Department of Energy's National Energy Technology Laboratory under Award Number DE-NT0005309

DOE Project: Air Products’ Sour Compression PDU DOE Project: Air Products Sour Compression PDU –Key Results
700
Oxyfuel 22 January 2010
• For the overall process, total SO2 removal was 20‐
500
600
Condition DSOxConversion >99%NOx conversion >90%(NOx zero +/‐ 20 ppmv)
100 % (based on gas compositions).
• For the overall process 200
300
400
ppmv
[FLUGAS]NO.SCALED
[FLUGAS]SO2.SCALED
Reactor OutletReactor OutletReactor Outlet
For the overall process, total NOx removal was 60‐90 % (based on gas compositions)
0
100
20:38:24 20:52:48 21:07:12 21:21:36 21:36:00 21:50:24 22:04:48 22:19:12 22:33:36
Reactor Inlet Reactor Inlet Reactor Inlet Reactor Inlet
compositions).
• The effects of variations in the SO2/NOx feed ratio, column pressure, gas flowrate and liquid recirculation on the reactor performance were
‐100Time
flowrate and liquid recirculation on the reactor performance were explored. Process performance was most sensitive to SO2/NOx feed ratio, over the range of parameter values investigated.
23
• SO2 was removed from the flue gas through both sulfite and sulfate mechanisms.
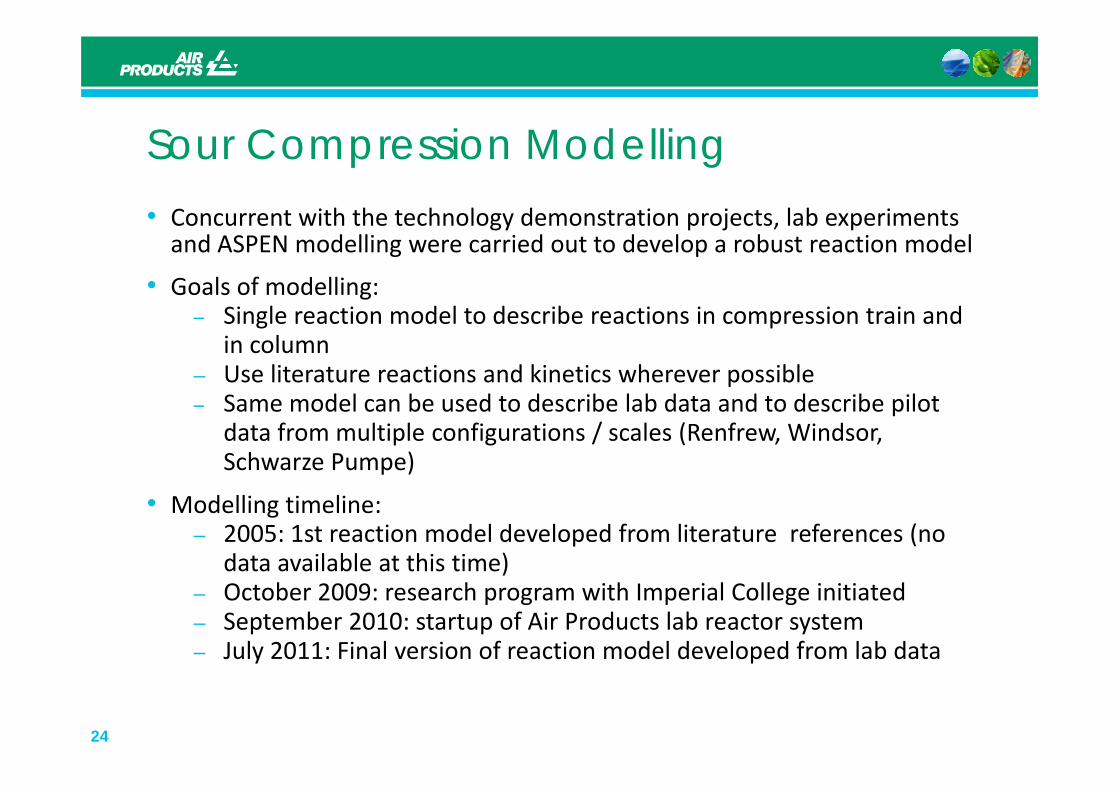
Sour Compression Modelling• Concurrent with the technology demonstration projects lab experiments• Concurrent with the technology demonstration projects, lab experiments and ASPEN modelling were carried out to develop a robust reaction model
• Goals of modelling:l d l d b d– Single reaction model to describe reactions in compression train and
in column– Use literature reactions and kinetics wherever possible
S d l b d d ib l b d d d ib il– Same model can be used to describe lab data and to describe pilot data from multiple configurations / scales (Renfrew, Windsor, Schwarze Pumpe)
• Modelling timeline:– 2005: 1st reaction model developed from literature references (no
data available at this time))– October 2009: research program with Imperial College initiated – September 2010: startup of Air Products lab reactor system– July 2011: Final version of reaction model developed from lab data
24
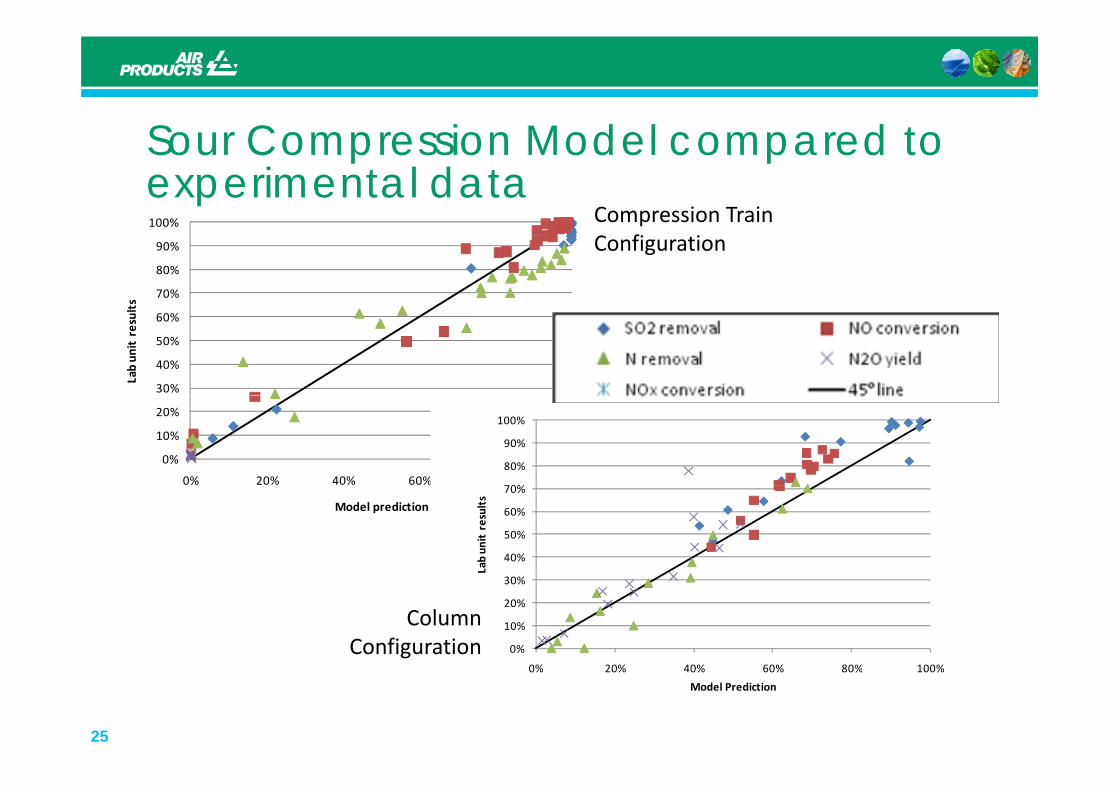
S C i M d l d t Sour Compression Model compared to experimental data
Compression Train
70%
80%
90%
100%
ts
Compression Train Configuration
30%
40%
50%
60%
Lab un
it result
SO2 removal
NO conversion
N removal
N2O yield
0%
10%
20%
0% 20% 40% 60% 80% 100%
N2O yield
45° line
70%
80%
90%
100%
Model prediction
40%
50%
60%
70%Lab un
it results
0%
10%
20%
30%
0% 20% 40% 60% 80% 100%
Column Configuration
25
0% 20% 40% 60% 80% 100%
Model Prediction

0/ 0 l G i f d ft O G50/50 Flue Gas Mix From Before and After OxPP FGD
26

0/ 0 l G i f d ft O G50/50 Flue Gas Mix From Before and After OxPP FGD
400
Inlet K432 Inlet Column Exit Column
350
400
NO
NOx
250
300
m, D
ry)
200
NO2(ppm
100
150
NO and
NO2
50
2
27
0
942 947 952 957 962 967
Time (minutes)
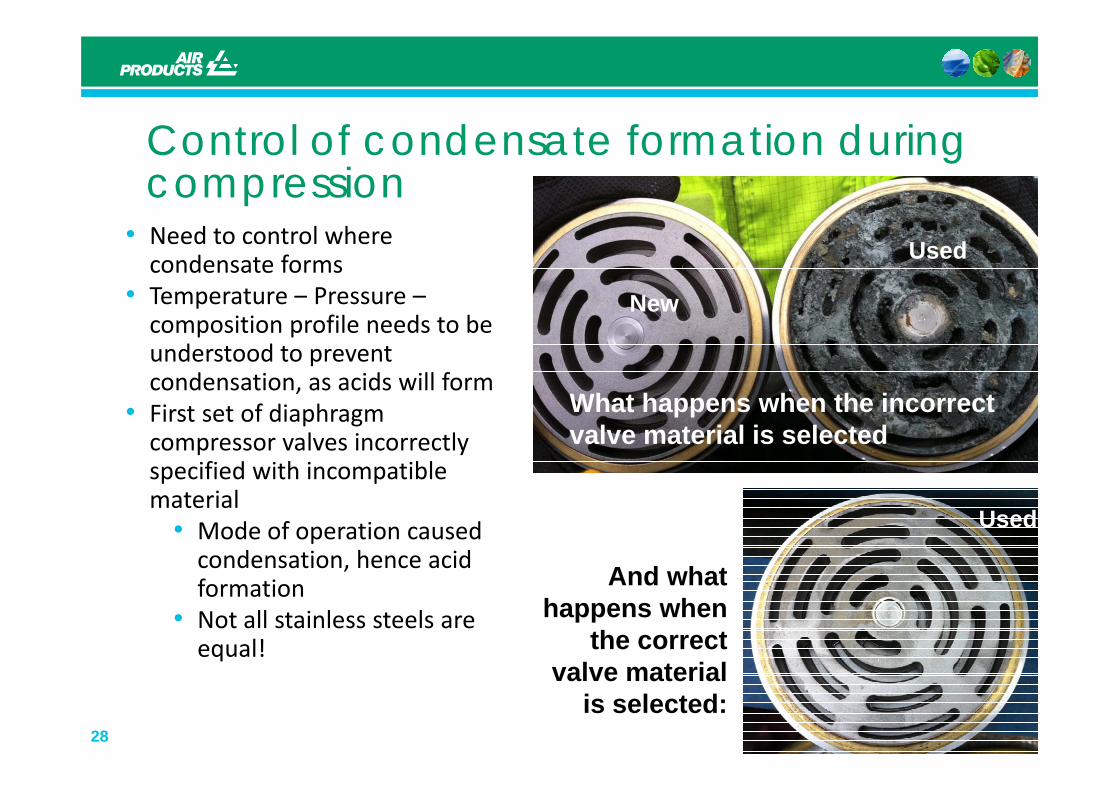
C t l f d t f ti d i Control of condensate formation during compression
New
Used• Need to control where condensate forms
• Temperature – Pressure –
Wh t h h th i t
Newpcomposition profile needs to be understood to prevent condensation, as acids will form
What happens when the incorrect valve material is selected
• First set of diaphragm compressor valves incorrectly specified with incompatible
And what
Usedmaterial
• Mode of operation caused condensation, hence acid And what
happens when the correct
l t i l
formation• Not all stainless steels are equal!
28
valve material is selected:

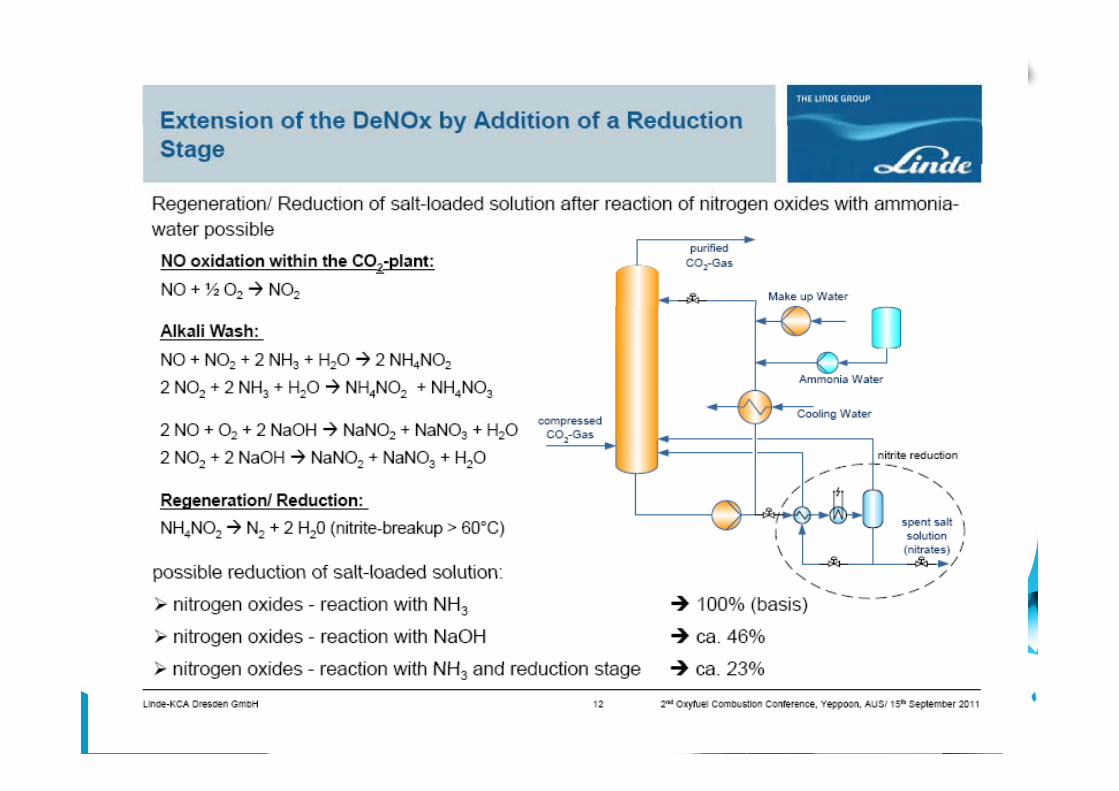
LICONOX™ Process
Bey/L/092009/Cottbus.pptLinde AG Engineering Division 30

31
32
33

S l h i A id M th dSulphuric Acid Method Activated Carbon Method
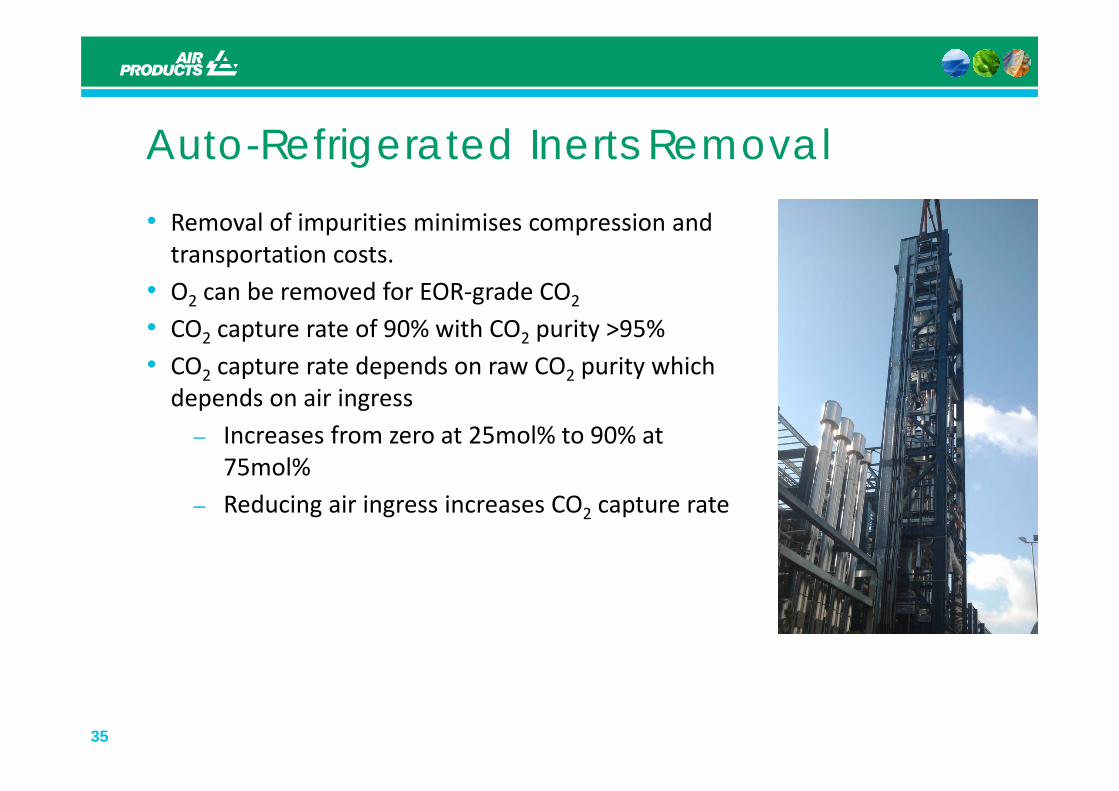
Auto-Refrigerated Inerts RemovalR l f i iti i i i i d• Removal of impurities minimises compression and transportation costs.
• O2 can be removed for EOR‐grade CO22 2
• CO2 capture rate of 90% with CO2 purity >95%• CO2 capture rate depends on raw CO2 purity which depends on air ingressdepends on air ingress
– Increases from zero at 25mol% to 90% at 75mol%
– Reducing air ingress increases CO2 capture rate
35

Can we improve on ~90% CO Capture?Can we improve on ~90% CO2 Capture?Vent stream is at pressure and is CO2 (and O2) rich
Flue Gas Vent 1 1 bar
Flue Gas Expander
Aluminium plate/fin exchanger
1.1 bar~25% CO2~25% O2~50% N2
Flue GasHeater -55°C
Driers
CO product
30 bar Raw CO2
CO2 product~96% CO2~4% Inerts‐60°C dp
36
30 bar Raw CO2Saturated 30°C75‐85% CO2

25%mol CO275% i t ( 15% O )
25%mol CO2
75% inerts75% inerts (~ 15% O2) (~ 19% O2)
72%mol CO2 98%mol CO2
76%mol CO224% inerts (~ 5 - 6% O2)
96%mol CO24% inerts (~ 0.95% O2)
72%mol CO2
28% inerts(~ 5 - 6% O2)
98%mol CO2
2% inerts(~ 0.6% O2)
25% l CO2 25%mol CO2
75% inerts (~ 15% O2)
25%mol CO2
75% inerts(~ 15% O2)
72%mol CO2 99.999%mol CO2
72%mol CO2
28% inerts(~ 5 - 6% O2)
99.95%mol CO2
0.05% inerts(~ .01% O2)
37
72%mol CO228% inerts(~ 5 - 6% O2)
99.999%mol CO2
0.001% inerts(~ .0005% O2)
( )

Autorefrigeration Process
J-T expansion of purified LCO2 for
Ventpurified LCO2 for refrigerationRaw CO2 partially
> 99.9% CO2
DryerDryerliquefied by boiling product
Compared to NH
yy
Hg
Compared to NH3refrigeration:Simpler process
PHX
Lower CAPEXHigher CO2recoveryLower power
Cold Box
DistillationColumn Reboiler
3838US Pat. 7,666,251
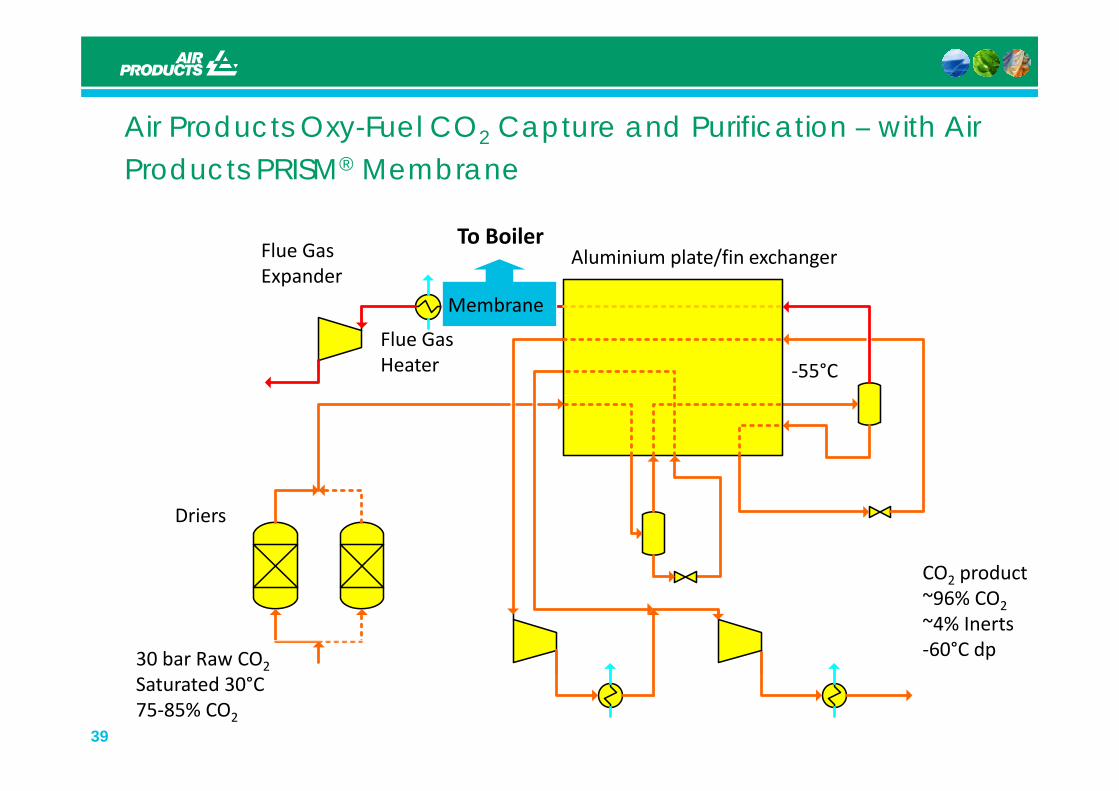
Air Products Oxy Fuel CO Capture and Purification with Air Air Products Oxy-Fuel CO2 Capture and Purification – with Air Products PRISM® Membrane
Flue Gas Expander
Aluminium plate/fin exchanger
Membrane
To Boiler
Flue GasHeater ‐55°C
Membrane
Driers
CO productCO2 product~96% CO2~4% Inerts‐60°C dp30 bar Raw CO2
39
30 bar Raw CO2Saturated 30°C75‐85% CO2
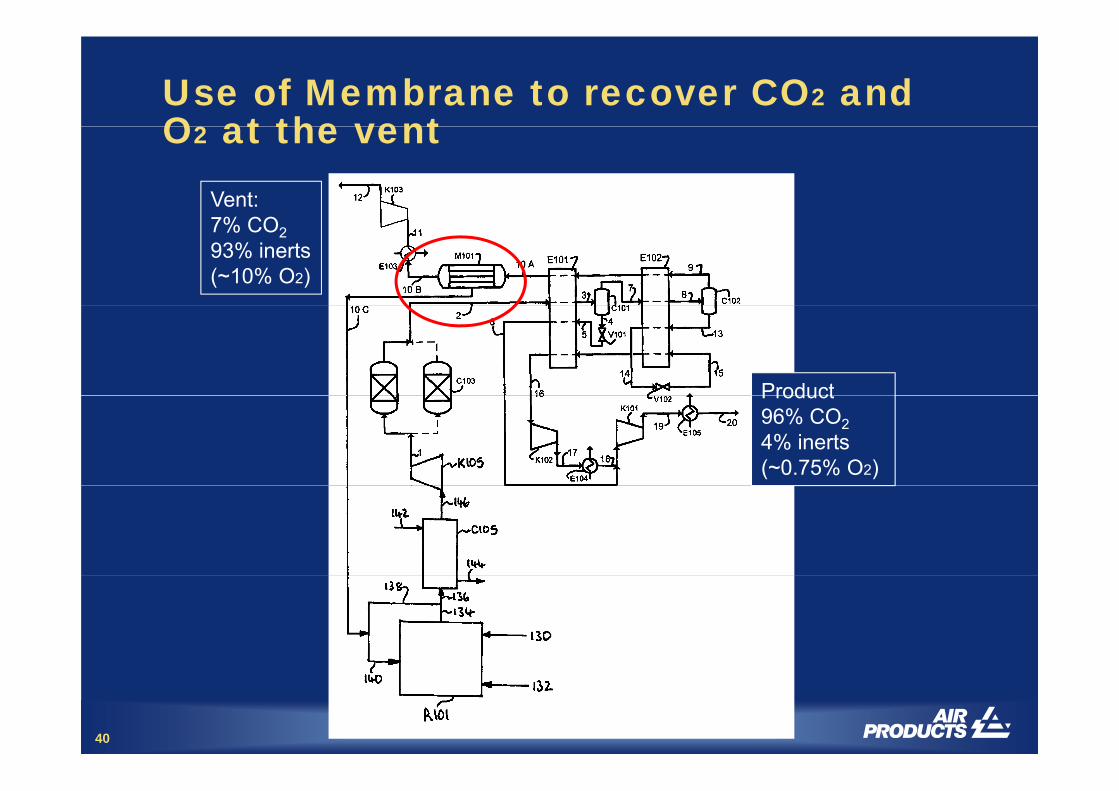
Use of Membrane to recover CO2 and O2 at the ventO2 at the vent
Vent:7% CO293% inerts (~10% O2)
ProductProduct96% CO24% inerts (~0.75% O2)
40
42
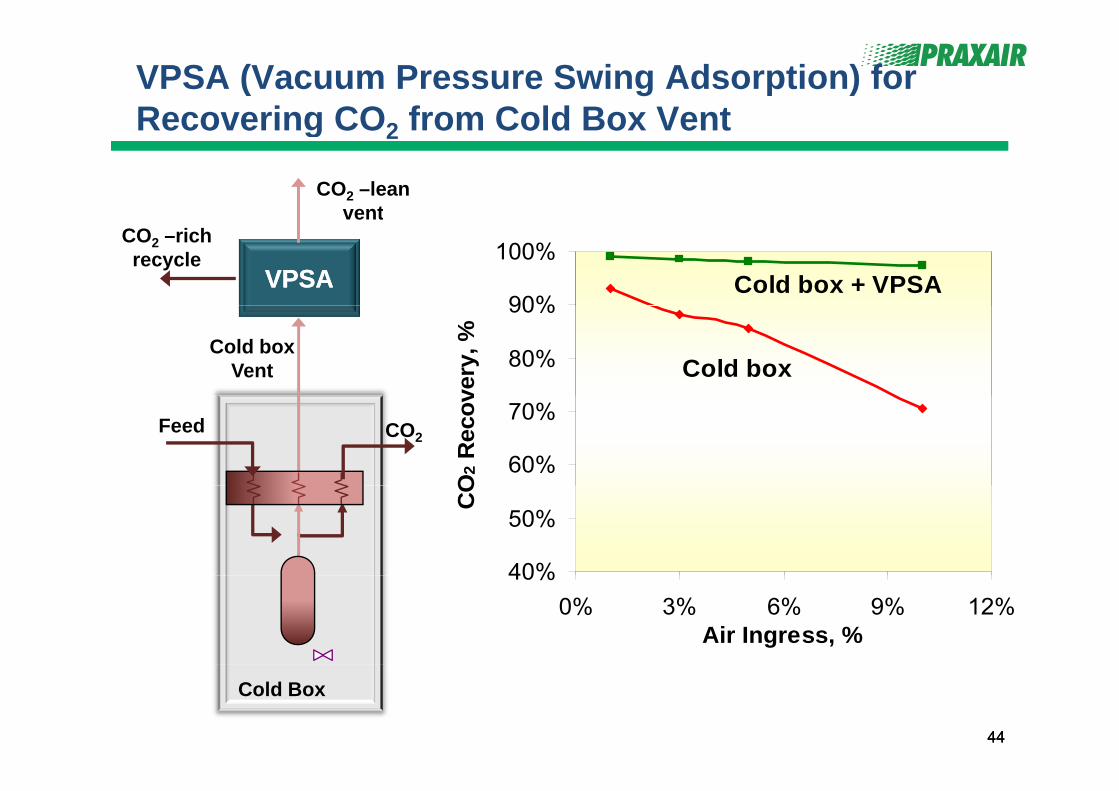
VPSA (Vacuum Pressure Swing Adsorption) for Recovering CO2 from Cold Box VentRecovering CO2 from Cold Box Vent
CO2 –leanvent
90%
100%Cold box + VPSAVPSAVPSA
CO2 –richrecycle
vent
80%
90%
very
, %
Cold boxCold box
Vent
60%
70%
O2 R
ecov
Feed CO2
40%
50%
CO
40%0% 3% 6% 9% 12%
Air Ingress, %
4444
Cold Box

565

Vattenfall ‐ Janschwalde (PC ‐250MWe) ‐ ???KEPCO/KOSEP ‐ Yongdong (PC ‐ 100MWe)
FutureGen2 ‐ Illinois (PC ‐ 100MWe)
Alstom Schwarze Pumpe 2008 30MWth LigniteHitachi Babcock Schwarze Pumpe 2010 30MWth LigniteIHI Callide 2011 30MWeAlstom / AL Lacq 2009 30MWth Gas/Oil?
l l h l
Coal
Target :
( )Endesa/CIUDEN ‐ El Bierzo (CFB ‐ 300MWe) ‐ ???
3 Newly announced oxyfuel projects in China.Drax Power Plant Oxyfuel in UK
CIUDEN El Bierzo CFB Facility 2011 30MWth CoalEl Bierzo PC Facility 2011 20MWth CoalCIUDEN
2009 – Lacq – World’s first 30MWt
t fitt d O NG
2011 – Callide –World’s first 30MWe retrofitted Oxy‐coal
power plant
By 2014‐2018
Demonstration of 50– 300MWe full scale power plant
“Commercialised by 2020”
2008
World’s FIRST 30 MWtfull chain demonstration
retrofitted Oxy‐NG boiler
2011 – CIUDEN –World’s first 30MWt Oxy‐CFB Pilot Plant
scale power plant.
2003 ‐ 2005
2007
B&W CEDF (30MWt) large scale burner testing started
at Schwarze Pumpe Pilot Plant
By the end of 2010/2011, Users (i.e. Power Plant Operators)
1990 ‐ 1995
1998 – 2001
CANMETUS DOE Project / B&W / Air Liquide
Vattenfall (ENCAP ++)CS Energy / IHI Callide Project
Users (i.e. Power Plant Operators) will have 6 burner manufacturers fully demonstrating “Utility Size Large Scale Burners” which should give a high level of confidence
1980’s
ANL/Battelle/EERC completed the first industrial scale pilot plant
EC Joule Thermie Project ‐ IFRF / Doosan Babcock / Int’l Combustion
NEDO / IHI / Jcoal Project
First large scale 35MWt B&W CEDF 2008 30MWth Coal
g e a g e e o co de cetoward demonstration
industrial scale pilot plant Oxy‐Coal Burner Retrofit Test done by
International Combustion
B&W CEDF 2008 30MWth CoalAlstom Alstom CE 2010 15MWth CoalDoosan Babcock DBEL ‐MBTF 2009 40MWth Coal
Updated by S. Santos (01/12/10)

Thank youWebsite: http://www.ieaghg.org
Special Issue:
Oxyfuel Combustion – Working Toward Demonstration and
Commercialisation
September 2011
59