Development and Verification of a Down-Hole … · Figure 2.3 The Danish Pocket Penetrometer...
56
G L De U Development and Verification of a Down-Hole Penetrometer Project Report No. TxDOT 5-4372-01-1 Final Report Texas Department of Transportation by C. Vipulanandan, Ph.D., P.E. Omer F. Usluogullari I GM A T C 1994 Center for Innovative Grouting Materials and Technology (CIGMAT) Department of Civil and Environmental Engineering University of Houston Houston, Texas 77204-4003 Report No. CIGMAT/UH 2008-2 http://tti.tamu.edu/documents/5-4372-01-1 Published: April 2008
Transcript of Development and Verification of a Down-Hole … · Figure 2.3 The Danish Pocket Penetrometer...

Investigation of a New Generation of FCC Compliant
NDT Devices for Pavement Layer Information Collection -
Test Procedure and Facility
Technical Report 0-4820-2
Performed in Cooperation with theTexas Department of Transportation
and the Federal Highway AdministrationProject Number 0-4820
ByRichard Liu
Jing LiXuemin ChenAditya EkboteHuichun Xing
Ying Wang
Subsurface Sensing LaboratoryDepartment of Electrical and Computer Engineering
University of HoustonURL: http://subsurface.ee.uh.edu/documents/0-4820-2.pdf
July 2006
Development and Verification of a
Down-Hole Penetrometer
Project Report No. TxDOT 5-4372-01-1
Final Report
Texas Department of Transportation
by
C. Vipulanandan, Ph.D., P.E.
Omer F. Usluogullari
I G M A TC
1994
Center for Innovative Grouting Materials and Technology
(CIGMAT)
Department of Civil and Environmental Engineering
University of Houston
Houston, Texas 77204-4003
Report No. CIGMAT/UH 2008-2
http://tti.tamu.edu/documents/5-4372-01-1
Published: April 2008


Technical Report Documentation Page 1. Report No. FHWA/TX-08/5-4372-01-1
2. Government Accession No.
3. Recipient's Catalog No. 5. Report Date February 2008 Published: April 2008
4. Title and Subtitle
Development and Verification of a Down-Hole Penetrometer
6. Performing Organization Code
7. Author(s) C. Vipulanandan and Omer F. Usluogullari
8. Performing Organization Report No. CIGMAT/UH 2008-2 5-4372-01-1 10. Work Unit No. (TRAIS)
9. Performing Organization Name and Address University of Houston Department of Civil and Environmental Engineering N107 Engineering Building 1 Houston, Texas 77204-4003
11. Contract or Grant No. Project 5-4372-01
13. Type of Report and Period Covered January 2005 to August 2007
12. Sponsoring Agency Name and Address Texas Department of Transportation Research and Technology Implementation Office P. O. Box 5080 Austin, Texas 78763-5080
14. Sponsoring Agency Code
15. Supplementary Notes Research performed in cooperation with Texas Department of Transportation Research Project Title: Development and Verification of a Down-Hole Penetrometer URL: http://tti.tamu.edu/documents/5-4372-01-1.pdf 16. Abstract Drilled shafts are increasingly used as foundations to support bridges and transportation structures in geomaterials such as soft-rocks and hard clay. Locating the bottom of the borehole during construction with the required strength is critical. Hence, developing a simple device that could be easily adapted/used with the drilling tool was an interest of this study. Determining the shear strength of the geomaterial in the borehole and at the bottom of the borehole can lead to better designs by identifying the various layers based on strength. In this study, Down-Hole Penetrometer (DHP) was designed, built and tested to determine its effectiveness in measuring the strength of soil/soft rock at the bottom of the borehole. DHP was calibrated in the laboratory by using springs with various stiffnesses and then field tested in clay shale, clay and silty clay in a total of six locations in the Houston and Dallas districts. The test results were used in developing the correlation between undrained shear strength of soil/soft rock and DHP deflection. 17. Key Words Correlations, Undrained Shear Strength, Soils, Soft Rock, Unconfined Compression Test, Down-Hole Penetrometer
18. Distribution Statement No restrictions. This document is available to the public through NTIS: National Technical Information Service 5285 Port Royal Road Springfield, Virginia 22161
19. Security Classif.(of this report) Unclassified
20. Security Classif.(of this page) Unclassified
21. No. of Pages 54
22. Price
Form DOT F 1700.7 (8-72) Reproduction of completed page authorized


Development and Verification of a
Down-Hole Penetrometer
Project Report No. TxDOT 5-4372-01-1
Final Report
Texas Department of Transportation
by
C. Vipulanandan, Ph.D., P.E. Omer F. Usluogullari
I G M A TC
1994
Center for Innovative Grouting Materials and Technology
(CIGMAT)
Department of Civil and Environmental Engineering
University of Houston
Houston, Texas 77204-4003
Report No. CIGMAT/UH 2008-2
Published: April 2008


iii
ENGINEERING DISCLAIMER
The contents of this report reflect the views of the authors, who are responsible for the
facts and the accuracy of the data presented herein. The contents do not necessarily reflect the
official views or policies of the Texas Department of Transportation. This report does not
constitute a standard or a regulation.
There was no art, method, process, or design which may be patentable under the patent
laws of the United States of America or any foreign country.
v

iv
PREFACE
In order to support high loads on bridges and other transportation structures and/or based
on the near surface geological conditions, more and more drilled shafts are being socketed to soft
rocks and clay. During the construction of drilled shafts in soft rock or hard clay, it is critical to
identify the soil stratum during the drilling process so that the drilled shaft could be correctly
socketed in the soft-rock or hard clay.
Both static and dynamic penetrometers are being used to determine the in situ soil
properties for designing deep foundations and slope stability analysis. However, these devices
cannot be used to characterize the soil in the drilled shaft borehole due to the difficulty of
incorporating the operations during the construction phase. In order to overcome this difficulty at
present, a Down-Hole Penetrometer (DHP) was designed and built at the University of Houston,
in Houston, Texas, and there is no commercially available tool to characterize the clay and soft-
rock strength at the bottom of the borehole of a drilled shaft.
Correlations based on the field test values could be very useful to engineers to determine
the undrained shear strength of the soil/rock. In order to correlate the DHP measurements
(deflections) to soil/rock strength and TCP values, limited field tests were performed in the
Houston District and Dallas District.
vi

v
ABSTRACT
Drilled shafts are increasingly used as foundations to support bridges and transportation
structures in geomaterials such as soft-rocks and hard clay. Locating the bottom of the borehole
during construction with the required strength is critical. Hence developing a simple device that
could be easily adapted/used with the drilling tool was an interest of this study. Determining the
shear strength of the geomaterial in the borehole and at the bottom of the borehole can lead to
better designs by identifying the various layers based on strength.
In this study, a Down-Hole Penetrometer (DHP) was designed, built and tested to
determine its effectiveness in measuring the strength of soil/soft rock at the bottom of the
borehole. Based on limited field tests, correlations between geomaterial strengths and DHP
deflection have been developed.
vii

vi
SUMMARY
Defining the soil and rock parameters at the bottom of a borehole in a drilled shaft is not
common because of the difficulties of measurement. Hence when developing the DHP, its
adoption to the Kelly bar was considered. The key components of DHP are the spring and a ring,
which is adjusted to move with the motion of the spring. The working procedure of DHP is based
on a concept. Load applied to the DHP provides a deflection at the spring then with the motion
of the spring ring, it starts to move. When a failure occurs at the penetrated soil the spring
reaches its maximum deflection, although the spring returns to its old position, the ring stands at
the point of maximum deflection.
In this project, DHP was calibrated in the laboratory using springs with various
stiffnesses and then field tested in clay shale, clay and silty clay at six locations within the
Houston and Dallas Districts. Based on the field test results, correlation between undrained shear
strength and DHP deflection was developed.
.
viii

vii
RESEARCH STATEMENT
This research project was conducted to develop a Down-Hole Penetrometer that could be
easily used during construction to determine strength of the geomaterial at the bottom of a
borehole.
The report will be a guidance document for TxDOT engineers on using the Down-Hole
Penetrometer to determine the strength of the soil/soft rock at the bottom of the borehole. The
deflection measured in DHP has been correlated to Su (shear strength) and TCP values.
The major components of the mechanical DHP system are piston, spring, sliding ring and
penetrometer shell. The basic concept of the penetrometer is to fail the geomaterials below the
piston and determine the deflection of the spring which in turn is correlated to the Su of the
soil/soft rock.
The DHP can be attached to the Kelly bar and lowered into a borehole, with or without
slurry, to determine the strength of the geomaterials at the bottom of the borehole. Based on
limited field tests, the shear strength of the geomaterials has been related to the deflection
measured.
ix

x
viii
TABLE OF CONTENTS
ENGINEERING DISCLAIMER....................................................................................... iii
PREFACE.......................................................................................................................... iv
ABSTRACT........................................................................................................................ v
SUMMARY....................................................................................................................... vi
RESEARCH STATEMENT............................................................................................. vii
TABLE OF CONTENTS....................................................................................................xi
LIST OF FIGURES ......................................................................................................... xiii
LIST OF TABLES............................................................................................................ xv
CHAPTER 1 INTRODUCTION ........................................................................................ 1
1.1 Introduction............................................................................................................... 1
1.2 Research Objectives.................................................................................................. 1
1.3 Organization.............................................................................................................. 2
CHAPTER 2 LITERATURE REVIEW ............................................................................. 3
2.1 Penetrometers............................................................................................................ 3
2.1.1 Texas Cone Penetrometer (TCP) ....................................................................... 4
2.1.2 Danish Pocket Penetrometer .............................................................................. 6
2.1.3 Multiple-Purpose Borehole Testing Device....................................................... 7
Summary ..................................................................................................................... 9
xi

ix
CHAPTER 3 DOWN-HOLE PENETROMETER (DHP)................................................ 11
3.1 Design .................................................................................................................... 11
3.2 Calibration............................................................................................................... 16
3.3 Field Tests............................................................................................................... 19
3.4 Correlations ............................................................................................................ 29
CHAPTER 4 CONCLUSIONS AND RECOMMENDATIONS..................................... 33
4.1 Conclusions............................................................................................................. 33
4.2 Recommendations................................................................................................... 34
REFERENCES ................................................................................................................. 35
xii
x
LIST OF FIGURES Page
Figure 2.1 Texas Cone Penetrometer (TCP) ……………………………………………………...5
Figure 2.2 TCP Hammers (TxDOT Geotechnical Manual 2000) ……………………………….. 6
Figure 2.3 The Danish Pocket Penetrometer (Sanglerat 1972) …………...................................... 7
Figure 2.4 Schematic View of the BTD System (Huang et al. 2002) …………………………… 8
Figure 3.1 Body of Down-Hole Penetrometer ………………………………………………..... 13
Figure 3.2 Details of the Piston ……………………………………………………………….....14
Figure 3.3 Details of the Kelly Adaptor ………………………………………………………... 15
Figure 3.4 Spring Constants Inside and Outside the DHP for a) Green Spring b) Gold Spring ...17
Figure 3.5 The First Location of the DHP Test in Houston (Map courtesy of Google Maps) … 19
Figure 3.6 The Second Location of the DHP Tests in Houston (Map courtesy of Google
Maps) ………………………………………………………………………………. 20
Figure 3.7 The Third Location of the DHP Test at Memorial Dr., Houston (Map courtesy of
Google Maps) ……………………………………………………………………… 21
Figure 3.8 The DHP Going into the Borehole …………………………………………………. 22
Figure 3.9 After the field test, changing the DHP for the other test …………………………… 22
Figure 3.10 Spring is hooked on DHP …………………………………………………………. 22
Figure 3.11 All DHPs Used in the Field Tests …………………………………………………. 22
Figure 3.12 Schematic of a DHP after the Field Test ………………………………………….. 23
Figure 3.13 Extruding the Soil Samples ……………………………………………………….. 23
Figure 3.14 Extruded Sample ………………………………………………………………….. 23
Figure 3.15 The Fourth Location of the DHP Test (Lawndale St., Houston) (Map courtesy of
Google Maps) ……………………………………………………………….…….. 24
Figure 3.16 The DHP Being Lowered …………………………………………………….…… 24
Figure 3.17 Moved Ring after Test into the Borehole ………………………………….……… 24
Figure 3.18 Trimming Clay Sample ………………………………………………………….... 25
Figure 3.19 Clay Sample before Compression Test ………………………………………….... 25
xiii
xi
Figure 3.20 Clay Sample after failure ………………………………………………………….. 25
Figure 3.21 Location of the DHP Test at the Intersection of I-30 and Loop 12, Dallas (Map
courtesy of Google Maps) ………………………………………………………… 26
Figure 3.22 Dallas Field Location and Prepared DHP before Test ……………………………. 26
Figure 3.23 Location of the DHP Tests, at the Trinity Bridge, Dallas (Map courtesy of
Google Maps) …………………………………………………………………….. 27
Figure 3.24 The DHP after Tests ………………………………………………………………. 27
Figure 3.25 DHP Taken Out of the borehole ……………………………………………….….. 27
Figure 3.26 Undrained Shear Strength versus DHP Spring Deflection for Green Spring (k=1800
lb/in.) ……………………………………………………………………………... 29
Figure 3.27 Undrained Shear Strength versus DHP Ultimate Strength Gold Spring (k=1100
lb/in.) ……………………………………………………………………………... 30
Figure 3.28 Correlation between DHP Deflection and NTCP (Blows/12 in.) …………………... 31
Figure 3.29 Correlation between DHP Deflection and NTCP (in./100 blows) ………………….. 32
Figure 3.30 Correlation between Deflection and NTCP (in./100 blows) ………………………... 32
xiv
xii
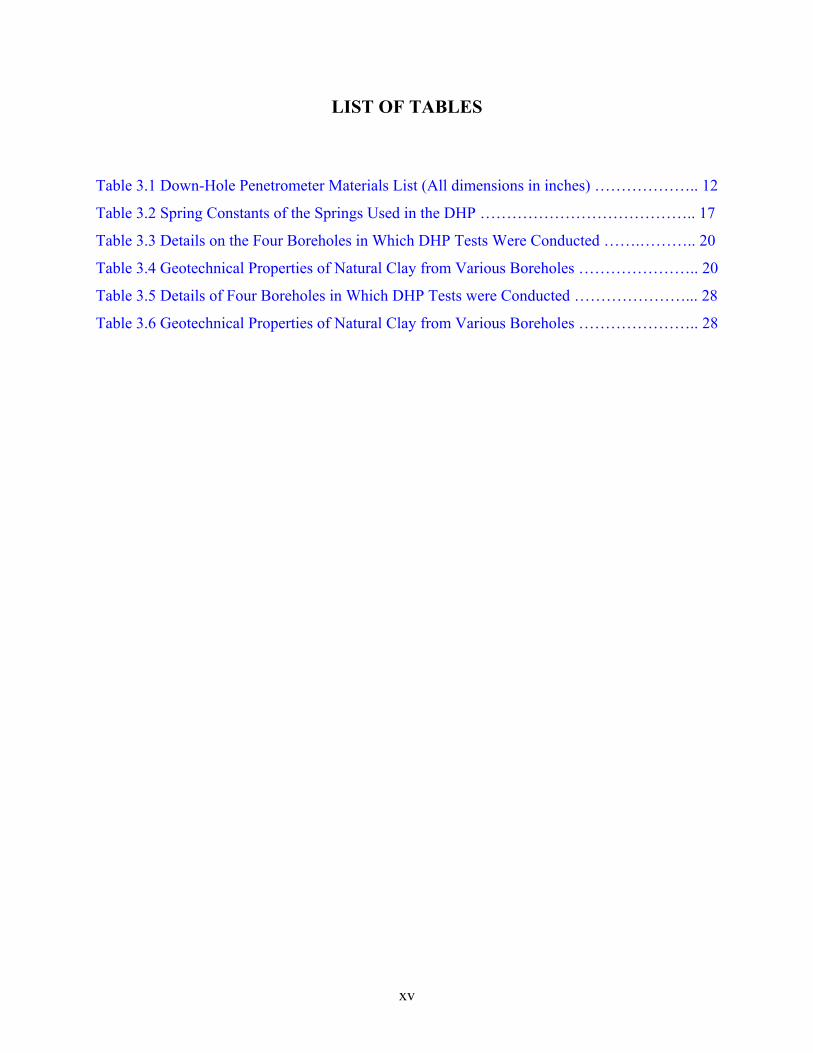
LIST OF TABLES
Table 3.1 Down-Hole Penetrometer Materials List (All dimensions in inches) ……………….. 12
Table 3.2 Spring Constants of the Springs Used in the DHP ………………………………….. 17
Table 3.3 Details on the Four Boreholes in Which DHP Tests Were Conducted …….……….. 20
Table 3.4 Geotechnical Properties of Natural Clay from Various Boreholes ………………….. 20
Table 3.5 Details of Four Boreholes in Which DHP Tests were Conducted …………………... 28
Table 3.6 Geotechnical Properties of Natural Clay from Various Boreholes ………………….. 28
xv


1
CHAPTER 1 INTRODUCTION 1.1 Introduction
For site investigation, in situ tests are increasingly used to determine the soil properties
for geotechnical analysis and design. The penetrometers evolved from the need to acquire data
on sub-surface soils that were not sampled easily by any other means. Static and dynamic
penetration resistances have been used to classify and characterize subsoils. Laboratory testing
undisturbed samples requires great care to avoid disturbance during handling, or systematical
disturbance during testing, and it may be difficult to relate the laboratory test results to the in situ
properties of the soil. There is always a certain degree of disturbance to the samples because the
confining pressures, which exist in the ground, are forcibly changed when the sample is
collected.
The penetrometer was developed as a handy tool to avoid many drawbacks of sampling
and laboratory tests, ant it has become a widely accepted means for the in situ properties. A
penetrometer consists of a slender metal rod that is pushed or driven into the ground by jacks,
hammer blows or other field instruments (Sanglerat 1972).
In this project, a Down-Hole Penetrometer (DHP) was designed, built and tested in the
laboratory and field to determine the ultimate strength of clay and soft rocks. The field tests were
conducted using the DHP in the Dallas and Houston Districts, both of which contain clay shale,
clay and silty clay.
1.2. Research Objective
The overall objective was to develop and calibrate the DHP for use in soft rocks. Then
specific objectives are as follows:
- Design the Down-Hole Penetrometer to cover a range of hard clay to soft rock.
- Calibrate the Down-Hole Penetrometer with field tests.

2
1.3 Organization
This report has been organized into four chapters. In Chapter 2, literature reviews related
to in situ methods used to characterize the soils and rocks have been summarized. In Chapter 3,
in addition to design details, field tests have been summarized. By varying the spring, various
soil types were investigated. Linear relationships between spring deflections and undrained shear
strength have been developed. Also DHP deflection is related to Texas Cone Penetrometer (TCP)
values. Conclusions and recommendations are summarized in Chapter 4.

3
CHAPTER 2 LITERATURE REVIEW
2.1 Penetrometers Probing with rods through weak ground to locate a firmer stratum has been practiced
since 1917 (Meigh 1987). Soil sounding or probing consists of forcing a rod into the soil and
observing the resistance to penetration. The penetrometer evolved from the need of acquiring
data on sub-surface soils that were not obtainable by any other means.
There are several applications for penetrometers such as: used to establish the thickness
of different strata when investigating the suitability of a site for construction works, testing
compaction works, and for determining the relative density of fills and naturally deposited non-
cohesive soils. In addition, information concerning the physical properties of soils can be
obtained, which is used to assess their bearing capacity and to analyze stability problems.
There are two ways to drive the penetrometers into the soil: static and dynamic methods.
Each one of these penetrometers have their own purposes and design considerations. In the
United States, the most commonly used penetration devices for soil-related applications are the
standard penetration test (SPT) and the cone penetration test (CPT). One of the in situ tools
commonly used for this process in the State of Texas by the Texas Department of Transportation
is the Texas cone penetrometer (TCP).
The SPT originated around 1927 and has been in use for some 80 years. It is being used
worldwide and currently the most popular and economical means to obtain subsurface
information. It is estimated that 85 to 90 percent of conventional design in North America is
made using the SPT (Bowles 2002; Marcuson and Bieganousky 1977; Mayne and Kemper 1984;
Mayne 1991; Meyerhof 1956). The method has been standardized as an ASTM D1586 since
1958 with periodic revisions to date.
The CPT is now widely used in lieu of the SPT, particularly in soft clays, soft silts and in
fine to medium sand deposits (Kulhawy and Mayne 1990; Mayne and Kemper 1984). The test is
not well adopted to gravel deposits or to stiff/hard cohesive deposits. This test has been
standardized by ASTM as D 5778. The test consists of pushing a 35.6 mm diameter standard
cone into the ground at a rate of 10 to 20 mm/s and recording the resistance. Because of the
complexity of soil behavior, empirical correlations are used extensively in evaluating soil
parameters (Orchant et al. 1988; Robertson and Campanella 1983).

4
In addition to these devices, University of Houston recently developed a Down-Hole
Penetrometer to characterize the soil in the borehole due to the difficulty of incorporating the
operations during the construction phase. Also, there are other penetrometers that have been
developed for in situ tests: Multiple-Purpose Borehole Testing Device (Huang et al. 2002),
Danish Pocket Penetrometer (Godskesen 1936).
2.1.1 Texas Cone Penetrometer (TCP)
The Texas Cone Penetrometer is commonly used for site investigation by the Texas
Department of Transportation (Figures 2.1 and 2.2). The TCP test involves driving a hardened
conical point into the soil and hard rock by dropping a 170 lb (77 kg) hammer a height of 2 feet
(0.6 m) (Tex-132-E). From the soil test, a penetration resistance or blow count ( TCPN ) is obtained
which equals the number of blows of the hammer for 12 inches (300 mm) of penetration.
According to the Geotechnical Manual (2000), TCP was developed by the bridge
foundation group in the bridge division with the help of several other divisions in the TxDOT.
This was an effort to bring consistency in soil testing to determine soil and rock load carrying
capacity in foundation design, which was lacking prior to the 1940s. The first use of TCP dates
back to 1949, and the correlation charts and test procedure was first published in the Foundation
Exploration and Design Manual in 1956. These correlations were modified slightly in 1972 and
1982 based on accumulated load test data for piling and drilled shafts (Geotechnical Manual
2000).
A recent study on TCP has further verified the correlations between CL and CH soil
Undrained Shear Strength and TCP values (Kim et al. 2007; Vipulanandan et al. 2007b;
Vipulanandan et al. 2007)

5
(a) Actual view (TxDOT Geotechnical Manual, 2000)
(b) Texas Cone Schematic
(c) Details of the Texas Cone Penetrometer (Not to Scale)
Figure 2.1 Texas Cone Penetrometer (TCP)
170 lb Hammer
Drill Stem
TCP Cone
Anvil
24 inch Hammer Drop
60
TCP Cone
Rod

6
(a) Fully Automatic (b) Automatic Trip Figure 2.2 TCP Hammers (TxDOT Geotechnical Manual 2000)
2.1.2 Danish Pocket Penetrometer The Danish or Swedish pocket penetrometer was developed by the Danish railroads in
1931. It has a spring placed on a cone, and it is driven into the soil by hand or with suspension
(Figure 2.3). It has been satisfactorily used for determining cohesion and allowable bearing
pressures of soils (Godskesen 1936).

7
Figure 2.3 The Danish Pocket Penetrometer (Sanglerat 1972)
2.1.3 Multiple-Purpose Borehole Testing Device (BTD) This in situ testing device was developed to provide design parameters for shallow or
deep foundations in soft rock (Huang et al. 2002). This device consists of two measuring
instruments; one is a pressuremeter and the other is a plate-loading device (Figure 2.4). It can be
used to perform a borehole jacking test, plate-loading test and borehole shear test in the same
borehole.
The BTD consisted of three major compartments, as described in Figure 2.4, with a total
height of 1900 mm. It was designed to perform tests in a 200 mm diameter borehole. The top
compartment could be expanded laterally against the borehole wall, performing a borehole
jacking test. This lateral expansion jams the top compartment against the borehole wall, provides
a reaction to the plate-loading test at the bottom of the borehole and exerts a normal stress
against the borehole wall for performing a shear wave test at the same time. The central
compartment offered waterproofed housing for the electronic signal processing system.

8
A series of field tests have been performed in a soft rock formation at a test site in Miaoli
County, which is located in northern Taiwan. Silty sandstone with occasional layers of shale and
mudstone were the major rock formations in this region.
Figure 2.4 Schematic View of the BTD System (Huang et al. 2002) Field coring can cause significant disturbance to soft rock samples and result in low
stiffness measurements. This device reduced the disturbance effects. It would be more desirable
to derive design parameters directly from field load tests. However, a full-size load test can be
time consuming and costly. Like the DHP, this device was also developed for foundations in
9
soft rock. On the other hand, DHP has the advantage that it can be attached to the Kelly bar
during construction, and also the DHP has the option of changing springs in case different types
of soils are encountered.
Summary
Based on the literature review, the following observation can be advanced:
(1) In situ methods currently used cannot be easily adopted with the drilled shaft construction to
determine the strength of the hard soil/soft rock at the bottom of the borehole.

10
CHAPTER 3 DOWN-HOLE PENETROMETER (DHP)
3.1 DHP Design
During the development of DHP, Kelly bar was considered for attaching the device. The
parts used in the DHP are listed in Table 3.1 and the cross sections of the DHP. The piston and
Kelly bar adaptor are shown in Figures 3.1, 3.2 and 3.3. Once assembled, the DHP weight about
30 lb. The key components of DHP are the spring and a ring, which is adjusted to move with the
motion of the spring. The working procedure of the DHP is based on a simple concept. Load-
applied DHP provides a deflection at the spring then with the motion of the spring ring starts to
move. By applying the weight of the Kelly bar the soil/soft rock below the piston fails and
compresses the spring to represent the failure load. At soil/soft rock the spring reaches its
maximum deflection. Although the spring returns to its old position when DHP is lifted off the
ground, the ring stands at the point of maximum deflection (δ max).
If the failure load on the piston was qult and the spring stiffness was k, it can be
represented as follows (bearing capacity relationship):
qult = pA
k maxδ× = N x Su (1)
where δmax = maximum deflection, Ap = area of piston, Su = undrained shear strength and N is
the bearing capacity factor.
111111
11
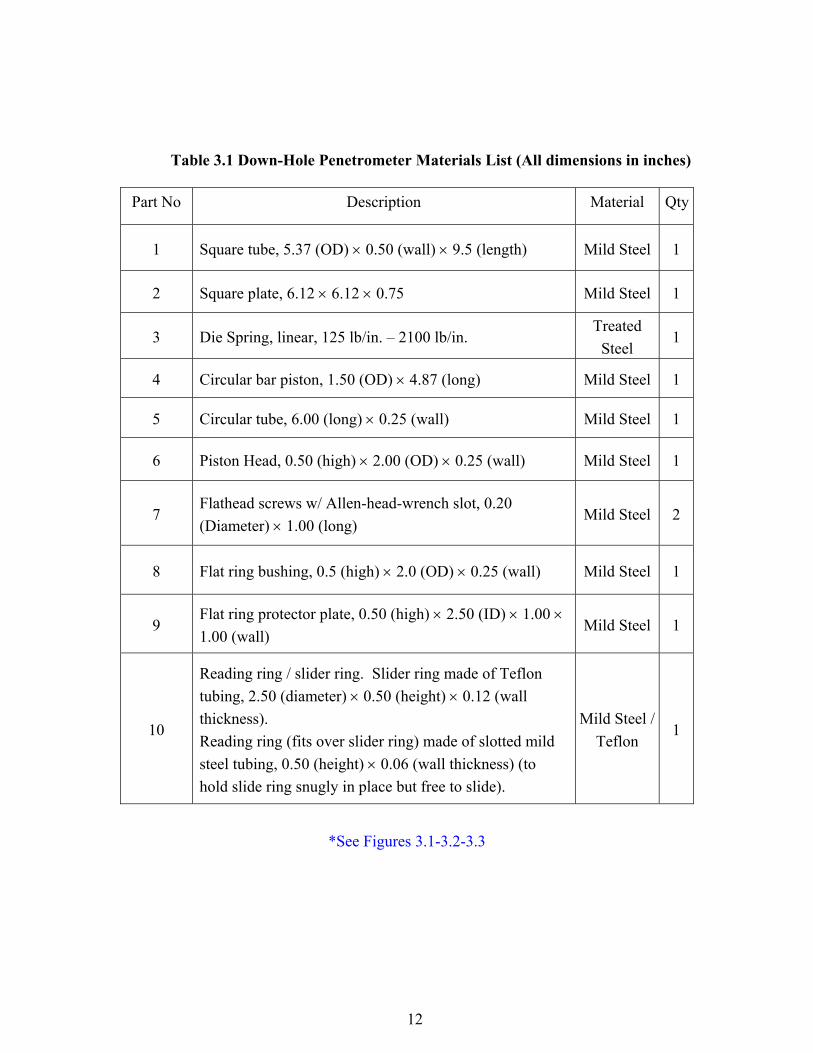
Table 3.1 Down-Hole Penetrometer Materials List (All dimensions in inches)
Part No Description Material Qty
1 Square tube, 5.37 (OD) × 0.50 (wall) × 9.5 (length) Mild Steel 1
2 Square plate, 6.12 × 6.12 × 0.75 Mild Steel 1
3 Die Spring, linear, 125 lb/in. – 2100 lb/in. Treated
Steel 1
4 Circular bar piston, 1.50 (OD) × 4.87 (long) Mild Steel 1
5 Circular tube, 6.00 (long) × 0.25 (wall) Mild Steel 1
6 Piston Head, 0.50 (high) × 2.00 (OD) × 0.25 (wall) Mild Steel 1
7 Flathead screws w/ Allen-head-wrench slot, 0.20 (Diameter) × 1.00 (long)
Mild Steel 2
8 Flat ring bushing, 0.5 (high) × 2.0 (OD) × 0.25 (wall) Mild Steel 1
9 Flat ring protector plate, 0.50 (high) × 2.50 (ID) × 1.00 × 1.00 (wall)
Mild Steel 1
10
Reading ring / slider ring. Slider ring made of Teflon tubing, 2.50 (diameter) × 0.50 (height) × 0.12 (wall thickness). Reading ring (fits over slider ring) made of slotted mild steel tubing, 0.50 (height) × 0.06 (wall thickness) (to hold slide ring snugly in place but free to slide).
Mild Steel / Teflon
1
*See Figures 3.1-3.2-3.3
121212

12
Figure 3.1 Body of Down-Hole Penetrometer
131313

13
Figure 3.2 Details of the Piston
0.2 in diameter screw, two at 180o ,
Drill and tap into piston to depth of 0.5 in
141414

14
Figure 3.3 Details of the Kelly Adaptor
151515

15
3.2 Calibration
Springs of different stiffnesses were used to test the DHP in the field. The springs were
calibrated in the laboratory using the Universal Test Machine (UTM). The applied load (L) and
corresponding deflection (δ) were recorded. The springs were calibrated inside and outside (free)
the DHP. The load-deflection curves for each of the springs are given in Figure 3.4 (a-b).
Load-Displacement curve for Spring Green
L = 1737 δ
y = 1854 δ + 354.84
L = 1896 δ + 348.33
0
500
1000
1500
2000
2500
0 0.2 0.4 0.6 0.8 1 1.2
Spring Deflection, δ (in.)
App
lied
Load
, L (l
b.)
Free Spring DeflectionSpring Deflection inside DHPSpring Deflection inside DHP
(a)
161616

16
Load-Displacement curve for Spring Gold
L = 1204δ + 69.367
L = 1107δy = 1234δ+ 93.551
0
200
400
600
800
1000
1200
0 0.1 0.2 0.3 0.4 0.5 0.6 0.7 0.8 0.9 1
Spring Deflection, δ (in.)
App
lied
Load
, L (l
b.)
Free Spring DeflectionSpring Deflection inside DHPSpring Deflection inside DHP
(b)
Figure 3.4 Spring Constants Inside and Outside the DHP for a) Green Spring b) Gold Spring
Table 3.2 lists the different springs used in this study.
Table 3.2 Spring Constants of the Springs Used in the DHP
Spring Manufacturer’s Spring Constant (lb/in.)
Calibrated Spring Constant of Free Spring (in compression) (lb/in.)
Average Calibrated Spring Constant of Spring in DHP (in compression) (lb/in.)
Green 1728 1737 1875 Gold 1100 1107 1219
As summarized in Table 3.2 the free spring constants (in compression) varied by 7
percent and 1 percent of the manufacturer’s supplied spring constants. This variation may occur
171717
17
because the manufacturer’s spring constant is not found by calibrating each spring, but only a
statistical estimation of a particular type of spring. Also, the manufacturer may have tested the
springs in tension, while for this study the springs were tested in compression. Calibration results
show two stiffness constants for each spring. In analyzing the spring constants it was found that
the springs, when calibrated inside the DHP, gave a higher value than when calibrated outside.
The increase in value of the spring constant in the DHP can be attributed to two factors: (a)
friction between the plunger and penetrometer walls increases with spring deflection, and/or (b)
the spring expands laterally when it is compressed, rubbing against the side of the chamber.
181818

18
3.3 Field Tests
a) Location 1 & 2 (I-10 West, I-10 East, Houston B1, B2, B3, B4) (July 2006)
Table 3.2 summarizes the information from the locations where field tests were
completed. Clay samples were obtained from four locations in Houston, Texas. Three of the
locations were along Interstate Highway 10 close to Beltway 8 and have been designated as B1,
B2, and B3. The fourth location was at the junction of Wallisville and Maxey Road, and has been
designated as B4. Figures 3.5 and 3.6 illustrate the maps of the four locations.
Figure 3.5 The First Location of the DHP Test in Houston. (Map courtesy of \ Google Maps)
B3 B2
B1
I-10
BELTWAY 8
191919

19
Figure 3.6 The Second Location of the DHP Tests in Houston. (Map courtesy of Google Maps)
Table 3.3 summarizes the details of the four drilled shafts at the test sites.
Table 3.3 Details on the Four Boreholes in Which DHP Tests Were Conducted
Location Length of Borehole (ft)
Diameter of Borehole (in.)
Soil Description TCP blow count Slurry
B1 50 60 Reddish Brown 10 (6) 25 (6) Yes
B2 63 60 Reddish Brown 34 (6) 40 (6) No
B3 53 48 Reddish Brown 39 (6) 50 (6) No
B4 54 36 Reddish Brown 18 (6) 21 (6) Yes
Material properties of the clay samples obtained from the four locations are summarized
in Table 3.4
Table 3.4 Geotechnical Properties of Natural Clay from Various Boreholes
Location Plastic Limit (%)
Liquid Limit (%)
Plasticity Index (%)
Soil Classification
B1 21 53 32 CH B2 20 59 39 CH B3 22 42 20 CL B4 27 72 45 CH
B4Loop 610
I-10
BELTWAY 8
202020

20
b) Location 3 (Intersection of Memorial Dr. and Beltway 8, B5) (03/23/07)
The field was located near the intersection of Memorial Dr. and B 8 (Figure 3.7). The soil
was composed of silt and clay, and these materials make soil extremely sticky. In order to
prevent soil sticking to auger during drilling, slurry is being used.
Figure 3.7 The Third Location of the DHP Test at Memorial Dr., Houston. (Map courtesy of Google Maps)
Slurry is a mixture of bentonite and water to make drilling easy in clay soils. Because of
slurry, the field conditions were really difficult for current penetrometers, but DHP can be easily
handled in slurry conditions with the help of the steel box, which goes into the borehole (Figure
3.8).
DHP tests began with a spring that had 370 lb/in. stiffness. With this spring, the reader
ring didn’t move, meaning that the soil was softer than the capacity of this spring (Figure 3.9).
The spring was replaced with another spring with a stiffness of 290 lb/in. (Figures 3.9 and 3.10).
The spring produced a 1.35 inch deflection, and when the DHP test was repeated with the same
spring a deflection of 1.21 was produced. Springs with a stiffness of 140 lb/in. and 110 lb/in.
were used for other DHP tests (Figures 3.11 and 3.12). Two samples with a 20 in. height and 2.8
in. diameter were obtained for unconfined compression tests (Figures 3.13 and 3.14).
Memorial Dr.
Field Location
Sam Houston Tollway
Loop 610
212121

21
Figure 3.8 The DHP Going into the Borehole Figure 3.9 After the test, changing
the DHP for the Other Test
Figure 3.10 Spring Is Hooked on DHP Figure 3.11 All DHPs Used in the Field Tests
Bore Hole
Kelly Bar DHP
DHP after test
Moved Ring
Spring inside Penetrometer
Head
All Penetrometers, Used during Tests
222222

22
Figure 3.12 Schematic of a DHP after the Field Test
Figure 3.13 Extruding the Soil Samples Figure 3.14 Extruded Sample
Penetrometer Head
Reading Ring
Spring Piston
Protector Plate
Sampler Tube Silty Clay Obtained from I-10 West Field Sample Extruding
Device
Silty Clay Obtained from I-10 West Field
232323

23
c) Location 4 (Houston Field at Goodyear Dr. (B6) (04/20/07))
The field test location was near the intersection of Loop 610 and Highway 225 (Figure
3.15). The soil was stiff clay. In order to prevent the collapse of the borehole during drilling,
slurry was used. Slurry is a mixture of bentonite and water, and nothing can be seen in the
borehole below the level of the slurry. The DHP was lowered through the slurry to perform the
test (Figures 3.16 and 3.17).
Figure 3.15 The Fourth Location of the DHP Test (Lawndale St., Houston).
(Map courtesy of Google Maps)
Figure 3.16 The DHP Being Lowered Figure 3.17 Moved Ring after Test.
into the Borehole
DHP
Kelly Bar
Borehole Casing
DHP after test
Moved Ring
Field Location
Railroad
Loop 610
Highway 225
242424

24
Soil samples were collected from the bottom of the borehole. The extruded samples were
trimmed to a size of 2.5 x 6 inches (Figure 3.18). Unconfined compression tests were performed
using a standard triaxial test machine without confinement (Figure 3.19). The soil sample failed
in shear (Figure 3.20).
Figure 3.18 Trimming Clay Sample Figure 3.19 Clay Sample
before Compression Test.
Figure 3.20 Clay Sample after failure
Clay Sample
Standard Tri – Axial Test Machine
Clay Sample
Wire Saw for Trimming
Shear Failure
252525

25
d) Location 5 (Intersection of I-30 and Loop 12 in Dallas (B7) (09/21/06 – 09/23/06))
The locations of the field tests were at the intersection of I-30 and Loop 12 and have been
designated as B6 (Figures 3.21 and 3.22). Clay shale samples were obtained from these
locations, and compression tests were conducted to obtain undrained shear strength.
Figure 3.21 Location of the DHP Test at the Intersection of I-30 and Loop 12, Dallas.
(Map courtesy of Google Maps)
Figure 3.22 Dallas Field Location and Prepared DHP before Test
DHP are ready to tests
Loop 12 Borehole
Loop 12
I-30 Field
Location
262626

26
e) Location 6 (Dallas Field at Trinity Bridge (B8) (03/14/07 – 03/16/07))
The drilled shafts were being constructed for the reconstruction of Trinity Bridge at
North Hampton, in Dallas (Figure 3.23). Because of the heavy rain on the previous day, the
boreholes were filled with water so the construction was stopped for one day.
Figure 3.23 Location of the DHP Tests, at the Trinity Bridge, Dallas. (Map courtesy of Google Maps)
Drilling began with a washer auger, where the water from the top level was taken away, and
the auger was switched to a drilling auger. The clay shale layer was founded at 17 feet and for
construction purposes, at least 30 foot of shaft was required to be in the clay shale. But, the soil
was harder than expected so they had to use mirrors and ropes to keep the digging aligned to
center, this precaution repeated for every movement of the auger. Two DHP tests were
completed (Figure 3.24), and one sample was collected. After finishing the first borehole, DHP
tests were conducted with the help of the construction crew (Figure 3.25).
Figure 3.24 The DHP after Tests Figure 3.25 DHP Taken Out of the borehole
DHP Coming Out
From Borehole
DHP After Test
Field Location: North Hampton Rd.
I-30
I-45
272727

27
Details of the drilled shafts at the test sites (Houston Field at the intersection of Memorial
Dr. and Beltway 8 and Houston Field at Goodyear Dr., Dallas Field at the intersection of I-30
and Loop 12, Dallas Field at Trinity Bridge) are summarized in Table 3.5.
Table 3.5 Details of Four Boreholes in Which DHP Tests were Conducted
Location Length of Borehole (ft)
Diameter of Borehole (in.)
Soil Description TCP Blow Count
Slurry
B5 54 45 Silty Clay, Reddish Brown
18 (6) 24 (6) Yes
B6 100 60 Silt, Reddish Brown
39 (6) 50 (6) Yes
B7 56 45 Shale, Dark Gray
50 (1) 50 (3) No
B8 53 48 Shale, Dark Gray
50 (4) 50 (4) No
Table 3.6 illustrates the material properties of the clay samples obtained from the four
locations.
Table 3.6 Geotechnical Properties of Natural Clay from Various Boreholes
Location Plastic Limit (%)
Liquid Limit (%) Plasticity Index (%)
Soil Classification
B5 35 69 34 CH B6 19 50 31 CH B7 24 56 32 CH
B8 24 54 30 CH
282828

28
3.4 Correlations
(a) Undrained Shear Strength
The main focus of this study was to investigate the relationship between the undrained
shear strength of soil/soft rock and the deflection obtained from DHP.
Figures 3.26 and 3.27 show the correlations of DHP deflection and undrained shear
strength (Su) of the geomaterials. Because of relatively high, stiffness the Green spring (1800
lb/in) was used for soft rocks and hard soils. Based on the linear regression analysis of the data,
the following correlation was obtained for DHP deflection and undrained shear strength of soil:
su = 54.4 δ (N=15 data) (2)
The coefficient of variation (R2) for this relationship was 0.57.
Figure 3.26 Undrained Shear Strength versus DHP Spring Deflection for Green Spring.
(k=1800 lb/in.)
Green Spring (k=1800 lbs/in)
0102030405060708090
0 0.5 1 1.5
DHP Deflection (inch)
S u (p
si)
Houston I-10 East
Dallas Trinity Bridge
Dallas I30-Loop12
292929

29
The Gold Spring had a stiffness (k) of 1100 lb/in. and was used for clay soils. Based on
the linear regression analysis of the data, the following correlation was obtained for DHP
deflection and undrained shear strength of soil:
Su = 33.2 δ (N=3 data) (3)
The coefficient of variation (R2) for this relationship was 0.91.
Figure 3.27 Undrained Shear Strength versus DHP Ultimate Strength
Gold Spring (k=1100 lb/in.).
0
5
10
15
20
25
30
0 0.2 0.4 0.6 0.8 1
DHP Deflection (inch)
S u (p
si)
Houston Goodyear Dr.
Houston I-10 West
Houston I-10 East
Gold Spring (k=1100 lb/in.)
303030

30
(b) TCP Value
The correlation between Texas Cone Penetrometer and DHP deflection was also
investigated. Field tests performed in the Dallas and Houston areas were used for developing this
relationship. Correlation between TCP blow counts (per 12 in penetration) to DHP deflection,
obtained from the Houston District is shown in Figure 3.28. The relationship was represented
with the following equation with a R2 value of 0.63.
NTCP = 65.5 δ, (N= 4 data) (4)
Figure 3.28 Correlation between DHP Deflection and NTCP (Blows/12 in.)
Both linear and nonlinear correlations between TCP penetration per 100 blows to DHP
deflection obtained from the Dallas District are shown in Figures 3.29 and 3.30 and represented
as follows:
313131

31
NTCP = -3.9 x δ + 10.5 , R2 = 0.42, (N=14 data) (5)
NTCP = 6.6 δ-1.05, R2 = 0.51, (N=14 data) (6)
Figure 3.29 Correlation between DHP Deflection and NTCP (in./100 blows)
Figure 3.30 Correlation between Deflection and NTCP (in./100 blows)
Green Spring (k=1800 lbs/i
Green Spring (k=1800 lb/in.)
Green Spring (k=1800 lb/in.)
323232

32
CHAPTER 4. CONCLUSIONS AND RECOMMENDATIONS
4.1 Conclusions
The main focus of this study was to develop a new penetrometer, Down-Hole
Penetrometer (DHP), for identifying the transition from hard soil to rock and measuring the
ultimate strength of the geomaterials during drilled shaft constructions. DHP can be used to
determine the undrained shear strength of soil from the ring displacement. Also, a correlation
between TCP blow count and DHP spring deflection was developed based on the data collected
from the Houston and Dallas Districts.
Based on the analyses of raw data and average values, the following relationships were
developed for soils in the Houston District and soft rocks in the Dallas District.
a) Correlations of DHP deflections and undrained shear strength
of the soil (28 psi < Su < 71 psi):
Su = 54.4 δ for Green Spring (k=1800 lb/in.) (N=15 data) (1)
b) for the soils with (12 psi < Su < 27 psi):
Su = 33.2 δ for Gold Spring (k=1100 lb/in.) (N=3 data) (2)
c) Least square fit of the data resulted in the following relationship between TCP blow count
and DHP spring deflection (in soil):
δ = 65.5 NTCP , R2 = 0.63 (N=4 data) (3)
d) Linear correlation between TCP penetration per 100 blows to DHP deflection (soft rock):
NTCP = -3.9 x δ + 10.5 , R2 = 0.42, (N=14 data) (4)
e) Nonlinear correlation between TCP penetration per 100 blows to DHP deflection (soft
rock):
NTCP = 6.6 δ-1.05, R2 = 0.51, (N=14 data) (5)
333333

33
4.2 Recommendations
1. Correlations for DHP were developed based on limited testing. The researchers
recommend additional field tests various soils and soft rocks to further improve the
correlations.
343434

35
REFERENCES
Bowles, Joseph E. (2002). “Foundation Engineering.” McGraw-Hill Publisher, New York, NY.
Geotechnical Manual (2000). Texas Department of Transportation, Bridge Division.
Godskesen, O., (1936). “Investigation for the bearing power of the subsoil with 25 by 25 mm
pointed drill weighted with 100 kg without samples.” Proc. Int. Soil Mech. Found. Eng. 1st
Cammridge, 311-314.
Huang, A. B., Fang, C. K., Liao, J. J., and Pan, Y. W. (2002). “Development of a Multiple-
Purpose Borehole Testing Device for Soft Rock.” Geotechnical Testing Journal, Vol. 25(3), 1-7.
Kim, M. S., Jao, M., Puppala, A. J. G., Chang, P., Yin, S., Pannila, I., Delphia, J., and
Vipulanandan, C. (2007). “Characterization the Soft Clays in Texas Gulf Coast Using the Texas
Cone Penetrometer (TCP).” CD Proceedings, New Peaks in Geotechnics, ASCE Geo Institute,
Denver, Colorado.
Kulhawy, F. H. and Mayne, P. W. (1990). “Manual on Estimating Soil Properties on Foundation
Design.” Research Project 1493-6, Final Report, Department of Civil Engineering Cornell
University.
Marcuson, W. F. and Bieganousky, W. A. (1977). “SPT and Relative Density in Coarse Sands.”
Journal of Geotechnical Engineering Division, ASCE, Vol. 103, No. GT11, pp. 1295-1309.
353535

36
Mayne, P. W. and Kemper, J. B. (1984). “Profiling OCR in Stiff Clays by CPT and SPT.”
Geotechnical Testing Journal, ASTM, Vol. 34, No. 4, pp. 139-147.
Mayne, P. W. (1991). “Determination of OCR in Clays Using Piezocone Tests Using Cavity
Expansion and Critical-State Concepts.” Vol. 31 (2), pp. 65-76.
Meigh, A.C. (1987). “Cone Penetration Testing, Methods and Interpretation.” Butterworths
Publications, Boston, Massachusetts.
Meyerhof, G.G. (1956). “Penetration Tests and Bearing Capacity of Cohesionless Soil.” Journal
of Soil Mechanics and Foundations Division, ASCE, Vol. 82, No. SM1, pp. 1-19.
Orchant, C.J., Kulhawy, F.H., and Trautmann, C.H. (1988). “Reliability-Based Foundation
Design for Transmission Line Structures: Critical Evaluation of In-Situ Test Methods.” Report
EL-5507, Vol. 2, Electric Power Research Institute, Palo Alto.
Robertson, P.K. and Campanella, R.G. (1983). “ Interpretation of Cone Penetration Tests – Part
І: Sand,” Can. Geotech. Journal, 20:718-733.
Sanglerat, G. (1972). “The Penetrometer and Soil Exploration.” Elsevier Publishing Co., New
York, 1972.
363636
37
.Vipulanandan, C., Kim, M. S., and Harendra, S. (2007a). “Microstructural and Geotechnical
Properties of Houston-Galveston Area Soft Clays.” CD Proceedings, New Peaks in Geotechnics,
ASCE Geo Institute, Denver, Colorado.
Vipulanandan, C., Guezo, Y. J. A., and Bilgin, O. (2007b). “Geotechnical Properties of Marine
and Deltaic Soft Clays.” CD Proceedings, New Peaks in Geotechnics, ASCE Geo Institute,
Denver, Colorado.
Vipulanandan, C., Puppala, A. J., Jao, M., Kim, M. S., Vasudevan, H., Kumar, P., and Mo, Y.
L. (2007). “Correlation of Texas Cone Penetrometer Test Values and Shear Strength of Texas
Soils.” Final Research Report 0-4862., Texas Department of Transportation, Austin, Texas
(http://cigmat.cive.uh.edu).
373737

383838