Development and Testing of a Turning Process Monitoring ...
16
Journal of Mechanical Engineering Vol 18(3), 147-162, 2021 __________________ ISSN 1823-5514, eISSN 2550-164X © 2021 College of Engineering, Universiti Teknologi MARA (UiTM), Malaysia. Received for review: 2021-03-15 Accepted for publication: 2021-05-06 Published: 2021-09-15 Development and Testing of a Turning Process Monitoring System using Acoustic Emission Keiichi Ninomiya*, Shun Yoshida, Kenji Okita, Toshihiko Koga Polytechnic University, Japan *[email protected] Shuzo Oshima Miyazaki Polytechnic Center, Japan ABSTRACT Studies on in-process measurement have suggested techniques for sensing tool wear and machine status in a machining center and turning center, for example by measuring cutting resistance. However, there appear to be no reports of effective uses of machine sensing in practical machine tools, perhaps due to problems such as limitations on the number and density of sensors and the possibility that attaching sensors may affect machine rigidity and thus processing quality. The purpose of this research is to develop a system that can monitor the state of the cutting process and maintain it in a normal or optimal state at all times, based on the acoustic emission (AE) method. To realize the development of such a system, it is very important to evaluate the tool wear qualitatively and quantitatively. This report describes a tool wear experiment that collected AE signals, cutting force data, and high-speed camera images during metal turning. The collected basic data are comprehensively evaluated and examined to determine the effectiveness of in- process measurement by the AE method. The results suggest that evaluating various AE parameters obtained from the AE original waveform is an effective parameter for monitoring tool wear and cutting conditions that affect product quality. The findings from the basic data obtained in this study were found to be useful information for the practical application of in-process measurement by the AE method using machine learning methods. Keywords: In-process Measurement; Turning processes; Tool wear; Cutting phenomena; Acoustic Emission
Transcript of Development and Testing of a Turning Process Monitoring ...

Journal of Mechanical Engineering Vol 18(3), 147-162, 2021
__________________ ISSN 1823-5514, eISSN 2550-164X © 2021 College of Engineering, Universiti Teknologi MARA (UiTM), Malaysia.
Received for review: 2021-03-15 Accepted for publication: 2021-05-06
Published: 2021-09-15
Development and Testing of a Turning Process Monitoring System
using Acoustic Emission
Keiichi Ninomiya*, Shun Yoshida, Kenji Okita, Toshihiko Koga Polytechnic University, Japan
Shuzo Oshima Miyazaki Polytechnic Center, Japan
ABSTRACT
Studies on in-process measurement have suggested techniques for sensing tool wear and machine status in a machining center and turning center, for example by measuring cutting resistance. However, there appear to be no reports of effective uses of machine sensing in practical machine tools, perhaps due to problems such as limitations on the number and density of sensors and the possibility that attaching sensors may affect machine rigidity and thus processing quality. The purpose of this research is to develop a system that can monitor the state of the cutting process and maintain it in a normal or optimal state at all times, based on the acoustic emission (AE) method. To realize the development of such a system, it is very important to evaluate the tool wear qualitatively and quantitatively. This report describes a tool wear experiment that collected AE signals, cutting force data, and high-speed camera images during metal turning. The collected basic data are comprehensively evaluated and examined to determine the effectiveness of in-process measurement by the AE method. The results suggest that evaluating various AE parameters obtained from the AE original waveform is an effective parameter for monitoring tool wear and cutting conditions that affect product quality. The findings from the basic data obtained in this study were found to be useful information for the practical application of in-process measurement by the AE method using machine learning methods. Keywords: In-process Measurement; Turning processes; Tool wear; Cutting phenomena; Acoustic Emission
Keiichi Ninomiya*, Shun Yoshida, Kenji Okita, Toshihiko Koga, Shuzo Oshima
148
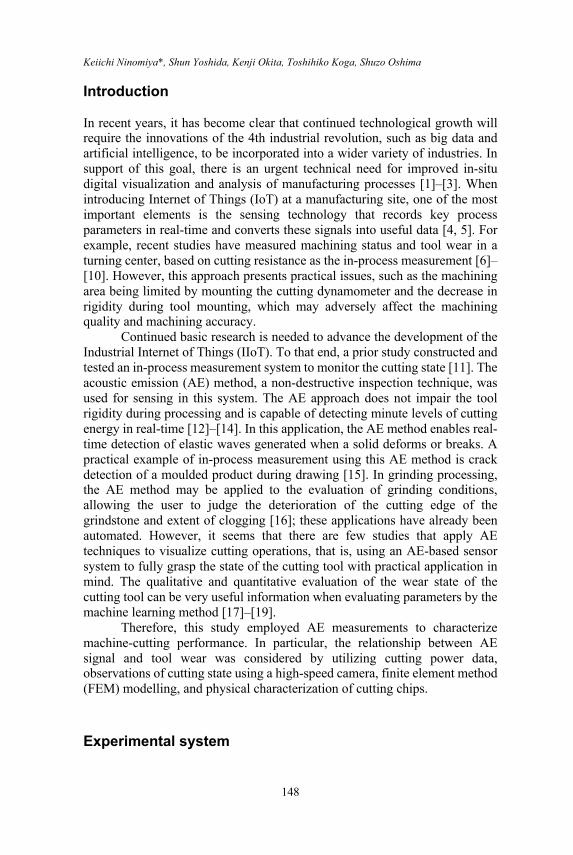
Introduction In recent years, it has become clear that continued technological growth will require the innovations of the 4th industrial revolution, such as big data and artificial intelligence, to be incorporated into a wider variety of industries. In support of this goal, there is an urgent technical need for improved in-situ digital visualization and analysis of manufacturing processes [1]–[3]. When introducing Internet of Things (IoT) at a manufacturing site, one of the most important elements is the sensing technology that records key process parameters in real-time and converts these signals into useful data [4, 5]. For example, recent studies have measured machining status and tool wear in a turning center, based on cutting resistance as the in-process measurement [6]–[10]. However, this approach presents practical issues, such as the machining area being limited by mounting the cutting dynamometer and the decrease in rigidity during tool mounting, which may adversely affect the machining quality and machining accuracy.
Continued basic research is needed to advance the development of the Industrial Internet of Things (IIoT). To that end, a prior study constructed and tested an in-process measurement system to monitor the cutting state [11]. The acoustic emission (AE) method, a non-destructive inspection technique, was used for sensing in this system. The AE approach does not impair the tool rigidity during processing and is capable of detecting minute levels of cutting energy in real-time [12]–[14]. In this application, the AE method enables real-time detection of elastic waves generated when a solid deforms or breaks. A practical example of in-process measurement using this AE method is crack detection of a moulded product during drawing [15]. In grinding processing, the AE method may be applied to the evaluation of grinding conditions, allowing the user to judge the deterioration of the cutting edge of the grindstone and extent of clogging [16]; these applications have already been automated. However, it seems that there are few studies that apply AE techniques to visualize cutting operations, that is, using an AE-based sensor system to fully grasp the state of the cutting tool with practical application in mind. The qualitative and quantitative evaluation of the wear state of the cutting tool can be very useful information when evaluating parameters by the machine learning method [17]–[19].
Therefore, this study employed AE measurements to characterize machine-cutting performance. In particular, the relationship between AE signal and tool wear was considered by utilizing cutting power data, observations of cutting state using a high-speed camera, finite element method (FEM) modelling, and physical characterization of cutting chips. Experimental system

Development and Testing of a Turning Process Monitoring System Using Acoustic Emission
149
Figure 1 shows the system used for the experiment. The system is designed to acquire cutting power measurements, AE signals, high-speed camera images, and various basic chip data during turning. A semi-automatic lathe (TAC360, Takisawa Co., Ltd.) that can maintain constant cutting speed was used as the machine tool. Cutting power was measured with a multi-component dynamometer (model 9257A, Kistler Co., Ltd.). The dynamometer signal was amplified by a multi-channel charge amplifier (model 5070A).
A wide-band type AE sensor (AE-900S-WB, NF Circuit Design Block Co., Ltd.) with low resonance was used for the AE measurements. The signal from the AE sensor was passed through the preamplifier and the discriminator (models 9917 and AE-9922S respectively); the processed AE signal and the envelope signal were recorded on a PC. The time constant of the envelope signal was 0.1 msec. The sampling frequency was 8 MHz, and signals were processed with a total gain of 20 dB using a high-pass filter of 50 kHz. In the experimental apparatus, the optimal mounting position of the AE sensor is generally considered to be near the processing point. However, when installing the AE sensor near the tool edge, it is necessary to lengthen the tool protrusion due to chip disposal problems and structural issues with the dynamometer. Therefore, in this experiment, the AE sensor was installed behind the shank as shown in Figure 1. In addition, a calibration experiment using a mechanical pencil (based on the NDIS 2110 standard) has confirmed that there is no difference in the output signal level between when it is installed near the cutting edge and when it is installed behind the tool shank.
Figure 1: Experiment system. Figure 2 illustrates the mounting method between the AE sensor and
the tool shank. The AE sensor was shielded against off-axis noise with
Workpiece
Cutting tool
Cutting force measurement
AE sensor
Preamp(Overall Gain:20dB)(HPF:50kHz)
Recorder
High-speed camera
Cutting tool
Workpiece
Discriminator

Keiichi Ninomiya*, Shun Yoshida, Kenji Okita, Toshihiko Koga, Shuzo Oshima
150
insulating tape, then inserted into the sensor jig, and mechanically fixed with screws from the rear of the AE sensor via an elastic material. Petroleum jelly was applied as a contact medium between the AE sensor and the tool shank.
In addition, for the purpose of observing the chip evacuation state, images were taken from above the work material with two high-speed cameras (models VW-9000 and VW-Z2, Keyence Co, Ltd.). The frame rate was set to 2000 fps considering the maximum spindle rotation speed during the experiment. To evaluate the work material after processing, the surface roughness was measured using a Surfpak-SV instrument (Mitutoyo CO., Ltd.), and surface gloss was measured with a mirror-TRI-gloss universal gloss meter (BYK-Gardner Co., Ltd.). The glossiness was measured according to JIS Z 8741:1997 with an incident angle of θ = 85 °, and the measurement direction was the feed direction of the cutting tool.
Figure 2: Structural diagram of AE sensor mounting.
Experimental Method and FEM Analysis Table 1 shows the main experimental conditions. The work material was C45 structural carbon steel. An insert tip with a corner radius of 0.03 mm was selected to reduce the effect of the contact arc length of the nose radius on the cutting depth. The machining method employed dry cutting and outer diameter finishing. The cutting conditions were determined within the recommended condition range of the insert tip. The cutting conditions were as follows: cutting speed 200 m/min, feed rate 0.01 mm/rev, and cutting depth 0.15 mm. The minimum feed rate of the machine tool was 0.01 mm/rev because the corner radius of the insert tip used was small.
Figure 3 shows the relationship between flank wear VB and boundary wear VBN during cutting. Here, flank wear is defined as the length from the non-wearing position of the main cutting edge to the wear bottom, excluding boundary wear. In this experiment, in which the flank wear was applied by artificial polishing, it was difficult to reproduce the frictional state with the
Target of measurement
Screw
AE sensor
Sensor jig
Contact medium
Insulating tape
Elastic rubber

Development and Testing of a Turning Process Monitoring System Using Acoustic Emission
151
actual cutting surface on the flank. Therefore, the flank wear produced by the cutting work was measured over long-term cutting. To determine flank wear VB, 11 types of worn tools were prepared in advance within the range of 0 to 200 µm with reference to the tool life judgment standard JIS B 4011:1971 for precision light cutting. These 11 cases correspond to the points in Figure 3.
Table 1: Cutting conditions
Insert
DCGT 11T3003R-FX Tool material Cermet Rake angle [ ° ] 15 Clearance angle [ ° ] 7 Corner radius [mm] 0.03
Work material Carbon steel (C45) Cutting speed Vc [m/min] 200 Feed rate f [mm/rev] 0.01 Depth of cut ap [mm] 0.15 Coolant Dry
Figure 3: Relation between flank wear width and boundary wear over the range of cutting time.
Figure 4 shows the relationship between the maximum height roughness RZ and glossiness GS (85°) for a range of cutting times. Note that the values obtained after a cutting time of 12 min are excluded from the figure because these data cannot be guaranteed to conform to the measurement
Flan
k w
earVB
[µm
]
Bou
ndar
y w
earVB N
[µm
]
0
20
40
60
80
100
120
140
160
180
200
0
20
40
60
80
100
120
140
160
180
200
0 5 10 15 20 25 30 35 40
Flank wear VB
Boundary wear VBN
Initialwear Steady-State wear Late stage of
Steady-State wear
Cutting time [min]

Keiichi Ninomiya*, Shun Yoshida, Kenji Okita, Toshihiko Koga, Shuzo Oshima
152
standard (i.e., relative to the specular glossiness at a specified incident angle θ on a glass surface with a refractive index of 1.567, with the reflectance being 100%) [20]. From the results in Figure 4, it is clear that the maximum height roughness and gloss are significantly inferior at the cutting time of 17 min.
Therefore, from the viewpoint of the change in the inclination of the tool wear curve and the finished surface (that is, the product quality), the cutting time can be divided into three segments in this experiment: from 0 to 6 min was the initial wear region, from 6 to 17 min was the initial stage of the steady wear region, and the remainder was the steady wear region. Each stage is labelled in Figures 3 and Figure 4 [21, 22].
Figure 4: Relation between maximum height roughness RZ and glossiness GS (85°) over the range of cutting time.
Next, FEM analysis was performed to clarify the source of the AE
signal during tool wear. AdvantEdge FEM Ver. 7.0 (Third Wave System CO., Ltd.) software was used as the analysis solver. In this analysis, a two-dimensional cutting model was created as a plane strain problem, and the analysis results of strain rate were obtained [23]. The tool model follows Table 1. The cutting conditions consisted of a cutting speed of 200 m/min, a feed rate of 0.05 mm/rev, and a cutting depth of 0.1 mm. Table 2 shows the analysis conditions and the physical property values determined. In addition, the database in the analysis package was used for physical property values relating to the tool and the work material. Since the analysis element is re-meshing in
Max
imum
hei
ght R
Z[µ
m]
Glo
ssin
ess GS
(85゚
)[%
]
0
10
20
30
40
0
1
2
3
4
5
0 5 10 15 20 25 30 35 40
Late stage of Steady-State wear
Initialwear
Steady-State wear
Maximum height RZGlossiness GS (85!)
Cutting time [min]

Development and Testing of a Turning Process Monitoring System Using Acoustic Emission
153
the workpiece being analyzed, it was automatically divided with the minimum mesh size set to 0.0071 mm.
Table 2: Material properties and simulation conditions
Tensile strength [MPa] 1 027 Yield strength [MPa] 612 Hardness [HB] 305 Maximum number of nodes 24 000
Maximum element size [mm] Tool 0.1 Work material 0.1
Minimum element size [mm] Tool 0.01 Work material 0.0071
Experimental Results and Discussion Table 3 presents representative types of AE signals that were frequently detected during different phases of the experiment, along with images taken by the high-speed camera. The symbols (a), (b), and (c) in the table correspond to the points as labelled in Figure 5.
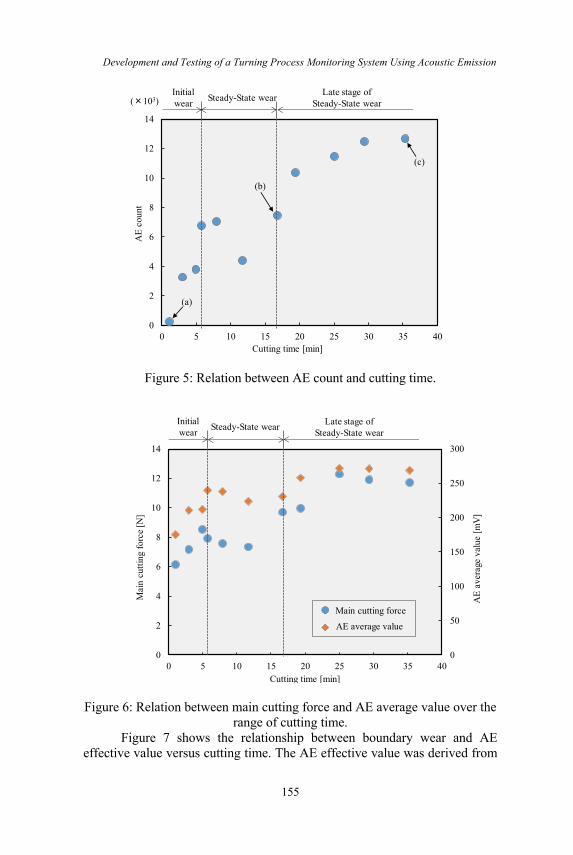
Figure 5 shows the relationship between cutting time and AE count. Here, the AE count is the number of signals that exceeded the amplitude threshold value of 0.3 mV, which was assumed to be the stable AE signal level during cutting. From the results in Table 3 and Figure 5, it can be seen that the amplitude of the AE signal and the AE count tended to increase as the tool wear progressed. In the initial wear area, due to the effect of the tip former, the chips are ejected toward the cutting direction side, though they are chips with a small curl radius and a flow type as shown in part (a) of the table. As a result, the amplitude and the number of counts is stages of the steady wear area, the chip curl radius gradually increased as shown in part (b) of the table, and the frequency with which the chips interfered with the shank also increased. As a result, although the amplitude of the AE waveform became larger than that in the initial wear region, it is considered that the number of counts was partly reduced because the chips were appropriately divided, and a large fluctuation was not seen overall. Furthermore, as the effect of the tip former diminished in the latter part of the steady wear region, the curl radius became larger, as shown in part (c) of the table. As a result, the number of counts is considered to increase because the chips were less likely to be divided and the frequency of observing the chips becoming entangled with the tool increased [24]. Here, the sources of AE signals in turning reported by Xiaoli Li [25] are the continuous signals of AE is associated with shearing in the primary zone and wear on the tool face and flank, and the burst signal or excess signal of AE is

Keiichi Ninomiya*, Shun Yoshida, Kenji Okita, Toshihiko Koga, Shuzo Oshima
154
the result from either tool fracture or chip breakage. Consistent with the report. Therefore, it is considered that the amplitude of the AE signal and the AE count can be effective indicators for diagnosing the state of chip discharge, that is, the abnormal state during cutting, such as chip entanglement in the tool.
Figure 6 shows the relationship between the main cutting force and the AE average value during the cutting time. Here, the AE average value was derived from the envelope waveform. The signal evaluation was performed at a position 2 mm from the tool’s initial cutting position, which has high data reproducibility. From the results, it can be seen that both the main cutting force and the AE average value decreased in the early stage of the steady wear region and tended to increase in the initial wear region and the latter stage of the steady wear region. This is because, especially in the initial stage of the steady wear area, the effective rake angle changed as the tool wear progressed, resulting in a larger shear angle, that is, an optimum shear angle can be obtained. As a result, the main component force and the AE average value tended to decrease. The correlation coefficient between the two is 0.88, indicating a strong positive correlation. Generally, one of the evaluation methods for tool wear is the evaluation of the dynamic component of cutting resistance [26, 27]. Therefore, it is considered that the AE average value, which shows a tendency similar to the cutting resistance, can be an effective parameter for performing the in-process measurement.
Table 3: AE waveform and cutting image for each wear area
Symbols in the
Figure 5 (a) (b) (c)
Wear state (Cutting time)
Initial wear (1min)
Steady-State wear (17min)
Late-stage of Steady-State wear
(36min)
AE source characterization
Cutting state (High-speed
camera 2000fps)
Development and Testing of a Turning Process Monitoring System Using Acoustic Emission
155
Figure 5: Relation between AE count and cutting time.
Figure 6: Relation between main cutting force and AE average value over the range of cutting time.
Figure 7 shows the relationship between boundary wear and AE effective value versus cutting time. The AE effective value was derived from
AE
coun
t
0
2
4
6
8
10
12
14
0 5 10 15 20 25 30 35 40
Initialwear Steady-State wear Late stage of
Steady-State wear
Cutting time [min]
(×103)
(c)
(b)
(a)
0
50
100
150
200
250
300
0
2
4
6
8
10
12
14
0 5 10 15 20 25 30 35 40
AE average value
Main cutting force
Mai
n cu
tting
forc
e[N
]
AE
aver
age
valu
e[m
V]
Initialwear Steady-State wear Late stage of
Steady-State wear
Cutting time [min]

Keiichi Ninomiya*, Shun Yoshida, Kenji Okita, Toshihiko Koga, Shuzo Oshima
156
the envelope waveform and was used to evaluate the AE average value. In this analysis, the AE effective value is used as one of the AE parameters indicating the signal magnitude, similar to the AE average value. On the other hand, since the AE effective value is calculated using the root mean square of the waveform, the two values were both used in the present study to indicate statistical data variability. From the results, it can be seen that the AE effective value greatly increased in the initial wear region, had a slightly decreasing tendency in the initial stage of the steady wear region, and again tended to increase in the latter period of the steady wear region. This is due to the changes in the cutting angle and the state of chip evacuation due to the changes in shear angle with the progress of tool wear. In the latter part of the steady wear region, it is probable that the flank wear, especially that of the boundary of the front flank and the corner radius, have greatly progressed because the cutting finish surface in Figure 4 is inferior. Therefore, it is conceivable that a large compressive force or a shear force acts between the flank and the chip to increase the AE effective value in the latter part of the steady wear region. In other words, as a result of its size predominantly expanding from the tip of the cutting edge to the plastic region below the flank, the work-affected layer on the finished surface appears to have had an effect [28]. Since the AE effective value has a strong positive correlation with the main cutting force (correlation coefficient 0.89), this value can be a useful index in terms of product quality. Iwamoto et al. [29] have been reported that the area of flank wear land is associated with static and dynamic components of cutting force, and the area of rake wear land can be associated with the AE effective value. The experimental results are consistent with this report.
Figure 8 shows the FEM analysis results of modelling the strain rates over a 2-D plain centered on the cutting tool. Model results for 0, 15, and 30 min of machining are given in the figure. The cutting distance was set to 10 mm, which is a sufficient distance to reach the steady machining state. The analytical results qualitatively agree with those obtained by the experiment, confirming that the principal component force increases with the progress of tool wear. From the strain rate distributions shown in Figure 8, the strain rate accompanying the progress of tool wear appears strongly in the vicinity of the tooltip (Figure 8(a)). On the other hand, Figure 8(b) shows that the contact length between the flank and the work material becomes longer over time so that the range expands to the plastic region below the flank and the secondary plastic region. Figure 8(c) suggests that the distribution range of each strain rate further expands, and the magnitude becomes stronger over 30 min of processing. Therefore, it was found that the AE source is the main shear region in the early stage of tool wear. Furthermore, it was found that as the tool wear progressed, it expanded to the secondary plastic region and the plastic region below the flank, and the size became dominant [30].

Development and Testing of a Turning Process Monitoring System Using Acoustic Emission
157
Figure 7: Relation between AE effective value and boundary wear in cutting time.
Figure 8: Distribution of strain rate. Figure 9 shows an example of the results of FFT analysis from the AE
signal. In Figure 9(a), the cutting time is 1 min, and in Figure 9(b), the cutting time is 36 min. Both figures are shown focusing on the frequency band 500-1000 kHz.
Bou
ndar
y w
ear[
µm]
AE
effe
ctiv
e va
lue
[mV
]
0
20
40
60
80
100
120
140
0
50
100
150
200
250
300
0 10 20 30 40
AE effective value
Boundary wear
Initialwear Steady-State wear
Late stage of Steady-State wear
Cutting time [min]
[mm]
[mm](a) Cutting Time 0min
0.3
0.2
9.9 10.0
[mm]
[mm](b) Cutting Time 15min
0.3
0.2
9.9 10.0
[mm]
[mm](c) Cutting Time 30min
0.3
0.2
9.9 10.0
Strain Rate[/s]30 000
90 000
150 000
Tool
Chips
Work material
Secondary plasticity zone
Clear plane lower plasticity zone
Main shear zone

Keiichi Ninomiya*, Shun Yoshida, Kenji Okita, Toshihiko Koga, Shuzo Oshima
158
Figure 10 shows images of the tip of the tool edge and of chips taken with a digital microscope at a cutting time of 36 min. Figure 10(a) shows an image of the rake face at the tip of the tool edge (photograph magnification is 500 x), and Figure 10(b) shows an image of chips on the tool rake face side (magnification 1000 x).
From the results in Figure 9, the amplitude of the frequency spectrum increased as the tool wear progressed. This occurs for two reasons: a) as seen in Figure 10, transfer marks due to the flow of chips can be observed between the tool and the chips due to the progress of tool wear; and b) from the result of FEM analysis, the AE source changes from the main shear zone to the secondary plasticity zone. Since friction and wear extend to the next plastic region and the plastic region below the flank, the influence of chip friction and wear on the rake face predominantly changes in this frequency band [11]. This is consistent with the findings reported by Takuma et al. [31] that the frequency range and wear conditions corresponding to the wear phenomenon can be grasped by wavelet analysis. Therefore, monitoring the frequency band above 500 kHz appears to be effective for understanding the transition of tool wear while performing the in-process measurement.
Figure 9: AE waveform FFT analysis result. (Frequency 500~1000 kHz).
AE frequency [kHz] AE frequency [kHz](a) Cutting time 1min (b) Cutting time 36min
0.5
0.4
0.3
0.2
0.1
0500 600 700 800 900 1000
0.5
0.4
0.3
0.2
0.1
0500 600 700 800 900 1000
Linearspectrum[mV]
Linearspectrum[mV]

Development and Testing of a Turning Process Monitoring System Using Acoustic Emission
159
Figure 10: Insert cutting edge and chip image (cutting time 36 min).
Conclusions In this study, a tool wear experiment was conducted to support the development of in-process measurement applied to turning operations. In the experiment, we collected basic data using an AE sensor, a cutting dynamometer, and a high-speed camera. From the experimental results, the following findings were obtained regarding the possibility of in-process measurement of tool wear using the AE method.
Firstly, the magnitude of the amplitude of the AE original waveform and the AE count is effective for monitoring the state of chip evacuation during tool wear, that is, detecting abnormal conditions such as chip entanglement in the tool.
Secondly, the AE mean value and the main component force have a strong positive correlation, as do the AE effective value and the boundary wear. Therefore, it was found that the AE average value and AE effective value can be effective parameters to monitor the state of the cut surface, that is, the product quality, when performing the in-process measurement.
Lastly, from the results of FEM analysis and FFT analysis, the frequency spectrum due to the progress of tool wear shows that the influence of friction and wear due to the flow of chips on the rake face between the tool and the chips changes its behaviour in the frequency band around 500 kHz. Therefore, it was found that monitoring the frequency band above 500 kHz is effective for characterizing the transition of tool wear.
Therefore, it was suggested that a detailed analysis of the AE waveform pattern and parameter over each frequency band may be effective for in-process measurement.
(b) Chip rake face side(a) Insert cutting edge rake face
100µm ×500 50µm ×1000
Transfer marks
Keiichi Ninomiya*, Shun Yoshida, Kenji Okita, Toshihiko Koga, Shuzo Oshima
160
References [1] Ray Y. Zhonga, Lihui Wangb and Xun Xu, “An IoT-enabled Real-time
Machine Status Monitoring Approach for Cloud Manufacturing,” Procedia CIRP, vol. 63, pp. 709 – 714, 2017.
[2] Y. Nishioka, “Connected Systems for Connected Factories. -Academic Frontier with a New Systems Theory-,” Journal of the Japan Society for Precision Engineering, vol. 83, no. 1, pp. 17 – 20, 2017.
[3] Ray Y Zhong, Xun Xu and Lihui Wang, “IoT-enabled Smart Factory Visibility and Traceability using Laser-scanners,” Procedia Manufacturing, vol. 10, pp. 1 – 14, 2017.
[4] Xingzheng Chen, Congbo Li, Ying Tang, Li Li and Qinge Xiao, “A framework for energy monitoring of machining workshops based on IoT,” Procedia CIRP, vol. 72, pp. 1386 – 1391, 2018.
[5] D. Mourtzis, E. Vlachou and N. Milas, “Industrial Big Data as a result of IoT adoption in Manufacturing,” Procedia CIRP, vol. 55, pp. 290 – 295, 2016.
[6] Jun Huang, Duc Truong Pham, Chunqian Ji and Zude Zhou, “Smart Cutting Tool Integrated With Optical Fiber Sensors for Cutting Force Measurement in Turning,” IEEE Transactions on Instrumentation and Measurement, vol. 69, no. 4, pp. 1720 – 1727, 2020.
[7] I. Nishida, M. Tatekawa, R. Sato and K. Shirase, “Cutting trouble detection system based on quantitative comparison between predicted and measured cutting torques. (1st report Cutting trouble detection for tool wear.),” Transactions of the JSME, vol. 84, no. 857, pp. 17-00433, 2018.
[8] X. Y. Zhang, X. Lu, S. Wang, W. Wang and W.D. Li, “A multi-sensor based online tool condition monitoring system for milling process,” Procedia CIRP, vol. 72, pp. 1136 – 1141, 2018.
[9] Franci Čuš-Uroš and Župerl, “Real-Time Cutting Tool Condition Monitoring in Milling,” Journal of Mechanical Engineering, vol. 57, no. 2, pp. 142 – 150, 2011.
[10] Ahmed Aly Diaa Sarhan, A. Matsubara, M. Sugihara, H. Saraie, S. Ibaraki and Y. Kakino, “Monitoring Method of Cutting Force by Using Additional Spindle Sensors,” JSME International Journal Series C, vol. 49, no. 2, pp. 307 – 315, 2006.
[11] K. Ninomiya, Y. Matumoto, T. Koga and M. Wada, “Development of In-process Measuring System for Turning Process Using Acoustic Emission Method. (1st Report, Experimental Study on Elucidation of Mechanism of Cutting Phenomena),” journal of Japan Society for Design Engineering, vol. 54, no. 10, pp. 669 – 680, 2019.
[12] T. Koga, A. Hase, K. Ninomiya, M. Wada and K. Konishi, “Experimental Study on Monitoring of Cutting Process by Acoustic Emission Method. -Tool Wear Detection in End Milling of Stainless Steel-,” Japanese Society of Tribologists, vol. 63, no. 7, pp. 487 – 498, 2018.

Development and Testing of a Turning Process Monitoring System Using Acoustic Emission
161
[13] T. Koga, A. Hase, K. Ninomiya, M. Wada, H. Mishina and K. Konishi, “Proposal and Evaluation of On-machine Measurement System for Square End Milling in Machining Center by Acoustic Emission Technique,” Journal of the Japan Society for Precision Engineering, vol. 83, no. 11, pp. 1025 – 1032, 2017.
[14] Vadim A. Pechenin, Alexander I. Khaimovich, Alexsandr I. Kondratiev and Michael A. Bolotov, “Method of controlling cutting tool wear based on signal analysis of acoustic emission for milling,” Procedia Engineering, vol. 176, pp. 246 – 252, 2017.
[15] R. Kakinoki, Y. Segawa, Y. Marumo, Y. Imamura, T. Nonaka and Y. Sakata, “Evaluation of Wrinkling States Using In-Process Ultrasonic Examination during Sheet Metal Forming,” Materials Transactions, vol. 59, no. 5, pp. 799 – 804, 2018.
[16] T. Sawa, Y. Ikuse, K. Unno, T. Odaki, S. Tomita, N. Morita and S. Toe, “Relationship between the Grinding Conditions in Constant Cutting Grinding of Fine-Ceramics and AE Wave. (1st Report) -Formulation of the Amplitude of AE Wave-,” Journal of the Japan Society for Precision Engineering, vol. 77, no. 9, pp. 878 – 882, 2011.
[17] M. Kaladhar, “Parametric Optimization and Modeling for Flank Wear of TiSiNTiAlN Nanolaminate Cutting Insert,” Journal of Mechanical Engineering, vol. 17, no. 3, pp. 69 – 84, 2020.
[18] Emiliano Traini, Giulia Bruno, Gianluca D’Antonio and Franco Lombardi, “Machine Learning Framework for Predictive Maintenance in Milling,” IFAC, vol. 52, no. 13, pp. 177 – 182, 2019.
[19] Vishal S. Sharma, S. K. Sharma and Ajay K. Sharma, “Cutting tool wear estimation for turning,” Journal of Intelligent Manufacturing, vol. 19, no. 1, pp. 99 – 108, 2007.
[20] M. Yonehara, “Quantitative Evaluation Method of Texture Using Surface Texture Parameters,” Journal of the Japan Society for Precision Engineering, vol. 82, no. 11, pp. 944 – 947, 2016.
[21] R. Serra and W. Rmili, “Experimental Evaluation of Flank Wear in Dry Turning from Accelerometer Data,” International Journal of Acoustics and Vibration, vol. 21, no. 1, pp. 50 – 58, 2016.
[22] R. Hood, S. L. Soo, D. K. Aspinwall and A. L. Mantle, “Tool life and workpiece surface integrity when turning an RR1000 nickel-based superalloy,” The International Journal of Advanced Manufacturing Technology, vol. 98, pp. 2461 – 2468, 2018.
[23] Mehmet Erdi Korkmaz, Mustafa Günay, “Finite Element Modelling of Cutting Forces and Power Consumption in Turning of AISI420 Martensitic Stainless Steel,” Arabian Journal for Science and Engineering, vol. 43, pp. 4863 – 4870, 2018.
[24] A. Hase, M. Wada, T. Koga and H. Mishina, “The relationship between acoustic emission signals and cutting phenomena in turning process,”

Keiichi Ninomiya*, Shun Yoshida, Kenji Okita, Toshihiko Koga, Shuzo Oshima
162
The International Journal of Advanced Manufacturing Technology, vol. 70, pp. 947 – 955, 2014.
[25] Xiaoli Li, “A brief review: acoustic emission method for tool wear monitoring during turning,” International Journal of Machine Tools & Manufacture, vol. 42, pp. 157 – 165, 2002.
[26] Xu Chuangwen, Dou Jianming, Chai Yuzhen, Li Huaiyuan, Shi Zhicheng and Xu Jing, “The relationships between cutting parameters, tool wear, cutting force and vibration,” Advances in Mechanical Engineering, vol. 10, no. 1, pp. 1 – 14, 2018.
[27] E. García Plaza and P.J. Núñez López, “Analysis of cutting force signals by wavelet packet transform for surface roughness monitoring in CNC turning,” Mechanical Systems and Signal Processing, vol. 98, pp. 634 – 651, 2018.
[28] Mourad Bendifallah, Mourad Brioua and Abderrahim Belloufi, “Cutting Tool Life And Its Effect On Surface Roughness When Turning With WC-6% CO,” International Journal of Modern Manufacturing Technologies, vol. 12, no. 2, pp. 7 – 16, 2020.
[29] R. Iwamoto, E. Kondo, S. Yoshidome, K. Ichiki, N. Kawagoishi, “Monitoring of Tool Wear of Single Crystal Diamond Tool in Ultra-Precision Cutting of Aluminum Alloy (1st Report) -Consideration of Effective Parameters in Indirect Method for Monitoring of Tool Wear-,” Japan Society of Precision Engineering, vol. 75, no. 6, pp. 757 – 761, 2009.
[30] Mohammad Lotfi, Saeid Amini and Mohsen Aghaei, “Tool Wear Prediction and Surface Improvement in Vibration Cutting,” Tribology Transactions, vol. 61, no. 3, pp. 414 – 423, 2018.
[31] M. Takuma, N. Shinke, T. Nishiura and S. Okamoto, “Evaluation of Wear Conditions with AE Method (1st Report, Application of Wavelet Transform Results),” Transactions of the Japan Society of Mechanical Engineers. A, vol. 70, no. 694, pp. 802 – 809, 2004.