Development and pilot testing of a questionnaire to assess ...
28
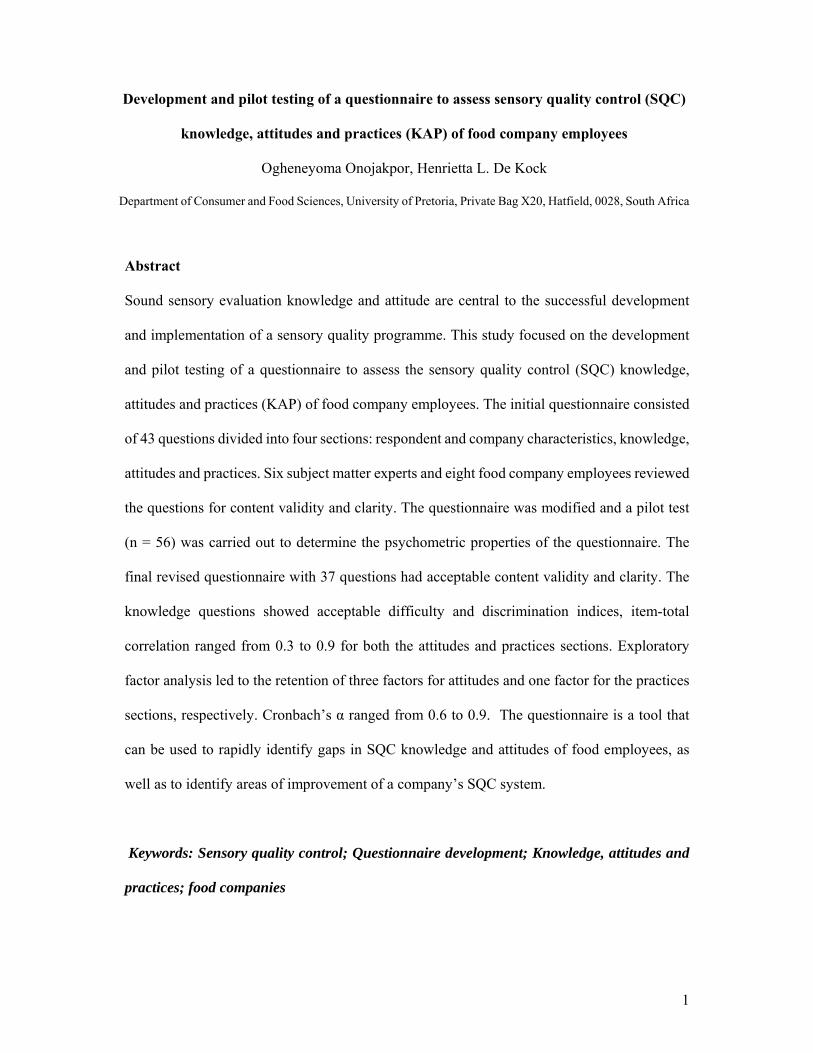
1 Development and pilot testing of a questionnaire to assess sensory quality control (SQC) knowledge, attitudes and practices (KAP) of food company employees Ogheneyoma Onojakpor, Henrietta L. De Kock Department of Consumer and Food Sciences, University of Pretoria, Private Bag X20, Hatfield, 0028, South Africa Abstract Sound sensory evaluation knowledge and attitude are central to the successful development and implementation of a sensory quality programme. This study focused on the development and pilot testing of a questionnaire to assess the sensory quality control (SQC) knowledge, attitudes and practices (KAP) of food company employees. The initial questionnaire consisted of 43 questions divided into four sections: respondent and company characteristics, knowledge, attitudes and practices. Six subject matter experts and eight food company employees reviewed the questions for content validity and clarity. The questionnaire was modified and a pilot test (n = 56) was carried out to determine the psychometric properties of the questionnaire. The final revised questionnaire with 37 questions had acceptable content validity and clarity. The knowledge questions showed acceptable difficulty and discrimination indices, item-total correlation ranged from 0.3 to 0.9 for both the attitudes and practices sections. Exploratory factor analysis led to the retention of three factors for attitudes and one factor for the practices sections, respectively. Cronbach’s α ranged from 0.6 to 0.9. The questionnaire is a tool that can be used to rapidly identify gaps in SQC knowledge and attitudes of food employees, as well as to identify areas of improvement of a company’s SQC system. Keywords: Sensory quality control; Questionnaire development; Knowledge, attitudes and practices; food companies
Transcript of Development and pilot testing of a questionnaire to assess ...
1
Development and pilot testing of a questionnaire to assess sensory quality control (SQC)
knowledge, attitudes and practices (KAP) of food company employees
Ogheneyoma Onojakpor, Henrietta L. De Kock
Department of Consumer and Food Sciences, University of Pretoria, Private Bag X20, Hatfield, 0028, South Africa
Abstract
Sound sensory evaluation knowledge and attitude are central to the successful development
and implementation of a sensory quality programme. This study focused on the development
and pilot testing of a questionnaire to assess the sensory quality control (SQC) knowledge,
attitudes and practices (KAP) of food company employees. The initial questionnaire consisted
of 43 questions divided into four sections: respondent and company characteristics, knowledge,
attitudes and practices. Six subject matter experts and eight food company employees reviewed
the questions for content validity and clarity. The questionnaire was modified and a pilot test
(n = 56) was carried out to determine the psychometric properties of the questionnaire. The
final revised questionnaire with 37 questions had acceptable content validity and clarity. The
knowledge questions showed acceptable difficulty and discrimination indices, item-total
correlation ranged from 0.3 to 0.9 for both the attitudes and practices sections. Exploratory
factor analysis led to the retention of three factors for attitudes and one factor for the practices
sections, respectively. Cronbach’s α ranged from 0.6 to 0.9. The questionnaire is a tool that
can be used to rapidly identify gaps in SQC knowledge and attitudes of food employees, as
well as to identify areas of improvement of a company’s SQC system.
Keywords: Sensory quality control; Questionnaire development; Knowledge, attitudes and
practices; food companies
2
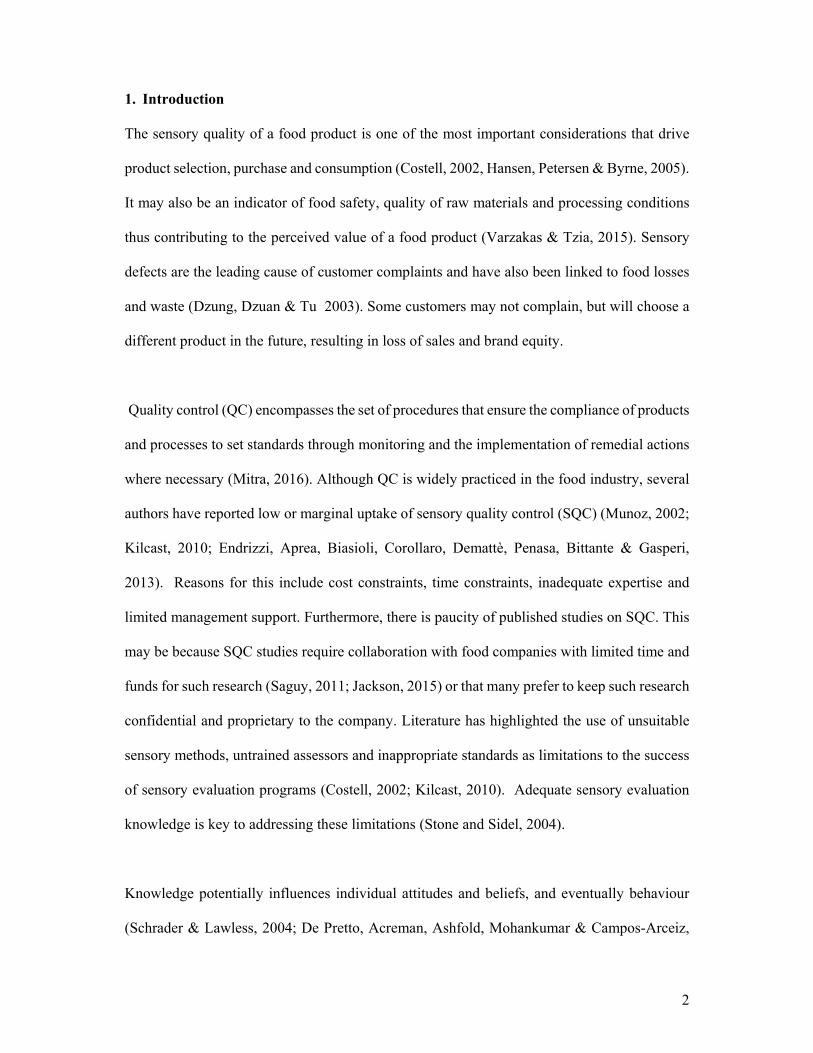
1. Introduction
The sensory quality of a food product is one of the most important considerations that drive
product selection, purchase and consumption (Costell, 2002, Hansen, Petersen & Byrne, 2005).
It may also be an indicator of food safety, quality of raw materials and processing conditions
thus contributing to the perceived value of a food product (Varzakas & Tzia, 2015). Sensory
defects are the leading cause of customer complaints and have also been linked to food losses
and waste (Dzung, Dzuan & Tu 2003). Some customers may not complain, but will choose a
different product in the future, resulting in loss of sales and brand equity.
Quality control (QC) encompasses the set of procedures that ensure the compliance of products
and processes to set standards through monitoring and the implementation of remedial actions
where necessary (Mitra, 2016). Although QC is widely practiced in the food industry, several
authors have reported low or marginal uptake of sensory quality control (SQC) (Munoz, 2002;
Kilcast, 2010; Endrizzi, Aprea, Biasioli, Corollaro, Demattè, Penasa, Bittante & Gasperi,
2013). Reasons for this include cost constraints, time constraints, inadequate expertise and
limited management support. Furthermore, there is paucity of published studies on SQC. This
may be because SQC studies require collaboration with food companies with limited time and
funds for such research (Saguy, 2011; Jackson, 2015) or that many prefer to keep such research
confidential and proprietary to the company. Literature has highlighted the use of unsuitable
sensory methods, untrained assessors and inappropriate standards as limitations to the success
of sensory evaluation programs (Costell, 2002; Kilcast, 2010). Adequate sensory evaluation
knowledge is key to addressing these limitations (Stone and Sidel, 2004).
Knowledge potentially influences individual attitudes and beliefs, and eventually behaviour
(Schrader & Lawless, 2004; De Pretto, Acreman, Ashfold, Mohankumar & Campos-Arceiz,

3
2015). It facilitates deductive reasoning and thus helps to acquire further information (Schrader
& Lawless, 2004). Quantitative knowledge, attitude and practices (KAP) data can be cost-
effectively collected at multiple locations simultaneously using questionnaires. The findings
could unveil weaknesses and strengths of processes and can facilitate optimization strategies
(Schrader & Lawless, 2004; Launiala, 2009). Pilot testing of questionnaires is necessary to
ensure that the data to be collected will be relevant, accurate and reproducible (Hair, Anderson,
Babin & Black, 2010; Jones, Lamp, Neelon, Nicholson, Schneider, Swanson & Zidenberg-
Cherr, 2015). Both the validity (accuracy of the questionnaire) and the reliability (consistency
of the measurements obtained) need to be ascertained (Singh, 2017). Three types of validity
tests are typically considered: content, construct and criterion validity (Rubio, Berg-Weger,
Tebb, Lee, & Rauch, 2003; Sarmugam, Worsley & Flood, 2014; Singh, 2017). Content
validation reflects the extent to which the questions are representative of the construct/subject
of interest and construct validity relates to the degree to which the test measures the theoretical
construct of interest. Criterion validity evaluates the relationship between performance on the
test and another related established criterion (the gold standard) (Rubio et al., 2003; Boateng,
Neilands, Frongillo, Melgar-Quiñonez and Young, 2018). Reliability is commonly assessed as
the Cronbach’s α coefficient, which is a measure of the relatedness of the questions (Tavakol
and Dennick, 2011; Cho and Kim, 2015).
Most KAP studies collect self-reported employee data, as employees are the possessors of
organizational knowledge (Birasnav, 2014). Employees should also report on organizational
culture and practices, as these influence employee attitude and the application of knowledge
(Doorewaard and Benschop, 2003; Ansari-Lari, Soodbakhsh & Lakzadeh, 2009). Furthermore,
some practices (e.g. SQC) are implemented at the organizational level and thus do not depend
solely on the knowledge of the employee.

4
While several valid and reliable food safety and nutrition KAP instruments exist, none could
be found for SQC. The only study found was a survey carried out by the Sensory Evaluation
Division (SED) of the Institute of Food Technologists in 2001 and 2002 reported by Stone and
Sidel (2004). The SED online survey focused on the ‘function of sensory within a company’,
evaluating the sensory methods used but did not cover the minimal requirements for sensory
evaluation programmes. The questionnaire was neither validated nor its development
documented. The aim of this study was to develop and pilot test a tool to assess SQC related
KAP in food companies. The questionnaire could be used to evaluate the sensory evaluation
KAP of food company employees, highlighting gaps and providing baseline information for
interventions around improvement in SQC. External organisations may also use the level of
compliance of the company to good sensory evaluation practices to evaluate its commitment
to product sensory quality.
2. Methods
2.1. Ethical Approval
The ethics committee of the University of Pretoria approved the study (EC 180000041). All
respondents provided consent. No remuneration was provided for respondents other than an
entry to a draw to win a sensory evaluation textbook. The questionnaire was pilot tested in
three studies (Figure 1). Data were collected in English.

5
Figure 1. Development and pilot testing of a questionnaire to assess sensory quality control (SQC)
knowledge, attitudes and practices (KAP) of food company employees
CVI = content validation index; ICC = Intra-class correlation coefficient DI = difficulty index; DC =
discrimination index
Study 2- Evaluation of the clarity of the questions
Food industry employees n=8 5 questions not clear (Rated not clear >
70%)
Development of the initial questionnaire (Table S1)
Final questionnaire (S2)
Study 3- Pilot testing of the questionnaire Food industry employees n=56
3 K questions too easy (DI > 0.9), No K question too difficult (DI < 0.1) 6 K questions with limited ability to discriminate high vs low Ktotal scorers (DC < 0.2)
Exploratory factor analysis of K, A and P pilot test results
Study 1- Content validation of questionnaire Subject experts n=6
3 questions not relevant (CVI< 0.8) Comments and recommendations for
improvement
• Respondent & company characteristics (C)‐ 12 questions • Knowledge (K)‐ 15 questions
• Attitudes (A)‐ 8 questions • Practices (P)‐ 8 questions
• 1 C question deleted (6), 2 C questions rephrased (3, 4) • 4 K questions rephrased (5, 10, 11, 12)
• 4 A questions rephrased (3, 6, 7, 8) • 3 P questions rephrased (3, 6, 7)
• C‐ 11 questions • K‐ 11 questions • A‐ 7 questions • P‐ 8 questions
• 2 C questions rephrased (4, 11) • 4 K questions deleted (7, 13, 14, 15), 3 K questions rephrased (1, 3, 6) • 1 A question deleted (1), 3 A questions rephrased (5, 6, 7) • 2 P questions rephrased (2, 3)

6
2.2. Initial questionnaire
The self-administered questionnaire was developed from published scientific literature, other
questionnaires and books on sensory evaluation and psychometrics. The initial questionnaire
(Table S1) consisted of 43 questions which are divided into four sections: respondents and
company characteristics, knowledge, attitudes and practices.
2.2.1. Respondents and company characteristics section
Selected characteristics of the respondents and their employers such as their main job function,
sensory evaluation related job functions, the size of the company, the number of products
manufactured, company location etc. were collected using 12 multiple choice questions. These
questions (C1- C12) are shown in Table S1. The options for company size were based on the
number of employees as per the World Trade Organisation definitions (WTO, 2016).
2.2.2. Knowledge section
This consisted of 15 questions with three response options: ‘yes’, ‘no’ and ‘I don’t know’. The
‘I don’t know’ option was added to differentiate incorrect knowledge from lack of knowledge
and to decrease the probability of a respondent opting for the right answer by chance (Agüeria,
Terni, Baldovino & Civit, 2018). The knowledge section covered sensory science topics such
as senses/sensory physiology, sensory methods, good sensory practices, statistics and SQC
(Table S1).
2.2.3. Attitudes Section
The attitude of respondents and their perceptions of their company’s disposition towards SQC
were measured with eight questions (Table S1). Respondents rated their level of agreement to
six attitude statements (A1 to A6) using a five-point Likert scale (1 = strongly disagree to 5 =

7
strongly agree) and for two questions (A7 and A8) ranked the level of importance of various
statements from least to most important.
2.2.4. Practices Section
The respondents’ perceptions of the compliance of their company with good SQC practices
were assessed using eight multiple-choice questions (Table S1). The three answer options
covered a range of practices with varying compliance to good practice regarding sensory
evaluation and SQC (Stone and Sidel, 2004 and Lawless and Heymann, 2010). Practices
assessed included the standards used, nature of panellists, test location and the frequency of
product evaluations.
2.3. Study 1- Content validation
As shown in Figure 1, the initial questionnaire (43 questions) was content validated by six
sensory evaluation experts, three academics, two industry scientists and one consultant. Three
of the experts had over ten years and the other three between five and ten years of experience.
The experts individually rated whether or not each of the questions was relevant to the research
issue under investigation using a five-point Likert scale (1 = strongly disagree to 5 = for
strongly agree). The content validity index (CVI) of each question was calculated as the ratio
of the number of experts that gave a relevance rating >3 (k) to the total number of experts,
therefore . A question was considered relevant if CVI > 0.8 (Rubio et al., 2003; Dos Santos,
Riner & Henriques, 2019). The experts were also asked to make recommendations for
improving the questionnaire.
The reliability of the expert ratings was computed as the Intra-class correlation coefficient
(ICC) consistency measure derived from a 2-way mixed effects ANOVA model (IBM SPSS
8
version 25). Reliability (ICC values) was categorized as poor (<0.50), moderate (0.50 to 0.75),
good (0.76 to 0.90) or excellent (>0.90) (Rubio et al., 2003: Koo & Li, 2016).
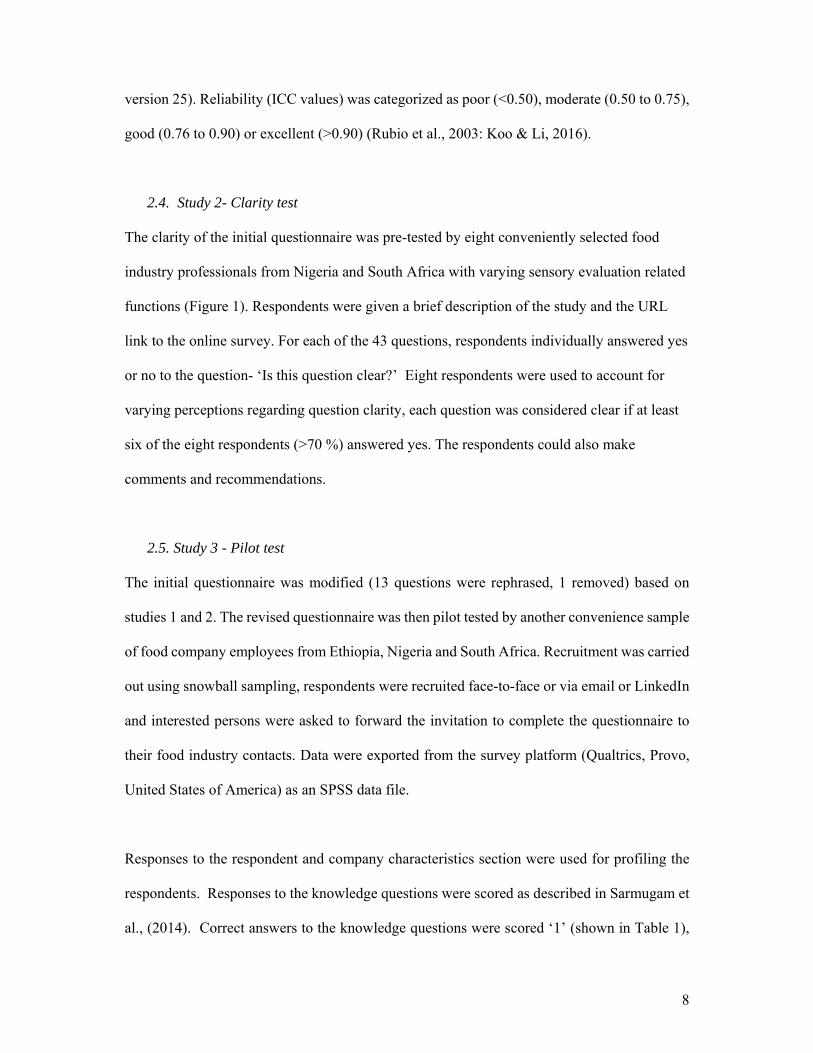
2.4. Study 2- Clarity test
The clarity of the initial questionnaire was pre-tested by eight conveniently selected food
industry professionals from Nigeria and South Africa with varying sensory evaluation related
functions (Figure 1). Respondents were given a brief description of the study and the URL
link to the online survey. For each of the 43 questions, respondents individually answered yes
or no to the question- ‘Is this question clear?’ Eight respondents were used to account for
varying perceptions regarding question clarity, each question was considered clear if at least
six of the eight respondents (>70 %) answered yes. The respondents could also make
comments and recommendations.
2.5. Study 3 - Pilot test
The initial questionnaire was modified (13 questions were rephrased, 1 removed) based on
studies 1 and 2. The revised questionnaire was then pilot tested by another convenience sample
of food company employees from Ethiopia, Nigeria and South Africa. Recruitment was carried
out using snowball sampling, respondents were recruited face-to-face or via email or LinkedIn
and interested persons were asked to forward the invitation to complete the questionnaire to
their food industry contacts. Data were exported from the survey platform (Qualtrics, Provo,
United States of America) as an SPSS data file.
Responses to the respondent and company characteristics section were used for profiling the
respondents. Responses to the knowledge questions were scored as described in Sarmugam et
al., (2014). Correct answers to the knowledge questions were scored ‘1’ (shown in Table 1),

9
while ‘I don’t know’ and wrong answers were scored ‘0’. Answers to the attitude questions
(A1 to A6) were scored 1-5 (strongly disagree - strongly agree), the scores were reversed for
A1 and A3 as they were negatively phrased. Answers to the practices questions were scored
Table 1. Knowledge (K) questions difficulty level and ability to discriminate between low and high Ktotal scorers in the pilot test (study 3, n = 56 respondents)
No. Question
Response options: Yes, No, I don’t know Correct answer
Difficulty index (DI) (0.1-0.9)
Discrimination index (DC)
(≥0.2)
K1 Can you smell food while it is in your mouth? Yes 0.70 0.64
K2 Is umami one of the basic tastes? Yes 0.25 0.64
K3 Can product feel be judged with the eyes? Yes 0.64 0.36
K4 Should you judge product flavour if you have a cold/flu? No 0.89 0.14
K5 Is palate cleansing (e.g. rinsing mouth with water) a good
sensory practice? Yes 0.89 0.21
K6 Should food tasters know the allergens in the food they will be
tasting? Yes 0.88 0.14
K7 Is the order of presenting samples important during sensory
tests? Yes 0.93 0.07
K8 Is a triangle test a sensory discrimination method? Yes 0.43 0.57
K9 Should preference questions be asked during descriptive
sensory tests? No 0.20 0.36
K10 Is a one tailed alternative hypothesis suitable for analysing the
results of a triangle test? Yes 0.16 0.29
K11 Is a t-test used for analysing sensory differences between
more than two products? No 0.11 0.29
K12 Should people without sensory evaluation training be used for
sensory quality control tests? No 0.68 0.43
K13 Are consumer preference tests suitable for sensory quality
control? No 0.13 0.07
K14 Does ingredient quality contribute to the sensory quality of the
finished food product? Yes 1.00 0.00
K15 Does preparation conditions contribute to the sensory quality
of the finished food product? Yes 0.98 0.07
DI = the proportion of respondents who answered correctly over the total n, criteria for acceptance 0.1 to 0.9
DC = proportion of respondents ‘correct’ high Ktotal scorers group (upper 25th percentile) minus low Ktotal scorers group (the
lower 25th percentile), a value ≥ 0.2 considered acceptable (Chen, Soo, Ab Rahman, Rostenberghe & Harith, 2013).

10
1-3, except for question P6 (what materials/ products are assessed as part of sensory quality
control in your food company?) where a score of ‘1’ was awarded for each of the options
selecting raw materials, in-process materials or finished goods and ‘0’ for samples from
product development. The sum of scores for knowledge and practices sections were used to
determine the total scores (Ktotal and Ptotal). For the attitude section, Atotal is the sum of scores
for questions A1 to A6.The performance of respondents on the different sections were
categorized as poor <50%, good (50% – 74%) and very good ≥75%. All statistical analyses
were performed using IBM SPSS version 25, unless stated otherwise.
The difficulty indexes (DI) of the knowledge questions were determined as the proportion of
respondents who answered correctly, the criteria for acceptance was 0.1 to 0.9 (Whati, Senekal,
Steyn, Nel, Lombard and Norris, 2005; Underhill-Blazey, Stopfer, Chittenden, Nayak, Lansang
Lederman, Garber & Gundersen,.2019). The discrimination indexes (DC) of the knowledge
questions were determined by subtracting the proportion of respondents who answered
correctly in the low Ktotal scorers group (the lower 25th percentile) from that of the high Ktotal
scorers group (upper 25th percentile) (Boateng et al., 2018), a value ≥ 0.2 was considered
acceptable (Chen, Soo, Ab Rahman, Rostenberghe & Harith, 2013).
Construct validity was assessed by comparing the Ktotal scores of respondents with sensory
evaluation related functions and those without and also respondents with prior awareness of
sensory evaluation and those without using the Mann-Whitney U test (Sarmugam et al., 2014).
It was expected that the former groups in both pairs would score higher on the knowledge
section. Respondents were segmented based on their responses to the questions ‘Have you
heard about sensory evaluation prior to this study?’ (C10 in Table S1) and ‘Which of the
following sensory related functions are you involved in?’ (C12 in Table S1), respectively.

11
Spearman’s rho coefficient was used to evaluate the relationship between Ktotal and Atotal scores
of respondents (Sarmugam et al., 2014).
Construct validity of all sections were evaluated by exploratory factor analysis (EFA) using
the principal axis factoring (PAF) method (Leech, Barrett and Morgan, 2015). The Kaiser
Meyer Olkin measure of sampling adequacy (KMO MSA) and Bartlett’s test of sphericity were
assessed as outputs of the EFA prior to factor retention to test the degree of correlation between
the questions and the sufficiency of the data collected. The benchmarks for acceptability were
>0.5 and < 0.05, respectively (Watson, 2017). The number of factors retained was determined
by multiple criteria: Kaiser’s eigenvalue, scree test, parallel analysis and Velicer’s minimum
average partial (MAP) test (Boateng et al., 2018). The reliability of the retained factors were
computed as Cronbach α and their relatedness as corrected item to total correlations (ITC),
values ≥ 0.70 and ≥ 0.2, respectively, were considered satisfactory (Ducak and Keller, 2016;
Boateng et al., 2018; Taber, 2018).
3. Results and Discussion
3.1. Content validation by experts (Study 1)
The experts considered three questions (C3, C4 and K13) irrelevant to the assessment of the
SQC KAPs as highlighted in Figure 1. K13 was removed while C3 and C4 were retained as
these were deemed important to form a complete profile of respondents’ companies. All other
questions were considered relevant (CVI > 0.80).
The ICC value was 0.954 (excellent), indicating that the ratings for the different questions by
the different experts were very similar. The experts also gave some recommendations such as

12
rephrasing questions C4, K5, K11, A1 and P3 and changing the response options for questions
A7 and A8 from ranking to a rating scale, these were effected.
3.2. Clarity test (Study 2)
Five knowledge questions (K2, K3, K5, K10 and K11) were deemed ‘unclear’ as less than 70%
of respondents rated them as clear (Figure 1). It is possible that different respondents applied
different criteria to determine whether a question was phrased clearly or not. Three questions
(K2, K5 and K11) may have been unclear due to unfamiliar terms, e.g. one respondent stated
for K2 ‘I answered no as I am unfamiliar with the term used’. Comments for K11 were ‘Maybe
include what is meant by a t-test’ and ‘Not everyone in industry working with sensory
evaluation understands statistical terms’. The terms were retained as they were considered
necessary to test advanced level sensory evaluation knowledge. Questions C4, K3, K5, K10,
K11, K12, A6, P6 and P7 were rephrased to improve clarity based on respondents’ rating and
recommendations. A comment by one respondent –‘ Not everyone is privileged to know this’,
led to the deletion of question C6 (Estimate the annual projected/ real gross income of your
company?).
3.3. Pilot test (Study 3)
A total of 71 responses were collected and 56 responses were analysed. Responses were
included if the respondent completed the respondent and company characteristics section and
at least one of the KAP sections. Fifty-one respondents had completed all sections and an
additional five respondents completed the respondent and company characteristics section and
at least one of the KAP sections. Analyses were carried out separately for the different sections.
Most of the responses (n = 61) were collected online via the survey platform Qualtrics, while
10 respondents completed printed copies of the questionnaire. The median online survey

13
completion time was 13 minutes 27 seconds. Most of the respondents (70%) completed the
online survey within 18 minutes; this is longer than the 15 minutes completion time estimated
by the researchers. Two respondents contacted the researchers and complained of difficulty
with moving from one section to the next online. This may have been due to poor internet
connection possibly contributing to the attrition rate, thus, emphasizing the importance of
paper-based surveys (Couper, 2000).
3.3.1. Characteristics of pilot test respondents and their companies
Of the 56 respondents, four (7%) worked for microenterprises (less than 10 employees), 33
(59%) for large food companies (over 250 employees) and 19 (34%) for small and medium
companies. 49 respondents worked in quality or production departments and 7 respondents
worked in marketing or other departments. Eight respondents (12%) had neither heard of
sensory evaluation nor reported that their companies practiced SQC. This number is of
importance as three of these respondents worked in large companies with assumingly access to
funds and expertise to carry out SQC. The respondents also had job roles (two working in
quality assurance and two in production) where SQC are generally considered important
(Lawless and Heymann, 2010). Customer complaints due to unacceptable sensory quality of
products in the last 12 months were reported by 38% (21) of the respondents. The question
related to customer complaints (C11) is important as it might highlight the potential
consequences of an inadequate SQC programme and may indicate the need for improvement
in the management of product sensory quality in companies. Due to the relatively small number
of respondents and convenience sampling procedure, it is not possible nor the intention here to
draw inferences about the larger population. The convenient recruitment strategy applied was
not targeted to include only employees that are directly involved with control of sensory quality

14
in companies, thus, survey results were interpreted with consideration for respondents’ job
roles.
3.3.2. Assessment of SQC knowledge
Eleven of the respondents (20 %) had poor knowledge (Ktotal <50%), 40 (71%) had good
knowledge (Ktotal between 50% and 75%) and five respondents (9%) had excellent knowledge
(Ktotal >75%). The DI of three questions (K7, K14 and K15) were > 0.9 (Table 1), reflecting
that the questions were too easy and therefore not appropriate for testing the knowledge level
of the respondents. The DI of each question is equivalent to its mean. Two questions (K14 and
K15) were related to SQC: ‘Does ingredient quality contribute to the sensory quality of the
finished food product?’ and ‘Does preparation conditions contribute to the sensory quality of
the finished food product?’. This indicates that most respondents understand the contribution
of raw materials and preparation conditions to the sensory quality of the finished product. The
third question (K7) was related to good sensory evaluation practices: ‘Is the order of presenting
samples important during sensory tests?’. No question had a DI < 0.1, so none was too difficult.
However, the DI of five questions (K2, K9. K10, K11 and K13) (Table 1) were below 0.3
indicating substantial difficulty. Both K10 and K11 relate to the use of statistics to analyse
sensory data and K9 and K13 relate to sensory methods in quality control indicating potential
knowledge gaps in these areas as previously reported by Costell (2002) and Stone and Sidel
(2004).
Six questions (K4, K6, K7, K13, K14, K15) (Table 1) had DC < 0.2 indicating a limited ability
to discriminate between high and low Ktotal scorers (Dickson-Spillmann, Siegrist & Keller,
2011; Jones et al., 2015). The determination of the DC is useful in question selection during

15
questionnaire development. Questions with both DC and DI values that do not fall within the
acceptable ranges were removed from the questionnaire, thus, K7, K14 and K15 were deleted.
As expected, respondents who had heard of sensory evaluation prior to this study had higher
Ktotal scores (p = 0.04) than those that were unaware of the discipline (Table 2). Those familiar
with sensory evaluation may have had relevant training and/or experience. Contrary to
expectation, respondents with sensory evaluation related functions did not score higher (p =
0.24) than those without involvement in such functions. The respondents who were not
involved in sensory evaluation related functions at the time, may have also received sensory
evaluation training or served such functions at some other stage.
\
Table 2. Comparison of total knowledge questions scores (Ktotal) of respondent groups (study 3 pilot
testing n=56 respondents) with different awareness of and involvement with sensory evaluation
Group n Median U-value
Prior awareness of sensory evaluation (C10)
Yes 48 9 0.04
No 8 6
Involvement in sensory evaluation related functions (C12)
Yes 48 9 0.24
No 8 6
Preliminary assessment of the knowledge section to test its suitability for EFA revealed
unacceptable KMO MSA of 0.444 and Bartlett’s test of sphericity of 0.236, therefore factor
analysis was not pursued further. These measures indicate a limited degree of correlation
between the questions and limitations regarding the sufficiency of the data collected. This
outcome is comparable to previous questionnaire development studies on nutrition knowledge
where factor analysis was not carried out (Dickson-Spillmann et al., 2011; Sarmugam et al.,
2014 and Jones et al., 2015). However, the authors did not give reasons for their decisions. The
low KMO MSA indicates the need to include more subject related questions and/or a larger
sample of respondents (Hair et al., 2010) to improve the correlation between questions and
16
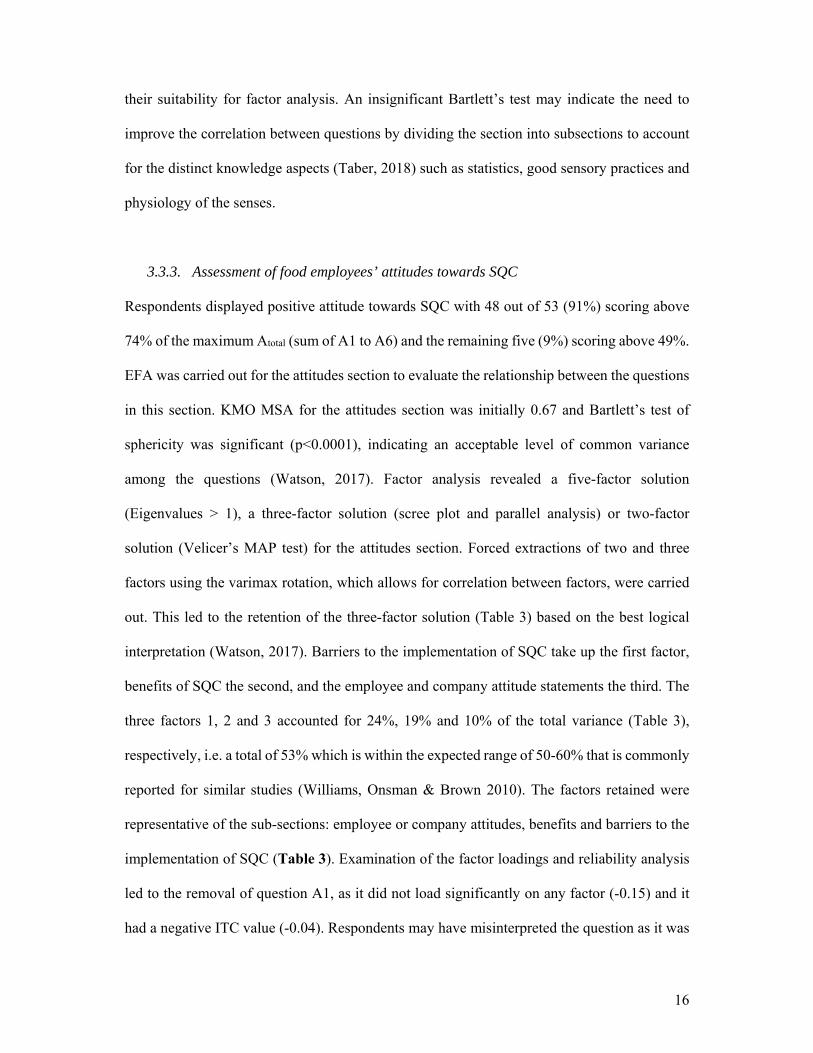
their suitability for factor analysis. An insignificant Bartlett’s test may indicate the need to
improve the correlation between questions by dividing the section into subsections to account
for the distinct knowledge aspects (Taber, 2018) such as statistics, good sensory practices and
physiology of the senses.
3.3.3. Assessment of food employees’ attitudes towards SQC
Respondents displayed positive attitude towards SQC with 48 out of 53 (91%) scoring above
74% of the maximum Atotal (sum of A1 to A6) and the remaining five (9%) scoring above 49%.
EFA was carried out for the attitudes section to evaluate the relationship between the questions
in this section. KMO MSA for the attitudes section was initially 0.67 and Bartlett’s test of
sphericity was significant (p<0.0001), indicating an acceptable level of common variance
among the questions (Watson, 2017). Factor analysis revealed a five-factor solution
(Eigenvalues > 1), a three-factor solution (scree plot and parallel analysis) or two-factor
solution (Velicer’s MAP test) for the attitudes section. Forced extractions of two and three
factors using the varimax rotation, which allows for correlation between factors, were carried
out. This led to the retention of the three-factor solution (Table 3) based on the best logical
interpretation (Watson, 2017). Barriers to the implementation of SQC take up the first factor,
benefits of SQC the second, and the employee and company attitude statements the third. The
three factors 1, 2 and 3 accounted for 24%, 19% and 10% of the total variance (Table 3),
respectively, i.e. a total of 53% which is within the expected range of 50-60% that is commonly
reported for similar studies (Williams, Onsman & Brown 2010). The factors retained were
representative of the sub-sections: employee or company attitudes, benefits and barriers to the
implementation of SQC (Table 3). Examination of the factor loadings and reliability analysis
led to the removal of question A1, as it did not load significantly on any factor (-0.15) and it
had a negative ITC value (-0.04). Respondents may have misinterpreted the question as it was

17
the first for this section and it was reverse worded. After the deletion of question A1 the KMO
MSA increased to 0.69, indicating better correlation between the questions (Watson, 2017).
Cronbach’s α for the sub-categories barriers and benefits of the implementation of SQC were
0.81 and 0.82 respectively (Table 3). These indicate good inter-relatedness between the
questions in each sub-category. The values also suggest a substantial contribution of each
question to the total section performance and the absence of or a low degree of measurement
errors (Tavakol and Dennick, 2011; Taber, 2018). The values are similar to the internal
consistencies observed in the development of the nutrition KAP questionnaire by Chen et al.
(2013). The Cronbach’s α coefficient for the employee/company attitudes sub-scale was 0.62.
This indicates a lesser common variance among the questions compared to the other two sub-
categories. It may also be an indication of the complexity of the questions due to their focus on
both personal and corporate attitudes (Table 3). Further improvement of these questions is
desirable to better assess employee/ company attitudes.
There was a statistically insignificant correlation (r = 0.08, p = 0.28) between the Ktotal and
Atotal scores. The lack of a significant correlation may be because the attitudes section assessed
both the respondent and their company while the knowledge questions focused on the
respondent. Several authors (Munoz 2002; Findlay, 2002; Kilcast, 2010) have discussed the
importance of management support in the successful implementation of SQC, howbeit not
frequently discussed is the role of employee support and motivation. There may be some
resistance to change from employees during the introduction of a new system or optimization
of an existing one, some employees may consider SQC as additional work. Thus, it was
important to consider attitude on both fronts: the company and the employees.

18
Table 3. Exploratory factor analysis (EFA) and internal consistency (Cronbach’s alpha) of the attitudes
(A) questions in the pilot test (study 3)
No Question Response options:
Median Factors
(Loadings >0.3)Item-total correlation
Strongly disagree to Strongly agree (1-5) 1 2 3 (>0.2)
A1 Taste and appearance are not important to consumer acceptance of food product
5 -0.15 -0.04
A2 I know the sensory attributes important for consumer acceptance of my company’s products
4 0.37 0.32
A3 Maintaining product sensory quality is not part of my job responsibility
5 0.31 0.38 0.40
A4 I have a clear role in maintaining consistent product sensory quality
4 0.63 0.57
A5 My company believes that consumer satisfaction depends on consistent sensory quality
4 0.47 0.34
A6 My company provides the tools (equipment, procedures etc.) needed to make products of consistent sensory quality
4 0.34 0.27
A7 These are common benefits of the implementation of a sensory quality control programme. Please select their level of importance to your company from 1=not important to 5=extremely important
A7_1 Reduce customer complaints 5 0.73 0.68
A7_2 Increase sales 5 0.58 0.38
A7_3 Improve product sensory quality 5 0.57 0.43 0.60
A7_4 Reduce waste 4 0.72 0.66
A7_5 Encourage employees to take responsibility for product quality
5 0.78 0.70
A8 These are common barriers to the implementation of a sensory quality control programme. Please select their level of importance in your company from 1=not important to 5=extremely important
A8_1 Low sensory expertise 4 0.63 0.59
A8_2 Consumes too much time 3 0.70 0.39 0.51
A8_3 Too expensive 3 0.57 0.50
A8_4 Not enough facilities 4 0.66 -0.33 0.64
A8_5 Low company management interest 4 0.72 0.63
A8_6 Low employee interest 3 0.67 0.61
% Variance accounted for 24 19 10
Cronbach α 0.81 0.82 0.62

19
3.3.4. Assessment of SQC practices
Of the 47 respondents who reported that their company implemented SQC, four respondents
(9%) reported marginal practices (Ptotal < 50%), 12 (26%) reported good practices (Ptotal
between 50 and 75%) and 31 (66%) reported very good practices (Ptotal >75%). Seventy-nine
% of respondents reported that finished products were evaluated while 38% reported evaluating
raw materials and 30% evaluating in-process materials as part of SQC (P6). Thirty eight
percent of respondents indicated that product samples from product development were assessed
as part of SQC in the company. For this group of respondents it is clear that more emphasis is
placed on finished product testing than raw material and in-process testing. Munoz (2002),
more than a decade ago, recommended to reduce over-reliance on end-product testing by
implementing SQC at the ingredient and in-process level. For some products, sensory quality
defects in finished goods may be reduced or prevented by adopting raw materials and/or in-
process SQC testing. This strategy may also reduce consumer dissatisfaction and wastage
associated with finished product sensory quality defects.
The relationships between knowledge or attitudes and practices were not explored further as
the questionnaire assessed the practices of the food company, and this is not necessarily
dependent on the knowledge or attitude of the employees. The positive attitude and practices
reported in this study may have been exaggerated by the mostly unidirectional nature of the
questions in both sections. Future efforts to balance the direction of the questions will be useful
to address this bias.
EFA of the practices section revealed one factor (Eigenvalue of 5.59) which accounted for a
total variance of 73% (Table 4). All questions loaded unto the one factor with good to excellent
factor loadings ranging from 0.61 to 0.95 (Table 4). The KMO MSA was 0.91 indicating good
20
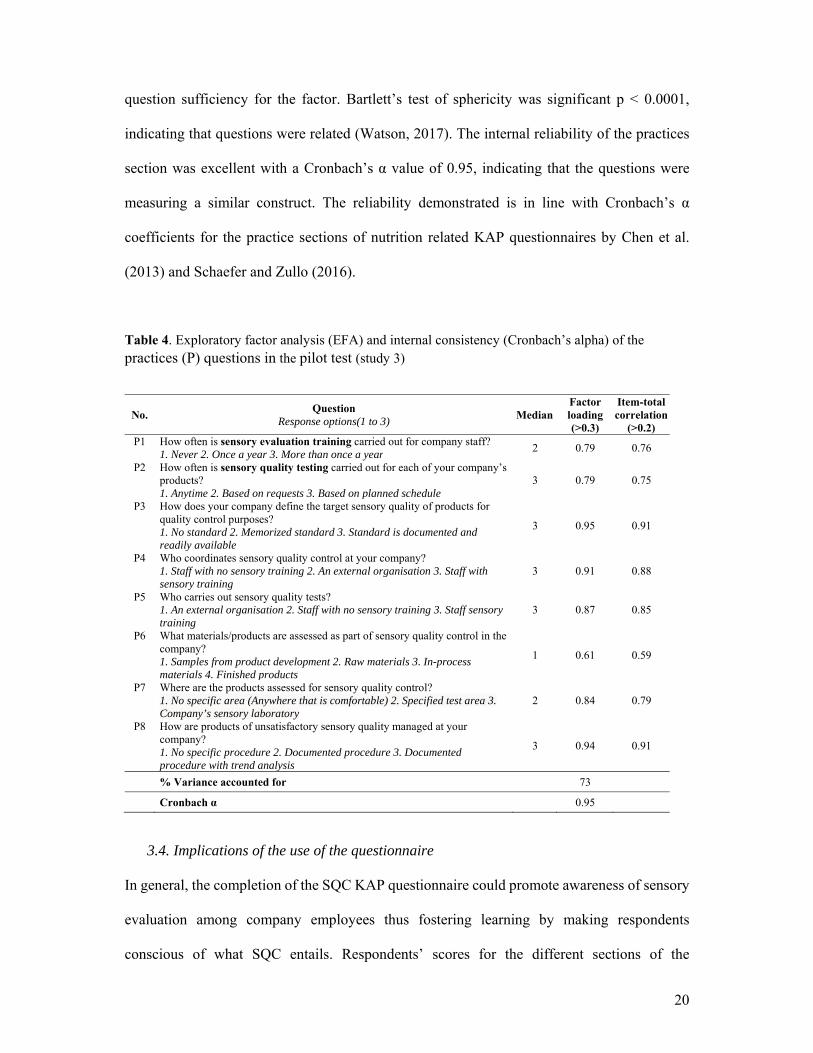
question sufficiency for the factor. Bartlett’s test of sphericity was significant p < 0.0001,
indicating that questions were related (Watson, 2017). The internal reliability of the practices
section was excellent with a Cronbach’s α value of 0.95, indicating that the questions were
measuring a similar construct. The reliability demonstrated is in line with Cronbach’s α
coefficients for the practice sections of nutrition related KAP questionnaires by Chen et al.
(2013) and Schaefer and Zullo (2016).
Table 4. Exploratory factor analysis (EFA) and internal consistency (Cronbach’s alpha) of the practices (P) questions in the pilot test (study 3)
No. Question
Response options(1 to 3) Median
Factor loading (>0.3)
Item-total correlation
(>0.2) P1 How often is sensory evaluation training carried out for company staff?
1. Never 2. Once a year 3. More than once a year2 0.79 0.76
P2 How often is sensory quality testing carried out for each of your company’s products? 1. Anytime 2. Based on requests 3. Based on planned schedule
3 0.79 0.75
P3 How does your company define the target sensory quality of products for quality control purposes? 1. No standard 2. Memorized standard 3. Standard is documented and readily available
3 0.95 0.91
P4 Who coordinates sensory quality control at your company? 1. Staff with no sensory training 2. An external organisation 3. Staff with sensory training
3 0.91 0.88
P5 Who carries out sensory quality tests? 1. An external organisation 2. Staff with no sensory training 3. Staff sensory training
3 0.87 0.85
P6 What materials/products are assessed as part of sensory quality control in the company? 1. Samples from product development 2. Raw materials 3. In-process materials 4. Finished products
1 0.61 0.59
P7 Where are the products assessed for sensory quality control? 1. No specific area (Anywhere that is comfortable) 2. Specified test area 3. Company’s sensory laboratory
2 0.84 0.79
P8 How are products of unsatisfactory sensory quality managed at your company? 1. No specific procedure 2. Documented procedure 3. Documented procedure with trend analysis
3 0.94 0.91
% Variance accounted for 73
Cronbach α 0.95
3.4. Implications of the use of the questionnaire
In general, the completion of the SQC KAP questionnaire could promote awareness of sensory
evaluation among company employees thus fostering learning by making respondents
conscious of what SQC entails. Respondents’ scores for the different sections of the

21
questionnaire could be used to assess performance levels and to identify areas of non-
conformance, training needs or attention to facilities and systems. For example, an anonymous
respondent (R36) in the pilot survey scored Ktotal = 46%, Atotal =77% and Ptotal =42%,
respectively. The low score areas indicate the need for training of the employee and
improvement of the SQC system of the company. The questionnaire could also be used to
assess knowledge gains from training programs by comparing performance before and after
training.
Technological advances in instruments and sensors (e.g. electronic nose and tongue, optical
scanners), robotics and artificial intelligence are changing the way SQC is carried out in
companies by addressing some inherent challenges of using human subjects (Hansen et al.,
2005; Zhang, Zhang, Xie, Fan & Bai, 2008). Humans are limited in how many samples they
can evaluate before fatigue sets in. Continuous and regular evaluation of some products
increase the potential for health concerns. Availability of human assessors for on-line
measurements is a challenge. Fast and efficient analysis of SQC data from human subjects
requires expertise. The modern technologies may have an impact on the speed, accuracy and
cost of SQC. Expertise is needed now more than ever to develop these methods and validate
their performance against human assessments in the food industry (Findlay, 2002). The use of
online survey collection platforms (Compusense Cloud, Qualtrics, SurveyMonkey® etc.),
cheaper and faster internet access and dedicated statistical software applications may enhance
the ease, accuracy and speed in questionnaire administration, data collection and analysis.
3.5. Limitations of the study and recommendations for further work
A major limitation of this study is the relatively small sample size of the pilot study in
comparison to other questionnaire development studies where 120 (Uggioni and Salay, 2013)
22
and 153 respondents (Álvarez-García, Álvarez-Nieto, Pancorbo-Hidalgo, Sanz-Martos, and
López-Medina, 2018) were used. However, the number of respondents in this study is similar
to pilot studies by Dos Santos et al. (2019) and John, Treharne, Hale, Panoulas, Carroll, and
Kitas, (2009) where 65 and 61 respondents were used, respectively. Continued refinement of
the questionnaire and in particular the knowledge section to include more questions is
desirable. Further testing of the questionnaire with more respondents is needed for higher
reliability of the factor extraction (Osborne, Costello & Kellow, 2008). Furthermore, a test-
retest reliability study could not be carried out as the questionnaire was completed
anonymously. In future, comparison of measures of SQC KAPs with other external measures
(e.g. product quality specifications compliance, consistency of product quality or consumer
perception of the product quality) should be explored. Improvement in SQC KAPs as a result
of training and other interventions can also be assessed. Confirmatory factor analysis with an
independent, larger sample should also be carried out to statistically verify the factor structure
derived from this study.
4. Conclusions
The study details the development and validation of a self-administered questionnaire for
assessing the KAP of food company employees with regards to SQC. Thirty-seven questions
were retained in the final questionnaire (shown in S2). The attitude and practices questions
demonstrated acceptable content validity, construct validity and internal reliability. However,
the pilot study revealed that the knowledge section needs further development. Food companies
and relevant stakeholders will be able to use the questionnaire to rapidly evaluate the sensory
quality knowledge and attitudes of their employees. It may be useful to identify knowledge
gaps and evaluate the effectiveness of SQC training. It should be developed further and applied
in future studies by other researchers.

23
Conflicts of interest
The authors have no conflict of interest with this work.
Funding
Author Onojakpor was financially supported by the University of Pretoria Commonwealth
Doctoral Scholarship programme, South Africa. This work is based on the research supported
in part by the National Research Foundation of South Africa (Grant Number: 11578) under the
LEAP Agri Joint Research Collaboration Programme 400 NUTRIFOODS project.
REFERENCES
Agüeria, D. A., Terni, C., Baldovino, V. M., & Civit, D. (2018). Food safety knowledge,
practices and attitudes of fishery workers in Mar del Plata, Argentina. Food Control,
91, 5-11.
Álvarez-García, C., Álvarez-Nieto, C., Pancorbo-Hidalgo, P. L., Sanz-Martos, S., & López-
Medina, I. M. (2018). Student nurses' knowledge and skills of children's environmental
health: Instrument development and psychometric analysis using item response theory.
Nurse education today, 69, 113-119.
Ansari-Lari, M., Soodbakhsh, S., & Lakzadeh, L. (2010). Knowledge, attitudes and practices
of workers on food hygienic practices in meat processing plants in Fars, Iran. Food
Control, 21, 260-263.
Barua, A. (2013). Methods for decision-making in survey questionnaires based on Likert scale.
Journal of Asian Scientific Research, 3(1), 35-38.
Birasnav, M. (2014). Knowledge management and organizational performance in the service
industry: The role of transformational leadership beyond the effects of transactional
leadership. Journal of business research, 67(8), 1622-1629.

24
Chen, S. T., Soo, K. L., Ab Rahman, A., Van Rostenberghe, H., & Harith, S. (2013).
Development and pilot testing of nutrition knowledge, attitude and practice
questionnaire in persons with disabilities (KAP-nOKU) among trainers in rehabilitation
centres, Malaysia. Pakistan Journal of Nutrition, 12(8), 708.
Cho, E., & Kim, S. (2015). Cronbach’s coefficient alpha: Well known but poorly understood.
Organizational Research Methods, 18(2), 207-230.
Costell, E. (2002). A comparison of sensory methods in quality control. Food Quality and
Preference, 13, 341-353.
Couper, M. P. (2000). Web surveys: A review of issues and approaches. Public opinion
quarterly, 64(4), 464-494.
De Pretto L, Acreman S, Ashfold MJ, Mohankumar SK, Campos-Arceiz A (2015) The Link
between Knowledge, Attitudes and Practices in Relation to Atmospheric Haze
Pollution in Peninsular Malaysia. PLoS ONE 10(12):
e0143655.doi:10.1371/journal.pone.0143655
Dickson-Spillmann, M., Siegrist, M., & Keller, C. (2011). Development and validation of a
short, consumer-oriented nutrition knowledge questionnaire. Appetite, 56(3), 617-620.
Doorewaard, H., & Benschop, Y. (2003). HRM and organizational change: an emotional
endeavor. Journal of organizational change management, 16(3), 272-286.
Dos Santos, F. C., Riner, M. E., & Henriques, S. H. (2019). Brazilian questionnaire of
competencies of oncology nurses: Construction and test of content validation.
International Journal of Nursing Sciences.
Ducak, K., & Keller, H. (2016). Development and initial reliability testing of NAK-50+: A
nutrition attitude and knowledge questionnaire for adults 50+ years of age. Canadian
Journal of Dietetic Practice and Research, 77(1), 3-8.
25
Dzung, N. H., Dzuan, L. & Tu, H. D. (2003). The role of sensory evaluation in food quality
control, food research and development: a case of coffee study. Proceeding of the 8th
Asean food conference. 862-866.
Endrizzi, I., Aprea, E., Biasioli, F., Corollaro, M. L., Demattè, M. L., Penasa, M., Bittante, G.
& Gasperi, F. (2013). Implementing Sensory Analysis Principles in the Quality Control
of PDO Products: A Critical Evaluation of a Real‐World Case Study. Journal of sensory
studies, 28, 14-24.
Findlay, C. (2002). Computers and the Internet in sensory quality control. Food quality and
preference, 13(6), 423-428.
Hair, J. F., Anderson, R. E., Babin, B. J., & Black, W. C. (2010). Multivariate data analysis: A
global perspective (Vol. 7). Prentice Hall. New Jersey.
Hansen, T., Petersen, M. A. & Byrne, D. V. (2005). Sensory based quality control utilising an
electronic nose and GC-MS analyses to predict end-product quality from raw materials.
Meat Science, 69, 621-634.
Jackson, P. (2015). Commercial Collaboration and Critical Engagement in Food Research.
Gastronomica: The Journal of Critical Food Studies, 15(3), 28–32.
doi:10.1525/gfc.2015.15.3.28
John, H., Treharne, G. J., Hale, E. D., Panoulas, V. F., Carroll, D., & Kitas, G. D. (2009).
Development and initial validation of a heart disease knowledge questionnaire for
people with rheumatoid arthritis. Patient Education and Counseling, 77(1), 136-143.
Jones, A. M., Lamp, C., Neelon, M., Nicholson, Y., Schneider, C., Swanson, P. W., &
Zidenberg-Cherr, S. (2015). Reliability and validity of nutrition knowledge
questionnaire for adults. Journal of Nutrition Education and Behavior, 47(1), 69-74.
Kilcast, D. (2010). Sensory analysis for food and beverage quality control: a practical guide,
Woodhead Publishing Ltd. Cambridge, UK..

26
Koo, T. K., & Li, M. Y. (2016). A guideline of selecting and reporting intraclass correlation
coefficients for reliability research. Journal of Chiropractic Medicine, 15(2), 155-163.
Launiala, A., (2009). How much can a KAP survey tell us about people's knowledge, attitudes
and practices? Some observations from medical anthropology research on malaria in
pregnancy in Malawi. Anthropology Matters, 11(1).
Lawless, H. T., & Heymann, H. (2010). Sensory evaluation of food: principles and practices.
Springer Science & Business Media. Unites States.
Leech, N., Barrett, K., & Morgan, G. A. (2015). SPSS for intermediate statistics: Use and
interpretation. Lawrence Erlbaum Associates, Inc. New Jersey, United States.
Mitra, A. (2016). Fundamentals of quality control and improvement. John Wiley & Sons.
Munoz, A. M. (2002). Sensory evaluation in quality control: an overview, new developments
and future opportunities. Food Quality and Preference, 13, 329-339.
Osborne, J. W., Costello, A. B., & Kellow, J. T. (2008). Best practices in exploratory factor
analysis. Best practices in quantitative methods, 86-99.
Rubio, D. M., Berg-Weger, M., Tebb, S. S., Lee, E. S., & Rauch, S. (2003). Objectifying
content validity: Conducting a content validity study in social work research. Social
Work Research, 27(2), 94-104.
Saguy, I. (2011). Paradigm shifts in academia and the food industry required to meet
innovation challenges. Trends in Food Science & Technology, 22(9), 467–475.
doi:10.1016/j.tifs.2011.04.003
Sarmugam, R., Worsley, A., & Flood, V. (2014). Development and validation of a salt
knowledge questionnaire. Public Health Nutrition, 17(5), 1061-1068.
Schaefer, J. T., & Zullo, M. D. (2016). Validation of an instrument to measure registered
dietitians’/nutritionists’ knowledge, attitudes and practices of an intuitive eating
approach. Public Health Nutrition, 19(17), 3114-3122.

27
Schrader, P. G., & Lawless, K. A. (2004). The knowledge, attitudes, & behaviors approach
how to evaluate performance and learning in complex environments. Performance
Improvement, 43(9), 8-15.
Singh, A. S. (2017). Common procedures for development, validity and reliability of a
questionnaire. International Journal of Economics, Commerce and Management United
Kingdom, 5, 790-801.
Stone, H. & Sidel, J. 2004. Sensory Evaluation Practices, Elsevier Academic Press. California,
USA.
Taber, K. S. (2018). The use of Cronbach’s alpha when developing and reporting research
instruments in science education. Research in Science Education, 48(6), 1273-1296.
Tavakol, M., & Dennick, R. (2011). Making sense of Cronbach's alpha. International journal
of Medical Education, 2, 53.
Uggioni, P. L., & Salay, E. (2013). Reliability and validity of a questionnaire to measure
consumer knowledge regarding safe practices to prevent microbiological contamination
in restaurants. Journal of Nutrition Education and Behavior, 45(3), 250-257.
Underhill-Blazey, M., Stopfer, J., Chittenden, A., Nayak, M. M., Lansang, K., Lederman, R.,
Garber, J. & Gundersen, D. A. (2019). Development and testing of the KnowGene scale
to assess general cancer genetic knowledge related to multigene panel testing. Patient
Education and Counseling, 102(8), 1558-1564
Varzakas, T. & Tzia, C. 2015. Handbook of food processing: food safety, quality, and
manufacturing processes, CRC Press. Florida, United States.
Watson, J. C. (2017). Establishing evidence for internal structure using exploratory factor
analysis. Measurement and Evaluation in Counseling and Development, 50(4), 232-
238.

28
Whati, L. H., Senekal, M., Steyn, N. P., Nel, J. H., Lombard, C., & Norris, S. (2005).
Development of a reliable and valid nutritional knowledge questionnaire for urban
South African adolescents. Nutrition, 21(1), 76-85.
Williams, B., Onsman, A., & Brown, T. (2010). Exploratory factor analysis: A five-step guide
for novices. Australasian Journal of Paramedicine, 8(3).
World Trade Organization (WTO) (2016). World Trade Report 2016: Levelling the trading
field for SMEs, Retrieved from
https://www.wto.org/english/res_e/booksp_e/world_trade_report16_e.pdf
Zamanzadeh, V., Rassouli, M., Abbaszadeh, A., Majd, H. A., Nikanfar, A., & Ghahramanian,
A. (2014). Details of content validity and objectifying it in instrument development.
Nursing Practice Today, 1(3), 163-171.
Zhang, Q., Zhang, S., Xie, C., Fan, C., & Bai, Z. (2008). ‘Sensory analysis’ of Chinese vinegars
using an electronic nose. Sensors and Actuators B: Chemical, 128(2), 586-593.