Development and Field Validation of NCHRP 1-42A Top … (Rey) Roque, Ph.D., P.E. Department of Civil...
52
Development and Field Validation of NCHRP 1-42A Top-down Cracking Model Reynaldo (Rey) Roque, Ph.D., P.E. Department of Civil and Coastal Engineering University of Florida July 17 th , 2009
Transcript of Development and Field Validation of NCHRP 1-42A Top … (Rey) Roque, Ph.D., P.E. Department of Civil...
Development and Field Validation of NCHRP 1-42A Top-down Cracking Model
Reynaldo (Rey) Roque, Ph.D., P.E.Department of Civil and Coastal Engineering
University of Florida
July 17th, 2009

Pavement Performance Prediction Symposium, Laramie, Wyoming
Overview
Top-Down Cracking Mechanisms Development of Top-Down Cracking
Model Model components Model integration and evaluation
Model Calibration and Validation

Top-Down Cracking Mechanisms
Mechanisms Bending-induced tension away from tire Shear-induced tension at tire edge
Key Elements Model Requirements
Pavement Performance Prediction Symposium, Laramie, Wyoming
Key Elements
Aging Intensifies load and thermal stresses Embrittles the mixture Degrades healing potential More critical for near-surface distress
Healing Not all micro-damage is
permanent/cumulative Effect of damage zones on load stresses
Important for initiation (NCSU)
Pavement Performance Prediction Symposium, Laramie, Wyoming
Key Elements
Thermal stresses can be an important part of this near-surface phenomenon Top-down cracking model must include a
thermal response model Stress intensity - fracture mechanics
Essential to explain propagation of surface cracks
Critical Condition Concept Discretization based on this concept
dramatically reduces computer run times

Pavement Performance Prediction Symposium, Laramie, Wyoming
- Critical Condition Concept (CCC)
Dis
tres
s
Loads/Age
TraditionalFatigue
Failure
CriticalCondition
Initiation
Advantages
•Few critical design conditions
•Reduced number of calculations
•Use of Advanced models (FEM/BEM) more feasible
•Potential for more accuracy: enhanced understanding of mechanism

Pavement Performance Prediction Symposium, Laramie, Wyoming
PAVEMENT STAGE
- CCC and Top-Down Cracking
MixStage
Top
Bottom
GradientI II III
I
I
IV
III
III
III
II
II
I
No Cumulative Damage Except• Deficient Structure• Overloads
Critical Conditions (>threshold)• Spring Thaw• Poor Drainage• Unexpected Loading
EARLY STAGES
Cumulative damage, especially at surface (stiff, brittle)
Critical Conditions (>threshold) Cooler periods (gradients) Surface flaws Thermal Stresses Damage Zones
LATER STAGES
Pavement Performance Prediction Symposium, Laramie, Wyoming
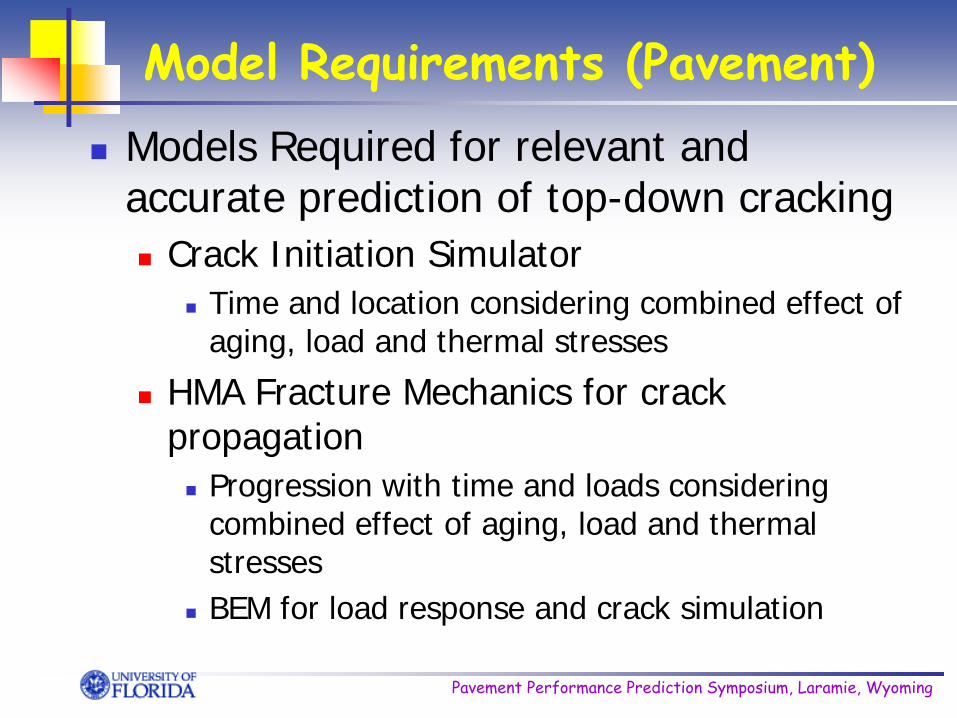
Model Requirements (Pavement) Models Required for relevant and
accurate prediction of top-down cracking Crack Initiation Simulator
Time and location considering combined effect of aging, load and thermal stresses
HMA Fracture Mechanics for crack propagation Progression with time and loads considering
combined effect of aging, load and thermal stresses
BEM for load response and crack simulation
Pavement Performance Prediction Symposium, Laramie, Wyoming
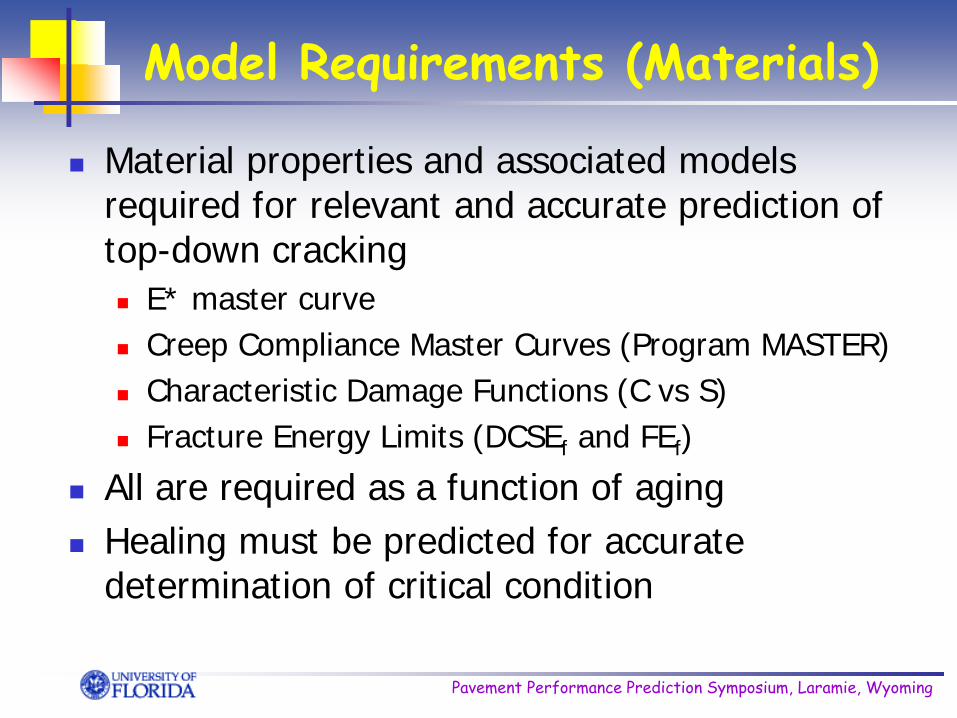
Model Requirements (Materials)
Material properties and associated models required for relevant and accurate prediction of top-down cracking E* master curve Creep Compliance Master Curves (Program MASTER) Characteristic Damage Functions (C vs S) Fracture Energy Limits (DCSEf and FEf)
All are required as a function of aging Healing must be predicted for accurate
determination of critical condition
Pavement Performance Prediction Symposium, Laramie, Wyoming
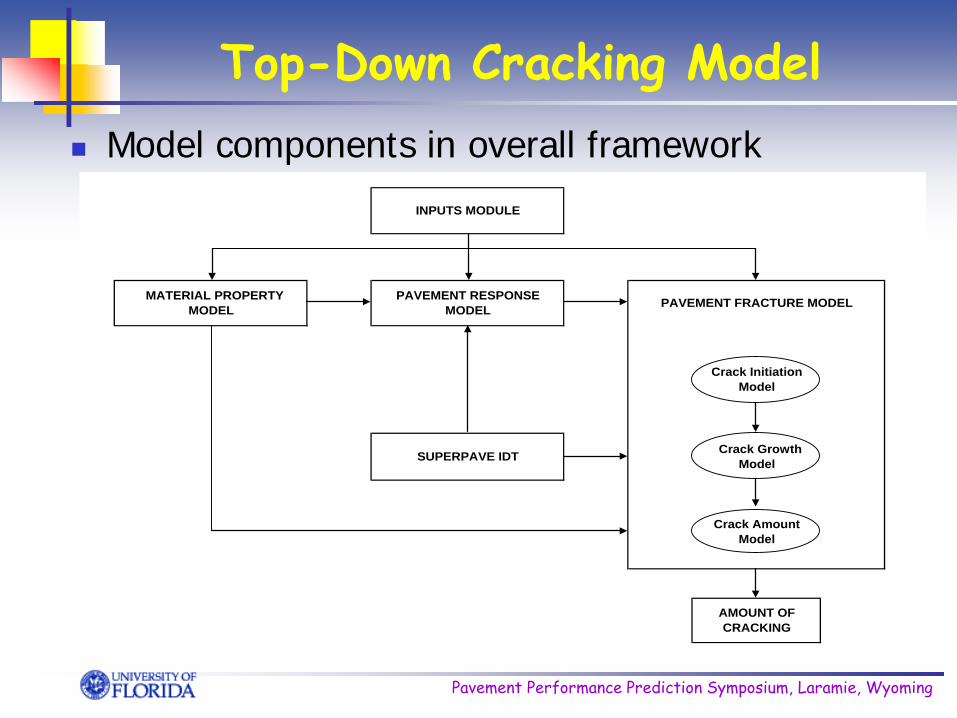
Top-Down Cracking Model Model components in overall framework
SUPERPAVE IDT
AMOUNT OF CRACKING
PAVEMENT FRACTURE MODEL
Crack Initiation Model
Crack Growth Model
Crack Amount Model
INPUTS MODULE
PAVEMENT RESPONSE MODEL
MATERIAL PROPERTY MODEL

Pavement Performance Prediction Symposium, Laramie, Wyoming
Inputs Module
Pavement material and structural property HMA material property
Basic characteristics (material property model) Damage and fracture properties (Superpave IDT)
Modulus of base, subbase, and subgrade Layer thickness
Traffic volume (in EASLs) Temperatures within HMA layer (EICM)
Pavement Performance Prediction Symposium, Laramie, Wyoming
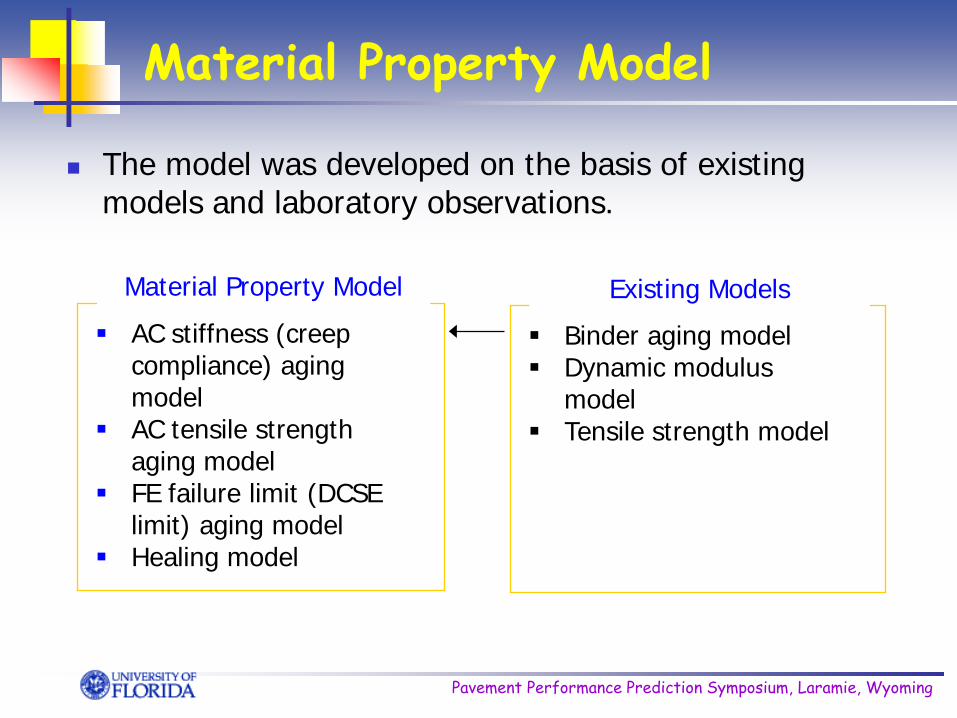
Binder aging model Dynamic modulus
model Tensile strength model
AC stiffness (creep compliance) aging model
AC tensile strength aging model
FE failure limit (DCSE limit) aging model
Healing model
Existing Models
Material Property Model
Material Property Model
The model was developed on the basis of existing models and laboratory observations.

Pavement Performance Prediction Symposium, Laramie, Wyoming
- AC Stiffness Aging Model
0 50 100 150 200 250 300 3501.5
2
2.5
3
3.5
4
t (day)
log-
stiff
ness
(ksi
)
Daily Stiffness of AC at Yr1
SHigh
SAv e.
SLow
0 50 100 150 200 250 300 3501.5
2
2.5
3
3.5
4
t (day)lo
g-st
iffne
ss (k
si)
Daily Stiffness of AC at Yr5
SHigh
SAv e.
SLow

Pavement Performance Prediction Symposium, Laramie, Wyoming
- FE Failure Limit Aging Model
FE failure limit aging model (surface):
0
2
4
6
8
10
0 10 20 30 40 50
Time (year)
Frac
ture
Ene
rgy
(Kpa
)
2510
FEi (Kpa) :
`
0
0.5
1
1.5
2
0 10 20 30 40 50
Time (year)
Frac
ture
Ene
rgy
(Kpa
)
135
k1 :
( ) [ ] 1min )()( k
niif tSFEFEFEtFE ⋅−−=0max
0)0,()(SSStStSn −
−=where,

Pavement Performance Prediction Symposium, Laramie, Wyoming
- Laboratory Healing Healing Tests @ Different DCSE for Modified Mixtures Loading with 55psi & Healing @ 20°C
Kim and Roque. 2006

Pavement Performance Prediction Symposium, Laramie, Wyoming
- Laboratory Healing
Repeated Loads for Determining Damage Recovery Rate (20°C)
Kim and Roque. 2006

Pavement Performance Prediction Symposium, Laramie, Wyoming
- Laboratory Healing
Damage Recovery Rate: 20°C > 10°C > 0°C
Kim and Roque. 2006

Pavement Performance Prediction Symposium, Laramie, Wyoming
- Damage Recovery due to Healing
Full Healing Partial Healing No Healing
t t t
Threshold
Mic
ro-d
amag
e
Pavement Performance Prediction Symposium, Laramie, Wyoming
- Healing Model
0
0.2
0.4
0.6
0.8
1
0 10 20 30 40 50
Time (year)
Max
imum
Hea
ling
Pot
entia
l 2510
FEf i (Kpa) :
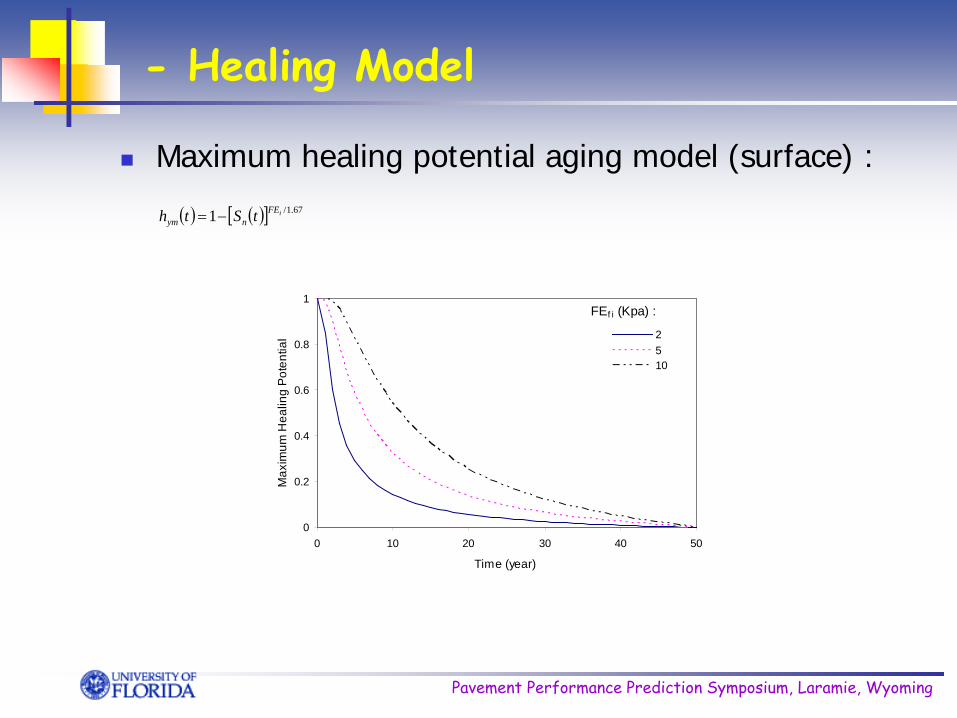
( ) ( )[ ] 67.1/1 iFEnym tSth −=
Maximum healing potential aging model (surface) :
Pavement Performance Prediction Symposium, Laramie, Wyoming
- Healing Model
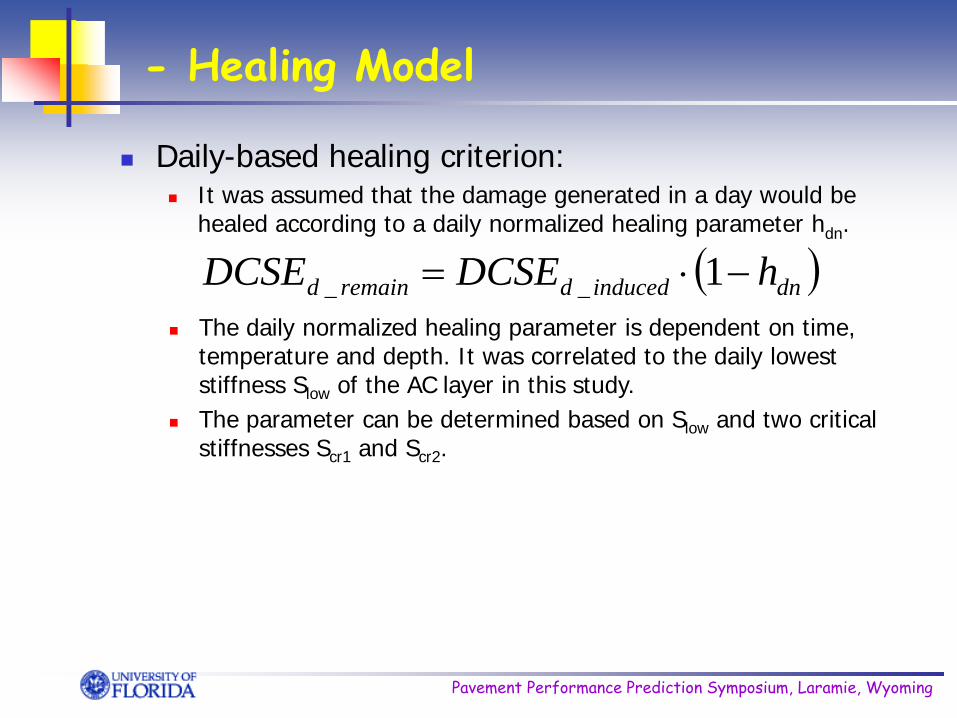
Daily-based healing criterion: It was assumed that the damage generated in a day would be
healed according to a daily normalized healing parameter hdn.
( )dninduceddremaind hDCSEDCSE −⋅= 1__
The daily normalized healing parameter is dependent on time, temperature and depth. It was correlated to the daily lowest stiffness Slow of the AC layer in this study.
The parameter can be determined based on Slow and two critical stiffnesses Scr1 and Scr2.

Pavement Performance Prediction Symposium, Laramie, Wyoming
- Healing Model
0 1 2 3 4 51
1.5
2
2.5
3
3.5
4
time (year)
log-
stiff
ness
(ksi
)
Scr1
Scr2
Zone C
Zone A
Daily-based healing criterion (cont.): Slow at surface of one typical AC layer for five successive years. Two critical values for daily lowest stiffness, Scr1 & Scr2.
Zone B
- No Healing
- Partial Healing
- Full Healing (at early age)
Pavement Performance Prediction Symposium, Laramie, Wyoming
- Healing Model
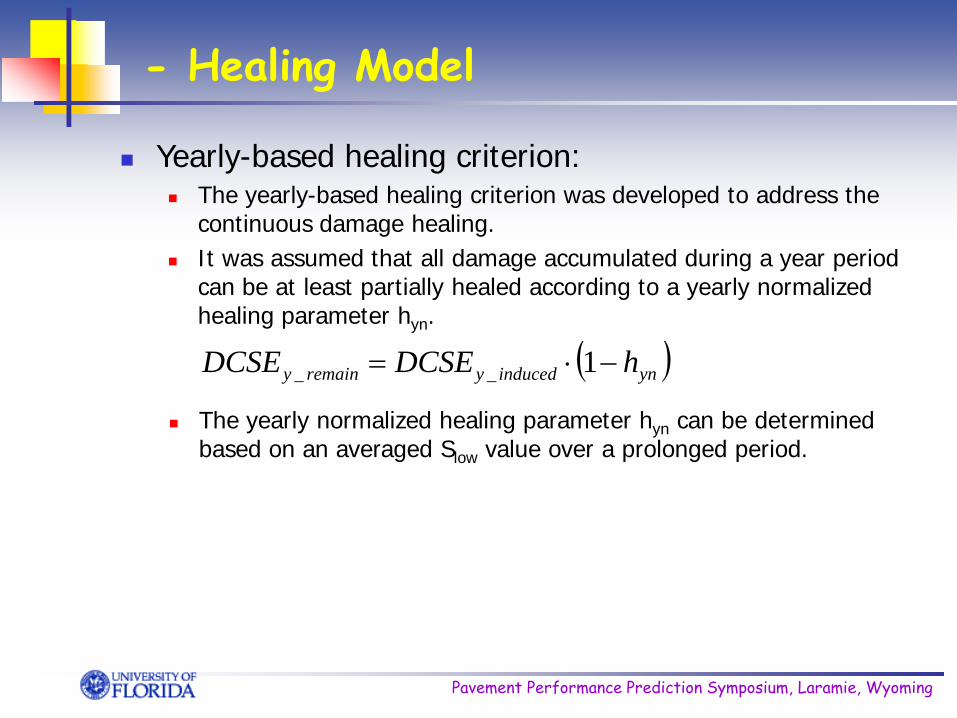
Yearly-based healing criterion: The yearly-based healing criterion was developed to address the
continuous damage healing. It was assumed that all damage accumulated during a year period
can be at least partially healed according to a yearly normalized healing parameter hyn.
The yearly normalized healing parameter hyn can be determined based on an averaged Slow value over a prolonged period.
( )yninducedyremainy hDCSEDCSE −⋅= 1__

Pavement Performance Prediction Symposium, Laramie, Wyoming
Superpave IDT
The Superpave indirect tensile test (IDT) includes three types of test: Resilient modulus Creep compliance (rate of damage) Tensile strength (fracture energy limit)
The IDT was used to determine rheological and fracture properties on field cores.
At this point, IDT tensile strength test must be required since an initial fracture energy model is not available.
Pavement Performance Prediction Symposium, Laramie, Wyoming
Pavement Response Model
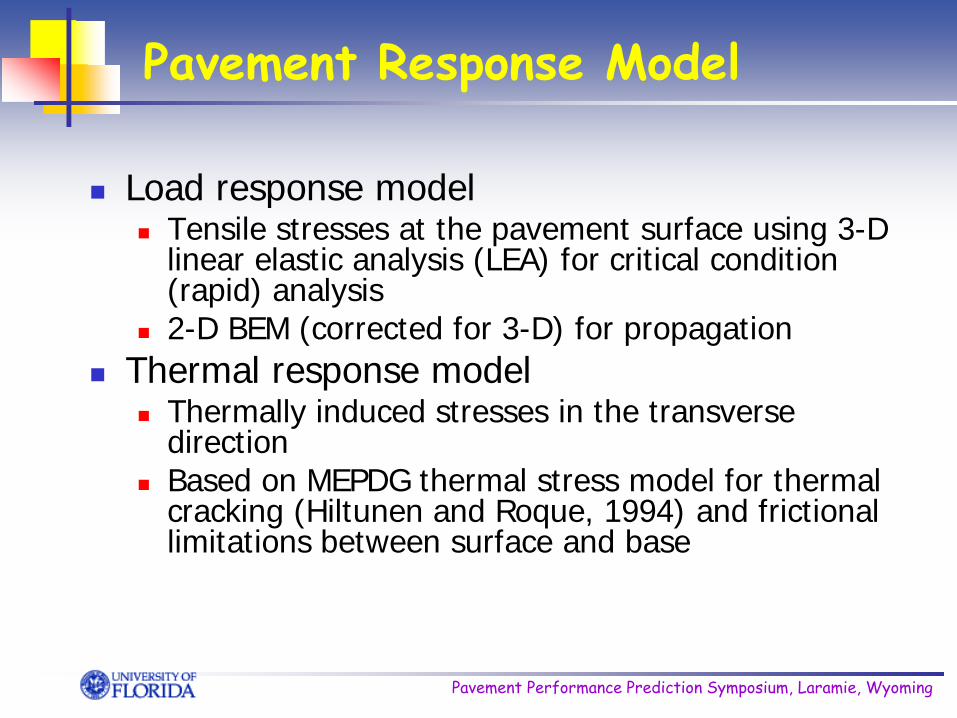
Load response model Tensile stresses at the pavement surface using 3-D
linear elastic analysis (LEA) for critical condition (rapid) analysis
2-D BEM (corrected for 3-D) for propagation Thermal response model
Thermally induced stresses in the transverse direction
Based on MEPDG thermal stress model for thermal cracking (Hiltunen and Roque, 1994) and frictional limitations between surface and base

Pavement Performance Prediction Symposium, Laramie, Wyoming
Pavement Fracture Model
Crack initiation Model Based on the threshold concept - HMA
fracture model (Roque et al., 2001, 2002) Crack initiation time and location predicted
using material property and pavement response models
Pavement Performance Prediction Symposium, Laramie, Wyoming
Pavement Fracture Model
Crack Growth Model Based on threshold concept - HMA fracture
model and displacement discontinuity (DD) boundary element model (BEM)
Predicts crack depth with time using material property model and thermal response model.
Pavement Performance Prediction Symposium, Laramie, Wyoming
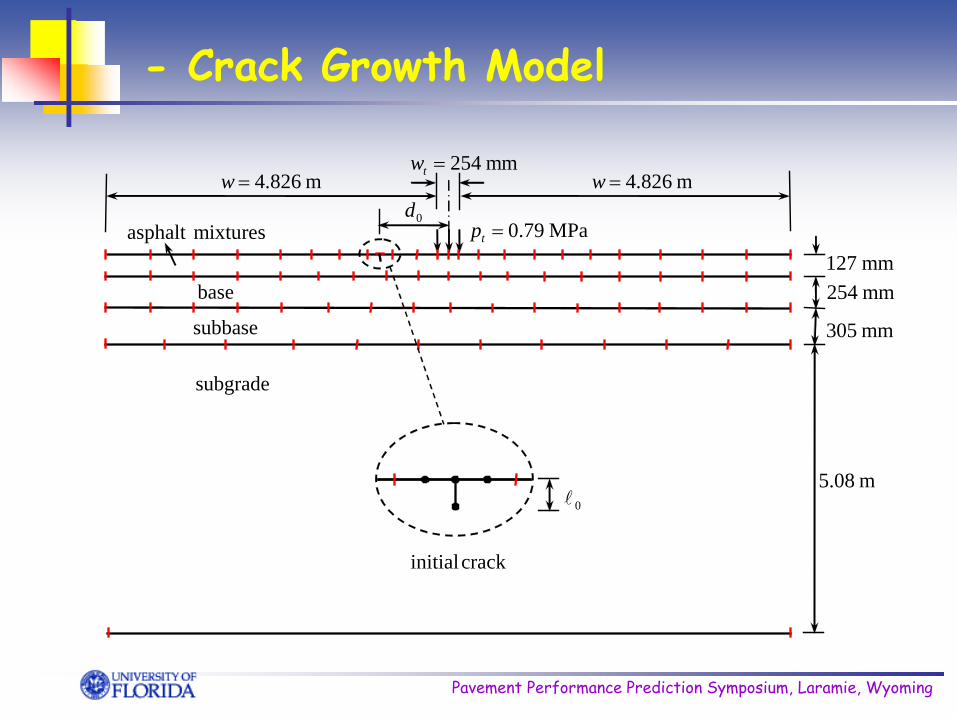
- Crack Growth Model
base
m08.5
crack initial
mixturesasphalt
subgrade
subbase
m826.4=w
MPa79.0=tp0d
m826.4=w
0
mm254=tw
mm127mm254
mm305

Pavement Performance Prediction Symposium, Laramie, Wyoming
Pavement Fracture Model
Crack Amount Model Crack amount was assumed to be linearly proportional to the
crack depth over AC layer thickness ratio (C/D).
0
30
60
90
120
150
180
210
240
270
300
330
0 0.1 0.2 0.3 0.4 0.5
C/D
Crac
k Am
ount
(ft /
100f
t)

Top-Down Cracking Model
Model Integration Critical condition concept (CCC)
Module for critical condition identification (CCI)
Module for crack initiation simulation (CIS) Module for crack growth simulation (CGS)
Model Evaluation Effect of climate Effect of traffic Effects of material and structural properties

Pavement Performance Prediction Symposium, Laramie, Wyoming
Critical Condition ConceptD
istr
ess
Loads/Age
Failure
CriticalCondition
Initiation
VECD-FEP++ or CIS
HMA Fracture Mechanics

Pavement Performance Prediction Symposium, Laramie, Wyoming
CCI Module Critical condition identification (CCI)
Healing Model
Check DCSEnorm against Threshold
Option A: Based on Pavement Response
& Crack Initiation Models
Option B: Based on Thermal Response
& Crack Growth Models
Material Property Aging Models
Damage (DCSEnorm) Computation

Pavement Performance Prediction Symposium, Laramie, Wyoming
CIS Module Crack Initiation Simulation (CIS).
DCSEnorm >= 1.0
Call: CCI Module (Option A)
End of Simulation
PVT Modeling: Create PVT Structure using LEA
No Yes
Go to next time step
Critical Condition Identified
Pavement Performance Prediction Symposium, Laramie, Wyoming
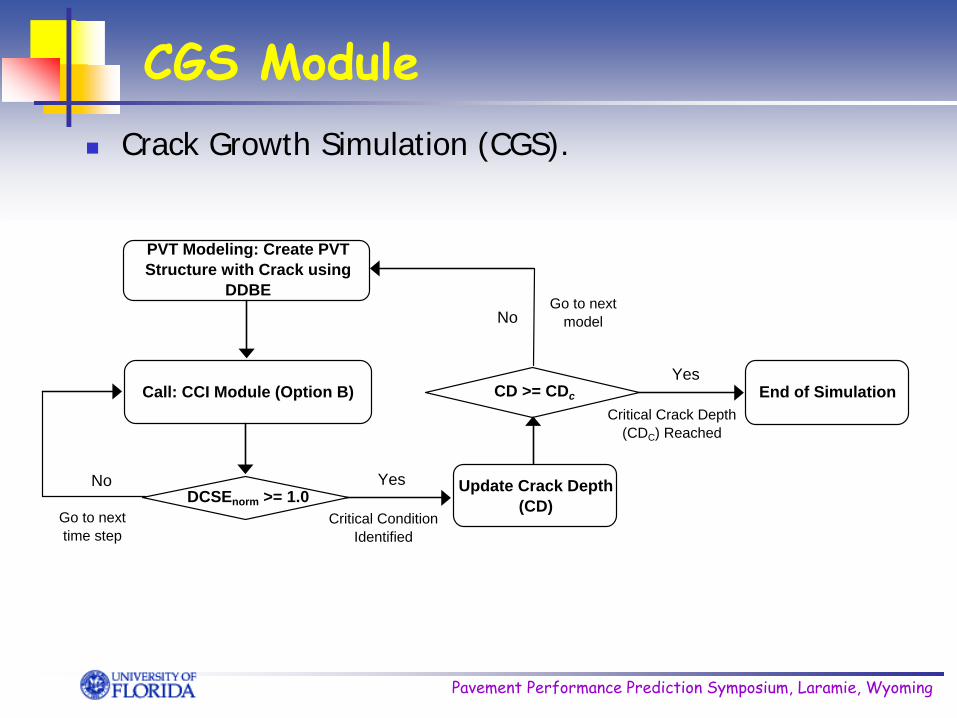
CGS Module Crack Growth Simulation (CGS).
DCSEnorm >= 1.0 Update Crack Depth (CD)
Call: CCI Module (Option B) End of SimulationCD >= CDc
PVT Modeling: Create PVT Structure with Crack using
DDBE
No Yes
No
Yes
Go to next time step
Critical Condition Identified
Go to next model
Critical Crack Depth (CDC) Reached

Pavement Performance Prediction Symposium, Laramie, Wyoming
Sample Prediction Climatic condition:
A freeze-thaw climate in Washington D.C. area.
Traffic volume: 18-kip single axle wheel load at
a rate of 100 cycles per hour (or, 17.5-million ESALs per 20 years).
Material and Structural properties:
AC layer
Base
Subgrade
2 40 ksiE = 2 0.3ν =
3 12 ksiE =
2 12 ''H =
1 5 ''H =1h2h
3h
2 0.35ν =
Parameter Value Aggregate % passing by weight
(seive size) 100.0 (3/4 in.), 90.0 (3/8 in.), 60.2 (# 4), 4.8 (# 200)
Binder type 67-22
Mean annual air temperature, oF 60
Effective binder content, % by volume 12
Air void content, % by volume 7
Initial fracture energy, Kpa 2
Fracture energy aging parameter 3
0
0.5
1
1.5
2
2.5
3
0 5 10 15 20 25Time (year)
Cra
ck d
epth
(inc
h)
WASH :
Pavement Performance Prediction Symposium, Laramie, Wyoming
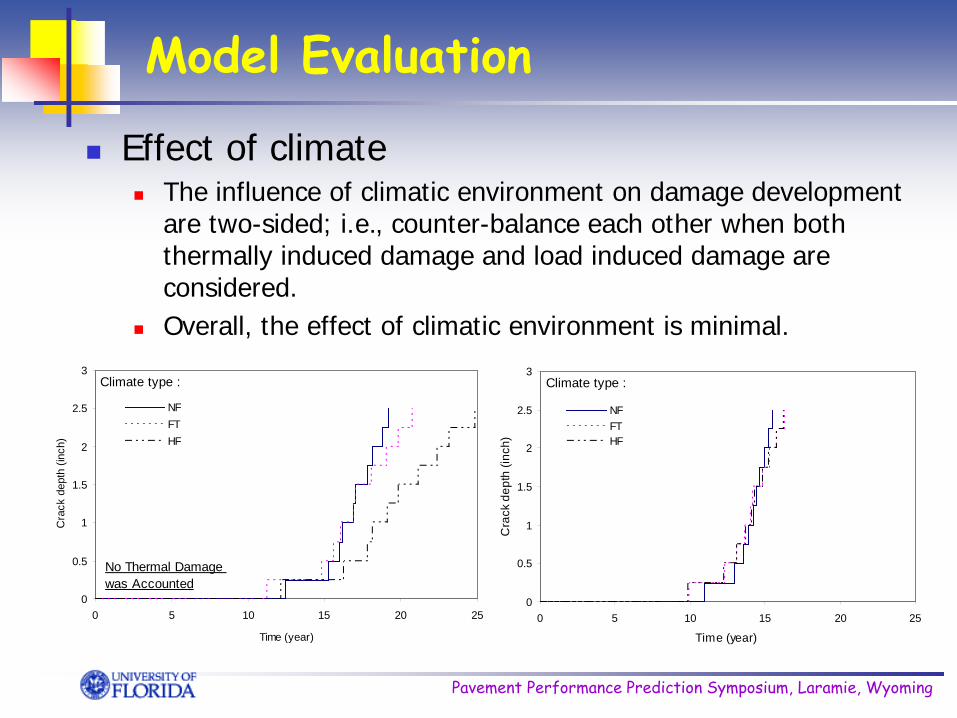
Model Evaluation
Effect of climate The influence of climatic environment on damage development
are two-sided; i.e., counter-balance each other when both thermally induced damage and load induced damage are considered.
Overall, the effect of climatic environment is minimal.
0
0.5
1
1.5
2
2.5
3
0 5 10 15 20 25
Time (year)
Cra
ck d
epth
(inc
h)
NFFTHF
Climate type :
No Thermal Damage was Accounted
0
0.5
1
1.5
2
2.5
3
0 5 10 15 20 25
Time (year)
Cra
ck d
epth
(inc
h)
NFFTHF
Climate type :

Pavement Performance Prediction Symposium, Laramie, Wyoming
Model Evaluation
Effect of traffic As expected, the effect of traffic volume is strong.
0
0.5
1
1.5
2
2.5
3
0 5 10 15 20 25
Time (year)
Cra
ck d
epth
(inc
h)
0.8760.4380.175
Traffic (x106 ESALs/Year) :

Pavement Performance Prediction Symposium, Laramie, Wyoming
Model Evaluation
Effects of material and structural properties The material and structural properties of the study
include: Initial fracture energy: strong influence Fracture energy aging parameter: fairly strong influence Binder viscosity: small influence Base modulus: fairly strong influence AC layer thickness: significant influence
The AC layer thickness was identified to have significant influence on mechanism to be used in the model.

Pavement Performance Prediction Symposium, Laramie, Wyoming
Model Evaluation
Effect of AC layer thickness on mechanism For thin to medium thickness AC layer, the mechanism of
bending-induced tension away from tire is appropriate. However, for thick AC layer in which the predicted initial crack
location is more than 36 inch from the tire, the mechanism of shear-induced tension at tire edge needs to be used.
0
0.5
1
1.5
2
2.5
3
3.5
4
0 5 10 15 20 25
Time (year)
Cra
ck d
epth
(inc
h)
2.55
7.5
H1 (inch) :
0
0.5
1
1.5
2
2.5
3
0 2.5 5 7.5 10 12.5 15
Time (year)
Cra
ck d
epth
(inc
h)
7.5
10
H1 (inch) :
Mechanism: Shear-induced tension at tire-edge

Top-Down Cracking Model
Model Calibration and Validation Summary of top-down cracking model data Calibration of model Validation of model Final model predictions

Pavement Performance Prediction Symposium, Laramie, Wyoming
Summary of Model Data
Selection of Pavement Sites Thirteen pavement sections were evaluated as part
of this study. They were selected based on quality of data from
standpoint of both laboratory testing and field observation.
Based on climatic condition, these pavement sections fall into two groups. No Freeze Hard Freeze

Pavement Performance Prediction Symposium, Laramie, Wyoming
- Selection of Pavement Sites
Field test sections of Group I includes eleven sections under No-Freeze climate of Florida.
Each of the sections has a thin to median layer thickness. Section Section Code County Section Number Name Limits
1 Interstate 75 I75-1A Charlotte MP 161.1 - MP 171.3Section 1
2 Interstate 75 I75-1B Charlotte MP 149.3 - MP 161.1Section 1
3 Interstate 75 I75-3 Lee MP 131.5 - MP 149.3Section 3
4 Interstate 75 I75-2 Lee MP 115.1 - MP 131.5Section 2
5 State Road 80 SR 80-1 Lee From Hickey Creek BridgeSection 1 To East of Joel Blvd.
6 State Road 80 SR 80-2 Lee From East of CR 80ASection 2 To West of Hickey Creek Bridge
7 Interstate 10 I10-8 Suwannee MP 15.144 - MP 18.000Section 8
8 Interstate 10 I10-9 Suwannee MP 18.000 - MP 21.474Section 9
9 State Road 471 SR471 Sumter The northbound lane three miles north of the Withlacoochee River
10 State Road 19 SR19 Lake The southbound lane five miles south of S.R. 40
11 State Road 997 SR997 Dade The northbound lane 7.6 miles south of US-27

Pavement Performance Prediction Symposium, Laramie, Wyoming
- Selection of Pavement Sites
Group II has two sections under Hard-Freeze climate of Minnesota (MNRoad).
However, both sections are full-depth AC pavements with a layer thickness of more than 9 inch.
Section Section CodeNumber Name
12 Interstate 94 I94-4Cell 4
13 Interstate 94 I94-14Cell 14
Location
located near Albertville, Minnesota (40 miles northwest of the Twin Cities)
located near Albertville, Minnesota (40 miles northwest of the Twin Cities)

Pavement Performance Prediction Symposium, Laramie, Wyoming
Calibration of Model Data from SuperPave IDT
The Superpave IDT was used to determine tensile properties on field cores obtained from the 13 test sections.
Section MR St εf FEf DCSEf AgeCode (Gpa) (Mpa) (µε) (Kpa) (Kpa) (year)I75-1A 11.14 1.65 1028.05 1.1 1.0 15I75-1B 10.91 2.01 1437.44 2.0 1.8 14I75-3 11.58 1.68 715.74 0.8 0.7 15I75-2 10.29 1.89 1066.72 1.3 1.1 14SR80-1 13.39 1.59 495.27 0.3 0.2 16SR80-2 13.45 2.39 679.15 1.0 0.8 19I10-8 9.85 1.56 386.00 0.4 0.3 7I10-9 10.21 1.27 415.00 0.4 0.3 7SR471 7.67 1.79 2040.00 2.5 2.3 3SR19 9.30 1.71 1338.00 1.6 1.4 3SR997 11.74 2.33 594.00 0.9 0.7 40I94-4 8.18 1.35 1203.56 1.1 1.0 13I94-14 9.44 1.78 1760.25 2.4 2.2 13
Pavement Performance Prediction Symposium, Laramie, Wyoming
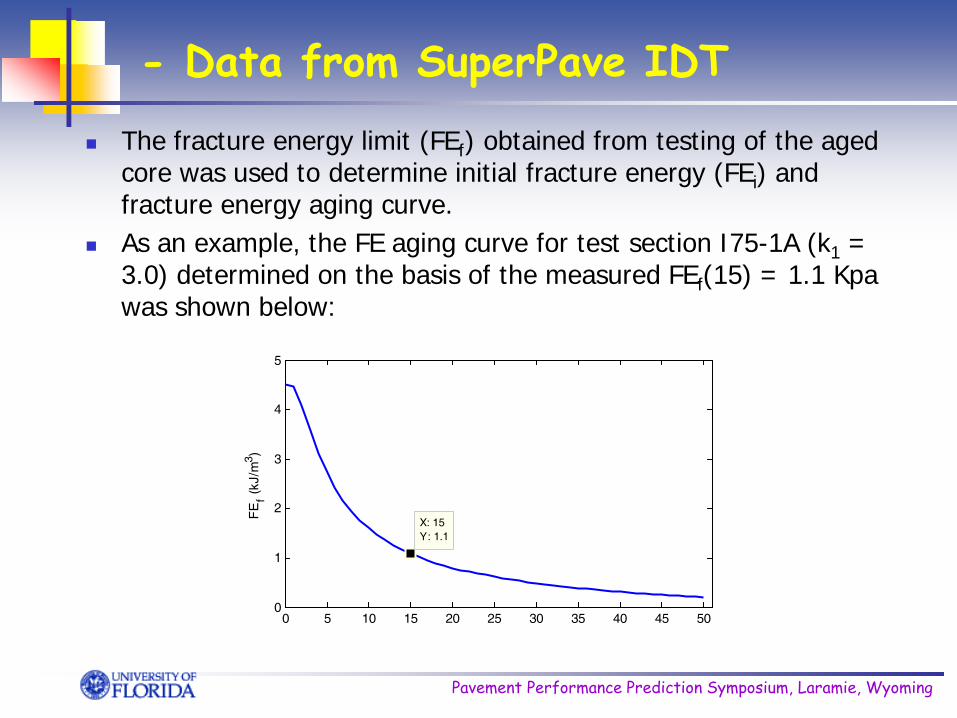
- Data from SuperPave IDT The fracture energy limit (FEf) obtained from testing of the aged
core was used to determine initial fracture energy (FEi) and fracture energy aging curve.
As an example, the FE aging curve for test section I75-1A (k1 = 3.0) determined on the basis of the measured FEf(15) = 1.1 Kpa was shown below:
0 5 10 15 20 25 30 35 40 45 500
1
2
3
4
5
FEf (
kJ/m
3 )
X: 15Y: 1.1
Pavement Performance Prediction Symposium, Laramie, Wyoming
Calibration of Model
Model calibration based on time to start (initiation) of top-down cracking
Only one calibration parameter was used Fracture energy aging parameter (k1), which resulted in the
best fit (highest R2) between observed and predicted time to initiation of cracking

Pavement Performance Prediction Symposium, Laramie, Wyoming
Calibration of Model Final Calibration
k1 = 3.0, R2 = 0.933
0
5
10
15
20
25
30
35
40
45
SR19 SR471 I10-8 I10-9 I75-1A I75-3 I75-1B I75-2 SR80-2 SR997
Sections
Tim
e to
Initi
atio
n (Y
ear)
Observed
Predicted
Worst BestPerformance
1 - 5 Yr
6 - 10 Yr
11 - 20 Yr
21 - 30 Yr
> 30 Yr

Pavement Performance Prediction Symposium, Laramie, Wyoming
Validation of Model The Prediction sum of squares (PRESS) was selected to perform
validation of model. Test section five was included in the validation process as an
independent data point.
I II III IV V
I 2 1
II 2 1
III 1 2
IV 1
V 1
Observed Cracking Performance
Pred
icte
d C
rack
ing
Perfo
rman
ce Time to crack initiation,
Level I: 1 to 5 years
Level II: 6 to 10 years
Level III: 11 to 20 years
Level IV: 21 to 30 years
Level V: > 30 years

Pavement Performance Prediction Symposium, Laramie, Wyoming
Final Model Predictions Final model predictions were conducted using the
calibrated model. All 13 sections were included.
Predicted versus observed crack initiation time.
0
5
10
15
20
25
30
35
40
45
SR19 SR471 I94-4* I94-14* I10-8 I10-9 I75-1A I75-3 I75-1B SR80-1 I75-2 SR80-2 SR997
Sections
Tim
e to
Initi
atio
n (Y
ear)
Observed
Predicted
Worst BestPerformance
1 - 5 Yr
6 - 10 Yr
11 - 20 Yr
21 - 30 Yr
> 30 Yr
Pavement Performance Prediction Symposium, Laramie, Wyoming
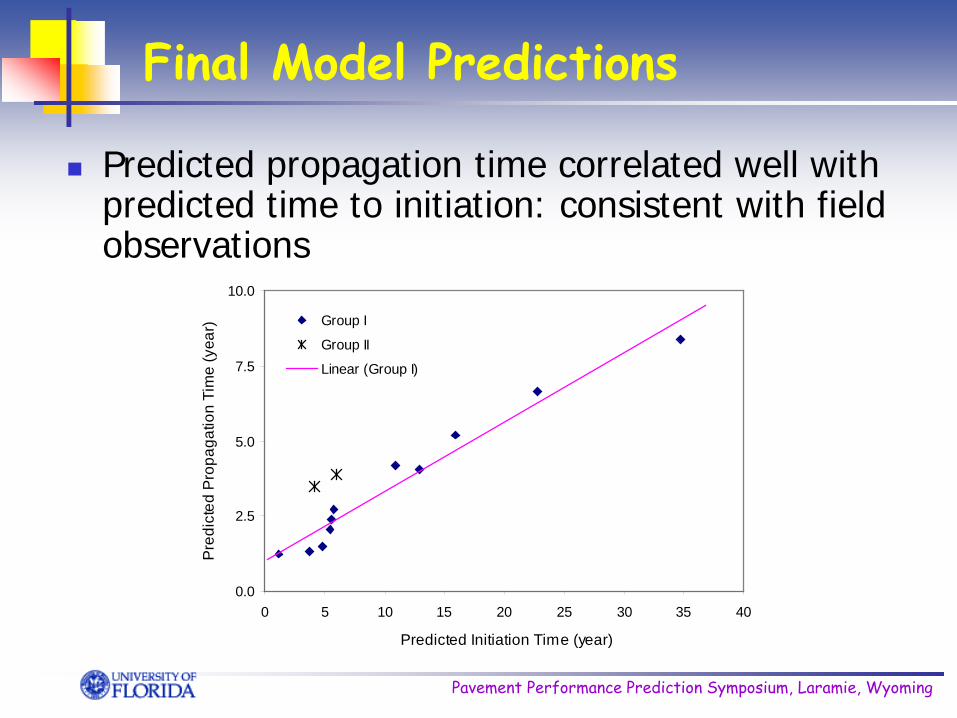
Final Model Predictions
Predicted propagation time correlated well with predicted time to initiation: consistent with field observations
0.0
2.5
5.0
7.5
10.0
0 5 10 15 20 25 30 35 40
Predicted Initiation Time (year)
Pre
dict
ed P
ropa
gatio
n Ti
me
(yea
r) Group I
Group II
Linear (Group I)

Pavement Performance Prediction Symposium, Laramie, Wyoming
Final Model Predictions
The final model predictions are expressed in terms of crack amount versus time for each of the test sections. As an example, cracking history of test section 1 (I75-1A) was presented.
I75-1A
0
50
100
150
200
250
300
350
400
0 2.5 5 7.5 10 12.5 15 17.5 20
Time (year)
AC
(ft/1
00
Initiation
Pavement Performance Prediction Symposium, Laramie, Wyoming
Two Big Challenges
Better understanding of and ability to predict mixture aging and healing How do damage properties and failure limits
change with age/environment? When do mixtures effectively stop healing? What mixture characteristics mitigate aging
effects?
Material property models Fracture energy, healing, compliance, damage Based on mixture components/characteristics

Pavement Performance Prediction Symposium, Laramie, Wyoming
Thank You!!