
Development and Evaluation of QoS Measurement System for Internet
14
JOURNAL OF INFORMATION SCIENCE AND ENGINEERING 18, 891-904 (2002) 891 Development and Evaluation of QoS Measurement System for Internet Applications by Client Observation HIROKI SAITO Department of Information Systems and Multimedia Design School of Engineering Tokyo Denki University Chiyoda-ku, Tokyo, 101-8457, Japan Various applications provide convenient services in the Internet. As these applica- tions are widely used, it is important that the quality of these services (QoS), such as the response time and throughput, be high. Several ways to measure network performance have been developed. However, QoS management is still difficult because of the lack of effective tools to evaluate network system usability. The goal of our study was to de- velop a new QoS measurement system for network system usability. In our approach, we measure system usability and performance through mechanisms installed in the clients. The purpose of our system is to make clear the behavior of the client applications, and this allows us to measure system performance and system usability. In this paper, we describe the fundamental concept behind client observation and its performance indices, and the design and implementation of a performance evaluation system implemented through observation. In addition, we confirm the effectiveness of our system through experiments. Keywords: quality of service, quality evaluation, performance measurement, perform- ance management, network management, internet 1. INTRODUCTION Many kind of applications on the Internet are widely used. So it is important that quality of these services, such as response time and throughput, be high. To achieve high quality the service in network systems, system administrators should evaluate how their systems are working and should operate their systems so as to perform users’ requests and optimize performance. To manage network system performance, it is important for administrators to be aware of system usability factors, such as access delay, and process- ing time, and data transfer throughput. Several ways to evaluate the performance of network systems have been developed: Statistical analysis is applied to activity logging in servers. This is a popular way to evaluate server performance. However, this analysis cannot provide any hints about net- work links or clients. Benchmarking is another performance measurement method. It can provide various indices of server performance. However, the benchmark requires a spe- cial environment, and the results are valid only for that environment. Network monitor- ing allows us to evaluate network usage at the datalink level. However, It focuses net- Received August 30, 2001; accepted April 15, 2002. Communicated by Jang-Ping Sheu, Makoto Takizawa and Myongsoon Park.
Transcript of Development and Evaluation of QoS Measurement System for Internet
JOURNAL OF INFORMATION SCIENCE AND ENGINEERING 18, 891-904 (2002)
891
Development and Evaluation of QoS Measurement Systemfor Internet Applications by Client Observation�
HIROKI SAITO
Department of Information Systems and Multimedia DesignSchool of EngineeringTokyo Denki University
Chiyoda-ku, Tokyo, 101-8457, Japan
Various applications provide convenient services in the Internet. As these applica-tions are widely used, it is important that the quality of these services (QoS), such as theresponse time and throughput, be high. Several ways to measure network performancehave been developed. However, QoS management is still difficult because of the lack ofeffective tools to evaluate network system usability. The goal of our study was to de-velop a new QoS measurement system for network system usability. In our approach, wemeasure system usability and performance through mechanisms installed in the clients.The purpose of our system is to make clear the behavior of the client applications, andthis allows us to measure system performance and system usability. In this paper, wedescribe the fundamental concept behind client observation and its performance indices,and the design and implementation of a performance evaluation system implementedthrough observation. In addition, we confirm the effectiveness of our system throughexperiments.
Keywords: quality of service, quality evaluation, performance measurement, perform-ance management, network management, internet
1. INTRODUCTION
Many kind of applications on the Internet are widely used. So it is important thatquality of these services, such as response time and throughput, be high. To achieve highquality the service in network systems, system administrators should evaluate how theirsystems are working and should operate their systems so as to perform users’ requestsand optimize performance. To manage network system performance, it is important foradministrators to be aware of system usability factors, such as access delay, and process-ing time, and data transfer throughput.
Several ways to evaluate the performance of network systems have been developed:Statistical analysis is applied to activity logging in servers. This is a popular way to
evaluate server performance. However, this analysis cannot provide any hints about net-work links or clients. Benchmarking is another performance measurement method. It canprovide various indices of server performance. However, the benchmark requires a spe-cial environment, and the results are valid only for that environment. Network monitor-ing allows us to evaluate network usage at the datalink level. However, It focuses net-
Received August 30, 2001; accepted April 15, 2002.Communicated by Jang-Ping Sheu, Makoto Takizawa and Myongsoon Park.
HIROKI SAITO892
work equipment management in the network layer. Its results do not indicate the qualityof application services. This is because the application level performance includes notonly the characteristics of the datalink, but also many other performance factors.
Therefore, we need an evaluation method for end point application performance.The goal of our study was to develop a new quality evaluation system. In our approach,the performance through measurement mechanisms installed in clients are indices thesystems quality.
2. QUALITY EVALUATION FOR INTERNET APPLICATIONS
2.1 Quality of Internet Applications
To evaluate the quality of Internet applications from the point of view of usability,system administrators must know how their services are working and must improve themto satisfy user requests. The quality of Internet applications with regard to usability isdetermined by how the client provides performance to the user; that is, the system ad-ministrator should be aware of the performance factors in client system. These factors areas follows:
Response time:1. time that elapses while a transaction is performed in the clients;2. time that elapses while the clients send a request message to the servers;3. time elapses while the servers process the request message and prepare a response
message;4. time elapses while the servers send a response message to the clients.
Throughput:1. amount of data processing per seconds in a transaction;2. amount of data transfer per seconds in request message transferring;3. amount of data transfer per seconds in response message transferring.
Therefore, an evaluation tool are needed to measure mentioned above indices.
2.2 Necessary Functions of Evaluation Tools
We consider a common framework to evaluate the performance of an end point ap-plication. The evaluation tool should have the following functions:
1. The tool is able to measure the throughput and response speed at an end-pointapplication, which impact the user.The performance evaluation tool aims to improve the performance of theend-point application. The total system performance is not always related to theperformance of the network path. Therefore, the network system performanceshould be evaluated in the client applications.
2. The tool handle various kinds of datalinks.The Internet has been implemented on various datalinks, such as Ethernet, ATM,FDDI, Token Ring, X.25, xDSL, and so on. TCP/IP technology is a set of proto-
QOS MESUREMENT SYSTEM FOR INTERNET APPLICATIONS 893
cols of the upper layers of these datalinks. Therefore, the measurement methodshould be independent of datalinks.
3. The measurement tool be independent of applications.Various applications and application protocols are utilized on the Internet. Theperformance measurement approach should be a standard framework, and itshould not be dependent on a single application or a single application protocol.
4. The measurement tool should be applicable to existing applications without anymodification.It is costly to modify application software to operate a measurement tool. Also, anumber of applications would be difficult to modify for use with a measurementtool.
5. The measurement tool should be applicable to running systems.Using computer simulation, it is difficult to calculate all the performance factors,and the benchmark is only valid under specified conditions. It is more effectiveto evaluate running systems by measuring performance in a real situation.
2.3 Conventional Performance Measurement
Several tools to evaluate network performance have been developed:
1. Statistical analysis of server logs.Statistical analysis of server access logs allows us to determine the operationstatus of the servers, such as the number of accesses, the number of data transfers,and the processing time. However, the results of analysis of server logs only in-dicates the performance of the servers themselves. The performance of the clientsand the network links is not included in the results.
2. Measurement of network usage and Round Trip Time (RTT).The Simple Network Management Protocol (SNMP) is widely used to measurenetwork usage [1, 2].System administrators can use simple tools, such as ping and traceroute, to diag-nose networks. However, TCP performance degrades as network usage increases,and it is also affected by the characteristics of the network links [3, 4]. The per-formance of an end-point application is affected by not only the network usage,but also by the characteristics, end-to-end throughput, and capacity of the serversand clients.
3. Benchmark.Some benchmark tools are available, such as SPECweb [5], WebStone [6], ttcp,DBS [7] and so on. These tools provide many indices of exact application per-formance. However, it is difficult to set up suitable benchmark conditions in or-der to reproduce those of servers under actual operating conditions.
4. Packet dumping.Analysis of packet dumping provides many indices of the datalink level, such astcpdump [8] and snoop. Some tools, such as RMONv2 and ENMA [6], can calcu-late the indices in the TCP layer. However, packet dumping can only be appliedto specific datalinks and traffic shared networks, and it requires much CPU power.Even in the Ethernet environment, packets can not be observed in a switchednetwork.
HIROKI SAITO894
Accordingly, we need a new performance evaluation tool for network systems thatcan be applied to actual systems operation under various configurations.
3. EVALUATION METHOD BY CLIENT OBSERVATION
3.1 Fundamental of Client Observation
The goal of our performance evaluation method is to provide a suitable, commonframework to measure network system performance usability. We do this by measuringthe actual network system performance from the user’s point of view.
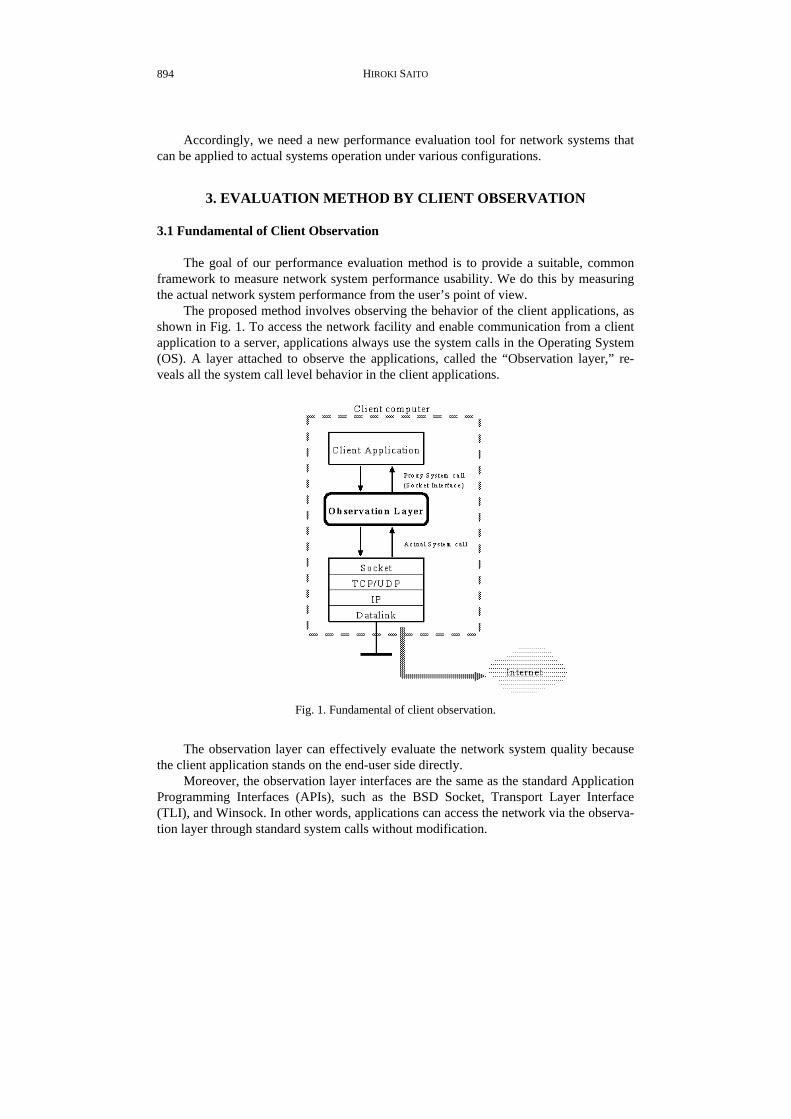
The proposed method involves observing the behavior of the client applications, asshown in Fig. 1. To access the network facility and enable communication from a clientapplication to a server, applications always use the system calls in the Operating System(OS). A layer attached to observe the applications, called the “Observation layer,” re-veals all the system call level behavior in the client applications.
Fig. 1. Fundamental of client observation.
The observation layer can effectively evaluate the network system quality becausethe client application stands on the end-user side directly.
Moreover, the observation layer interfaces are the same as the standard ApplicationProgramming Interfaces (APIs), such as the BSD Socket, Transport Layer Interface(TLI), and Winsock. In other words, applications can access the network via the observa-tion layer through standard system calls without modification.
QOS MESUREMENT SYSTEM FOR INTERNET APPLICATIONS 895
3.2 Communication Model in the Observation Layer
In this section, we describe the target communication model for measurementthrough the observation layer.
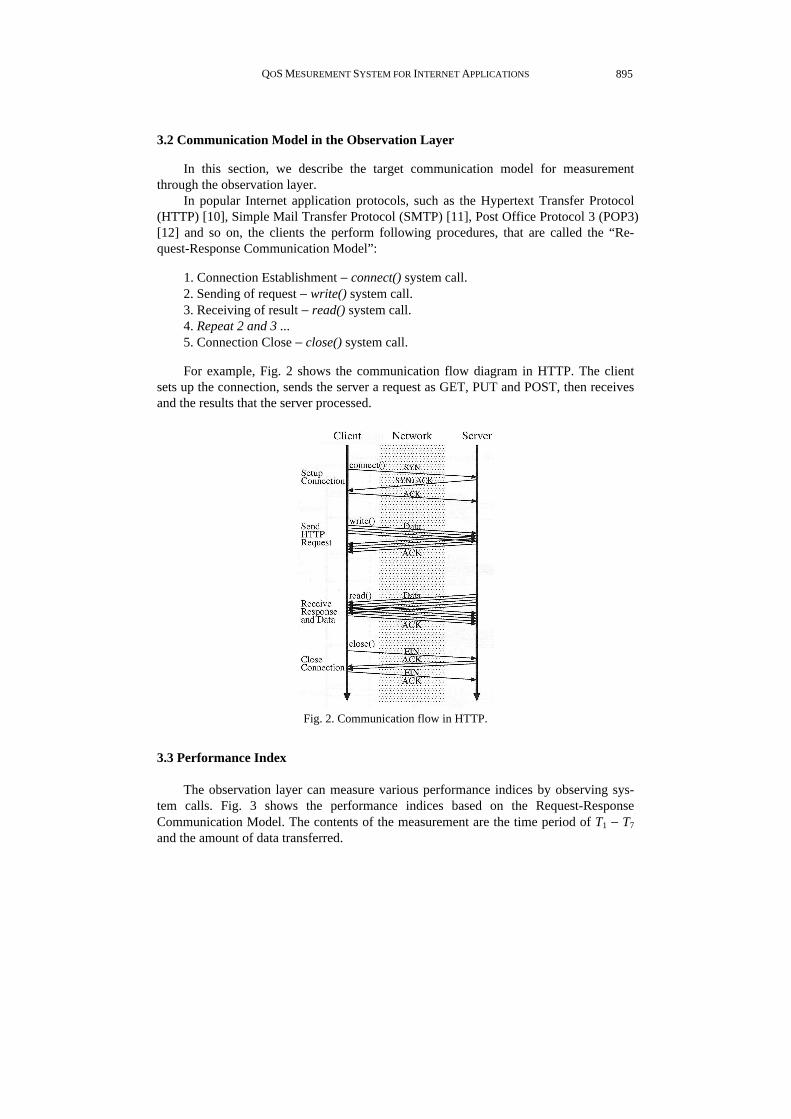
In popular Internet application protocols, such as the Hypertext Transfer Protocol(HTTP) [10], Simple Mail Transfer Protocol (SMTP) [11], Post Office Protocol 3 (POP3)[12] and so on, the clients the perform following procedures, that are called the “Re-quest-Response Communication Model”:
1. Connection Establishment − connect() system call.2. Sending of request − write() system call.3. Receiving of result − read() system call.4. Repeat 2 and 3 ...5. Connection Close − close() system call.
For example, Fig. 2 shows the communication flow diagram in HTTP. The clientsets up the connection, sends the server a request as GET, PUT and POST, then receivesand the results that the server processed.
Fig. 2. Communication flow in HTTP.
3.3 Performance Index
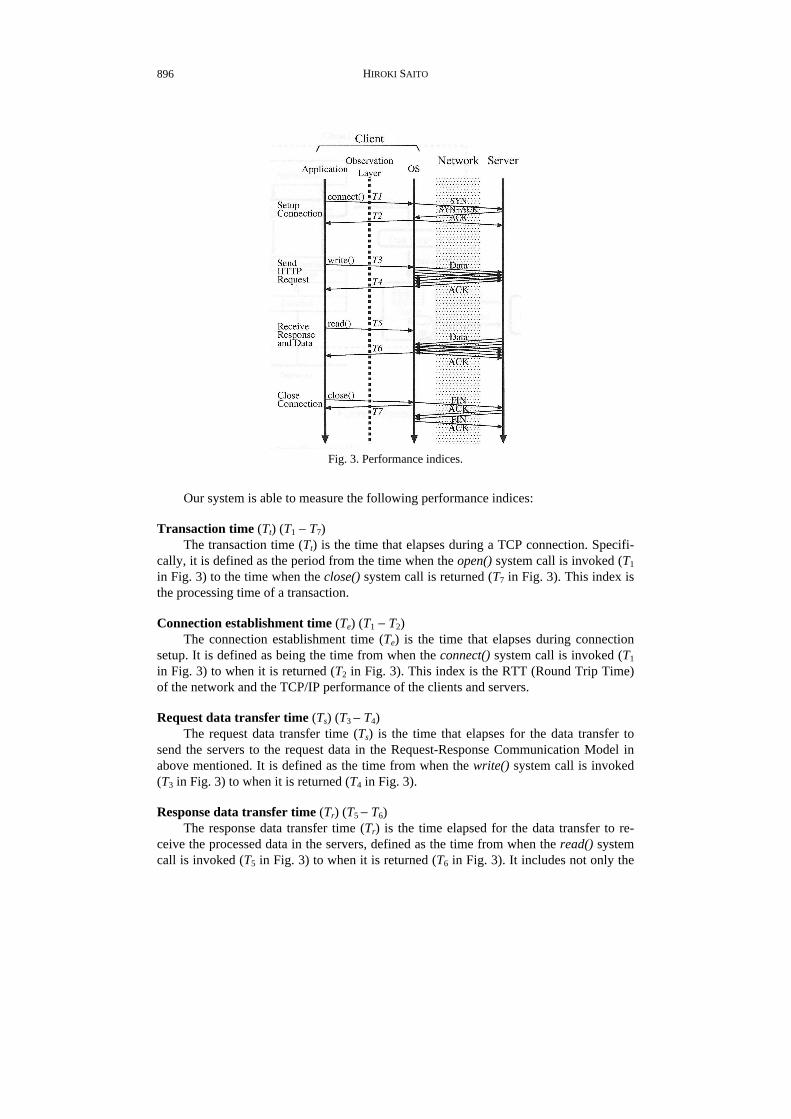
The observation layer can measure various performance indices by observing sys-tem calls. Fig. 3 shows the performance indices based on the Request-ResponseCommunication Model. The contents of the measurement are the time period of T1 − T7
and the amount of data transferred.
HIROKI SAITO896
Fig. 3. Performance indices.
Our system is able to measure the following performance indices:
Transaction time (Tt) (T1 − T7)The transaction time (Tt) is the time that elapses during a TCP connection. Specifi-
cally, it is defined as the period from the time when the open() system call is invoked (T1
in Fig. 3) to the time when the close() system call is returned (T7 in Fig. 3). This index isthe processing time of a transaction.
Connection establishment time (Te) (T1 − T2)The connection establishment time (Te) is the time that elapses during connection
setup. It is defined as being the time from when the connect() system call is invoked (T1
in Fig. 3) to when it is returned (T2 in Fig. 3). This index is the RTT (Round Trip Time)of the network and the TCP/IP performance of the clients and servers.
Request data transfer time (Ts) (T3 − T4)The request data transfer time (Ts) is the time that elapses for the data transfer to
send the servers to the request data in the Request-Response Communication Model inabove mentioned. It is defined as the time from when the write() system call is invoked(T3 in Fig. 3) to when it is returned (T4 in Fig. 3).
Response data transfer time (Tr) (T5 − T6)The response data transfer time (Tr) is the time elapsed for the data transfer to re-
ceive the processed data in the servers, defined as the time from when the read() systemcall is invoked (T5 in Fig. 3) to when it is returned (T6 in Fig. 3). It includes not only the
QOS MESUREMENT SYSTEM FOR INTERNET APPLICATIONS 897
time that elapses during for the data transfer, but also the time needed to process a re-quest in the servers. Therefore, this value indicates the performance of the server systemsand the network.
Request data size (Ds)The request data size (Ds) is the amount of data transferred to the servers as the re-
quest. It is defined as the number of bytes transmitted by write() system call.
Response data size (Dr)The response data size (Dr) is the amount of data transferred from the servers as the
response. It is defined as the number of bytes received by read() system call.
Request data transfer rate (Rs)The request data transfer rate (Rs) is the transfer rate of the requested data sent to the
servers. It is defined as
)timetransferdataRequest(
)sizedataRequest(
s
ss T
DR = . (1)
Response data transfer rate (Rr)The response data transfer rate (Rr) is the transfer rate of the data returned by the
servers. It is defined as
)timetransferdataResponse(
)sizedataResponse(
r
rr T
DR = . (2)
Transaction transfer rate (Ra)The transaction transfer rate (Ra) is the rate of all data transferred during the time
that elapses during the entire process. It is a performance index based on the data size ofthe transaction. It is defined as
)on time(Transacti
size)dataResponse()sizedataRequest(
t
rsa T
DDR
∑∑ += . (3)
4. DESIGN OF PERFORMANCE EVALUATION SYSTEM
4.1 System Model
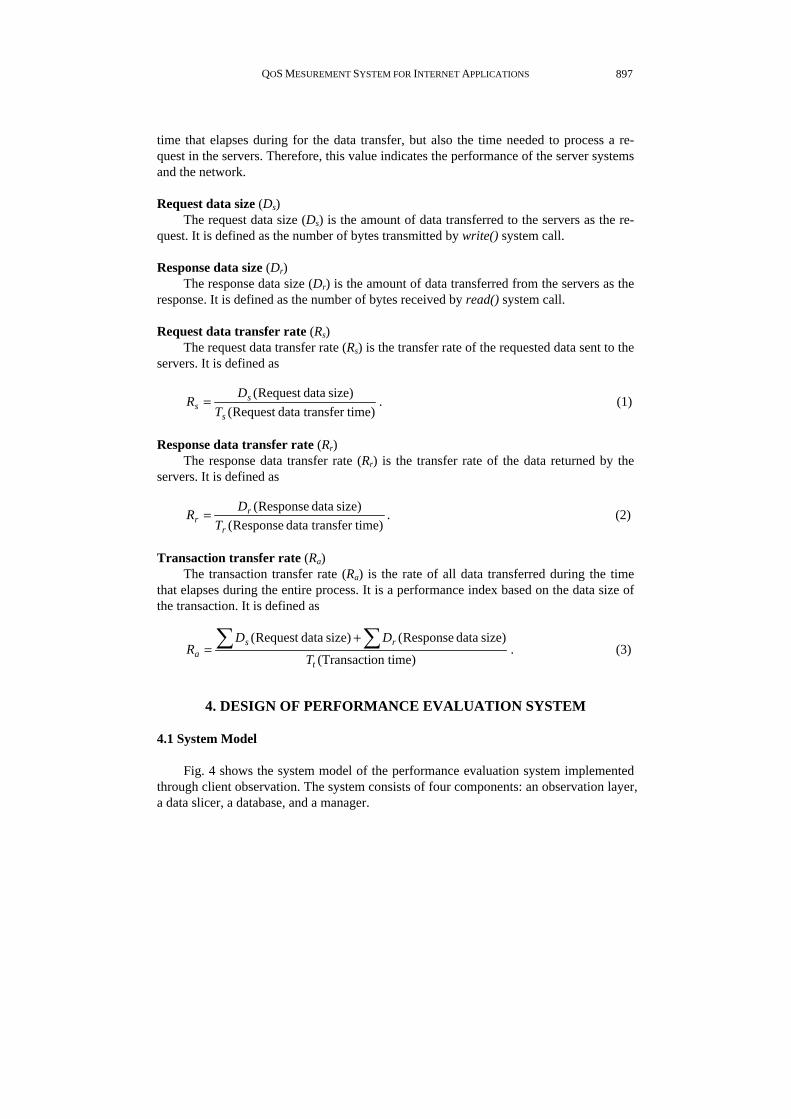
Fig. 4 shows the system model of the performance evaluation system implementedthrough client observation. The system consists of four components: an observation layer,a data slicer, a database, and a manager.
HIROKI SAITO898
Fig. 4. System structure.
4.1.1 Observation layer
The observation layer monitors the system calls between the applications and theOS.
The observation layer has proxy system call functions. The proxy system call func-tions stands for the application instead of the actual system call functions in the OS.When the application calls system calls, the proxy system call procedures in the observa-tion layer are invoked. Then the observation layer records the time of each state (T1 − T7),counts the amount of data transferred in each TCP connection, and simultaneously, in-vokes the actual system call in the OS.
4.1.2 Data slicer
The data slicer processes the measured raw data in the observation layer with theconditions such as the IP address and the port number, and performs basic analysis.
4.1.3 Database
The data slicer stores the processed data in the database. The database is used forfurther analysis by the manager.
The database consists of a matrix into which are put the server address, port number,time elapsing in each state, data size, and transfer rate in time stamp order. The structureof the database is quite simple because a data entry for each TCP connection forms a
QOS MESUREMENT SYSTEM FOR INTERNET APPLICATIONS 899
single row of data. Therefore, it reduces the amount of overhead for measurement in theclients.
4.1.4 Manager
The manager collects measurement data from the target of the remote clients. Itanalyzes the data and provides a graphical interpretation of the results. Currently, themanager is implemented as the interface to Gnuplot to view the analysis results.
4.2 Implementation
We are currently implementing the performance evaluation system on World WideWeb (WWW) systems. The observation layer, data slicer, and database are implementedin ANSI C on Sun Solaris. The manager is implemented in shell programs and C pro-grams.
The observation layer has a proxy BSD Socket interface for invoking from the tar-get application. The proxy interface is implemented as a shared library that uses dynamiclinking. It enables replacement of the actual Socket interface in the OS with the proxySocket interface in the observation layer when the application is executed dynamically.Therefore, no modification of the application program is needed for measurement. Evenif the target system does not have dynamic linking facilities, we do not have to modifythe application; we recompile/link to the observation layer module as a static library.
The proxy Socket interface is invoked when the application calls a Socket systemcall to access the network. The observation layer monitors connection open, close, write,and read, records the time that elapses, and counts the data transfers. It continuously callsactual Socket system calls in the OS.
5. EXPERIMENTS CONDUCTED TO EVALUATE THEEFFECTIVENESS OF OUR APPROACH
5.1 Comparison of Our System With Server Log Analysis
In order to evaluate our implementation, we applied our system to actual runningsystems.
To confirm the measurement accuracy of our system, we compared the measure ofour system with the analysis results of the server access log. Statistical analysis of theserver access log was used to evaluate the performance.
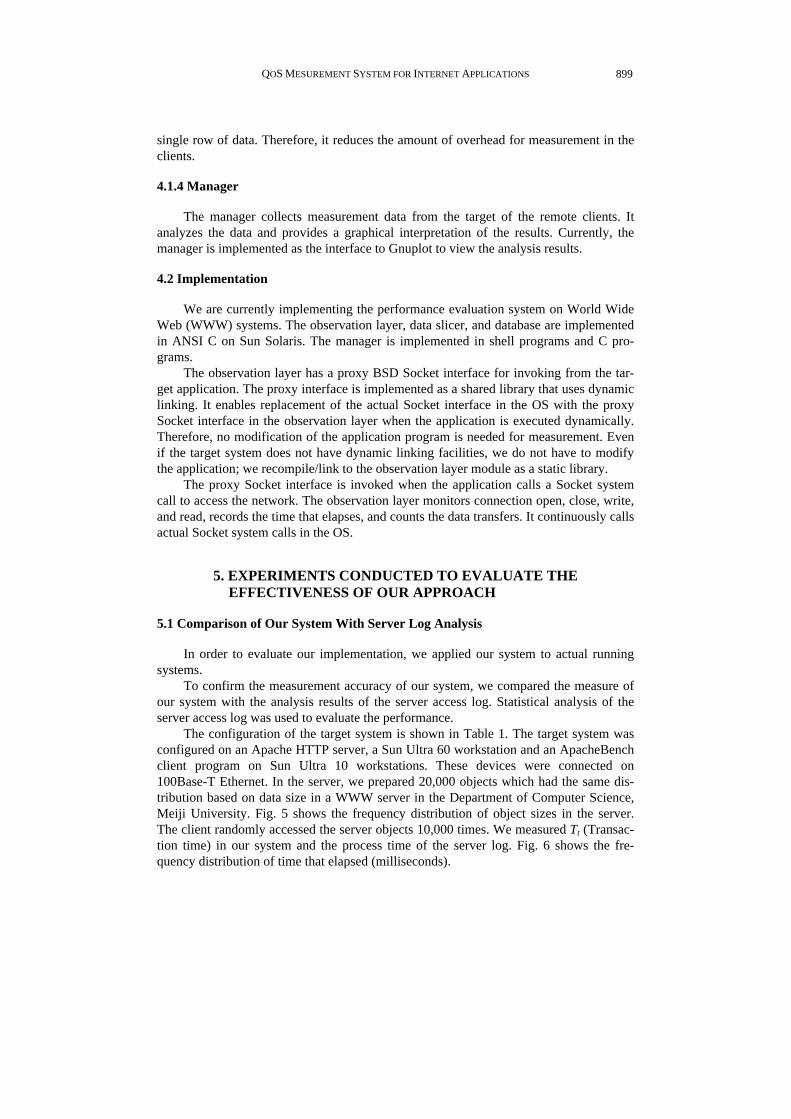
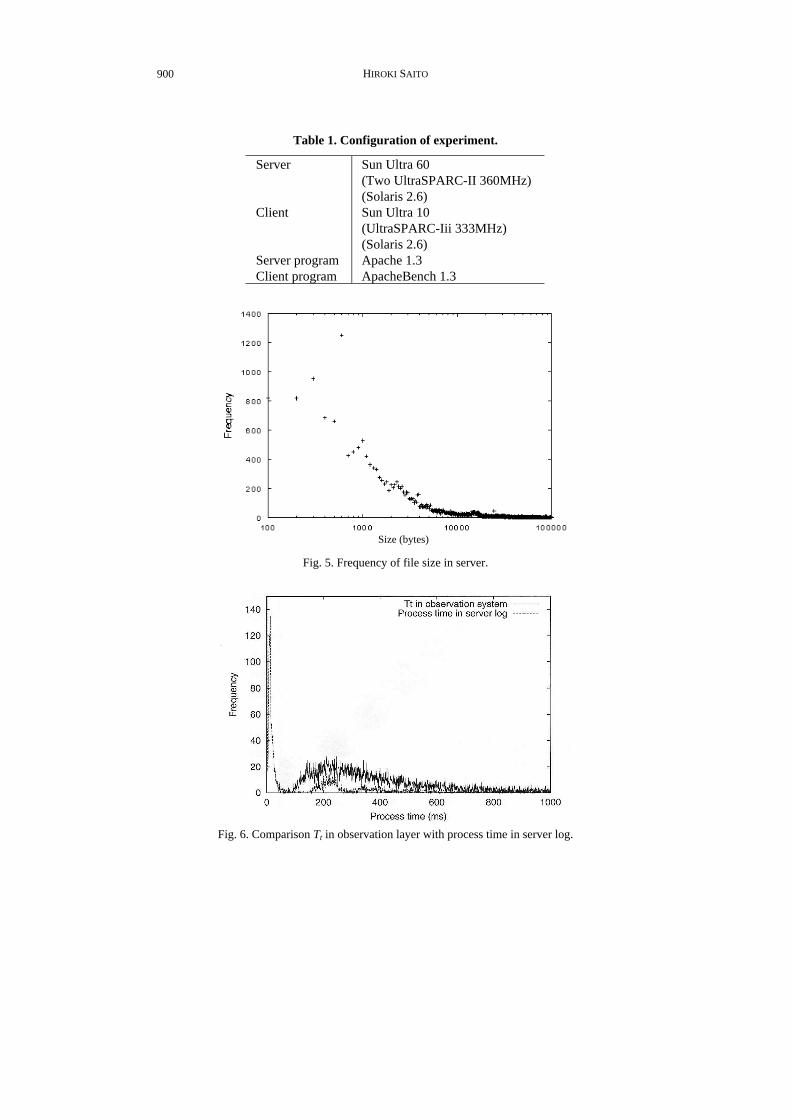
The configuration of the target system is shown in Table 1. The target system wasconfigured on an Apache HTTP server, a Sun Ultra 60 workstation and an ApacheBenchclient program on Sun Ultra 10 workstations. These devices were connected on100Base-T Ethernet. In the server, we prepared 20,000 objects which had the same dis-tribution based on data size in a WWW server in the Department of Computer Science,Meiji University. Fig. 5 shows the frequency distribution of object sizes in the server.The client randomly accessed the server objects 10,000 times. We measured Tt (Transac-tion time) in our system and the process time of the server log. Fig. 6 shows the fre-quency distribution of time that elapsed (milliseconds).
HIROKI SAITO900
Table 1. Configuration of experiment.
Server
Client
Server programClient program
Sun Ultra 60(Two UltraSPARC-II 360MHz)(Solaris 2.6)Sun Ultra 10(UltraSPARC-Iii 333MHz)(Solaris 2.6)Apache 1.3ApacheBench 1.3
Size (bytes)
Fig. 5. Frequency of file size in server.
Fig. 6. Comparison Tt in observation layer with process time in server log.
QOS MESUREMENT SYSTEM FOR INTERNET APPLICATIONS 901
The results were distributed around 200ms for Tt of our system and concentratedaround 10ms in the server log. The average of our system was 815ms, and one of theserver logs was 418ms. The difference reached 51 percent.
Tt in our system is the entire time that elapses during the transaction, including thetime needed for connection setup, data transfer, and connection close procedures in theSocket layer. In contrast, the server log records only the server side application activity.Therefore, the server log cannot measure performance with respect to connectionsetup/closing.
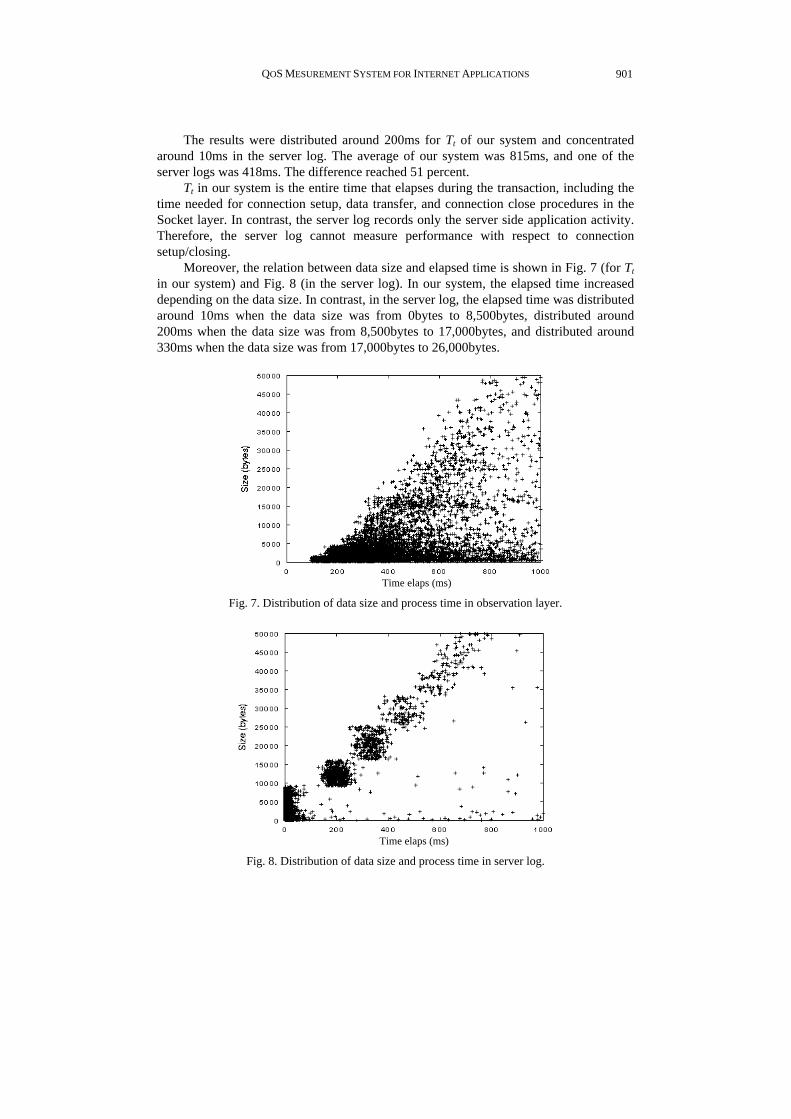
Moreover, the relation between data size and elapsed time is shown in Fig. 7 (for Tt
in our system) and Fig. 8 (in the server log). In our system, the elapsed time increaseddepending on the data size. In contrast, in the server log, the elapsed time was distributedaround 10ms when the data size was from 0bytes to 8,500bytes, distributed around200ms when the data size was from 8,500bytes to 17,000bytes, and distributed around330ms when the data size was from 17,000bytes to 26,000bytes.
Time elaps (ms)
Fig. 7. Distribution of data size and process time in observation layer.
Time elaps (ms)
Fig. 8. Distribution of data size and process time in server log.
HIROKI SAITO902
The server logs records the performance in the application level on the server side.Once the data are put into the buffer in the OS, before an actual transmission occurs, itappears that data transfers are completed early in the server programs. Since the size ofthe socket buffer is configured at about 8kbytes in the Solaris environment, the transmis-sion process is carried out in blocks of 8kbytes.
Generally, because almost all WWW contents on the Internet consist of 8kbyte orsmaller objects [13], server logs are inaccurate records.
Therefore, our system is more accurate than the conventional method based on theexperimental results.
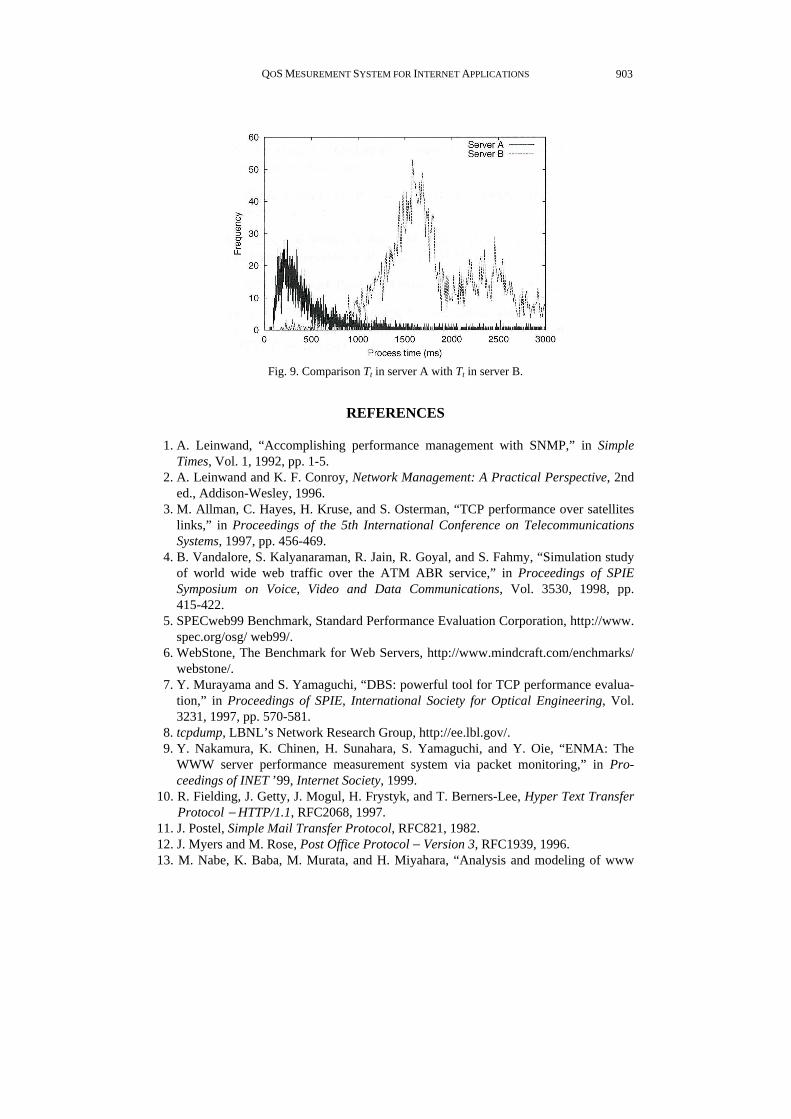
5.2 Comparison of Server Performance
We conducted other experiments to measure the performance of the server. Wecompared a measurement of the “Fast” server with one of the “Slow” server.
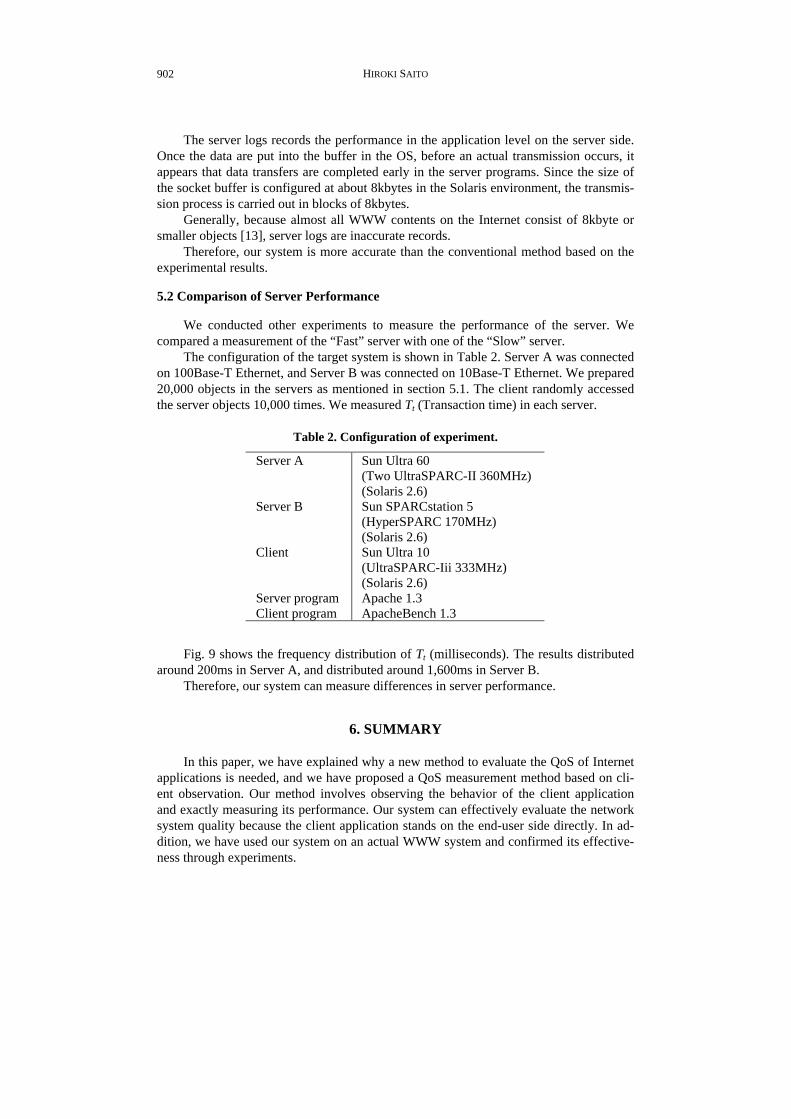
The configuration of the target system is shown in Table 2. Server A was connectedon 100Base-T Ethernet, and Server B was connected on 10Base-T Ethernet. We prepared20,000 objects in the servers as mentioned in section 5.1. The client randomly accessedthe server objects 10,000 times. We measured Tt (Transaction time) in each server.
Table 2. Configuration of experiment.
Server A
Server B
Client
Server programClient program
Sun Ultra 60(Two UltraSPARC-II 360MHz)(Solaris 2.6)Sun SPARCstation 5(HyperSPARC 170MHz)(Solaris 2.6)Sun Ultra 10(UltraSPARC-Iii 333MHz)(Solaris 2.6)Apache 1.3ApacheBench 1.3
Fig. 9 shows the frequency distribution of Tt (milliseconds). The results distributedaround 200ms in Server A, and distributed around 1,600ms in Server B.
Therefore, our system can measure differences in server performance.
6. SUMMARY
In this paper, we have explained why a new method to evaluate the QoS of Internetapplications is needed, and we have proposed a QoS measurement method based on cli-ent observation. Our method involves observing the behavior of the client applicationand exactly measuring its performance. Our system can effectively evaluate the networksystem quality because the client application stands on the end-user side directly. In ad-dition, we have used our system on an actual WWW system and confirmed its effective-ness through experiments.
QOS MESUREMENT SYSTEM FOR INTERNET APPLICATIONS 903
Fig. 9. Comparison Tt in server A with Tt in server B.
REFERENCES
1. A. Leinwand, “Accomplishing performance management with SNMP,” in SimpleTimes, Vol. 1, 1992, pp. 1-5.
2. A. Leinwand and K. F. Conroy, Network Management: A Practical Perspective, 2nded., Addison-Wesley, 1996.
3. M. Allman, C. Hayes, H. Kruse, and S. Osterman, “TCP performance over satelliteslinks,” in Proceedings of the 5th International Conference on TelecommunicationsSystems, 1997, pp. 456-469.
4. B. Vandalore, S. Kalyanaraman, R. Jain, R. Goyal, and S. Fahmy, “Simulation studyof world wide web traffic over the ATM ABR service,” in Proceedings of SPIESymposium on Voice, Video and Data Communications, Vol. 3530, 1998, pp.415-422.
5. SPECweb99 Benchmark, Standard Performance Evaluation Corporation, http://www.spec.org/osg/ web99/.
6. WebStone, The Benchmark for Web Servers, http://www.mindcraft.com/enchmarks/webstone/.
7. Y. Murayama and S. Yamaguchi, “DBS: powerful tool for TCP performance evalua-tion,” in Proceedings of SPIE, International Society for Optical Engineering, Vol.3231, 1997, pp. 570-581.
8. tcpdump, LBNL’s Network Research Group, http://ee.lbl.gov/.9. Y. Nakamura, K. Chinen, H. Sunahara, S. Yamaguchi, and Y. Oie, “ENMA: The
WWW server performance measurement system via packet monitoring,” in Pro-ceedings of INET ’99, Internet Society, 1999.
10. R. Fielding, J. Getty, J. Mogul, H. Frystyk, and T. Berners-Lee, Hyper Text TransferProtocol − HTTP/1.1, RFC2068, 1997.
11. J. Postel, Simple Mail Transfer Protocol, RFC821, 1982.12. J. Myers and M. Rose, Post Office Protocol − Version 3, RFC1939, 1996.13. M. Nabe, K. Baba, M. Murata, and H. Miyahara, “Analysis and modeling of www
HIROKI SAITO904
traffic for designing internet traffic,” IEICE Transaction, Vol. J80-B1, 1997, pp.428-437.
14. H. Saito and T. Chusho, “Design and implementation of network performanceevaluation system through client observation,” in Proceedings of INET2000, InternetSociety, 2000.
15. H. Saito and T. Chusho, “Quality evaluation of network services by client observa-tion,” in Proceedings of the 15th International Conference on Information Network-ing ’01 (ICOIN15 ’01), pp. 568-575.
Hiroki Saito was born in Tokyo. He received B.S., M.E. andPh. D degrees in Computer Science from Meiji University, Japan,in 1996, 1998 and 2001, respectively. He is since 2002 an in-structor in the Department of Information Systems and Multime-dia Design, School of Engineering, Tokyo Denki University, Ja-pan. He is a member of Internet Society, Information ProcessingSociety Japan and Japan Society for Software Science and Tech-nology. His research interest includes performance measurementin the Internet, network management and Internet architecture.