Development and characterization of polymer- metallic ...
129
HAL Id: tel-00844736 https://tel.archives-ouvertes.fr/tel-00844736 Submitted on 15 Jul 2013 HAL is a multi-disciplinary open access archive for the deposit and dissemination of sci- entific research documents, whether they are pub- lished or not. The documents may come from teaching and research institutions in France or abroad, or from public or private research centers. L’archive ouverte pluridisciplinaire HAL, est destinée au dépôt et à la diffusion de documents scientifiques de niveau recherche, publiés ou non, émanant des établissements d’enseignement et de recherche français ou étrangers, des laboratoires publics ou privés. Development and characterization of polymer- metallic powder feedstocks for micro-injection molding Xiangji Kong To cite this version: Xiangji Kong. Development and characterization of polymer- metallic powder feedstocks for micro- injection molding. Other. Université de Franche-Comté, 2011. English. NNT : 2011BESA2029. tel-00844736
Transcript of Development and characterization of polymer- metallic ...

HAL Id: tel-00844736https://tel.archives-ouvertes.fr/tel-00844736
Submitted on 15 Jul 2013
HAL is a multi-disciplinary open accessarchive for the deposit and dissemination of sci-entific research documents, whether they are pub-lished or not. The documents may come fromteaching and research institutions in France orabroad, or from public or private research centers.
L’archive ouverte pluridisciplinaire HAL, estdestinée au dépôt et à la diffusion de documentsscientifiques de niveau recherche, publiés ou non,émanant des établissements d’enseignement et derecherche français ou étrangers, des laboratoirespublics ou privés.
Development and characterization of polymer- metallicpowder feedstocks for micro-injection molding
Xiangji Kong
To cite this version:Xiangji Kong. Development and characterization of polymer- metallic powder feedstocks for micro-injection molding. Other. Université de Franche-Comté, 2011. English. �NNT : 2011BESA2029�.�tel-00844736�

2011
Ph. D. thesis
Prepared at
L’U.F.R. DES SCIENCES ET TECHNIQUES DE L’UNIVERSITÉ DE FRANCHE-COMTE In order to obtain the
GRADE DE DOCTEUR DE L’UNIVERSITÉ DE FRANCHE-COMTE Spécialité: Sciences pour l’Ingénieur
DEVELOPPEMENT ET CARACTERISATION DE MELANGES POLYMERES-POUDRES METALLIQUES POUR LE MICRO MOULAGE PAR INJECTION DEVELOPMENT AND CHARACTERIZATION OF POLYMER- METALLIC POWDER FEEDSTOCKS FOR MICRO-INJECTION MOLDING
by
Xiangji KONG Defense on 7th February 2011, defense committee:
Advisor
Co-advisor
Reviewers
Examinators
-
T. BARRIERE
J.-C. GELIN
Y. BIENVENU
J.M.TORRALBA
F. BERNARD
E. CARREÑO-MORELLI
F. VALDIVIESO
H. BERTHIAUX
Professor, University of Franche-Comté, Besançon
Professor, ENSMM, Besançon
Professor, Mines ParisTech, Paris
Professor, University of Madrid, Spain
Professor, University of Bourgogne, Dijon
Professor, University of Applied Sciences Western, Switzerland
HdR, Ecole Nationale Supérieure des Mines de St-Etienne
Professor, Ecole des Mines d'Albi-Carmaux


Doctoral Dissertation of Université de Franche-Comté
I
Abstract
Micro-PIM technology is one of the key technologies to satisfy the increasing demands for smaller parts
associated to miniaturization and functionalization in different application fields. The thesis focuses on
the elaboration and characterization of feedstock based on 316L stainless steel powders, identification of
physical material parameters associated to the sintering stage and on the numerical simulations of the
sintering process.
Feedstock formulations with new binder systems composed of different polymeric binder systems have
been proposed for various 316L stainless steel powders (5 µm and 16 µm). Characterization of the
resulting feedstocks for each group is carried out through mixing torque tests and viscosity tests. The
feedstock associated to formulation with polypropylene + paraffin wax + stearic acid is well adapted for
both powders and retained in the subsequent tests, due to the low mixing torque and shear viscosity. The
critical powder volume loading with 316L stainless steel powder (5 µm) according to the retained
formulation is determined at 68% using four different methods. Micro mono-material injection (with
316L stainless steel feedstock) and bi-material injection (with 316L stainless steel feedstock and Cu
feedstock) are properly investigated. Homogeneity tests are performed for the feedstocks before and
after injection.
A physical model well suited for sintering stage is proposed for the simulation of sintering stage. The
parameters identifications of the proposed model are carried out for the sintering stages considering
316L stainless steel (5 µm) feedstocks with various powder volume loadings (62%, 64% and 66%). By
beam-bending tests and free sintering tests through TMA in a vertical dilatometer are investigated.
Three sintering stages corresponding to heating rates equal 5 °C/min, 10 °C/min and 15 °C/min are used
during both beam-bending tests and free sintering tests.
On basis of the results obtained from dilatometry measurements, the shear viscosity module G, the bulk
viscosity module K and the sintering stress σs are identified using Matlab® software. Afterwards, the
sintering model is implemented in the Abaqus® finite element codes, the element that are used
correspond to R3D4 and C3D8R for the support and the four micro-specimens, respectively. The
physical material parameters resulting from the identification experiments are used to define the 316L
stainless steel feedstock, together with the identified G, K and σs. Finally, the sintering stage at 1200 °C
with three heating rates (5 °C/min, 10 °C/min and 15 °C/min) are also simulated corresponding to the
four types of micro-specimen (powder volume loading of 62%, 64% and 66%). The simulated
shrinkages and relative densities of the sintered micro-specimens are compared to the experimental
results and the agreement is good.
Keywords: Micro-Metal Injection Molding, Bi-material injection, Sintering, 316L Stainless Steel,
Material modeling, Numerical Simulation

Doctoral Dissertation of Université de Franche-Comté
II
ABSTRACT ............................................................................................................................................................... I
ACKNOWLEDGMENTS ....................................................................................................................................... IV
INTRODUCTION ..................................................................................................................................................... 1
CHAPTER 1. STATE OF THE ART ................................................................................................................... 5
1.1. POWDER METALLURGY ............................................................................................................................ 5 1.1.1. Brief introduction of powder metallurgy .............................................................................................. 5 1.1.2. Powder metallurgy history ................................................................................................................... 5 1.1.3. Industry of powder metallurgy ............................................................................................................. 6 1.1.4. Advantages of powder metallurgy ........................................................................................................ 6
1.2. POWDER INJECTION MOULDING ............................................................................................................... 7 1.2.1. Powder injection moulding market ...................................................................................................... 8 1.2.2. Raw material for metal powder injection moulding process ................................................................10
1.3. METAL POWDER INJECTION MOLDING PROCESS .....................................................................................13 1.3.1. Bi-material metal powder injection moulding process.........................................................................18 1.3.2. Micro metallic powder injection moulding process .............................................................................18 1.3.3. Biomedical metallic powder injection moulding process .....................................................................19 1.3.4. Limitations of metal injection moulding process .................................................................................20 1.3.5. Advantages of powder injection moulding process ..............................................................................20
1.4. RESEARCHES IN METAL POWDER INJECTION MOULDING PROCESS ..........................................................22 1.4.1. The scientific papers and associated patents in the area of MIM ........................................................22 1.4.2. The principal research centers in MIM processing .............................................................................22 1.4.3. Research centers concentrated on modeling and simulation of Metal Injection Moulding Process ....23 1.4.4. Researches about MIM process in France ..........................................................................................23
CHAPTER 2. DEVELOPMENT AND CHARACTERIZATION OF FEEDSTOCKS BASED ON FINE
POWDERS WITH HIGH VOLUME FRACTION LOADING ..............................................................................25
2.1. POWDERS, PROCESSING AND CHARACTERISTICS .....................................................................................25 2.1.1. Main powders type ..............................................................................................................................25 2.1.2. Powders used in the previous Ph. D. theses carried out at FEMTO-ST ..............................................26 2.1.3. Powders used in the related experiments and analyses........................................................................26
2.2. BINDER ....................................................................................................................................................29 2.2.1. The role of binder in MIM processes ..................................................................................................29 2.2.2. Choice of a proper binder ...................................................................................................................29
2.3. MAIN PROPERTIES OF FEEDSTOCKS.........................................................................................................31 2.3.1. Involved equipment to investigate the characteristics and properties of the feedstock .........................31
2.4. FEEDSTOCK FORMULATION .....................................................................................................................35 2.5. CHOICE OF THE APPROPRIATE FEEDSTOCK FORMULATION THROUGH PHYSICAL TESTING......................36
2.5.1. Mixing Torque Tests ...........................................................................................................................36 2.5.2. Viscosity Tests.....................................................................................................................................38
2.6. DETERMINATION OF CRITICAL POWDER LOADING ..................................................................................40 2.6.1. Mixing tests by continuously increasing powder loading ....................................................................40 2.6.2. Mixing tests by batch powder loading .................................................................................................41 2.6.3. Rheological tests ................................................................................................................................42 2.6.4. Feedstock viscosity model ...................................................................................................................42
2.7. HOMOGENEITY TESTS FOR THE FEEDSTOCKS ..........................................................................................45 2.8. SELECTED FEEDSTOCK FOR THE SUBSEQUENT EXPERIMENTS .................................................................47 SUMMARY .............................................................................................................................................................48
CHAPTER 3. MICRO-MIM PROCESS FOR MINIATURIZATION AND FUNCTIONALIZATION ...........50
3.1. EQUIPMENT USED FOR INJECTION MOLDING STAGE ................................................................................50 3.1.1. Arburg 220-S injection moulding equipment ......................................................................................50 3.1.2. Battenfeld Microsystem 50 injection moulding equipment ..................................................................51 3.1.3. Mould design and micro machining ...................................................................................................52
3.2. MONO INJECTION FOR THE PHYSICAL IDENTIFICATIONS OF THE FEEDSTOCKS .......................................53 3.3. MICRO INJECTION OF THE SPECIMENS USED FOR VALIDATION OF THE SIMULATIONS .............................54 3.4. HOMOGENEITY TESTS OF THE INJECTED SPECIMENS FROM MICRO INJECTION .......................................55 3.5. BI-MATERIAL INJECTION MOLD WITH TWO-PLATE MOLD .......................................................................57 3.6. BI-MATERIAL INJECTION WITH THREE-PLATE MOLD ..............................................................................59 SUMMARY .............................................................................................................................................................60

Doctoral Dissertation of Université de Franche-Comté
III
CHAPTER 4. DEBINDING AND SINTERING STAGES OF MIM PROCESS FOR THE COMPONENTS
OBTAINED BY BI-MATERIAL AND MICRO-INJECTION ...............................................................................61
4.1. THERMAL DEBINDING STAGE ..................................................................................................................61 4.1.1. Equipment used for thermal debinding stage ......................................................................................61 4.1.2. Debinding cycles and atmosphere .......................................................................................................62
4.2. SINTERING STAGE BY SOLID STATE DIFFUSION ........................................................................................64 4.2.1. Equipment used for sintering stage .....................................................................................................65 4.2.2. Sintering cycles for bi-material injected specimens .............................................................................65 4.2.3. Sintering cycles for micro-injected specimens .....................................................................................68 4.2.4. Physical properties of the resulted micro-parts at the end of the processing stage ...............................69
SUMMARY .............................................................................................................................................................71
CHAPTER 5. IDENTIFICATION OF CONSTITUTIVE MATERIAL PARAMETERS AND NUMERICAL
SIMULATION OF THE SINTERING STAGE IN MICRO-MIM .........................................................................73
5.1. CONSTITUTIVE SINTERING MODEL ..........................................................................................................73 5.2. SINTERING PARAMETERS IDENTIFICATION ..............................................................................................77
5.2.1. Identification tests in vertical dilatometer ...........................................................................................78 5.2.2. Numerical identification of the sintering model ..................................................................................84
5.3. FE SIMULATION OF THE SINTERING STAGE FOR THE COMPONENTS FROM MICRO-MIM WITH 316 L
STAINLESS STEEL FEEDSTOCK ...............................................................................................................................91 5.3.1. Prediction of shrinkages for micro- injected specimens with 316L stainless steel feedstock (D50=3.4 µm,
formulation F3) ................................................................................................................................................93 5.3.2. Prediction of relative density for the micro-injected specimens with 316L stainless steel feedstock (D50=3.4 µm, formulation F3) ..........................................................................................................................95
SUMMARY .............................................................................................................................................................98
CHAPTER 6. CONCLUSIONS AND PERSPECTIVES ....................................................................................99
6.1. CONCLUSIONS .........................................................................................................................................99 6.2. PERSPECTIVES....................................................................................................................................... 101
6.2.1. Experiments and processing ............................................................................................................. 101 6.2.2. Computational developments ............................................................................................................ 101
APPENDIX I: SIMULATED SHRINKAGES AND COMPARISONS BETWEEN THE NUMERICAL AND
EXPERIMENTAL RESULTS ............................................................................................................................... 102
APPENDIX II: SIMULATED RELATIVE DENSITY DISTRIBUTIONS .......................................................... 108
BIBLIOGRAPHY .................................................................................................................................................. 110

Doctoral Dissertation of Université de Franche-Comté
IV
Acknowledgments
I would like to express my appreciation and thanks to my thesis advisors, Professor Thierry Barriere
(Université de Franche-Comté, France) and Professor Jean-Claude Gelin (ENSMM, France), for their
kindly advice, clear guidance and helpful assistance during the whole research course. Their rich
experiences on powder injection moulding process, advanced knowledge on material forming
technology and valuable notions on numerical simulation are indispensable for the progress of my
dissertation, which strengthen the foundation of my professional and scientific career in the future.
Special thanks go to the reviewers Pr. Yves Bienvenu (Mines ParisTech, France) and Pr. Jose Manuel
TORRALBA (University of Madrid, Spain), their valuable suggestions are incorporated in the final
thesis.
I would like to appreciate Gérard Michel (ENSMM, France) and Camille Garcin (FEMTO-ST/Applied
Mechanics, France) for their works on manufacturing of injection molds employed in my thesis, also for
Guillame Larsen (Ph. D. student in the research team) for the design of the bi-material injection mold. I
am obligated to thank Jiupeng Song (Doctor, China) for the kindly help on the simulation with Matlab®
and Abaqus®. I am thankful to Huibin Ou (ENSMM, France) for his assistance on my experimental and
numerical works. Still many thanks to my colleagues in office 43H for their company: Elie Gibeau,
Cédric Quinard, Cyrille Barbier, Frédéric Thiebaud, Gang Cheng, Edouard Falconnet and Belgacem
Mamen.
I would like to thank the French government for the scholarship that affords my three years’ study in
France. Finally I especially express my great respect to my family for the continuous supports. I
especially thank my girlfriend Caomeng Sun for her precious encouragement throughout the entire
duration of my thesis.

Introduction
1
Introduction
Powder injection molding of metals (MIM) process is adapted from polymer injection molding
techniques, and it has already been focused and developed for several decades. Now this process draws
more and more attention due to its ability to reduce the waste of metal, increasing economic efficiency,
expending the utilization of the hard metals and refractory metals, realizing the manufacturing of
intricate structure and advancing the miniaturization [1].
The MIM process consists of sequential stages [2]: mixing of metallic powders and thermoplastic
binders to get the feedstock, injection of powder/binder mixtures into the mould die cavities, debinding
to mostly remove the binder and finally sintering stage by solid state diffusion to densify the metallic
powder particles. The resulting components exhibit proper physical and mechanical properties.
Examples of the parts resulting from MIM process are related in the Figure 1.
Figure 1. Parts and components with complex shape produced from the metal injection molding
process, courtesy of EPMA
The development of the feedstock is necessary to complete the MIM process, since all the following
stages should be designed and operated according to the prepared feedstock. The feedstock properties
determine the injection and debinding stage in a large part. For instance, the injection parameters during
the molding process, the mold design, the choice of method for the debinding stage: thermal, solvent,
catalytic, supercritical, etc. As long as the feedstock is chosen and prepared, the injection stage and the
debinding one can be consequently studied and established. So then the focus is shifted to the sintering
stage.
The sintering stage is the key point that leads the MIM process to be successful [3]. The properties of
the final components are sensitive to various factors in the sintering process. The sintering atmosphere
environment, heating, holding and cooling kinetic, as well as the design of the sintering cycle, the
maximum sintering temperature, the support plate to hold the component are all the elements that should
taken into account to ensure the required demands from the customer, such as the shape, the final
geometry and tolerance, the final density as well as the mechanical properties of the components from
the MIM process.

Introduction
2
Actually, even if this process has been industrialized for several years and if there are already hundreds
of firms active in this domain, the MIM process is still a recent one, with a large variety of problems not
yet resolved. In terms of feedstock, the metal powder are evolving with a tending to decrease; the
chemical composition of the powder remains to be qualify; the binder system could be deficient and its
adaptability to proceed with different powder is not clear; the homogeneity of feedstock largely varies
with different factors. For the sintering stage, the understanding of the densification behavior is not
totally described, the determination of the size and density changes after sintering is time consuming
and the cost is too high; unexpected defects also appear often during the sintering stage.
In the material processing and micro-manufacturing process managed by Professor Jean-Claude Gelin
and Professor Thierry Barriere, the activities associated to PIM have concerned experiments, modeling,
simulation and optimization for more than 15 years. A chronology of the Ph. D. theses processed in our
laboratory in the last years is given in the Figure 2.
The related studies are carried out in our powder injection molding research team at the Applied
Mechanics department of FEMTO-ST laboratory linked to University of Franche-Comte, ENSMM and
UTBM in Besancon city. The relevant works in the same domain have been done from 1995.
Figure 2. Chronology of the Ph. D. theses processed in the Powder Injection Moulding research group
Compared with the powders used in the past Ph. D. theses in the research team, the 316L stainless steel
powder with D50=3.4 µm is much finer, such micro powder satisfies the increasing demands for smaller
components and miniaturization in different applications fields, such as sensors, medical devices, micro
devices and so on [4] [5]. That is why very fine powders are manufactured today.
In addition, there are the rising markets for the multifunctional components composed of two parts made
of different materials, as example it could be a combination of magnetic and non-magnetic parts,
conductive and insulating parts or hard and soft materials in the same components [6]. However, little
Injection molding: M. Duttily, T. Barrière, P. Dvorak, Z. Cheng, D. Liksonov, G. Cheng…
Solid state sintering: D. Renault, J. Song.
Full optimization of the MIM processing: G. Ayad.
Development of 316L stainless steel (16µm) feedstock: C.
Quinard.
Feedstock development for 316L stainless steel
(D50=3.4 µm) feedstock, characterization and
processing of bi-MIM: X. KONG.
1996 1998 2002 2006 2008 2010 ……

Introduction
3
work has been developed in this domain, especially in micro bi-material injection area, there are few
papers in the literature in that field. The MIM process is a proper way to produce such kind of parts. In
fact, our research team accumulated lot of knowledge about the bi-material injection and micro bi-
material injection, including the associated mold design. However, there are some problems have not
been overcome in practice, especially in the domain of micro bi-material injection molding. Thus, the
main part of the proposed thesis is concentrated on that field.
To answer some of the questions mentioned above in the present MIM process, the preliminary topics
of the present Ph. D. thesis are focused on the new feedstock with the fine 316L stainless steel powder
(D50=3.4 µm) to get high powder volume fraction, the mono-injection and bi-material injection using the
micro mold cavities, the modeling and numerical simulations of the sintering stage by solid state
diffusion by involving the micro-components and the identified parameters. Two topics have been
focused for PIM in the same time: miniaturization and multi-functionalization, a functional micro-
component realized from the PIM process is related in Figure 3.
Figure 3. Example of functional micro-component, courtesy of Acelent Technologies
In the first chapter, the state of the art in the areas of powder metallurgy, powder injection molding and
metal powder injection molding are introduced. In addition, the relative scientific researches are
summarized for European, Asian and America regions.
In the second chapter, the development of the new feedstock based on fine stainless steel powders and
fine cooper powders with the binder systems composed of the different polypropylene, polyethylene,
acid and wax are detailed with high powder volume content. These mixing conditions and rheological
characterizations are investigated by various methods. The homogeneity of the feedstock is also
examined by SEM and TGA analysis. Different methods to determine the critical powder volume
fraction have been proposed and compared for fine 316L stainless steel powders.
In the third chapter, both mono-material injection and bi-material injection are tested on the basis of the
elaborated feedstock from the previous steps. Several molds have been designed and manufactured in
our research team and employed in the injection tests; these include the traditional injection molds and
micro injection molds. Consequently, the tensile and beam-bending test specimens in specific size are

Introduction
4
injected with high powder volume loading (i.e. 66%). Besides, the bi-material injected specimens
combining the feedstock with varied powder volume loadings or with different metal powder have been
realized.
In the fourth chapter, the thermal debinding and sintering stage are analyzed. The topics are the
manufacturing of the sintered components to obtain the data base for the identification of the behavior
laws and validate the simulation of the sintering stage. The components previously manufactured are
debinded and sintered, and observations of the components after each stage are carried out, the
shrinkages and the density change are related.
Meanwhile, the sintering is used to get the final parts formed of powder materials. The specimens are
thermally treated at temperatures below the melting point of the main constituent to increase the strength
of the parts by bonding particles together. Many ceramic materials and high temperature metals can be
sintered and this process allows getting parts using a sintering temperature below their melting point
depending on the materials. A powder compact before sintering is a porous packing of powders that is
held together by weak surface bonds. During sintering the individual particles diffuse together to create
a dense, strong monolithic part [7]. In consequence, the components may be out of the designed
tolerances or, in some worse cases; they may be cracked, excessively warped or chemically incorrect
with a very small density.
To avoid these defects, numerical simulations are employed to predict the process accuracy and
repeatability by simulating the shape and relative density of the final component [8] in the last chapter,
different identifications of the parameters employed in the sintering model are realized, through the use
of these parameters in numerical simulations by the appropriate finite element software are processed in
order to predict the shrinkage and relative final density for these feedstock used in the injection stage,
without suffering from the repeated sintering experiments.
In conclusion chapter, the experimental and numerical results are all summarized, and the resulting
different perspectives are proposed at the last part of the Ph. D. memory.

Chapter 1. State of the art
5
Chapter 1. State of the art
One needs a good understanding of the evolution of the relevant technologies to know well the metal
powder injection molding process, which stems from the powder metallurgy. In this chapter, the history
of the powder metallurgy and the MIM process is reminded. Moreover, the latest developments in
industry as well as research center concerned as well.
1.1. Powder metallurgy
1.1.1. Brief introduction of powder metallurgy
Instead of manufacturing the metal objects by casting from molten metal or forging at softening
temperatures, MIM is a more economical, more flexible and more environmentally friendly technology.
Powder metallurgy process can be used to manufacture parts of simple or complex shape from a wide
variety of metals and alloys in the required shape by replication of the die cavity by injection moulding
under pressure, then debinding and sintering in some certain atmospheres and high temperatures to lead
to a solid by coalescing the powder particles together, the production flow chart is given in Figure 4.
Figure 4. Sketch diagram of powder injection molding process [2]
1.1.2. Powder metallurgy history
The history of powder metallurgy process can be traced back to 3000 B.C when the Egyptians made
iron tools using this technique. In Figure 5, the development of powder metallurgy is recapitulated, and
the origins of each period have been demonstrated as well. In the 21st century, based on the micro

Chapter 1. State of the art
6
powder injection molding process, the nanotechnology has been developed and will continuously
increase in the new decade [9].
Date Form Origin
3000 AC Iron tools Egypt, Africa, India
1200s Platinum pellets Inca, South America
1878~1900 Incandescent lamp USA
1915~1930 Carbide (die, wire drawing die, cutting tools) Germany
1920s Sintered oil-impregnated bearing USA
1940s Sintered components in steel Central Europe
1960s CIM- lost-wax casting USA
1970s HIP- steel tools- superalloys USA
1980s MIM- various components USA
1990s
Nano-powder
MIM in Europe
USA
Europe
2000s Micro PIM Japan, Europe
Figure 5. History of the powder metallurgy
1.1.3. Industry of powder metallurgy
The products issued from powder metallurgy are today widely used in automotive and aerospace
applications for power tools and household appliances. PM is international and related to grow
industries in all of the major industrialized countries [9].
Global sales of powder metallurgy components were over (US) $21 billion in 2006, which is expected
to reach about $23 billion in 2007 and about $30 billion by 2012, at an average annual growth rate
(AAGR) of about 5% [10].
The North American PM business was worth about $5 billion in 2007, which is expected to increase to
$5.5 billion in 2012 [10]. The European PM market is estimated at around $9.5 billion in 2007, which is
expected to reach $11.6 billion in 2012 [10]. The powder metallurgy market in developing Asia will
show growth at around 9%; some Asian countries will see even higher growth [10].
In addition, to proceed with each stage of powder metallurgy process, certain special developed
equipments are appearing. The global market for powder metallurgy equipment and tooling will be
worth about $700 million till 2012 [10].
1.1.4. Advantages of powder metallurgy
To explain the important prospect and the trend of rapid growth for powder metallurgy, the following
advantages of this technology compared with the other process should be taken into account:
A cost-effective processing technology;

Chapter 1. State of the art
7
Facilitate the manufacturing of components with irregular shapes, or eliminate machining for the
one that are hard to be machined;
Saves valuable raw materials through recycling and elimination of costly secondary machining
operations through net and near-net shape design;
Unique way to proceed with high performance and advanced particulate materials and alloys
such as superalloys, tool steels, PM wrought aluminum alloys, dispersion-strengthened metals,
thermally sprayed materials and intermetallics;
On the leading edge of new manufacturing processes for improved product quality and
productivity;
Improves industrial productivity by eliminating manufacturing steps and proper adaptation to
automation will be adapted to get accuracy and special properties such as self-lubrication and
controlled filtration;
Only way of processing vital metals such as tungsten carbide, dispersion-strengthened materials,
high speed tool steels, superalloys and self-lubricating bearings;
Saves natural resources through recycling and conservation of critical raw materials;
Strategically important to complex systems such as automotive engines and transmissions,
aircraft turbine engines, riding lawn mowers, surgical instruments, auto segments, electronic
parts, core assets, scalpels, dilators, power tools, oil/gas well drilling equipment and off-road
tractors.
1.2. Powder injection moulding
Based on powder metallurgy technologies, different processes have been developed, such as metallic or
ceramic powder-injection molding (MIM or CIM, respectively), hot isostatic pressing (HIP), hot
pressing, and hot extrusion (to name a range of processing technologies), spray forming, rapid
prototyping and rapid manufacturing. Meanwhile, one ideal for producing near-net-shape components is
powder-injection molding (PIM), which has the ability to process advanced metals into complex-shaped
parts, just like in thermoplastic molding process [11].
PIM technology was first used in the 1930s for injection molding ceramic sheaths entering in spark plug
insulators production. The process was adopted by the investment casting industry due to the better
ability for manufacturing ceramic cores. This process is well devoted to achieve mass production thanks
to the ability of producing complex geometries which are impossible to get with the other technologies,
especially for the very small components in large batches corresponding to the case where PIM process
is usually applied, as shown in Figure 6. However, PIM attracted little other interest until it was used
for the molding of metal powders in the mid 1970s. This novel application of what was considered a

Chapter 1. State of the art
8
low tech process to a diverse range of particulate systems initiated considerable worldwide research in
the following years. The research strengthened the science, technologies and knowledge base in PIM,
and it is now recognized as a sophisticated, interdisciplinary technology [12].
Figure 6. Characterization of different processes in terms of production volume vs. part weight [13]
1.2.1. Powder injection moulding market
In comparison to metals, ceramics and carbides PIM sales in the domain of powder metallurgy are
smaller and not yet closing the gap on metals. Among nearly 330 firms identified in PIM, over two-
thirds report participation in MIM market. From a sales value perspective, MIM portion of PIM is over
75%. Since MIM is the dominant actor in PIM, attention was directed to understand the changes taking
place in that field [14]. A general resume of the sales for PIM, MIM and CIM has been indicated in
Figure 7.
Figure 7. Annual sales of powder injection molding (PIM), ceramic powder injection molding (CIM)
and metal powder injection molding versus calendar year till 2009
PIM
Year
Sale
s,
($, m
illi
on
)
15~20% / year

Chapter 1. State of the art
9
It is shown that an average rise of 15~20% per year has been presented by PIM and MIM regardless of a
few years of drop. Compared with these two processes, CIM has given a relatively low growth rate.
Considering the sales of the firms identified in PIM, a survey from 1990 to 2010 gives variations in
Figure 8 according to geographical origin. The number of firms has grown from about 50 to about 350.
It can be clearly observed that China and India have rapidly developed in the last decades and this
tendency will continue in the coming years.
Figure 8. Survey of the global sales of the firms according to the geographical regions (1990 to 2010)
In terms of sales from metal powder injection molding process, one report of the worldwide sale
fractions of the metal powder injection molding market has been detailed by Patil Balaji [15] and related
in Figure 9.
Figure 9. Worldwide sale parts of metallic powder injection molding market
Table 1 gives the summary of sales in the past and the forecast by 2014 of MIM components. Inside,
ROW includes S. America, Australia and non-NATO Europe inc. Russia (Courtesy Sandvik Osprey/
BCC Research).
Table 1. Forecast global sales of MIM components by world region [16]
Region USD in 2009,
Million
Share in
2009,%
USD in 2014,
Million
Share in
2014
CAGR
2009-14
Asia 460.8 48 959 51 15.8%
Europe 279.7 28 484 25 11.6%
N America 231 23 424 22 12.9%
ROW 13.4 1 33 2 19.8%
Total 984.9 100 1900 100 14%
The development of the different markets has been summarized in reference [17]:
The global Metal powder injection molding market will expand at an Average Annual Growth Rate
(AAGR) of 8.4% from $382 million in 2004 to healthy $571 million in 2009. The market in Japan is
the fastest growing, at an AAGR of 10.6%, and it has reached $185 million in 2009; The U.S. market is
USA
Europe
Japan
China & India
2004 2009

Chapter 1. State of the art
10
the largest, but will grow more slowly at an AAGR of 7.2% to $240 million by 2009; The rest of Asia
(including China) and European markets will both rise at AAGRs of 7.9% to $35 million and $111
million, respectively. After exceptionally high growth rates of between 10 and 15%, due to the negative
influences of the economic crisis, the global 2009 MIM markets have significantly declined, however, a
slight recovery is still expected for 2009~2014. Some examples of the metallic or ceramic components
from the powder injection molding technology are given in Figure 10.
Figure 10. Examples from the PIM process, a) luxury mobile phone with the keypads manufactured
from zirconia powder, courtesy of Alliance; b) MIM components, courtesy of Alliance; c) sensor
manufactured from 316L stainless steel powder, courtesy of Rise; d) 3D wheel, courtesy of Ets
Griffond and e) knife tool manufactured from alumina powder, courtesy of Ets Griffond
1.2.2. Raw material for metal powder injection moulding process
1.2.2.1. Metal powders
The most common metals available in powder form are iron and steel, tin, nickel, copper, aluminum and
titanium, as well as refractory metals such as tungsten, molybdenum and tantalum [9]. The powder
shipments of North America for the year of 2007 and 2008 are detailed in Table 2.
Table 2. North American Metal Powder Shipments [9]
2007 2008
Iron & Steel
Stainless Steel
Copper & Copper Base
Aluminum
Molybdenum
Tungsten
Tungsten Carbide
Nickel
Tin
404,650
9,676 (E)
19,992
50,000 (E)
2,800 (E)
4,650 (E)
7,394
9,190 (E)
785
327,272
7,750 (E)
17,400
42,500 (E)
2,000 (E)
4,000 (F)
5,103
8,650 (E)
752
(E) estimate (short tons) 509,137 415.427
However, European shipments of metal powders for PM applications fared much better than North
America, increasing by over 8% in 2006 compared with the previous year, to reach around 192,000 tons.
a)
b)
c)
d)
e)
Injected
Sintered

Chapter 1. State of the art
11
In Asia, Japanese shipments of metal powders for PM represented about 139,000 tons in 2006, with a
similar amount in China [9]. Figure 11 shows some metal powders dedicated for MIM process.
Figure 11. Examples of the metal powders used for MIM process [9]
In 2008, stainless powder was still the most used compared with the others metal powders in MIM
industry, as shown in Figure 12, it had taken almost 50% of the whole powder utilization in this domain.
In 2010, the same tendency has been reported by Sandvik-Osprey© from January to September. In USA,
the components injected with stainless steel and steel account for 60% and 30% of the global products
respectively. These steels are used in orthodontic (35%) and biomedical (30%) applications, such as
chisels, cutting tools, clamps and clip applications. Besides, the application of firearms indicates 20%.
The world PIM market reaches about $ 112 billion and the European PIM medical market represents
$ 112 million (2010, data of World PM, A. Bose and R. M. German). Some new feedstock
developments have been recently proposed in the market such as molybdenum [18] or 18 carat gold
alloy in order to develop some new application fields [19]. Actually, there are some new developed Ti
feedstocks concerning watches, surgical tools, aerospace and biomedical implants. But the
corresponding sales remain from 1 to 2% of global sales and only 7% of firms proposed to sell Ti-PIM
components. Otherwise, certain developments have focused on super alloy compacts as inconel 718 in
order to achieve high corrosion, high oxidation resistance and high temperature strength [20].
Figure 12. Global relative use of metal powders in MIM process [21]
0% 10% 20% 30% 40% 50%
Stainless steel
Steel
Tungsten
Nickel, iron-nickel
Titanium
Copper
Tool steel
Electronic
Percent of metal

Chapter 1. State of the art
12
Numerous techniques which can be used to manufacture metal powders have been applied. For instance,
gas atomization, water atomization, oxide reduction, fine grinding, reaction, etc. For 316L stainless steel
powder, one method has been used often is gas or water atomization. The principle of gas atomization is
sketched in Figure 13.
Figure 13. Gas atomization process for production of metal powders from liquid metal melts [22]
The molten material is fed into a gas expansion nozzle to form the droplets that solidify before impact
with the chamber wall. The molten stream is disintegrated by rapid expansion out of the fluid nozzle.
Atomization by high-pressure water is used to make rounded, prealloyed particles for PIM applications,
the process is conceptually similar to gas atomization, except for the rapid quenching and differing fluid
properties [23].Gas atomization gives some advantage in contrast to the water atomization applied to the
manufacturing of fine stainless steel powders, the sintered components from fine powders by gas
atomization are superior to those from water atomization. The same tendencies are observed after HIP
treatment [2].
1.2.2.2. Binders
A primary requirement of the binder is to allow the flow of the particles into the mold die cavity, it is
mandatory that the binder wets the powder surface, to aid mixing and molding, so various chemicals
phenomena that modify wetting behavior are widely employed. Some important attributes of an ideal
binder are reported in Table 3.
Based on the requirements for a binder, a simple binder design philosophy emerges. The binder usually
has three components a backbone polymer that provides strength, a filler phase that is easily extracted in
the first phase of debinding, and a surfactant to bridge between the binder and powder. The new
tendency is to propose proper environmental friendly binder rather than to manufacture them by
chemical process. For instance, Torralba et al. used polysaccharides binder to replace classical PP or PE
ingredient binders [24] [25]. Some developments have been realized since some recent years with a

Chapter 1. State of the art
13
special aqueous sugar to develop large PIM components. The license is used by example by Belgium
Metal SA to produce large 316L firearms.
Table 3. The important attributes of an ideal binder [23]
Flow characteristics
· Viscosity below 10 Pa.s at the molding temperature
· Low viscosity change of temperature during molding
· Rapid change in viscosity during cooling
· Strong and rigid after cooling
· Small molecule to fit between particles and avoid orientation during flow
· Minimum flow orientation
Powder interaction
· Low contact angle
· Adherence to powder
· Chemically passive, even under high shear and high temperature
· Thermally stable during mixing and molding
Debinding
· Multiple components with differing characteristics
· Noncorrosive, nontoxic decomposition product
· Low ash content, low metallic content
· Decomposition temperature above molding and mixing temperatures
· Decomposition before sintering temperature
· Complete removal as the powder attains structural rigidity
Manufacturing
· Inexpensive and available
· Safe and environmentally acceptable
· Long shelf life, low water absorption, no volatile components
· Not degraded by cyclic heating (reusable)
· High lubricity
· High strength and stiffness
· Low thermal expansion coefficient
· Soluble in common solvents
· Short chain length, no orientation
1.3. Metal powder injection molding process
The metallic powder injection molding process is somewhat similar to plastic-injection molding as
shown in Figure 14.
Figure 14. Sketch of metal powder injection molding process [26]

Chapter 1. State of the art
14
However, there are some additional steps in MIM: mixing the powders with an organic binder
(feedstock preparation) and, then the feedstock are shaped in injection molds, then the binders are
removed and finally the porous debinded components are sintered to get high density and required
mechanical properties.
Meanwhile, in the first stage the ratio powder to binder is a fundamental parameter for MIM process.
This ratio Ф is often expressed on a volume percentage as in equation (1):
B
B
p
p
p
p
ρ
W
ρ
W
ρ
W
Φ
(1)
but in practice the measurement of volume is much more difficult than weight, so the ratio expressed by
weight should be given, the theoretical feedstock density ρM is given in equation (2):
BpM Φ)ρ-(1Φρρ (2)
with ρp and ρB are the theoretical powder density and theoretical binder density respectively. Therefore,
the weight fraction of powder WP is expressed in equation (3):
Φ)-(1ρΦρ
ΦρW
BP
P
P
(3)
the weight fraction of binder WB is accordingly obtained by equation (4):
PB WW 1 (4)
Note that the above fractions are only used when the powder volume loading is below the critical
condition (as shown in Figure 15, the two examples indicate different binder systems) which means
there is no excess of binder in the feedstock [23].
Figure 15. Evolution of relative viscosity vs. powder volume loading and the consequence on the
fluidity
10
100
1000
Rel
ativ
e vis
cosi
ty,
[Pa.
s]
Example 1:
Iron-wax
Example 2:
Ni3 Al-wax
Critical powder
volume loading
0 20 40 60 80 100
Powder volume loading, [%]

Chapter 1. State of the art
15
This is because the abrupt increase of viscosity appears near the critical powder loading (indicated in
Figure 15) which may cause problems at the injection molding stage, and the powder volume loading
that issued is usually slightly less than the critical value.
As shown in Figure 16, in the injection molding stage, the feedstock is fed into the equipment as
polymer-powder granules. A screw-type plunger transports the granules through a heated barrel towards
the nozzle; this plunger is used to decrease the living time in the barrel/ screw system. Along the barrel
there are typically three heating zones called rear, center, and front. The front zone next to the nozzle is
the hottest zone. On the way to the nozzle the feedstock granules soften and become a homogenous
mass, which is forced under high pressure into the mold cavity, where it quickly cools and hardens. The
mold is then opened to remove the molded part and to prepare the mold for the next cycle.
Figure 16. Principle sketch of the injection molding equipment [27]
Moreover, the morphology of the feedstock in the barrel is detailed in Figure 17.
Figure 17. Screw functional sections of the injection equipment during the injection stage (courtesy of
Arburg) [28]

Chapter 1. State of the art
16
The screw acts as a mixer to ensure uniform heating during plasticizing. The screw has a check ring
behind the tip that acts as a non-return valve that allows feedstock flow into the front of the cylinder
during plasticizing and seals against a seat ring on the screw during mould filling and force flow trough
the cylinder nozzle [29].
Typical set of parameters is given in the Table 4 [23]. The parameters of injection stage are link to
feedstock, injection moulding equipment and mold cavities.
Table 4. Typical molding parameters
Barrel temperature, °C 100 to 200
Nozzle temperature, °C 80 to 200
Mold temperature, °C 20 to 100
Screw rotation speed, rpm 35 to 70
Injection pressure, MPa 0.1 to 130
Packing pressure, MPa 0 to 10
Fill time, s 0.2 to 3
Packing time, s 2 to 60
Cooling time, s 18 to 45
Cycle time, s 8 to 360
The debinding stage consists in removing a large part of the binder from the molded component in the
shortest time possible by employing solvent, catalyst, thermal or other techniques, in keeping the
debinding influence on the component as low as possible [30]. This process is a complex combination
of chemical and physical degradation of the binders under thermal conditions. At present, different
debinding techniques have been developed categorized as solvent and thermal process. In the solvent
debinding process, the injected components are placed in a solvent fluid or vapor to dissolve the binders.
The other debinding technique is thermal debinding consisting in removing the binders by heating the
compacts. Meanwhile, the thermal debinding is time-consuming. Actually, lots of researches have been
carried out concerning the supercritical debinding method to decrease debinding time and then to obtain
the homogenous structure [23]. During the supercritical debinding, the binders are dissolved into the
fluid by heat and pressure applied on the components. In the catalytic debinding, the compacts are
heated in atmosphere containing catalyst to sweep away the polymers that are contained inside [23].
The different stages during the sintering process are sketched in Figure 18 [23]. The debinded
components are sintered by solid state diffusion.
Figure 18. Illustration of the microstructure evolution during the solid state diffusion sintering stage
Loose powder Initial stage Final stage Intermediate stage

Chapter 1. State of the art
17
Three main kinds of diffusion can occur to form the necks between the neighbor particles: volume
diffusion, grain boundary diffusion and surface diffusion. Many factors influence the sintering cycle, the
determination of the kinetic cycle vary according to different feedstocks, component size and shape,
sintering atmosphere, etc.
A typical sintering cycle by solid state diffusion for stainless steel feedstock is given in Figure 19,
which is composed by four main steps: thermal debinding, emergence of neck growth, reduction of
oxide diffusion and sintering. Meantime, the thermal debinding step can be carried out separately in
another oven.
Figure 19. Typical (solid state diffusion) kinetic sintering cycle for stainless steel feedstock with four
segments
The components after such sintering stage reveal high relative density about 98%, which ensure the
proper mechanical characteristics and corrosion properties. A shrinkage about 10~20% is obtained
corresponding to the binder and porosity elimination as shown in Figure 20.
Figure 20. Remained binder in the component from different stages of the MIM process
Injected component
Debinded component
Sintered component
100%
<20%
0%
Remained binder
Fragile
Very fragile
Good mechanical properties
Thermal
debinding
Reduction of oxide
diffusion
Sintering
Emergence of
neck growth 350~600
700~850
900~1100
1150~1400
Time, [hour]
Temperature, [°C]

Chapter 1. State of the art
18
1.3.1. Bi-material metal powder injection moulding process
Beyond single micro components or micro-structure, a micro system is usually obtained by assembling
several components elaborated with different materials for special functionality or properties as shown
in Figure 21.
Figure 21. Component composed of 316L and 17-4PH manufactured by the MIM process [31]
In practice such approach is not successful due to the difficulty of bonding properly together the
components of different material by forming a microstructure. However, there is still demand for parts
that contain two segments made of materials with different properties. The requirements for such objects
could be magnetic properties in one area of the object and non-magnetic properties in another part of the
object. Other properties to be altered could be thermal conductivity and electrical conductivity, Young’s
modulus, hardness, reflectivity and so on [32]. Bi-injection equipment differs from general injection
molding equipment mainly in the injection unit element and movable mold plate design. Firstly, bi-
injection equipment has two independent injection units, much more deployments of two injection units
for bi-injection (such as horizontal parallel, horizontal Y uni-direction, horizontal L type, vertical L and
vertical Y, even in horizontal parallel contra-direction arrangement for two plats clamping structure)
have been used than for general injection; secondly, as to movable mold plate design, a rotating
mechanism for bi-injection moulding [33] whose reciprocal rotating function to allow cycling alternate
motion.
1.3.2. Micro metallic powder injection moulding process
The global trend towards miniaturization demands manufacturing processes suitable for both micro
devices and economic cost. Generally, the parts from micro metallic powder injection moulding process
(micro-MIM) have sizes of several micrometers up to millimeters with three-dimensional
microstructures located on one or more surface areas [34]. One promising process for the replication of
metallic microstructures is micro-MIM that has reached an industrially state. Several micro components
for different applications are shown in Figure 22.

Chapter 1. State of the art
19
Figure 22. Examples of component from micro metal powder injection moulding process, a) micro-
component [35]; b) plate with micro-structure [36]; c) Micro specimens manufactured FEMTO-ST
Compared with the standard MIM process widely used in industry, some process specialties have to be
considered for micro-MIM. These include powder particle size, which is significantly reduced in
contrast to standard MIM, and binder composition, which needs to be adjusted for safe ejection of small
structures. Due to these variations, debinding and sintering routes also have to be adjusted accordingly
[31]. For example, the surface finish of injection molded metallic micro-component (Rmax=8 µm) is
worse than its counterpart made from polymers (Rmax=100 nm) or ceramics (Rmax=2 µm) [34]. It
specially concerns micro-MIM where proper surface finishing is required [37].
Furthermore, special equipments have been manufactured for micro-injection stage. However, the most
important strength of micro MIM lies in the great economic efficiency realized when producing medium
and large series. A crucial advantage of the process is that its near-net-shape capability means that very
few finishing work is required.
1.3.3. Biomedical metallic powder injection moulding process
From 2005, three new MIM processes have been introduced in laboratory. Meanwhile, micro injection
molding and bi-material injection molding have been introduced above. The third one is biomedical-
MIM. Figure 23 gives a general view of the development of the MIM process.
Figure 23. General view of the evolution of MIM process
5 mm a) b) c) 5 mm
Improve the
accuracy
Incubation
period
2015 2008 1980
Increase
powder loading
Enrich the choice
of feedstock
MIM
µ-MIM
Biomedical-MIM
Component
weight ≥ 200
g
Bi-material MIM
Chapter 1. State of the art
20
Powder Injection Moulding is an established process for manufacturing of medical products from
biocompatible materials. Processing innovations have, however, enabled a wider range of functional
products to be considered than ever before [38].
Biomaterials must simultaneously satisfy many requirements and exhibits properties such as non-
toxicity, corrosion resistant, thermal conductivity, strength, fatigue durability, biocompatibility and
sometimes aesthetics [39]. Actually, some micro-components with Ti feedstock have been injected [40],
in parallel, some tests about the biocompatibility are also under examination for the components from
biomedical-MIM in order to verify its ability to be implanted into the body. As example, the studies
with different cell growth have been realized by Imgrund et al. for steel implant or micro functional
injected surface [41].
1.3.4. Limitations of metal injection moulding process
As it is known, the main disadvantages of MIM process are listed below [23]:
Size – The proper part size is typically limited to less than 200 grams due to the cost of the fine
metal powders in comparison to classical commercial feedstocks used for MIM parts;
Section Thickness – The maximum section thickness is generally kept to less than 6.25 mm to
be able to effectively remove the thermoplastic binder from the part without damage, as well as
to control distortion during sintering;
Tolerances – Typically +/- 0.3 percent, less to +/- 0.001 mm for very small dimensions [42].
Tighter tolerances require secondary machining or grinding operations. The tolerances and
surface roughness in the case of 316L stainless steel decrease when the powder particle size,
with a very fine size powder (D50=4 µm), the surface roughness about Ra=0.4 µm has been
obtained compared with 1.6 µm for D50=12 µm;
Even though MIM process has these limitations, it has been rapidly developed and applied for more and
more parts, related to the advantages mentioned before.
1.3.5. Advantages of powder injection moulding process
Metal injection moulding has to be considered since the initial design stage for parts and assembly [23]:
Parts design - MIM offers design flexibility similar to plastic injection molding. Geometrically
complex parts that cannot be processed by using the conventional metallic powder processes
without secondary machining operations are possible using MIM process.

Chapter 1. State of the art
21
Enhanced Details - MIM provides possibilities for intricate features such as dovetails, slots,
undercuts, threads, and complex curved surfaces. MIM can produce cylindrical parts with
greater length-to-diameter ratios. And all of these advantages are accompanied with the lower
unit cost. A comparison of the unit cost from some different processes has been illustrated in
Figure 24.
Figure 24. Component cost from different processes vs. the shape complexity [13]
Improved Properties - MIM parts are typically 95% to 98% dense (vary from different materials),
approaching wrought material properties. MIM parts achieve greater strength compared with
conventional powder metallurgy processes.
Reduced Waste/Machining - MIM's capability to provide net shape components eliminates
many secondary machining operations. An example is given in Figure 25, Alliance© has
produced a complex shaped backing case for a luxury watch [43], the 24 individual blades and
the support has been firstly injected, then all the injected blades have been assembled onto the
support, after debinding, the sinter-joining has been carried out during the sintering stage, proper
tolerances and join quality have been achieved (see Figure 25 c)).
Figure 25. Production process for the aerospace turbine engine themed watch case realized by
Alliance© (courtesy of EPMA), a) injected individual blade and support; b) 24 injected blades and
injected support and c) sintered component
Reduced Assemblies – MIM process can be used to combine two or more simpler shapes into a
single, more complex component to minimize assembly costs, as shown in Figure 26.
Ф 36mm
a) b) c)
Simple
shape
Slightly complex
shape Very complex
shape

Chapter 1. State of the art
22
Figure 26. Capability of reducing assemblies of MIM process, a) conventional process with 4
manufacturing processes and assembly, b) MIM process with one near-net shape molding [44]
1.4. Researches in metal powder injection moulding process
1.4.1. The scientific papers and associated patents in the area of MIM
Before 1970, there were only 10 papers related to MIM process, and even more generally in the domain
of PIM, then the number increased to 100 in 1980 and more than 1000 scientific articles were published
at the end of 1999 [45]. In the later 8 years, 3120 papers have been issued of which 1810 were about
MIM process. Till 2007, the number of the related scientific papers raised twice [46]. Up to now, there
are some journals which have been widely distributed, such as Powder Metallurgy, Powder Injection
Moulding International, International Journal of Powder Metallurgy, Journal of the American Ceramic
Society, and Journal of the European Ceramic Society etc. Besides, 400 patents have been registered in
the USA from 1990s [46].
1.4.2. The principal research centers in MIM processing
In America, Pr. R.M. German research team has focused on the MIM process for long time [23] [47]
[48]. In Europe, some centers focus on the micro-manufacturing, such as University of Cranfield (Dr. J.
Alock [49]), University of Delft (Dr. L. Kowalski [50] [51] [52]). In Switzerland, the application of
NiTi shape memory materials has been studied with powder injection moulding process (Pr. Efraín
Carreño-Morelli [53]). In Germany, several technical research centers concentrate on the elaboration of
components by MIM process, they are Fraunhofer (FhG-IFAM: Dr. Fr. Petzoldt [54]; FhG-IWM: Dr. T.
Kraft [55] [56]) and KIT Karlshuhe (Dr. V. Piotter, R. Ruprecht [57]). In United Kingdom, there are the
MIM researches at Brunel university and especially in Pr. M.J. Ediridsinghe team related to the
elaboration of the large ceramic components [58]. Some research centers focus on only one single stage
of MIM process, as example the characterization of feedstock and its components at Chalmers
university (Pr. L. Nyborg [59]), the modeling of debinding and sintering at Catholic University of
Leuven (Pr L. Froyen [60], Pr. Van der Biest O. [61]) and at MTM department of the university of KUL
a) b)

Chapter 1. State of the art
23
(Pr. Angermann H.H). In Spain, two research groups are developing some new feedstocks, especially
for M2 HSS (High Speed Steel) in University of Castilla La Mancha, large activities in PIM are also
developed by JM Torralba team (university of Madrid, Carlos Ш) [62]. As example, some new
feedstocks have been developed with different 316L stainless steel powders, varying powder particle
contents and shapes. T Vieira has developed special coating method to ameliorate the fluidity of the
feedstock (at Coimbra university) [63] in Portugal. In Austria, a set of modern equipments has been set
to build a large center in MIM fields regrouping a lot of equipment providers. In Japan, several types of
very fine powders dedicated to micro-MIM or the other nanotechnologies applications have been
developed. As example, iron, stainless steel, zircon, nickel and so on, have been used to develop proper
feedstocks and processes for large varieties of applications [36] [64] [65]. In Korea, the development of
MIM process with the titanium, copper, tungsten powders and several alloys have been developed
through collaborations with the research centers in USA [66] [67] [68].
1.4.3. Research centers concentrated on modeling and simulation of Metal Injection
Moulding Process
At present, the proposed commercial software to simulate MIM process is Moldflow® and moldex 3D®
which is dedicated to the simulation of the injection molding stage in 2D or 3D [69]. But the interaction
of the binder and powder particles cannot be investigated clearly. In addition, there is not yet the
particular software for the other stages of MIM process. Professor Hetu [70] and his colleagues at IMI in
Canada and Professor J.C. Gelin and his colleagues in our laboratory have developed modeling
methodologies and software tools. The first team model and simulate the filling of mold cavity by using
a viscous law [71]. The second team has used a biphasic approach. The COMSOL® software package
has been used in the simulation of micro or nano injection moulding processes. ABAQUS® has also
been employed in our team to perform the numerical simulation of the sintering stage. These analyses
have been firstly carried out for the conventional MIM process with the medium size powders [72], and
then these similar tests have been done in the micro-injection molding process with the fine powder
(316L stainless steel powder, D50=3.4 µm) as related in the thesis, the involved components are about 5
mm in the length direction and 0.5 mm in thickness.
1.4.4. Researches about MIM process in France
In France, the researches related to MIM process have been carried out since 1985; meanwhile, the
moulding stage (Arnaud Poitou [ 73]), the debinding one (Agnès Manguin [ 74 ]) and segregation
analyses (Béatrice Lantéri [75]) related to this process have been studied at Ecole des Mines de Paris.

Chapter 1. State of the art
24
Since five years, an increasing number of laboratories are involved in PIM activities. As the ECAM
laboratory that develops a feedstock with biodegradable polymer for biomedical applications. Some
studies have been also done about the spark plasma sintering (SPS) by Pr. Frédéric BERNARD [76] for
Ni powder. Especially, in FCE (Fonctionnalisation et Chimie pour les Microsystèmes) there are some
BioPIM projects supervised by CEA LITEN (Grenoble, France). In Charleville-Mézières, a platform has
been developed for pre-industrialization PIM production. Since one year, POUDR'INNOV platform
starts activities with large investisments in Rhône-Alpes, in order to diffuse and promote PIM
opportunities. Since two years, almost twenty partners from industries and research centers are
participating to GFPIM group in order to promote PIM potentialities for industries. In our laboratory
FEMTO-ST/Applied Mechanics, the research team on micro processing and loaded polymers
processing has developed researches on PIM since 1995 [77] [78]. The conventional MIM and PIM
have been carried out using various metallic or ceramic powders and powder particles. Moreover, the
micro-MIM and bi-material MIM have been investigated as well. Concerning the simulation of PIM, the
FeaPIM© software has been adopted a bi-phasic model to predict the segregation of powder particles
during the mould cavities filling [79]. In the same research group, studies have also been developed
concerning solid state sintering, based on extensive experiments, identifications, modeling and
simulations [72].

Chapter 2. Development and characterization of feedstocks based on fine powders with high volume fraction loading
25
Chapter 2. Development and characterization of feedstocks
based on fine powders with high volume fraction loading
The content of this chapter is related to the development of new feedstocks based on the fine 316L
stainless steel powders, in order to optimize the powder loading content through different methods. The
same methodology has been adapted to copper feedstock. The final objective is the injection of micro
components with bi-material that are investigated both from experiments and simulations.
All the subsequent processing stages are significantly affected by the feedstock characterization, in other
words, the feedstock attributes have a definitive effect to one MIM process, therefore, the preparation
and the characterization of the feedstock should be properly investigated and seriously controlled [23],
so different experiments have been set up and carried out to characterize the developed feedstocks.
2.1. Powders, processing and characteristics
So far, different elaboration techniques have been developed and applied in PIM processing to process
metallic and ceramic powders, as example, gas atomization, water atomization, oxide reduction,
precipitation, milling and so on. The resulting powders from different techniques exhibit different
characteristics due to the different procedures related to each technique, for instance, gas atomization
provide generally spherical powder shapes, while the morphology of the powders resulting from water
atomization is rounded or shows ligaments, however, the cost of water atomization compared with gas
atomization is smaller. The resulted particle sizes are also in different ranges.
2.1.1. Main powders type
As final components resulting from MIM process are formed by the powders contained in the feedstock,
thus, it is important to characterize the powder. To describe the powder, certain aspects should be taken
into account as related following: 1) particle size and its distribution, 2) particle shape, 3) specific
surface, 4) interparticle friction as measured by packing and flow characterization tests [23]. It is
necessary to select a proper powder for MIM process, since there are lots of factors to account, so a
balance between these factors should be reached. In general, the chosen powder should be able to
facilitate molding, raising the powder loading in feedstock; the powder should also limit the distortion
during debinding, and offer the possibility to carefully control the sintering stage.
Chapter 2. Development and characterization of feedstocks based on fine powders with high volume fraction loading
26
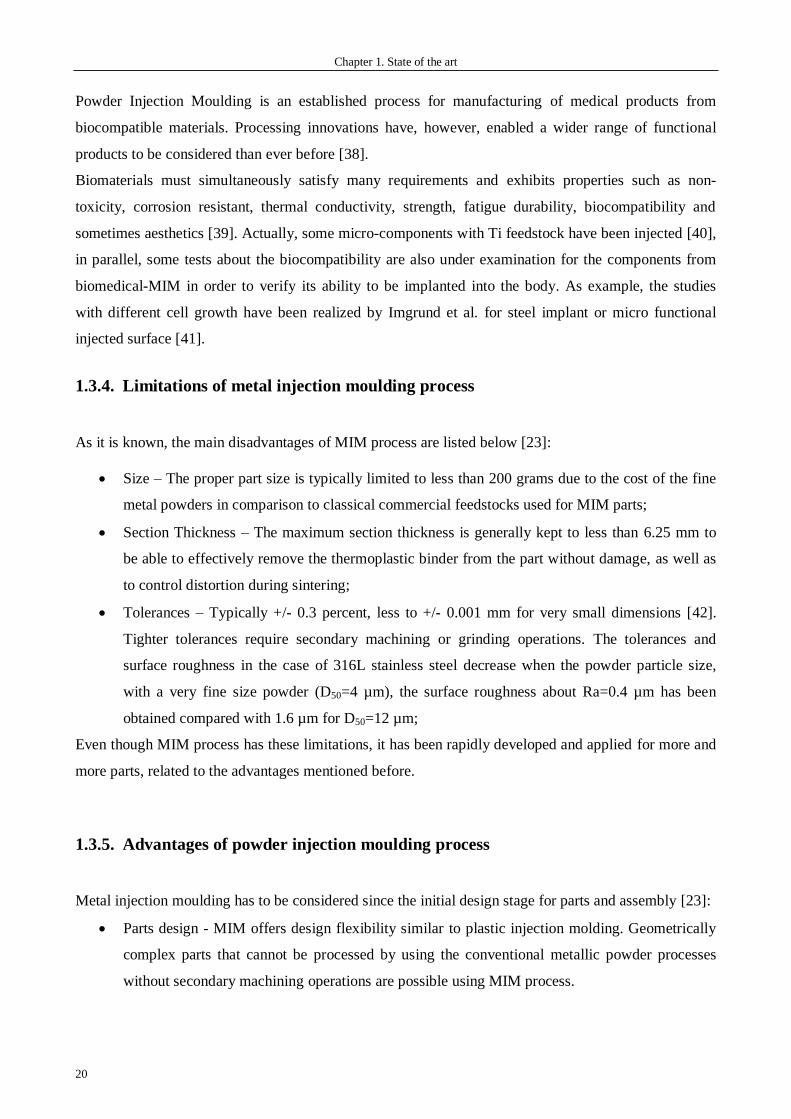
2.1.2. Powders used in the previous Ph. D. theses carried out at FEMTO-ST
A summary of the feedstocks developed in FEMTO-ST from 2002 to 2005 are related in Table 5, the
powders and equipments are detailed as well.
Table 5. The feedstocks developed during the Ph. D. and the employed equipment in our laboratory
Powder 316L stainless steel Fe FeNi (8%)
Particle size 16 µm 5 µm 30 µm 30µm
Powder volume loading (max.) 62% 62% 58% 62%
Powder volume loading of
feedstock used for injection,
debinding and sintering stage
60% 60% 58% 60%
Equipment for preparation of
feedstock
Z blades (FEMTO-ST)
Twin-screw mixer (FEMTO-ST)
Twin-screw extruder (Germany)
Twin-screw mixer
(FEMTO-ST)
For the two feedstocks based on 316L stainless steel, the maximum powder volume loading reached to
62%, but for the injection, debinding and sintering stage, only the feedstocks loaded at 60% (in volume)
was employed in the early Ph. D. theses.
2.1.3. Powders used in the related experiments and analyses
As mentioned above, the feedstocks based on the same 316L stainless steel for different powder loading
are related in the present study.
2.1.3.1. 316L stainless steel powder
During the last recent years, 316L stainless steel powders are the most common one employed in
injection molded alloys, either gas atomized or water atomized. The fact that these powders are largely
used results from their capabilities to be sintered to high density and the material’s corrosion resistance
[80], so numbers of investigations concerning MIM process have been focused on 316L stainless steel
powders. Imbaby et al. have studied the manufacturing of micro-parts by soft lithography and powder
metallurgy with 316L stainless steel powder of 1.8 µm (D50) size [81]. The involved powder volume
loading is about 62%. Liu et al. [36] have carried out different analyses consisting to mix and
characterize micro-powder injection molding with 316L stainless steel feedstock, composed of powder
particles with size equal 2.37 µm (D50). During last decade, important research works have been carried
out at FEMTO-ST. Gelin, Barriere et al. used a commercial feedstock provided by Advanced
Metalworking Practices (Advamet©) composed of 316L stainless steel powders that has been used for
various injection and sintering tests [79]. Afterwards, Quinard et al. have investigated the development

Chapter 2. Development and characterization of feedstocks based on fine powders with high volume fraction loading
27
and identification of 316L stainless steel feedstock with mean powder particles size equals 5 µm and
16µm (D50) [82]. In reference [75], 316L stainless steel powder (D50=3.4 µm) provided by Osprey© with
spherical particle shapes has been studied to prepare new feedstock with the objective to increase the
powder volume loading and by consequence to reduce shrinkage during the sintering stage. Table 6
gives the powder size distribution and the chemical composition.
Table 6. Characterization of 316 L stainless steel powders used in the related investigations
Powder size and density
Powder Size D10 D50 D90 Density
316L Low Ni - Osprey 5 µm 1.8 µm 3.4 µm 6.0 µm 7.9 g.cm-3
316L Low Ni - Osprey 16 µm 4.1 µm 10.5 µm 21.9 µm 7.9 g.cm-3
Powder chemical composition
Element Cr Ni Mo Mn Si C P S Fe
Content (%) 17.4 10.9 2.5 1.2 1.64 0.021 0.015 0.006 Bal.
One of the proper tools to observe the particle characterization of the powder is the scanning electron
microscopy (SEM). Figure 27 gives the photographs of the 316L stainless steel powder used for micro-
PIM and the corresponding distribution of powder particle are indicated in Figure 28.
Figure 27. 316L stainless steel powders (D50=3.4 µm) used in the proposed investigations
Figure 28. Particle size distribution for 316L stainless steel powders (D50=3.4 µm) used in the related
investigations
A broad particle size distribution provides a higher packing density and as a consequence, a higher
amount of binder would not be necessary to produce the feedstock [83]. It is extremely necessary to
a) b) c) 10 µm 5 µm
≈ 3.4 Particle size [µm]
Diffe
rential dis
trib
ution [
vol.%
]

Chapter 2. Development and characterization of feedstocks based on fine powders with high volume fraction loading
28
determine the particle sizes and their distribution of the employed powder, because these strongly affect
the different stages of the PIM process. Furthermore, another 316L stainless steel powder with a mean
powder particle equals 16 µm has been used as well in our researches to test and compare different
formulations in PIM process; the related micrographs are shown in Figure 29.
Figure 29. Scanning electron micrographs of 316L stainless steel powders (D50=10.5 µm) used in the
related investigations
2.1.3.2. Copper powders
In order to realize the bi-material-injection experiment, a copper powder (D50=6.34 µm) has been used
for one of the injection units. Figure 30 shows the micro details of the powder. One can remark that, the
cooper particles have nearly spherical shapes that are well appropriated to obtain feedstocks with low
viscosity. The melting and evaporation temperature of this cooper powders are respectively 1083 °C and
2567 °C, and the density is 8.93 g.cm-3. The particle size distribution is given in Figure 31.
Figure 30. Copper powder (D50=6.34 µm) used in the proposed investigations
Figure 31. Particle size distribution of copper powder (D50=6.34 µm) used in the proposed
investigations
D10: 3.73 µm
D50: 6.34 µm
D90: 10.81 µm
Particle size [µm] Diffe
rential dis
trib
ution [
vol.%
]
5µm 2µm a) b)
b) c) a) 50 µm 10 µm

Chapter 2. Development and characterization of feedstocks based on fine powders with high volume fraction loading
29
2.2. Binder
2.2.1. The role of binder in MIM processes
Even though the binder has not to remain in the final components, it has an important influence in the
MIM process, because this is the binder that transports the metallic powder particles in the mold cavity
during the injection stage, and holds the required shape of the components during the ejection,
debinding stage and the beginning of the sintering stage by solid state diffusion.
2.2.2. Choice of a proper binder
At present, there are many of possibilities to choose the binder, but no binder is perfect. For this choice,
it is very important but difficult to select an appropriate one between different possibilities. Two main
requirements are required for the binder: the first one is to provide an easy flow of the particles into the
die cavity during molding, wax polymers which generally have low viscosity meet well this demand; the
second one is to avoid separation of the powder during the preparation of feedstock and molding, and
pure waxes are not sufficient with this respect. For this reason, most of binder systems contain at least
two components; the added polymeric components lead to increase the viscosity in order to hold the
component shape after cooling. Besides, some additives polymers like surfactants are generally
employed in the binder system to coat the powder [23]. Table 7 relates some examples of binder
systems that have been related in the literature.
Table 7. Examples of binders for PIM
72% polyethylene glycol, 24% polyethylene, 4% tritolyl phosphate [84]
45% polyamide, 25% ethylene-bis-laurylamide, 30% N,N-diacetylpiperazine [85]
58% polystyrene, 30% mineral oil, 12% vegetable oil [86]
44% polystyrene, 44% oil, 6% polyethylene, 6% stearic acid [87]
62% paraffin wax, 33% polypropylene, 5% stearic acid [88]
80% microcrystalline wax, 20% stearic acid [89]
79% paraffin wax, 10% ethylene vinylacetate copolymer, 10% high density polyethylene, 1% stearic
acid [90]
60% paraffin wax, 10% high density polyethylene, 10% polypropylene, 5% liquid paraffin, 5%
dioctylphthalate, 5% ethylene propylene diene monomer, 5% stearic acid [91]
53% low density polyethylene, 26% ethylene-acrylic acid block copolymer, 21% paraffin wax, 5%
stearic acid [92]
Consequently, polypropylene and polyethylene have been tested as the primary binder system to keep
the component shape after injection molding and debinding; waxes have been chosen as the secondary
binder in order to decrease the feedstock viscosity and to increase the replication ability of the feedstock;
the additive surfactant stearic acid and oleic acid have been added to facilitate powder wetting by

Chapter 2. Development and characterization of feedstocks based on fine powders with high volume fraction loading
30
lowering the surface energy of the binder-powder interface. The physical characteristics of the binders
used to elaborate the feedstocks have been developed in Table 8.
Table 8. Characteristics and contents of the proposed binder system
Binder Melting
temperature [°C]
Density
[g.cm-3] Linear Formula Comments
Polypropylene
(PP_G) 140 0.90 [CH2CH(CH3)]n
Mw≈304940
Mn≈46832
Polypropylene
(PP_A) 160~165 0.90 [CH2CH(CH3)]n
Mw≈250000
Mn≈67000
Polyethylene
(LDPE_G) 130 0.91 H(CH2CH2)nH low density
Polyethylene
(LDPE_A) 125~140 0.95 H(CH2CH2)nH low density
Paraffin Wax
(PW_G) 58~60 0.91 (CnH2n+2)m
Mw≈754
Mn≈721
Carnauba
Wax
(CW_A)
83~91 0.99 CH3(CH2)n+1COO(CH2)n+1CH3
Stearic acid
(SA) 70.1 0.86 CH3(CH2)16COOH
Mw≈484
Mn≈475
Oleic acid
(OA) 16.7 0.91 CH3(CH2)7CHCH(CH2)7COOH
Note: Mw: the weight average molecular weight; Mn: the number average molecular weight.
Here the PP_G and PP_A, LDPE-G and LDPE_A are two types of polypropylene and polyethylene with
different characteristics. Figure 32 are some examples of the binders which have been taken into
account in our investigation.
Figure 32. Examples of binder used in the feedstock, a) PP_A, granular of 3~4 mm; b) LDPE_G,
powder of 1 mm; c) SA, powder of 0.2~0.3 mm ; d) LDPE_A, granular of 2.5~3.5 mm; e) CW_A,
lamellar; f) OA, liquid
a) b) c)
d) e) f)

Chapter 2. Development and characterization of feedstocks based on fine powders with high volume fraction loading
31
2.3. Main properties of feedstocks
The quality of the feedstock injected into the mold cavity is one of the main aspects in the micro-PIM
technology. It largely influences the final properties of the resulting micro-components associated to the
process. The determination of proper feedstock formulation becomes is important to satisfy the
requirements. To describe exactly one feedstock, the following aspects should be correctly investigated:
1) value of mixing torque during the mixing process, 2) critical powder loading to ensure the possibility
to mix the powder and the binder, 3) viscosity behavior of the mixture, 4) homogeneity of the mixture.
All these four points should be properly specified, because they strongly influence the success of the
injection molding stage.
2.3.1. Involved equipment to investigate the characteristics and properties of the
feedstock
The tests concerning mixing torque tests have been realized in a Brabender® twin-screw mixer, the
rheological shear viscosity has been measured by using a capillary rheometer.
2.3.1.1. Twin-screw mixer
As shown in the Figure 33, the mixer consists principally in two mixing screws. During the mixing
process, the powder and binder are put into the mixer bowl, the two blades made of special steel turn
reversely towards each other at different speeds to provide excellent compounding and mixing
characteristics to achieve a maximal shear rate (955 °.s-1), leading to the proper homogeneity of the
feedstock.
Figure 33. Brabender® twin-screw mixer W 50 EHT, a) general view of the mixer; b) assembly of
mixing towel; c) the two mixer blades and their counter-rotation towards each other
Mixer
blades
Heating elements
Mixing chamber
Front wall
a)
b)
c)

Chapter 2. Development and characterization of feedstocks based on fine powders with high volume fraction loading
32
A data recording is connected with the mixer in order to get the mixing torque. The main parameters of
this mixer are indicated below:
mixing temperature: 20 to 500 °C;
mixing speed: 0 to 120 rpm;
maximal mixing torque: 150 N.m;
volume of mixer bowl: 55 cm3.
2.3.1.2. Capillary rheometer
Actually, the feedstock filling into the mold cavity is a viscoplastic behavior, it means two properties:
viscosity and plasticity. Meanwhile, the viscosity is the more important one that should be clearly
specified. If the viscosity is too high, mold filling will be very difficult and sometimes lead to failure of
injection stage may be probably caused. On the contrary, low viscosity is acceptable for MIM process
which can facilitate filling the whole mold cavity. However, certain consequences can be involved by
too low viscosity, such as the segregation of powder particle in the feedstock, defects like distortion,
crack and fracture during and after the debinding stage, the inhomogeneous shrinkage of the sintered
components, etc. The viscosity presented in this chapter is an apparent viscosity. No corrections like
Rabinowitsch correction [93] to correct the shear rate at the wall and Bagley correction to correct the
pressure drop (particularly for stress due to funneling effect at the entrance) [94] [95] have not been
done for our viscosity results. The feedstock viscosities have to be evaluated to qualify their injection
abilities, so the viscosity should be carefully measured and analyzed. A useful technique that is used to
measure the viscosity over some range of shear rate or temperature instead of a single fixed point is the
capillary rheometer. In our laboratory, a RH2000 Capillary rheometer (Figure 34) has been used to
characterize the feedstock viscosities. For our investigation, most attention has been paid to the shear
viscosity of our studied feedstock, thus, only single bore (the left one in the Figure 34) has been use to
carry out the measurement. The right bore has not been introduced in our tests due to its main role is to
study the elongation flow behavior. This is a double-bore rheometer, its main technical specifications
are mentioned below:
Driving load: 20 kN;
Maximal temperature: 500°C;
Shear rate range: 20 s-1 to 20000 s-1;
Pressure transducer range: 30000, 20000, 10000, 5000, 1500, 500 psi (1 psi=0.00689 MPa);
Capillary die diameter: from 0.5 to 3 mm (in 0.5mm increments) with the length/die diameter
(16mm/1mm) ratio equals always 16.
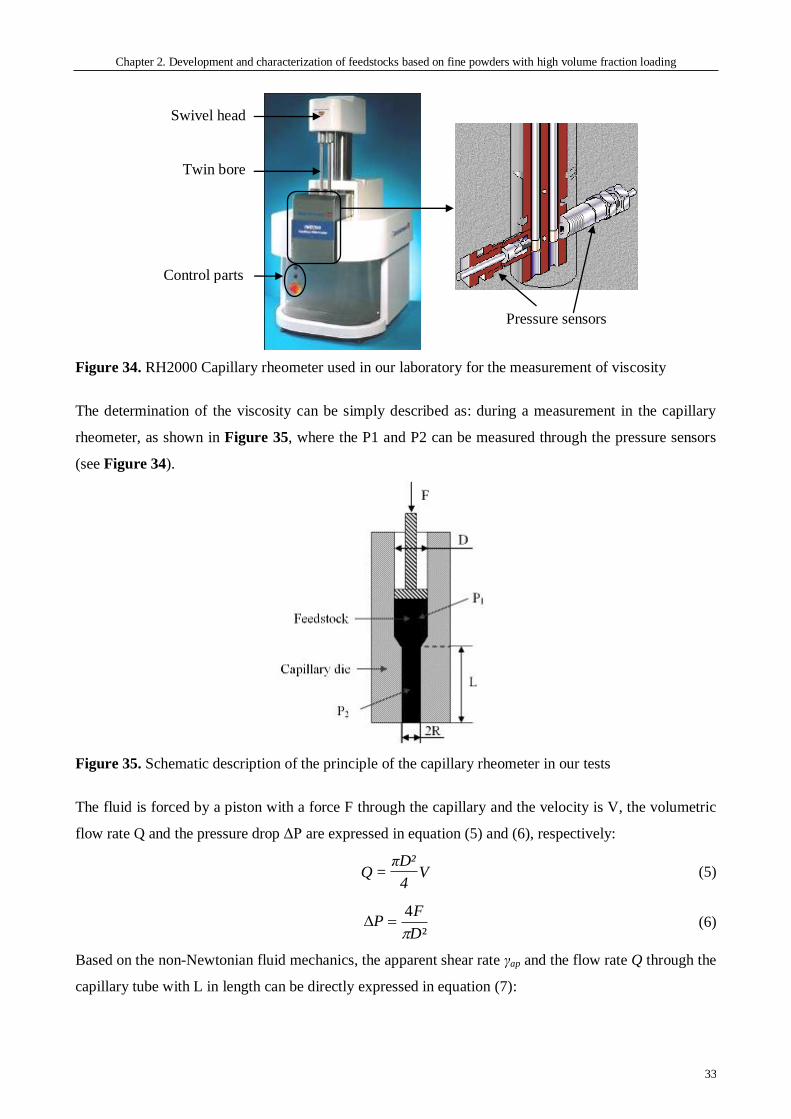
Chapter 2. Development and characterization of feedstocks based on fine powders with high volume fraction loading
33
Figure 34. RH2000 Capillary rheometer used in our laboratory for the measurement of viscosity
The determination of the viscosity can be simply described as: during a measurement in the capillary
rheometer, as shown in Figure 35, where the P1 and P2 can be measured through the pressure sensors
(see Figure 34).
Figure 35. Schematic description of the principle of the capillary rheometer in our tests
The fluid is forced by a piston with a force F through the capillary and the velocity is V, the volumetric
flow rate Q and the pressure drop ΔP are expressed in equation (5) and (6), respectively:
V4
²DπQ = (5)
²
4
D
FP
(6)
Based on the non-Newtonian fluid mechanics, the apparent shear rate γap and the flow rate Q through the
capillary tube with L in length can be directly expressed in equation (7):
Swivel head
Twin bore
Control parts
Pressure sensors

Chapter 2. Development and characterization of feedstocks based on fine powders with high volume fraction loading
34
L
PR
m
ap
2
,
L
PRQ
m
8
4 (7)
where μm is the viscosity of the feedstock under consideration. The apparent shear rate γap and the shear
stress τw can be obtained according to the following equation (8) and (9):
VR
Dap 3
² (8)
LD
RFw
²
2
(9)
The shear viscosity μm is finally given in equation (10) by the ratio between τw and γap:
ap
w
m γ
ημ = (10)
The rheometer is mainly used to characterize the viscosity of the feedstock.
2.3.1.3. Vertical dilatometer
In order to determine the behavior of the feedstocks during the sintering stage, and then to identify the
physical parameters dedicated to numerical simulation, a vertical SETSYS® dilatometer (as shown in
Figure 36) has been set up in our laboratory to carry out the thermal and dilatometric analysis in middle
of my Ph. D. thesis.
Figure 36. Vertical SETSYS® dilatometer used in the investigation
This SETSYS® dilatometer offers a measurement range from ambient temperature to 2400°C. It is
equipped with a carrier gas circulation where flow can be adjusted and controlled by a mass flow
controller (MFC). A large variety of gas is acceptable for this equipment, such as nitrogen, hydrogen,
helium, etc. A "gas mixture" option comprises the auxiliary gas circuit. The carrier and auxiliary gas
circulation are linked by a three-way control valve that mixes the required gas in proportions ranging
from 50/50 to 1/99. Moreover, the main feature of this dilatometer is its modularity. Different
measurement modules (DTA, DSC, TGA and TMA) can be interchanged around the same structure
Control
modules
Measurement
modules
Heating
elements

Chapter 2. Development and characterization of feedstocks based on fine powders with high volume fraction loading
35
comprising the furnace, electronics, gas circuits, atmosphere control, etc. The TGA (Thermogravimetry
analysis) and TMA (Thermomechanical analysis) modules have been used for the present study.
TGA allows measuring the variation of mass of a sample when it is subjected to a temperature program
in a controlled atmosphere. This variation of mass can be a loss (vapor emission) or a gain (fixing of
absorbed gases). TMA is a technique to measure the deformation of a sample under non-oscillating
stress when subjected to a temperature program in a controlled atmosphere. The stresses applied can be
compression, tensile or bending stresses. The associated specifications for the two modules are detailed
in Table 9. The choice of the temperature range and atmosphere depends on the thermocouples and the
furnaces which vary with the material under consideration.
Table 9. Specifications for TGA and TMA modules of the SETSYS® thermo analyzer
Module TGA TMA
Temperature range (°C) 20 ~ 1700
20 ~ 2400
20 ~ 1700
20 ~ 2400
Crucible volume (µl) 50 to 3000 -
Max. size of the sample (mm) L: 20, Ф:14 L: 20, Ф:10
Resolution 0.03 µg 0.2 nm
Measuring range ± 200 mg ± 2 mm
Atmosphere Primary vacuum (10-3 mbar), secondary vacuum (10-5 mbar),
pure H2, pure N2, pure He, 95% N2+5% H2...
2.4. Feedstock formulation
Based on the physical properties of binders above mentioned, three typical feedstock formulations have
been developed, based on polymer + wax (Group #1), polymer + wax + acid (Group #2) and polymer +
acid (Group #3) respectively. A typical powder volume loading range of 58% to 62% has been proposed
for iron and steels, therefore, the powder volume loading has been initially fixed at 60% for our
investigations. The typical ratios between the binders have been adapted to the 316L stainless steel
powder [2], and the same ratios will be kept for the corresponding formulations even though higher
powder volume loadings are involved. Table 10 gives more details of the different feedstock
formulations.
Table 10. Components and related contents used for the proposed feedstock formulations
Formulation Compositions and Contents (in volume, %)
Powder Binders
Group #1 F1 316L stainless steel (60) LDPE_G(16) + PW_G(24)
F2 316L stainless steel (60) LDPE_A(16) + PW_G(24)
Group #2
F3 316L stainless steel (60) PP_G(16) + PW_G(22) + SA(2)
F4 316L stainless steel (60) PP_G(16) + CW_A(22) + SA(2)
F5 316L stainless steel (60) PP_A(16) + PW_G(22) + SA(2)
F6 316L stainless steel (60) PP_A(16) + CW_A(22) + SA(2)
Group #3 F7 316L stainless steel (60) LDPE_G(38) + OA(2)

Chapter 2. Development and characterization of feedstocks based on fine powders with high volume fraction loading
36
To prepare the feedstocks according to the formulations related above, the following conditions have
been set for formulations F1, F2, F3, F4 and F7:
mixing temperature: 160 °C;
mixing rotation speed of the mixer blades: 30 rpm;
mixing time: 30 min.
These mixing conditions have already been determined during the previous studies in our laboratory [96]
[97]. Due to the high melting point of PP_A involved in formulation F5 and F6, the mixing temperature
has been increased to 180 °C for these two feedstock formulations, but the same mixing rotation speed
(30 rpm) and mixing time (30 min) have been retained.
2.5. Choice of the appropriate feedstock formulation through physical
testing
As discussed above, different tests have been carried out with the twin-screw mixer and the bi-bore
capillary rheometer to select the appropriate feedstock formulations. Both 316L stainless steel powders
with D50=10.5 µm and 3.4 µm have been used to do these tests.
2.5.1. Mixing Torque Tests
The metallic powder and the polymer in form of granules or powder is fed in the heated mixing chamber,
fused and milled by the two rotating blades at a fixed rotor speed, while the torque is recorded as a
function of time [98]. The curves of the mixing torque as a function of time have been shown in Figure
37 to Figure 39.
316L stainless steel 5µm
0
5
10
15
20
25
30
35
40
45
50
0 5 10 15 20 25 30
Time [min]
Mix
ing
to
rqu
e [
Nm
]
F1 F2
F1 F1
F2 F2
316L stainless steel 16µm
0
5
10
15
20
25
30
35
40
45
50
0 5 10 15 20 25 30
Time [min]
Mix
ing
to
rqu
e [
Nm
]
F1 F2
F2
F1
Figure 37. Mixing torques vs. time for 316L stainless steel powder (D50=3.4 µm and 10.5 µm)
feedstock according to F1 and F2 (group #1)

Chapter 2. Development and characterization of feedstocks based on fine powders with high volume fraction loading
37
When the binder and metallic powder are introduced in the mixing chamber, they offer a certain
resistance to the free rotation of the blades and therefore the torque increases. When the heat transfer is
sufficient to completely melt the core of the particles, one obtains a macroscopic continuum easier to
mix, the torque required to rotate the blades at the fixed speed decreases and reaches a steady state
regime, and these relatively low values are the final mixing torques for each formulation [98].
From the above curves Figure 37, it can be observed that the mixing torques of formulations are in the
same levels (about 10 Nm for F1 and about 1.5 to 3.5 Nm for F2) for both powders. The mixing torque
according to formulation F1 are about 8 Nm higher than those according to formulation F2. The
replacement of PE_G by PE_A decreases the mixing torque for these feedstocks corresponding to group
#1. Some fluctuant values can be found out in the curve of formulation F1 during the end mixing stage,
which means this formulation is less homogeneous than formulation F2 giving quite few disturbance
considering the mixing torque curve.
316L stainless stee 5µm
0
0.5
1
1.5
2
2.5
3
0 5 10 15 20 25 30
Time [min]
Mix
ing
to
rqu
e [
Nm
]
F3 F4 F5 F6
F4 F4
F3
F3
F6 F6
F5 F5
316L stainless steel 16µm
0
0.5
1
1.5
2
2.5
3
0 5 10 15 20 25 30
Time [min]
Mix
ing
to
rqu
e [
Nm
]
F3 F4 F5 F6
F5
F4
F6
F3
F6 F6F3 F3
F5
F4
Figure 38. Mixing torques vs. time for 316L stainless steel powder (D50=3.4 µm and 10.5 µm)
feedstock according to F3, F4, F5 and F6 (group #2)
A calibration of the employed twin-screw mixer with an identified polymer given by the equipment
supplier has been introduced into between the mixing tests for powder of 5 µm and 16 µm, in order to
ensure the reliability of the very low mixing torque for this group #2. As shown in Figure 38, it can be
seen that these final mixing torques corresponding to the formulations related to group #2 are distributed
in a relatively closer range from 0.2 to 2.5 Nm, the mixing torques in the same level have been
presented in the other researches on 316L stainless steel powder [83]. One can observe that the mixing
torque curve in the case of formulation F4 is noisier in the steady state for both powders which indicates
a lower homogeneity, so this formulation is eliminated from group #2 due to this fact. Compared with
the final values of the two previous tests, the mixing torques corresponding to formulation F7 shown in
Figure 39 is much higher for both powders, and the steady mixing torque for powder of 16 µm is about
7 Nm higher than the one for powder of 5 µm.

Chapter 2. Development and characterization of feedstocks based on fine powders with high volume fraction loading
38
316L stainless steel 5µm
0
5
10
15
20
25
30
30 35 40 45 50 55 60
Time [min]
Mix
ing
to
rqu
e [
Nm
]
F7
F7
0 5 10 15 20 25 30
316L stainless steel 16µm
0
5
10
15
20
25
30
5 10 15 20 25 30 35
Time [min]
Mix
ing
to
rqu
e [
Nm
]
F7
F7
0 5 10 15 20 25 30
Figure 39. Mixing torques vs. time for 316L stainless steel powder (D50=3.4 µm and 10.5 µm)
feedstock according to F7 (group #3)
Through these mixing torque tests for these three groups of feedstock formulation, it is found out that
the final mixing torques corresponding to F1 and F7 are much higher than these corresponding to the
other formulations; the mixing temperature according to F5 and F6 formulation has to be raised about
20 °C~30 °C more than the other formulations in order to completely melt the binders. So formulations
F2 and F3 have been retained to compose the adaptive options in terms of these mixing torque tests.
2.5.2. Viscosity Tests
In the related tests, the diameter of the capillary die is 1 mm. The shear rate range is 100 s-1 to 10000 s-1
which is usually the shear rate range occurring during the injection molding stage, and the temperature
is set at 160 °C (180 °C for formulation F5 and F6) corresponding to the mixing temperature. The
feedstocks (from F1 to F7, 316L stainless steel powder, D50=3.4 µm and 10.5 µm) prepared in the
previous mixing tests have been tested here. The results from the capillary rheometer have been related
in Figure 40, Figure 41 and Figure 42.
According to the curves related in Figure 40, the formulations F1 and F2 in group #1 give generally the
same viscosity for both powders.
1
10
100
1000
100 1000 10000
Shear rate [s-1
]
Sh
ear
vis
co
sit
y [
Pa
.S]
F1_5 µm F2_5 µm
1
10
100
1000
100 1000 10000
Shear rate [s-1
]
Sh
ear
vis
co
sit
y [
Pa
.s]
F1_16 µm F2_ 16 µm
Figure 40. Shear viscosity vs. shear rate corresponding to feedstock formulations F1 and F2 (group #1)

Chapter 2. Development and characterization of feedstocks based on fine powders with high volume fraction loading
39
For group #2 (see Figure 41), the viscosities are mostly distributed in the range of 10 to 100 Pa.s
(except for few individual points) considering the two powders and, the linear relationship of shear rate
to shear viscosity (in logarithmic coordinate) for powder of 16 µm is more clear compared to powder of
5 µm. According to formulation F3, the feedstocks with the two powders gives viscosities in a close
range; the feedstock prepared with the powder of 16 µm is more viscous than these prepared with
powder of 5 µm according to formulation F4 and F5, but it has been conversely presented for
formulation F6.
1
10
100
100 1000 10000
Shear rate [s-1
]
Sh
ear
vis
co
sit
y [
Pa
.s]
F3_5 µm F4_5 µm F5_5 µm F6_5 µm
1
10
100
100 1000 10000
Shear rate [s-1
]
Sh
ea
r v
isc
os
ity
[P
a.s
]F3_16 µm F4_16 µm F5_16 µm F6_16 µm
Figure 41. Shear viscosity vs. shear rate corresponding to feedstock formulations F3, F4, F5 and F6
(group #2)
The viscosities of group #3 (see Figure 42) are higher than the two other groups. One can observe that a
lower shear viscosity has been obtained for the powder of 5 µm in contrast to powder of 16 µm
according to formulation F7.
1
10
100
1000
100 1000 10000
Shear rate [s-1
]
Sh
ear
vis
co
sit
y [
Pa.s
]
F7_5 µm
1
10
100
1000
100 1000 10000
Shear rate [s-1
]
Sh
ea
r v
isc
os
ity
[P
a.s
]
F7_16 µm
Figure 42. Shear viscosity vs. shear rate corresponding to feedstock formulations F7 (group #3)
In terms of these rehological results, one can clearly remind that the feedstock corresponding to
formulation group #2 exhibits the lowest viscosities compared with the two other series considering to
the same shear rates and formulation F3 is less viscous than the other formations within group #2.
Finally, combining the conclusions from the mixing torque and viscosity tests, formulation F3 has been
retained for the subsequent tests by employing 316L stainless steel powder with D50=3.4 µm.

Chapter 2. Development and characterization of feedstocks based on fine powders with high volume fraction loading
40
2.6. Determination of critical powder loading
In powder injection molding, higher powder loading is benefic for the resulting properties of the
component. But the powder loading cannot be increased in an unlimited range [99]. Too high powder
content means there is not sufficient binder to completely fill the desired geometry with the powder
particles. So it means that undesirable voids will result from injection molding, which leads to
difficulties during molding stage. Therefore, a critical powder loading can be determined, that could be
associated to the possibility of filling the mold cavity. Generally, the feedstocks are loaded slightly
lower than the critical value. A feedstock with optimal powder loading will exhibit proper rheological
properties for injection molding, small distortion during debinding and sintering and thus appropriate
mechanical properties after debinding and sintering [99]. Four different methods are compared in this
analysis. The first two ones consist in mixing tests that are carried out by continuously rising powder
loading or by rising separately powder loading in the two-screw mixer using the same conditions as in
the tests to select the feedstock formulation. The parameters are the same ones like in the previous
mixing torque tests: 160 °C for the mixing temperature and 30 rpm as the mixing rotation speed, but the
weight of the powders are different. In order to determine the power law for characterizing the
rheological behavior, the same capillary rheometer has been used.
2.6.1. Mixing tests by continuously increasing powder loading
For the first test, the powder volume loading has been increased gradually from 50% to 78% by adding
the powders with an increment equals 2% for each level. This methodology has been also used in the
past by T. JARDIEL et al. to determine the critical solid loading [100]. The mixing torque vs. mixing
time is related in Figure 43. Three different zones appear looking to this curve. In zone 1, there is
mainly binder in the mixture and the torque remains almost at the same low level. In zone 2 (64% to
70%) the torque begins to slightly increase starting from powder loading equal to 64%, in zone 3, the
torque increase rapidly from 70% to the maximal powder loaded feedstock corresponding to 78%. So in
relation with this incremental test, the critical powder volume loading has been selected from 64% to
70%. This test can provide a way to get the critical solid loading in a simple way just using one testing
cycle. The complete heating cycle is around 225 min (14 steps to increases of powder loading) with
intensive shearing that leads to the decomposition of the stearic acid. In order to ensure that the final
quantity of feedstock will not excess the maximal content of the mixer, 70 g (about one fourth of the
maximal content of the mixer) of powder has been added into the mixer cavity at the beginning of the
test. It results that the mixing torques are smaller than the ones of the next test according to the same
powder volume loading as shown in the small chart (in the left upper corner in Figure 43), especially

Chapter 2. Development and characterization of feedstocks based on fine powders with high volume fraction loading
41
for the powder volume loading lower than 66%, this is due to the fact that always 160 g powders are
involved in the subsequent mixing tests.
0
0.5
1
1.5
2
2.5
3
50 52 54 56 58 60 62 64 66 68 70 72 74 76 78
Powder volume loading, [%]
Mix
ing
to
rqu
e [
N.m
]
Zone 1 Zone 3
0
0.1
0.2
0.3
0.4
0.5
0.6
Mix
ing
to
rqu
e [
N.m
]
0,05 Nm0,09 Nm
0,16 Nm
0,27 Nm
0,51 Nm
58 % 60 % 62 % 64 % 66 %
Zone 2
Figure 43. Mixing torque vs. powder volume loading obtained through the continuously rising powder
loading technique (316L stainless steel powder, D50=3.4 µm, feedstock formulation F3, mixing
temperature=160 °C, mixing time=30 min)
2.6.2. Mixing tests by batch powder loading
Instead of increasing continuously powder loading, other tests have been carried out with a different
method for the second test. The mixtures have been prepared one by one with different powder loadings
from 60% up to 78%. Figure 44 shows the three different domains in the curve.
0
0.5
1
1.5
2
2.5
60 62 64 66 68 70 72 74 76 78
Powder volume loading [%]
Mix
ing
to
rqu
e,
[N.m
]
0
0.2
0.4
0.6
0.8
1
1.2
1.4
Mix
ing
to
rqu
e [
N.m
]
0.52 N.m
Zone 1Zone 2
Zone 3
Figure 44. Mixing torque vs. powder volume loading related to the mixing tests by separately rising
powder loading (316L stainless steel powder, D50=3.4 µm, feedstock formulation F3, mixing
temperature=160 °C, mixing time=30 min)

Chapter 2. Development and characterization of feedstocks based on fine powders with high volume fraction loading
42
From 60% to 64%, the torque remains almost stable; above 64% it begins to increase slowly; from
70%, the torque goes up fast since there are no more enough binders to properly mix the powders.
One can remark that the critical powder loading is located in the range of 64% to 70%. This test
proves well the conclusion of the first test.
2.6.3. Rheological tests
Feedstock loaded from 62% to 78% (except for 74%, 76% and 78% due to the excess content of the
powder) have been sequentially tested using a capillary rheometer, considering different shear rates with
the same capillary dies diameters (1 mm) and the same temperature. According to the results related in
Figure 45, nearly the same phenomena are observed. The related viscosities corresponding from 62% to
66% (zone 1) increase slowly. In zone 2 (from 66% to 70%), these viscosities start to progressively
increase, but above 70%, an abrupt rise appears. So one can observe from these shear viscosity
measurements, the critical powder loading vs. powder loading is located in the range of 66% to 70%. In
addition, the viscosities of the feedstock corresponding to formulation 2 are always less than 180 Pa.s, it
results that these feedstock are well adapted to be injected.
0
20
40
60
80
100
120
140
160
180
62 64 66 68 70 72 74 76 78
Powder volume loading [%]
Sh
ea
r vis
co
sit
y [
Pa.s
]
10000 /s 5000 /s
2682 /s 1390 /s
772 /s 374 /s
192 /s
Limit of powder
volume content
Zone 1
Zone 2
Zone 3
Figure 45. Shear viscosities vs. powder volume loading obtained from the rheological tests for the
feedstock loaded from 62% to 78% (shear rates from 192 s-1 to 10000 s-1, measured at 160 °C, 316L
stainless steel powder, D50=3.4 µm, feedstock formulation F3, mixing temperature=160 °C, mixing
time=30 min)
2.6.4. Feedstock viscosity model
From the previous tests, the critical powder loading could be fixed from 66% to 70%. In order to get
more accurate rheological behavior, a complementary test has been carried out to define more accurately

Chapter 2. Development and characterization of feedstocks based on fine powders with high volume fraction loading
43
define the critical powder loading based on the previous rheological results, the related powder volume
loading range is from 64% to 72%. This model has been proposed by Aggarwal et al. [101], and it
expresses the viscosity as a power law temperature dependent model as [102] [103], see equation (11):
1exp),(
n
RT
EBT (11)
where η , γ , n, B, E, T and R correspond to the viscosity, the shear rate, the power-law exponent, a
material specific reference factor (some authors call this factor the reference viscosity), the flow
activation energy for the Arrhenius temperature dependence of the viscosity, the absolute temperature
and the gas constant, respectively. The value of n indicates the degree of sensitivity of viscosity against
shear rate. The lower the value of n the more sensitive is the viscosity versus shear rate [83].
The values of the parameters according to equation (11) for different powder volume loading have been
calculated (by using the method proposed by Aggarwal et al. [101]) and indicated in Table 11 and the
viscosities are revealed in Figure 46. These results are in good agreement with the studies realized by
Aggarwal et al. with 316L stainless steel powder having the same spherical particle.
Table 11. Values of the different factors according to different powder volume loading
Powder volume loading, [%] B [Pa.s] E [kJ/mol] │n -1│
64 0.154360 34.43 0.4650
66 0.012141 34.59 0.2286
68 0.002542 38.30 0.1985
70 0.000197 47.24 0.2462
72 0.061651 28.20 0.3509
y = 180.19x - 0.2286
y = 105.56x - 0.1985
y = 155.24x - 0.3509
y = 98.383x - 0.2462
y = 2193.7x - 0.4650
1
10
100
1000
1000 10000Shear rate [s
-1]
Sh
ear
vis
osit
y [
Pa.s
]
64%
66%
68%
70%
72%
Figure 46. Shear viscosities (expressed by power law model) vs. shear rate for the feedstocks (powder
loadings varying from 64% to 72%)
Afterwards, the power-law exponent is then plotted in Figure 47 (the viscosity has not been obtained
for 72% corresponding to high shear rate range), which provides the way to determine a critical powder

Chapter 2. Development and characterization of feedstocks based on fine powders with high volume fraction loading
44
loading zone corresponding to the minimal value of the exponent, and 68% has been retained for the
critical powder volume solid loading.
Figure 47. Determination of critical powder volume loading through feedstock viscosity model
Therefore, according to the tests carried out with the appropriate formulation, the critical powder solid
loading for 316L stainless steel powders (D50=3.4 µm) has been fixed to 68%. In addition, from the
results of the rheological tests, the viscosities of the feedstock correspond to a relatively small level.
Table 12 summarizes the proposed methods for the determination of the critical powder volume loading
of the 316L stainless steel feedstock (D50=3.4 µm, feedstock formulation F3), and the main features of
four different methods has been given as well.
Table 12. Summary of the employed methods in our investigation to determine the critical powder
volume loading for 316L stainless steel feedstock
Method Continuous
mixing tests
Separate
mixing tests
Rheological
tests
Power law
model tests
Tested powder
loading range 50~78% 60~78% 60~72% 66~70%
Obtained
critical powder
loading range
64~70% 64~70% 66~70% 68%
Equipment Twin-screw mixer Capillary rheometer
Advantage Already examined
by other authors,
one single
continuous test to
do, time-saving
Simultaneous
determination of
injectable
feedstocks with
different powder
volume loading
Rheological
characterization
of the tested
feedstocks
Already examined by
other authors,
rheological
characterization of
the elaborated
feedstocks
Disadvantage Possible
decomposition of
the binder during
the continuous
heating
Time-consuming Obligatory
preparation of the
feedstock,
time-consuming
Obligatory
measurement of the
viscosity and
preparation of the
feedstock, time-
consuming

Chapter 2. Development and characterization of feedstocks based on fine powders with high volume fraction loading
45
2.7. Homogeneity tests for the feedstocks
A proper homogeneity is one of the important goals for the feedstock preparation. In practice, three
different situations can be met, as sketched in Figure 48. In the case of an excessive powder loading the
fine spaces or interstices between small particles make the mixing stage more difficult [104]. During
mixing, insufficient binder will induce incomplete wetting of the powder particle surface that leads to
injection molding difficulties. In contrast, excessive binder decreases the viscosity of the feedstock, and
this may cause powder-binder separation under high shear stress during injection molding [23]. On the
other hand, molded microstructures with low strength may cause demolding problems as they can break
or be distorted during demolding [105]. Lower powder content can also cause troubles during the
sintering as well as the overall dimensions can undergo higher and non-isotropic shrinkage.
Figure 48. Three possible situations in a powder-binder mixture [23]: a) excess of binder, b) critical
binder concentration, and c) voids due to insufficient binder
Different methods have been studied to characterize the quality of a powder mixture, for example, the
binder burnt-out test, the methodology based on principle component analysis (PCA) [106], etc. In the
present investigation, the homogeneity of the feedstock was examined by binder burnt-out test and
under scanning electron microscope (SEM).
For the binder burnt-out test, the homogeneity of the feedstock was assessed by comparing the weight
loss [36] in the SETSYS® dilatometer with TGA. The available melting pots to this application are
related in Figure 49.
Figure 49. Some specific melting pots adapted to TGA (Thermogravimetric analysis) application
Binder Powder
particle Void
c) missing binder a) escessive binder b) critical binder
Melting pot used
in TGA test

Chapter 2. Development and characterization of feedstocks based on fine powders with high volume fraction loading
46
During the TGA measurement, the sample of the feedstock prepared according to formulation F3
(Powder+ PP_G+ PW_G+ SA) is contained in the selected melting pot (alumina, up to 1700°C). The
content of the binder in feedstock formulation F3 is indicated in the Table 13.
Table 13. Components and related contents in weight and volume in the feedstock formulation F3
Type 316L PP (Polypropylene) PW (Paraffin wax) SA (Stearic acid)
Volume,% 60 16 22 2
Weight,% 92,90 2,80 3,90 0,40
Then the samples are put into the dilatometer furnace where an argon flow rate of 20 ml/min has been
set. The temperature is set to 500 °C from 20 °C with a heating rate of 2 °C/min, the heating cycle and
the corresponding results are shown in Figure 50.
Figure 50. TGA results of the 316L stainless steel feedstock (D50=3.4 µm, formulation F3, powder
volume loading=60%).
The two peaks related to the dTG curve correspond to the elimination of PW_G plus SA and PP_G
respectively. The complete elimination of the binder at 427 °C corresponds to the minimum thermal
debinding temperature. The total weight loss at the end of the heating cycle is about 7.2%, the value is
extremely close to the theoretical binder weight in the feedstock formulation 3 (7.1% as indicated in
Figure 50), the difference of 0.1% can be explained through the air, especially the vapor, absorbed
through the feedstock. Three TGA tests with different total weight of feedstock have been investigated
associated to the same conditions. The same results have been obtained. Hence, it confirms the
homogeneity of the feedstock. From these essential TG analyses to determine the maximum temperature
for the removal of binder in the thermal debinding cycle. It can be seen that the weight loss assisted by
the degradation of polypropylene which serves as the backbone of the injected components and starts at
PW_G+SA
PP_G

Chapter 2. Development and characterization of feedstocks based on fine powders with high volume fraction loading
47
about 350 °C. This indicates the maximum temperature during injection moulding. In addition, the
scanning electron micrographs of the feedstock are related in Figure 51. One can observe that the
particles uniformly disperse into the matrix and are enveloped by the binder. So as a concluding remark,
based on the thermogravimetry analysis results and the scanning electron micrographs, the proper
homogeneity is well proved for the selected feedstock formulation F3.
Figure 51. Scanning electron micrographs of feedstock after mixing stage, corresponding to formulation
2, powder loading equal 60% (mixing temperature: 160°C, mixing rotation speed: 30 rpm and mixing
time: 30 min)
2.8. Selected feedstock for the subsequent experiments
As the feedstock formulation F3 has been previously chosen, and the critical powder volume loading
has been generally fixed at 68%. Hence, by mixing the binders according to the formulation F3 and the
316L stainless steel powder (D50=3.4 µm) with four different powder volume loadings (60%, 62% 64%
and 66%), four different feedstocks have been prepared for the following injection tests in chapter 3.
The mixing temperature is 160 °C; the mixing rotation speed equals 30 rpm.
In Figure 52, the measured shear viscosities and shear stresses for these four feedstocks have been
given in log10 scale for the temperatures of 160 °C, 180 °C and 200 °C. A linear relationship between
the shear viscosity vs. shear rate and shear stress vs. shear rate has been indicated by these curves,
respectively. It is shown that the shear viscosities decrease and the shear stresses increase with the
increasing shear rates for a fixed temperature. Moreover, it is also presented that the shear viscosities
and the shear stresses decrease with the increasing temperatures; in contrary, when the powder volume
loadings increase, the values of the shear viscosity and shear stress rise.
However, it is interesting to note that the shear viscosity and shear stress for feedstocks loaded at 66% is
less stable than the others. Since the shear stress can be considered as the minimum force required to
make a relative movement between particle assemblies [107], these worse results of feedstocks loaded
at 66% could be considered as the difficulty of feedstock flow resulted from the lower powder volume
loading of the binder in the studied feedstock.
a) b) 5 µm 2 µm

Chapter 2. Development and characterization of feedstocks based on fine powders with high volume fraction loading
48
Figure 52. Shear viscosity and shear stress vs. shear rate for the 316L stainless steel feedstocks (D50=3.4
µm) at different temperatures with powder volume loadings of a) 60%, b) 62%, c) 64% and d) 66%
according to formulation F3.
Summary
This chapter has proposed the development of the new feedstocks, especially for fine stainless steel
powders. The methodology to obtain the critical powder content has been presented and then validated
through the measurement of the mixing torque and viscosity, and then the approximate powder volume
loading window has been selected as well. For the feedstock based on 316L stainless steel powder
(D50=3.4 µm), three feedstock formulation groups have been tested, and the powder volume loading has
been optimized using different methods until 72%. SEM and TGA analyses have confirmed the
homogeneity of these feedstocks. The rheological analysis in injection shear rate range has been carried
out also until the same limit (72%). The feedstock with high powder volume loading is more appropriate
for injection moulding because fluctuations of temperature will not produce an important viscosity
change [2]. The critical powder volume content has been chosen up to 68%. Normally, the optimal solid
content means 2 to 5% less powder than the critical content. As a consequence, an optimum powder
loading of 66% has been determined to go on with the injection stage. The feedstocks based on 316L
stainless steel powders (D50=3.4 µm) have been prepared to inject with the powder volume loading
1
10
100
375 593 1391 2683 5181 10002
Shear rate [s-1
]
Sh
ear
vis
co
sit
y [
Pa.s
]
1
10
100
Sh
ear
str
ess [
kP
a]
Shear stress_160 °C Shear viscosity_160 °C
Shear stress_180 °C Shear viscosity_180 °C
Shear stress_200 °C Shear viscosity_200 °C
1
10
100
374 652 1391 2683 5181 10001
Shear rate [s-1
]
Sh
ear
vis
co
sit
y [
pa.s
]
1
10
100
Sh
ear
str
ess [
kP
a]
Shear stress_160 °C Shear viscosity_160 °C
Shear stress_180 °C Shear viscosity_180 °C
Shear stress_200 °C Shear viscosity_200 °C
1
10
100
374 722 1391 2683 5182 10001
Shear rate [s-1
]
Sh
ear
vis
co
sit
y [
Pa.s
]
1
10
100
Sh
ear
str
ess [
kP
a]
Shear stress_160 °C Shear viscosity_160 °CShear stress_180 °C Shear viscosity_180 °CShear stress_200 °C Shear viscosity_200 °C
1
10
100
374 722 1391 2683 5181 10001
Shear rate [s-1
]
Sh
ear
vis
co
sit
y [
Pa.s
]
1
10
100
1000
Sh
ear
str
ess [
kP
a]
Shear viscosity_160 °C Shear viscosity_180 °C
Shear viscosity_200 °C Shear stress_160 °C
Shear stress_180 °C Shear stress_200 °C
a)
c) d)
b)

Chapter 2. Development and characterization of feedstocks based on fine powders with high volume fraction loading
49
varying from 60% to 66%, and the feedstock based on copper powder with the powder content of 60%
will be injected for the micro bi-material components in next chapters.

Chapter 3. Micro-MIM process for miniaturization and functionalization
50
Chapter 3. Micro-MIM process for miniaturization and
functionalization
With the elaborated and characterized feedstock resulting from previous investigation, the injection
stage can be processed. In this stage, the desired form of the components should be attained without
defects; this is the main objective of injection molding. Both mono-material injection with 316L
stainless steel powder and bi-material injection combining 316L stainless steel and copper feedstocks
have been tried to develop a micro-component integrating miniaturization and multi-functionalization.
3.1. Equipment used for injection molding stage
As conventional injection, micro injection molding and micro bi-material injection are also developed in
our laboratory, different injection equipments have been involved for this stage: Arburg 220-S© and
Battenfeld Microsystem 50©.
3.1.1. Arburg 220-S injection moulding equipment
By injecting the feedstock prepared according to formulation F3 (316L stainless steel powder, D50=3.4
µm, different powder volume loading: 60%, 62%, 64% and 66%), the specimens dedicated to the
identification tests are injected in hydraulic Arburg 220-S© (Figure 53) injection equipment.
Figure 53. Hydraulic Arburg 220-S injection equipment for the conventional injection molding
The main technical data are shown in Table 14.
Table 14. Technical specifications of Arburg 220-S injection equipment
Clamping force (max.) 20 kN
Injection volume 3 to 12 cm3
Injection speed (max.) 366 mm/s
Injection temperature (max.) 400 °C
Injection pressure (max.) 250 MPa
Injection flow (max.) 22 cm3/s

Chapter 3. Micro-MIM process for miniaturization and functionalization
51
3.1.2. Battenfeld Microsystem 50 injection moulding equipment
Different equipments have been developed especially for micro-injection molding and bi-material
microinjection with polymers or high loaded feedstocks, such as electric injection molding equipments,
appropriate units to measure accurate volume and to check the quality of the components, see Battenfeld
Microsystem© or Ferromatik Milakron© [108] [109] [110]. More and more demands and requirements
appear about micro-components realized by micro powder injection molding. Nevertheless, equipments
available for bi-feedstock injection molding are not so common for PIM processes. Investigations and
process knowledge has been developed to design adapted molds for bi-material injection molding to
micro scale components during this Ph. D. thesis.
A specific micro-injection Battenfeld Microsystem© 50 (Figure 54) has been used to perform micro-
Powder Injection Molding, a special micro bi-material injection molding equipment for biomedical and
micro-system.
Figure 54. FEMTO-ST employed Battenfeld Microsystem 50 injection equipment (dedicated to micro-
injection and bi-material injection molding) and examples of the components illustrated in the literature
to prove the capacity of the new equipments, courtesy of Battenfeld
The micro-injection equipment consists of clamping module, injection module, swivel module, removal
and handling module, quality monitoring module completed through an external vacuum pump. The
injection unit is especially composed of three stages to achieve the high-precision processing of the very
small injection molding volume, a 14 mm diameter extruder screw, an injection piston with a diameter
of 5 mm and a 5 mm piston for pre-dosing with a accuracy of 0.001 cm3. The injection molding
capacities are the following: maximal injection speed equal to 760 mm.s-1; maximal injection pressure
equal to 250 MPa and theoretical injection volume from 0.025 cm3 to 1.1 cm3; the maximal clamping
force equal 50 kN and the ejection force equal to 1.2 kN.
In order to achieve a proper description of the injection process of Battenfeld Microsystem© 50, Figure
55 is provided. At first the extruder screw pushes the material into the metering sleeve, and then the
Injection
unit A
Injection
unit B
2 mm 2 mm
4 mm 1 mm
PIM application Bi-MIM application
MIM application MIM application
a) b)

Chapter 3. Micro-MIM process for miniaturization and functionalization
52
materials are pressed into the nozzle where the injection piston injects them into the mold cavity. After
demolding, one injection moulding cycle ends.
Figure 55. Sketch of the injection unit of Battenfeld Microsystem 50
3.1.3. Mould design and micro machining
Since the molds are specially designed, manufactured and used for micro powder injection molding,
well adapted equipments (see Figure 56) have been set-up to manufacture the mold die cavities. The
main technical specifications of these equipments are detailed in Table 15.
Figure 56. Equipment used in the investigation related to the machining of die cavities, a) DML 40 SI
laser micro-manufacturing; b) HSPC 2216 high speed micro-milling and c) Charmilles Robofil 2050TW
micro-Wire Electrical Discharge equipment
Table 15. Main technical specifications of the employed equipments for the mould manufacturing
DML 40 SI
Nd: YAG laser, 3 axes mechanical, 3 axes optical, laser beam
diameter: 40~100 µm
HSPC 2216
3 axes machining, 20~30000 rpm and 60000~160000 rpm,
precision: ±1 µm, automatic tool changer with 32 positions
Charmilles Robofil 2050TW
wire diameters: 0.33~20 µm, maximal taper in TW mode: ±30 °,
max. work piece dimensions (L×D×H): 1000×490×260 mm,
minimal surface roughness (steel, H=60 mm): Ra=0.10
Cylindrical
Sprue
Nozzle
Mounting plate
Injection piston
Shut-off valve
Extruder screw
Metering sleeve Pressure sensor piston
Heating zone
Molded
component
Fixed part
of mold
a) c) b)

Chapter 3. Micro-MIM process for miniaturization and functionalization
53
3.2. Mono injection for the physical identifications of the feedstocks
After granulating the feedstock to small pellets for easy injection molding, the 316L stainless steel
(D50=3.4 µm) feedstock is mixed homogenously according to formulation F3 with different powder
volume loading (60%, 62%, 64% and 66%) is injected by using Arburg 220-S© injection equipment as
mentioned above. he mold involved for these experiments is related in Figure 57, it was manufactured
and optimized during previous Ph. D. thesis [44] in our research team, four types of specimen have been
combined in the same mold, and the dimensions are indicated as well. Figure 58 relates the injected
components from this mold using the following the injection parameters:
Injection temperature: 180 °C;
Injection volume: 4 cm3;
Injection speed : 10 m/min;
Injection pressure: 100 MPa;
Injection flow: 20 cm3/s.
One can notice that the injection temperature is 180 °C, which is a little higher than the mixing
temperature (160 °C) related to the preparation of the feedstock; this is to ensure that the feedstock can
fill perfectly into the entire die cavity of the mold, especially for the small size specimen corresponding
to type 3 and 4 with a section gate of 0.5 mm2 without paraffin wax degradation.
Figure 57. Mold combining four types of specimen used for mono injection tests, a) dimensions of the
mold cavities; b) the ejectors for the four types of specimen
According to the injected specimens related Figure 58, this injection is well realized for the four loaded
feedstocks (from 60% to 66% in 2% increments), there is no external defect on the specimens with a
constant geometry size. The beam-bending test specimens will be used to determine the viscosity
modulus during the sintering stage.
Figure 58. Injected specimens from the involved two-plate mold without external defect
mm
a)
Type 2 Type 1
Type 3 Type 3 Type 4
b)
23 mm 25 mm
10 mm 10.5 mm

Chapter 3. Micro-MIM process for miniaturization and functionalization
54
3.3. Micro injection of the specimens used for validation of the
simulations
Instead of using Arburg 220-S© injection equipment, Battenfeld Microsystem© 50 is also used for the
micro injection of the different specimens which will be used to validate the subsequent FE simulations
of the sintering stage with Abaqus®. Four types of specimen have been assembled in the same mold, the
micro die cavity of this two-plate mold is shown in Figure 59, and the thickness of these specimens is
0.5 mm. These different specimens will be used for the simulation of sintering stage in order to compare
the shrinkage and final relative density applied to the micro-components manufactured from the MIM
process with the very fine powder.
Figure 59. Geometry of the four different micro-mold cavities used specifically in micro-injection tests,
a) Type 1, step test specimen; b) Type 2, beam-bending test specimen; c) Type 3, cross test specimen; d)
Type 4, tensile test specimen
Four feedstock with different powder volume loadings corresponding to 60%, 62%, 64% and 66%
(316L stainless steel powder, D50=3.4 µm, according to formulation F3) have been tested by using this
5 mm
1 mm
1 mm
5 mm
1 mm
0.5 mm
5 mm
0.5 mm
3 mm
1 mm
5 mm
0.5 mm 1 mm 0.75 mm
1 mm
3 mm
a)
b)
c)
Type 1
Type 2
Type 1
d)
Type 2

Chapter 3. Micro-MIM process for miniaturization and functionalization
55
mold. The mould has been designed by another Ph. D. student in our research team: Mr. Guillaume
LARSEN). Some injected specimens are shown in Figure 60.
Figure 60. Injected micro specimens dedicated to the simulations of sintering stage with Abaqus®,
realized in Battenfeld Microsystem 50 corresponding to powder volume loading to 60%
To guarantee that the feedstock filling can be correctly carried out in the micro mold cavities with a
smallest semi-circle injection section gate of 0.25 mm2, the injection temperature is increased up to
210 °C (10 °C even higher than in the former mono injection of the specimens used for the
identifications). The other injection parameters are:
Injection volume: 45 mm3;
Injection velocity : 10 m.min-1;
Injection pressure: 35 bar.
3.4. Homogeneity tests of the injected specimens from micro injection
The TGA analysis of the feedstock (mentioned in section 2.7) has proved that the feedstocks prepared
according to formulation F3 have a good homogeneity. Due to the fact that the factors of the injection
stage can influence the feedstock quality, another TG analysis has been performed on the injected
specimens from micro injection in Battenfeld Microsystem© 50. Two methods have been compared for
these analyses. In the first case, the tested objects are one entire specimen of the four types. Accordingly,
each specimen has been split into two parts in the second case, and then two or three parts from the
different types of specimen have been tested together in one analysis. The results of the micro
specimens injected with the feedstock loaded at 62% have been plotted in Figure 61 and Figure 62 for
the two cases, respectively.
5 mm
Type 1
Type 2
Type 3
Type 4

Chapter 3. Micro-MIM process for miniaturization and functionalization
56
Figure 61. TGA results for the entire specimens from micro injection with 316L stainless steel
feedstock (D50=3.4 µm, formulation F3, powder volume loading=62%)
Figure 62. TGA results of the split specimens from micro injection with 316L stainless steel feedstock
(D50=3.4 µm, formulation F3, powder volume loading=62%)
In terms of the results from these two different methods, homogeneity of the injected specimens or the
extruded feedstock has been indicated by the good agreement of the two weight losses in each plot.
However, notice that the weight losses of the polypropylene are higher than the theoretical value (2.7%,
calculated according to equation (3)), which is caused by the residual polypropylene in the injection
PW_G+SA
PP_G
PW_G+SA
PP_G

Chapter 3. Micro-MIM process for miniaturization and functionalization
57
machine. Moreover, the similar TG analyses have been carried out for the injected micro specimens
with the feedstock loaded at 64%, and the same conclusion has been also reached.
Hence, in view of these TG analyses, the homogeneity of the micro specimens injected with the
feedstocks according to formulation F3 has also been examined regardless the excrescent polypropylene.
In addition, the segregation of the small components has been also used to verify by micro X-Ray
tomography, the homogeneity of the specimen has been obtained. For example, the tomography photo
of specimen type d) shown in Figure 63 indicates the homogeneous distribution of feedstock, hardly
any segregation has been presented regardless the flash in the edge area.
Figure 63. X-Ray tomography photo of micro specimens of type d) injected with 316L stainless steel
feedstock (D50=3.4 µm, formulation F3, powder volume loading=60%)
3.5. Bi-material injection mold with two-plate mold
Bi-material components could be produced by using bi-powder injection molding technique. This
process requires using a bi-unit powder injection molding process. It is widely recognized that the two
different materials need to follow nearly similar thermal expansion and sintering kinetics, and also
proper bonding characteristics [111].
Important research activities have been developed through CarCIM project since three years, especially
by IKTS (Fraunhofer Institute for Ceramic Technologies and Systems) and the partners. The research
investigations have concluded the possibility to inject two feedstock CIM component (see Figure 64)
and proposed some approach to study the feedstock development in order to have the same shrinkage
during the sintering stage for both materials. The topic of the project is to focus on the components in
size of about 22 mm.
Figure 64. Bi-material CIM component realized during CarCIM project (STREP FP7)
Feedstock 1 Feedstock 1
Feedstock 1 Feedstock 1
22 mm
Flash
0.5 mm

Chapter 3. Micro-MIM process for miniaturization and functionalization
58
During the first bi-material injection moulding test, the 316L stainless steel feedstock (D50=3.4 µm,
according to formulation F3) with different powder loadings of 60% and 64% have been injected into a
two-plate tensile test specimen mould cavity through two separate sets of sprue and rectangular runner
(Figure 65) in Battenfeld Microsystem© 50, the dimensions of the mold cavity are given also.
Figure 65. Two-plate tensile mould for bi-material tensile test specimen injected on Battenfeld
Microsystem 50, a) the micro cavity, sprues and runners of the mold; b) the dimensions (in mm) of this
micro die cavity of this micro mold
The injected components (Figure 66) have been successfully obtained without external defects, the size
and weight of the specimens are uniform. The injection temperature is 220 °C; the injection volume for
both injection units are 30 mm3 and the injection pressure is 40 bar.
Figure 66. Tensile test specimen injected with feedstock loaded at 60% and 64% according to
formulation F3, a) enlargement of the interface region between the two different region; b) the resulting
injected tensile test specimen
Even the injection section during this bi-material injection is bigger than in the previous tests, the
injection temperature is set at 220 °C due to the high powder volume loading of 64% to ensure that the
correct feedstock filling can be achieved. In the photo taken under macroscope, the feedstocks represent
two different colors, because the feedstock loaded at 60% has less 316L stainless steel powder than the
one loaded at 64%, and this metal powder is not brilliant before sintering, so the part with more powder
particles is darker than the other. However, it is clearly shown that the interface between the two
feedstocks is not straight, and its position varies with the injection parameters; this is related to the fact
that the die cavities for both feedstocks are not separated, and they are injected simultaneously, so the
Sprue A Sprue B
a) b)
Runner A Runner B
Micro cavity
Injection unit A:
316L stainless steel
powder, D50=3.4
µm, feedstock
formulation F3,
powder volume
loading=60%,
Interface region between
two different feedstocks Injection unit B:
316L stainless steel
powder, D50=3.4
µm, feedstock
formulation F3,
powder volume
loading=64%,
a) b)
11 mm

Chapter 3. Micro-MIM process for miniaturization and functionalization
59
front flows of both different feedstock meet together to form the interface, but this irregular meeting of
the feedstocks is not able to be repeated uniformly. Consequently, another mold specially designed for
bi-material injection molding with two separated injection chambers are developed for the next bi-
material injection test.
3.6. Bi-material injection with three-plate mold
As lots of research activities related to injection moulding with 316L stainless steel powder have been
realized in the research team since long time, some other powders have been gradually introduced into
the studies. In this thesis, in order to carry out the bi-material injection moulding, a Cu powder has been
taken into account in this investigation. For this bi-material injection test, a three-plate mold has been
developed in order to clearly define the separated die cavities for each feedstock, thus the interface
between both feedstocks can be well controlled. This mold has been specially designed and
manufactured during this Ph. D. thesis, the design of the mold is based on the knowledge issued from
the two different polymer domains. The design of this mold is shown in Figure 67.
Figure 67. Three-plate mold for bi-material injection moulding dedicated to the injection of feedstocks
based on 316L stainless steel (16 µm) and Cu powder according to formulation F3, a) fixed plate side; b)
three plate mould in closed state and c) mobile plate side
The resulted components from this bi-material injection stage is shown in Figure 68, the central cylinder
(Ø 3mm×5.6 mm) is injected with the 316L stainless steel (16µm) feedstock, while the ring (Ø
6mm×2.4 mm) around the central cylinder corresponds to the Cu powder (D50= 6.34 µm) feedstock.
Both feedstocks have been prepared according to the formulation F3 with 60% as the powder volume
loading. During the injection tests, the Cu feedstock is firstly injected, and then the 316L stainless steel
feedstock is injected afterwards. The interval between the two injections is about 0.2 second
corresponding to the exit of the internal core. The main injection parameters are same for both injection
Sprue of 316L
stainless steel
feedstock (16µm) Sprue of Cu
feedstock
Runner of Cu
feedstock
Micro die
cavity
a) b) c)

Chapter 3. Micro-MIM process for miniaturization and functionalization
60
units: injection temperature equal 220 °C, injection pressure equal 40 bar, except for the injection
volumes: 45 mm3 for the 316L stainless steel feedstock and 60 mm3 for the Cu feedstock.
Figure 68. Bi-material component injected with 316L stainless steel feedstock (16µm, powder volume
loading: 60%, formulation F3) and Cu feedstock (powder volume loading: 60%, formulation F3), a) the
dimensions of the component; b) the two feedstocks in the component
However, there are still some flashes in edge region, the cause of the phenomena is possible the loose
fits between the moveable and the fixed parts of the mold or high injection pressure.
However, this bi-material injected component has been manufactured without obvious defects like
cracks, short shot, sticking and so on, in concluding, the bi-material injection combining the feedstocks
prepared according to formulation F3 with different metal powders has been correctly carried out.
Summary
The feedstocks involved in this chapter have been prepared using formulation F3, but they are based on
different metallic powders: 316L stainless steel (5 µm and 16 µm) and copper (D50= 6.34 µm).
Considering the components from the mono-injection, micro injection, micro bi-injection with two types
of mold by injecting the feedstock retained from the 8 different feedstock formulations, this stage has
been properly investigated.
Compared with the other injection tests based on the 316L stainless steel carried out by the previous Ph.
D. theses, the higher volume loadings (62%, 64% and 66%) have been firstly reached by involving finer
powder (D50=3.4 µm) in the feedstocks, various different components have been obtained without
external defects, and a good homogeneity reparation between powder and binder has been observed.
Some injected micro-components have a small size compared to previous studies. Secondly, the micro-
injection and micro bi-material injection of these higher loaded feedstocks have been tested after the
design and manufacturing of the mold. Especially, the micro bi-material injection combining one 316L
stainless steel feedstock and one Cu feedstock has been tried in Battenfeld Microsystem© 50 in order to
begin some new activities using the miniaturization and functionalization components.
316L stainless steel
feedstock (16µm,
powder volume
loading: 60%,
formulation F3)
Cu feedstock
(D50=6.34 µm,
powder volume
loading: 60%,
formulation F3)
a) b)
Flash

Chapter 4. Debinding and sintering stages of MIM process for the components obtained by bi-material and micro-injection
61
Chapter 4. Debinding and sintering stages of MIM process for
the components obtained by bi-material and micro-injection
In this chapter, the debinding and sintering stages for the injected components from the previous
injection stage are demonstrated. In the debinding stage, the mono injected specimens used for the
identification (mentioned in section 3.2), the micro-injected specimens used for the simulations
(mentioned in 3.3) and the specimens injected with two different 316L stainless steel feedstocks from
bi-material injection with two-plate mold (mentioned in 3.4) have been debinded. However, the
sintering stage has been performed only for the specimens dedicated to the identification and simulation.
The resulting components from these two stages are related in this chapter. Moreover, the observations
of the sintered components are covered as well.
4.1. Thermal debinding stage
The debinding stage is a complex process (and it exists different debinding techniques), which
consumes a major part of the processing time [112], for instance, in this thesis the debinding time is 24
hours in contrast to 30 min for mixing and 1 min for injection. Debinding stage is considered as one of
the most critical steps in the processing technology among the four main stages of the MIM process.
Due to the factors involved with solvent debinding, (chemical handling, health concerns with the solvent
vapor and their recovery), solvent debinding has been excluded from our research.
Accordingly, the most popular debinding technique, thermal debinding, has been used in our studies
under argon atmosphere for the sake of simplicity, safety and environment respect.
4.1.1. Equipment used for thermal debinding stage
A laboratory-scale debinding oven (Figure 69) is used to carry out the thermal debinding for the
injected specimens from the previous stage. The principal technical specifications of this oven are
related below:
Test temperature (max.): 300 °C;
Volume (max.): 27 L;
Gas circulation: air, argon;
Gas flow (max.): 200 cm3/min.

Chapter 4. Debinding and sintering stages of MIM process for the components obtained by bi-material and micro-injection
62
Figure 69. Thermal debinding oven used in our analyses
4.1.2. Debinding cycles and atmosphere
In the literature, previous works related to the thermal debinding mechanisms and kinetics [113] [114]
[115] [116] [117] have already been performed, most of which focused on thermal debinding processing
under a protective atmosphere, but for some active and easy-oxidized powders such as stainless steel
and magnetic material powder, thermal debinding in vacuum is still very effective, and sometimes it is
the only possibility [118]. uring thermal debinding, the lower molecular weight constituents are usually
decomposed by evaporation or wicking. The capillary force moves the liquid binder from the center of
the part to the surface where evaporation occurs. When the lower molecular weight components is
removed, the decomposition of the higher molecular weight components will take place at a higher
temperature by breaking off into lower molecular weight components [ 119 ]. They are usually
decomposed by either chain depolymerization or random decomposition [ 120 ]. Therefore, the
temperatures should be carefully selected for thermal debinding with respect to the binder degradation
points [119]. Hence, the results of the thermogravimetry analysis (from 20 °C to 500 °C, heating rate of
2 °C/min, argon flow rate of 20 ml/min) for the 316L stainless steel feedstock (D50=3.4 µm, formulation
F3, different powder volume loading=60%) should be taken into account, as shown in Figure 70.
Figure 70. Thermogravimetry analysis for the 316L stainless steel feedstock (D50=3.4 µm, formulation
F3, different powder volume loading=60%)
Decomposition of
paraffin wax and
stearic acid
Decomposition
of polypropylene
Heating rate: 2 °C/min
Argon flow rate: 20 ml/min 165 °C
370 °C

Chapter 4. Debinding and sintering stages of MIM process for the components obtained by bi-material and micro-injection
63
The thermogravimetry profile indicates that the first mass decrease starts at about 165 °C and completes
at about 370 °C, which represents the decomposition of the paraffin wax and stearic acid (lower
molecular weight components) in the formulation F3. Then the second degradation takes place from
370 °C upto 440 °C assisted by the decomposition of polypropylene (the higher molecular weight
components).
According to the above analysis, a debinding cycle composed of two ramps has been employed and
plotted in Figure 71. As it is shown, the injected compacts have been firstly heated with a heating rate
equal 55 °C/hour from the 20 °C to 130 °C (lower than the beginning temperature of the decomposition
of paraffin wax and stearic acid) to vaporize the water vapor absorbed in the injected components. Then
the temperature is increased up to 220 °C with a very slow heating rate equal 4.5 °C/hour to eliminate
the paraffin wax and stearic acid, without removing the polypropylene which serves as the backbone of
the debinded porous components. Finally, the components are cooled during 120 min to reach ambient
temperature.
Figure 71. Debinding cycle involved in the thermal debinding stage
Gas flow rate is very important to ensure that the binder is swept away to prevent defects. When the gas
flow rate is not high enough, some of the carbon in the binder will become carbon black on the part
surface and some of potentially cause unexpected melting at high temperature sintering. Also, the
components become more impressible to indicate defects such as cracking and blistering if the gas flow
rate is too low. During the removal of the binders in our investigation, the argon gas flow (non-reactive
atmosphere to prevent oxidation of the metallic powder) in the oven is 40 cm3/min in order to prevent
the possible defects assisted by the improper gas flow [121].
Afterwards, the observations of the weight loss of binder have been carried out for the porous
components from this debinding cycle. Table 16 specifies the fractions of the removed binder to the
initial mass of binder before debinding stage for the specimens injected with 316L stainless steel
feedstocks with two different powder volume loadings.
20
60
100
140
180
220
0 2 4 6 8 10 12 14 16 18 20 22 24
Time [hour]
Te
mp
era
ture
[°C
]
130
55 °C/hour
4.5 °C/hour

Chapter 4. Debinding and sintering stages of MIM process for the components obtained by bi-material and micro-injection
64
Table 16. Fraction of the removed binder for the specimens injected with 316L stainless steel feedstock
(D50=3.4 µm, formulation F3, different powder volume loading)
Powder volume loading of the specimens Percentage of the removed binder
62% 71.02%
64% 75.06%
As suggested by the results, about 70% to 75% of the binders have been removed leading to open
porosity in the component. The morphology of the debinded structures (Figure 72) has been examined
using a scanning electron microscope (SEM). In both figures, the flocculent bulks between the spherical
powder particles are the remaining binders. It is clearly shown that the removed binder for the specimen
injected with feedstock loaded at 62% (Figure 72 a)) is less than in the specimen injected with
feedstock loaded at 64% (Figure 72 b)), which results from the higher binder content (38%) in the
specimen injected with feedstock loaded at 62% in comparison to specimen injected with feedstock
loaded at 64% (36%).
Figure 72. Debinded structure of the specimens injected with 316L stainless steel feedstock (D50=3.4
µm, formulation F3), a) feedstock loaded at 62%; b) feedstock loaded at 64%.
The debinded components according to this debinding cycle are free of defects as creating residual
stress, etc. As example, Figure 75 and Figure 79 show that the initial shape of the injected components
are well kept by the debinded porous components, no dimension change has been found out between the
injected and the debinded specimens.
4.2. Sintering stage by solid state diffusion
Since the final mechanical properties are strongly affected by the sintering stage, this stage is commonly
considered as one of the important step among the four MIM processing steps. The sintering stage
consists of bonding the particles together by solid state diffusion to form a homogenous part when
densification is achieved [122]. In the sintering stage, the pores inside the porous debinded components
are eliminated. The porous parts resulting from the debinding stage are heated up to a temperature
slightly lower than the melting temperature of the material used in the process, the powder particles
bond together by solid-state diffusion.
a) b) 5 µm 5 µm

Chapter 4. Debinding and sintering stages of MIM process for the components obtained by bi-material and micro-injection
65
4.2.1. Equipment used for sintering stage
Since the objective of the sintering tests is not mass production, a batch furnace (Figure 73) that offers a
maximal temperature equal 1850 °C has been used. In contrary, the batch furnace is more flexible than
continuous furnace. The principal technical specification of the furnace is given below:
Test temperature (max.): 1850 °C;
Volume (max.): 50 L;
Atmosphere:
o gas circulation: argon, helium or mixture of both;
o primary vacuum: 10-3 mbar, secondary vacuum: 10-5 mbar;
Temperature control: one command thermocouple and another one of S type (platinum - 10%
rhodium) set-up in center of the heaters;
Component holder: ceramic plates;
Heater elements: graphite.
Figure 73. Furnace (provided by VAS®) for sintering stage: a) exterior view; b) interior view of the
chamber
Actually, during the sintering stage, the pores may coarsen and grow due to the inner expansion of the
gas in the pores when sintering is processed at too high temperature [123]. But there is no gas trapped
when the sintering stage is carried out in vacuum atmosphere. Hence, primary vacuum is used in the
related experiments.
4.2.2. Sintering cycles for bi-material injected specimens
The specimens injected with two differently loaded feedstocks have been sintered with the hereby
described conditions. For these bi-material injected specimens, the temperature has been heated up to
1360 °C to activate fast sintering mechanisms, slightly lower than 1371~1398 °C corresponding to the
melting point of 316L stainless steel powders.
Heaters
a) b)
Control
modules
Furnace wall
Support

Chapter 4. Debinding and sintering stages of MIM process for the components obtained by bi-material and micro-injection
66
Since the sintering time directly depends on the heating rate in a way, sintering tests with different
heating rate have been carried out to analyze the influence of this factor. As above mentioned, a
maximal temperature equal 1360 °C has been selected. The related sintering ramps are indicated in
Table 17, and also illustrated in Figure 74 to give a better description.
Table 17. Sintering ramps for specimens from bi-material injection
Ramp 1 Ramp 2 Ramp 3
Heating rate [°C/min] 10 20 -10
Temperature [°C] 600 1360 20
Holding time [min] 30 120 End
Figure 74. Sintering cycle (1360 °C, 20 °C/min) for bi-material injected specimens
Firstly, the debinded components have been heated from ambient temperature up to 600 °C during
nearly 120 min, then the temperature is maintained during 30 min; after that, the components one heated
to 1360 °C with a heating rate equal 20 °C/min and a constant temperature during 120 min. Finally the
cooling stage with a temperature rate equal -10 °C.min-1 has been used for the components. As shown in
Figure 75, the components are correctly sintered with no obvious defects appearing and no cracks near
the interface between both different feedstocks, even along the interface zone (specified in Figure 75 as
well).
Figure 75. Beam-bending test specimens injected with two different feedstocks (60% for one half and
64% for the other half) after the injection, debinding and sintering stages
0
200
400
600
800
1000
1200
1400
Time [min]
Term
pera
ture
[°C
]
20 °C/min
30 min
120 min 1360
10 °C/min
20 °C/min
9.7 mm
60% 60% 60%
64% 64% 64%
Debinded
Sintered
Interface
zone
Injected
11 mm

Chapter 4. Debinding and sintering stages of MIM process for the components obtained by bi-material and micro-injection
67
The sizes and dimensions of the final components have been measured using a microscope and
compared with the geometry of the injected and debinded ones to analyze the shrinkage associated to
debinding and sintering stage. The results (Table 18) indicate that significant shrinkages take place in
the length direction for the components injected with the feedstocks loaded at 60% and 62% (12.07%);
the other ones loaded at 60% and 64% exhibit over 10.94% shrinkage.
Table 18. Shrinkage in length direction of the beam-bending test specimens injected with 316L stainless
steel feedstock (D50=3.4 µm, formulation F3, different powder volume loading)
Powder volume loading of the feedstock Shrinkage in length direction
60%~62% 12.07%
60%~64% 10.94%
Afterwards, scanning electron micrographs have been carried out for the beam-bending test specimens
(60%~64%) without polishing. Both sides of the same specimen have been observed and are related in
Figure 76 and Figure 77. The grain sizes have increased dramatically. Porosity has almost fully
disappeared in the specimen half injected with powder volume loading of 60%, and the decrease in
porosity in the half with powder volume loading of 64% has been clearly revealed as well, due to the
elimination of pores via grain boundary and volume diffusion at high temperatures [124].
Figure 76. Scanning electron micrographs of the beam-bending test specimens (the half injected with
powder volume loading of 60%) before polishing, almost no porosity is seen, the grain growth are
observed
Figure 77. Scanning electron micrographs of the beam-bending test specimens (the half injected with
powder volume loading of 64%) before polishing, the decrease in porosity and the grain growth are
observed
Pore
Grain boundary
50 µm 10 µm
50 µm 10 µm
Pore Grain
boundary

Chapter 4. Debinding and sintering stages of MIM process for the components obtained by bi-material and micro-injection
68
4.2.3. Sintering cycles for micro-injected specimens
Due to the decrease in size (especially the thickness) for the micro-injected components from the micro-
injection with fine powder, the sintering temperature is no more obligate to be so high (as 1360 °C
which has been used in our previous sintering for the bi-material injected specimens). So a temperature
about 1250 °C [125] has been proposed in literature. Thus, instead of 1360 °C as the maximum peak
during the sintering stage, for the micro mono-injected specimens, 1200 °C has been tested as adequate
sintering temperature. The same primary vacuum has been used for this test.
Some investigations have been previously done in the literature, and they showed that the main
parameters in sintering cycle are: heating rate, sintering time, sintering temperature and sintering
atmosphere [126]. To study the influence of the heating rate, three different sintering cycles have been
used in the analysis and three ramps have been included for each sintering cycle. Table 19 and Figure
78 give details about this sintering cycle. Ramp 1 corresponds the pre-sintering period, and the third
ramp is to cool down the sintered compacts. The main sintering period is ramp 2 with the heating rate of
5 °C/min, 10 °C/min and 15 °C/min up to 1200 °C, the holding time at this temperature is still 120 min
as before. In addition, still the same primary vacuum has been used during this sintering test.
Table 19. Sintering cycles for specimens from micro-mono-injection
Sintering cycles Ramp 1 Ramp 2 Ramp 3
1
Heating rate [°C/min] 2.5 5 -10
Temperature [°C] 600 1200 20
Holding time [min] 30 120 End
2
Heating rate [°C/min] 5 10 -10
Temperature [°C] 600 1200 20
Holding time [min] 30 120 End
3
Heating rate [°C/min] 7.5 15 -10
Temperature [°C] 600 1200 20
Holding time [min] 30 120 End
Figure 78. Sintering cycles (1200 °C) with three heating rates of 5 °C/min, 10 °C/min and 15 °C/min
for mono-injected specimens
0
200
400
600
800
1000
1200
1400
0 100 200 300 400 500 600 700
Time [min]
Tem
pera
ture
[°C
]
5 °C/min 10 °C/min 15 °C/min

Chapter 4. Debinding and sintering stages of MIM process for the components obtained by bi-material and micro-injection
69
4.2.4. Physical properties of the resulted micro-parts at the end of the processing stage
As the results suggest, four types of the micro specimen injected with 316L stainless steel feedstock
(D50=3.4 µm, formulation F3, powder volume loading of 60%, 62% and 64%) have been sintered.
Taking the specimens loaded at 62% as an example, the resulting sintered specimens are shown in
Figure 79 without obvious defect.
Figure 79. Four types of micro specimens injected with 316L stainless steel feedstock (D50=3.4 µm,
formulation F3, powder volume loading is 62%) after the injection, debinding and sintering stages
4.2.4.1. Shrinkages of the resulting micro-specimens in different directions
The analyses of the dimensions have been carried out to the sintered specimens injected with feedstock
loaded at 62% and 64% respectively. The mean shrinkages in the main directions are related in Table
20 and Table 21.
As shown by the results related to the feedstock loaded at 62%, the sintering cycle with the heating rate
corresponding to 10 °C/min generates the maximum shrinkages in L (9.6%) and W (10.4%) directions;
in the thickness direction, the heating rate that indicates the maximum shrinkage (20.8%) is obtained at
15 °C/min, which is much higher than the shrinkages in the other directions. In regard to the feedstock
loaded at 64%, the sintering cycle with the heating rate of 15 °C/min gives always the maximum
shrinkages which are 10.3%, 11.9% and 20.9% in L, W and thickness directions, respectively.
One can remark that a very high shrinkage in thickness direction has also been revealed as for the
feedstock loaded at 62%. ompared with the shrinkage in L direction for both feedstocks, higher valued
have been achieved in W direction for three heating rates. The same phenomenon has been encountered
by other authors, N.H. Loh et al. [127]. The main parameters affecting final part size have been already
Debinded Debinded
Sintered Injected Sintered Injected

Chapter 4. Debinding and sintering stages of MIM process for the components obtained by bi-material and micro-injection
70
studied and these include the metal powder morphology, binder ingredients and proportions, mixing
conditions, mold design, molding parameters, rheological behavior of the molding materials, debinding,
sintering, equipment and even environmental conditions. Among these often integrally-related factors,
the most sensitive are the powder volume loading and the mold design [127]. As it is shown, different
shrinkages have been revealed for the same directions for the different specimen types, since all the
conditions during the process are the same, these differences in our experiments can only be explained
by the different mold design corresponding to the specimen types.
Table 20. Shrinkage in different directions corresponding micro specimen injected with 316L stainless
steel feedstock (D50=3.4 µm, formulation F3, powder volume loading is 62%)
Direction
Heating
rate
[°C/min]
Type a)
Type b)
Type c)
Type d)
Mean
value
L
5 9.6% 9.4% 9.4% 9.2% 9.4%
10 9.9% 10.1% 8.4% 9.9% 9.6%
15 8.5% 9.3% 9.0% 9.4% 9.1%
W
5 10.0% 11.0% 10.2% 10.0% 10.3%
10 12.0% 11.0% 9.6% 9.1% 10.4%
15 8.0% 9.3% 10.7% 9.0% 9.3%
Thickness
5 18.0% 16.0% 24.0% 16.0% 18.5%
10 16.0% 22.0% 22.0% 16.0% 19.0%
15 19.6% 19.5% 24.0% 20.0% 20.8%
Table 21. Shrinkage in different directions corresponding micro specimen injected with 316L stainless
steel feedstock (D50=3.4 µm, formulation F3, powder volume loading is 64%)
Direction
Heating
rate
[°C/min]
Type a)
Type b)
Type c)
Type d)
Mean
value
L
5 10.1% 10.4% 10.2% 9.8% 10.1%
10 9.6% 9.5% 9.3% 9.3% 9.4%
15 10.9% 10.2% 9.6% 10.4% 10.3%
W
5 9.8% 10.9% 11.3% 9.0% 10.3%
10 10.0% 10.0% 12.0% 10.0% 10.5%
15 9.5% 13.0% 13.0% 12.0% 11.9%
Thickness
5 16.0% 20.0% 24.0% 22.0% 20.5%
10 16.0% 18.0% 20.0% 20.0% 18.5%
15 22.2% 16.0% 26.0% 19.4% 20.9%
As we know, a low powder volume loading results in considerable dimensional change during the
sintering stage in comparison with a high powder volume loading [2]. However, in some cases one can
observe that the related results are in the opposite way. Thus, more tests should be carried out to
examine this problem.
L
W
L
W W
L L
W
L
W
L
W W
L L
W

Chapter 4. Debinding and sintering stages of MIM process for the components obtained by bi-material and micro-injection
71
4.2.4.2. Densities of the resulting micro-specimens
In addition, the density of the sintered micro-specimens have been measured by the water displacement
method (Archimedes method) for feedstocks loaded at 62% and 64%, as it is reported in Table 22.
Table 22. Density of the sintered micro-parts resulting from 316L stainless steel feedstock (D50=3.4 µm,
formulation F3)
Powder volume loading Heating rate [°C/min] Density [g/cm3] Relative density
62%
5 7.37 92.8%
10 7.51 95.1%
15 7.21 91.3%
64%
5 7.26 91.9%
10 7.31 92.5%
15 7.48 94.7%
4.2.4.3. Vickers hardness of the micro-specimens
Besides measurements of shrinkages and densities of the sintered micro-specimens, Vickers hardness
tests have been also used to evaluate the resulting mechanical properties. Since the four types of micro-
specimens have been employed for the measurements before post-treatment (e.g. quenching, etc), a
relative low average value of HV/160 has been observed.
Summary
The micro-components in this chapter are the beam-bending test specimens injected with two 316L
stainless steel feedstock (60% as the powder volume loading for one half and 64% for the other half)
and the four types of the micro specimen injected 316L stainless steel feedstock (D50=3.4 µm,
formulation F3, powder volume loading is 60%).
For the thermal debinding stage, a classical cycle with two ramps has been used for these beam-bending
test specimens in an argon atmosphere. About 70% to 75% of the binders are removed out without
generating external defects for the debinded porous components. The debinded structures (e.g. for the
injected with 316L stainless steel feedstock loaded at 62% and 64%) have been observed as well.
The debinded porous specimens are then sintered and the final specimens have been finally produced. A
sintering cycle with a heating rate of 20 °C/min till 1360 °C has been processed on the beam-bending
test specimens obtained from bi-material injection The shrinkages in length direction for the bi-material
injected specimen are 12.07% (specimens injected with feedstocks loaded at 60% and 62%) and 10.94%
(specimens injected with feedstocks loaded at 60% and 64%). For the micro mono-injected specimens,

Chapter 4. Debinding and sintering stages of MIM process for the components obtained by bi-material and micro-injection
72
The shrinkages in length, width and thickness directions of the micro mono-injected specimens have
been measured, one can notice smaller shrinkages in length directions (with an average value of about
11.5%) than in width directions (with an average value of about 13.2%) attributed to the mold design
influence.

Chapter 5. Identification of constitutive material parameters and numerical simulation of the sintering stage in micro-MIM
73
Chapter 5. Identification of constitutive material parameters
and numerical simulation of the sintering stage in micro-MIM
In comparison with the conventional trial and error method, computer simulation of sintering by finite
element method in combination with appropriate material laws is a faster alternative to optimize entire
industrial processes [128].
The objective of this chapter is the shrinkage and density calculation of the components form micro-
injection obtained from the previous stages. In the first stage, the identification of constitutive behavior
law and physical parameters concerning the very fine stainless steel powders and high volume loading
contents involved in the sintering model should be performed in order to set up the implementation of
the FE simulations. The identifications are carried out with Matlab®, and the identified parameters are
presented. Then the solid state diffusion model for the sintering has been implemented in a commercial
FE solver (ABAQUS©) as a user supplied material routine (UMAT) to perform the simulation of the
sintering stage for micro-MIM process. Finally, the simulation results are related for the four specimen
types and compared with the experimental results to validate the simulations of the micro-injected
components.
5.1. Constitutive sintering model
Sintering theory has been developed continuously from the late 1940s [128]. The most successful
approaches to understand the mechanisms of neck growth and shrinkage is the two-sphere model due to
Frenkel and Kuczynski [129] for the early sintering stages whereby the particles bond together by the
neck which forms where the powder particles were initially touching, as shown in Figure 80. As
temperature increases during the sintering process, the neck speeds up to grow [130].
Figure 80. Neck formation in the sintering of spherical particles of the same size with a neck

Chapter 5. Identification of constitutive material parameters and numerical simulation of the sintering stage in micro-MIM
74
The cylindrical pore channel model is due to Coble [131] and the extrapolated two-particle model due to
Kingery and Berg [132] for the intermediate shrinkage state, and the spherical pore model due to
MacKenzie and Shuttleworth [133] for the late sintering stages have been proved correctly as well. In
the seventies, more sophisticated models (based on less simplified pore geometries and taking
superposition of the various sintering mechanisms into account) have been developed, for example, by
Johnson [134], Skorokhod [135], Ashby [136], Beere [137], Scherer [138], among many others (for
reviews see, for example, Exner et al. [139] [140] [141] [142], Schatt [143], German [47] or Olevsky
[144]). A similar development took place in solid-liquid phase sintering theory, where the early model
due to Kingery [145], has been the starting point for most of later and still ongoing theoretical work in
spite of its geometric over simplifications and its lack of qualitative agreement with experimental
observations. Extensive reviews on sintering models for liquid phase sintering are available (see, e.g.
German [146], Schatt [143], Savitskii [147] or Exner and Arzt [141]). Later theoretical work on solid
and liquid state sintering considering additional effects like non-isothermal sintering, gravity, particle
orientation, anisotropic shrinkage [148], or superposition of external loads have been carried out. In
addition, sintering theory was also applied to new sintering processes like microwave sintering [149].
Moreover, a microscopic model for viscous sintering has been adopted by A. Mawardi et al. to describe
the micro/nano-structural evolution by considering the effects of nano-particle mechanics on the
sintering kinetics [150]. The overall dimensional change of the sintered micro-part is determined based
on the local sintering stress in the green body, which is evaluated using the variation of the
micro/nanostructure during sintering, as shown in Figure 81, where the sintering stress sζ is formulated
based on the mechanism of diffusion at the interparticle boundary for two spherical particles in contact.
Figure 81. Diagrammatic sketch of interparticle boundary for the determination of sintering stress in the
microscopic scale
One can find a schematic illustration of an interparticle boundary across which a velocity discontinuity
occurs, where the stresses, nζ and tζ are defined such that positive velocity differential results in
positive work. The details of the formulation of mass transport on the interparticle boundary are
reported in reference [151]. The deformation of the particle can be derived based on the quasistatic
principle of virtual power, in the following form:

Chapter 5. Identification of constitutive material parameters and numerical simulation of the sintering stage in micro-MIM
75
0dLjmζdAvnζ
pL
*
iinA
*
iis (12)
where v is the velocity, A is the surface area of particle, j* is the diffusion flux, and nζ is the stress on
Lp (contact perimeter), while m and n are the unit normal vectors, for the ith plane of contact.
Recently, it has been increasingly possible to perform simulation of the micro-structural behavior of
large systems, and this development opens the way for embedding micro-structural evolution into
macroscopic models [ 152 ], which in turn allowed plasticity models to move beyond continuum
phenomenological theories that rely on field quantities to approximate collective micro-structural
phenomena [153] [154] [155] [156]. Some numerical researches have been realized on the micro-
behavior during the sintering process of the alumina [157] [158].
The model chosen in our study is a phenomenological one based on the continuum mechanics, by
considering a thermo-elasto-viscoplastic model (as shown in Figure 82) with isotropically distributed
voids [159], in order to estimate shrinkage, relative density and variation of the shapes of micro-
components, during and after the sintering stage without being obliged to carry out the physical
experiments [72] [82] [160].
Figure 82. Sketch of the employed sintering model in our investigations
Under high sintering temperature conditions, the macroscopic behavior of the material can be regarded
as a creep deformation one [161] [162] [163]. The total strain ε of this model is described as expressed
in equation (13), consisting to split the strain rate in three parts [159].
vpthe εεεε ++= (13)
where eε ,
thε and vpε are the elastic, thermal and viscoplastic strain rates.
The part of elastic strain rate is assumed to be linear and isotropic. It can be expressed in the following
expression:
ζCε ee = (14)
where Ce is the elastic compliance matrix. Equation (14) can also be expressed in the rate form of
Hooke’s law, as following:
)( vptheee DD (15)
where De is elastic stiffness matrix.
The thermal strain is mainly due to thermal expansion that can be expressed as:
ΙTΔαε th = (16)

Chapter 5. Identification of constitutive material parameters and numerical simulation of the sintering stage in micro-MIM
76
where α is the thermal expansion coefficient, TΔ is the incremental temperature rate, I is second order
identity tensor. α can be determined by the experiments carried out in dilatometer.
After overcoming a specified transition temperature in sintering, viscoplastic strains prevail on elastic
strains and densification occurs. The viscoplastic strain rate is given by equation (17) [160]:
IK3
ζζ
G2
)ζ( devε
svp-
+=m (17)
where vpε is the viscoplastic strain rate, dev(σ) is the deviatoric stress tensor, σm=tr(σ)/3 is the trace of
the stress tensor, I is the second order identity tensor, G is the shear viscosity modulus, K is the bulk
viscosity modulus, sζ is the sintering stress. G , K and sζ stand for the material parameters to be
determined. This strain rate is function of temperature, density and relative density of pores [164] [165].
The material is considered a porous media in which the total relative density ρ (summation of the
relative densities of powder, binder and pores, defined as the volume fraction of the constituent divided
by the entire volume) is constant (equal to 1) during the entire process while the relative densities of
each component continuously change [8].
The elastic-viscous analogy is suggested to define the shear and bulk viscosity modules for sintering
materials, as related in equation [166]:
)ν2(1
ηG
p
p
,
)2ν-3(1
ηK
p
p (18)
where pη and pν are uniaxial viscosity and viscous Poisson’s ratio of the porous material.
As shown in Figure 83, Song et al. have defined the following relationship to define the uniaxial
viscosity ePη through bending tests [72] [160] [167]:
)4²32
5(
13
34
bh
PL
h
gL ssae
P
(19)
where δ is the deflection rate at the center of the specimen, aρ is the apparent density, g is gravity, P
is the external load, Ls, b and h are respectively the distance between the two supporting rods and the
width and thickness of the specimen.
Figure 83. Simply supported beam model for beam-bending tests
The viscous Poisson’s ratio is determined from an average relationship in the following form [166]:
P

Chapter 5. Identification of constitutive material parameters and numerical simulation of the sintering stage in micro-MIM
77
2ρ3
ρ
2
1ν p
(20)
where ρ is the relative density. The relative density of the sintered part is calculated by the following
expression:
3
0
)λ1(
ρρ
+= (21)
where 0ρ is the relative density after pre-sintering and λ is the uniaxial shrinkage defined as:
0
0
L
LLλ
(22)
where L and 0L are the length of the specimens before and after sintering stage.
The following equation is proposed to determine the sintering stress [168]:
C
s B (23)
where B and C are the material parameters that should be identified from dilatometer experiments.
The above evaluation is summarized in Figure 84, the material parameters can be determined by
identifying the shear viscosity module G, the bulk viscosity module K and the sintering stress σs.
Extensive numerical simulations have been done for the small size components injected with a 316L
stainless steel feedstock provided by AMW in our laboratory by Song et al. [160]. Besides, the
components injected with some in-house feedstocks based on the powder with larger particle size
(powder volume loading equal 60%) have been also simulated.
Figure 84. Evaluation of the viscoplastic strain rate in the sintering model
5.2. Sintering parameters identification
The beam-bending test process has been proposed to identify the sintering parameters for the sintered
parts during the sintering stage at high temperature [169]. In our laboratory, Song et al. have carried out

Chapter 5. Identification of constitutive material parameters and numerical simulation of the sintering stage in micro-MIM
78
the beam-bending tests specimens for the components (80mm in length) in a furnace [167]. Quinard et
al. have performed identifications through the horizontal dilatometer equipped with a beam-bending test
support for the components with the length of 25mm [170].
The vertical dilatometer has been intensively used for the identification in the present study. The 316L
stainless steel feedstocks (D50=3.4 µm, formulation F3) with high powder volume loadings (62%, 64%
and 66%) have been identified here. As the deflection direction is vertical, so the influence of the
gravity has been considered in these identification tests in the vertical dilatometer with primary vacuum
for the micro-MIM process with the very fine powder.
5.2.1. Identification tests in vertical dilatometer
To succeed in the sintering stage, high sintering temperature and fast heating rate have been applied.
However, fast heating can induce various defects in the sintered components [122], such as crack and
distortion due to the stress and temperature gradients. It results in some difficulties to determine the
sintering parameters and to choose the appropriate design of the injection mold. Thus, in the
identification tests in the vertical dilatometer, three heating rates (as shown in Table 23) with the equal
5 °C/min, 10 °C/min and 15 °C/min have been used to correspond the heating rates employed in the
sintering stage for the micro-injected specimens (see section 4.2.3). Figure 85 illustrates the three cycles
used in the analyses.
Table 23. Different sintering cycles for the identification tests in vertical dilatometer
Sintering cycles Ramp 1 Ramp 2
1
Heating rate [°C/min] 5 -10
Temperature [°C] 1360 20
Holding time [min] 120 End
2
Heating rate [°C/min] 10 -10
Temperature [°C] 1360 20
Holding time [min] 120 End
3
Heating rate [°C/min] 15 -10
Temperature [°C] 1360 20
Holding time [min] 120 End
Considering the main densification of 316L stainless steel powder occurs from above 900 °C, the pre-
sintering stage has been omitted to simplify the sintering cycles. The temperature in the vertical
dilatometer has been raised up to 1360 °C due to the fact that sintering stage with higher temperature
will be also simulated in the future. Since the 316L stainless steel powder in our study is an easy-
oxidized powder, so during the identification tests in vertical dilatometer, an argon atmosphere has been
used to protect them. The same pre-sintering stage as in the identification tests in horizontal dilatometer
has been also carried out for the specimens in the vertical dilatometer. Consequently, the mechanical
properties of the pre-sintered specimens are improved.

Chapter 5. Identification of constitutive material parameters and numerical simulation of the sintering stage in micro-MIM
79
0
200
400
600
800
1000
1200
1400
Time [min]
Te
mp
era
ture
[°C
]
5 °C/min 10 °C/min 15 °C/min
Figure 85. Heating cycles for beam-bending and free sintering test in vertical dilatometer
5.2.1.1. Beam-bending tests in vertical dilatometer
The set-up used for the beam-bending tests in the vertical dilatometer is demonstrated in Figure 86. The
associated probe is made up of a base with two knives and a rod with a knife-shaped cross section. A
load equal 5 cN has been applied at the centre of the specimen through the rod. The specimens have a
rectangular shape (14 mm in length, 5.5 mm in width and 1 mm in thickness).
Figure 86. Beam-bending test in vertical SETSYS® evolution dilatometer, a) Set-up for TMA
measurement and the involved probe; b) geometry of the sample and the sample support
Since gravity has been taken into account, the uniaxial viscosities ePη have been evaluated according to
equation (17) and related in Figure 87 with the rectangular specimens before and after tests. Due to the
difficulty of the injection with the feedstock loaded at 66%, as small number of specimens has been
manufactured. As the consequence, the beam-bending and free sintering tests with heating rate of
15 °C/min have not been carried out for this feedstock.
14mm
12mm
Ø 5mm
a) b)
Probe
Sample
holder
388 522 343.3

Chapter 5. Identification of constitutive material parameters and numerical simulation of the sintering stage in micro-MIM
80
Figure 87. Uniaxial viscosities e
Pη vs. temperature from beam-bending tests in vertical dilatometer for
316 L stainless steel feedstock (D50=3.4 µm, formulation F3) with the powder volume loadings equal a)
62%; b) 64%; c) 66%
6
6.5
7
7.5
8
8.5
9
9.5
10
1000 1100 1200 1300 1400
Temperature [°C]
Lg
(un
iax
ial
vis
co
sit
y [
Pa
.s])
5°C/min 10°C/min 15°C/min
6
6.5
7
7.5
8
8.5
9
9.5
10
1000 1100 1200 1300 1400
Temperature [°C]
Lg
(un
iax
ial
vis
co
sit
y [
Pa
.s])
5°C/min 10°C/min 15°C/min
6
6.5
7
7.5
8
8.5
9
9.5
10
1000 1100 1200 1300 1400
Temperature [°C]
Lg
(un
iaxia
l vis
co
sit
y [
Pa.s
])
5 °C/min 10°C/min
a)
b)
c)

Chapter 5. Identification of constitutive material parameters and numerical simulation of the sintering stage in micro-MIM
81
Based on the results obtained from these tests, the following synthesis can be related:
1) The uniaxial viscosities are in the range 0.1-0.3 GPa.s for 316L stainless steel powders. However
Blaine [169] got values of uniaxial viscosity in the range 0.2-0.6 GPa.s for 316L stainless steel powders
compacted with boron. Lame [171] reported values of uniaxial viscosity in the range 60-80 GPa.s for
iron powder compacts. Vagnon [172] related the uniaxial viscosity of 316L stainless steel powders
compacts in the range 4-50 GPa.s. The differences between the results reported by Blaine [169] and
Lame [171] can be explained through numbers of parameters as homogeneity of the feedstock, the
content of the binder, the particle size of the powder, etc.
2) The powder materials under consideration begin to flow when the temperature is greater than
1000 °C, which confirms well the results obtained by different authors.
3) The feedstock loaded from 62% to 66%, exhibits greater uniaxial viscosities equals about 8 G.Pa.s at
the lower heating rate of 5 °C/min. One has to remark that for the feedstock loaded at 62%, the uniaxial
viscosity exhibits an abrupt increase at about 1225 °C for heating rate equal 15 °C/min.
4) One can remark that with the same heating rate, the higher the feedstocks are loaded, the higher
uniaxial viscosities are obtained at the same temperature. This is related to the fact that the more the
powder loading is, the higher the related viscosity becomes.
5.2.1.2. Free sintering tests in vertical dilatometer
Figure 88 indicates the set-up for free-sintering test in vertical dilatometer. The length of the cylindrical
specimens is 10 mm and the diameter is 5 mm. The rod has a flat end and the base is also flat.
Figure 88. Set-up for free-sintering test in vertical SETSYS® evolution dilatometer
The shrinkage curves vs. different sintering temperatures for the different loaded feedstocks have been
observed and plotted in Figure 89, and the involved cylindrical specimens in these free-sintering tests
have been given as well.
Ø 5 mm
Ø 5 mm
Probe
Sample Sample
support
Sample
holder

Chapter 5. Identification of constitutive material parameters and numerical simulation of the sintering stage in micro-MIM
82
Figure 89. Uniaxial shrinkage vs. temperature from free sintering test in vertical dilatometer for 316
L stainless steel feedstock (D50=3.4 µm, formulation F3) with the powder volume loading of a) 62%; b)
64%; c) 66%
-12.00%
-10.00%
-8.00%
-6.00%
-4.00%
-2.00%
0.00%
2.00%
1000 1100 1200 1300 1400
Temperature [°C]
Un
iaxia
l s
hri
nkag
e
5°C/min 10 °C/min
a)
b)
c)
-12.00%
-10.00%
-8.00%
-6.00%
-4.00%
-2.00%
0.00%
2.00%
1000 1100 1200 1300 1400
Temperature [°C]
Un
iax
ial
sh
rin
kag
e
5 °C/min 10 °C/min 15 °C/min
-12.00%
-10.00%
-8.00%
-6.00%
-4.00%
-2.00%
0.00%
2.00%
1000 1100 1200 1300 1400
Temperature [°C]
Un
iax
ial
sh
rin
kag
e
5 °C/min 10 °C/min 15 °C/min

Chapter 5. Identification of constitutive material parameters and numerical simulation of the sintering stage in micro-MIM
83
According to these curves, the following conclusions can be set up:
1) Shrinkage begins to occur at about 1000 °C and rapidly increase at a temperature above 1050 °C till
around 1200 °C, then after and up to a temperature approaching to 1360 °C and the shrinkage largely
decreases.
2) At the same temperature, large shrinkages are obtained for the specimens with lower powder loading.
The reason is related to the fact that when powder loading is high, more pores are produced, so the
components after sintering shrink more obviously.
3) A higher density was obtained using low heating rate since a greater shrinkage was obtained. The
density investigation after the sintering stage has been performed on the sintered specimens.
As example, considering the feedstock loaded at 64%, as reported in Table 24, the rise of density in
accordance with the drop of the heating rate has been clearly presented. In comparison with the lower
heating rate, less time has been left to the components to shrink during the sintering stage with rapid
heating.
Table 24. Density and shrinkage of 316 L stainless steel feedstock (D50=3.4 µm, formulation F3,
powder volume loading is 64%) after sintering stage with three different heating rates
Heating rate, °C/min Density, g.cm-3 Shrinkage
5 7.618 12.51 %
10 7.593 12.26 %
15 7.567 12.20 %
Besides, the shrinkage rates during these free sintering tests in the vertical dilatometer have been
measured as well, always the same temperature about 1180 °C (see Figure 90) has been revealed as the
highest shrinkage rates occur for all the three powder volume loadings. And it is can be seen that the
shrinkage rates increase as the heating rates rise up.
-10
-9
-8
-7
-6
-5
-4
-3
-2
-1
0
1000 1100 1200 1300 1400Temperature [°C]
Sh
rin
ka
ge
ra
te [
%/m
in]
5 °C/min
10 °C/min
15 °C/min
Figure 90. Shrinkage rate during the free sintering test in vertical dilatometer for 316 L stainless steel
feedstock (D50=3.4 µm, formulation F3) with the powder volume loading of 62%

Chapter 5. Identification of constitutive material parameters and numerical simulation of the sintering stage in micro-MIM
84
5.2.2. Numerical identification of the sintering model
As discussed in section 5.1, the shear viscosity module G, bulk viscosity module K and sintering stress
σs should be determined to identify the employed sintering model based on the results from the
identification tests mentioned previously. Matlab® and the related tools are used for this.
5.2.2.1. Numerical identification of B and C parameter
Sintering stress is the driving force for densification. It depends on the surface tension, relative density,
size and shape of the particles, as well as the grain and pore size that varies with the microstructure
evolution during the sintering process. As discussed above (in section 5.1), parameter B and C in
sintering model (equation (23)) are the material parameters that should be identified from dilatometric
experiments.
5.2.2.1.1. Algorithm in Matlab® for identification of parameter B and C
Different expressions are proposed to calculate the sintering stress for the open and closed pores [173]
[174]. The following equation (24) has been proposed to calculate the sintering stress for 316L stainless
steel powder during the sintering stage [160].
s
p
ζ3K
1Tα
L
L
(24)
By coupling the equation (23), equation (24) can be expressed as:
)L
LT3(α
K
BρC (25)
where L is the dimensional change of the specimen, α is the coefficient of thermal dilatation, T is the
variation rate of temperature. The strategy to identify the parameters B and C in Matlab® is to approach
the numerical shrinkage curve according to equation (26) to the one obtained from the free sintering
tests. The algorithm is indicated in the following expression [160]:
],[
)()()(
)(min
2
1
,,
CBx
xTxTxF
xF
n
i
i
e
i
m (26)
where eλ is experimental uniaxial shrinkage, obtained from dilatometer test,
mλ is numerical uniaxial
shrinkage, F(x) is the mean residual squares of the tolerance where i=1,…, n indicates different values
of the sintering temperature, x is the set of material parameters to be identified. The Nelder-Mead

Chapter 5. Identification of constitutive material parameters and numerical simulation of the sintering stage in micro-MIM
85
Simplex method [175] has been employed to minimize the value of F(x) in our case. Note that the
calculations have been divided into two segments specified by critical relative density (0.8) during the
sintering stage due to the different shrinkage rates for each one.
5.2.2.1.2. B and C identified for 316L stainless steel feedstock with the powder volume loading of
62%, 64% and 66%
In accordance, by coupling the shrinkages obtained from the identification tests in vertical dilatometer,
the identification of B and C parameters during the sintering stage with three different heating rates of
5 °C/min, 10 °C/min and 15°C/min have been implemented for the 316L stainless steel feedstock loaded
at 62%, 64% and 66% and the identified values are indicated in Table 25, Table 26 and Table 27,
respectively.
Table 25. Identified B and C during sintering stage with different heating rates for 316 L stainless
steel feedstock (D50=3.4 µm, formulation F3, powder volume loading is 62%)
ρ <0.8 ρ ≥0.8
Heating rate B1 C1 B2 C2
5 °C/min 6501.7 5.2478 2482.9 -5.4275
10 °C/min 1114.0 0.0504 1528.9 -6.3254
15 °C/min 6756.4 4.6458 1696.2 -8.7859
Table 26. Identified B and C during sintering stage with different heating rates for 316 L stainless
steel feedstock (D50=3.4 µm, formulation F3, powder volume loading is 64%)
ρ <0.8 ρ ≥0.8
Heating rate B1 C1 B2 C2
5 °C/min 7147.2 5.2287 852.3 -10.407
10 °C/min 3982.8 3.3489 3094.3 1.2225
15 °C/min 6169.3 4.6355 207.5 -23.273
Table 27. Identified B and C during sintering stage with different heating rates for 316 L stainless
steel feedstock (D50=3.4 µm, formulation F3, powder volume loading is 66%)
ρ <0.8 ρ ≥0.8
Heating rate B1 C1 B2 C2
5 °C/min 3090 3.728 2435.9 -6.1662
10 °C/min 5696.6 4.9671 1814.1 -1.7039
The numerical shrinkage curves after identification are related in Figure 91, Figure 92 and Figure 93.
As it is shown for the three different heating rates, all the numerical curves fit well the experimental
ones; these results have confirmed very well the choice of our sintering stress model and the
identification method.

Chapter 5. Identification of constitutive material parameters and numerical simulation of the sintering stage in micro-MIM
86
Figure 91. Comparison between experimental shrinkages in vertical dilatometer during the sintering
stages with different heating rates and identified ones for 316 L stainless steel feedstock (D50=3.4 µm,
formulation F3, powder volume loading is 62%)
60 80 100 120 140 160 180 200 220-14
-12
-10
-8
-6
-4
-2
0
2
Time [min]
Sh
rin
ka
ge
[%
]
Experimental value
Numerical value
150 200 250 300 350 400-14
-12
-10
-8
-6
-4
-2
0
2
4
Time [min]
Sh
rin
ka
ge
[%
]
Experimental value
Numerical value
50 100 150 200 250 300-14
-12
-10
-8
-6
-4
-2
0
2
Time [min]
Sh
rin
kag
e [
%]
Experimental value
Numerical value
62%, 5 °C/min
62%, 10 °C/min
62%, 15 °C/min
a)
b)
c)

Chapter 5. Identification of constitutive material parameters and numerical simulation of the sintering stage in micro-MIM
87
Figure 92. Comparison between experimental shrinkages in vertical dilatometer during the sintering
stages with different heating rates and identified ones for 316 L stainless steel feedstock (D50=3.4 µm,
formulation F3, powder volume loading is 64%)
Figure 93. Comparison between experimental shrinkages in vertical dilatometer during the sintering
stages with different heating rates and identified ones for 316 L stainless steel feedstock (D50=3.4 µm,
formulation F3, powder volume loading is 66%)
50 100 150 200 250 300-12
-10
-8
-6
-4
-2
0
2
Time [min]
Sh
rin
kag
e [
%]
Experimental value
Numerical value
150 200 250 300 350 400-12
-10
-8
-6
-4
-2
0
2
Time [min]
Sh
rin
kag
e [
%]
Experimental value
Numerical value
66%, 5 °C/min 66%, 10 °C/min
a) b)
60 80 100 120 140 160 180 200 220-12
-10
-8
-6
-4
-2
0
2
Time [min]
Sh
rin
ka
ge
[%
]
Experimental value
Numerical value
50 100 150 200 250 300-12
-10
-8
-6
-4
-2
0
2
Time [min]
Sh
rin
ka
ge
[%
]
Experimental value
Numerical value
150 200 250 300 350 400-12
-10
-8
-6
-4
-2
0
2
Time [min]
Sh
rin
ka
ge
[%
]
Experimental value
Numerical value
64%, 5 °C/min 64%, 10 °C/min
64%, 15 °C/min
a) b)
c)

Chapter 5. Identification of constitutive material parameters and numerical simulation of the sintering stage in micro-MIM
88
In addition, the relative densities associated to these three heating cycles for 316 L stainless steel
feedstock (D50=3.4 µm, formulation F3) with different powder volume loadings of 62%, 64% and 66%
have been calculated with the identified shrinkage, as shown in Figure 94. Compared with the ones
obtained in the horizontal dilatometer, higher values (about 0.95) of the relative density have been
reached with more significant shrinkages.
Figure 94. Calculated relative densities according to equation (20) for 316 L stainless steel feedstock
(D50=3.4 µm, formulation F3, powder volume loading of 62%, 64% and 66%) during the sintering
stages with different heating rates of 5, 10 and 15 °C/min
5.2.2.2. Numerical identification of viscosity parameters
In parallel to the identification of sintering stress, the shear and bulk viscosity modules have been
calculated using equation (17) for the 316L stainless steel feedstock (D50=3.4 µm, formulation F3,
powder volume loading of 62%, 64% and 66%). The modules G and K have been calculated by using
the above identified shrinkages and relative densities. The results are plotted (in logarithmic coordinates)
vs. temperature in Figure 95 in accordance to the three heating cycles. G and K begin to increase when
the temperature is greater than 1000 °C, which confirms well the experimental results obtained in the
900 1000 1100 1200 1300
0.65
0.7
0.75
0.8
0.85
0.9
0.95
1
Temperature [°C]
Rela
tive d
en
sit
y
5°C/min
10°C/min
15°C/min
900 1000 1100 1200 1300
0.65
0.7
0.75
0.8
0.85
0.9
0.95
1
Temperature [°C]
Rela
tive d
en
sit
y
5°C/min
10°C/min
15°C/min
900 1000 1100 1200 13000.65
0.7
0.75
0.8
0.85
0.9
0.95
1
Temperature [°C]
Rela
tive d
en
sit
y
5°C/min
10°C/min
62% 64%
66%

Chapter 5. Identification of constitutive material parameters and numerical simulation of the sintering stage in micro-MIM
89
dilatometer and they give the values always smaller than 0.31 GPa.s for all the tested cases. Besides, the
values of G and K with the same heating rate as the powder volume loadings rise at the same
temperature. Note that for the feedstock loaded at 62%, G and K exhibit an abrupt increase at about
1225 °C for heating rate equal 15 °C/min, which is generated by the abrupt increase of the uniaxial
viscosity with the same heating rate.
Figure 95. The identified shear and bulk viscosity modules according to equation (17) during the
sintering stages with different heating rates for 316 L stainless steel feedstock (D50=3.4 µm, formulation
F3, powder volume loading of 62%, 64% and 66%)
1000 1050 1100 1150 1200 1250 1300 13506
6.5
7
7.5
8
8.5
Temperature [°C]
Lg
(K,
[Pa.s
])
5°C/min
10°C/min
15°C/min
1000 1050 1100 1150 1200 1250 1300 13506
6.5
7
7.5
8
8.5
Temperature [°C]
Lg
(K,
[Pa.s
])
5°C/min
10°C/min
15°C/min
1000 1050 1100 1150 1200 1250 1300 13506.5
7
7.5
8
8.5
9
Temperature [°C]
Lg
(K,
[Pa.s
])
5°C/min
10°C/min
1000 1050 1100 1150 1200 1250 1300 13505.5
6
6.5
7
7.5
Temperature [°C]
Lg
(G,
[Pa.s
])
5°C/min
10°C/min
15°C/min
1000 1050 1100 1150 1200 1250 1300 13505.5
6
6.5
7
7.5
8
Temperature [°C]
Lg
(G,
[Pa.s
])
5°C/min
10°C/min
15°C/min
1000 1050 1100 1150 1200 1250 1300 13506
6.5
7
7.5
8
Temperature [°C]
Lg
(G,
[Pa.s
])
5°C/min
10°C/min
62%, G
64%, G
66%, G
62%, K
64%, K
66%, K

Chapter 5. Identification of constitutive material parameters and numerical simulation of the sintering stage in micro-MIM
90
Moreover, the experimental and numerical identified viscosity modules (G and K, in logarithm
coordinates) during the sintering stages with different heating rates have been compared in Figure 96,
Figure 97 and Figure 98 for three powder volume loadings. As different moments of the sintering stage
gives different G and K, 1000 °C and 1200 °C have been selected as the examples to demonstrate these
results.
Figure 96. Comparison of shear (G) and bulk (K) viscosity modules (in logarithm coordinates) from
experiments and numerical identification with different heating rates during the sintering stages for 316
L stainless steel feedstock (D50=3.4 µm, formulation F3, powder volume loading of 62%) at temperature
of a) 1000 °C and b) 1200 °C
Figure 97. Comparison of shear (G) and bulk (K) viscosity modules (in logarithm coordinates) from
experiments and numerical identification with different heating rates during the sintering stages for 316
L stainless steel feedstock (D50=3.4 µm, formulation F3, powder volume loading of 64%) at temperature
of a) 1000 °C and b) 1200 °C
It is shown that the identified viscosity modules are in perfect agreement with the experimental ones.
All the same, one exception should be noted that the identified K at 1200 °C with heating rate equal
5 °C/min for powder volume loading of 62%. To explain this problem, new experiments and
identifications will be carried out. Still due to the lack of specimens load at 66%, only two sintering
stages with heating rates of 5 °C/min and 10 °C/min have been studied, and the results have been related
in Figure 98, the identified viscosity modules fit well the experimental values as well.
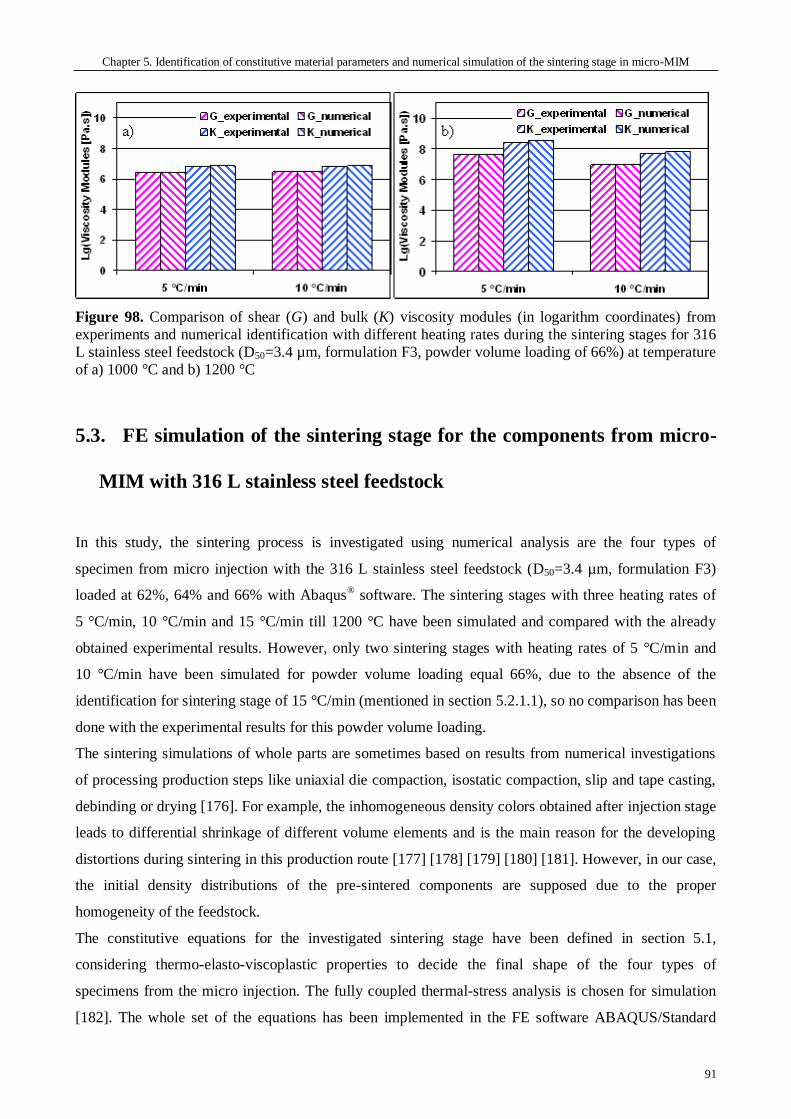
Chapter 5. Identification of constitutive material parameters and numerical simulation of the sintering stage in micro-MIM
91
Figure 98. Comparison of shear (G) and bulk (K) viscosity modules (in logarithm coordinates) from
experiments and numerical identification with different heating rates during the sintering stages for 316
L stainless steel feedstock (D50=3.4 µm, formulation F3, powder volume loading of 66%) at temperature
of a) 1000 °C and b) 1200 °C
5.3. FE simulation of the sintering stage for the components from micro-
MIM with 316 L stainless steel feedstock
In this study, the sintering process is investigated using numerical analysis are the four types of
specimen from micro injection with the 316 L stainless steel feedstock (D50=3.4 µm, formulation F3)
loaded at 62%, 64% and 66% with Abaqus® software. The sintering stages with three heating rates of
5 °C/min, 10 °C/min and 15 °C/min till 1200 °C have been simulated and compared with the already
obtained experimental results. However, only two sintering stages with heating rates of 5 °C/min and
10 °C/min have been simulated for powder volume loading equal 66%, due to the absence of the
identification for sintering stage of 15 °C/min (mentioned in section 5.2.1.1), so no comparison has been
done with the experimental results for this powder volume loading.
The sintering simulations of whole parts are sometimes based on results from numerical investigations
of processing production steps like uniaxial die compaction, isostatic compaction, slip and tape casting,
debinding or drying [176]. For example, the inhomogeneous density colors obtained after injection stage
leads to differential shrinkage of different volume elements and is the main reason for the developing
distortions during sintering in this production route [177] [178] [179] [180] [181]. However, in our case,
the initial density distributions of the pre-sintered components are supposed due to the proper
homogeneity of the feedstock.
The constitutive equations for the investigated sintering stage have been defined in section 5.1,
considering thermo-elasto-viscoplastic properties to decide the final shape of the four types of
specimens from the micro injection. The fully coupled thermal-stress analysis is chosen for simulation
[182]. The whole set of the equations has been implemented in the FE software ABAQUS/Standard

Chapter 5. Identification of constitutive material parameters and numerical simulation of the sintering stage in micro-MIM
92
(version 6.9-2) as a user supplied material routine (UMAT). The assembly composed of the micro-
specimens and the support has been demonstrated in Figure 99.
Figure 99 FE mesh of the four micro-specimen types and the support plate before sintering
The support for the four types of specimens is the same one. R3D4 and C3D8R have been set for the
support and the specimens as the element type, respectively. More details about characterization of the
mesh for these assemblies have been given in Table 28.
Table 28. Characterization of the mesh used in the investigated simulation
Component Support Type 1 Type 2 Type 3 Type 4
Element type R3D4 C3D8R C3D8R C3D8R C3D8R
Number of element 900 2100 2500 2160 2160
Number of node 976 2898 3366 2970 2970
The frictional coefficient between the specimens and the support has been set at 0.5 resulting from
previous analysis [167]. In addition, some other material parameters have been used in the simulation;
they are related in Table 29.
Table 29. Material parameters (316L stainless steel feedstock, D50=3.4 µm, formulation F3) used in the
simulation with Abaqus®
Young modulus 196 GPa
Elastic Poisson’s ratio 0.28
Thermal conductivity 14.6 W/(m°C) [183]
Thermal expansion coefficient 1.12×10⁻⁵ °C-1
Support Support
Support Support
Type 1 Type 2
Type 3 Type 4

Chapter 5. Identification of constitutive material parameters and numerical simulation of the sintering stage in micro-MIM
93
5.3.1. Prediction of shrinkages for micro- injected specimens with 316L stainless steel
feedstock (D50=3.4 µm, formulation F3)
The homogeneous green relative densities equal 0.62, 0.64 and 0.66 have been used in simulation
corresponding to the feedstocks loaded at 62%, 64% and 66%, respectively.
The final shrinkages (in 3D) (powder volume loading equal 62%, heating rate equal 5 °C/min) of the
sintered micro-specimens have been shown in Figure 100, and then the comparisons between the
simulated shrinkages and the experimental ones in length, width and thickness directions are related in
Figure 101. The other simulation results and comparisons have been shown in Appendix I, according to
different powder volume loadings and heating rates.
Figure 100. Numerical shrinkages of the four types of micro specimen (316L stainless steel, D50=3.4
µm, formulation F3, powder volume loading=62%) after the sintering stage (heating rate=5 °C/min)
As we discussed at the beginning of this chapter, no real manufacturing of the micro-specimen loaded at
66% have been processed, so only the numerical values have been given in Figure 115 and Figure 116
for this powder volume loading.
According to the results for powder volume loading of 62% and 64% (Figure 100 to Figure 109), it can
be observed that the experimental and numerical shrinkages are in good agreement in length and width
directions, especially for the sintering stage with heating rates of 5 °C/min and 10 °C/min. And for these
two heating rates, the shrinkages are more homogeneous than the ones for 15 °C/min, which can be
proved by the variation over 20% in light of shrinkage for the heating rate of 15 °C/min. In addition,
significant changes in shrinkage have been revealed by different types of the micro-specimens with the
heating rate of 15 °C/min. It means that the shrinkages evidently vary according to different forms of the
component to be sintered. The worse prediction of the dimensional shrinkages for the heating rate of
Type 1
Type 3
Type 2
Type 4

Chapter 5. Identification of constitutive material parameters and numerical simulation of the sintering stage in micro-MIM
94
15 °C/min is caused by this rapid thermal kinetic, which can generate more probable distortions to the
components under sintering, and this influence can particularly be more obvious for the micro-
components. So in terms of the resulted shrinkage, it can be concluded that a relatively slow heating rate
is preferred by the sintering stage for the micro-components with complex form, regarding the high
sensibility of component form associated to the rapid heating rate.
Some studies have been done about the gravity effects on the shrinkages of the sintering components
[184] [185 ]. The influence of gravity on uneven shrinkage of the sintered body depends on its
dimensions, support reaction, and the initial density distribution. Considering the gravitational effect,
more uneven shrinkages have been also observed in our study in the thickness direction for all these
four types of specimens compared with the shrinkages in other directions.
Figure 101. Comparison between the experimental and the numerical shrinkages of the four types of
micro specimen (316L stainless steel, D50=3.4 µm, formulation F3, powder volume loading=62%) after
the sintering stage (heating rate=5 °C/min)
Furthermore, if the contrast should be done between the sintered micro-specimens loaded at 62% and
64% in view of shrinkage, we can find out that the present results can hardly agree with the argument
that higher powder volume loading generally leads to lower dimensional shrinkage, and it will be even
worse when the simulation results are taken into account. One of the main reasons is due to the fact that
the identification results of shear viscosity modules G and bulk viscosity modules K with heating rate of
Type b)
0%
2%
4%
6%
8%
10%
12%
14%
16%
18%
Length Width Thickness
Numerical
Experimental
Type c)
0%
2%
4%
6%
8%
10%
12%
14%
16%
18%
20%
22%
24%
Length Width Thickness
Numerical
Experimental
Type d)
0%
2%
4%
6%
8%
10%
12%
14%
16%
18%
Length Width Thickness
Numerical
Experimental
Type a)
0%
2%
4%
6%
8%
10%
12%
14%
16%
18%
20%
Length Width Thickness
Numerical
Experimental
Type 1
Type 3
Type 2
Type 4

Chapter 5. Identification of constitutive material parameters and numerical simulation of the sintering stage in micro-MIM
95
5 °C/min are not very steady (see Figure 95), which have increased abruptly from about 1100 °C and
then slowed down the shrinkage in the simulation.
5.3.2. Prediction of relative density for the micro-injected specimens with 316L
stainless steel feedstock (D50=3.4 µm, formulation F3)
Besides of shrinkages, the relative densities have been simulated as well for these micro-specimens
injected with powder volume loading of 62%, 64% and 66%, respectively. The relative density
distributions (powder volume loading equal 62%, heating rate equal 5 °C/min) of the sintered micro-
specimens have been illustrated in Figure 102. The other simulation results have been shown in section
Appendix II, according to different powder volume loadings and heating rates.
As it is shown in the figures, the relative densities are generally homogeneous for most of the
simulations, in which the variations have been well controlled within 1%. However, some different
results have been encountered for the powder volume loading of 64% with heating rate of 15 °C/min
(see Figure 117 c)) and powder volume loading of 66% with heating rate of 5 °C/min (see Figure 118
a)). Especially the simulation for the first one (powder volume loading=64%, heating rate=15 °C/min), a
highest value of 100% has been attained by the micro-specimens of type 2, type 3 and type 4 while their
shapes have been significantly changed. This is due to the higher heating rate afforded to these micro-
specimens, which evidenced by the experimental phenomena mentioned in section 5.3.1, the
components loaded higher are particularly more sensitive to the rapid heating rate. Though in contrast
with these three types of micro-specimen, a relatively homogeneous distribution has been given by type
1, as shown in the same figure, just 3% as the variation has been found. Some little better results have
been obtained in the second one (powder volume loading=66%, heating rate=5 °C/min), in which study
about 5% error has been revealed by the micro-specimens of type 1, type 3 and type 4, but for one of
type 2, perfect densification has been achieved (only 0.77% as the variation) due to the more simple
form of this type.

Chapter 5. Identification of constitutive material parameters and numerical simulation of the sintering stage in micro-MIM
96
Figure 102. Numerical relative densities of the four types of micro-specimen (316L stainless steel,
D50=3.4 µm, formulation F3, powder volume loading=62%) after the sintering stage with heating rate of
a) 5 °C/min, b) 10 °C/min and c) 15 °C/min
Type 1
Type 3
Type 2
Type 4
b)
Type 1
Type 3
Type 2
Type 4
a)
Type 1
Type 3
Type 2
Type 4
c)

Chapter 5. Identification of constitutive material parameters and numerical simulation of the sintering stage in micro-MIM
97
Finally, with the measurement of the relative density (mentioned in section 4.2.4.2) for the sintered
micro-specimens, the comparison between the experiments and these simulations have been
summarized and the mean values are plotted in Figure 103 and Figure 104 for powder volume loading
of 62% and 64%, respectively.
80%
84%
88%
92%
96%
5 10 15
Heating rate [°C/min]
Rela
tiv
e d
en
sit
y
62%-experimental
62%-numerical
Figure 103. Comparison between the experimental and the numerical relative density corresponding to
four types of micro specimen (316L stainless steel, D50=3.4 µm, formulation F3, powder volume
loading=64%) after the sintering stage (heating rate=5 °C/min, 10 °C/min and 15 °C/min)
80%
84%
88%
92%
96%
5 10 15
Heating rate [°C/min]
Re
lati
ve
de
ns
ity
64%-experimental
64%-numerical
Figure 104. Comparison between the experimental and the numerical relative density corresponding to
four types of micro specimen (316L stainless steel, D50=3.4 µm, formulation F3, powder volume
loading=64%) after the sintering stage (heating rate=5 °C/min, 10 °C/min and 15 °C/min)
Actually, obvious differences between the experimental and numerical values have been observed for
both powder volume loadings. The results from simulation are almost smaller than the ones from
experiment, this is due to the fact that the identification tests (mentioned in section 5.2.1) in the vertical
dilatometer have been carried out in an argon atmosphere instead of vacuum to prevent them from
getting oxidized. As it is known, in some worse situations, the pores will be coarsen due to the inner
expansion of the gas in the pores when the sintering is processed at high temperature [ 186], the
consequence is that the slow down and the reduction effect for densification, but there no gas trapped
Chapter 5. Identification of constitutive material parameters and numerical simulation of the sintering stage in micro-MIM
98
when the sintering stage is carried out in vacuum atmosphere, that’s why the experimental results are
always higher than the ones simulated by using the identified parameters from the vertical tests.
Summary
In this chapter, a phenomenological model of solid state diffusion sintering has been presented.
Meanwhile the parameters (G, K and σs) should be determined have been highlighted. The beam-
bending and free sintering tests in the vertical dilatometer have been realized in order to identify the
model parameters. Consequently, the identifications in Matlab® have been successfully carried out, and
the results have been related.
Based on the identified parameters, by coupling the other parameters proposed in literature and the other
similar researches, such as Young modulus, elastic Poisson’s ratio, thermal conductivity and the friction
between the component and support, etc, the model has been implemented in the finite element code
Abaqus® as a user defined material routine UMAT. The sintering stages with different heating rates
(5 °C/min, 10 °C/min and 15 °C/min) are simulated for four micro-specimens types injected with three
powder volume loadings (62%, 64% and 66%). As the results, the shrinkage and relative density
associated to each sintering cycle have been related and compared to the experimental values,
respectively. The simulation results fit well the experiments, especially for the sintering cycles with
relative low heating rates and low powder volume loadings. However, due to the high sensibility of the
component shape associated to the sintering cycle with rapid heating rate, the prediction of the sintering
behavior for micro-specimens injected with high powder volume loading (66%) and rapid heating rate
(15 °C/min) has to be improved in comparison with the other results.
In summary, the sintering computational simulation with the proposed thermo-elasto-viscoplastic model
can generally predict the results of the sintering stage. But this ability in some cases remained limited
for some particular situations, such as the very rapid heating rate during the sintering stage, the micro-
specimens with complex form, the components injected with feedstock loaded very high, etc.

Chapter 6. Conclusions and perspectives
99
Chapter 6. Conclusions and perspectives
The researches reported in this thesis focus on the elaboration and characterization of feedstock based
on 316L stainless steel powders, the identification of material and physical parameters associated to the
sintering stage and the numerical simulations of the sintering process by the FE method using the
identified parameters. The main experimental developments and the related numerical simulations, as
well as the future works in this chapter.
6.1. Conclusions
In comparison to the previous Ph. D. theses carried out in our research team, new binder systems
composed of different polymeric binder systems have been adapted to various 316L stainless
steel powders (5 µm and 16 µm). Three feedstock formulations have been elaborated using
polyethylene and wax (Group #1), polypropylene + wax + acid (Group #2) and polyethylene +
acid (Group #3). The resulting feedstocks for each group have been characterized using the
mixing torque tests in twin-screw mixer and the shear viscosity tests using in capillary
rheometer. Group #2 has been highlighted from the three groups due to the lower mixing torque
and shear viscosity revealed by this binder system. Meanwhile, the feedstock associated to
formulation F3 that is well adapted for both powders is retained for the subsequent tests.
By using the selected F3 feedstock formulation, four methods have been employed to determine
the critical powder volume loading with 316L stainless steel powder (5 µm): mixing tests by
continuously powder content increasing and batch powder loading, rheological tests and
feedstock viscosity model. The different powder volume loading ranges obtained according to
each method are 64~70%, 64~70%, 66%~70 and 68%, respectively. By coupling these four
ranges, the critical powder volume loading corresponding to formulation F3 has been located at
68% for the powder of 5 µm.
Mono-material injection with one single feedstock and bi-material injection with two different
feedstocks have been properly developed and realized. Four types of micro-specimen used for
the simulation validation have been injected with three 316L stainless steel feedstocks (5 µm) of
62%, 64%, and 66% corresponding to formulation F3. A two-plate mold has been used for the
bi-material injection with 316L stainless steel feedstocks (5 µm) loaded at 60% and 64%, but the
injection chambers are not separated for the different feedstocks, so the irregular joining of
feedstock at the interface zone have been encountered in these first bi-material injection tests.
Then micro component injected with 316L stainless steel feedstock (5 µm) and Cu feedstock has

Chapter 6. Conclusions and perspectives
100
been realized by using a three-plate mold with the separated die cavities. The interface between
both feedstocks has been well controlled in comparison with the first process.
Binder burnt-out tests have been carried out for the selected feedstocks in TGA module in the
vertical dilatometer, as well as for the injected micro-specimens dedicated in order to validate
the numerical simulations. In the first case, the feedstock pellets with different powders volume
loading have been heated up to 500 °C, and the weight loss has been measured. In micro-
specimen injection, TGA has been examined for injected specimens. Consequently, the
homogeneity of feedstock has been investigated before and after injection. The measured weight
losses in both cases are in good agreement to the theoretical binder weight in the feedstock
formulation. In addition, the binders and powder particles distribution have been observed
through SEM. Both TGA and SEM analyses lead to the same conclusion: the feedstock prepared
corresponding to the selected formulation F3 (binder system composed of polypropylene,
paraffin wax and stearic acid) are homogeneous.
In order to identify the sintering parameters based on the proposed model, beam-bending and
free sintering tests have been performed through TMA in a vertical dilatometer. Three heating
rates corresponding to 5 °C/min, 10 °C/min and 15 °C/min have been used during these tests on
316L stainless steel (5 µm) feedstocks with various powder volume loadings (62%, 64% and
66%). On basis of the results obtained from the dilatometer, the shear viscosity module G, the
bulk viscosity module K and the sintering stress σs have been properly identified using Matlab®
software, The identified parameters fit well the experimental values.
A thermo-elasto-viscoplastic model well suited for sintering stage has been implemented in
Abaqus® finite element code, the element that are used correspond to R3D4 and C3D8R for the
support and the four micro-specimens, respectively. The material parameters resulting from the
experiments have been used to define the 316L stainless steel feedstock, together with the
identified G, K and σs. Finally, the sintering stage of 1200 °C for the four types of micro-
specimens (powder volume loading of 62%, 64% and 66%) with three heating rates (5 °C/min,
10 °C/min and 15 °C/min) have been simulated. The experimental shrinkages and relative
densities of the sintered micro-specimens have been compared to the simulation results.
Adequate comparisons are related, especially for the case of lower heating rates adapted to the
components injected with lower powder volume loadings and simple forms.

Chapter 6. Conclusions and perspectives
101
6.2. Perspectives
6.2.1. Experiments and processing
According to the obtained results, new investigations about the new binders involved in the feedstock
formulations should be carried out, due to the fact that the linear relationship between shear viscosity
and shear rate is influenced in relative high shear rate range (mentioned in section 2.5.2).
The difficulty of micro injection moulding with high powder volume loading (66%) on the devoted
equipments should be improved, and then more specimens with this powder volume loading should be
manufactured for the identification tests and the comparison with the simulation results.
For the debinding stage, some alternative debinding techniques will be introduced and tried in our
research team, and still some modifications will be done for the debinding cycle and debinding
atmosphere.
In terms of sintering stage, the micro-specimens injected with 316L stainless steel feedstock and Cu
feedstock will be sintered in order to complete the bi-material injection moulding process, various
sintering cycles and atmospheres will be tested. As a general objective, one has to develop the sintering
capacities and related numerical simulations to be able to proceed with various materials.
6.2.2. Computational developments
A sintering model specially developed for the densification of micro-MIM process, such as the
microscopic model mentioned in section 5.1, will be correspondingly introduced and adapted to new
developments as micro-specimens. Accordingly, new parameters dedicated to the numerical simulation
should be identified. So new models will be introduced in Abaqus®, considering the worse situations in
which the sintering stage with rapid heating rates accommodated to the complex micro-specimens with
high powder volume loading. Finally, simulations for the sintering stage of bi-material injection
moulding will be also performed by combining two material routines for the feedstocks involved in the
bi-material component, on the basis of the identified parameters for each feedstock.
New challenges will also be investigated to provide the ability of the MIM process for the micro
manufacturing of active functional devices (sensors …), based on multi materials joining ability of the
process.

Appendix I: Simulated shrinkages and comparisons between the numerical and experimental results
102
Appendix I: Simulated shrinkages and comparisons between the
numerical and experimental results
Figure 105. Numerical shrinkages of the four types of micro specimen (316L stainless steel, D50=3.4
µm, formulation F3, powder volume loading=62%) after the sintering stage (heating rate=10 °C/min)
Figure 106. Comparison between the experimental and the numerical shrinkages of the four types of
micro specimen (316L stainless steel, D50=3.4 µm, formulation F3, powder volume loading=62%) after
the sintering stage (heating rate=10 °C/min)
Type 1
Type 3
Type 2
Type 4
Type a)
0%
2%
4%
6%
8%
10%
12%
14%
16%
18%
Length Width Thickness
Numerical
Experimental
Type b)
0%
2%
4%
6%
8%
10%
12%
14%
16%
18%
20%
22%
Length Width Thickness
Numerical
Experimental
Type c)
0%
2%
4%
6%
8%
10%
12%
14%
16%
18%
20%
22%
Length Width Thickness
Numerical
Experimental
Type d)
0.00%
2.00%
4.00%
6.00%
8.00%
10.00%
12.00%
14.00%
16.00%
18.00%
Length Width Thickness
Numerical
Experimental
Type 1
Type 3
Type 2
Type 4

Appendix I: Simulated shrinkages and comparisons between the numerical and experimental results
103
Figure 107. Numerical shrinkages of the four types of micro specimen (316L stainless steel, D50=3.4
µm, formulation F3, powder volume loading=62%) after the sintering stage (heating rate=15 °C/min)
Figure 108. Comparison between the experimental and the numerical shrinkages of the four types of
micro specimen (316L stainless steel, D50=3.4 µm, formulation F3, powder volume loading=62%) after
the sintering stage (heating rate=15 °C/min)
Type 1
Type 3
Type 2
Type 4
Type a)
0%
2%
4%
6%
8%
10%
12%
14%
16%
18%
20%
Length Width Thickness
Numerical
Experimental
Type b)
0%
2%
4%
6%
8%
10%
12%
14%
16%
18%
20%
Length Width Thickness
Numerical
Experimental
Type c)
0%
2%
4%
6%
8%
10%
12%
14%
16%
18%
20%
22%
24%
Length Width Thickness
Numerical
Experimental
Type d)
0%
2%
4%
6%
8%
10%
12%
14%
16%
18%
20%
Length Width Thickness
Numerical
Experimental
Type 1
Type 3
Type 2
Type 4

Appendix I: Simulated shrinkages and comparisons between the numerical and experimental results
104
Figure 109. Numerical shrinkages of the four types of micro specimen (316L stainless steel, D50=3.4
µm, formulation F3, powder volume loading=64%) after the sintering stage (heating rate=5 °C/min)
Figure 110. Comparison between the experimental and the numerical shrinkages of the four types of
micro specimen (316L stainless steel, D50=3.4 µm, formulation F3, powder volume loading=64%) after
the sintering stage (heating rate=5 °C/min)
Type 1
Type 3
Type 2
Type 4
Type a)
0%
2%
4%
6%
8%
10%
12%
14%
16%
18%
Length Width Thickness
Numerical
Experimental
Type b)
0%
2%
4%
6%
8%
10%
12%
14%
16%
18%
20%
Length Width Thickness
Numerical
Experimental
Type c)
0%
2%
4%
6%
8%
10%
12%
14%
16%
18%
20%
22%
24%
Length Width Thickness
Numerical
Experimental
Type d)
0%
2%
4%
6%
8%
10%
12%
14%
16%
18%
20%
22%
24%
Length Width Thickness
Numerical
Experimental
Type 1
Type 3
Type 2
Type 4

Appendix I: Simulated shrinkages and comparisons between the numerical and experimental results
105
Figure 111. Numerical shrinkages of the four types of micro specimen (316L stainless steel, D50=3.4
µm, formulation F3, powder volume loading=64%) after the sintering stage (heating rate=10 °C/min)
Figure 112. Comparison between the experimental and the numerical shrinkages of the four types of
micro specimen (316L stainless steel, D50=3.4 µm, formulation F3, powder volume loading=64%) after
the sintering stage (heating rate=10 °C/min)
Type 1
Type 3
Type 2
Type 4
Type a)
0%
2%
4%
6%
8%
10%
12%
14%
16%
18%
Length Width Thickness
Numerical
Experimental
Type b)
0%
2%
4%
6%
8%
10%
12%
14%
16%
18%
20%
Length Width Thickness
Numerical
Experimental
Type c)
0%
2%
4%
6%
8%
10%
12%
14%
16%
18%
20%
Length Width Thickness
Numerical
Experimental
Type d)
0%
2%
4%
6%
8%
10%
12%
14%
16%
18%
20%
Length Width Thickness
Numerical
Experimental
Type 1
Type 3
Type 2
Type 4

Appendix I: Simulated shrinkages and comparisons between the numerical and experimental results
106
Figure 113. Numerical shrinkages of the four types of micro specimen (316L stainless steel, D50=3.4
µm, formulation F3, powder volume loading=64%) after the sintering stage (heating rate=15 °C/min)
Figure 114. Comparison between the experimental and the numerical shrinkages of the four types of
micro specimen (316L stainless steel, D50=3.4 µm, formulation F3, powder volume loading=64%) after
the sintering stage (heating rate=15 °C/min)
Type 1
Type 3
Type 2
Type 4
Type a)
0%
2%
4%
6%
8%
10%
12%
14%
16%
18%
20%
22%
24%
Length Width Thickness
Numerical
Experimental
Type b)
0%
2%
4%
6%
8%
10%
12%
14%
16%
18%
Length Width Thickness
Numerical
Experimental
Type c)
0%
2%
4%
6%
8%
10%
12%
14%
16%
18%
20%
22%
24%
26%
Length Width Thickness
Numerical
Experimental
Type d)
0%
2%
4%
6%
8%
10%
12%
14%
16%
18%
20%
Length Width Thickness
Numerical
Experimental
Type 1
Type 3
Type 2
Type 4

Appendix I: Simulated shrinkages and comparisons between the numerical and experimental results
107
Figure 115. Numerical shrinkages of the four types of micro specimen (316L stainless steel, D50=3.4
µm, formulation F3, powder volume loading=66%) after the sintering stage (heating rate=5 °C/min)
Figure 116. Numerical shrinkages of the four types of micro specimen (316L stainless steel, D50=3.4
µm, formulation F3, powder volume loading=66%) after the sintering stage (heating rate=10 °C/min)
Type 1
Type 3
Type 2
Type 4
Type 1
Type 3
Type 2
Type 4

Appendix II: Simulated relative density distributions
108
Appendix II: Simulated relative density distributions
Figure 117. Numerical relative densities of the four types of micro-specimen (316L stainless steel,
D50=3.4 µm, formulation F3, powder volume loading=64%) after the sintering stage with heating rate of
a) 5 °C/min, b) 10 °C/min and c) 15 °C/min
Type 1
Type 3
Type 2
Type 4
c)
Type 1
Type 3
Type 2
Type 4
b)
Type 1
Type 3
Type 2
Type 4
a)
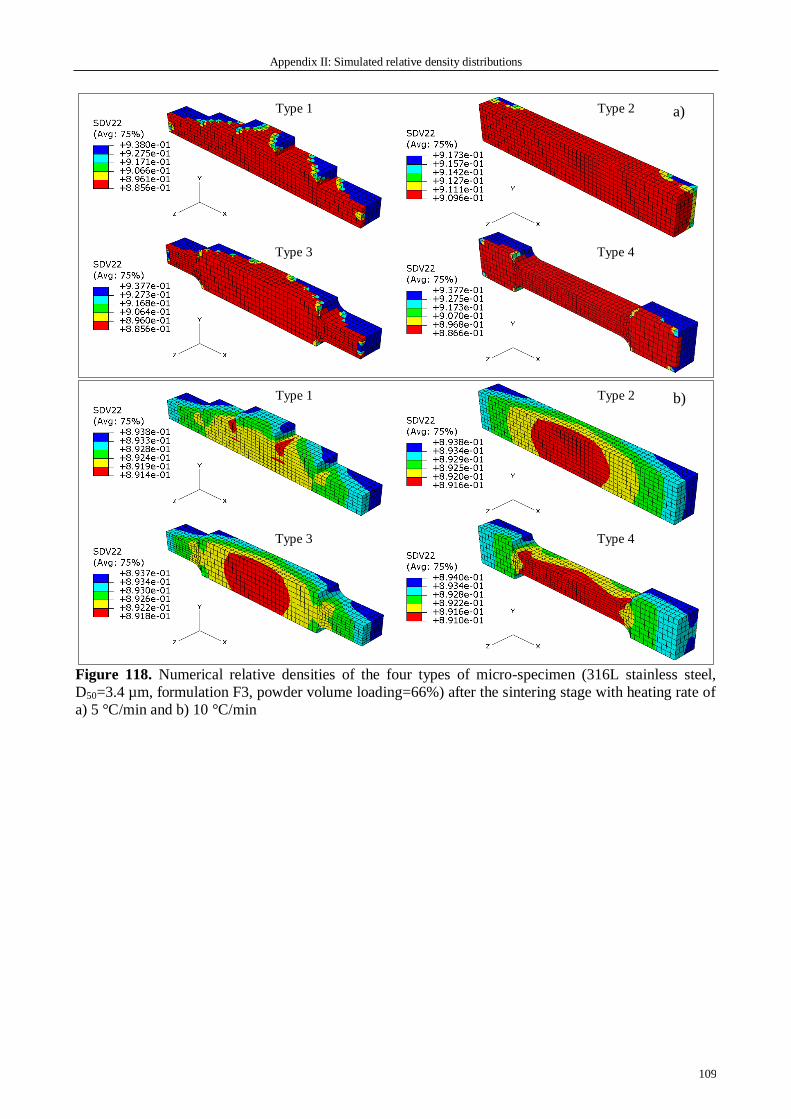
Appendix II: Simulated relative density distributions
109
Figure 118. Numerical relative densities of the four types of micro-specimen (316L stainless steel,
D50=3.4 µm, formulation F3, powder volume loading=66%) after the sintering stage with heating rate of
a) 5 °C/min and b) 10 °C/min
Type 1
Type 3
Type 2
Type 4
b)
Type 1
Type 3
Type 2
Type 4
a)

Bibliography
110
Bibliography
[1] H.Ö. Gülsoy and R.M. German, Production of micro-porous austenitic stainless steel by powder
injection molding, Scripta Materialia, Volume 58, Issue 4, 2008, pp. 295-298.
[2] R.M. German and A. Bose, Injection Molding of Metals and Ceramics, MPIF, 1997.
[3] C. H. Ji, N. H. Loh, K. A. Khor and S. B. Tor, Sintering study of 316L stainless steel metal
injection molding parts using Taguchi method: final density, Materials Science and Engineering A,
Volume 311, Issues 1-2, 2001, pp. 74-82.
[4] K. Nishiyabu, I. Andrews and S. Tanaka, Making and measuring in micro MIM manufacturing,
Metal Powder Report, Volume 64, Issue 9, 2009, pp. 22-25.
[5] A. Rota, P. Imgrund, L. Kramer, R. Meyer and J. Haack, Micro MIM approaches mass
production , Metal Powder Report, Volume 60, Issue 12, 2005, pp.16-20.
[ 6 ] L. K. Tan, R. Baumgartner and R.M. German, Powder Injection Molding of Bi-Metal
Components. PIM Compilation IV: Applications and Management Issues, Metal Powder Industries
Federation, Princeton, NJ, May 2007.
[7] M. Braginsky, V. Tikare, E. Olevsky, Numerical simulation of solid state sintering, International
Journal of Solids and Structures 42 (2005) 621–636.
[8] D.F. Heaney, R. Spina, Numerical analysis of debinding and sintering of MIM parts, Journal of
Materials Processing Technology 191 (2007) 385–389.
[9] www.mpif.org/newsroom/facts.pdf
[10] L. Sheppard, The powder metallurgy industry worldwide 2007 – 2012, Materials Technology
Publications, Sep 2007, pp. 450.
[11] K.P. Cooper, Producing net-shape products by powder metallurgy, JOM Journal of the Minerals,
Metals and Materials Society, Volume 51, Number 7, DOI: 10.1007/s11837-999 0104-9.
[12] http://www.azom.com/details.asp?ArticleID=1627.
[ 13 ] M. Kearns, Alloy Metal Powders for Dental Applications, 2007, Sandvik Osprey Ltd.,
www.smt.sandvik.com/osprey.
[14] R.M. German, PIM breaks the $1 bn barrier, Metal Powder Report, Volume 63, Issue 3, 2008, pp.
8-10.
[15] P. Balaji, Metal Injection Molding, Advanced Materials, Report Code: AVM049A, 2005.
[16] G. Schlieper, Euro PM2009 review: A high level of MIM industry participation gives a welcome
boost in Copenhagen, Powder injection moulding international Volume 3, Number 4, 2009, pp. 38-42.
[17] P. Balaji, Metal injection molding, report code: AVM049A, July 2005.
Bibliography
111
[18] J. Song, T. Zhi, Y. Yu and Z. Zhuang, Development of Molybdenum Powder Injection Moulding
Feedstock, PM2010 World Congress proceeding, Volume 4, pp. 573-580.
[19] H. Mulin, P. Jacquet, M. Lambertin, D. Moinard-Checot and J.C. Bihr, Contribution to the
Development of 18 Carat Gold Alloy Shaped by MIM, PM2010 World Congress proceeding, Volume 4,
pp. 339-346.
[20] D. Seo, K. Ogawa, Y. Nakao, H. Miura and T. Shoji, Influence of high-temperature creep stress
on growth of thermally grown oxide in thermal barrier coatings, Surface and Coatings Technology,
Volume 203, Issue 14, 2009, pp. 1979-1983.
[21] R.M. German, Divergences in global powder injection moulding, Journal of Powder Injection
Moulding, Volume 2, Number 1, 2008.
[22] http://www.xstreamscience.org/H_Glaze/H_Glaze_1.htm
[23] R.M. German and A. Bose, Injection Molding of Metals and Ceramics, Princeton, New Jersey,
USA, 1997.
[24] J. Hidalgo, J.M. Contreras, S. Gonzalez, A. Jiménez-Morales and J.M. Torralba, Rheological
Behaviour of Powder Injection Moulding (PIM) Feedstocks Fabricated with a Thermoplastic Binder
System Based on Polysaccharides, PM2010 World Congress proceeding, Volume 4, pp. 549-555.
[25] J. Hidalgo, J.M. Contreras, B. Baile, A. Jiménez-Morales and J.M. Torralba, Rheological and
Thermal Behaviour of Powder Injection Moulding (PIM) Feedstocks Fabricated with Binder System
Based on Waxes, PM2010 World Congress proceeding, Volume 4, pp. 589-594.
[26] http://www.custompartnet.com/wu/metal-injection-molding
[27] B. Linke, Injection molding an IC into a connector or consumable item, APP 4717, Aug 03, 2010.
[28] H. Jorge, Compounding and Processing of a Water Soluble Binder for Powder Injection Moulding,
Ph. D. thesis, Universidade do Minho, 2008.
[29] D.V. Rosato, Injection Molding Handbook, New York (USA): Van Nostrand Reinhold (1986).
[30] J. Song, T. Barriere, J.C. Gelin and B. Liu, Powder injection molding of metallic and ceramic
hip implants, Int. J. Powder Metallurgy, 2009, Volume 45, Issue 3, pp. 25-34.
[31] Ph. Imgrund, A. Rota and L. Kramer, Processing and properties of bi-material parts by micro
metal injection moulding, Multi-Material Micro Manufacture, 2005, pp. 131.
[32] L.Tan and R. Baumgartner, Powder injection molding of bi-metal components, Proceedings of
European Congress and Exhibition on Powder Metallurgy Nice, France, 2001, pp. 135–140.
[33] http://www.fcs.com.tw/webtop/FAQ_EN/index.phtml?action=browse&id=164&StoreID=9&
[ 34 ] R. Ruprecht, T. Gietzelt, K. Mueller, V. Piotter and J. Hausselt, Injection molding of
microstructured components from plastics, metals and ceramics, Microsystem Technologies, 2002,
pp.351-358.

Bibliography
112
[35] Ph. Imgrund, A. Rota and A. Simchi, Microinjection moulding of 316L/17-4PH and 316L/Fe
powders for fabrication of magnetic–nonmagnetic bimetals, Journal of Materials Processing Technology,
Volume 200, Issues 1-3, 2008, pp. 259-264.
[36] L. Liu, N.H. Loh, B.Y. Tay, S.B. Tor, Y. Murakoshi and R. Maeda, Mixing and characterisation
of 316L stainless steel feedstock for micro powder injection molding, Materials Characterization,
Volume 54, Issue 3, 2005, pp. 230-238.
[37] L. Liu, N.H. Loh, B.Y. Tay, S.B. Tor, Y. Murakoshi and R. Maeda, Effects of thermal
debinding on surface roughness in micro powder injection molding, Materials Letters, Volume 61, Issue
3, February 2007, pp. 809-812.
[38] http://www.pim-international.com/magazine
[39] F. Watari, A. Yokohama, F. Saso, M. Uo and T. Kawasaki, Fabrication and properties of
functionally graded dental implant, Composites B: Engineering, Volume 28, Issues 1-2, 1997, pp. 5-11.
[40] E.S. Thian, N.H. Loh, K.A. Khor and S.B. Tor, Effects of debinding parameters on powder
injection molded Ti-6Al-4V/HA composite parts, Advanced Powder Technology, Volume 12, Issue 3,
2001, pp. 361-370.
[41] R. Felton, P. Imgrund, F. Petzoldt, V. Friederici, D. Busquets-Mataix, L. Reig, V. Amigó and
J.A. Calero, PM companies eye a new future of taking medicine, Metal Powder Report, Volume 64,
Issue 3, 2009, pp. 12-17.
[42] http://www.epma.com/New_non_members/mim_design.htm
[43] N. Williams and P. Whittaker, PM2010 : Case studies highlight global success of Metal and
Ceramic Injection Moulding, Powder Injectiong Moulding International, Volume 4, Number 4, 2010, pp.
48-54.
[44] C. Quinard, Experimentation, modelisation et simulation dans le domaine de l’elaboration de
micro-composants injectes a partir de poudres, Ph.D. Thesis, University of Franche-Comté, 2008.
[45] R.M. German, Research productivity and the value to the P.I.M. market, P.I.M. 2000, Int.
Conference on Injection Moulding of Metals and Ceramics, Ed. by German R.M., Penn States
University Press, 2000.
[46] R.M. German, Status of PIM Research and Development, P.I.M. 2007, Int. Conference on
Injection Moulding of Metals and Ceramics, Ed. by M.P.I.F, 2007.
[47] R.M. German, Sintering theory and practice, Ed. by Wiley J. & Sons, 1996.
[48] R.M. German, Design and applications, published by Innovation Material Solutions, 2000.
[49] J. Alcock, Co-injection promises further growth for MIM, Metal Powder Report, Volume 54, Issue
6, 1999, pp. 1-30.
[50] T. Barriere, Expérimentations, Modélisation et Simulation Numérique du Moulage par Injection
de Poudres Métalliques, Thèse de doctorat, Université de Franche-Comté, 2000.

Bibliography
113
[51] T. Hartwig, G. Veltl, F. Petzoldt, H. Kunze, R. Scholl and B. Kieback, Powders for metal
injection molding Journal of the European Ceramic Society, Volume 18, Issue 9, 1998, pp. 1211-1216.
[52] L. Kowalski, J. Duszczyk and L. Katgerman, Thermal conductivity of metal powder-polymer
feedstock for powder injection molding, Journal of Materials Processing Technology, Volume 178,
Issues 1-3, 2006, pp. 194-199
[53] J.E. Bidaux, A. Jochem and E. Carreño-Morelli, Powder injection moulding of NiTi shape
memory materials, Powder Injection Moulding International, 2008, Volume 2, Issue 1, pp. 59-62.
[ 54 ] F.P. Petzoldt, General introduction to metal injection moulding, Metal injection moulding,
E.P.M.A. Short Course, Ed. by E.P.M.A., I.F.A.M., 1995.
[55] M. Reiterer, T. Kraft, U. Janosovits and H. Riedel, Finite element simulation of cold isostatic
pressing and sintering of SiC components, Ceramics International, Volume 30, Issue 2, 2004, pp. 177-
183.
[56] T. Kraft and H. Riedel, Numerical simulation of solid state sintering: model and application,
Journal of Europe ceramic society, Volume 24, Issue 2, 2004, pp. 345-361.
[57] B. Zeep, P. Norajitra, V. Piotter, J. Boehm, R. Ruprecht and J. Hausselt, Net shaping of
tungsten components by micro powder injection moulding, Fusion Engineering and Design 82, Issues
15-24, 2007, pp. 2660-2665.
[58] H.M. Shaw and M.J. Edirisinghe, Shrinkage and particle packing during removal of organic
vehicle from ceramic injection mouldings, Journal of the European Ceramic Society, Volume 15, Issue
2, 1995, pp. 109-116.
[59] L. Nyborg et al., Interactions between surface-active additives and 316L stainless steel powder for
MIM, Metal Powder Report, Volume 53, Issue 4, 1998, pp. 38.
[60] A. Olevsky, G. Timmermans, B. Shtern, L. Froyen and L. Delaey, The permeable element
method for modelling of deformation processes in porous and powder materials: theoretical basis and
checking by experiments, Powder Technology, Volume 93, Issue 2, 1997, pp. 127-141.
[61] O. Van der Biest and A.L. Maximenko, Computer modelling and optimization of thermal
debinding in powder injection moulding, Metal Powder Report, Volume 53, Issue 4, 1998, pp. 39.
[62] B. Levenfeld, A. Várez, L. Castro and J. M. Torralba, Processing of P/M M2 high speed steels
by mould casting using thermosetting binders, Journal of Materials Processing Technology
Volume 119, Issues 1-3, 2001, pp. 1-6.
[63] M. Matos, J. M. Castanho and M. T. Vieira, Composite copper/stainless steel coated powders,
Journal of Alloys and Compounds Volume 483, Issues 1-2, 2009, pp. 460-463.
[64] Z. Y. Liu, N. H. Loh, S. B. Tor, K. A. Khor, Y. Murakoshi, R. Maeda and T. Shimizu, Micro-
powder injection molding, Journal of Materials Processing Technology, Volume 127, Issue 2, 2002, pp.
165-168.

Bibliography
114
[65] O. Yamamoto, T. Sasamoto and M. Inagaki, Antioxidation of carbon-carbon composites by SiC
concentration gradient and zircon overcoating, Carbon, Volume 33, Issue 4, 1995, pp. 359-365.
[66] Y. Kang and S. Kang, The surface microstructure of TiC-(Ti,W)C-WC-Ni cermets sintered in a
nitrogen atmosphere, Materials Science and Engineering: A, Volume 527, Issues 27-28, 2010, pp. 7241-
7246.
[67] Y. Kang and S. Kang, WC-reinforced (Ti,W)(CN), Journal of the European Ceramic Society,
Volume 30, Issue 3, 2010, pp. 793-798.
[68] H.K. Kang and S. B. Kang, Tungsten/copper composite deposits produced by a cold spray,
Scripta Materialia, Volume 49, Issue 12, 2003, pp. 1169-1174.
[ 69 ] M. Thornagel, MIM-Simulation: A Virtual Study on Phase Separation, EURO PM2009
Proceedings, Volume 2, 2009, pp. 135-140.
[70] F. Ilinca and J.F. Hétu, A finite element immersed boundary method for fluid flow around
moving objects, Computers & Fluids, Volume 39, Issue 9, 2010, pp. 1656-1671.
[71] J.F. Hetu, Simulation of injection moulding effects of thermal and inertial effects on flow stability,
Metal Powder Report, Volume 56, Issue 6, 2001, pp. 40.
[72] J. Song, J.C. Gelin, T. Barriere and B. Liu, Experiments and numerical modelling of solid state
sintering for 316L stainless steel components, J. of Materials Processing and Technology 177, 2006, pp.
352-355.
[73] A. Poitou, Approche mécanique du mélange par extrusion, Thèse de doctorat soutenue en 1988,
Ecole des Mines de Paris, 1988, pp. 1-120.
[74] Manguin-Fritsch Agnès, Modélisation et optimisation de la dégradation thermique des liants
utilisés en injection de céramiques, Thèse de doctorat soutenue le 01/11/1992, Ecole des Mines de Paris,
1992, pp. 1-100.
[75] B. Lanteri, Etude du comportement rhéologique d'un mélange polymère-céramique destiné à
l'injection, Thèse de doctorat soutenue le 01/12/1993, Ecole des Mines de Paris, 1993, pp. 1-100.
[76] L. Minier, S.L. Gallet, Y. Grin and F. Bernard, Influence of the current flow on the SPS
sintering of a Ni powder, Journal of Alloys and Compounds, Volume 508, Issue 2, 2010, pp. 412-418.
[77] M. Dutilly and J.C. Gelin, A multiphase flow approach accounting for thermo-mechanical
coupling for modelling the powder injection molding, Simulation of Materials Processing: Theory,
Methods and Application, Ed. by Shen and Dawson, 1998, pp. 635-640.
[78] M. Dutilly, O. Ghouati and J.C. Gelin, Finite element analysis of the debinding and densification
phenomena in the process of metal injection molding, Materials Processing Technology, Volume 83,
Issues 1-3, 1998, pp. 170-175.

Bibliography
115
[79] T. Barriere, J.C. Gelin and B. Liu, Experimental and numerical investigations on the properties
and quality of parts produced by MIM, Powder Metallurgy, Ed. by Maney Publishing, Volume 44,
Number 3, 2001, pp. 228-234.
[80] D.F. Heaney, T.J. Mueller and P A. Davies, Mechanical properties of metal injection moulded
316l stainless steel using both prealloy and master alloy techniques, Powder Metallurgy, Volume 47,
Number 4, 2004, pp. 367-373.
[81] M.A. Omar, R. Ibrahim, M.I. Sidik, M. Mustapha and M. Mohamad, Rapid debinding of 316L
stainless steel injection moulded component, Journal of Materials Processing Technology, Volume 140,
Issues 1-3, 2003, pp. 397–400.
[82] C. Quinard, T. Barriere and J.C. Gelin, Development and property identification of 316L
stainless steel feedstock for PIM and μPIM, Powder Technology, Volume 190, Issues 1-2, 2009,
pp.123–128.
[83] M.E. Sotomayor, A. Várez and B. Levenfeld, Influence of powder particle size distribution on
rheological properties of 316 L powder injection moulding feedstocks, Powder Technology, Volume
200, Issues 1-2, 2010, pp. 30-36.
[84] D.F. Bailey, Moulding Ceramic Composition, Patent No. US3285873.
[85] I. Hiroshi Ono, S. Katuyoshi, Y. Haruo, S. Takeo and M. Yoshimichi, Polyamide base binder
for use in metal powder injection molding process, Patent No. US5002998.
[86] R.W. Ohnsorg, Composition and process for injection molding ceramic materials, Patent No.
US4144207.
[87] R.E. Wiech, Manufacture of parts from particulate material, Patent No. US4197118.
[88] K. Roetenberg, R. Raman, C. Whitman, I. Snider and R.M. German, “Optimization of the
Mixing Process for Powder Injection Molding”, Powder Injection Molding Symposium, Princeton, NJ:
Metal Powder Industries Federation, 1992, pp. 119-130.
[89] J.H. Song and J.R.G. Evans, Flocculation after injection moulding in ceramic suspensions. J.
Mater. Res., Volume 9, Issues 9, 1994, pp. 2386-2397.
[90] Liu, D.-M. and W.J. Tseng, Influence of debinding rate, solid loading and binder formulation on
the green microstructure and sintering behaviour of ceramic injection mouldings. Ceramics International,
Volume 24, Issues 6, 1998, pp. 471-481.
[91] Zhu, B., X. Qu, and Y. Tao, Mathematical model for condensed-solvent debinding process of PIM.
Journal of Materials Processing Technology, Volume 142, Issue 2, 2003, pp. 487-492.
[92] Honek, T., B. Hausnerova, and P. Saha, Relative viscosity models and their application to
capillary flow data of highly filled hard-metal carbide powder compounds. Polymer Composites,
Volume 26, Issue 1, 2005, pp. 29-36.

Bibliography
116
[93] C. Karatas, A. Kocer, H. I. Ünal and S. Saritas, Rheological properties of feedstocks prepared
with steatite powder and polyethylene-based thermoplastic binders, Journal of Materials Processing
Technology, Volume 152, Issue 1, 2004, pp. 77-83.
[94] J.J. Reddy, N. Ravi and M. Vijayakumar, A simple model for viscosity of powder injection
moulding mixes with binder content above powder critical binder volume concentration, Journal of the
European Ceramic Society, Volume 20, Issue 12, 2000, pp. 2183-2190.
[95] M. Khakbiz, A. Simchi and R. Bagheri, Analysis of the rheological behavior and stability of
316L stainless steel–TiC powder injection molding feedstock, Materials Science and Engineering: A,
Volume 407, Issues 1-2, 2005, pp. 105-113.
[96] X. Kong, C. Quinard, T. Barrière and J. C. Gelin, Mixing and Characterisation of stainless steel
316L feedstock, International Journal of Material Forming, Volume 2, Supplement 1, 2009, pp. 709-712.
[97] X. Kong, T. Barriere and J. C. Gelin, Investigations on sintering of 316L stainless steel powders
and identification of physical parameters from coupling experiments and finite element simulations,
International Journal of Powder Metallurgy, May/June, 2010, pp. 61-72.
[98] M. Bousmina, A. Ait-Kadi and J. B. Faisant, Determination of shear rate and viscosity from
batch mixer data, Journal of Rheology, Volume 43, Issue 2, 1999, pp.415-433.
[99] Y. Li, L. Li and K.A. Khalil, Effect of powder loading on metal injection molding stainless steels,
Journal of Materials Processing Technology, Volume 183, Issues 2-3, 2007, pp. 432–439.
[100] T. Jardiel, M.E. Sotomayor, B. Levenfeld, and A. Várez, Optimization of the Processing of 8-
YSZ Powder by Powder Injection Molding for SOFC Electrolytes, International Journal of Applied
Ceramic Technology, Volume 5, Issue 6, 2008, pp. 574 – 581.
[101] G. Aggarwal, S. J. Park and I. Smid, Development of niobium powder injection molding: Part I.
Feedstock and injection molding, International Journal of Refractory Metals & Hard Materials, Volume
24, Issue 3, 2006, pp. 253–262.
[102] Y. Li, B. Huang and X. Qu, Viscosity and melt rheology of metal injection molding feedstocks,
Powder Metall., Volume 42, Number 1, 1999, pp.86-90.
[103] X. Chen, Y. C. Lam, Z. Y. Wang and K. W. Tan, Determination of phenomenological constant
of shear-induced particle migration model, Comput. Mater. Sci., Volume 30, Issues 3-4, 2004, pp.223-
229.
[104] C.I. Chung, B.O. Rhee, M.Y. Cao and C.X. Liu. Requirements of binder for powder injection
molding. Compend Met Inject Molding, Volume 2, 1989, pp. 67– 72.
[ 105 ] V. Piotter, W. Bauer, T. Benzler and A. Emde, Injection molding of components for
microsystems. Microsyst Technol, Volume 7, 2001, pp. 99– 102.

Bibliography
117
[106] H. Berthiaux, V. Mosorov, L. Tomczak, C. Gatumel and J.F. Demeyre, Principal component
analysis for characterising homogeneity in powder mixing using image processing techniques, Chemical
Engineering and Processing, Volume 45, Issue 5, 2006, pp. 397-403.
[107] W. Yang, K. Yang and M.H. Hon, Effects of PEG molecular weights on rheological behavior of
alumina injection molding feedstocks, Materials Chemistry and Physics, Volume 78, Issue 2, 2003, pp.
416-424.
[108] C.G. Kukla, Micro injection molding, Int. J. of Forming Processes, Volume 4, Issues 3-4, 2001,
pp. 253-269.
[109] T. Osada, K. Nishiyabu, Y. Karasaki, S. Tanaka and H. Miura, Investigations on the variation
of feedstock properties in Micro MIM Products, Powder injection molding, Penn State College, Ed. by
R.M. German, Pennsylvannia, USA, 2003, pp. 1-11.
[110] A.C. Rota, F. Petzoldt and P. Imgrund, Micromolding of advanced material combinations,
Powder injection molding, Penn State College, Ed. by R.M. German, Pennsylvannia, USA, 2003, pp. 1-
18.
[111] D.F. Heaney, P. Suri and R.M. German, Defect-free sintering of two material powder injection
molded components, Journal of Materials Science, 2003, Volume 38, Number 24, pp. 4869–4874.
[112] T.L. Lin and L.W. Hourng, Investigation of wick debinding in metal injection molding:
numerical simulations by the random walk approach and experiments, Advanced Powder Technology,
Volume 16, Issue 5, 2005, pp. 495-515
[113] S.A. Matar, M.J. Edirsinghe, Diffusion of degradation products in ceramic moldings during
pyrolysis: Effect of Geometry, J.R.G. Evans and E.H. Twizell, Journal of the American Ceramic Society,
Volume 79, Issue 3, 1996, pp. 749-755.
[114] M.J. Cima, J.A. Lewis and A.D. Devoe, Binder Distribution in Ceramic Greenware During
Thermolysis, Journal of the American Ceramic Society, Volume 72, Issue 7, 1989, pp. 1192–1199.
[115] H.H. Angermann, F.K. Yang and O.V. Biest, Removal of low molecular weight components
during thermal debinding of powder compacts, Journal of the American Ceramic Society Volume 72,
Issue 7, 1989, pp. 1192–1199.
[ 116 ] R.M. German, Theory of thermal debinding, International Journal of Powder Metallurgy
(Princeton, New Jersey), Volume 23, Issue 4, 1987, pp. 237-245.
[117] Y. Li, X. Qu and B. Huang, Thermal debinding and model for the wax-based MIM binder of
multi-polymer components, Jinshu Xuebao/Acta Metallurgica Sinica, Volume 35, Issue 2, 1999, pp.
167-171.
[118] Y. Li, S. Liu, X. Qu and B. Huang, Thermal debinding processing of 316L stainless steel
powder injection molding compacts, Journal of Materials Processing Technology, Volume 137, Issues
1-3, 2003, pp. 65-69

Bibliography
118
[119] E.S. Thian, N.H. Loh, K.A. Khor and S.B. Tor, Effects of debinding parameters on powder
injection molded Ti-6Al-4V/HA composite parts, Advanced Powder Technology, Volume 12, Issue 3,
2001, pp. 361-370.
[120] D.W.V. Krevelen, Properties of Polymers (Third edition), 1990, Amsterdam.
[121] D.F. Haeney, T.J. Mueller and P.A. Davies, Mechanical properties of metal injection moulding
316L stainless steel using both prealloy and master alloy techniques, Powder Metallurgy, Volume
47, Number 4, 2004, pp. 367-373(7).
[122] R.M. German, Sintering theory and practice, 1996, J. Wiley and Sons, New York.
[123] J. Rawers, F. Croydon, R. Krabbe and N. Duttlinger, Tensile characteristics of nitrogen
enhanced powder injection moulded 316L stainless steel, Powder Metall., Volume 39, Number 2, 1996,
pp. 125.
[124] R.P. Koseski, P. Suri, N.B. Earhardt, R.M. German and Y.S. Kwon, Microstructural evolution
of injection molded gas- and water-atomized 316L stainless steel powder during sintering, Materials
Science and Engineering A, Volume 390, Issues 1-2, 2005, pp. 171-177.
[125] C. H. Ji, N. H. Loh, K. A. Khor and S. B. Tor, Sintering study of 316L stainless steel metal
injection molding parts using Taguchi method: final density, Materials Science and Engineering A,
Volume 311, Issues 1-2, 2001, pp. 74-82.
[126] L. Cai and R.M. German, Powder Injection Molding Using Water Atomized 316L Stainless
Steel, Int. J. of Powder Metallurgy, Volume 31, Number 3, 1995, pp. 257-264.
[127] N. H. Loh and R. M. German, Statistical analysis of shrinkage variation for powder injection
molding, Journal of Materials Processing Technology, Volume 59, Issue 3, 1996, pp. 278-284.
[128] T. Kraft and H. Riedel, Numerical simulation of solid state sintering; model and application,
Journal of the European Ceramic Society, Volume 24, Issue 2, 2004, pp. 345-361.
[129] G.C. Kuczynski, Self diffusion in sintering of metallic particles. Met. Trans., 185, 1949, pp. 169–
178.
[130] A. Luque, J. Aldazabal, J.M. Martínez-Esnaola, A. Martín-Meizoso, J. Gil Sevillano, and
R.S. Farr, Geometrical Monte Carlo model of liquid-phase sintering, Mathematics and Computers in
Simulation, Volume 80, Issue 7, 2010, pp. 1469-1486.
[131] R.L. Coble, Sintering of crystalline solids. I. Intermediate and final state diffusion models,
Journal of Applied Physics, Volume 32, Issue 5, 1961, pp. 787–792.
[132] W.D. Kingery, and M. Berg, Study of the initial stages of sintering of solids by viscous flow,
evaporation-condensation and self-diffusion. Journal of Applied Physics, Volume 26, Issue 10, 1955, pp.
1205–1212.
[133] J.K. Mackenzie and R. Shuttleworth, A phenomenological theory of sintering. Proceedings of
the Physical Society. Section B, Volume 62, Number 12, 1949, pp. 833–852.

Bibliography
119
[ 134 ] D.L. Johnson, New method for obtaining volume, grainboundary, and surface diffusion
coefficients from sintering data. Journal of Applied Physics, Volume 40, Issue 1, 1969, pp. 192-200.
[135] V.W. Skorokhod and S. M. Solonin, Sov. Powder Metall. Met. Ceram. 1972, 141.
[136] M.F. Ashby, A first report on sintering diagrams, Acta Metallurgica, Volume 22, Issue 3, 1974,
pp. 275-289.
[137] W. Beere, The second stage sintering kinetics of powder compacts, Acta Metallurgica, Volume
23, Issue 1, 1975, pp. 139-145.
[138] G.W. Scherer, Sintering of low-density glasses, Journal of the American Ceramic Societ,
Volume 60, Issue 5-6, 1977, pp. 236–239.
[139] H.E. Exner, Principles of single phase sintering, In Reviews on Powder Metallurgy and Physical
Ceramics, Vol. 1,. Freund Publishing House, Tel Aviv, 1979.
[140] H.E. Exner, Solid-state sintering: critical assessment of theoretical concepts and experimental
methods. Powder Metall. Int., Volume 23, Issue 4, 1980, pp. 203–209.
[141] H. E. Exner and E. Arzt, Sintering processes. In Physical Metallurgy, 4th edn. Vol. 3, ed. R. W.
Cahn and P. Haasen. Elsevier Science, Amsterdam, 1996, pp. 2628–2662.
[142] H.E. Exner, and T. Kraft, Review on computer simulations of sintering processes, In: Powder
Metallurgy World Congress 1998, Vol. 2. EPMA, Shrewsbury, UK, 1998, pp. 278–283.
[143] W. Schatt, Sintervorgange. VDI-Verlag, Dusseldorf, 1992.
[ 144 ] E.A. Olevsky, Theory of sintering: from discrete to continuum, Materials Science and
Engineering: R: Reports, Volume 23, Issue 2, 1998, pp. 41-100.
[145] W.D. Kingery, Densification during sintering in the presence of a liquid phase. I. Theory.,
Journal of Applied Physics Volume 30, Issue 3, 1959, pp. 301–306.
[146] R.M. German, Liquid Phase Sintering. Plenum Press, New York, 1985.
[ 147 ] A.P. Savitskii, Liquid Phase Sintering of Systems with Interacting Components. Russian
Academy of Sciences, Tomsk, 1993.
[148] R.P. Markondeya, A. Odulena and W.R. Cannon, Anisotropic shrinkage during sintering of
particle-oriented systems numerical simulation and experimental studies, Acta Materialia, Volume 50,
Issue 10, 2002, pp. 2559-2570.
[149] H. Riedel and J. Svoboda, Simulation of microwave sintering with advanced sintering models,
Advances in Microwave and Radio Frequency Processing 2006, Part III, 210-216, DOI: 10.1007/978-3-
540-32944-2_23.
[150] A. Mawardi and R. Pitchumani, Simulation of sintering of nanoparticulate micropreforms in a
microfabrication process, Acta Materialia, Volume 57, Issue 6, 2009, pp. 1975-1987.
[ 151 ] R.M. McMeeking, and L.T. Kuhn, A diffusional creep law for powder compacts, Acta
Metallurgica Et Materialia, Volume 40, Issue 5, 1992, pp. 961-969.
Bibliography
120
[152] M. Braginsky, V. Tikare and E. Olevsky, Numerical simulation of solid state sintering,
International Journal of Solids and Structures, Volume 42, Issue 2, 2005, pp. 621-636.
[153] D. Walgraef and E.C. Aifantis, Plastic instabilities, dislocation patterns and nonequilibrium
phenomena, Res Mechanica, Volume 23, Issue 2-3, 1988, pp. 161-195 .
[154] L.P. Kubin and Y. Estrin, Evolution of dislocation densities and the critical conditions for the
Portevin–Lechatelier effect, Acta Metallurgica et Materialia, Volume 38, Issues 5, pp. 697–708.
[ 155 ] G. Ananthakrishna, Formation, propagation of bands and chaos in Jerky flow, Scripta
Metallurgica et Materialia, Volume 29, Issue 9, 1993, pp. 1183-1188.
[156] M.V. Glazov and C. Laird, Size effects of dislocation patterning in fatigued metals, Acta
Metallurgica et Materialia, Volume 43, Issue 7, 1995, pp. 2849-2857.
[ 157 ] D. Lance, F. Valdivieso and P Goeuriot, Correlation between densification rate and
microstructural evolution for pure alpha alumina, Journal of the European Ceramic Society, Volume 24,
Issue 9, 2004, pp. 2749-2761.
[158] C. Nivot and F. Valdivieso, Microstructure refinement of alumina: Optimisation by gas pressure
sintering process, Ceramics International, Volume 34, Issue 7, 2008, pp. 1595-1602.
[159] M. Gasik and B. Zhang, A constitutive model and FE simulation for the sintering process of
powder compacts, Computational Materials Science, Volume 18, Issue 1, 2000, pp. 93-101.
[160] J. Song, T. Barriere, B. Liu, J.C. Gelin and G. Michel, Experimental and numerical analysis on
sintering behaviours of injection moulded components in 316L stainless steel powders, Powder
Metallurgy, Volume 53, Number 4, pp. 295-304.
[161] R.L. Coble, A model for boundary diffusion controlled creep in polycrystalline mater- ials, J.
Appl. Phys., Volume 34, Number 6, 1963, pp. 1679-1682.
[162] R.K. Bordia and G.W. Scherer, On constrained sintering-I Constitutive model for a sintering
body, Acta Materialia, Volume 36, Number 9, 1988, pp. 2393-2397.
[163] F.R.N. Nabarro, Creep at very Low Rates, Metall. Mater. Trans. A., Volume 33A, Number 153,
2002, pp. 213-218.
[ 164 ] M. Dutilly, O. Ghouati and J.C. Gelin, Finite-element analysis of the debinding and
densification phenomena in the process of metal injection molding, Journal of Materials Processing
Technology, Volume 83, Issues 1-3, 1998, pp. 170-175.
[165] R. Zhang and R.S. Engel, N.J. Salamon, R.M. German, Simulation of free sintering shrinkage
and distortion behavior of stainless steel powder compacts, Proceedings of the 2002 International
Conference on Process Modeling in Powder Metallurgy&Particulate Materials, Newport Beach, CA,
October 28–29, 2002.
[166] R.K. Bordia and G.W. Scherer, On constrained sintering-I Constitutive model for a sintering
body, Acta Materialia, Volume 36, Number 9, 1988, pp. 2393-2397.

Bibliography
121
[167] J. Song, Experiments, Modelling and Numerical Simulation of the Sintering Process for Metallic
or Ceramic Powders, Ph.D. Thesis, University of Franche-Comté and Southwest Jiaotong University,
2007.
[168] A. Peterson and J. Agren, Constitutive behavior of WC-Co materials with different grain size
sintered under load, Acta Materialia, Volume 52, Issue 7, 2004, pp. 1847-1858.
[169] D.C. Blaine, R. Bollina, S.J. Park and R.M. German, Critical use of video-imaging to
rationalize computer sintering simulation, Computers in industry, Volume 56, Number 9, 2005, pp. 867-
875.
[170] C. Quinard, J. Song, T. Barriere and J.C. Gelin, Elaboration of PIM feedstocks with 316L fine
stainless steel powders for the processing of micro-components, Powder Technology, In Press,
Corrected Proof, Available online 26 August 2010.
[171] O. Lame, D. Bouvard and H. Wiedemann, Anisotropic shrinkage gravity induced creep during
sintering of steel powder compacts, Powder Metall., Volume 45, Number 2, 2002, pp. 181-185.
[172] A. Vagnon, D. Bouvard and G. Kapelski, An anisotropic constitutive model for simulating the
sintering of stainless steel powders compacts, Technology & Applications of Sintering, Proceedings of
the 4th International Conference on the Science, Grenoble, France, August 29-September 1, 2005, pp.
232-235.
[ 173 ] J. Svoboda, H. Riedel and H. Zipse, Equilibrium pore surfaces, sintering stresses and
constitutive equations for intermediate and late stages of sintering-Part I: Computation of equilibrium
surfaces, Acta Metallurgica et Materialia, Volume 42, Issue 2, 1994, pp. 435-443.
[ 174 ] H. Riedel and J. Svoboda, Equilibrium pore surfaces, sintering stresses and constitutive
equations for intermediate and late stages of sintering-Part II: Diffusional densification and creep, Acta
Metallurgica et Materialia, Volume 42, Issue 2, 1994, pp. 445-452.
[175] J.C. Lagarias, J.A. Reeds, M.H. Wright and P.E. Wright, Convergence Properties of the
Nelder-Mead Simplex Method in Low Dimensions, SIAM Journal of Optimization, Volume 9, Number
1, 1998, pp. 112-147.
[176] T. Kraft and H. Riedel, Numerical simulation of solid state sintering; model and application,
Journal of the European Ceramic Society, Volume 24, Issue 2, 2004, pp. 345-361.
[177] K. Mori, Finite element simulation of nonuniform shrinkage in sintering of ceramic powder
compact, In Numerical Methods in Industrial Forming Processes, Numiform 92, ed. J. L. Chenot, R. D.
Wood and O. C. Zienkiewicz. A.A. Balkema, Rotterdam, 1992, pp. 69–78.
[178] K.Y. Sanliturk, I. Aydin and B.J. Briscoe, A finite-element approach for the shape prediction of
ceramic compacts during sintering, J. Am. Ceram. Soc., Volume 82, Issue 7, 1999, pp. 1748–1756,
[ 179 ] E. Doege, A. Bagaviev and K. Hanini, FEM Simulation der Prozessschritte
Pulverpressen/Sintern. Mat.-wiss. Werkstofftech, Volume 32, Issue 1, 2001, pp. 57–61.

Bibliography
122
[180] T. Kraft, H. Riedel, P. Stingl, and F. Wittig, Finite element simulation of die pressing and
sintering, Adv. Engng. Mater., Volume 1, Issue 2, 1999, pp. 107–109.
[181] T. Kraft and H. Riedel, Numerical simulation of die compaction and sintering, Powder Metall,
Volume 45, Number 3, 2002, pp. 227-231(5).
[182] J.C. Gelin, T. Barriere, J. Song and B. Liu, Experimental Investigations and Numerical
Modelling of Sintering Process for 316L Stainless Steel MIM Components, International Conference on
Powder Injection Molding of Metals, Ceramics and Carbides, 20-22 March 2006, Florida, USA.
[183] R. Zhang, R.S. Engel, N.J. Salamon and R.M. German, Simulation of free sintering shrinkage
and distortion behavior of stainless steel powder compacts, 2002 International Conference on Process
Modeling in Powder Metallurgy & Particulate Materials, Oct. 28-29, 2002, Newport Beach, CA.
[184] E.A. Olevsky and R.M. German, Effect of gravity on dimensional change during sintering-І
shrinkage anisotropy, Acta Mater., Volume 48, Issue 5, 2000, pp. 1153-1166.
[185] E.A. Olevsky, R.M. German and A. Upadhyaya, Effect of gravity on dimensional change
during sintering- Π shape distortion, Acta Mater., Volume 48, Issue 5, 2000, pp. 1167-1180.
[186] R.M. German, Powder Injection Molding, MPIF, 1990, Princeton, NJ.