FLY ASH FIELD SECTION 1018 TABLE 1 QUALIFIED FLY ASH SOURCES

Development and Characterization of Fly ash
Based Ceramic Membranes for the Separation
of Oil-in-Water Emulsions
Kanchapogu Suresh

ii

iii
Development and Characterization of Fly ash
Based Ceramic Membranes for the Separation
of Oil-in-Water Emulsions
Thesis
Submitted in partial fulfillment of the
requirements for the degree of
DOCTOR OF PHILOSOPHY
by
Kanchapogu Suresh
Roll No.: 126107004
Department of Chemical Engineering
Indian Institute of Technology, Guwahati
Guwahati-781039
October, 2016

iv

v
Dedication
To My Family

vi

vii
CERTIFICATE
It is certified that the work contained in the thesis entitled “Development and
Characterization of Fly ash based Ceramic Membranes for the Separation of Oil-in-
Water Emulsions” by Kanchapogu Suresh has been carried out under my supervision and
that this work has not been submitted elsewhere for a degree.
Date: (Dr. G. Pugazhenthi)
Professor
Department of Chemical Engineering
Indian Institute of Technology Guwahati
Guwahati-781039, India.
.
Department of Chemical Engineering
Indian Institute of Technology Guwahati
Guwahati - 781039 (INDIA)

viii

ix
Acknowledgement
I would like to make my deepest appreciation and gratitude to Prof. G. Pugazhenthi for his
invaluable guidance, constructive criticism and encouragement during my thesis work. I must
say I am blessed to have he as my supervisor. My most heartfelt thanks to Prof. Ramgopal
V. S. Uppaluri for his kind help, suggestions and constant encouragement in writing
manuscripts as well as editing the thesis files of my research work within stipulated short
period of time.
My sincere acknowledgement goes to Prof. V.S. Moholkar and Prof. B. P. Mandal, former
and present Heads of Chemical Engineering Department. I thank them for their
encouragement, guidance, and support from the initial to the final stages of my PhD work. I
am also indebted to the members of Doctoral Committee Prof. B. P. Mandal, Dr. Nanda
Kishore, of the Department of Chemical Engineering and Prof. K. Pakshirajan of the
Department of Biosciences and Bioengineering, for their precious suggestions about critical
issues related to my work.
I am also thankful to Dr. Senthil Kumar of Department of Biosciences and Bioengineering,
who have made me learn working with Design-Expert® Software Version 9, and for his
continuous motivation and support during analysis of experimental results using Response
Surface Methodology (RSM).
Acknowledgement is made to all my well-wishers both faculty and students of Indian
Institute of Technology Guwahati for their support, encouragement and critique. I also
acknowledge the financial support provided by IIT Guwahati.
Contact angle instrument used in this work was financially supported by a grant for Center of
Excellence for Sustainable Polymers at IIT Guwahati from Department of Chemicals &
Petrochemicals, Ministry of Chemicals and Fertilizers, Government of India. XRD, used in
this work, was financially supported by a FIST grant (SR/FST/ETII-028/2010) from the
Department of Science and Technology (DST), Government of India.

x
I am also deeply grateful to the scientific officers Dr. K. K. Senapati and Mr. K. K. Singh,
Scientific Officers, at the Central Instruments Facility of IIT Guwahati for allowing me to
carry out SEM analysis on my own. I am also grateful to the Mr. B. Choudhury of Central
Workshop, IIT Guwahati for helping me in the fabrication of my experimental setup which
was very much essential in my research work.
I would like to extend my sincere thanks to all my beloved friends Mr. Mood Mohan, Mr.
Tekula Srinu, Mr. Rajasekhar Ravula, Dr. Kamal Kumar Bhatluri, Mr. Bandi Chandra
Sekhar, Mr. V Shyam Kumar Yadav, Mr. Rahul Patwa, for helping me in experimental work
and for their involvement in the discussions about research problems and Mr. Tharun Dolla,
Mr. Ramesh Pallekonda, Mr. Kankipati Kiran Kumar, Mr. Naveen, Mr. Rahul, for their help
in proof reading of my thesis. I am also thankful to my Lab mates i.e., Dr. Ashim Kumar
Basumathary, Mr. Manish Kumar, Mr. Kelothu Suresh, Mr. Vinoth Kumar, Mr. Mohan and
lobby mates i.e., Mr. Binay Deogam, Mr. Kishant Kumar, Mr. Prudhvi Raj, Mr. Bisweswar
Das, Mr. Abhik Bhattacharjee, Mr. Rupak Kishore with whom I have come in contact during
my stay at IIT Guwahati. The friendship and unforgettable attachments shared with them has
made my life pleasant. I am also thankful to summer internship students namely Mr.
Manpadu Ramesh, Ms. Priyanka Kumari, Ms. Monikangkana Talukdar, for their wonderful
support during the experimental investigations. I extend my indebted gratitude towards the
church, with whom I cherished my good times, for their support and encouragement in all
tough times and most of all their prayers for me and my project.
A special thanks to my family. Words cannot express how grateful I am to my mother, father,
sisters and brothers for all of the sacrifices that they’ve made on my behalf. Their prayer for
me was what sustained me this far. Finally I thank my God, my good Father, for letting me
through all the difficulties. I have experienced your guidance day by day. You are the one
who let me finish my degree. I will trust you in future as well. Thank you, Lord.
October, 2016
IIT Guwahati
(Kanchapogu Suresh)

xi
Abstract
Liquid Considering the available prior art in the field of inexpensive ceramic and titania
membranes and their applicability for oil-in-water emulsions treatment, this work addresses
experimental and theoretical investigations in four major themes namely:
Fly ash based inexpensive ceramic membrane fabrication and characterization
Dead end and Cross flow microfiltration (MF) of oil-in-water emulsions using
inexpensive ceramic membranes
Fabrication of titania-fly ash composite membranes for oil-in-water emulsion
treatment
Response surface methodology for the parametric optimization of inexpensive
ceramic membrane based dead end and cross-flow MF of oil-in-water emulsions.
From a novelty perspective, the Ph.D thesis can be summarized as follows:
a) Dead end oil-in-water MF studies with low cost ceramic membranes possessing
lower average pore size (1.32–2.97 µm).
b) Dead end MF studies with fly ash based inexpensive ceramic membranes
(1.30–1.44 µm) using synthetic oil-in-water emulsions (50–200 mg/L feed
concentration).
c) Cross flow MF investigations with lower pore size inexpensive membranes and lower
feed concentration (50–200 mg/L) and subsequent parametric optimality
investigations using RSM.
d) Performance enhancement of ceramic membranes by titania coating via hydrothermal
method and their comparative assessment in MF of oil-in-water emulsions with
conventional low cost ceramic membranes.

xii
The first phase of the Ph.D. thesis involved the fabrication of inexpensive mixed clays based
membranes (SP1–SP4) using uni-axial dry compaction method in which the SP4 membrane
provided 99.2% oil rejection and 4.1×10⁻⁸ m3/m2 s flux at 69 kPa and 200 mg/L feed
concentration. Further, new compositions have been identified that refer to maximum
constitution of fly ash in the M1-M3 membranes fabricated with uni-axial dry compaction
method. Membrane characterization was conducted using thermo gravimetric analysis (TGA)
field emission scanning electron microscopy (FESEM), X-ray diffraction (XRD) analysis, N2
permeation studies. The M1-M3 membranes have been evaluated to possess 1.30 – 1.44 µm
average pore size and 30 – 43% average porosity.
Among M1-M3 membranes, M2 membrane provided optimal flux and rejection of 2×10⁻⁴
m3/m2 s and 98.47%, respectively for 345 kPa pressure differential and 200 mg/L initial oil
concentration. The RSM based optimization of dead end MF process with M2 membrane
inferred that the optimal flux and rejection values are 2.6×10⁻⁴ and 96.94%, respectively for
345 kPa applied pressure and 176.07 mg/L feed concentration.
Cross-flow MF studies carried out with titania-fly ash composite membrane provided better
performance in comparison with the M2 membrane. During cross flow MF conducted at 207
kPa applied pressure, 0.1769 m/s cross flow velocity and 200 mg/L feed concentration, the
titania fly ash membrane provided an optimal flux and rejection of 42.85×10⁻⁴ m3/m2 s and
98.82% respectively, which are marginally better than those provided by the M2 membrane
(40.9×10⁻⁴ m3/m2 s and 98.37%, respectively). The RSM based analysis inferred similar
insights on parametric optimality.
For comparative purposes, clay, titania-clay and γ-Al2O3-clay composite membranes were
prepared with clay, TiCl4 and AlCl3 as source material and hydrothermal method for
asymmetric membrane fabrication. During dead end MF of oil-in-water emulsions (50-250
mg/L feed concentration), the titania-clay membrane provided optimal flux and rejection of

xiii
8.481×10⁻⁵ m3/m2 s and 98.96%, respectively at 69 kPa and 200 mg/L of oil concentration.
On the other hand, corresponding optimal flux and rejection of γ-Al2O3-clay composite
membrane (0.97 µm pore size) are 6.119×10⁻⁵ m3/m2 s and 98.46%, respectively.
Further, during cross flow MF with 200 mg/L feed concentration, among titania-clay and clay
membranes, titania-clay membrane provided optimal combinations of membrane flux
(186.60×10⁻⁶ m3/m2 s) and rejection (99.56%) at 207 kPa applied pressure and 0.1769 m/s
cross flow velocity. Corresponding flux and rejection values for clay membrane have been
determined to be 87.08×10⁻⁶ m3/m2 s and 93.24%, respectively.
Among all membranes, titania-fly ash composite membranes provided best performance for
oil-in-water emulsion treatment. For 100 mg/L feed concentration, 207 kPa applied pressure
and 0.1769 m/s cross flow velocity, the titania-fly ash composite membrane provided an
optimal flux of 51.6372×10⁻⁴ m3/m2 s, which was higher than that obtained with M2
membrane (49.97×10⁻⁴ m3/m2.s). For higher feed concentration of 200 mg/L, applied pressure
of 207 kPa and cross flow velocity of 0.1769 m/s, the titania-fly ash composite membrane
provided flux and rejection of 42.85×10⁻⁴ m3/m2.s and 98.82%, respectively, which were
higher than those provided by TiO2-clay composite membrane (1.86×10⁻⁴ m3/m2 s and
99.56% rejection). Hence, titania-fly ash composite membrane fabricated with M2 membrane
as support is inferred to be the best for oil-in-water emulsion treatment. From the perspective
of available prior-art, this inference is significant, given the fact that there has not been any
literature that refers to the optimality of titania-fly ash composite membranes for oil-in-water
emulsion treatment.
Conceptual retail cost analysis (inclusive chemical, electrical, labor, etc.,) of the fabricated
low cost ceramic membrane (M1-M3) indicated that their cost is about 462-465 $/m2,
respectively. Thus, it has been inferred from cost analysis that the membranes are 3-5 times
inexpensive than other ceramic membranes.

xiv
In summary, the Ph.D thesis highlights the relevance and promising opportunities for fly ash
based low cost ceramic membranes towards oil-in-water emulsion filtration. In addition, the
thesis provides useful insights into the fabrication engineering aspects of low cost TiO2
composite membranes. The commercial application of fly ash and fly ash composite
membranes needs to be further investigated using industrial oil-in-water emulsions in the near
future to translate the utility of waste material such as fly ash as a value added product in
separation process technologies.

xv
Contents
Page
No.
Dedication v
Certificate vii
Acknowledgement ix
Abstract xi
List of tables xxiii
List of figures xxvii
Nomenclature xxxiii
Chapter –1
Introduction and literature review
1-52
1.1 Fly ash material 3
1.1.1 History 3
1.1.2 Physical Properties 4
1.1.3 Chemical Properties 5
1.1.4 Applications 7
1.2 Overview of Membrane Processes 9
1.2.1 Materials based classification 10
1.2.2 Separation process based classification 12
1.2.3 Industrial applications of membrane technology 14
1.2.4 Polymeric membranes 15

xvi
1.2.5 Ceramic membranes 16
1.2.6 Ceramic membrane fabrication methods 16
1.3 State-of-the-art 18
1.3.1 Preparation of ceramic membrane supports 18
1.3.2 Preparation of composite membranes 25
1.3.3 Literature review for titania coating on ceramic membrane
support
30
1.3.4 Ceramic membrane based microfiltration of oil-in-water
emulsions
33
1.3.5 Response Surface Methodology 41
1.4 Possible scope for further research 45
1.4.1 Preparation, characterization and application of ceramic
membranes from mixed clays
45
1.4.2 Preparation, characterization, optimization and application of low
cost fly ash based ceramic membranes
46
1.4.3 Preparation, characterization and application of TiO2-Fly ash
composite membranes
47
1.4.4 Response Surface Methodology for the MF performance of
membranes
48
1.4.5 Preparation, characterization and application of TiO2-clay,
γ-Al2O3-clay and clay membranes
49
1.4.6 Cross flow microfiltration studies for TiO2-clay and clay
membranes
50
1.5 Objective of the thesis 50
1.6 Organization of the thesis 51

xvii
Chapter –2
Materials and methods
53-79
2.1 Preparation, characterization and application of ceramic membranes
from mixed clays
55
2.1.1 Starting materials 55
2.1.2 Fabrication 56
2.1.3 Characterization 59
2.1.3.1 Particle size distribution (PSD) 59
2.1.3.2 X-Ray diffraction analysis (XRD) 59
2.1.3.3 Field emission scanning electron microscope (FESEM) 59
2.1.3.4 Porosity 60
2.1.3.5 Mechanical strength 61
2.1.3.6 Chemical stability 61
2.1.4 Dead end Microfiltration 61
2.1.4.1 Experimental set up 61
2.1.4.2 Hydraulic permeability and average pore size of
membranes
62
2.1.4.3 Dead end MF of oil-in-water emulsions 64
2.1.4.4 Membrane cleaning 65
2.2 Preparation, characterization, optimization and application of low cost
fly ash based ceramic membranes
65
2.2.1 Membrane fabrication 65
2.2.2 Characterization 66
2.2.3 Dead end flow microfiltration experiment 68

xviii
2.2.4 RSM based simulation studies 68
2.3 Preparation, characterization and application of TiO2-Fly ash composite
membranes
70
2.3.1 Synthesis of TiO2-Fly ash composite membrane 70
2.3.2 Characterization 71
2.3.3 Cross flow microfiltration 71
2.3.3.1 Experimental set up 71
2.3.3.2 Microfiltration Tests 73
2.3.4 RSM modelling studies 73
2.4 Preparation, characterization and application of TiO2-clay, γ-Al2O3-clay
composite and clay membranes
75
2.4.1 Materials 75
2.4.2 Preparation of membranes 75
2.4.3 Characterization 76
2.4.4 Dead end microfiltration of oil-in-water emulsions 77
2.5 Cross Flow MF studies for TiO2-Clay and clay membranes 77
2.5.1 Cross flow MF tests 78
2.5.2 Membrane fouling analysis 78
Chapter –3
Preparation, characterization and application of ceramic membranes
from mixed clays
81-98
3.1 Overview 83
3.2 Results and Discussion 83

xix
3.2.1 Particle size distribution (PSD) 83
3.2.2 XRD analysis 85
3.2.3 FESEM analysis 88
3.2.4 Porosity 89
3.2.5 Chemical stability 90
3.2.6 Mechanical strenghth 91
3.2.7 Hydraulic permeability and average pore size of membranes 91
3.2.8 Separation of oil-in-water emulsion 94
3.2.9 Cost estimation 96
3.3 Summary 98
Chapter –4
Preparation, characterization, optimization and application of low cost
fly ash based ceramic membranes
99-142
4.1 Overview 101
4.2 Results and discussion 102
4.2.1 Particle size distribution 102
4.2.2 Thermo gravimetric analysis 103
4.2.3 XRD 104
4.2.4 Porosity 105
4.2.5 Chemical stability 105
4.2.6 Flexural strength 106
4.2.7 SEM analysis 106

xx
4.2.8 Water flux and Hydraulic permeability 107
4.2.9 Dead end MF oil-in-water emulsion 110
4.2.10 Cost estimation 115
4.2.11 Process model 118
4.2.11.1 ANOVA analysis and quadratic model fitness 122
4.2.11.2 ANOVA for rejection 126
4.2.11.3 Response surface and contour plots 130
4.2.11.4 Process optimization 140
4.3 Summary 142
Chapter –5
Preparation, characterization and application of TiO2-Fly ash
composite membranes
143-178
5.1 Overview 145
5.2 Results and discussion 146
5.2.1 Contact angle and FESEM micrographs 146
5.2.2 Average porosity and FESEM based pore size 149
5.2.3 Droplet size distributions 149
5.2.4 Water flux 151
5.2.5 Cross-flow MF of oil-in-water emulsions 152
5.2.5.1 Effect of applied pressure 152
5.2.5.2 Effect of cross flow rate 155
5.2.5.3 Performance indices 159

xxi
5.2.6 ANOVA analysis 164
5.2.6.1 Validation of predicted response at the optimum
condition
177
5.3 Summary 177
Chapter –6
Preparation, characterization and application of TiO2-clay,
γ-Al2O3-clay composite and clay membranes
179-205
6.1 Overview 181
6.2 Results and discussion 181
6.2.1 Particle size distribution (PSD) 181
6.2.2 N2 adsorption-desorption isotherm 182
6.2.3 Thermo gravimetric analysis (TGA) 184
6.2.4 FTIR 185
6.2.5 XRD analysis 187
6.2.6 Porosity 189
6.2.7 FESEM images of the membrane 190
6.2.8 Water flux and hydraulic permeability 195
6.2.9 Dead end MF of oil-in-water emulsions 196
6.2.9.1 Effect of applied pressure on oil separation 197
6.2.9.2 Effect of feed concentration on oil separation 198
6.4 Summary 205

xxii
Chapter –7
Cross flow microfiltration studies for TiO2-clay and clay membranes
207-224
7.1 Overview 209
7.2 Results and discussion 209
7.2.1 Determination of pure water flux in cross flow mode 209
7.2.2 Cross-flow microfiltration of oil-in-water emulsions 211
7.2.3 Analysis of fouling 219
7.3 Summary 224
Chapter-8
Conclusions and Future work
225-230
8.1 Conclusion 227
8.2 Future work 229
References 231-257
List of publications 259
APPENDIX 261

xxiii
List of tables
Table No. Title Page No.
Table 1.1 Physical properties of fly ash 5
Table 1.2 Classification of fly ash by ASTM standards 5
Table 1.3 Classification of fly ash based on European standards EN 450-1 6
Table 1.4 Classification of coal fly ash on chemical composition 7
Table 1.5 Literature data summary for ceramic supports 30
Table 1.6 Literature data for TiO2 based composite membranes 33
Table 1.7 Literature reported data for (a) dead-end and (b) cross flow MF
of oil-in-water emulsions
40
Table 1.8 Response surface methodology based optimization for various
MF processes
44
Table 2.1 Composition of raw materials used for fabrication of ceramic
membranes
56
Table 2.2 Materials used to make ceramic membranes 65
Table 3.1 Particle size distribution of the clay mixtures used to fabricate
membrane (SP1-SP4)
85
Table 3.2 Comparison of oil removal percentage of fabricated membrane
with other membranes
95
Table 3.3 Cost estimation of membranes (SP1-SP4) 97
Table 4.1 Characterization results of fabricated membranes 112
Table 4.2 Comparative study of fabricated membranes 112
Table 4.3 Comparison of oil rejection of fabricated membrane with other
membranes
113

xxiv
Table 4.4 Cost estimation for fabrication of membranes and oil-in-water
emulsion treatment
116
Table 4.5 RSM design and its actual and predicted values for M2
membrane
119
Table 4.6 RSM design and its actual and predicted values for M1
membrane
120
Table 4.7 RSM design and its actual and predicted values for M3
membrane
121
Table 4.8 ANOVA for the permeate flux response surface quadratic model
of M2 membrane
124
Table 4.9 ANOVA for the permeate flux response surface quadratic model
of M1 Membrane
125
Table 4.10 ANOVA for the permeate flux response surface quadratic model
of M3 membrane
126
Table 4.11 ANOVA for the rejection response surface quadratic model of
M2 membrane
128
Table 4.12 ANOVA for the oil rejection response surface quadratic model
of M1 Membrane
129
Table 4.13 ANOVA for the rejection response surface quadratic model of
M3 membrane
130
Table 5.1 Comparison between permeation flux and rejection of the
TiO2-Fly ash composite membrane and M2 membrane in this
work and those reported in the literature
163
Table 5.2 RSM design and its actual and predicted values for TiO2-Fly ash
membrane
166

xxv
Table 5.3 RSM design and its actual and predicted values for M2
membrane
167
Table 5.4 ANOVA for the permeate flux response surface quadratic model
of TiO2-Fly ash membrane
168
Table 5.5 ANOVA for the rejection response surface quadratic model of
TiO2-Fly ash membrane
169
Table 5.6 ANOVA for the permeate flux response surface quadratic model
of M2 membrane
170
Table 5.7 ANOVA for the rejection response surface quadratic model of
M2 membrane
171
Table 6.1 Comparison of membrane performance with other reported
membranes
204
Table 7.1 Comparison study of permeate flux and rejection data of present
work with other membranes published in literature for separation
of oil-in-water emulsion
218
Table 7.2 Model parameters acquired for distinctive pore blocking models
with clay and TiO2–clay composite membrane at three pressures.
(Coefficient of correlation (R2), initial permeate flux (J0) and
slopes (k))
222

xxvi

xxvii
List of figures
Figure No. Figure caption Page No.
Figure 1.1 Classification of synthetic membranes 10
Figure 1.2 Different modes of operation in membrane processes
(F-Feed, P-Permeate, R-Retentate, S-Stream and
M-Membrane
13
Figure 1.3 Flow chart displaying the steps involved in ceramic
membrane preparation by paste method
26
Figure 2.1 (a) Schematic for the preparation of low cost ceramic
membrane supports (SP1-SP4)
57
Figure 2.1 (b) Photograph of hydraulic machine, unsintered membrane,
sintered membrane and polished membrane
58
Figure 2.2 Schematic of dead-end microfiltration setup (1-N2 gas
cylinder, 2-pressure regulator, 3-connecting tube, 4-
pressure gauge, 5-membrane, 6-rubber gasket, 7-top
compartment, 8-bottom base plate, 9-feed inlet and 10-
permeate measuring cylinder)
62
Figure 2.3 Schematic of N2 gas permeation test setup 68
Figure 2.4 Cross flow microfiltration set up 72
Figure 3.1 Particle size distribution of (a) individual raw materials and
(b) powder mixtures used to fabricate membranes
(SP1-SP4)
84
Figure 3.2 XRD of raw materials (a) Titanium dioxide (b) Quartz and
(c) Fly ash (Q- Quartz, A-Anatase, R-Rutile,
C- Corundum)
86

xxviii
Figure 3.3 XRD analysis of powder mixtures used to fabricate of
membranes (SP1-SP4) (Q-Quartz, Ca-Calcium carbonate,
A-Anatase, C-Corundum and Cristobalite, T-Aluminum
Titanate, R-Rutile, CaO- Calcium Oxide)
87
Figure 3.4 FESEM images of the membranes (SP1, SP2, SP3 and
SP4)
88
Figure 3.5 Pore size distribution analysis of the membranes
(SP1-SP4) from FESEM images
89
Figure 3.6 Porosity of membranes from FESEM analysis and
Archimedes principle
90
Figure 3.7 Chemical stability of the membranes (SP1-SP4) in acid 92
Figure 3.8 Flexural strength of the membranes (SP1-SP4) 92
Figure 3.9 Variation of pure water flux of the membranes at different
applied pressure
93
Figure 3.10 Variation of permeate flux and percentage removal of oil at
different applied pressures for SP4 membrane
94
Figure 4.1 Particles size distribution of the membrane powder mixture
(M1-M3)
102
Figure 4.2 TGA graph of the membrane powder mixture (M1-M3) 103
Figure 4.3 XRD analysis of raw material powder mixture (M1-M3)
(Q-Quartz, Ca-Calcium carbonate, CaO-Calcium oxide,
C-Cristobalite and Corundum)
104
Figure 4.4 SEM images of membrane (M1-M3) 108
Figure 4.5 Variation of (a) N2 gas permeate flux (b) pure water flux
with applied pressure for membrane M1-M3
109

xxix
Figure 4.6 Effect of applied pressure and feed concentration on
permeate flux and rejection (M1-M3) ■□-50 mg/L; ●○-100
mg/L; ▲Δ - 150 mg/L; ▼ -200 mg/L (Filled symbol:
Flux, Unfilled symbol: Rejection)
114
Figure 4.7 Response surface plots for permeate flux and oil rejection
of M2 membrane
132
Figure 4.8 Contour plots for combined effects on permeate flux and
rejection of M2 membrane
133
Figure 4.9 Contour plots of permeate flux and rejection for
M1 membrane
134
Figure 4.10 Response surface plots of permeate flux and oil rejection
for M1 membrane
135
Figure 4.11 Contour plots of permeate flux and rejection for
M3 membrane
136
Figure 4.12 Response surface plots of permeate flux and oil rejection
for M3 membrane
137
Figure 4.13 Actual versus predicted values for M2 membrane 138
Figure 4.14 Residual plots against Normal probability for
M2 membrane
139
Figure 5.1 (a,b) Contact angle, (c,d) FESEM images and (e) EDX
analysis of M2 membrane and TiO2-Fly ash membrane
148
Figure 5.2 N2 gas permeation through membranes 150
Figure 5.3 Droplet size distribution of oil-in-water emulsions 150
Figure 5.4 The variation of water flux of TiO2-Fly ash composite
membrane (filled symbol) and M2 (unfilled symbol)
151

xxx
membranes with various applied pressures at different
cross flow velocities (■,□ - 69 kPa; ●,○ - 138 kPa; ▲,Δ -
207 kPa)
Figure 5.5 The variation of permeate flux of TiO2-Fly ash composite
membrane (filled symbol) and M2 (unfilled symbol)
membranes with various applied pressures and cross flow
velocities at different feed concentrations (■,□ - 69 kPa;
●,○ - 138 kPa; ▲,Δ - 207 kPa)
153
Figure 5.6 The variation of rejection of TiO2-Fly ash composite
membrane (filled symbol) and M2 (unfilled symbol)
membranes with various applied pressures and cross flow
velocities at different feed concentrations (■,□ - 69 kPa;
●,○ - 138 kPa; ▲,Δ - 207 kPa)
154
Figure 5.7 The performance indices for TiO2-Fly ash composite
membrane (Filled symbol) and M2 membrane (unfilled
symbol) at different feed concentrations (100-200 mg/L)
with various cross flow velocities (0.0885-0.1768 m/s)
160
Figure 5.8 Permeate flux and rejection surface plots as a function of
(a,b) pressure and concentration, (c,d) pressure and cross
flow velocity, and (e,f) concentration and cross flow
velocity for the TiO2-Fly ash composite membrane
173
Figure 5.9 Permeate flux and rejection surface plots as a function of
(a,b) pressure and concentration, (c,d) pressure and cross
flow velocity, and (e,f) concentration and cross flow
velocity for the M2 membrane
174

xxxi
Figure 5.10 RSM model predicted values vs experimental values 176
Figure 6.1 Particle size distribution of synthesized sols (TiO2 and
γ-Al2O3)
182
Figure 6.2 N2 adsorption and desorption isotherms and BJH pore size
distributions of TiO2 and γ-Al2O3 powders
183
Figure 6.3 TGA and DTG curves of as synthesized (before
calcination) TiO2 (A, a), and γ-Al2O3 (B, b) powder
185
Figure 6.4 FTIR analysis of TiO2 powder and γ-Al2O3 powder 186
Figure 6.5 XRD profiles of the clay, TiO2, and Al2O3 powders before
and after calcination (P-Pyrophyllite, M-Mullite,
C-Calcium carbonate, F-Feldspar, CaO-Calcium oxide,
W-Wollastonite, K-Kaolin and A-Anatase)
189
Figure 6.6 FESEM images (a,b,c) and contact angle (d,e,f) of clay,
TiO2-clay and γ-Al2O3-clay membrane (○-TiO2 layer;
□-γ-Al2O3 layer)
193
Figure 6.7 Pore size distribution of the clay and composite
membranes
194
Figure 6.8 Effect of pressure on N2 gas permeability of clay and
composite membranes
194
Figure 6.9 Effect of pressure on pure water flux of clay and composite
membranes
195
Figure 6.10 Droplet size distribution of oil-in-water emulsions 196
Figure 6.11 Variation of permeate flux and rejection of oil with applied
pressure for clay (■, □), TiO2–clay membrane (●, ○) and
γ-Al2O3–clay membrane (▲, Δ)
198

xxxii
Figure 6.12 Variation of permeate flux and rejection (%) of oil with
feed concentration for clay (■, □), TiO2–clay membrane
(●, ○) and γ-Al2O3–clay membrane (▲, Δ)
199
Figure 7.1 Variation of pure water flux of clay and TiO2-clay
membrane in cross flow mode with applied pressures
(69-207 kPa) at cross flow velocity of 0.0885 m/s
210
Figure 7.2 Variation of permeate flux of clay membrane at three cross
flow velocities and applied pressures
213
Figure 7.3 Variation of permeate flux of TiO2–clay membrane at three
cross flow velocities and applied pressures
214
Figure 7.4 The effect of applied pressure and cross flow velocity on
rejection for clay and TiO2-clay membrane
215
Figure 7.5 Effect of pressure on four different pore blocking models.
(■ Complete pore blocking, ● Standard pore blocking,
▲ Intermediate pore blocking, ▼ Cake filtration)
220

xxxiii
Nomenclature
Symbols
ε - Porosity of the membrane
WD - Weight of dry membrane (g)
WW - Weight of the membrane with pores filled with water (pores are filled with water under
vacuum) (g)
WA- Weight of the membrane saturated with water measured in water (A refers to
Archimedes) (g)
σ - Flexural strength (Pa)
F - Load at the fracture point (N)
L - Span length (m)
b - Width of the sample (m)
t - Thickness of the sample (m)
Jw - Pure water flux (m3/m2 s)
V - Volume of water permeated (m3)
A - Membrane area (m2)
ΔT - Sampling time (s)
rm - Pore radius of the membrane (μm)
Lh - Hydraulic permeability of the membrane (m3/m2sPa)
µ - Viscosity of water (Pa s)
ΔP – Applied pressure (kPa)
lp - Pore length (m)
P - Average pressure acting on the membrane (Pa)
ν - Molecular mean velocity of the gas (m/s)

xxxiv
η - Viscosity of gas (Pa s)
q - Tortuosity
K - Effective permeability factor
P2 - Membrane pressure at permeate side (Pa)
S - Permeable area of the membrane (m2)
rg – Average pore size of the membrane (µm)
Y - Predicted response
V - Volume of permeate (m3)
A - Membrane area (m2)
J - Permeate flux (m3/m2 s)
Lh - the permeability of the membrane (m3/m2 s kPa)
R - Rejection of oil (%)
Cf - Oil concentration in feed (mg/L)
Cp - Oil concentration in permeate (mg/L)
di - Diameter of the ith pore (μm)
ni - Number of pores on the membrane
Davg - Average value of membrane pore diameter (μm)
ΔXi - Step change content of uncoded variable i
Xo - Real value of an independent variable (Xi) at the centre point
Zi - Dimensionless coded value of an independent variable
Y - Predicted response (permeate flux and rejection)
βij - the interaction coefficients,

xxxv
βii - the quadratic effect,
βi - the linear effect
β0 -the intercept
εijk -the random error,
Xi, Xj - the uncoded independent variables.
Abbreviations
SEM – Scanning Electron Microscope
FESEM – Field Emission Scanning Electron Microscope
FTIR – Fourier Transform Infrared Spectrophotometer
XRD – X-Ray Diffraction
TGA – Thermogravimetric analysis
DTG – Differential Thermogravimetric analysis
PSD – Particle Size Distribution
RSM – Response Surface Methodology
MF – Microfiltration
UF – Ultrafiltration
NF – Nanofiltration
RO – Reverse Osmosis
COD – Chemical Oxygen Demand
TOC – Total Organic Carbon
CFV – Cross Flow Velocity
TMP – Transmembrane Pressure
CCD – Central Composite Design

xxxvi

1
CHAPTER-1
Introduction and Literature Review

2

3
CHAPTER 1 Introduction and Literature Review
After presenting a brief overview of fly ash materials and ceramic membranes in sections 1.1
and 1.2, respectively, this chapter addresses the available prior art in the fields of ceramic
support fabrication, composite membrane fabrication, and ceramic membrane based oil-in-
water emulsion separation studies and applications pertaining to response surface
methodology for membrane separation processes in section 1.3. Thereby, possible scope for
further research, objectives of the thesis and its organization are being presented in sections
1.4, 1.5 and 1.6, respectively.
1.1 Fly ash material
1.1.1 History
Electrical power generating produce millions of tons of fly ash and related by-products by
burning coal. With increasing electricity demand and with abundance of coal in nature, fly
ash generation is increasing enormously. According to Ahmaruzzaman (2010), only 16% of
fly ash is utilized by existing techniques. Out of this, the cement industry utilizes about 30%
of fly ash and the remaining portion is disposed to landfill and ash ponds. Due to the
existence of transition metal oxides, fly ash is known to provide adverse environmental
effect. Among various viable alternatives for fly ash utilization, the fabrication of efficient
ceramic membranes is an important alternative, owing to the utilization of fly ash to further
address potential adverse environmental effects caused by discharged wastewater such as oil-
in-water emulsions.
Listed as sixth largest in terms of electrical power generation, India produces significant
amount of fly ash. While majority of fly ash is being used for cement manufacture, roadways

4
and brick manufacture, large quantities of fly ash is stored in ponds. Currently, only 50% of
the fly ash is used in the annual production capacity of 160 million tones in India.
Fly ash is abrasive, refractory and also alkaline. It consists of macronutrients (P, K, Ca, Mg)
and micronutrients (Zn, Fe, Cu, Mn, B and Mo) and can be adopted for plant growth. Lime
binding capacity of the fly ash enables it for cement manufacturing, concrete building
materials and other relevant products. Chemical constitution of fly ash corresponds to
significant proportion of silica (60-65%) followed with alumina (25-30%), magnetite and
Fe2O3 (6-15%). Due to this, Iyer and Scott (2011) have opined that it can be used for the
synthesis of zeolite, alum and precipitated silica. With appropriate physiochemical properties
(bulk density, particle size, porosity, water holding capacity and active surface area), fly ash
has been suggested to be adsorbent (Blissett and Rowson, 2012). Further, agricultural and
engineering materials can be also developed from fly ash.
1.1.2 Physical Properties
Table 1.1 presents the physical properties of fly ash. Typically, fly ash contains spherical
solid or hollow amorphous powder particles. Further, fly ash also contains angular shaped
particles of carbonaceous materials. The particle size distribution is about 1-150µm (Ilic et
al., 2003). Specific gravity and specific surface area vary from 2.1 – 3.0 and 170 – 1000
m2/kg, respectively. Depending upon unburned carbon content, the colour of fly ash varies
from tan to black.

5
Table 1.1: Physical properties of fly ash
Properties Range
Specific Gravity 2.1-3.0
Specific surface area (m2/kg) 170-1000
Color Grey-black
Particle size (µm) 1-150
1.1.3 Chemical Properties
Depending upon the type of coal burnt and handling/storage procedures, fly ash chemical
properties vary significantly. Fundamentally, fly ash classification is based on the type of
coal (anthracite, bituminous, sub-bituminous and lignite) used during combustion
(Ahmaruzzaman, 2010; Iyer and Scott, 2011; Blissett and Rowson, 2012). While bituminous
coal based fly ash consists of silica, alumina, iron oxide, calcium and carbon, the fly ash
obtained from sub-bituminous coal consists of higher constitution of magnesium and calcium
oxide and lower amounts of silica, iron oxide and carbon.
Table 1.2: Classification of fly ash by ASTM standards
Class SiO2+Al2O3+Fe2O3
(%)
SO3
(%)
Ca
(%)
Moisture
(%)
Loss of
Ignition (%)
C 50-70 <5 30-40 <3 <6
F >70
1-12
<12
The American Society for Testing Materials (ASTM) classification (C618) of fly ash refers
to class F and C categories (Table 1.2). This is based on the constitution of alumina, silica,
iron oxide and lime in fly ash. With low lime, class F fly ash possesses 70% overall weight
percentage of alumina, silica, and iron oxide. However, for class C fly ash, the overall weight

6
percentage of alumina, silica, and iron oxides is about 50 – 70% along with abundance of
lime content. Generally, class C fly ash is obtained by low rank coals i.e. lignite and sub-
bituminous coal with cementations properties. On the other hand, class F fly ash is obtained
from the combustion of higher rank pozzolanic coals. The main differences between these
ashes are in calcium, alumina, silica and iron content. While calcium content in class F varies
from 1 – 12%, it varies from 30 – 40 % in class C. Another variation in the composition
corresponds to alkali (sodium and potassium) and sulfate content. This is higher for class C
fly ash but not class F fly ash. European standards based fly ash constitution is being
presented in Table 1.3.
Table 1.3: Classification of fly ash based on European standards EN 450-1
Class SiO2+Al2O3+Fe2O3 (%) SO3 (%) Reactive Silica (%) LOI (%)
A >70 <3 >25 <5
B - - - 2-7
C - - - 4-9
The general classification of coal fly ash typically ignores the mineralogy aspects of the coal.
Vassilev and Vassileva (2007) indicated that the coal fly ash classification does not
systematic scientific basis, despite being addressed from industrial coal utilization
perspective. Thereby, European coal fly ash classification system has been developed in
which the bulk oxides have been grouped together to classify fly ash (shown in Table 1.4).
Fly ash has been analyzed to have significant variations in available phases such as kaolinite,
mullite, illite and siderate that includes calcite, pyrite and hematite. Low calcium ash has

7
quartz and mullite as major constituents. On the other hand, fly ash with high calcium
content consists quartz, Tricalcium Aluminate (C3A), Calcium Silicate (CS) and
Tetracalcium Alumino Silicate (C4AS) (Bruce and Mathew, 2004). Fly ash has significant
amount of glass, which is typically explored to develop road construction materials by
facilitating reaction with lime (Pozzolanic reaction). Fly ash with its promising features of
adhesivity, glass content, crystalline content and strength is eventually used in cement
production and concrete admix.
Table 1.4: Classification of coal fly ash on chemical composition
Class SiO2 + Al2O3 + K2O +
TiO2 + P2O5 (%)
CaO + MgO + SO3 +
Na2O + MnO (%) Fe2O3
Sialic >77 <11.5 <11.5
Calsialic <89 >11.5 <11.5
Ferrisialic <89 <11.5 >11.5
Ferricalcsialic <77 >11.5 >11.5
1.1.4 Applications
Eminent features of fly ash are spherical texture, pozzolanic properties, low alkali content,
and moisture insensitivity, low cost, ease of handling, good shear strength, consistent quality
and low carbon content. The drinking force behind application oriented research on fly ash is
upon the development of products with technical and commercial value. A plethora of
potential applications have been already identified with fly ash as economically viable
source. These include:
Synthesis of zeolites by hydrothermal method (Querol et al., 1995).

8
Raw material for concrete addition and road construction and (Mathur, 2000).
Raw material for blended cements in concrete blocks; filling of voids, mine shafts and
sub-surface mine works; restoration and re-cultivation in open cast mining (Hansen,
1991; Nanni et al., 1996; Delagrave et al., 1997).
Material to offer compaction and lower head of hydration in dam construction materials.
Further, fly ash blended concrete increased durability of structure two to three times,
as against ordinary Portland cement and hence could be used in irrigation projects
(Gao et al., 2007).
Raw material for the pavement base course foundation material production; drying agent
for wet soils and structural fill (Gonzalez, 2009).
Raw material for brick production (Lin, 2006).
Low cost adsorbent for organic compounds (Phenol, Ortho-chloro phenol, 2,4 Dichloro
phenol, Cresol), flue gas (SiO2, NOx) and metals (Zn+2, Cd+2, Pb+2, Cu+2, Ni+2, Cr+3,
Cr+6, Hg+2, As+3, As+5) removal from industrial effluents (Akgerman and Zardkoohi,
1996; Daifullah and Gad, 1998; Davini, 2002; Banerjee et al., 2003; Apak et al., 1998;
Kelleher et al., 2002; Banerjee et al., 2004; Pattanayak et al., 2000).
Fabrication of low cost ceramic supports (Jedidi et al., 2009; Dong et al., 2010; Fang et al.,
2011).
In the above applications, the application of fly ash for separation and treatment of waste
water streams is an important area of research that is presently investigated to a significant
extent (Jedidi et al., 2009; Dong et al., 2010; Fang et al., 2011). The major objective of this
thesis is to address the membrane application potential of fly ash and therefore, the next
section summarizes a brief overview of membrane processes.

9
1.2 Overview of Membrane Processes
Membranes are functional semi-permeable active or passive barriers that permit the
preferential retention/permeation of one or several components (molecules, particles or
polymers) in gaseous and/or liquid mixtures (Hsieh, 1996). In due course of separation, the
primary species that are rejected and retained are termed as retentate solutes and the species
that pass through the membranes are termed as permeate solutes. In general, the driving force
to accomplish desired separation is brought forward by the application of pressure or
concentration or potential difference across the membrane.
Membranes have been found to be advantages and promising separation technology
when compared to other separation technologies such as adsorption, distillation, extraction
and crystallization. In this regard, lower capital cost, higher separation factors, compact
design and the elimination of secondary separation units are regarded to be some of the
primary advantages of the membrane technology.
The performance of the membrane depends upon various factors such as porosity,
pore diameter distributions, particle size distributions amongst the solutes that are processed
in addition to the solubility/diffusivity of the permeating molecules. Therefore, membrane
technology needs to be studied thoroughly in order to ensure its versatility for industrial
applications.

10
1.2.1 Materials based classification
Figure 1.1: Classification of synthetic membranes
In general, membranes can be classified into two major types, namely biological and
synthetic membrane (Cheryan, 1998; Mulder, 1991 and Nunes and Peinemann, 2001). While
biological membranes refer to those that are present in living cells and aid in cellular
functional separations, synthetic membranes are those that are prepared using various
materials such as solids and liquids. A conventional example for biological membrane is
nephrons present in human kidney which facilitate separation of waste compounds (urea and
excess sugars) from the blood in living beings.
The classifications of membranes are presented in Fig.1.1. Generally, solid and liquid
membranes constitute synthetic membranes. Solid membranes are further classified into
Unsupported
liquid
membranes
Supported
liquid
membranes
Synthetic membranes
Solid membranes Liquid membranes
Dense
membrane
s
Porous
membranes
Electrically
charged
membranes
Symmetric
membrane
Asymmetric
membrane
Isotropic
membrane
Anisotropic
membrane

11
dense, porous and electrically charged membranes. Porous membranes possess highly void
structures with random distribution of inter-connected pores in a mechanically rigid
morphology. The separation occurs in these membranes due to the size difference of the
particles and membrane pores. However, dense membranes consist of dominating non-porous
structures and hence separation occurs due to diffusion and activation phenomena.
Electrically charged membranes being porous or dense membranes carry fixed positive or
negative charge that aid in the separation of solutions with ions. A further structural
classification of various membranes indicates symmetric and asymmetric membranes.
Symmetric membranes consist of a single layer with homogenous porous structures. On the
other hand, asymmetric membranes possess heterogeneous membrane structure that is
accomplished using two or more porous structures or layers. Typically, asymmetric
membranes possess thin narrow porous layer on a thick macroporous (wider pore) layer
(support). In an asymmetric membrane, while the thin film provides higher separation and
permeation characteristics of the membrane, the support provides higher mechanical strength
to the membrane with minimum resistance to permeation. Therefore asymmetric membranes
are always regarded to be advantageous than symmetric membranes. A pore size distribution
based classification indicates symmetric membranes to be either isotropic or anisotropic.
While uniform membrane pore sizes throughout the membrane structure are present in
isotropic membranes, varied pore sizes throughout the membrane structure are present in
anisotropic membranes. Solid phase symmetric and asymmetric membranes are primarily
used for pressure driven membrane separation processes.
Based on the different types of materials with which these membranes are fabricated, the
membranes are classified as polymeric and ceramic symmetric membranes and polymer-
polymer, polymer-ceramic, ceramic-ceramic asymmetric membranes. While symmetric
membranes are typically fabricated using single functional materials, asymmetric

12
multilayered membranes are typically fabricated by depositing a thin film of polymeric,
inorganic or any other suitable materials over a porous support.
1.2.2 Separation process based classification
Depending upon the nature of the driving force and transport mechanism of feed
materials through the membrane, membrane separation processes can be classified. While
some of these processes are well established in the industry, a few of them are still in
experimental stages and large scale industrial applications are yet to be realized. Based on the
membrane transport mechanism, various membrane separation processes can be classified as
follows (Mulder, 1991):
1. Processes with pressure as driving force – Microfiltration (MF), ultrafiltration
(UF), nanofiltration (NF) and reverse osmosis (RO)
2. Concentration driven processes – Gas separation, pervaporation (PV),
dialysis, membrane extraction, supported liquid membrane (SLEM) and
emulsion liquid membrane (ELM).
3. Temperature driven processes – Membrane distillation and thermo-osmosis
4. Electrically driven processes – Electrodialysis, electrofiltration and
electrochemical ion exchange.
Membrane flow pattern can be classified into either dead end or cross flow. It is based on the
relative feed stream direction in conjunction with the membrane orientation. The different
flow patterns are depicted in Fig.1.2. In dead end flow pattern, both feed and permeate flow
are perpendicular to membrane surface and it is a batch processes. In cross flow pattern, both
permeate and feed flow parallel to the surface of the membrane. Cross flow can be operated
in co current or counter current mode using a sweep stream. In counter current flow the
upstream and downstream moves parallel to the membrane surface in opposite direction. But
in co-current flow, the two streams flow in same direction.

13
Figure 1.2: Different modes of operation in membrane processes (F-Feed, P-Permeate,
R-Retentate, S-Stream and M-Membrane)
(a) Dead end flow pattern
F
M
P
F
P
M
R
(b) Cross flow pattern
(c) Co current flow
F
S
M
R
P
F
S
M
R
P
F
S
M
R
P
(d) Counter current flow
(e) Complete mixing

14
1.2.3 Industrial applications of membrane technology
Numerous industrial applications of synthetic solid symmetric and asymmetric membranes
exist for MF and UF membranes.
a) Potable water production from alternate sources to remove various particles as well as
bacteria
b) Biotechnological applications such as protein recovery, milk concentration and
separation of fat from milk.
c) Treatment of industrial waste streams such as oily wastewater, pulp and paper
wastewater, leather wastewater etc., for suspended solids removal in the wastewater
streams.
d) Production of clarified fruit juices which possess long term storage characteristics and
thereby enable the reduction of transportation costs of food products.
The industrial applications of other membrane separation processes such as NF, RO,
pervaporation, dialysis, electro dialysis and gas separation are presented as follows:
1. NF and RO: Desalination of sea water to generate drinking water, treatment of various
industrial wastewaters, removal of nitrates, fluorides, heavy metals, etc.
2. Pervaporation: separation of organic and azeotropic mixtures (such as ethanol-water)
those are difficult to separate using conventional methods such as distillation.
3. Dialysis and electro dialysis: Removal of different harmful components from human
blood during kidney failure.

15
4. Gas permeation: To produce oxygen enriched air, nitrogen enriched air and hydrogen
recovery using porous as well as dense membranes. In addition, dense membranes are
used to accomplish carrier facilitated separations.
1.2.4 Polymeric membranes
Polymeric materials and ceramics are the most widely used functional membrane materials to
prepare symmetric membranes for industrial scale applications. The asymmetric membranes
are usually prepared from symmetric polymeric or ceramic membrane materials or both. In an
asymmetric membrane, usually the support layer provides desired mechanical strength and
the thin skin layer constituting either polymeric or ceramic caters towards the desired
separation characteristics.
Polymeric membranes are thin films of 10-100 µm thickness. Different types of
polymers such as polysulphone (PSU), cellulose acetate (CA), polyamide (PA),
polyethersulphone (PES), Polyvinylidene fluoride (PVDF), polyacrylonitrile (PAN),
polytetrafloroethylene (PTFE), polyetherimide (PEI), polypropylene (PP) are widely used to
fabricate the polymeric membranes.
Advantages Disadvantages
1. Wider ranges of pore sizes varying from
MF to RO are available.
1. Low solvent resistance
2. Comparatively low cost than ceramic
membrane
2. Lower applicable range of pH and
hence low chemical stability
3. Easy to fabricate 3. Low temperature ranges
4. Ease to scale up 4. Lower life span (12-18 months)

16
1.2.5 Ceramic membranes
Ceramic membranes are synthetic membranes prepared with inorganic materials such
alumina, zirconia, silica, titania, kaolin etc., Ceramic membranes possess superior chemical,
thermal and mechanical stability. Usually, ceramic membranes have about 2 – 5 mm
thickness for the porous support. Asymmetric ceramic membranes constitute thin film (10-
100 µm) of ceramic coating over a thick porous symmetric support.
Advantages Disadvantages
1. Very high corrosion resistance.
2. Applicability to wider pH ranges (0.5-14).
3. Applicability of wider temperature ranges
(350-500oC). As a result they are used in
industrial scale separations without any
feed pre-conditioning steps.
4. Less fouling tendency.
1. Most ceramic membranes are
available in pore diameters
within the MF and UF range
(0.010 – 10 µm).
2. Comparatively higher cost.
3. They are brittle in nature
5. Inertness to common chemicals and
solvents.
6. Higher mechanical strength.
1.2.6 Ceramic membrane fabrication methods
Symmetric membranes are fabricated using uni-axial and paste methods (Baker, 2004;
Judd and Jafferson, 2003). Both these methods involve the preparation of an inorganic
mixture using suitable pore forming organic and inorganic materials along with binder
materials. The uni-axial method involves casting an inorganic mixture in a suitable disk or

17
tubular shape and kept under very high pressure (30-50 MPa). Subsequently, the disk or
tubular type mould is sintered to prepare the membrane.
The paste method involves the preparation of a paste using the inorganic mixture
using suitable solvent which is eventually casted into suitable shape and sintered at high
temperature. The composition of the raw materials, sintering temperature and process
including the schedule of heating, sintering and cooling significantly influence the properties
and morphology of the ceramic membranes.
Asymmetric ceramic membranes are prepared by allowing the deposition of a thin
film of inorganic materials over the porous symmetric ceramic membranes (support). Slip
coating followed with casting, sol-gel and dip coating methods are usually deployed for the
fabrication of asymmetric ceramic membranes whose properties are dependent upon both
support as well as thin skin layer morphology.
Using a suspension of finer particles in cellulosic polymer or polyvinylalcohol (to
serve as binder and viscosity enhancement), the slip-coating process involves the coating of
the support surface with the said suspension followed with drying and sintering at high
temperature to achieve a fine micro porous surface layer.
The literature presents membrane fabrication by targeting specific combinations of
raw materials and sintering temperature. Expensive materials, used for many years to
manufacture membranes, are now-a-days replaced by low cost clays. Over the past several
years, several literatures indicate upon the utility of ceramic membranes for microfiltration of
oil-in-water emulsion studies are investigated and understood. In subsequent sections, a
detailed review on development of TiO2 composite membrane along with experimental and
application in oil-in-water emulsion treatment is discussed.

18
1.3 State-of-the-art
In this section, the available prior-art in the field of ceramic composite membrane fabrication
and application is being addressed. The available prior-art has been presented for three
themes, namely ceramic supports, composite membranes and their applications and
application of response surface methodology for microfiltration research. The following sub-
sections elaborate upon the available literature data for each case.
1.3.1 Preparation of ceramic membrane supports
Several literatures report upon ceramic membrane fabrication using various raw materials.
These are α- alumina, stainless steel (Rs. 150000/m2) (Judd and Jafferson, 2003; Yoshino et
al., 2005; Defriend et al., 2003; Benito et al., 2005), γ-alumina, zirconia, titania and silica
etc., (Judd and Jafferson, 2003; Wang et al., 2006; Tsuru, 2001; Falamaki et al., 2004). The
cost of these membranes is significantly high due to the higher costs of the raw materials.
Hence, from economic perspective, these membranes are not viable for environmental
process engineering applications. As an alternative for their economic infeasibility, current
research addresses other low cost ceramic membrane precursor utility to reduce the cost.
On the other hand, it is also evident in the literature that fly ash is abundantly available waste
material that is often generated from power plants by burning coal. There are good number of
litertaures that address the preparation of inexpensive ceramic membranes using cheaper raw
materials such as fly ash, raw clay, Moroccan clay, apatite powder, dolomite, kaolin,
Tunisian clay, sepiolite clay and Algerian clay (Saffaj et al., 2005; Saffaj et al., 2006;
Khemakhem et al., 2006; Weir et al., 2001; Khider et al., 2004; Bouzerara et al., 2006).
In addition, preparation methods for ceramic membrane involve additional fabrication
complexities that also contribute to the overall cost. While many fabrication methods exist,
Xia and Liu (2001) have opined that uni-axial dry compaction method is a simple, highly cost
effective method for laboratory and pilot plant scale ceramic membrane fabrication. In the

19
next few paragraphs, a brief account of the available prior-art is being presented in the area of
ceramic membrane support preparation.
Using dry compaction method, Wang et al. (2008) prepared inorganic membrane using sol-
coated alumina powder (mean particle size = 27.5 µm). The membrane sintered at 1350 oC
possessed 39% open porosity, 45 MPa mechanical strength and 7.71 µm average pore size.
The authors examined the role of sintering temperature on membrane morphological
properties and have concluded that the sol-coating and sintering conditions strongly influence
membrane microstructure.
Using high purity α-alumina powder, Shqau et al. (2006) prepared macroporous ceramic
membrane support by adopting colloidal processing method and various sintering
temperatures. The best membrane has been evaluated to possess 28 nm average pore size and
20 % porosity after sintering was carried out at 1000 oC.
Using Moroccan clay, Saffaj et al. (2006) prepared ceramic membrane support by extrusion
method and sintered at various temperatures. The pore diameter and mechanical strength of
the membranes enhanced with increasing sintering temperature. However, the membrane
porosity reduced with increased sintering temperature. The optimal membrane corresponds to
that prepared at 1225 oC at which the membrane possessed an average pore size of 10.25 µm
and mechanical strength of 10 MPa.
Masmoudi et al. (2007) reported the development of low cost membrane support from natural
apatite powder. Extrusion method was adopted by the authors along with alternate sintering
temperatures. The obtained result revealed that the pore diameter and mechanical strength
increased with increasing sintering temperature and membrane porosity reduced with
increasing sintering temperature. With good chemical resistance in basic media (5% weight
loss) and poor chemical resistance in acidic media (25% weight loss), the ceramic membrane
possessed 6 µm mean pore size and 47% porosity after sintering at 1160 °C.

20
Bouzerara et al. (2006) reported the preparation of ceramic membrane support from kaolin
and kaolin-dolama mixtures. Four different processing routes were investigated with two
different configurations (tubular and flat). The tubular support was prepared by extrusion
whereas the flat support prepared with dry and roll pressing. Membrane properties such as
average pore size, mechanical strength and porosity were investigated with respect to
variations in sintering temperature. Their research confirmed that mechanical strength, pore
size, porosity and pore size distribution got significantly varied with variations in sintering
temperature and processing route. Using extrusion method and sintering temperature of 1250
oC for 1 h, membranes with 43% porosity, uniform pore size distribution, 28 µm average pore
size were obtained. On the other hand, when roll pressing was adopted for same sintering
temperature, membranes with higher porosity (51%) were fabricated.
Using Tunisian natural illite clay, Khemakhem et al. (2006) prepared UF membrane by
adopting slip casting method for UF layer deposition on the MF support prepared using
aqueous colloidal suspension and sintering temperature of 800 oC. With 185 KDa molecular
weight cut off, the membrane water permeability was evaluated as 88 L/h m2 bar.
Using low cost industrial grade cordierite powder, Dong et al. (2007) targeted the effect of
sintering temperature on membrane properties. It has been evaluated that while mechanical
strength increased, the porosity decreased with increasing sintering temperature. The optimal
condition for membrane fabrication was at 1380 oC sintering temperature, at which, 8.66 µm
pore size and 36.2% porosity were obtained for the membrane with poor corrosion resistance.
Nandi et al. (2008) studied the influence of sintering temperature on porosity, average pore
size, mechanical stability and chemical resistance of low cost ceramic membranes. Low cost
materials such as kaolin, quartz, calcium carbonate, sodium carbonate, boric acid and sodium
metasilicate were used by the authors to infer upon a new formulation and paste method.
With increasing sintering temperature, while membrane pore size, mechanical strength and

21
chemical stability increased, the membrane porosity decreased. At an optimal sintering
temperature of 900 oC, average pore diameter, porosity and mechanical strength were
evaluated to be 0.70 µm, 40 % and 6 MPa, respectively.
Monash and Pugazhenthi (2011a) used low cost clays such as kaolin, quartz, ball clay,
feldspar, calcium carbonate and pyrophyllite. The membrane support was prepared by uni-
axial dry compaction method and sintered at different temperature. Their research affirmed
that while porosity reduced, pore diameter, chemical stability and mechanical strength
increased with increasing sintering temperature. With good chemical resistance in both acidic
and basic media, the membrane sintered at 950 oC possessed porosity, flexural strength and
average pore size of 44%, 28 MPa and 1.01 µm, respectively.
Jedidi et al. (2009) prepared inexpensive microfiltration tubular ceramic membrane using
coal fly ash at 800 oC sintering temperature for 2 h sintering time. The membrane possessed
4.5 µm average pore size and 51% porosity. The authors adopted slip coating method with a
suspension of fly ash powder, water and PVA to expound mesoporous layer on the support.
Thereby, the active layer with 0.25 µm pore size and 20 µm thickness offered 475 L/m2 h bar
membrane permeability. The membrane was tested for the treatment of dying effluent
streams generated after washing operations in textile industry. COD and color removal
efficiency of the membrane were evaluated to be 75% and 90%, respectively.
Dong et al. (2011) developed the ceramic support using dry compaction method and
industrial waste fly ash and natural bauxite as raw materials. The average particle size of the
flyash, bauxite and mixture were evaluated as 1.76, 1.13 and 1.52 µm, respectively. It has
been evaluated that the open pore size and porosity of the ceramic membrane reduced with
increasing sintering temperature.
Thomas et al. (2011) prepared fly ash based membrane for microfiltration of mining waters.
Initially, fly ash was grinded to get particle size less than 63µm for fabricating porous module

22
using mould casting method and sintered at 1000 oC. The final skin layer was fabricated
using similar constituents such as fly ash, PVA and NaOH and the membrane was sintered at
1000 oC for 5 hr. With good combinations of mechanical strength and thermal stability, the
average membrane pore size and porosity were evaluated as 0.026-0.063 µm and 49%,
respectively. Using mining water, membrane flux and permeability were evaluated.
Fang et al. (2011) prepared tubular shaped ceramic membrane by slip casting method by
using refined fly ash with three different sizes (15.41, 5.01 and 1.41 µm). Initially, macro
porous fly ash based support was fabricated by extrusion method using fly ash with larger
particle size, methylcellulose, and water. For the membrane fabrication, the sintering
temperature was 1190 oC for 2 h. The intermediate layer and tope layer were deposited on
support by adopting slip casting method and two different sintering temperatures. The
average pore size of the support, intermediate layer and top layer were evaluated as 2.13, 1.94
and 0.77 µm, respectively. The performance of the support and multiple coated membranes
indicates good water flux and permeability. At a pressure of 0.1 MPa and room temperature,
the water flux of the support, intermediate layer and top layer were evaluated to be 2.26, 1.86
and 1.56 × 10⁴ L/m2 h bar, respectively.
The fuel cell performance of low cost ceramic membranes were investigated by Fukui et al.
(2009). The authors utilized fly ash generated from waste incineration and chicken bone
powder as raw materials to achieve calcium phosphate hydrogel membrane. To achieve the
said membrane, the authors used amorphous calcium phosphate hydro gel along with said
raw materials. After melting the mixture in air at 1200 oC for 30 min, the mixture was poured
on an iron plate. Subsequently, the membrane electrode assembly was fabricated to achieve
50.0 µm thick crystallized calcium phosphate hydrogel layer on a carbon electrode with Pt

23
catalyst layer and thin gas diffusion layer. It was evaluated that the mechanical strength of the
calcium hydrogel layer increased after drying the anode for 24 h at room temperature.
Using refined fly ash as raw material and by adopting slip casting method, Fang et al. (2013)
prepared asymmetric MF ceramic membranes. After fabricating macro porous fly ash based
support, the authors prepared aqueous fly ash solution with 3 wt% to achieve skin layer on
the inner surface of the membrane support. Subsequently, the membrane was sintered at 1000
oC. For multiple coatings, the authors used a freshly prepared fly ash suspension with a
concentration of 2.0 wt. % and used similar drying and sintering conditions that were adopted
for the support. The membrane with 0.77 µm pore size provided higher water flux of
1.56 × 10⁻⁴ L/m2 h. At 0.1 MPa transmembrane pressure, the prepared membrane was used
for MF of particle suspension and oil-in-water emulsions. The membrane provided higher
membrane fluxes of 2270 L/m2 h and 159 L/m2 h for particle suspension and emulsion
separation studies respectively. Corresponding separation efficiencies were 99.9 % and
95.5 %, respectively.
Adopting uni-axial dry compaction method, Dong et al. (2010) prepared porous mullite
membranes by using fly ash, calcined bauxite and titania (sintering additive). The authors
examined the role of titanium dioxide on the sintering behavior and main properties of porous
mullite. With increasing titania content (0 – 6%), it was observed that the sintering ability and
mechanical strength of the membranes increased and the average pore size of the membrane
decreased from 7.28 to 6.28 µm. For all cases, the pore size distribution referred to bimodal
distribution in pore sizes.
Using coal based fly ash, Jedidi et al. (2011) reported the preparation of extrusion based
ceramic membrane support fabrication at a sintering temperature of 1125 °C. The membrane
average pore size and porosity were evaluated as 4.5 µm and 51%, respectively. Along with
these, mechanical strength and corrosion resistance were also studied. Further, slip casting

24
method was adopted at 800 oC sintering temperature to achieve a skin layer with 0.25 µm
pore size. The composite membrane provided a water flux of 475 L/h m2 bar. Also, the
obtained membrane properties such as membrane flux and separation efficiency were
compared with those of alumina based membrane.
Using fly ash and titania as raw materials, Jo et al. (1997) prepared fly ash and titania
membranes by adopting dip coating procedure and stainless steel mesh substrates. The
coating was achieved by preparing an optimal composition of a suspension with fly ash or
titania, distilled water, PVA, Glycerol (plasticizer) and dispex (dispersant). For fly ash and
titania membranes, the average pore size was 2.5 and 0.2 µm, respectively. The apparent air
permeability for the membranes were evaluated as 7.0×10⁻¹⁴ m2 and 2.1×10⁻¹⁵ m2 at 450 oC.
Using coal based fly ash and extrusion method, Jedidi et al. (2009) prepared porous tubular
supports. The fly ash powder was prepared by burning charcoal at 800 oC. The plastic
ceramic paste was prepared with the resultant powder (84%), organic additives (4% amijel,
4% methocel), porosity agent (4% starch) and water. After sintering at 1125 oC, the
membranes were evaluated to have a pore diameter of 4.5 µm and porosity of 51%.
Dong et al. (2006) reported the membrane preparation using fly ash and magnesium
carbonate. Initially, the green bars were prepared by uni-axial cold pressing. Subsequently,
tubular supports were prepared using extrusion method at a sintering temperature of 1380 oC.
Eventually, using a mixture of fly ash powder and magnesium carbonate and by adopting
modified dip coating method, skin layers were achieved at various sintering temperature. The
membrane support possessed an average pore size of 18.0 µm, porosity of 41.1% and
mechanical strength of 28.7 MPa. For membranes prepared at various sintering temperature,
the average pore size of composite membrane and nitrogen permeance were evaluated to be
3.6-6.4 µm and 7.52-9.82 ×10⁴ m3/m2 h MPa, respectively.

25
1.3.2 Preparation of composite membranes
Composed of inorganic oxides, ceramic membranes have excellent combinations of chemical
resistance, mechanical strength, thermal stability, higher selectivity and applicability for high
temperature and corrosive process environment. It is well known that the membrane
performance is dependent upon various properties such as pore size distribution and average
porosity of the membrane, particle size distribution of the solutes and solubility/diffusivity of
the permeating molecules.
Usually, ceramic membranes are prepared by simple preparation methods such as uniaxial
compaction, paste method. In these methods, a symmetric support is generally prepared by
shaping powder in a die and subsequent consolidation of green body using sintering process.
A schematic of ceramic support fabrication is presented in Fig. 1.3. Both uniaxial compaction
and paste methods involve the preparation of an inorganic mixture using suitable pore
forming organic and inorganic materials and binder materials. The uniaxial compaction
method involves casting an inorganic mixture in a suitable disk or tubular by applying higher
pressure in the casting process (30-50 MPa). Subsequently, the disk or tubular type mould is
sintered to prepare the membrane. The paste method involves the preparation of a paste using
inorganic mixture with suitable solvent, which is eventually casted into suitable shape and
sintered at high temperature. Thereby, the ceramic membrane properties are strongly
influenced with the raw materials composition, sintering temperature and process including
the schedule of heating, sintering and cooling. On the other hand, asymmetric ceramic
membranes are prepared by facilitating the deposition of thin film of inorganic materials on
porous symmetric ceramic membranes (support). Usually, slip casting followed with casting,
sol-gel and dip coating methods are adopted for asymmetric membrane fabrication. The skin
layer morphology is strongly influenced with the particle size of deposited materials and
morphology of the support.

26
Figure 1.3: Flow chart displaying the steps involved in ceramic membrane preparation
by paste method
Using hydrothermal crystallization approach, analcime zeolite composite membranes were
prepared by Potdar et al. (2002) on clay supports. Eventually, gas phase nitration was
conducted by using nitrous oxide gases (NOx) and the nitrated zeolite was aminated with
hydrazine hydrate. Subsequently, unmodified, nitrated and animated zeolite membranes were
investigated for surfactant separation using ultrafiltration process. The authors inferred that
surface modification allowed 300% enhancement in surfactant retention along with an
enhancement in the membrane flux.
Kazemimoghadam et al. (2004) prepared the Zeolite NaA and hydroxy sodalite membranes.
The membranes were prepared by coating of these materials on the porous mullite support
made by extrusion method and the supports were sintered at 1250 oC for 5 h. It was analyzed
that while separation factor for hydroxyl sodalite based membrane is higher than that
obtained for NaA membrane, it offers lower flux. Therefore, for lower concentration of
unsymmetrical dimethylhydrazine (UDMH), zeolite NaA membrane has been opined by
authors in comparison with hydroxyl sodalite membrane and vice-versa.
Raw material
Paste preparation
Casting
Sintering

27
Erdem et al. (2006) adopted a two-step approach for ceramic composite membrane
fabrication in which the first step refers to slip casting followed with dip-coating to fabricate
thin selective layers subsequently in the second step. With an average porosity of 40%, the
membrane has been evaluated to have excellent lactose separation characteristics in which the
solute is characterized with high protein content (80%) and relatively low lactose retention
(7%). The membrane flux was evaluated to be 40 L/m2 h.
Adopting porous clay supports, Workneh et al. (2008) allowed the deposition of sodalite
octahydrate zeolite particles to partially block the mouth of the porous structure. Also, casting
method was adopted by the authors using low cost inorganic precursors to obtain the support
with average pore size of 0.2 microns and 51% porosity. During the separation studies
conducted for SDS (Sodium dodecyl sulfate), the maximum rejection of 46% was obtained
for a feed concentration of 10 g/L at a membrane flux of 1.2 x 10⁻⁵ (m/s).
Cross-linked poly methyl methacrylate-ethylene glycol dimethacrylate (PMMA-EGDM) UF
membrane was fabricated by Neelakandan et al. (2003) in which low cost inorganic
precursors were used to prepare the ceramic support. Following the preparation of the
support, the polymer composite membrane was prepared by coating the polymeric material
followed with cross-linking at 60 oC. During separation studies conducted for Cr (VI), the
modified PMMA membrane provided higher membrane flux in comparison with the
unmodified membrane.
Shukla et al. (2007) reported the modification of zeolite-clay composite ultrafiltration
membranes and applied to the chromic acid separation from its solution. Initially, the
membrane support coated with kaolin by dip coating method and sintered at 900oC for 8h.
Further, insitu crystallization allowed zeolite to fill up the membrane pores and reaction with
NOx was facilitated to achieve chemically modified zeolite membrane. The modified

28
membrane with 10-30 nm surface pore size provided a rejection of 74% for the chromate ions
in aqueous solution.
Adopting two-stage modification technique, Pugazhenthi et al. (2005) prepared non-
interpenetrating charged carbon UF membrane. In the fabrication procedure, the authors
reported that the first step consists of nitration of carbon membrane using NOx at 250 oC and
subsequent amination with hydrazine hydrate at 60 oC to induce charge on the membrane.
The pore radii of unmodified, nitrated and animated carbon membranes were 2.0, 2.8 and 3.3
nm, respectively. During Cr (VI) separation from aqueous solution, for the said sequence of
membranes, the rejection was evaluated as 96%, 84% and 88%, respectively.
Alem et al. (2009) prepared disk-shaped ceramic membrane using α-Al2O3 by adopting uni-
axial pressing method. With an applied pressure of 31 MPa, the membrane was sintered at
1350 oC to achieve 15 mm diameter, 2 mm thickness and 38% porosity.
Chowdhury et al. (2003) prepared disk shaped support with α-Al2O3 as raw material using the
colloidal filtration method. Their process involved sintering of the support at 1100 ºC. The
composite membrane with ~1 µm support thickness and ~30 nm thickness surface silica layer
has 0.08-0.12 µm pore size and MCM-48 structure.
Patterson et al. (2006) prepared tubular shaped support with α-Al2O3 as raw material using
centrifugally casted method and sintered the support at 1200 ºC. The membrane was
subsequently subjected to dip-coating with an average pore size of 0.16 µm.
Basumatary et al. (2016) synthesized zeolite composite membranes with a pore size of 0.142-
0.173 µm. The zeolite membranes refer to MCM-41, MCM-48 and Faujasite (FAU) zeolite
based membranes that were fabricated on ceramic support using hydrothermal method.
Subsequently, the membranes were applied to cross flow microfiltration of Cr (VI) from
aqueous solution. Membranes provided 82% (FAU), 75% (MCM-41) and 77% (MCM-48) of

29
Cr (VI) removal efficiency using the feed concentration of 1000 mg/L and cross flow rate of
1.11×10⁻⁷ m3/s, at 345 kPa of applied pressure.
In another work, Basumatary et al. (2016) investigated the potential of MCM-48 ceramic
composite membranes by separation of FeCl3 from aqueous solution. The membrane was
characterized to have porosity and an average pore size of 22% and 0.142 µm, respectively.
With FeCl3 salt solution concentration of 250 mg/L, pH of 2, and 276 kPa applied pressure,
the maximum observed rejection was found to be 86%
Kumar et al. (2015) prepared zirconia-ceramic composite membrane through in-sity
hydrothermal method using zirconium oxychloride as a sintering material. The hydrothermal
crystallization process was carried out at 90 °C for 60 h and finally calcined at 400 °C for 6 h.
The zirconia membrane possessed 42% porosity, 0.66 µm average pore size and 1.44×10⁻⁶
m3/m2 s kPa water permeability. The membrane attained 61% of methyl orange rejection
from aqueous solution and permeate flux of 2.28×10⁻⁵ m3/m2 s at 68 kPa.
A summary of literature data with respect to classification based on support preparation is
presented in Table 1.5.

30
Table 1.5: Literature data summary for ceramic supports
Author
Raw
Material
Method of
preparation
Sintering
Temperature
(oC)
Pore size
(µm)
Porosity
(%)
Wang et al. (2008) α-Al2O3 Dry
compaction
1350 7.71 39
Shqau et al. (2006) α-Al2O3 Colloidal
processing
1000 0.028 20
Saffaj et al. (2006) Moroccan
clay
Extrusion 1225 10.25 -
Masmoudi et al. (2007) Natural
apatite
powder
Extrusion 1160 6 47
Bouzerara et al. (2006) Kaolin and
dolama
Extrusion 1250 28 43
Dong et al. (2007) Cordierite Extrusion 1380 8.66 36.2
Nandi et al. (2008) Clays Paste 900 0.7 40
1.3.3 Literature review for titania coating on ceramic membrane support
Titania composite membrane with nano-structural morphology has been fabricated by Alem
et al. (2009a) using sol-gel method. The authors opined that membrane thickness, calcination
time and calcination temperature strongly influence its photo-catalytic characteristics. The
optimal membrane with a thickness of 1 μm was prepared with titania sol (made with tetra-
isopropyl orthotitanate containing organic additives, hydroxylpropyl methycellulose (HPMC)
and polyvinylalcohol). The membrane was calcined for 1 h at 450 oC at a heating rate of

31
10oC/h. The sintered alumina support at 1350 oC for 1 h possessed 38% porosity and
permeability of 52.61 cm3 /min bar cm2. The composite membrane possessed 4.7 nm average
surface pore size and 30.09 cm3 /min bar cm2 water permeability.
Wang et al. (2007) have prepared tubular shaped 100% pure titania membrane and studied
the effect of sintering on open pore structure and chemical stability. Rutile support with 2.1
µm average pore size, 43.09% porosity, 1641 m3/m2 h bar water permeability was prepared
by the authors. Titania sol was prepared using hydrolyzed TiSO4 in acidic conditions in tri-
ethanol amine and polyvinyl alcohol media at room temperature. Subsequently, anatase
powder with 0.37 µm average particle size was used to dip coat the rutile membrane and
eventually sintered at 500-700 oC for 2h. The prepared composite membrane possessed an
average pore size of 100 nm and active membrane layer thickness of 15-20 microns. The
composite membranes exhibited higher membrane flux and insitu photocatalytic behavior
during degradation of methylene blue dye in synthetic aqueous media.
Patterson et al. (2006) carried out direct dip-coating of anatase to achieve defect free titania
composite membrane using α-Al2O3 tubular support. The ceramic support with average pore
size of 1600 nm was centrifugally casted to achieve a titania top layer thickness of 1.5 – 1.6
microns. The sintering was carried out at 450 oC for 30 min. The authors reported that the
water permeability for support and membrane was 40.8 and 9.72 L/m2 h bar, respectively.
The average pore size of titania top layer was 300 – 500 microns with which a retention of
4% ethanol and 53.7% isopropanol was obtained with an average separation factor of 2.64.
Chou et al. (1999) have made ceramic supports using mixtures of alumina and kaolin by
adopting dry pressing method. They have used anatase titania particles of two average sizes
(0.5, 0.03 µm) to coat two layers on the ceramic support and sintered the membranes at 900
and 750 oC. As a result, the authors evaluated that the membrane average pore size is about
0.8 and 0.12 microns and the gas permeability was 250×10-7 mol/m2 s Pa. It was also

32
observed that the variations in porosity and average pore size are a function of membrane
layer thickness.
Adopting sol-gel method, Alem et al. (2009b) have prepared mesoporous photocatalytic
titania multilayer membrane on α-Al2O3 support. Polymeric titania sol was prepared with
tetra-isopropyl orthotitanate as a titania precursor along with other chemicals such as nitric
acid, isopropanol in aqueous media. The membrane was calcined at 450 oC for 1 h. The
prepared membrane with an average pore size of 11.7 nm and minimum particle size of 5.8
nm and lowest pore size of 4 nm was evaluated to have 83 m2/g surface area and lower
crystallinite size (10.3 nm). For methyl orange degradation, the titania multi-layer membrane
was evaluated to allow 41.9% degradation after 9 h of UV irradiation.
Saffaj et al. (2004) studied the performance of TiO2-ZnAl2O4 multilayer UF membranes
prepared with cordierite support. Using cordierite particles in the range of 0-125 µm, the
support was fabricated with a heating rate of 5 oC/min and with a sintering temperature of
1275 oC for 1 h. The prepared cordierite tubular support possessed an average porosity and
pore size of 40% and 7 µm, respectively. Subsequently, the intermediate layers on
microporous support were prepared with slip casting of powdered zirconia suspension. The
sintered zirconia composite membrane at 1100 oC for 2 h possessed an average pore size and
thickness of 0.23 µm and 23 µm, respectively.
The top layer in the UF membrane was prepared by sol-gel method using titania sol (titanium
isopropoxide, nitric acid solution, and water mixture) and zirconia sol (ZnAl2O4 boehmite
solution, zinc nitrate solution, deionized water and hydroxyethyl cellulose mixture). TiO2–
ZnAl2O4 sol coated cordierite tubular support was sintered at 400 oC for 2 h. The composite
UF membrane has been characterized with 6.3 L/h m2 bar water permeability, 1.2 µm average
thickness and 4 nm average pore size. The membrane performance was further tested for the
separation of methylene blue and Cr(III), Pb(II) and Cd(II) containing aqueous solutions. It

33
was also affirmed that the interaction with NaCl and Na2SO4 containing solutions altered
solute rejection rates.
A summary of literature data available for the preparation of titania membranes with
alternative titania precursors is presented in Table 1.6.
Table 1.6: Literature data for TiO2 based composite membranes
Author Membrane
material
Method Pore
size
(µm)
Porosity
(%)
Sintering
Temperature
(°C)
Calcination
Temperature
(°C)
Chou et al.
(1999)
Alumina, Kaolin,
Titania
Sol-gel
process
0.12,
1.5 40 900 750
Wang et al.
(2007)
Titanium sulfate
(Anatase), PAA
Sol-
coated
process
0.10 - 1200 500-700
Patterson et
al. (2006)
Titanium(IV)
butoxide, α-Al2O3
Dip
coating 0.3-0.5 - - 450
Saffaj et al.
(2004)
Titanium-
isopropoxide,
HNO3, ZnAl2O4,
cordierite
Sol-gel
process
& slip
casting
0.004 40 - 400
Alem et al.
(2009)
Tetra isopropyl-
Orthotitanate,
HPMC, H2O,
PVA, α-Al2O3
Sol-gel
process 0.0047 38 1350 450
1.3.4 Ceramic membrane based microfiltration of oil-in-water emulsions
Various industries, including metallurgical, petroleum, and food processing produce highly
concentrated (500-1000 mg/L) oil-in-water emulsions (Ezzati et al., 2005; Mohammadi et
al., 2004; Abadi et al., 2011), which are harmful threat to aquatic and human life. The
destructive impact of oil-in-water emulsions on ecosystems and environment necessitates the
separation of oil from oily wastewater from ecological safety perspective (Yang et al., 1998).
Thereby, maximum discharge values have been set to restrict oil/grease concentration in

34
industrial effluents by pollution control board and several government agencies. Therefore,
several researchers have been exploring new technologies and to upgrade existing
technologies to produce treated oily wastewater with oil concentration below the standard
discharge limit i.e. 5-10 mg/L (Cumming et al., 2000; Hua et al., 2007; Abadi et al., 2011;
Cui et al., 2008). In the last two decades, several methods such as electrocoagulation process
(Bensadok et al., 2008), coagulation (Zouboulis et al., 2000), dissolved air floatation (Al-
Shamrani et al., 2002), gravity separation (Krebs et al., 2012), de-emulsifications process
(Salam et al., 2013), skimming (John, 2010) and flocculation (Kang et al., 2012) have been
suggested and studied for the separation of oil from oily wastewater. Among these, many
methods are not efficient to achieve the norms/standards set by the pollution control agencies.
Further, they also produce a secondary waste stream/product in large quantities (Ahmadun et
al., 2009). In the past few years, owing to their promising features such as higher chemical,
mechanical and thermal stability, longer shelf life, excellent defouling characteristics, good
combinations of separation efficiency and membrane flux and susceptibility and ease for
process clean up, there is a renewed interest in ceramic membranes for industrial
applications. (Abadi et al., 2011; Zhong et al., 2003; Monash and Pugazhenthi, 2011).
Thereby, ceramic membrane technology has been proven for the treatment of industrial
effluents, including pharmaceutical, beverages, refinery, dairy, food and electronic industry
(Singh, 2015).
Cui et al. (2008) prepared NaA/Al2O3 zeolite ceramic composite membranes with average
pore sizes of 1.2 µm, 0.4 µm and 0.2 µm. Thereby, membranes with pore sizes of 1.2 and 0.4
µm were utilized for oil-in-water emulsion treatment at a feed concentration of 100 mg/L.
The authors reported that the permeate contained oil concentration lower than 1 mg/L and the
wider pore size membrane provided 99% oil rejection and 95 L/m2 h at 50 kPa trans-
membrane pressure.

35
Nandi et al. (2010) reported mixed clay based membranes for oil-in-water emulsion
treatment. For a feed concentration of 250 mg/L, the authors reported 98.8% oil rejection and
5.36×10⁻⁶ m3/m2 s flux after 60 min of dead end MF at 68.95 kPa trans-membrane pressure.
Using commercial ceramic membrane, Lobo et al. (2006) studied the effect of pH and cross
flow velocity on the ultrafiltration of oil-in-water emulsion. They observed that the COD
retention varied from 92-96% and decreased significantly at lower pH of the solution. The
authors also observed higher concentration polarization at lower cross flow velocity.
Rezvanpour et al. (2009) used two commercial membranes (cellulose and polysulphone) to
study the effect of different parameters (type of membrane, transmembrane pressure, feed
concentration, cross-flow velocity and pH) on the ultrafiltration of kerosene-water emulsion.
Their results affirmed upon higher permeate flux for membrane with high pore size and
stronger hydrophiliicity and constant permeate flux at 3 bar. Further, the authors reported that
the membrane flux reduced with feed oil concentration and did not enhance significantly with
variation in cross-flow velocity, pressure and pH.
Yang et al. (1998) have prepared ZrO2/α-Al2O3 composite ceramic membranes with pore size
of 10 nm, 0.2 μm, 1.0 μm and 0.2 μm for oil-in-water emulsion treatment. The experiments
were conducted at 0.1-0.15 MPa transmembrane pressure and 3-5 m/s surface velocity. The
membranes provided an oil rejection and membrane flux of 99.8, 99.9, 94.3, 99.8% and 18,
22, 27, 93 L/m2 h bar, respectively.
Hua et al. (2007) reported the performance of α-Al2O3 ceramic membranes with an average
pore size of 50 nm for oil-in-water emulsion treatment. The authors investigated the effect of
various operating parameters including trans-membrane pressure (TMP), cross flow velocity
(CFV), feed oil and salt concentration and pH on total orgonic carbon (TOC) removal and
membrane flux. The authors obtained 92.4% TOC removal efficiency for all experimental

36
conditions and higher membrane flux at combinations of higher TMP, higher CFV and lower
feed oil concentration. Further, membrane flux increased significantly for pH variation from
3.8 – 5.8.
Cumming et al. (2000) used polyvinyl-pyrrolidone (PVP) coated commercial membranes
with various pore sizes (2, 5, 8 and 10 μm) for microfiltration of oil-in-water emulsion. They
studied the influence of pore size on filtration flux and oil rejection for 1000 mg/l feed oil
concentration. The 2 μm filter exhibited a membrane flux of 215 L/m2 h at trans-membrane
pressure (TMP) of 450 Pa which reduced to 107 L/m2 h at a TMP of 2860 Pa. The larger pore
size (5, 8 and 10 µm) filters exhibited flux values of 202, 227 and 381 L/m2 h, respectively at
450 Pa, which are comparable to that obtained for 2 μm filter. The authors also predicted oil
rejection for all membranes using relevant modeling procedures. It has been reported that the
predicted rejection was significantly close to that measured for 2 μm filter (99-96% at 470 –
2800 Pa TMP). Also, the deviation between predicted and measured rejection has been
evaluated to be increasing with an increase in the pore size of membrane.
Using sol-gel method, Benito et al. (2005) deposited intermediate α-Al2O3 and top γ-Al2O3
layer on alumina supports. The composite membrane has been characterized to possess a top
layer with 4 nm average pore size and 72% porosity. The authors investigated the effect of
sol concentration and calcinations temperature on the membrane structure to achieve optimal
pore size and porosity.
Mueller et al. (1997) used α-alumina ceramic membranes (0.2, 0.8 μm pore size) and surface
modified polyacrylonitrile membrane (0.1 μm) for the cross flow microfiltration of oil-in-
water. The membranes were evaluated to have significant fouling and flux decline during MF
operation. The membranes provided different initial fluxes which culminated to be similar
final fluxes (30-40 kg/m2 h) after 2 h of MF with 250 ppm feed oil concentration at 10 psig
trans-membrane pressure (TMP).

37
Zhong et al. (2003) studied oil-in-water emulsion treatment using flocculation and subsequent
MF based treatment of flocculated effluents using 0.2 μm ZrO2 membrane. Their
investigations affirmed that flocculation reduced membrane fouling and enhanced membrane
flux and permeate quality. The authors also evaluated the effect of TMP, CFV on flux and
permeate quality. Based on their investigations, the authors reported that the optimal TMP
and CFV values are 0.11 MPa and 2.56 m/s, respectively.
The treatment of oil-field produced waters was conducted by Ebrahimi et al. (2009) using
various membranes. The authors carried out cross-flow MF pre-treatment with optional UF
and NF processes to evaluate upon average flux and TOC removal efficiency. The MF
process involved the utilization of 0.1 and 0.2 μm membranes. The 0.1μm membrane
exhibited membrane flux variation from 1150 – 200 L/m2 h for a time period of 1 – 5 h with
58-59% oil and 33.39% TOC removal at 1 bar TMP. The 0.2 μm membrane provided flux
decline from 300 to 55 L/m2 h and 82% of oil, 27% of TOC removal at 1 bar TMP. Utilizing
a 0.05μm membrane, the UF process achieved 99% of oil, 39% of TOC removal at 1 bar
TMP for 120 min time period. Similarly, the NF process was reported to provide 84% oil
removal at 1 bar and 60 min time period.
With alumina as support, Wang et al. (2000) used alumina and zirconia as top layers for two
different membranes for the treatment of waste rolling emulsion. The membranes with an
average pore size of 0.1 – 0.2 μm were evaluated to provide good combinations of oil
rejection (99.9% and 99.8% for zirconia and alumina composite membrane, respectively) and
membrane flux (100 L/m2 h and 43 L/m2 h for zirconia and alumina composite membrane,
respectively).
Hyun et al. (1997) used commercial α-alumina tubes (35% porosity and 0.8 µm average pore
size) and prepared alumina and zirconia composite membranes by coating slurries (α-alumina
slurry with particle size of 0.6 µm; zirconia slurry with particle size of 0.4 µm; 2-propanol as

38
dispersion medium and ethyl cellulose as binder) on support surface via reverse dip-drawing
technique. The membranes were calcined at 1200 and 950 °C, respectively. The effective
average pore size of alumina and zirconia membranes were 0.16 µm and 0.07 µm,
respectively. Oil (Kerosene) separation ability of membranes were tested in the crossflow
microfiltration system at transmembrane pressure of 0.98-2.94 bar, cross flow velocity of
0.27-0.55 m/s and oil-in-water emulsion concentration of 600-11000 ppm. At lower feed
concentration of 600 ppm, TMP 2.94 bar, CFV at 0.27 m/s condition, alumina membrane
exhibited flux of 280 (L/m2 h) and 95.7% rejection of oil, while zirconia membrane provided
40 (L/m2 h) flux and 96.7% oil rejection.
Li et al. (2006) fabricated surface modified Al2O3 membrane for the treatment of oil-in-water
emulsions (15.5 mg/L) in cross flow operation. The authors achieved 98.04% rejection and
149.81 L/m2 h bar membrane flux at 7.8 m/s cross flow velocity.
Zhou et al. (2010) used a commercial tubular alumina membrane (average porosity of 40%
and average pore size of 0.2 µm) and fabricated zirconia-alumina composite membrane by
dip coating method for the treatment of engine oil emulsions (20 engine oil (1 g/L), Tween 80
(0.5 g/L), span 80 (0.5 g/l) with an average droplet size of 1.79 µm. The authors obtained a
maximum permeate flux of 506 L/m2 h and rejection of 97.8% for zirconia-alumina at cross
flow velocity of 5 m/s and TMP of 0.16 MPa.
Abbasi et al (2010) used kaolin, clay and alumina powder to fabricate mullite and mullite-
alumina based ceramic membrane for the cross flow microfiltration of oil-in-water emulsions
with a feed concentration of 250 mg/L. Cylindrical shaped mullite membrane was prepared
with extrusion method and calcined at 1250 °C (1350 °C for mullite-alumina). The prepared
mullite membrane possessed an average pores size of 0.289 µm, porosity of 32% (56% for
mullite-alumina) and provided a membrane water flux of 18 L/m2 h (582 L/m2 h for mullite-
alumina) at 1 bar and 1 m/s CFV. The authors reported a maximum membrane flux of

39
72.7 L/m2 h (244 L/m2 h for mullite-alumina) and rejection of 93.8% (81.3% for mullite-
alumina) for the mullite membrane.
Abadi et al (2011) used a tubular commercial ceramic α-alumina membrane for the
microfiltration of oil-in-water emulsions in cross flow operation. The prepared membrane
with an average pore size of 0.2 µm and 33% porosity provided a maximum membrane flux
of 290 L/m2 h at 1.25 bar TMP, 2.25 m/s and 32.5 °C.
Masoudnia et al. (2013) used 0.45 µm pore sized polivinylidene fluoride (PVDF) membrane
for the treatment of 3000 ppm synthetic oil-in-water emulsion. For a cross-flow Reynolds
number of 2500 and 1 bar TMP, the membrane provided 80% oil removal and membrane flux
of 1151.2 kg/m2 h.
Vasanth et al. (2013) prepared kaolin membrane for the microfiltration of oil-in-water
emulsions using cross flow operation. The prepared membrane has an average pore size of
1.06 µm and porosity of 26%. The authors reported a maximum membrane flux of 1990 L/m2
h and rejection of 87% at 207 kPa.
Zhu et al. (2016) applied TiO2-Mullite composite membrane for the treatment of 200 mg/L
oil-in-water emulsion. The authors obtained maximum membrane flux (150 L/m2 h bar) and
rejection (97%) at 0.025 bar and 0.15 m/s cross flow velocity.
Hu et al. (2015) modified commercial Al2O3 MF membrane (average pore size 200 nm) with
graphene oxide (GO) by adopting vacuum based transfer method. The membranes were
subjected to cross flow microfiltration of oil-in-water emulsion (Machine oil concentration of
1 g/L; average droplet size of 1.8 µm) at 1 bar TMP and cross flow rate of 5 m3/h. The
modified membranes provided a flux of 667 L/m2 h bar, (522 L/m2 h bar unmodified) and
98.7% of rejection (98.1% unmodified), respectively.
A summary of literature reviews on separation of oil-in-water emulsion with various
membranes is listed in Table 1.7.

40
Table 1.7: Literature reported data for (a) dead-end and (b) cross flow MF of oil-in-water
emulsions.
(a) Dead end flow
Author Pore
Size
(µm)
ΔP
(kPa)
C0
(mg/L)
Membrane
flux (m3/m2 s)
Rejection
(%)
Monash and
Pugazhenthi, (2011)
1.30 276.4 125 2.21×10⁻⁶ 85
Nandi et al. (2009) 0.98 345.4 200 2.31×10⁻⁷ 96
Vasanth et al. (2011) 0.55 41.37 50 3.28×10⁻⁷ 97.3
Vasanth et al. (2013) 1.06 69 200 2.34×10⁻⁶ 96
(b) Cross flow
Author Type of
membrane
Pore
size
(µm)
C0
(mg/L)
CFV
(m/s)
ΔP
(kPa)
Membrane
flux (m3/m2 s)
Rejection
(%)
Li et al.
(2006)
Al2O3-PVDF - 15.5 7.8 100 4.16×10⁻⁵ 98.04
Hua et al.
(2007)
α-Al2O3 0.05 500 1.68 100 1.78×10⁻⁵ 98.1
Zhou et al.
(2010)
ZrO2-Al2O3 0.2 1000 5 0.16 - 98.7
Abadi et al.
(2011)
α-Alumina
(Commercial)
0.2 92 2.25 127.1 69.4×10⁻⁶ 95
Abbasi et al.
(2010)
Mullite-
alumina
0.57 500 1.5 305.1 27.7×10⁻⁶ 93.8
Vasanth et al.
(2013)
Low cost
clays
1.06 100 13.9
×10-7
m3/s
207 55.4×10⁻⁶ 87

41
1.3.5 Response Surface Methodology (RSM)
The removal of oil droplets from oil-in-water emulsions depends on the feed characterization
parameters, membrane properties and operating parameters. In general, initial feed
concentration, applied pressure and cross flow rate are prominent microfiltration process
parameters that critically influence the process efficacy (Masoudnia et al., 2013). Based on
rigorous experimentation and modeling approaches, optimization methodologies can be
adopted to identify optimal process variables in the MF of oil-in-water emulsions.
Optimization of MF process parameters is extremely important to visualize the potential of
the membrane process in terms of cost minimization for desired flux and rejection
combinations (Montgomery, 2001).
While classical optimization processes are well known for process optimality, they require
efficient model development that demands significant man power requirements for model
fitness and experimental investigations. On the other hand, multivariate statistical methods
are highly effective and preferable for the study of interactions among factors and thereby
allow the identification of optimal process parameter values for which treatment cost and
operational time would be minimal (Montgomery, 2001). The statistical experimental design
implicates the approximating the coefficients involved in the mathematical model, checking
the adequacy of the model and predicting the response. Many researchers used central
composite design (CCD) method to estimate response surface (Montgomery, 2001;
Abadikhah, 2015).
Recently, few researchers (Salahi et al., 2013; Abadokhah et al., 2014; Jokic et al., 2010;
Rastegar et al., 2011) used RSM to analyze the variation of performance involved during
wastewater treatment. This is due to the reason that RSM facilitates effective search in the
design space, which is not possible in conventional experimentation that involves discretized
variation in a parameter of interest for constant values of all other parameters. Thus, RSM

42
with its ability to provide maximum or minimum reference points further extends the
limitations of experimental investigations in the design space (Jokic et al., 2010). Thereby,
the methodology allows the identification of influential or significant terms that contribute
towards process efficiency with small number of simulation experiments.
Jokic et al. (2010) used a commercial ceramic membrane for cross flow microfiltration of
yeast suspensions. Further, RSM via Box-Behnken design was employed for the optimization
of process parameters (TMP: 0.2-1.0 bar; feed flow rate: 80-180 L/h; concentration: 2-10
g/L) and considered responses as permeate flux, reduction of specific energy consumption
(ER). Finally, authors reported the optimal conditions for MF process at 1 bar TMP, 2 g/L
concentration and feed flow rate 122.70 L/h at which the optimal values for membrane flux
(189.53 L/m2 h) and ER (44.36%) were obtained with 0.964 desirability.
Yi et al. (2011) studied the optimization of process conditions using RSM methodology for
anionic polyacrylamide (APAM)-oil-in-water emulsion treatment using polyvinylidene
fluoride (PVDF) membrane modified by TiO2/Al2O3 materials. The authors obtained an
optimal permeate relative flux ratio (J/J0) of 21.51% at optimal process conditions of CAPAM
(20 mg/L), Coil (20 mg/L), pH (2) and TMP (0.05 MPa).
Salahi et al. (2013) have used polyacrylonitrile membrane during cross flow MF of oily
wastewater. The MF process was optimized using RSM tool with which the optimal process
conditions have been identified as 45 oC feed temperature, 4 bar TMP, 1.3 m/s CFV, 10 pH
and 11.2 g/L salt concentration. At these conditions, optimal permeate flux was obtained as
180.1 L/m2.h for a corresponding measurement based flux value of 172.75 L/m2 h.
Sadeghian et al. (2015) studied the application of RSM to optimize operating conditions
during ultrafiltration of oil-in-water emulsion. The optimum conditions were obtained as 1
bar and 3 m/s for TMP and velocity, respectively at which the optimal process variable values

43
were 79%, 77% and 50 L/m2 h for turbidity removal, COD removal and permeate flux,
respectively.
Arzani et al. (2016) have employed CCD based RSM to examine the effects of three
operating parameters namely NaOH solution temperature (30-90°C), NaOH solution
concentration (5-45 wt%) and removal time (2-10 h) on free silica removal of mullite
microfiltration membranes. The authors reported that the optimal process conditions
correspond to 75°C of NaOH solution temperature, 35 wt% of NaOH solution concentration
and 8 h as removal time at which the optimal porosity has been evaluated to be 49.4%.
Corresponding experimental value for the variable is 48.3%.
Table 1.8 presents RSM based optimization for various MF processes.

44
Table 1.8: Response surface methodology based optimization for various MF processes
Author Membrane Feed RSM tool Process
parameters
Optimal Responses
Experimental Predicted
Jokic et al.
(2010)
TAMI (Commercial)
Yeast
suspensions
Box-
Behnken
TMP: 0.2 – 1.0 bar
CFV: 80 - 180 h
C0 = 2 -10 g/L
TMP: 1 bar, CFV = 130 L/h, Co =
2 g/L, Flux = 189.2 L/m2.h and
ER = 34.55%
TMP: 1 bar, CFV = 130 L/h, Co = 2
g/L, Flux = 189.5 L/m2.h and ER =
44.36%
Yi et al. (2011) TiO2/Al2O3 PVDF APAM-oil-
emulsion
Central
composite
rotatable
design
(CCRD)
CAPAM oil: 0-200 mg/L
Coil: 0-200 mg/L,
TMP: 0.05-0.15 MPa
CTDS: 0-8000 mg/L
pH: 1-13.
CAPAM oil: 20 mg/L
Coil: 20 mg/L
TMP: 0.05 MPa
pH: 2
Relative flux (21.51%)
CAPAM oil: 20 mg/L
Coil: 20 mg/L
TMP: 0.05 MPa
pH: 2
Relative flux (19.34%)
Salahi et al.
(2013)
Polyacrylonitrile Oily
wastewater
Box-
Behnken
TMP: 0.5-4.5 bar
CFV: 0-1.5 m/s)
C0: 0-200 g/L
pH: 4-10
Temperature: 25-50 °C.
TMP: 4 bar
CFV: 1.3 m/s)
C0: 11.2 g/L
pH: 10
Temperature: 45 °C
Flux (172.75 L/m2 h)
TMP: 4 bar
CFV: 1.3 m/s)
C0: 11.2 g/L
pH: 10
Temperature: 45 °C
Flux (180.1 L/m2 h)
Sadeghian et al.
(2015)
Polyvinylidene
fluoride membrane
Oil-in-water
emulsion
CCD TMP: 0.7-2.8 bar
CFV: 1.0-4.2 m/s.
TMP: 1 bar
CFV: 3.16 m/s
Flux (50 L/m2 h); turbidity
(79%); COD (77%)
TMP: 1 bar
CFV: 3.16 m/s
Flux (50.66 L/m2 h); turbidity
(78.83%); COD (76.63%)
Arzani et al.
(2016)
Mullite Free silica
removal
CCD TNaOH: 45-90 °C
Removal time: 4-10 h
CNaOH : 15-45 wt%.
TNaOH: 75 °C
Removal time: 8 h
CNaOH : 35 wt%
Porosity (48.3%)
TNaOH: 75 °C
Removal time: 8 h
CNaOH : 35 wt%
Porosity (49.4%)

45
1.4 Possible scope for further research
Despite having few limitations, membrane based separation processes have been proven to be
effective for the separation of oil from oily wastewater (Alzahrani et al. 2014; Padaki et al.,
2015). For instance, reverse osmosis requires high-applied pressure in treatment and RO
membranes have low permeability induced high fouling problem (Jamaly et al., 2014). Also,
due to lower pore size, ultrafiltration (Wijmans et al., 1984; Berg and Smolders, 1990; Garcia
et al., 2012) and nanofiltration (Bruggen et al., 2008; Mohammad et al., 2015; Masoudnia et
al., 2013) produce lower permeate flux. Therefore, microfiltration is promising due to its
higher water permeability and lower pressure requirements (Abadi et al., 2011; Yang et al.,
1998; Cui et al., 2008; Masoudnia et al., 2013).
Broadly, further research in the field of MF range ceramic membranes can be addressed in
three areas. Firstly, preparation and characterization of inexpensive ceramic membranes with
optimized compositions is to be addressed. Secondly, application of prepared membranes is
to be targeted. Thirdly, theoretical insights to experimental data can be carried out to
visualize deeper aspects of parametric optimality. The following sub-sections detail upon
these issues:
1.4.1 Preparation, characterization and application of ceramic membranes from mixed
clays
Till date, among various materials, α-alumina (Lin and Burggraaf, 1991), γ-alumina
(Defriend et al., 2003), zirconia (Yang et al., 1998), TiO2 (Wang et al., 2006) and silica
(Yoshino et al., 2005) based ceramic membranes have been extensively studied. These
membranes are expensive due to the higher cost of raw materials and higher sintering
temperature (1300 oC). Therefore, the process cost is significantly high for these membranes
and hence ceramic membranes are likely not to be applied in industrial process schemes.

46
Alternative approaches to reduce the high cost of ceramic membranes refer to the utilization
of cheaper inorganic precursors (raw clay (Saffaj et al. 2005), Moroccan clay (Saffaj et al.,
2004), powdered apatite (Masmoudi et al., 2007), dolomite (Zhou et al., 2010), kaolin
(Bouzerara et al. 2006), Tunisian clay (Khemakhem et al., 2006), sepiolite clay (Weir et al.,
2001) and Algerian clay (Khider et al., 2004)) with which the sintering temperature can be
significantly lowered to 900 – 1100 oC. Further, Xia and Liu (2001) indicated that uni-axial
dry compaction method is an inexpensive method and can be used to prepare membranes on a
laboratory scale (Xia and Liu, 2001). While reported compositions of inorganic materials in
the literature for inexpensive ceramic membrane preparation refer to the utilization of
materials such as quartz, CaCO3, kaolin and feldspar, ceramic membranes have not been
reported till date with both conventional materials (quartz, calcium carbonate, etc.) with
waste materials such as fly ash. Therefore, the preparation, characterization and application
of ceramic membranes that consist of the said materials is to be targeted first to judge upon
the utility of fly ash for membrane preparation. Based on the membrane performance, further
improvement in inorganic material composition can be targeted.
1.4.2 Preparation, characterization, optimization and application of low cost fly ash
based ceramic membranes
In the previous sub-section, research efforts have been dovetailed towards the verification of
fly ash as an important constituent in inexpensive ceramic membrane fabrication. However,
a key feature of the mixed clay membranes is that the membranes consist of significantly
higher quantities of materials other than fly ash. In this regard, it is important that fly ash
constitutes the highest composition in the ceramic membranes and only in such a scenario,
the membrane cost would be significantly lower due to the enhanced utilization of waste
material for value added product development. Therefore, the thesis need to eventually target

47
the preparation and characterization of inexpensive fly ash based ceramic membranes, which
need to have significantly different composition than those reported for mixed clays in the
literature (Abadi et al., 2011; Yang et al., 1998; Cui et al., 2008). The fly ash based ceramic
membrane cost is expected to be significantly low due to three reasons, namely significant
utilization of fly ash waste material whose value is insignificant, lower sintering temperature
(1100 oC) and simpler fabrication method such as uni-axial dry compaction method.
Thereby, the thesis primarily targets the resolution of environmental issues associated to fly
ash by producing a value added product such as ceramic membrane with applications such as
treatment of oily wastewater streams.
1.4.3 Preparation, characterization and application of TiO2–Fly ash composite
membrane
Generally, ceramic clay and polymeric membranes are characterized to be hydrophobic. Due
to this feature, these membranes require higher transmembrane pressure (in the order of
several bars) to separate water from other constituents (Chakrabarty et al., 2008). Hence,
quicker flux decline, greater fouling and lower flux are apparent. To counter such effect,
surface modification techniques are adopted to enhance the hydrophilicity of the membranes
(Li et al., 2009; Ahmad et al., 2011; Yi et al., 2011; Sadeghian et al., 2015). The hydrophilic
surface modification refers to the deposition of hydrophilic nanoparticles of various materials
such as γ-Al2O3 (DeFriend et al., 2003), ZrO2 (Zhou et al., 2010) and TiO2 (Chang et al.,
2014) in the ceramic membrane porous structure. These nanoparticles enable an
enhancement in the hydroxyl groups existent on the membrane surface and hence greater
hydrophilicity and reduction in transmembrane flux decline (Tsuru et al., 2008; Pan et al.,
2012). Among several mentioned materials, titania and alumina are inexpensive materials for
the alteration of morphological and separation characteristics of ceramic membranes. Among

48
these two, titania is inexpensive compared to alumina and therefore the first choice in this
section is to fabricate titania composite membrane.
Generally, hydrothermal method was extensively used to deposit TiO2 and Al2O3 particles on
the ceramic clay supports (Chou et al., 1999; Wang et al., 2007) but not on fly ash membrane
supports. In this method, usually, alkoxide precursors of alumina are used which are
expensive and significantly toxic (Patterson et al., 2006). However, for the same method, the
utilization of TiCl4 instead of titanium butoxide, titanium-isopropoxide is promising due to its
lower cost and relatively non-toxic nature (Zhang et al., 2001).
In the available prior-art, titania composite membranes have been prepared utilizing mixed
clay (Chou et al., 1999), α-Al2O3 (Chowdhury et al., 2003; Li et al., 2006) and Cordierite
(Saffaj et al., 2004) as supports. However, TiO2-fly-ash composite membrane has not been
reported in the literature till date (Dong et al., 2010; Fang et al., 2011; Jedidi et al., 2011).
Therefore, there is scope to fabricate a new low cost and non-toxic TiO2 composite
membrane. Needless to convey, the ceramic membranes shall also have better separation
efficiencies towards the separation of oil-in-water emulsions. Hence, the next area of
research that needs to be addressed in this work is with respect to the preparation,
characterization and application of low cost TiO2-fly ash composite membranes.
Also, the application of TiO2-fly ash composite membrane needs to target the cross-flow
microfiltration of oil-in-water emulsions as these studies would ensure the actual
performance of the membranes for synthetic emulsions. This may not be the case for dead-
end microfiltration studies.
1.4.4 Response Surface Methodology for the MF performance of membranes
Till date, RSM based parametric analysis and optimization have been studied for various
processes including nanofiltration (Salahi et al., 2013; Abadikhah et al., 2014), microfiltration
(Jokic et al., 2010, Rastegar et al., 2011), biosorption (Ghaedi and Kokhdan, 2015),

49
adsorption (Savasari et al., 2015; Santos and Boaventira, 2008), electrocoagulation (Tir and
Moulai-Mostefa, 2008; Chavalparit and Ongwandee, 2009; Gengec et al., 2012; Un et al.,
2014; Olmez et al., 2009), electrochemical (Thirugnanasambandham et al., 2015; Kushwaha
et al., 2010; Yue et al., 2015; Mohajeri et al., 2010; Korbahti and Tanyolac, 2008),
coagulation-flocculation (Wang et al., 2014; Wang et al., 2011; Wang et al., 2007; Ghafari et
al., 2009; Tringh and Kang, 2011; Jadhav and Mahajan, 2014), ion exchange (Bashir et al.,
2010) and wet peroxide oxidation (Shi et al., 2014). In the field of microfiltration, very few
studies were conducted and only one study carried out RSM analysis for oil-in-water
emulsion treatment using ceramic membranes. Hence, it can be concluded from the prior-art
that while RSM is a useful technique for the optimal analysis of flux and rejection
characteristics with variation in process parameters. The RSM based oily wastewater
treatment using ceramic membrane based microfiltration process has not been reported till
date and is the primary objective of this work.
Thus, there is enough scope to conduct research and examine the optimality of dead-end and
cross flow MF process parameters for oil-in-water emulsion treatment using several
membrane data obtained in this work. Based on further analysis of experimental data, the
research has been confined to fly ash and titania-fly ash composite membranes.
1.4.5 Preparation, characterization and application of TiO2–clay, γ-Al2O3– clay and clay
membranes
After a thorough examination of available prior-art, it is also apparent that the additional
research in the preparation, characterization and application of titania, γ-alumina-clay
composite membranes is also beneficial for a comparative outlook with respect to titania-fly
ash membranes. Also, while literature refers to experimental investigations for higher oil feed
concentration, studies are scarce with feed concentration as low as 250 mg/L. Therefore,
there is enough possible scope for the preparation, characterization and application of clay

50
and titania/γ-alumina clay composite membranes so as to infer upon the performance
efficiency of fly ash membranes from both experimental and theoretical point of view. The
titania and γ-alumina layer on the clay membranes are to be targeted using hydrothermal
method. Further, the membranes have been investigated for their separation characteristics
during dead-end MF operation.
1.4.6 Cross flow microfiltration studies for TiO2–clay and clay membranes
Till date, several investigations targeted the microfiltration of titania-clay (Chou et al., 1999;
Saffaj et al., 2004) and clay membranes (Potdar et al., 2002; Benito et al., 2005; Nandi et al.,
2010; Fang et al., 2013). However, it is well known that the clay membrane performance is a
strong function of its composition. Therefore, the clay membranes prepared in this work
have to be judged so as to understand upon their real performance. This is also due to the fact
that membranes prepared with uni-axial dry compaction method may not have exactly similar
morphology than those prepared with other methods such as extrusion, slip casting, etc.
Therefore, while data is available in the literature for the said membranes, cross flow
microfiltration has to be conducted for these membranes to infer upon the optimality of fly
ash based composite membranes for oil-in-water emulsion treatment.
1.5 Objective of the Thesis
Based on the state of the art presented in sections 1.2.1 to 1.2.4, the PhD thesis targets the
fulfillment of the following major objectives:
1. Preparation, characterization and application of
a) ceramic membranes from mixed clays
b) low cost fly ash based ceramic membranes
c) TiO2-Fly ash composite membrane
d) TiO2–clay and γ-Al2O3–clay and clay membranes

51
2. Cross flow microfiltration of oil-in-water emulsions using TiO2–clay and clay
membranes
3. RSM based optimization of process parameters of dead-end and cross-flow MF of oil-
in-water emulsions using fly-ash and titania-fly ash membranes.
1.6 Organization of the Thesis
The PhD thesis is organized in eight chapters. A brief account of the chapters in the thesis is
presented in the following paragraphs:
Chapter 1 addresses the available prior-art in the chosen area of research and possible scope
for further research followed with objective and organization of the thesis.
Chapter 2 addresses the experimental and modeling methodology adopted in the Ph.D.
thesis. Precisely it refers to (a) preparation of inexpensive mixed clay, fly ash, titania-fly ash,
titania-clay, γ-alumina-clay and clay ceramic membranes (b) characterization of membranes
using XRD, TGA, BET, PSD, FTIR, FESEM, mechanical and chemical stability, porosity,
nitrogen and water permeation tests and average membrane pore size determination
procedures (c) preparation of synthetic crude oil-in-water emulsions (d) dead-end and cross-
flow MF of oil-in-water emulsions and (e) RSM based parametric optimization of dead-end
and cross-flow MF performance of various ceramic membranes.
Chapter 3 describes the results obtained for inexpensive mixed clay membranes. These
include characterization and dead-end MF performance of oil-in-water emulsions. This refers
to the evaluation of flux and rejection characteristics during MF studies.
Chapter 4 elaborates upon the results obtained for fly ash based membranes. These pertain to
surface and membrane characterization and dead-end MF performance (flux and rejection
characteristics) for oil-in-water emulsion treatment. Subsequently, the chapter applies RSM
methodology for the identification of optimal process conditions during dead-end MF studies.

52
Chapter 5 summarizes the results obtained for the TiO2-fly ash inexpensive ceramic
membranes. These include the results obtained from characterization and cross-flow studies
for flux and rejection characteristics. Thereby, RSM based optimization was conducted for
the cross-flow MF data to evaluate upon the optimality of process parameters such as feed
concentration, cross-flow velocity and operating pressure.
Chapter 6 addresses the results obtained for TiO2-clay, γ-Al2O3 –clay and clay membranes.
These include characterization results and the dead-end MF performance of the membranes
for oil-in-water emulsions. Based on the obtained data, best membrane has been identified.
For the best membrane identified in Chapter 6, Chapter 7 presents the cross-flow MF based
comparative assessment of clay composite and clay membranes. For the obtained data,
fouling analysis was conducted using pore blocking models.
Chapter 8 summarizes the conclusions obtained from the research output in this work.
Eventually, based on the insights of the obtained data and research methodologies, the
chapter also outlines possible directions for future work.

53
CHAPTER-2
Materials and Methods

54

55
CHAPTER 2 Materials and Methods
Section 2.1 addresses the preparation and characterization of ceramic membranes (SP1-SP4)
from mixed clays. This section also presents dead end microfiltration experiments for the
removal of oil. Section 2.2 addresses the preparation, characterization, optimization and
application of low cost fly ash based ceramic membranes (M1-M3), which were
manufactured with variant pore sizes by altering the compositions of the low cost ceramic
precursors. Section 2.3 summarizes the preparation and characterization of TiO2-Fly ash
composite membrane and explains RSM modeling approaches for cross flow MF of oil-in-
water emulsions. Section 2.4 addresses the preparation, characterization and application of
TiO2-clay, γ-Al2O3-clay and clay membranes. Along with membrane fouling analysis, Section
2.5 presents the cross flow MF studies of TiO2-clay and clay membranes for the separation of
oil from synthetic oil-in-water emulsions.
2.1 Preparation, characterization and application of ceramic membranes
from mixed clays
2.1.1 Starting materials
The composition of raw materials used for the fabrication of ceramic membranes was listed
in the Table.2.1. Quartz was collected from Kanpur, India. Calcium carbonate, TiO2 were
procured form Merck (I) Ltd. Fly ash was collected from Guwahati, India. All the raw
materials were used as received without any further purification. Millipore water obtained
from Millipore system (ELIX-3) was used throughout this work.

56
2.1.2 Fabrication
The fabrication procedure of membrane was schematically represented in Fig. 2.1 (a and b).
Table 2.1: Composition of raw materials used for fabrication of ceramic membranes
Raw materials Quartz (g) CaCO3 (g) Fly ash (g) TiO2 (g) WTiO 2/ WFly ash
Membrane, SP1 30 20 50 0 0
Membrane, SP2 30 20 40 10 0.25
Membrane, SP3 30 20 30 20 0.67
Membrane, SP4 30 20 20 30 1.50
The raw materials listed in Table 2.1 were mixed in a ball mill at 40 rpm for 20 min. The
resulting powder was then sieved using 30 mesh standard screens and requisite amount was
pressed in a hydraulic pressing machine at a pressure of 50 MPa with the help of stainless
steel mould. The obtained circular disk-shaped membranes were first dried at 100 oC and then
at 200 oC for 24 h in a hot air oven (make: Reico, India; model: ROV/DG). The above
controlled drying process ensures a maximum removal of moisture and also reduces any
thermal stress during moisture removal. Subsequently, the membranes were sintered at 1100
oC for 6 h in a muffle furnace (make: Lab Tech, Korea; model: LEF-115P-2) with a
controlled heating rate. After sintering, the rigid and porous ceramic membranes were
polished on both sides using silicon carbide abrasive paper (No.C-220) to obtain ceramic
membranes with uniform surface. Then these membranes were washed with Millipore water
in an ultrasonic bath [make: Elma, India; model: T460] for 15 min to remove the loose
particles adhered on the surface of membranes.

57
Figure 2.1 (a): Schematic for the preparation of low cost ceramic membrane supports
(SP1-SP4)
Raw materials
Mixing in ball mill (40 rpm, 20 min)
Dry compaction at 50 MPa
Drying 100 oC for 24 h
Drying 200 oC for 24 h
Membrane sintering (1100 oC)
Polishing the membrane
Ultra-sonication to remove the loose particles
Membrane drying at 110 oC
Characterization

58
Figure 2.1 (b): Photograph of hydraulic machine, unsintered membrane, sintered
membrane and polished membrane
Hydraulic press
Unsintered
Sintered
Shaped
Mould

59
2.1.3 Characterization
The characterization of raw materials and membrane were done by particle size distribution
(PSD), X-ray diffraction analysis (XRD), morphological study using field emission scanning
electron microscope (FESEM), average porosity, mechanical and chemical stability
determination, and evaluation of average pore size and permeability of the ceramic
membrane.
2.1.3.1 Particle size distribution (PSD)
The particle size distribution (PSD) of the raw materials was performed by particle sizing
machine, Malvern Mastersizer 2000 (APA 5005® hydro MU, Malvern Instruments,
Worcestershire, U.K.) in wet dispersion mode.
2.1.3.2 X-ray diffraction analysis (XRD)
XRD analysis of the individual raw materials and ceramic membranes was conducted to
evaluate the extent of phase transformations during sintering by Bruker AXS instrument
(Karlsruhe, Germany) using CuKα (1.5406 Å) radiation operating at 40 kV and 40 mA. The
patterns were acquired for 2θ ranging between 1o and 80o with a scan speed of 0.5o/s.
2.1.3.3 Field emission scanning electron microscope (FESEM)
The images of membrane surface were taken to analyze the morphology of the membranes by
field emission scanning electron microscope (FESEM, ∑IGMA, Carl Zeiss). The membrane
samples were coated with gold to a thickness of approximately 150 Å. After that, FESEM
images of top surface of the membrane at different magnifications were obtained to calculate
the porosity and pore size of the membrane.

60
2.1.3.4 Porosity
Porosity of the membrane was determined using Archimedes’ principle. Firstly, the
membrane was dried in a hot air oven at 110 oC for 6 h to remove complete moisture present
in the membrane and its dry weight (WD) was determined. Then, it was immersed in water for
24 h. After that, the membrane was removed and water on the outer surface was removed
using tissue paper and the wet weight of the membrane (WW) was measured. Then the
membrane was immersed in water to measure the weight of the membrane when it was
saturated with water (WA). The porosity (ε) of the membrane was determined using the
following relation (Monash and Pugazhenthi 2011; Laux et al., 2005):
W D
W A
W W
W W
(2.1)
Surface porosity of the membranes was also estimated using images obtained from FESEM.
For this, ImageJ software (Open source software provided by National Institute of Health
(NIH), web link: http://rsbweb.nih.gov/ij/download.html) was adopted after thresholding
(threshold the pores) the 8-bit image using “Analyze particles” feature of this software. Since
the pores are interconnected during thresholding, the porosity of the membranes was
measured manually by choosing three rectangular sections (area) of four images of similar
magnification at different location.

61
2.1.3.5 Mechanical strength
The flexural strength of the membranes was tested with a three point bending method on
55×5×5 mm rectangular bars using Universal Testing Machine (DUTT-101, M/s Deepak
Polyplast, and Mumbai, India). The flexural strength was evaluated by the following
expression.
2
3
2
FL
bt (2.2)
Where, σ is the flexural strength (Pa), F is the load at the fracture point (N), L is the span
length (m), b is the width of the sample (m), and t is the thickness of the sample (m).
2.1.3.6 Chemical stability
Chemical stability of the membrane was determined by subjecting the membrane individually
into acid (pH 1) and alkali solution (pH 14). The pH of the solution was adjusted using HCl
and NaOH. The stability was measured in terms of mass loss before and after corrosion. For
this, the membrane was placed in acid and alkali solution for one week at atmospheric
condition. Then the membrane was taken out from the solution, washed with Millipore water
and dried at 110 oC for 6 h. The mass loss of the membrane characterizes the chemical
stability.
2.1.4 Dead end Microfiltration
2.1.4.1 Experimental set up
The water flux and hydraulic permeability of the membrane was determined using homemade
dead-end filtration setup made up of stainless steel. The setup (as shown in Fig. 2.2) used for
this experiment consists of two parts, a cylindrical top part and a base plate with a provision

62
to keep a membrane. The membrane was placed on a perforated casing and placed in the
bottom compartment. The upper compartment of the batch cell was pressurized using N2 gas
by setting a desired pressure through regulator attached with the nitrogen cylinder.
Figure 2.2: Schematic of dead-end microfiltration setup (1-N2 gas cylinder, 2-pressure
regulator, 3-connecting tube, 4-pressure gauge, 5-membrane, 6-rubber gasket, 7-top
compartment, 8-bottom base plate, 9-feed inlet and 10-permeate measuring cylinder).
2.1.4.2 Hydraulic permeability and average pore size of membranes
The hydraulic permeability and average pore size of the membranes were determined by
measuring their water flux using in-house made dead-end filtration setup (Fig 2.2). Prior to
the experiment, the pure water was passed through the membrane several times at higher
pressure to remove any loose particles present in the pores. After that, the water flux was
measured at different applied pressures (69-345 kPa). All the experiments were carried out by
filling 150 ml of Millipore water in the dead-end filtration setup. After discarding the first 50

63
ml of water at a fixed pressure, the time required to collect next 50 ml was noted down to
calculate the water flux at that particular applied pressure using the following equation:
33 2
w 2
V (Volume of water permeated, m ) J (Pure water flux, m /m s)=
A (Membrane area, m ) Δt (Time, s) (2.3)
The average pore size of the membrane in terms of radius is estimated by assuming presence
of cylindrical pores using the following equation deduced from Hagen-Poiseuille equation.
0.58 p h
m
l Lr
(2.4)
Where, rm is the pore radius of the membrane, Lh is the hydraulic permeability of the
membrane, μ is the viscosity of water, l is the pore length and ε is the porosity of the
membrane
In addition, the pore size distribution and average pore diameter of the membranes are
estimated from FESEM micrographs using ImageJ software. For each membrane, six images
with various magnifications are selected for analysis to minimize the error of image analysis.
The average pore size, Davg of the membrane was calculated using the following equation:
1
1
n
i i
iavg n
i
i
n d
D
n
(2.5)
Where, Davg is the average pore diameter (μm), n is the number of pores and di is the diameter
of the ith pore (μm).

64
2.1.4.3 Dead end MF of oil-in-water emulsions
The oil-in-water emulsion (200 mg/L) was prepared by mixing crude oil (collected from
Guwahati Refinery, IOCL, India) with Millipore water in sonicator for 15 h at room
temperature (25 oC). No surfactant was added because natural surfactant present in the crude
oil stabilizes the oil-in-water emulsion sufficiently for performing the experiments.
The droplet size of the emulsion (200 mg/L) was determined using particle size analyzer
(Malvern Mastersizer 2000, Model APA 5005). The prepared oil-in-water emulsion
(concentration of 200 mg/L) was utilized for microfiltration experiments. The experiments
were performed in the same dead-end filtration setup as shown in Fig 2.2 with varying
applied pressures. In all experiments, the feed volume of 150 mL was filled into the filtration
setup. The first 10 mL of permeate was discarded and time taken for collection of second 10
mL of permeate was noted down to calculate permeate flux. All the experiments were
conducted at room temperature (25 oC) and the percentage removal (R) of oil and permeate
flux was evaluated according to the following expression
The membrane flux (J) was evaluated using the expression:
33 2
2
V (Volume of the permeate, m )J (Membrane flux, m /m s) =
A (Membrane area, m ) Δt (Sampling time, s) (2.6)
The membrane rejection was estimated using the following expression:
100p
f
C (Oil concentration in permeate, mg/L) R (Rejection, %) = 1 -
C (Oil concentration in feed, mg/L) (2.7)
The concentration of oil in permeate was evaluated using a UV-vis spectrophotometer
(Spectrascan, UV 2300) at a wave length of 239 nm, where the maximum absorbance was
observed.

65
2.1.4.4 Membrane cleaning
In order to regenerate a fouled membrane, the membrane was initially rinsed with water for 1
h. Subsequently, the membrane was cleaned using surf excel solution for 1 h. Finally, at
higher applied pressure, water was passed through the membrane to facilitate the removal of
oil droplets that adhere or adsorb to the surface of the membrane. After completing the
cleaning process, the water flux was once again measured so as to confirm upon the complete
restoration of water permeability
2.2 Preparation, characterization, optimization and application of low cost
fly ash based ceramic membranes
2.2.1 Membrane fabrication
The inorganic precursors used for ceramic membrane (M1-M3) fabrication are presented in
Table 2.2. The procedure for membrane fabrication is presented in section 2.1.2. Firstly, the
required materials and 4 mL of polyvinyl alcohol (PVA) solution (2 wt. %) were thoroughly
mixed in a ball mill for 1200 s at 40 rpm. The rest of the procedure was same as mentioned
in section 2.1.2 and pressed at a load of 150 Kg/cm2. The procedure discussed in section 2.1.2
was followed for drying, sintering and cleaning of membranes.
Table 2.2: Materials used to make ceramic membranes
Raw materials
Membrane, M1
(Wt. %)
Membrane, M2
(Wt. %)
Membrane, M3
(Wt. %)
Fly ash 80 80 70
Quartz 20 10 20
Calcium Carbonate - 10 10

66
2.2.2 Characterization
The XRD analysis, evaluation of membrane flexural strength, and chemical stability
measurement procedures were elaborated in section 2.1.3. Scanning electron microscopy
(SEM) was conducted to examine the surface morphology using SEM instrument (Make:
LEO, Model: 1430VP®, Oxford). ImageJ analysis software based SEM image analysis and
the average membrane pore size determination was discussed in sub-section 2.1.4.2.
In order to examine the thermal transformation during sintering, thermo-gravimetric analysis
(TGA) was conducted for the mixture of inorganic precursors using TGA instrument (Make
NetzscR, Model: STA449F3A00). TGA was conducted using argon as a carrier gas and 10
oC/min heating rate from ambient temperature to the sintering temperature. Nano-particle size
analyzer (NPSA) (Make: Beckmann Coulter, Model: Delsa nano C) was used to determine
the particle size distribution of powder mixtures.
In order to evaluate the pore size of the membranes, the permeation of N2 gas through these
membranes was carried out using an in-house made permeation set up as shown in Fig. 2.3.
The setup consists of a tubular shaped hollow top dome ended with circular shape (stainless
steel) and at bottom, circular shaped flat plate has a facility to place membrane inside the flat
plate and it was airtight by means of rubber gaskets. Then the setup was pressurized at
various applied pressures by using N2 gas and the outlet gas flow rate was calculated by using
digital gas flow meter (Make: Agilent Technologies, Model: ADM 1000 Universal Gas
Flowmeter), which was connected to the outlet of the bottom flat plate. Each test was carried
out at 25°C and before every test; the whole setup was checked for air leakage by dipping the
setup in the detergent solution contained bucket. After finding out no leakage in the set up,
then N2 gas permeation tests were carried out. From the nitrogen permeation experiments, the
measured data corresponds to flow rate (Q) versus applied pressure (ΔP) that was generated
for the membranes. The nitrogen gas effective permeability factor (K) of the membranes was

67
derived from these gas permeation data and average pore radius (rg) was calculated as
follows:
2
2 22.133 1.6
g g
p p
r v rK P
l q l q (2.8)
Where, P is the average pressure acting on the membrane, ν denotes the molecular mean
velocity of the gas (m/s), η describes the viscosity of gas (Pa s), q denotes the tortuosity, lp
represents pore length (m) and K denotes the effective permeability factor.
The effective permeability factor is calculated using the following expression:
2PQK
S P
(2.9)
Where, ΔP denotes the applied pressure, Q represents the volumetric flow rate (m3/s), P2 is
the membrane pressure at permeate side and S denotes the permeable area of the membrane.
The average pore size of the membrane can be obtained from the following expression:
1.333g
Br
C
(2.10)
Where B and C are the intercept and slope, respectively, obtained from the expression (2.8).
In addition, pure water flux tests were conducted to measure the hydraulic permeability
using indigenously designed dead end microfiltration experimental setup (Fig. 2.2).
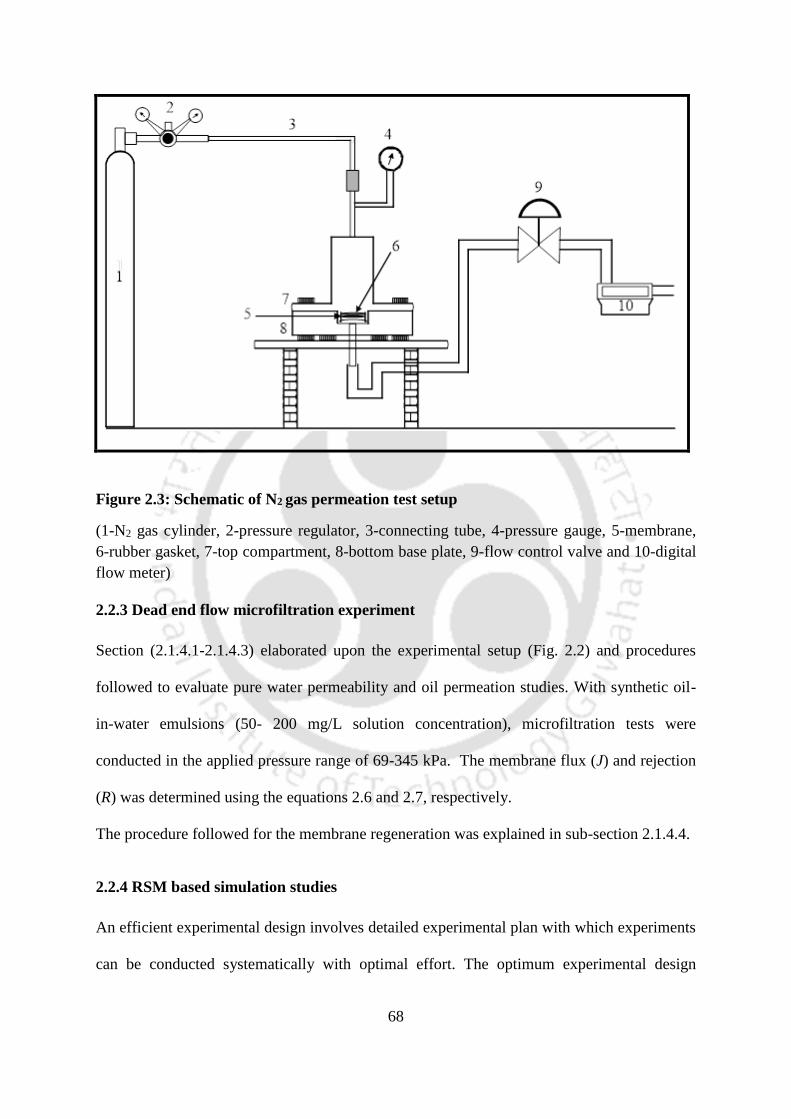
68
Figure 2.3: Schematic of N2 gas permeation test setup
(1-N2 gas cylinder, 2-pressure regulator, 3-connecting tube, 4-pressure gauge, 5-membrane,
6-rubber gasket, 7-top compartment, 8-bottom base plate, 9-flow control valve and 10-digital
flow meter)
2.2.3 Dead end flow microfiltration experiment
Section (2.1.4.1-2.1.4.3) elaborated upon the experimental setup (Fig. 2.2) and procedures
followed to evaluate pure water permeability and oil permeation studies. With synthetic oil-
in-water emulsions (50- 200 mg/L solution concentration), microfiltration tests were
conducted in the applied pressure range of 69-345 kPa. The membrane flux (J) and rejection
(R) was determined using the equations 2.6 and 2.7, respectively.
The procedure followed for the membrane regeneration was explained in sub-section 2.1.4.4.
2.2.4 RSM based simulation studies
An efficient experimental design involves detailed experimental plan with which experiments
can be conducted systematically with optimal effort. The optimum experimental design

69
allows the maximization of the information while performing the experiment. The design of
experiments starts with concept of choosing the process model. For better performance of
process optimization, CCD methodology from the RSM is effectively used and is therefore
employed in the present work. At the center point location, the total number of possible
combinations of experiments are obtained by the design of experiments targeted with the
number of independent variables that strongly influence the process performance in terms of
flux and rejection. Three levels are considered (+1,0,-1) for a particular variable while
performing the CCD analysis using variables of experiments such as feed concentration (X1)
and applied pressure (X2) to obtain response effects. Out of the three levels, ‘0’ level is
considered as the center point or the middle level. The factorial design influences the amount
of the values in high and low levels. In this case, both the high and low level of the point are
chosen as 1.414, which is obtained from the relation 2(k/4) (where k = number of factors = 2).
Five levels are considered ranging from -1.414, -1, 0, +1, +1.414, for every process variable
in this study. The formulae 2k +2k+n0, is used for the determination of the number of
possible experiments. In this formula, the first term signifies the factorial points, second term
indicates the axial points and the third indicates the central run.
In the present study, CCD method is used by considering two factors. In substituting the two
factors in the above formula, 4 factorial nodes, 4 axial nodes and 5 replicates at the center
point are obtained. Hence, in the present study, in total, 13 experiments were carried out
using these parameter variables. A second order regression polynomial model was developed
for the reconstruction of the response using the independent variables and their corresponding
interactions. The process performance is denoted using the equation:
2
0
1 1 1, 1,
n n n n
i i ii i i i j ij
i i i i j j i j
Y X X X X
(2.11)

70
where Y describes recovered response, β0 denotes offset parameter, βi is linear performance
variation, βii is the squared effect, βij indicates effect of interaction, εij is the random error and
Xi and Xj are the independent uncoded variables.
In the present work, a polynomial of second order is derived using independent uncoded
parameters mentioned below:
2 2
0 1 1 2 2 12 1 2 11 1 22 2Y X X X X X X (2.12)
Design expert software (Version 7.0) was used to carry out RSM studies that feature
experimental design matrix, ANOVA studies, response surfaces, normal plots of residuals
and contour points.
2.3 Preparation, characterization and application of TiO2-Fly ash
composite membranes
2.3.1 Synthesis of TiO2-Fly ash composite membrane
TiO2-Fly ash composite membrane was prepared with low cost fly ash ceramic membrane
(M2) using in-situ hydrothermal crystallization. To do so, firstly, at room temperature, a slow
drop wise addition of TiCl4 was allowed in water at constant stirring condition to achieve 5
vol.% solution. Thereby, the solution pH is enhanced to 9.0 by contacting aqueous ammonia
in dropwise fashion. Eventually, the synthesized solution was poured on the already kept fly
ash ceramic membrane (M2) in an autoclave reactor [Teflon coated stainless steel] of 250 mL
capacity. The crystallization was carried out in a hot air oven facilitated with appropriate
temperature controller with reactor subjected to hydrothermal treatment at 160 °C for 12 h.
After crystallization process, the reactor was cooled to room temperature. The membrane
coated with TiO2 and residual powder were recovered from the autoclave and washed

71
abundantly with water to eliminate loosely adhering crystals. Subsequently, the washed
membrane and powder sample were then dried for 12 h at 110 °C. Finally, calcination [400
°C, 1 °C/min] was conducted for 3 h for both coated membrane and powder samples to
subject them to characerization studies.
2.3.2 Characterization
The structural morphology and porosity of the membranes were evaluated by
following the procedure detailed in sub-section 2.1.3.3 and sub-section 2.1.3.4, respectively.
In addition, the average pore size of the membrane was also evaluated with N2 gas
permeation tests conducted in an indigenous permeation set-up. Details of the procedure
have been presented in section 2.2.2. Contact angle (CA) measurements for fly ash membrane
(M2) and TiO2-Fly ash composite membrane were conducted with Drop shape analyzer
[Model: DSA25, Make: Kruss] using sessile drop method and water droplets (4 µL) at 0.16
mL/min falling rate and 16 frame rate. For each membrane, the average value of the CA was
measured by conducting experiments at five distinct locations on the membrane surfaces.
2.3.3 Cross flow microfiltration
2.3.3.1 Experimental set up
The experimental setup refers to a peristaltic pump supplemented with inlet and outlet
connections (see Fig. 2.4). The inlet connection of the pump is connected to the feed tank and
the outlet connection to the membrane module that hosts the circular membrane disc. A
pressure gauge kept at the membrane module allows the measurement of retentate/feed
pressure on the membrane. The membrane module retentate outlet is connected to an
adjustable valve and a flow meter to alter and measure the flow rate, respectively.
Subsequently, the outlet of the flow meter is connected back to the feed tank. Thereby, a

72
Flo
w d
irec
tion
glass beaker is kept on a weighing balance to collect the permeate solution from the
membrane module base plate. Thereby, weight measurement of permeate samples at specific
time intervals is noted to evaluate the membrane flux. Further, adjustable valves facilitate the
pressure adjustment in the system.
Peristaltic pump
Pressure gauge
Balance
Measuring cylinder
Feed Tank
Flow Meter
Valve
Membrane module
Membrane
Figure 2.4: Cross flow microfiltration set up

73
2.3.3.2 Microfiltration Tests
Synthetic oil-in-water emulsions (100-200 mg/L) were prepared by dissolving 0.1-0.2
g of crude oil in 1 L of water with help of sonication bath for 15 h. The separation
experiments were carried out in cross flow microfiltration mode with the experimental setup
depicted in Fig. 2.4. Prior to the experimental investigation with synthetic oil-in-water
emulsions, water was circulated in the membrane process system at pressure higher than the
maximum pressure of operation to remove loose particles on the porous flow path and to
allow compaction. Eventually, water flux measurements were conducted in the pressure
range of 69 – 207 kPa. The membrane performance was evaluated for various combinations
of applied pressure, feed concentration and cross flow velocity, which were varied from 69-
207 kPa, 100-200 mg/L and 0.0885-0.1736 m/s, respectively. For all experiments, 5 L of
feed solution was used. During the MF process, time duration to collect the desired permeate
volume was noted at different cumulative time periods. Thereby, the membrane rejection and
membrane flux was determined using the equation 2.6 and 2.7, respectively. The procedure
followed for the membrane regeneration was explained in sub-section 2.1.4.4
2.3.4 RSM modeling studies
The CCD design framework constituted a three level-three factor approach with six axial
points (α = ±1.68), eight orthogonal factorial points and six replicates at central points. This
affirmed upon the need to conduct 20 experimental runs (Aleboyeh et al., 2008). Thereby,
RSM technique was adopted to analyse the obtained cross flow MF data for oil-in-water
emulsion separation. In the RSM, the selection of independent variables and their levels for
the responses as permeate flux and rejection were 69-207 kPa applied pressure (X1), 100 –
200 mg/L feed concentration (X2), and 0.0885 – 0.1769 m/s cross flow velocity (X3). The
design matrix of independent variables, predicted and experimentally obtained responses

74
(permeate flux and rejections) of TiO2-Fly ash membrane and M2 membrane subjected to
ANOVA analysis. Design expert software® trial version 7 (Stat-Ease, inc., Minneapolis, MN,
USA) was employed for graphical analysis and regression of model analysis for the obtained
results. The relation between coded (Zi) and real values (Xi) during statistical analysis is
according to the expression (Khataee and Dehghan, 2011):
- = 1, 2 and 3i o
i
i
X XZ i
X
(2.14)
Where, Xi is independent variable real value, ΔXi is the step change content of uncoded
variable i, Xo is independent variable real value at the centre point and Zi is the dimensionless
independent variable coded value. For each independent variable, variations involved three
levels such as centre point, factorial points (+ and -) and axial points (+ and -). Subsequently,
the system response was assumed to be describable using a second–order polynomial model
of independent variables (Khataee and Dehghan, 2011).
20
1 1 1, 1,
n n n n
i i ii i ij i j ijk
i i i i j j i j
Y X X X X
(2.15)
Where, βij , βii , βi and β0, are interaction coefficients, quadratic, linear and the intercept,
respectively, εijk is the random error, Xi, Xj are uncoded independent variables and Y is the
predicted response (permeate flux and rejection). In the above expression, the variables
numbers represented by i, j, k, and n need to be integers. For the case where i < j, βij refers to
the interaction effect of Xi and Xj variables. The statistical significance of the model is
analysed based on the model F-value (Fisher’s satirical test (F-test)) and probability value (P
< 0.05), which are obtained by the analysis of a variance (ANOVA) test (Liu and Chiou,

75
2005). The model adequacy is evaluated by fitting the predicted response vs experimental
response with which the regression coefficient value (R2) could be obtained for further
analysis on the fitness.
2.4 Preparation, characterization and application of TiO2-clay, γ-Al2O3-
clay composite and clay membranes
2.4.1 Materials
The clay powders (feldspar, kaolin, pyrophyllite, ball clay and quartz,) were collected
from Kanpur, India. Calcium carbonate, polyvinyl alcohol (PVA), aluminium chloride
(99.5% pure, AlCl3.6H2O) and aqueous ammonia solution (25 wt. %) were supplied by
Merck (I) Ltd., Mumbai, India. Titanium tetrachloride (TiCl4, 99.5% pure) was purchased
from Loba Chemie, Mumbai, India. Crude oil used in this work was procured from IOCL
Refinery, Guwahati, India. The Millipore system (ELIX-3) was used for Millipore water
collection.
2.4.2 Preparation of membranes
The manufacturing procedure followed for clay membrane was same as in section 2.2.
Here, the required composition of clay powders was mixed with PVA solution, and support
was sintered for 6 h at temperature of 950 °C .
For the preparation of TiO2 membrane, the procedure was explained in section 2.3.1, While
section 2.3.1 refers to TiO2-Fly ash composite membrane from M2 membrane, this section
refers to fabraication of TiO2-clay membrane on clay membrane. Rest of the procedure used
is same as section 2.3.1.

76
Similarly, γ-Al2O3 membrane was prepared by hydrothermal method using AlCl3 as a
starting material. 4 wt. % AlCl3 solution was prepared and aqueous ammonia solution was
added dropwise into the AlCl3 solution with continuous stirring until the pH of the solution
reached 8.0. Then the solution was transferred to a Teflon coated SS autoclave reactor and
the dried clay membrane was also placed in the reactor. The hydrothermal reaction was
performed at 150 °C for 8 h. The membrane and as-synthesized powder were calcined at 600
°C for 3 h.
2.4.3 Characterization
Thermal degradation behavior of as synthesized powders was analyzed in Netzsch
thermo gravimetric analyzer (Make: Netzsch, Model: STA449F3A00) in argon atmosphere
with the temperature increment of 10 °C/min. The X-ray diffraction (XRD) analysis was
acquired at 2θ values of 10-80° using a scanning rate of 0.05 °C/s in an equipment (Make:
Bruker, Model: D8 ADVANCE) with Cu K (λ=0.154506 nm) radiation operating at 40 kV
and 40 mA. The crystallite size was calculated from X-ray diffraction patterns using Debye-
Scherrer equation, D =Kλ/(βcosθ), where λ is the wavelength of the X-ray radiation (λ =
0.154506 nm), K is a constant (0.9), β is the peak full width at half maximum height, and θ is
the diffraction angle. The particle size distribution (PSD) of the TiO2 and γ-Al2O3 sols were
measured using Delsa nano C (Beckman Coulter). FTIR spectra of the prepared TiO2 and γ-
Al2O3 powders were analyzed using Shimadzu Fourier Transform Infrared Spectrosopy
(FTIR) (Model: IRAffinity-1) to identify the functional groups present in the prepared
powders. Nitrogen adsorption/desorption isotherms for calcined TiO2 and γ-Al2O3 powder
samples were determined at -196 °C using the BET method in the instrument, Quantachrome
surface area and pore size analyzer (Make: Quantachrome, Model: Autosorb-IQ MP). Before

77
N2 adsorption/desorption analysis, both the samples (TiO2 powder and γ-Al2O3 powder) were
completely degassed under the temperature of 200 °C with 3 h duration.
The structural morphology, porosity and contact angle of the clay membrane and
composite membranes were evaluated according to the procedure detailed in section 2.1.3.3,
Sub-section 2.1.3.4 and section 2.3.2, respectively. In addition, average pore size was
evaluated by N2 gas permeation study.
2.4.4 Dead end Microfiltration of oil-in-water emulsions
The stable oil-in-water emulsions having the concentrations of 50-250 mg/L were
produced by following the procedure described in section 2.1.4.3. Then the droplet size
distributions of prepared four different concentrations of oil-in-water emulsions (50-250
mg/L) were measured with the instrument, particle size analyzer (Make: Malvern, UK;
Model: Master Sizer 2000).
The prepared membranesTiO2-clay, γ-Al2O3-clay and clay membrane were applied to
remove oil from the oil-in-water emulsions using dead-end flow setup (see Fig. 2.2). Each
experiment was conducted using 150 mL quantity of feed oil solution in the experimental
setup. For every applied pressure, the first 10 mL of the collected permeate was rejected and
the time taken for the collection of second 10 mL of permeate was used to measure the
permeate flux. The equations 2.6 and 2.7 were used to estimate the permeate flux and oil
rejection values of the membrane. The membranes were regenerated by following steps
mentioned in section 2.1.4.4.
2.5 Cross Flow MF studies for TiO2–clay and clay membranes
In order to achieve better performance of membranes in separation of oil-in-water emulsions,
this section targeted the cross flow MF process with the TiO2-clay and clay membranes.

78
2.5.1 Cross flow MF Tests
The microfiltration procedures, analytical methods used and experimental set up for cross
flow microfiltration have been presented in section 2.3.3. The pure water flux of clay and
TiO2-clay membrane was determined at three different applied pressures (69-207 kPa) by
keeping a constant cross flow velocity of 0.0885 m/s. The performance of the membranes
was tested with oil-in-water emulsion of 200 mg/L and the applied pressure between 69 and
207 kPa at three cross flow velocities (0.0885-0.1769 m/s). The expressions (2.6) and (2.7)
were employed to measure the permeate flux (J) and oil rejection (R).
After finishing of every experimental run, the TiO2–clay membrane and clay membrane were
cleaned and regenerated according to the procedure mention in sub-section 2.1.4.4.
2.5.2 Membrane fouling analysis
The fouling of the membrane in cross flow microfiltration process was studied with the help
of intermediate pore blocking, cake filtration, complete pore blocking and standard pore
blocking models.
(i) Complete pore blocking
Complete pore blocking happens when the solute particles sizes are greater than the
membrane pore sizes. Consequently, pore blocking takes place over surface of the membrane
and not within the membrane pores.
1 1
0ln( ) ln( ) bJ J k t (2.15)
(ii) Standard pore blocking
Standard pore blocking assumes that the molecules penetrate into the pores of the membrane
and deposit over the pore walls because of the abnormality in the pore passages. Generally,

79
standard pore blocking arises when the sizes of the solute particles are smaller than that of
membrane pore size and thereby, pore blocking happens inside the membrane pores. In this
manner, the membrane pore volume reduces proportionally to the filtered permeate volume.
0.5 0.5
0 sJ J k t (2.16)
(iii) Intermediate pore blocking
Intermediate blocking arises when both the solute particles and the membrane pores are
similar in the size. For such a scenario, it is expected that the solute molecules do not
essentially block the membrane pore and few particles may settle over others. Hence, the
non-blocked membrane surface area reduced with time and a few molecules are relied upon
to deter the membrane pore passage without hindering the pore completely.
1 1
0 iJ J k t (2.17)
(iv) Cake filtration
Cake filtration relates to a situation where particles bigger than the normal pore size
aggregate on the membrane surface and thus facilitate the development of a “cake”. The cake
develops with time and offers an extra porous barrier (and subsequently hydraulic resistance)
to the permeating liquid.
2 2
0 cJ J k t (2.18)

80
The plot of J-2 vs. t, J-1 vs. t, J-0.5 vs. t, and ln(J-1) vs. t shall be a straight-line with slope of kc,
ki, ks and kb with y-intercept of J-2, J-1, J-0.5 and ln(J-1) for cake filtration model, intermediate
pore blocking, standard pore blocking and complete pore blocking, respectively. The fitness
of any one of the above models is based on the maximum value of coefficient of correlation
(R2) of the microfiltration permeation data.

81
CHAPTER-3
Preparation, Characterization and Application of Ceramic Membranes from Mixed Clays

82

83
CHAPTER 3 Preparation, characterization and application of ceramic
membranes from mixed clays
After a brief overview, sections 3.2.1-3.2.7 address the characterization of rawmaterials and
membranes (SP1-SP4), section 3.2.8 elaborates upon the dead end MF performance of SP4
membrane. Following this, section 3.2.9 summarizes the retail cost analysis followed with the
summary of the research findings in section 3.3.
3.1 Overview
In this chapter, results obtained from surface, physical, flux characterization of SP1-SP4
membranes are presented first. Eventually, dead end MF performance of the SP4 membrane
is summarized. Finally, the evaluated conceptual retail cost of the membrane is presented.
3.2 Results and Discussion
3.2.1 Particle size distribution (PSD)
The particle size distribution (PSD) of the raw materials was done to get an idea of the
particle size and its uniformity of the particles. The size of the raw materials determines the
porosity and pore size of the sintered membrane. Pore growth mainly depends on the initial
particle size of the raw materials and compaction pressure (Tsuru, 2001). Finer particles
require a relatively low temperature for sintering and conversely it results in a large transport
resistance because of too small effective pore size. On the other hand, coarser particles need
higher sintering temperature resulting in macroporous membranes with reduced mechanical
strength (Wang et al., 2007). The particle size distribution of the individual raw materials and
powder mixture used for the fabrication of four fly ash based membranes (SP1-SP4) is shown
in Fig. 3.1 (a, b). It can be seen from Table 3.1 and Fig. 3.1 (b) that the size of particles are in
the ranges of 0.96-138.0 µm, 1.26-316.23 µm, 1.26-138.0 μm and 1.26-91.2 μm for the

84
membrane SP1, SP2, SP3 and SP4, respectively. Moreover, a volume median diameter (d0.5)
of the raw material mixtures is found to be 7.3, 5.9, 5.0 and 4.8 µm for the membrane SP1,
SP2, SP3 and SP4, respectively. These sized raw material mixtures would be reasonably
useful for the preparation of porous fly ash based membrane with maximum porosity (Wang
et al., 2007; Monash and Pugazhenthi, 2011b; Vasanth et al., 2011a). For the powder
mixtures used for the fabrication of membranes (SP4-SP1), the span values are found to be in
the range of 2.18-6.07. This specifies that width of the particle size distribution offers good
mixing and uniform distribution between the particles.
0.01 0.1 1 10 100 1000 10000
0
4
8
Volu
me (
%)
Size (µm)
Fly ash
Titania
Quartz
CaCO3
0.01 0.1 1 10 100 1000 10000
0
4
8
V
olu
me
(%)
Size (µm)
SP1
SP2
SP3
SP4
Figure 3.1: Particle size distribution of (a) individual raw materials and (b) powder
mixtures used to fabricate membranes (SP1-SP4)

85
Table 3.1: Particle size distribution of the clay mixtures used to fabricate membrane
(SP1-SP4)
Membrane SP1 SP2 SP3 SP4
Average particle size (μm) 26.514 28.263 17.694 12.497
Span value 6.075 5.983 4.152 2.181
Volume weighted mean (μm) 16.963 14.88 10.265 7.947
Particle size range
0.955-
138.038
1.259-
316.228
1.259-
138.038
1.259-
91.201
d0.1 (μm) 2.536 2.499 2.398 2.423
d0.5 (μm) 7.282 5.888 5.017 4.847
d0.9 (μm) 46.775 37.724 23.232 12.993
3.2.2 XRD analysis
Fig 3.2 displays the XRD profiles of individual raw materials before and after calcination at
1100 oC. It is clearly seen that the chemically pure TiO2 contains two type of crystalline
phases such as anatase (major phase) and rutile (minor phase). Similar phases were also
identified by Dong et al., (2010) for pure TiO2. In the fly ash, the observed crystalline phases
are quartz (SiO2) and corundum (Al2O3), which are consistent with the results reported by
Jedidi et al. (2011). It is also noticed that in the fly ash, the intensity of quartz peak decreases
due to conversion of quartz to corundum at the sintering temperature.

86
Figure 3.2: XRD of raw materials (a) Titanium dioxide (b) Quartz and (c) Fly ash (Q-
Quartz, A-Anatase, R-Rutile, C- Corundum)
It is clearly seen from Fig. 3.2(b) that in comparison with before calcination, the peaks
corresponding to the quartz are not changed in the XRD pattern of quartz after calcination.
This signifies that the quartz is not affected by the sintering temperature. According to the
literatures (Monash and Pugazhenthi 2011b; Vasanth et al., 2011a), no phase change is
observed in the quartz during sintering. In addition, TGA analysis of quartz confirms that
there is no significant weight loss during sintering (Vasanth et al., 2013; Monash and
Pugazhenthi 2011b; Vasanth et al., 2011a). In view of the above, it can be concluded that
quartz is thermally stable at the studied sintering temperature.
The XRD reflections of the membranes (SP1-SP4) before and after sintering are presented in
Fig 3.3. In most cases, sintering produces series of reactions or phase transformations that
5 10 15 20 25 30 35 40 45 50 55 60 65 70 75 80
2θ (degree)
(a)A
A AA R A
AR R
Before Calcination
Inte
nsi
ty (
a.u
.)
(b)Q
Q
(c)
Q
Q
C
Q
5 10 15 20 25 30 35 40 45 50 55 60 65 70 75 80
2θ (degree)
(a)
A
RR
RAR
A
RA A AA
(b)Q
QQ Q Q
(c)
Q
C
Q
After Calcination

87
lead to the formation of new phases. As a result, the disappearance and shift in the peak
positions are observed in the XRD analysis.
Figure 3.3: XRD analysis of powder mixtures used to fabricate of membranes (SP1-SP4)
(Q-Quartz, Ca-Calcium carbonate, A-Anatase, C-Corundum and Cristobalite, T-
Aluminum Titanate, R-Rutile, CaO- Calcium Oxide)
Although many phase transformations occur during sintering of the membrane, the formation
of new phase for the prepared membrane is aluminum titanate (Al2O3.TiO2) by reaction of
rutile with corundum. During sintering, quartz reacts with rutile and converts to cristobalite
and corundum (Jedidi et al., 2009). The background noise in the XRD pattern of the sintered

88
membrane suggests that there may be an existence of amorphous silica (Monash and
Pugazhenthi 2011b; Gualtieri et al., 1995; Cultrone et al., 2001).
3.2.3 FESEM analysis
Surface morphology of the sintered membranes was studied using FESEM as depicted in Fig
3.4. These images demonstrate the membrane surface with rough morphological structure.
The superficial observation of the FESEM images indicates that the membranes do not have
any pinholes and cracks.
Figure 3.4: FESEM images of the membranes (SP1, SP2, SP3 and SP4)
SP1 SP2
SP3 SP4

89
The average pore size of the membranes estimated from FESEM images is found to be 3,
2.95, 2.79 and 2.28 µm for the membrane SP1, SP2, SP3 and SP4, respectively. The pore size
distribution of membranes is presented in Fig 3.5. It is observed that the pore diameter of the
membrane decreases with an increase in the TiO2 content, which is due to binding ability of
TiO2 during sintering. Some of the pores may even disappear during sintering. It is well
documented in the literature that the membrane pore size is significantly influenced by TiO2
content and sintering temperature (Dong et al., 2010).
0 1 2 3 4 5 6 7 8
0
10
20
30
40
Nu
mb
er o
f p
ore
s (%
)
Pore Size (µm)
S1
S2
S3
S4
Figure 3.5: Pore size distribution analysis of the membranes (SP1-SP4) from FESEM
images
3.2.4 Porosity
The porosity of the membranes determined by Archimedes principle and FESEM analysis is
illustrated in Fig 3.6. The results clearly indicate that substantial changes are observed in the
porosity of the membranes when the TiO2 content increases in the precursor formulations. In
general, the porosity of the membrane mainly depends on the amount of porosifier (CaCO3)
and an additive (TiO2) present in the sample. However in this study, quantity of porosifier

90
(CaCO3) is kept constant for all membrane compositions and hence, the variation of porosity
is due to the increased TiO2 content. It is seen from the Table 2.1 (Chapter 2) that the
domination of TiO2 (WTiO2/ Wfly ash) increases from 0 to 1.50. Consequently, the porosity of
the membranes increases with an increase in the TiO2 content and maximum porosity of 48
% is obtained for SP4 membrane. It is noticed that the surface porosity of the membranes
determined by FESEM analysis is higher due to difficulty in controlling the threshold of the
pores of the membranes.
SP1 SP2 SP3 SP40
20
40
60
80
Po
rosi
ty (
%)
Membrane composition
FESEM analysis
Archimedes principle
Figure 3.6: Porosity of membranes from FESEM analysis and Archimedes principle
3.2.5 Chemical stability
The chemical stability of the membranes was evaluated in terms of mass loss after keeping
the membrane in contact with acid and alkali solutions individually. As the TiO2 content
increases, the weight loss of the membranes due to corrosion of acid decreases from 6 to 2%
as depicted in Fig 3.7. The weight loss of the membrane due to alkali is found to be around
1% for all the membranes. The results reveal that the membranes exhibit better corrosion
resistance in both acidic and basic medium. The obtained results are comparable with

91
cordierite (Dong et al., 2006) and alumino-silicate microfiltration membranes (Almandoza et
al., 2004).
3.2.6 Mechanical strength
Fig 3.8 demonstrates that with increasing TiO2 content in the precursor formulations, the
flexural strength of the membranes increases from 6.02 to 13.82 MPa. Similar observation
was also reported by Dong et al., (2010). In general, calcium carbonate (CaCO3) is used as
porosifier as well as sintering aid. Besides, the flexural strength of the membrane primarily
depends on the amount of sintering aid present in the precursor sample (Bouzerara et al.,
2006; Boudaira et al., 2009; Falamaki et al., 2004). However, in this study, the amount of
CaCO3 is kept constant for all the membrane formulations. Hence the enhanced flexural
strength of the membrane is due to the increased densification with higher amount of TiO2 at
the sintering temperature (1100 oC) (Dong et al., 2010).
3.2.7 Hydraulic permeability and average pore size of membranes
All the prepared membranes were characterized for their hydraulic permeability. Pure water
flux was measured by applying different pressures ranging between 28 to 69 kPa as depicted
in Fig 3.9. It is observed that the flux of the membranes depends on the applied pressure and
also increases with an increase in the applied pressure. The hydraulic permeability of the
membranes is estimated to be 1.58×10⁻⁸, 1.14×10⁻⁸, 0.87×10⁻⁸ and 0.63×10⁻⁸ (m3/m2sPa) for
the membrane SP1, SP2, SP3 and SP4, respectively.

92
SP1 SP2 SP3 SP40
2
4
6
8
Wei
gh
t lo
ss (
%)
Membrane composition
Figure 3.7: Chemical stability of the membranes (SP1-SP4) in acid
SP1 SP2 SP3 SP40.0
2.5
5.0
7.5
10.0
12.5
15.0
Fle
xu
ral
stre
ng
th (
MP
a)
Membrane composition
Figure 3.8: Flexural strength of the membranes (SP1-SP4)

93
0 10 20 30 40 50 60 700
20
40
60
80
100
120
SP1
SP2
SP3
SP4
Wa
ter
flu
x J
×1
05 (
m3/m
2s)
Applied Pressure (kPa)
Figure 3.9: Variation of pure water flux of the membranes at different applied pressure
The average pore diameter of the membranes calculated from hydraulic permeability
data is found to be 2.97, 1.77, 1.57, 1.32 μm for the membrane SP1, SP2, SP3 and SP4,
respectively. The reduction in the pore size and pure water flux of the membranes with
increasing TiO2 content in the precursors is due to better densification of the membranes. The
pore size of the ceramic membranes measured by FESEM analysis is slightly higher than
those calculated from pure water permeability data. FESEM tends to overestimate the pore
size as it can only assess the pore diameter at the surface of the membrane and some of the
pores may be dead end pores (not through pores). The pore size obtained from water
permeability data corresponds to a minimal size of the pore constriction through in which
water passes and is smaller than the surface pore size. Thus the pore size obtained from water
permeability is more accurate than FESEM analysis.

94
3.2.8 Separation of oil-in-water emulsion
Among the prepared membranes, the lowest pore size membrane (SP4) was tested for the
separation of oil-in-water emulsion. Fig 3.10 illustrates the variation of the permeate flux and
percentage removal of oil with various applied pressures (69-345 kPa) for the initial oil
concentration of 200 mg/L.
0 100 200 300 4000.0
0.5
1.0
1.5
2.0
Applied Pressure (kPa)
Perm
ea
te F
lux
1
07
(m3
/m2
s)
0
20
40
60
80
100
Rem
ov
al
(%)
Figure 3.10: Variation of permeate flux and percentage removal of oil at different
applied pressures for SP4 membrane
As expected, the removal of oil decreases slightly with an increase in the applied pressure.
This is due to the fact that the higher pressure enhances the wetting and coalescence of oil
droplets and this would enforce the oil droplets to pass through the membrane along with the
permeate. The observed results are consistent with the results reported in the literature (Abadi
et al., 2011; Arnot et al., 2000). The maximum rejection of 99.2% is observed at a lower
applied pressure of 69 kPa. As the applied pressure increases from 69 to 345 kPa, the
permeate flux also increases due to enhancement of the driving force across the membrane. A
large difference between permeate flux and pure water flux under same condition is observed

95
Table 3.2: Comparison of oil removal percentage of fabricated membrane with other membranes
Membrane/support
Material
Mean
Pore size Type of oil
Applied
pressure
(kPa)
Feed
Concentration
(mg/L)
Permeate
flux×106
(m3/m2 s)
Removal
(%) Reference
α- Al2O3/ α-Al2O3 1.0 µm Vegetable oil 100 5000 7.5 94.3 Yang et al., (1998)
α- Al2O3/α- Al2O3 0.2 µm Vegetable oil 100 5000 6.11 99.9 Yang et al., (1998)
ZrO2/ α- Al2O3 0.2 µm Vegetable oil 100 5000 25.83 99.8 Yang et al., (1998)
NaA zeolite/ α- Al2O3 1.2 µm Lubricant oil 50 100 5.0 98.8 Cui et al., (2008)
α- Al2O3 2.1 µm Lubricant oil 50 100 2.083 55.0 Cui et al., (2008)
NaA zeolite/ α- Al2O3 0.4 µm Lubricant oil 50 100 0.694 99.4 Cui et al., (2008)
Al2O3 0.16 µm Lubricant oil 50 600 to 11000 7.083 98.0 Cui et al., (2008)
α- Al2O3 0.1 µm Refinery oil 100 150 88.61 61.4 Ebrahimi et al.,(2010)
TiO2/TiO2 1000 Da Refinery oil 100 565 17.78 99.5 Ebrahimi et al.,(2010)
Membrane, SP4 1.32 µm Crude oil 69 200 0.04 99.2 Present study

96
for the studied membrane (SP4) on account of pore blocking and concentration polarization
(see Figs 3.9 and 3.10).
For industrial application point of view, the membranes should possess higher removal
efficiency with good permeate flux. Hence it can be concluded that the prepared membrane,
SP4, displays better rejection (99.2-95.6%) of oil with permeate flux. In comparison with
other membranes (see Table 3.2), the performance of the prepared membrane in terms of
rejection and permeate flux, is comparable or even better than those reported in the literature.
It can be concluded from Table 3.2 that the membrane (SP4) prepared from fly ash is useful
for treating oily wastewater in the form of oil-in-water emulsion.
3.2.9 Cost estimation
Based on the retail cost of the raw materials, the average cost of the ceramic membranes is
estimated as Rs. 3, 5, 6.5, and 8.5 per one circular shaped membrane for SP1, SP2, SP3 and
SP4, respectively that corresponds to 15-40 ($/m2) as listed in Table 3.3. The cost of the
prepared membranes is comparable and even lower than the membranes reported in the
literature (Emani et al., 2013; Vasanth et al., 2011b; Nandi et al., 2011; Jana et al., 2010;
Mittal et al., 2011). It is worth to mention that the cost of the ceramic membranes prepared by
Emani et al., (2013), Vasanth et al., (2011b), Nandi et al., (2011) and Mittal et al., (2011) is
78, 67, 130 and 34 ($/m2), respectively. Moreover, cost of the inorganic membranes is
projected to be around 500-1000 ($/m2) (Koros et al., 2000; Nunes and Peinemann 2001;
Ceramiques techniques & industrielles, 2007). The cost of the commercial membrane made
of α-Al2O3 is reported to be 989-1220 ($/m2) (Krauczyk and Jonsson 2014).

97
Table 3.3: Cost estimation of membranes (SP1-SP4)
Raw
materials
Unit
price
(Rs./
kg)
Amount of raw
materials used
for the
fabrication of
one membrane
(kg)
Cost estimated for the Fabrication of one
membrane (Rs.)
SP1 SP2
SP3
SP4
Quartz 10.00 7.50× 10⁻³ 0.075 0.075 0.075 0.075
Calcium
carbonate
520 5.00× 10⁻³ 2.6 2.6 2.6 2.6
Fly ash 28.0 12.5 × 10⁻³ 0.35 0.28 0.21 0.14
Titania 720 2.5 × 10⁻³ - 1.8 3.6 5.4
Raw materials cost for one membrane
fabrication
3.02 4.76 6.48 8.22
Cost of one ceramic membrane of 5
mm thickness and 63 mm diameter
(rounded value)
3 5 6.5 8.5
Estimated raw materials cost per unit
area of the fabricated membrane
963/m2
(15 $/m2)
1605/m2
(25 $/m2)
2086/m2
(33 $/m2)
2567/m2
(40 $/m2)
Cost is always considered as a massive apprehension in the membrane process, which is
mainly from energy consumption and membrane replacement. The use of conventional
membranes in wastewater treatment requires high energy input in order to keep constant
efficiency due to lower membrane permeability. Generally membranes made of clay based
raw materials possess higher permeability than conventional membranes; as a result, lower
cost on energy. Currently, natural clays and fly ash are most preferred membrane materials
when compared with other materials because of their low cost. Typically, the membrane
separation process using alumina and zirconia based membranes is more expensive than those

98
using clay based membranes because of the costly raw materials. On the contrary, fly ash is
rather cost effective compared to conventional membranes. In addition, enhanced antifouling
ability of the clay based membranes extends the back flushing interval and membrane life
span that also increases the price gap between the clay membranes and commercial
membranes.
3.3 Summary
The porosity of the membranes is found to be 21, 34, 43 and 48% for the membrane SP1,
SP2, SP3 and SP4, respectively. The prepared membranes with various composition offer
good mechanical strength (6.02-13.82 MPa). The weight loss of the membranes (SP1-SP4) in
acid and alkali solution is found to be 6-2%, 1%, respectively indicating that these
membranes are more stable in both acidic and basic medium. The average pore size of the
membranes calculated from water permeability data is found to be 2.97, 1.77, 1.57 and 1.32
µm for the membrane SP1, SP2, SP3 and SP4, respectively. The performance of the
fabricated membrane (SP4) is demonstrated by separation of oil from oil-in-water emulsion.
The maximum removal of oil is observed to be 99.2% with permeate flux of 4.1×10⁻⁸
(m3/m2s) at an applied pressure of 69 kPa for the initial oil concentration of 200 mg/L. Based
on the cost of raw materials, cost of the membranes is estimated to be around 15-40 ($/m2).

99
CHAPTER-4
Preparation, Characterization, Optimization and Application of Low Cost Fly ash Based Ceramic
Membranes

100

101
CHAPTER 4 Preparation, characterization, optimization and application
of low cost fly ash based ceramic membranes
After brief overview on fabrication of membranes (M1-M3) in section 4.1, sections
4.2.1-4.2.8 present the results obtained during characterization and dead end MF of oil-in-
water emulsions for the low cost fly ash based ceramic membranes (M1-M3). Section 4.2.9
summarizes the flux and rejection profiles and followed its subsequent analysis using RSM
model in section 4.2.11. Section 4.2.10 presents the overall cost estimation for the
membranes during microfiltration studies. Finally, section 4.3 presents a summary of the
dead end MF and RSM data.
4.1 Overview
This chapter addresses further maximum quantity of fly ash usage in raw materials
composition to fabricate fly ash based ceramic membranes of variant morphological
properties. Fly ash/CaCO3/Quartz addition/removal has been carried out to target the
necessary variations. Three new compositions were identified for the fabrication of
membranes with maximum utilization of fly ash. The membranes (M1-M3) were prepared
with identified new compositions of fly ash by following uniaxial compaction method. The
main objective of this chapter is to evaluate various membrane properties such as average
pore size, porosity, chemical and mechanical stability and pure water permeability. The
prepared membranes (M1-M3) were subjected to dead-end flow microfiltration of oil-in-
water emulsions. In addition to that, the effect of feed concentration and applied pressure on
rejection of oil and permeate flux was investigated. Finally, the parametric optimization study
was carried out by response surface methodology.

102
4.2 Results and Discussion
4.2.1 Particle size distribution
Figure 4.1: Particles size distribution of the membrane powder mixture (M1-M3)
Three powder mixtures (M1, M2 and M3) were analyzed for their particle size
distributions. It is well known that the size distributions of the inorganic precursor mixture
strongly influence the membrane morphological properties including pore size and porosity.
Therefore, particle size distribution analysis of three composition mixtures was performed
and the results are shown in Fig. 4.1. It is apparent from Fig. 4.1 that in comparison with M2
and M3, M1 sample has smaller particle size. The possible reason could be that some
particles of M1 sample have smaller particle size (fly ash) than that of quartz and absence of
CaCO3.
1000 2000 3000 4000
0
5
10
15
20
25
30
Vo
lum
e (
%)
Particle size (nm)
M1
M2
M3

103
4.2.2 Thermo gravimetric analysis
Figure 4.2: TGA graph of the membrane powder mixture (M1-M3)
TGA curves of the raw materials mixtures are shown in Fig. 4.2. As indicated in the
figure, maximum weight loss occurs due to the decomposition of CaCO3 and generation of
CO2. The membrane porosity is primarily dependent on the released CO2 gas moved path.
Moreover, for both membranes M2 and M3, almost same (4%) net weight loss is obtained for
the powder mixture. This result infers that the weight loss of the membrane mainly depends
upon the quantity of calcium carbonate of samples. Above 800 oC, it is also observed that all
samples affirm insignificant weight loss and thereby confirm upon the validity of preposition
that the minimum sintering temperature needs to be higher than 800 oC. For M2 and M3, the
0 100 200 300 400 500 600 700 800 900 1000 1100
0
10
20
30
40
50
60
70
80
90
100
Wei
gh
t lo
ss (
%)
Temperature (°C)
M1
M2
M3
M1M2
M3

104
slower mass decrease in the powder mixture (<800 °C) is possibly due to CaCO3 thermal
decomposition. The TGA curve for M1 membrane mixture indicates upon an insignificant
weight loss due to fly ash and absence of CaCO3 (Monash and Pugazhenthi, 2011).
Figure 4.3: XRD analysis of raw material powder mixture (M1-M3) (Q-Quartz, Ca-
Calcium carbonate, CaO-Calcium oxide, C-Cristobalite and Corundum)
4.2.3 XRD
The XRD analysis facilitates the identification of various phases that exist before and
after sintering and thereby visualize various phase transformations and newer phase
formations during membrane sintering. Fig. 4.3 presents the XRD patterns of the unsintered
0 5 10 15 20 25 30 35 40 45 50 55 60 65 70 75 80
2θ (degree)
M1Q
Q
Inte
nsi
ty (
a.
u.)
M2Q
CaQ
M3Q
CaQ
Before Sintering
0 5 10 15 20 25 30 35 40 45 50 55 60 65 70 75 80
2θ (degree)
M1 Q
Q
C
M2
Q
QCaOC
M3Q
Q
CaOC
After Sintering

105
and sintered membrane (M1-M3) samples. For the fly ash, it has been reported that quartz
(SiO2) and corundum (Al2O3) crystalline phases exist (Suresh and Pugazhenthi, 2016). For
both unsintered and sintered samples of fly ash, it has been observed that there are changes in
the peaks corresponding to the quartz and this confirms that during sintering, quartz is
converted to cristobalite and corundum. Similar observations are reported in the literature
(Jedidi et al, 2009).
4.2.4 Porosity
The average porosity was evaluated to be 30, 39 and 43% for M1, M2 and M3
membranes, respectively. Thus, for M1 membrane, lower porosity exists and significant
differences in the porosities of the membranes is due to the porosifier concentration (calcium
carbonate) in the precursor mixture. Even though the amount of calcium carbonate available
in the M2 and M3 membrane composition is same, the variation of porosity is due to the
variant quantities of fly ash. Thus, the membrane porosity increases with increasing
concentrations of CaCO3 and fly ash and highest porosity of 43% was obtained for M3
membrane.
4.2.5 Chemical stability
For membranes, the acid corrosion based weight loss is 28 (M1), 26 (M2) and 24 (M3) %,
respectively. Significant weight loss during acidic corrosion tests is due to the presence of
CaO in the membrane morphology. For all membranes, only 1% weight loss was evaluated
during base corrosion tests. Thereby, the membranes can be concluded to be highly relevant
for processing basic but not acidic media.

106
4.2.6 Flexural strength
The membrane flexural strength is evaluated as 1.68 (M1), 6.99 (M2) and 9.25 (M3)
MPa. It is observed that the flexural strength increases with the addition of CaCO3 content for
M2, and M3 membranes in comparison with M1. Hence, the significant increase in the
flexural strength is due to strong interaction between the quartz and CaCO3 and large
interfacial area between them. These observations confirm that CaCO3 serves as both
porosifier and sintering aid in the membrane morphology and sintering process. The
membrane densification is strongly influenced by the inorganic precursor composition.
Therefore, membrane densification increased with enhancement of sintering aid and thereby
increased flexural strength. These observations and reasoning statements are in agreement
for the membrane densification trends presented for literature reported variation in CaCO3
compositions for clay membranes (Monash and Pugazhenthi, 2011; Suresh and Pugazhenthi,
2016).
4.2.7 SEM analysis
It is well known that the membrane morphologies are crucial factors to influence the
membrane performance. Therefore, SEM based investigations of the membrane surface
morphologies was conducted. Fig. 4.4 presents the surface image of M1, M2 and M3 at same
magnification. These images confirm that no surface defects such as pinholes and cracks exist
on the surface. Fig. 4.4 shows that the smooth surface membrane has number of smaller pores
and some of them have been identified as bigger pores from image. Hence, the membrane
(M1) with this kind of morphology may probably provide good performance. In comparison
with M1, the membrane M2 has smoother surface with more number of smaller pores.
Moreover, membranes M1 and M2 have the same content of fly ash and different amount of
CaCO3. Although membranes M2 and M3 possess same quantity of CaCO3, the membrane

107
M3 demonstrates the smooth surface with larger pores due to the increased amount of quartz
in comparison with the M2. Based on the analysis, it has been observed that the membrane
pore size varied from 0.001 – 2.75 µm and affirms diverse porous structure. The SEM image
analysis based pore size is evaluated as 2.0 (M1), 1.75 (M2) and 1.79 (M3) µm, respectively.
Corresponding membrane pore density has been estimated as 4.12×10¹⁴, 6.49×10¹⁴,
7.42×10¹⁴ (number of pores/m2), respectively. Thus, it is apparent that the membrane pore
density is strongly influenced with the precursor composition variation (Table 2.2). The N2
gas permeation data based effective permeability factor variation with average pressure is
presented in Fig. 4.5(a) for various cases. Among all cases, for M2 membrane, lowest
combinations of effective permeability factor and pore size have been obtained. The N2
permeation based average membrane pore size values are 1.36 (M1), 1.30 (M2) and 1.44
(M3) µm, respectively. Corresponding SEM analysis based mean pore size values are 2.0,
1.75 and 1.79 µm, respectively. Significant variation in the SEM analysis based mean pore
size and that determined with N2 permeation study is due to the reason that gas permeation
based data refers to open channel pores, which is not the case for SEM based analysis in
which even dead pores are as well counted for pore size evaluation.
4.2.8 Water flux and Hydraulic permeability
In agreement with the Darcy’s law, Fig. 4.5(b) affirms that membrane water flux
linearly increases with increasing applied pressure and refers to a straight line passing
through the origin. Using the water flux plot, membrane hydraulic permeability (Lh) is
determined (Srijaroonrat et al, 1999).

108
Figure 4.4: SEM images of membrane (M1-M3)
M3
M2
M1

109
105 110 115 120 125 130 135 140
0
5
10
15
20
25
M1
M2
M3
Eff
ecti
ve
Per
mea
bil
ity
fa
cto
r K 1
03 (
m/s
)
Average Pressure P 10-3
(Pa)
(a)
0 100 200 300 400
0
10
20
30
40
M1
M2
M3
Pu
re w
ate
r f
lux
J10
4 (m
3/m
2 s
)
Applied Pressure (kPa)
(b)
Figure 4.5: Variation of (a) N2 gas permeate flux (b) pure water flux with applied
pressure for membrane M1-M3

110
In the Figure, the solid line refers to the regression of the data with a condition that
the line needs to pass through the origin i.e., water flux value is zero for applied pressure
value of zero. The membrane hydraulic permeability values are subsequently evaluated as
5.384×10⁻⁶ (M1), 6.508×10⁻⁶ (M2) and 9.53×10⁻⁶ (M3) (m3/m2s kPa).
All characterization parameters evaluated for M1-M3 membranes are presented in
Table 4.1. Table 4.2 presents a comparative assessment of obtained results with those
presented in the literature for other ceramic membranes. From both Tables (4.1 and 4.2), it
can be inferred that the fly ash based ceramic membranes prepared at lower sintering
temperature have superior morphological characteristics in terms of pore size and porosity.
4.2.9 Dead end MF of oil-in-water emulsions
For prepared emulsions, droplet size of synthetic oil-in-water emulsions varied from
0.5-100 µm. The average droplet size has been evaluated as 1.761, 2.989, 6.037 and 6.928
µm for 50, 100, 150 and 200 mg/L synthetic oil-in-water emulsion solution, respectively [12,
49]. The pH of oil-in-water emulsions of various concentrations is found to be 5.51, 5.63,
5.78 and 6.05 for 50, 100, 150 and 200 mg/L, respectively.
Fig. 4.6 presents the permeate flux and membrane rejection variation with pressure.
Compared to water flux, the membrane flux is significantly low for the MF of emulsion. The
figure is in accordance with the theoretical insight that refers to enhancement in membrane
flux with increasing driving force. Further, membrane flux has been observed to reduce
with increasing feed concentration. This is due to the reason that higher feed concentration
refers to greater size distributions of the emulsion droplets, which enhances pore blocking
rate. From Fig. 4.6, it is also apparent that membrane M3 flux is higher than that obtained for
M1 and M2 membranes. Lowest flux is obtained for M2 membrane and this is due to its
lower pore size. For the operating and process conditions of 50 mg/L feed concentration and

111
345 kPa applied pressure, maximum permeate flux values of 6.55×10⁻⁴ (M1), 4.42×10⁻⁴ (M2)
and 8.19×10⁻⁴ (M3) m3/m2 s have been evaluated.
Fig. 4.6 also affirms that rejection reduces with increasing pressure. This is due to the
enhanced oil droplet wetting and coalescence at higher pressure to allow greater transport of
oil droplets through the porous membrane structure. On the other hand, membrane rejection
enhanced with increasing feed concentration. This increase of rejection value is an
enhancement in both oil droplet size and density with oil concentration. In summary, the
prepared membranes are effective to remove oil from oily wastewater. According to the
results shown in Fig. 4.6, the treatment of oil-in-water emulsions by microfiltration facilitates
a significant reduction in the permeate oil concentration. At 69 kPa applied pressure and 200
mg/L feed concentration, the maximum rejection of oil by M1, M2 and M3 is found to be
99.94%, 99.99% and 96.12%, respectively. The research findings precisely indicate the better
performance of the fly ash membranes for oil rejection.
Table 4.3 summarizes a comparative summary of evaluated oil rejection data and literature
data. From the Table 4.3, it can be understood that the membranes prepared from low cost
materials performed well in treating the oil-in-water emulsions. In addition, despite providing
lower flux, membrane M2 performance in terms of rejection is better than that of M1 and M3.
At 69 kPa pressure and 200 mg/L feed concentration, M2 membrane provided a flux and
rejection of 0.337×10⁻⁴ (m3/m2 s) and 99.99%, respectively. Corresponding values for M1 and
M3 membranes are 0.415×10⁻⁴ m3/m2s, 99.94% and 0.413×10⁻⁴ m3/m2s, 96.12%,
respectively. Since industrial applications require higher rejection and good flux, membrane
M2 is inferred to be the best for industrial applications.

112
Table 4.1: Characterization results of fabricated membranes
Table 4.2: Comparative study of fabricated membranes
Membrane
materials
Sintering
Temperature
(oC)
Average
pore size
(µm)
Porosity
(%)
Mechanical
strength
(MPa)
Author
Membrane M1 1100 1.41 30 1.68 Present work
Membrane M2 1100 1.36 39 6.99 Present work
Membrane M3 1100 1.53 43 9.25 Present work
Apatite 1150 5 48 14 Masmoudi et al., (2007)
Cordierite 1380 8.66 36 31 Dong et al., (2007)
Kaolin+Dolama 1200 3.77 41 6 Bouzerara et al., (2006)
Kaolin+Dolama 1250 11.09 41 15 Bouzerara et al., (2006)
Morocan clay 1175 10.75 43 3 Saffaj et al., (2006)
Properties Membrane M1 Membrane M2 Membrane M3
Pore size (SEM) 2 µm 1.75 µm 1.79 µm
Pore size (from N2 gas permeate flux) 1.36 µm 1.30 µm 1.44 µm
Porosity (%) 30 39 43
Hydraulic permeance (m3/m2s kPa) 5.384×10⁻⁶ 6.508×10⁻⁶ 9.53×10⁻⁶
Mechanical Strength 1.68 MPa 6.99 MPa 9.25 MPa
Cost of one membrane ($/m2) 462 465 465

113
Table 4.3: Comparison of oil rejection of fabricated membrane with other membranes
Membrane/support Material Mean
Pore size
Type of oil Applied
pressure
(kPa)
Feed
(ppm)
Oil droplet
size (µm)
Permeate
flux×106
(m3/m2 s)
Rejection
(%)
Author
α- Al2O3 0.2 µm Refinery oil 125 26 20 69.44 84.61 Abadi et al., (2011)
γ- Al2O3/α- Al2O3 10 nm Vegetable oil 100 5000 - 5.0 99.8 Yang et al., (1998)
α- Al2O3/ α-Al2O3 1.0 µm Vegetable oil 100 5000 - 7.50 94.3 Yang et al., (1998)
α- Al2O3 500 nm Kerosene 300 1000 11 175 ---- Srijaroonrat et al., (1999)
NaA zeolite/ α- Al2O3 1.2 µm Lubricant oil 100 100 1.5 16.67 98.8 Cui et al., (2008)
NaA zeolite/ α- Al2O3 0.4 µm Lubricant oil 100 100 1.5 1.39 99.4 Cui et al., (2008)
α- Al2O3 2.1 µm Lubricant oil 100 100 1.5 4.17 55.0 Cui et al., (2008)
Clay 0.98 µm Crude oil 345 200 1.211 79.78 98.6 Monash and Pugazhenthi, (2011)
Polyvinylidene Fluoride (PVDF) 0.45 µm Gas-oil 300 3000 0.901 134 80 Masoudnia et al., (2013)
α- Al2O3 0.1 µm Refinery oil 100 150 - 88.6 61.4 Ebrahimi et al., (2010)
TiO2/TiO2 1000Da Refinery oil 100 565 - 17.8 99.5 Ebrahimi et al., (2010)
Fly ash 0.77 µm Crude oil 100 75 2.8 44.17 95.30 Fang et al., (2013)
Coal 1 µm Crude oil 100 120 5 17.86 97.80 Song et al., (2006)
Membrane M1 1.41 µm Crude oil 69 200 6.928 41.5 99.94 Present study
Membrane M2 1.36 µm Crude oil 69 200 6.928 33.7 99.99 Present study
Membrane M3 1.53 µm Crude oil 69 200 6.928 41.3 96.12 Present study

114
Figure 4.6: Effect of applied pressure and feed concentration on permeate flux and
rejection (M1-M3) ■□-50 mg/L; ●○-100 mg/L; ▲Δ - 150 mg/L; ▼ -200 mg/L (Filled
symbol: Flux, Unfilled symbol: Rejection)
0 100 200 300 400
0
3
6
9
Applied pressure
Per
mea
te f
lux
J1
04
(m
3/m
2 s
)
0
10
20
30
40
50
60
70
80
90
100
Rej
ecti
on
(%
)
M1
0 100 200 300 400
0
2
4
6
Applied pressure (kPa)
Per
mea
te f
lux
J104 (
m3/m
2 s
)
0
10
20
30
40
50
60
70
80
90
100
Rej
ecti
on
(%
)
M2
0 100 200 300 400
0
5
10
15
Applied pressure (kPa)
Per
mea
te f
lux
J1
04
(m
3/m
2 s
)
0
10
20
30
40
50
60
70
80
90
100
Rej
ecti
on
(%
)
M3

115
4.2.10 Cost estimation
The in-house made ceramic membranes from fly ash need to be analyzed towards cost
effectiveness. Therefore, retail cost estimation has been done for the fabricated membranes
(M1-M3). The cost analysis involved the consideration of various parameters associated to
the cost of raw materials, manpower, electricity and equipment for the retail cost estimation.
The parameters considered for the cost estimation of membranes are presented in Table 4.4.
Appendix I summarizes the details with respect to the cost estimation for the membrane
fabrication and oil-in-water emulsions treatment. The fabricated ceramic membrane costs are
evaluated as 462 (M1), 465 (M2) and 465 (M3) $/m2. In the literature, ceramic membrane
cost is reported to be about 500 – 1000 $/m2 (Cheryan, 1998; Koros and Mahajan, 2000). The
cost of α-Al2O3 symmetric ceramic membrane is 500 $/m2 and the cost of membrane made
from stainless steel is about 3000 $/m2 (Mott Metallurgical Corp., 2007). For polymeric
membranes and symmetric α-alumina membranes, the costs vary from 50 – 200 $/m2
(Cheryan, 1998) and 2000-4000 $/m2 (Tennison, 2000), respectively. It is further important to
note that the membrane cost estimated and reported in this work is conceptual and could vary
significantly after detailed cost estimation. However, it is inferred that the fabricated
membranes are inexpensive than those prepared with alumina and zirconia from the
perspective of raw materials cost and lower sintering temperatures.
Further, cost analysis for oil-in-water emulsion separation with the fabricated
membranes for large-scale operation was conducted using obtained experimental results.
Total membrane system cost that includes equipment (Dead end flow permeation setup),
piping and instrumentation costs ($ 225) and N2 gas ($ 295.41)) is evaluated as $ 520.41 for
10 years period. Hence, assuming straight-line depreciation, the total fixed cost per year is 52
$/year. The prepared membranes (M1-M3) could be operated for 69 kPa and 200 mg/L
applied pressure and feed concentration, respectively at which their flux values are 4.15×10⁻⁵

116
(M1), 3.37×10⁻⁵ (M2) and 4.13×10⁻⁵ m3/m2 s (M3). Corresponding rejection values are
99.94, 99.99 and 96.12%. With an assumption of 8 h operation per day, total processed oil-in-
water emulsion feed in an year are 310752, 252345.6 and 309254.4 L with M1, M2 and M3,
respectively. For the treatment, the N2 gas cost is evaluated as $ 10/year for the dead end MF
unit operation. With straight-line depreciation for a time period of 7 years, the ceramic
membrane cost is 66 (M1), 67 (M2) and 67 (M3) $/year. A further reduction in membrane
shelf life could be considered by taking membrane shelf life as 3 years.
Table 4.4 presents a summary of costs involved with membrane cleaning,
maintenance (3% of membrane system cost) and labor cost (2% membrane system cost). The
cost estimation presented in Table 4.4 indicated significant variation due to variations in
equipment costs and flux production (or feed treated). In summary, the fly ash based ceramic
membranes are effective and efficient for oil-in-water separation applications in comparison
with highly expensive ceramic membranes.
Table 4.4: Cost estimation for fabrication of membranes and oil-in-water emulsion
treatment
Source M1 M2 M3
Raw materials cost ($/m2) 4.1913 7.3876 7.1375
Labor cost ($/m2) 197.4017 197.4017 197.4017
Electricity cost ($/m2) 156.7317 156.7317 156.7317
Equipment cost ($/m2) 56.1900 56.1900 56.1900
Miscellaneous cost ($/m2) 46.5931 46.5931 46.5931
The overall fabrication cost of one
membrane ($/m2)
461.1078
(462 $/m2)
464.3041
(465 $/m2)
464.054
(465 $/m2)

117
Oil-in-water emulsions treatment cost M1 M2 M3
Permeate flux through unit (m2) area of
membrane at applied pressure of 69 kPa
and feed concentration of 200 mg/L
4.15×10⁻⁵
(m3/m2 s)
3.37×10⁻⁵
(m3/m2 s)
4.13×10⁻⁵
(m3/m2 s)
Amount of oil-in-water emulsions
processed per year
310752
(L/Year)
252345.6
(L/Year)
309254.4
(L/Year)
Total direct (fixed) cost [Empty N2
cylinder cost + dead end flow filtration set
up cost)
52 ($/Year) 52 ($/Year) 52 ($/Year)
Operating cost (N2 gas consumable cost
per year for treatment of oil-in-water
emulsion by each membrane)
10 ($/Year) 10 ($/Year) 10 ($/Year)
Membrane cost 462 ($/m2) 465 ($/m2) 465 ($/m2)
Depreciation cost 66 ($/Year) 67 ($/Year) 67 ($/Year)
Membrane cleaning and maintenance cost
(@ 3% of total cost of the membrane
system)
1.56 ($/Year) 1.56 ($/Year) 1.56 ($/Year)
Labor cost (@ 2% of total cost of the
membrane system)
1.04 ($/Year) 1.04 ($/Year) 1.04 ($/Year)
The overall cost for the treatment of oil-
in-water emulsions ($/Year)
524.60
(525 $/Year)
524.60
(525 $/Year)
524.60
(525 $/Year)

118
4.2.11 Process model
The experimental investigations confirm that the removal of oil from oily wastewater
using ceramic microfiltration process is strongly influenced with operating parameters such
as applied pressure and feed concentration. Therefore, process model using regression based
approaches would indicate strong significance of these parameters and suitable expressions
need to consider these variables. A central composite design approach is followed to correlate
operating parameters (feed concentration and applied pressure) with measured or evaluated
variables (flux and rejection). The response parameters and design matrix obtained from
experimental investigations with M2 membrane are presented in Table 4.5. To evaluate upon
the effect of combined parameters, experiments are performed at various chosen parameters
in their statistical combinations of values to obtain combined matrix of experimental design.
The influential quadratic terms in the model are estimated using the central runs by repeating
the experiments for five times.
Eq. (2.11) expresses membrane flux or rejection (Y) in terms of applied pressure (X1)
and feed concentration (X2). The coefficient values of Eq. (2.12) are determined using the
RSM based regression technique using experimental data with help of Design-Expert 7.0.0
software. For M2 membrane, the regression based expressions for membrane flux and
rejection are presented in Eq. (4.1) and Eq. (4.2) respectively i.e.
-04 -06 -06 -09
1 2 1 2
-09 2 -08 2
1 2
Flux -1.789 10 1.657 10 3.083 10 - 2.482 10
-1.306 10 -1.195 10
X X X X
X X
(4.1)
4 5 2 4 2
1 2 1 2 1 2Rejection 84.229 0.086 0.209 3.728 10 2.189 10 6.462 10X X X X X X (4.2)
The positive and negative values in the above expression represent the synergetic and
antagonistic effect respectively. In addition, each term in the expression is not equally

119
important. Further, the model quality is to be evaluated in terms of the fitness evaluated
using coefficient of correlation and hence its determination is very important from the
perspective of statistical analysis.
The RSM model results for M1 and M3 membranes are similar to those obtained for
M2 and further explanations are not provided. The obtained results for these are presented in
Tables 4.6 and 4.7, respectively.
Table 4.5: RSM design and its actual and predicted values for M2 membrane
Run
order
Applied pressure
(kPa)
X1
Concentration
(mg/L)
X2
Permeate Flux J×104
(m3/m2 s)
Rejection (%)
Actual Predicted Actual Predicted
1 69 100 0.80 1.01 96.21 95.49
2 345 100 3.10 3.40 84.40 84.80
3 207 150 2.20 2.25 96.38 95.98
4 207 150 2.30 2.25 95.47 95.98
5 207 150 2.20 2.25 96.16 95.98
6 207 150 2.40 2.25 95.69 95.98
7 207 79.29 2.60 2.37 85.97 86.20
8 207 220.71 0.91 0.93 99.54 99.29
9 207 150 2.10 2.25 96.18 95.98
10 69 200 0.34 0.34 99.99 99.61
11 402.16 150 3.40 3.20 93.69 92.89
12 345 200 2.00 2.05 98.47 99.21
13 11.84 150 0.39 0.30 99.95 100

120
Table 4.6: RSM design and its actual and predicted values for M1 membrane
Run
order
Applied
pressure
(kPa)
Concentration
(mg/L)
Permeate Flux J×104
(m3/m2 s)
Rejection (%)
Actual Predicted Actual Predicted
1 207 150 2.31 2.23 90.26 90.76
2 207 150 2.25 2.23 90.15 90.76
3 69 200 0.42 0.45 99.95 100.75
4 345 200 1.38 1.45 92.37 92.15
5 207 150 2.19 2.23 91.45 90.76
6 207 150 2.22 2.23 90.36 90.76
7 207 220.71 0.65 0.61 99.04 98.52
8 69 100 1.21 1.29 94.3 93.98
9 11.84 150 0.36 0.31 99.98 99.53
10 345 100 4.68 4.80 81.64 80.3
11 207 79.29 3.67 3.56 84.29 85.35
12 402.16 150 3.61 3.51 82.79 83.78
13 207 150 2.17 2.23 91.56 90.76

121
Table 4.7: RSM design and its actual and predicted values for M3 membrane
Run
order
Applied
pressure
(kPa)
Concentration
(mg/L)
Permeate Flux J×104
(m3/m2 s)
Rejection (%)
Actual Predicted Actual Predicted
1 207 79.29 3.90 3.71 81.21 82.09
2 207 150 2.32 2.49 86.55 85.25
3 69 100 1.23 1.51 87.00 86.03
4 207 150 2.49 2.49 85.02 85.25
5 402.16 150 3.84 4.01 80.54 80.86
6 207 220.71 0.95 1.09 94.54 94.81
7 345 200 2.49 2.26 88.00 87.82
8 207 150 2.46 2.49 86.01 85.25
9 207 150 2.68 2.49 84.00 85.25
10 345 100 4.91 4.91 80.00 79.39
11 69 200 0.41 0.46 96.12 95.58
12 207 150 2.52 2.49 84.69 85.25
13 11.84 150 0.54 0.32 90.22 91.05

122
4.2.11.1 ANOVA analysis and quadratic model fitness
To ensure upon the model fitness, tests were carried out to evaluate upon the significance of
mathematical regression model, model coefficients and lack of fitness. During analysis of
variance (ANOVA), the value of F or p (usually denoted as Prob.>F) conveys upon the
significance of the coefficients. Coefficients with larger F and small Prob.>F value are
regarded to be significant. Table 4.8 summarizes results obtained from ANOVA analysis for
M2 membrane using second-order response model. For membrane M2, it can be seen that the
model F and Prob.>F values are 58.19 (high) and <0.05 (low), thereby affirming upon the
significance of the model. Similarly, the coefficients corresponding to various independent
variable terms also need to have a low Prob.>F value to indicate upon their significance. This
work aims to evaluate upon the significance of applied pressure (X1), feed concentration (X2),
the quadratic effect of applied pressure (X12) and feed concentration (X2
2). The ranking order
in terms of significance is X1>X12>X2>X2
2 with insignificance of other model terms. Lower
lack-of-fit F-value (4.95) conveyed that there has been insignificant lack of fitness for the
model. Further, the noise contribution towards the lack of fit F-value is evaluated to be 7.82%
by chance, which is also satisfactory. Also, “Pred R-squared” value (0.8606) is in agreement
with the “Adj R-squared” value (0.9597). For “Adeq Precision” that refers to a signal to
noise ratio value of 22.965 by the ANOVA analysis, the model fitness is assured due to
obtaining a value significantly greater than 4. Thereby, model navigation is suitably
confirmed in the design space.
After insignificant interaction terms are eliminated in Eq. (4.1), the model can be
expressed as in Eq. (4.3). In Eq. (4.3), the identification of any other insignificant model
terms requires a further model reduction strategy so as to achieve model improvement.

123
04 06 06 09 2 08 2
1 2 1 2Flux 1.789 10 1.657 10 3.083 10 1.306 10 1.195 10X X X X (4.3)
Obtained results from sequential model fitness studies are shown in Table 4.8 and affirm that
quadratic model is suitable to represent permeate flux.
The second-order response model parameters for the ANOVA of M1 and M3 membrane flux
is presented in Table 4.9 and 4.10, respectively. As indicated in Table 4.9, F and Prob.>F
have been evaluated to be 446.36 and very low value (<0.05). Thereby, these values affirm
upon the significance of the model in terms of X1, X2, X1X2 and X12 terms. A “Lack of Fit F-
value” of 5.84 affirms insignificant lack of fitness in comparison with the error. Further,
“Pred-R-squared” value (0.9810) and “Adj R-squared” value (0.9946) are in good agreement.
The higher value of “Adeq Precision” (68.534) confirms that the model navigation in the
design space can be carried out. For M3 membrane, 90.7 F-value conveys its significance
with X1, X2 and X1 X2 as significant model terms. Acceptable values of “Lack of Fit F-value”
(5.23) and close agreement between “Pred R-squared” (0.9090) and “Adj R-squared”
(0.9739) are also conveyed in Table 4.10 for the M3 membrane.

124
Table 4.8: ANOVA for the permeate flux response surface quadratic model of
M2 membrane
Source
Sum of
Squares
DF
Mean
Square
F–value
p–value
(Prob > F)
Model 1.15×10⁻⁷ 5 2.31×10⁻⁸ 58.19 < 0.0001
X1-Applied Pressure (kPa) 8.43×10⁻⁸ 1 8.43×10⁻⁸ 212.52 < 0.0001
X2-Concentration (mg/L) 2.06×10⁻⁸ 1 2.06×10⁻⁸ 52.00 0.0002
X1X2 1.17×10⁻⁹ 1 1.17×10⁻⁹ 2.96 0.1291
X12 4.3×10⁻⁹ 1 4.3×10⁻⁹ 10.85 0.0132
X22 6.21×10⁻⁹ 1 6.21×10⁻⁹ 15.65 0.0055
Residual 2.78×10⁻⁹ 7 3.97×10⁻¹⁰
Lack of Fit 2.19×10⁻⁹ 3 7.29×10⁻¹⁰ 4.95 0.0782
Pure Error 5.89×10⁻¹⁰ 4 1.47×10⁻¹⁰
Cor Total 1.18×10⁻⁷ 12
Std. Dev. 1.99×10⁻⁵ R2 0.98
Mean 0.0002 Adj R2 0.96
C.V. % 10.43 Pred R2 0.86
PRESS 1.65×10⁻⁸ Adeq Precision 22.96

125
Table 4.9: ANOVA for the permeate flux response surface quadratic model of
M1 Membrane
Source
Sum of
Squares
Degree of
Freedom
Mean
Square
F–value
p–value
(Prob > F)
Model 2.07×10⁻⁷ 5 4.14×10⁻⁸ 446.36 < 0.0001
X1-Applied Pressure
(kPa)
1.02×10⁻⁷ 1 1.02×10⁻⁷ 1098.81 < 0.0001
X2-Concentration
(mg/L)
8.75×10⁻⁸ 1 8.75×10⁻⁸ 942.88 < 0.0001
X1X2 1.57×10⁻⁸ 1 1.57×10⁻⁸ 169.07 < 0.0001
X12 1.77×10⁻⁹ 1 1.77×10⁻⁹ 19.03 0.0033
X22 3.59E-10 1 3.59×10⁻¹⁰ 3.87 0.0900
Residual 6.49×10⁻¹⁰ 7 9.28×10⁻¹¹
Lack of Fit 5.29×10⁻¹⁰ 3 1.76×10⁻¹⁰ 5.84 0.0607
Pure Error 1.21×10⁻¹⁰ 4 3.02×10⁻¹¹
Cor Total 2.08×10⁻⁷ 12
Std. Dev. 9.63×10⁻⁶ R2 1.00
Mean 0.00021 Adj R2 0.99
C.V. % 4.62 Pred R2 0.98
PRESS 3.95×10⁻⁹ Adeq
Precision
68.53

126
Table 4.10: ANOVA for the permeate flux response surface quadratic model of
M3 membrane
Source
Sum of
Squares
Degree of
Freedom
Mean
Square
F–value
p–value
(Prob > F)
Model 2.13×10⁻⁷ 5 4.25×10⁻⁸ 90.70 < 0.0001
X1-Applied Pressure (kPa) 1.36×10⁻⁷ 1 1.36×10⁻⁷ 289.57 < 0.0001
X2-Concentration (mg/L) 6.86×10⁻⁸ 1 6.86×10⁻⁸ 146.18 < 0.0001
X1X2 6.42×10⁻⁹ 1 6.42×10⁻⁹ 13.70 0.0076
X12 1.87×10⁻⁹ 1 1.87×10⁻⁹ 3.98 0.0863
X22 1.46×10⁻¹⁰ 1 1.46×10⁻¹⁰ 0.31 0.5943
Residual 3.28×10⁻⁹ 7 4.69×10⁻¹⁰
Lack of Fit 2.62×10⁻⁹ 3 8.72×10⁻¹⁰ 5.22 0.0720
Pure Error 6.67×10⁻¹⁰ 4 1.67×10⁻¹⁰
Cor Total 2.16×10⁻⁷ 12
Std. Dev. 2.17×10⁻⁵ R2 0.98
Mean 0.00024 Adj R2 0.97
C.V. % 9.16 Pred R2 0.91
PRESS 1.96×10⁻⁸ Adeq
Precision
31.20
4.2.11.2 ANOVA for rejection
For M2 membrane, model F-value of 118.70 affirms model significance (Table 4.11).
A chance of 0.01% for the “Model F-value” confirms that noise is low. “Prob.>F” values less
than 0.05 for model terms X1, X2, X1X2, X22 indicate their significance. Model terms with p
values greater than 0.1 indicate insignificant terms and model reduction could further

127
improve the model fitness. Other ANOVA values affirm that the obtained values are
satisfactory (6.32 Lack of fit value; 5.35% chance for Lack of Fit F-value; 0.9284 Pred-R-
squared value; 0.98 Adj R squared value; 34.111 signal to noise ratio).
After insignificant interaction terms are eliminated in the regression expression
presented in Eq. (4.2), the model is simplified in the following form by refining the model:
4 4 2
1 2 1 2 2Rejection 84.229 0.086 0.209 3.728 10 6.462 10X X X X X (4.4)
Sequential model fitting results are shown in Table 4.11 and confirms that the quadratic
model is the most suitable model to represent rejection. Further, ANOVA analysis was also
conducted to evaluate upon the applied pressure and feed concentration effect on oil rejection
data. Results obtained for the conducted analysis are presented in Table 4.8 and 4.11 for
pressure and feed concentration effect, respectively. P values in both the tables affirm that all
terms are significant with 99% confidence. The R2 values from statistical analysis are
satisfactory (0.981 and 0.99 for membrane flux and oil rejection, respectively). Regression
coefficients obtained from the analysis are also presented in Table 4.8 and Table 4.11.
Regressed model parameters in Eq (4.1-4.2) convey upon the effect of operational parameters
and their possible interactions on dependent variables. From Table 4.8 and Eq. (4.1), a
positive effect of pressure and feed concentration on membrane flux can be seen. Similar
insights can be deduced from Table 4.11 and Eq. (4.2).
The results obtained for the second-order response model using ANOVA analysis for
rejection data of membranes M1 and M3 are presented in Table 4.12 and Table 4.13,
respectively. For M1 membrane rejection data, high F value (85.52) conveys model
significance. 0.01% chance for model-F value affirms that there is little noise. Also, X1, X2

128
and X1X2 have been identified as significant model terms. 3.63 value for “Lack of Fit”
parameter affirms insignificant lack of fitness in comparison with the pure error. A good
agreement of “Pred R squared value” (0.9095) and “Adj R-squared value” (0.9274) is
apparent. 29.968 noise to signal ratio confirms adequacy of signal. Similar results have been
obtained for the M3 membrane (53.08 model F-value; X1, X2 and X22 significant terms; 1.04
Lack of fit F-value; Pred R squared value of 0.8972; Adj R squared value of 0.9559; Adeq.
Precision of 23.056). Thereby, model navigation is also affirmed by the ANOVA in the
design space.
Table 4.11: ANOVA for the rejection response surface quadratic model of
M2 membrane
Source Sum of
Squares DF
Mean
Square F–value
p–value
(Prob > F)
Model 280.43 5 56.09 118.70 < 0.0001
X1-Applied Pressure (kPa) 61.51 1 61.51 130.18 < 0.0001
X2-Concentration (mg/L) 171.50 1 171.50 362.97 < 0.0001
X1X2 26.47 1 26.47 56.02 0.0001
X12 1.21 1 1.21 2.56 0.1536
X22 18.16 1 18.16 38.42 0.0004
Residual 3.31 7 0.47
Lack of Fit 2.73 3 0.91 6.32 0.0535
Pure Error 0.58 4 0.14
Cor Total 283.74 12
Std. Dev. 0.69 R2 0.99
Mean 95.24 Adj R2 0.98
C.V. % 0.72 Pred R2 0.93
PRESS 20.32 Adeq Precision 34.11

129
Table 4.12: ANOVA for the oil rejection response surface quadratic model of
M1 Membrane
Source
Sum of
Squares
DF
Mean
Square
F–value
p–value
(Prob > F)
Model 431.29 5 86.26 85.52 < 0.0001
X1-Applied Pressure (kPa) 248.09 1 248.09 245.96 < 0.0001
X2-Concentration (mg/L) 173.35 1 173.35 171.86 < 0.0001
X1X2 6.45 1 6.45 6.40 0.0393
X12 1.41 1 1.41 1.39 0.2764
X22 2.42 1 2.42 2.40 0.1655
Residual 7.06 7 1.01
Lack of Fit 5.16 3 1.72 3.63 0.1227
Pure Error 1.90 4 0.47
Cor Total 438.35 12
Std. Dev. 1.00 R2 0.98
Mean 91.40 Adj R2 0.97
C.V. % 1.10 Pred R2 0.91
PRESS 39.68 Adeq Precision 29.97

130
Table 4.13: ANOVA for the rejection response surface quadratic model of
M3 membrane
Source
Sum of
Squares
Degree of
Freedom
Mean
Square
F–
value
p–value
(Prob > F)
Model 2.13×10⁻⁷ 5 4.25×10⁻⁸ 90.70 < 0.0001
X1-Applied Pressure (kPa) 1.36×10⁻⁷ 1 1.36×10⁻⁷ 289.57 < 0.0001
X2-Concentration (mg/L) 6.86×10⁻⁸ 1 6.86×10⁻⁸ 146.18 < 0.0001
X1X2 6.42×10⁻⁹ 1 6.42×10⁻⁹ 13.70 0.0076
X12 1.87×10⁻⁹ 1 1.87×10⁻⁹ 3.98 0.0863
X22 1.46×10⁻¹⁰ 1 1.46×10⁻¹⁰ 0.31 0.5943
Residual 3.28×10⁻⁹ 7 4.69×10⁻¹⁰
Lack of Fit 2.62×10⁻⁹ 3 8.72×10⁻¹⁰ 5.22 0.0720
Pure Error 6.67×10⁻¹⁰ 4 1.67×10⁻¹⁰
Cor Total 2.16×10⁻⁷ 12
Std. Dev. 2.17×10⁻⁵ R2 0.98
Mean 0.00024 Adj R2 0.97
C.V. % 9.16 Pred R2 0.91
PRESS 1.96×10⁻⁸ Adeq
Precision
31.20
4.2.11.3 Response surface and contour plots
The graphical surfaces of response and contour plots are obtained using the RSM
methodology from the developed regression equation. These response function plots of the
surface and contour plots are useful in understanding the effects of combined factors. In
addition, the obtained parameters are useful to analyze upon three-dimensional interactions.

131
The effect of the studied range of variables with interactions is analyzed by keeping the other
parameters constant. This results in two response and corresponding contour plots for
membrane M2 (Fig. 4.7 and 4.8 respectively). Fig. 4.7 demonstrates the three dimensional
response surface relationships between dependent variables and independent variables
(applied pressure (X1) and feed concentration (X2)) for M2 membrane. The contour plots
depict that the expected dependence of membrane flux with pressure and feed concentration.
However, membrane flux increases with increasing feed concentration and marginally
declines with increasing pressure. The contour plots for oil rejections is depicted in Fig. 4.8
that illustrates the combined effect of X1 (pressure) and X2 (feed concentration) on rejection.
The contour plot shapes convey upon the level and nature of the interactions that can be
viewed by the elliptic nature of the plots of contours. However, the non-useful or low case
interactions are also evident with the circular shape of few contours. These plots depict that
the cumulative interaction parameters of operating variables selected in this investigation are
much more important. Similar findings are also observed for the M1 and M3 membranes.
Fig. 4.9-4.12 depicts the corresponding plots for these membranes.

132
Design-Expert® Software
Permeate Flux (m³/m² s )0.000336
3.37E-005
X1 = A: Applied Pressure (kPa)X2 = B: Concentration (mg/L)
69
138
207
276
345
100
125
150
175
200
3.0E-05
1.1E-04
1.9E-04
2.7E-04
3.5E-04
Design-Expert® Software
Rejection (%)99.99
84.4
X1 = A: Applied Pressure (kPa)X2 = B: Concentration (mg/L)
69
138
207
276
345
100
125
150
175
200
84
88
92
96
100
Figure 4.7: Response surface plots for permeate flux and oil rejection of M2 membrane

133
Design-Expert® Software
Permeate Flux (m³/m² s )Design Points0.000336
3.37E-005
X1 = A: Applied Pressure (kPa)X2 = B: Concentration (mg/L)
69 138 207 276 345
100
125
150
175
200
Applied Pressure (kPa)
Co
nce
ntr
atio
n (
mg
/L)
8.5E-05
1.4E-041.9E-04
2.4E-04
2.9E-04
55555
Design-Expert® Software
Rejection (%)Design Points99.99
84.4
X1 = A: Applied Pressure (kPa)X2 = B: Concentration (mg/L)
69 138 207 276 345
100
125
150
175
200
Applied Pressure (kPa)
Co
nce
ntr
atio
n (
mg
/L)
87.3052
89.8083
92.3114
94.8146
97.3177
55555
Figure 4.8: Contour plots for combined effects on permeate flux and rejection of M2
membrane

134
Design-Expert® Software
Permeate Flux (m³/m² s )Design Points0.000468
3.6E-005
X1 = A: Applied Pressure (kPa)X2 = B: Concentration (mg/L)
69 138 207 276 345
100
125
150
175
200
Applied Pressure (kPa)
Co
nce
ntr
atio
n (
mg
/L)
1.2E-04
1.9E-04
2.6E-04
3.3E-04
4.1E-04
55555
Design-Expert® Software
Rejection (%)Design Points99.98
81.64
X1 = A: Applied Pressure (kPa)X2 = B: Concentration (mg/L)
69 138 207 276 345
100
125
150
175
200
Applied Pressure (kPa)
Co
nce
ntr
atio
n (
mg
/L)
83.7092
87.1171
90.525
93.9329
97.3408
55555
Figure 4.9: Contour plots of permeate flux and rejection for M1 membrane

135
Design-Expert® Software
Permeate Flux (m³/m² s )0.000468
3.6E-005
X1 = A: Applied Pressure (kPa)X2 = B: Concentration (mg/L)
69
138
207
276
345
100
125
150
175
200
3.0E-05
1.4E-04
2.6E-04
3.7E-04
4.8E-04
Design-Expert® Software
Rejection (%)99.98
81.64
X1 = A: Applied Pressure (kPa)X2 = B: Concentration (mg/L)
69
138
207
276
345
100
125
150
175
200
80
85.25
90.5
95.75
101
Figure 4.10: Response surface plots of permeate flux and oil rejection for M1 membrane

136
Design-Expert® Software
Permeate Flux (m³/m² s )Design Points0.000491
4.13E-005
X1 = A: Applied Pressure (kPa)X2 = B: Concentration (mg/L)
69 138 207 276 345
100
125
150
175
200
Applied Pressure (kPa)
Co
nce
ntr
atio
n (
mg
/L)
1.2E-04
1.9E-04
2.7E-04
3.4E-04
4.2E-04
55555
Design-Expert® Software
Rejection (%)Design Points96.12
80
X1 = A: Applied Pressure (kPa)X2 = B: Concentration (mg/L)
69 138 207 276 345
100
125
150
175
200
Applied Pressure (kPa)
Co
nce
ntr
atio
n (
mg
/L)
82.0853
84.7845
87.4838
90.183
92.8822
55555
Figure 4.11: Contour plots of permeate flux and rejection for M3 membrane

137
Design-Expert® Software
Permeate Flux (m³/m² s )0.000491
4.13E-005
X1 = A: Applied Pressure (kPa)X2 = B: Concentration (mg/L)
69
138
207
276
345
100
125
150
175
200
4.0E-05
1.5E-04
2.7E-04
3.9E-04
5.0E-04
Design-Expert® Software
Rejection (%)96.12
80
X1 = A: Applied Pressure (kPa)X2 = B: Concentration (mg/L)
69
138
207
276
345
100
125
150
175
200
79
83.5
88
92.5
97
Figure 4.12: Response surface plots of permeate flux and oil rejection for M3 membrane

138
0 1 2 3 4
0
1
2
3
4
Pre
dic
ted
flu
x J1
04 (
m3/m
2 s
)
Actual flux J104 (m
3/m
2 s)
84 86 88 90 92 94 96 98 100
84
86
88
90
92
94
96
98
100
Pre
dic
ted
oil
reje
cti
on
(%
)
Actual oil rejection (%)
Figure 4.13: Actual versus predicted values for M2 membrane

139
Figure 4.14: Residual plots against Normal probability for M2 membrane

140
4.2.11.4 Process optimization
The optimization technique is used to analyze the quadratic equation for desired features of
independent and dependent variables. The design parameter values are obtained from the
process optimization for either minimum and or maximum value of the response of the
developed function.
The Design Expert 7.0 Model package has been used for the numerical optimization
to select the required level of accuracy from each of the variable with five number of possible
desired ways for responses (none, maximum, within rage, minimum and target value) and for
the variable taken a fixed value. Then the optimization of numerical values are set up for the
required function to maximize within the range of 69-345 kPa pressure differential and 100-
200 mg/L feed concentration. The primary intention of the modeling effort is to maximize
both permeate flux and oil removal by recalculating important factors from developed
desirability functions. As obtained from the desirability ramp during numerical optimization,
specific values for all responses are evaluated. The best local maximum is found at 345 kPa
pressure, 176.07 mg/L feed concentration, 2.6×10⁻⁴ (m3/m2 s) permeate flux and 96.97% oil
rejection with 0.774 desirability. Hence, Design Expert 7.0.0 software is effectively used to
fit the experimental results (see Table 4.5) with a second order quadratic equation.
Multiple regression approach in Design Expert 7.0.0 software was used to fit
quadratic second order model for data presented in Table 4.5. When predicted responses are
relatively realistic with the experimental data, a dependable and accurate model is affirmed.
Both the experimental values and predicted values of permeate flux and rejection from the
statistical process model are well compared and displayed in the Fig. 4.13. In addition to this,
Fig. 4.14 demonstrate the relation between the residuals values and normal probability. For
the validation of the ANOVA results, it must be the case that the plot between the residuals

141
and normal probability is straight line to avoid any problem in the data. From Fig. 4.14, it is
noticed that plot shows straight line. Therefore, these experimental investigations affirm that
the empirical model is satisfactory to predict oil removal during dead end MF operation.
The perturbation plots of permeate flux and rejection versus the process variables i.e.
applied pressure and feed concentration are as well important. The utility of the perturbation
plot exists in terms of effects associated to relevant factors for a specific position in the
design space. By maintaining all other factors constant, the response plot is achieved by
varying a factor only in the set range. The Design Expert 7.0.0 sets mid-point as reference
point for all factors. The sensitivity and insensitivity of a factor is sought in terms of the
slope of the response. A steep slope or curvature response affirms sensitivity of response
with a factor which is not the case for a relatively flat line. For the case where there are more
than two factors, perturbation plots are used to find the effect of those factors on which the
response is highly sensitive. This study reveals that rejection is more sensitive to feed
concentration of oil-in-water emulsions and least sensitive to applied pressure while other
response i.e. permeate flux is more sensitive to applied pressure and least sensitive to feed
concentration.
For M1 membrane, the best local maximum is found at 188.54 kPa pressure differential,
137.32 mg/L feed concentration, 2.3060×10⁻⁴ (m3/m2 s) membrane flux, 90.44% oil rejection
for 0.465 desirability. For M3 membrane, the best local maximum is found at 310.17 kPa
applied pressure, 200 mg/L feed concentration, 2.1054×10⁻⁴ (m3/m2 s) permeate flux, 88.64%
oil rejection at a desirability of 0.449.

142
4.3 Summary
This chapters summarizes the development and characterization of inexpensive
ceramic membranes using fly ash as major inorganic precursor by uniaxial dry compaction
method. All the membranes being sintered at 1100 oC exhibit excellent thermal, chemical and
mechanical strength properties. The membranes possess porosity of 30 (M1), 39 (M2) and
43 (M3) %. The prepared membrane with different composition offers good mechanical
strength (1.68, 6.99 and 9.25 MPa for mentioned membrane sequence). The permeability and
average pore diameter are estimated to be 5.384×10⁻⁶ , 6.508×10⁻⁶, 9.53×10⁻⁶ m/s kPa and
1.41, 1.36, 1.53 µm for said sequence of membranes. During microfiltration studies with
synthetic oil-in-water emulsions, M2 membrane offered better combinations of rejection (81-
99%) and membrane flux (4.42-0.337×10⁻⁴ m3/m2 s).
Dead-end flow microfiltration is an effective and prominent process for the separation
of oil-in-water emulsions. For the parametric optimization, this work targeted a two-step
approach in which the first step referred to experimental investigations to evaluate upon the
optimality of applied pressure and feed concentration on the process variables, namely flux
and rejection. The second step involved the parametric optimization RSM methodology in
which central composite design approach has been followed. Using ANOVA analysis, model
refinement was facilitated that allowed the identification of significant and insignificant terms
for both interactive and squared terms. Both experimental and theoretical investigations are in
good agreement for flux and rejection. For the M2 membrane, based on RSM, optimal
process variable values of permeate flux (2.6×10⁻⁴ m3/m2s), rejection (96.94%) and
desirability (0.774) have been at 345 kPa applied pressure and 176.07 mg/L feed
concentration.

143
CHAPTER-5
Preparation, Characterization and Application of TiO2-Fly ash Composite membranes

144

145
CHAPTER 5 Preparation, characterization and application of TiO2-Fly
ash composite membranes
After a brief introduction to necessity of addressing the fabrication of TiO2-Fly ash composite
membrane in section 5.1, sections 5.2.1-5.2.4 summarize the characterization results of TiO2-
Fly ash composite membrane. Eventually, sections 5.2.5 summarizes the results obtained for
membranes during cross flow MF of oil-in-water emulsions. Finally the optimization of MF
process by RSM for membranes and their corresponding obtained results are presented in
section 5.2.6 followed with summary of the chapter in section 5.3.
5.1 Overview
In chapter 4, the results obtained from the dead end microfiltration of oil-in-water emulsions
have been reported for various fly ash based ceramic membranes (M1, M2 and M3), whose
average pore size is about 1.41, 1.36 and 1.53 µm, respectively. Amongst these, the M2
membrane has been identified as the optimal choice due to its good performance
characteristics. While dead end microfiltration provides significantly stringent conditions of
fouling for the membranes, they are not practiced regularly in the industrial scale operating
systems. Typically, cross flow microfiltration is practiced on a pilot plant and industrial scale
operation. Therefore, the flux and separation characteristics obtained from dead end
microfiltration are not directly relevant to infer the confidence levels associated to the
application of the fabricated membranes. Thus, cross flow microfiltration study has been
targeted in this chapter for the developed M2 and TiO2-Fly ash composite membranes and
full details are explained in the subsequent sub-sections. In the earlier chapter 4, the
separation of oil-in-water emulsions with M2 membrane in dead end mode of operation has
been presented. The membrane with lowest average pore size refers to M2 membrane whose
146
average pore size is 1.36 µm. However, the membrane with hydrophobic nature is not
favorable for the effective treatment of oil-in-water emulsions in the range of 50-200 mg/L.
Thus, further engineering is targeted to achieve hydrophilic sub-micron range MF
membranes. To do so, further enhancement in permeate flux, oil rejection and reduction in
membrane pore size and surface modification is anticipated by coating a layer on the M2
membrane. Amongst various available materials, TiO2 is one of the most favored choices due
to its surface modification tendency. Thereby, further research has been initiated in this work
to achieve hydrophilic microfiltration range ceramic membrane. For this purpose, the efficacy
of the in-situ hydrothermal method is also targeted. Typically, asymmetric membranes are
developed on a macroporous support with moderately higher average pore size. This is
primarily due to the fact that a macroporous support with lower average pore size offers
significant hydraulic resistance, which is not beneficial. Thus, considering all these issues,
membrane M2 has been selected and used as the macroporous support to fabricate TiO2-Fly
ash composite membrane.
5.2 Results and discussion
5.2.1 Contact angle and FESEM micrographs
Figs. 5.1 (a) and (b) represent the images of contact angle for M2 and TiO2-Fly ash composite
membrane, respectively, with which the contact angle has been evaluated as 25.8° and 14.4°,
respectively. For both membranes, the contact angle values are significantly lower than 90o,
indicating that both membranes are hydrophilic in nature. Due to this reason, it is expected
that during cross flow MF of oil-in-water emulsions, the adherence of oil droplets to the
membrane surface could reduce and accordingly, the membrane fouling will be lower.
Further, compared to the M2 membrane, the TiO2-Fly ash composite membrane is strongly
hydrophilic and this is due to the TiO2 layer. Thereby, TiO2 could significantly lower the

147
interaction of the oil droplets with the membrane surface and strongly mitigate or weaken
membrane fouling. Thus it is expected that among the asymmetric and symmetric
membranes, the composite membrane would have lower fouling and greater shelf life for oil-
in-water emulsion treatment.
Figs. 5.1 (c) and (d) depict the FESEM images of M2 membrane and TiO2 composite
membrane, respectively. The presence of TiO2 nanoparticles is depicted with circle symbol
and arrow mark in the FESEM image of composite membrane (Fig. 5.1(d)). It can be
observed that TiO2 nanoparticles were uniformly coated on the composite membrane and
both membrane surfaces exhibit a defect free surface that is bereft of pinholes/cracks. The
EDX analysis of TiO2 composite membrane further confirms the distribution of titanium
element on the membrane surface as the scan image indicated Ti element on the tiny TiO2
porous layer prevalent on the surface (Fig. 5.1(e)). Thus, FESEM images confirmed upon
greater hydrophilic nature of the composite membrane due to the presence of TiO2
nanoparticles on the surface which contributed to pore size reduction and porosity as well.

148
Figure 5.1: (a,b) Contact angle, (c,d) FESEM images and (e) EDX analysis of M2
membrane and TiO2-Fly ash membrane
(e) EDX analysis
(a) M2 (b) TiO2-Fly ash
(c) M2 (d) TiO2-Fly ash

149
5.2.2 Average porosity and FESEM based pore size
TiO2-Fly ash composite membrane and M2 membrane porosities were evaluated to be 35%
and 39%, respectively. Thus, the titania coating has reduced the porosity by 4 % due to the
reduction in pore volume with the coated layer. The FESEM image based average membrane
pore sizes are 1.32 and 1.75 µm for TiO2-Fly ash and M2 membrane, respectively. Hence, it
is apparent that while porosity reduction is not significant with the titania coating, the same is
not true for the average pore size of the membrane.
Fig. 5.2 depicts the N2 gas permeation data based effective permeability factor variation with
average pressure for both membranes. Compared to M2 membrane, the TiO2-fly ash
membrane indicated lower combinations of effective permeability factor and pore size. The
N2 permeation based average membrane pore size values are 1.12 and 1.30 µm for TiO2-Fly
ash and M2 membrane, respectively. Corresponding FESEM image analysis based mean pore
size values are 1.32 and 1.75 µm, respectively. Significant variation exists in the mean pore
size with FESEM analysis and with N2 permeation data. This is due to the reason that gas
permeation based data refers to open channel pores, which is not the case for FESEM based
analysis in which even dead pores are also counted during pore size evaluation.
5.2.3 Droplet size distributions
Fig. 5.3 depicts the droplet size distribution of oil-in-water emulsions were evaluated at
various solution concentrations. For all the concentrations, the emulsion droplet sizes varied
from 0.05 - 100 µm. The average emulsion droplet size (in diameter) was evaluated to be
0.989, 5.246 and 6.716 µm for solutions with 100, 150 and 200 mg/L oil concentrations,
respectively.

150
110 120 130 140
0
3
6
9
12
15
18
21
24
M2 membrane
TiO2-Fly ash
Eff
ecti
ve
Perm
eab
ilit
y F
act
or
K10
3 (
m/s
)
Average Pressure P103 (m/s)
Figure 5.2: N2 gas permeation through membranes
0.01 0.1 1 10 100 1000 10000 100000
0
2
4
6
8
10
100 mg/L
150 mg/L
200 mg/L
Vo
lum
e (%
)
Droplet Size (m)
Figure 5.3: Droplet size distribution of oil-in-water emulsions

151
0 5 10 15 20 25 30 35 40 45 50 55 60 65
0
10
20
30
40
50
Wa
ter
flu
x J
10
4 (
m3/m
2 s
)
Time (min)
0.0885 m/s
0 5 10 15 20 25 30 35 40 45 50 55 60 65
0
10
20
30
40
50
Wa
ter
flu
x J
10
4 (
m3/m
2 s
)
Time (min)
0.1327 m/s
0 5 10 15 20 25 30 35 40 45 50 55 60 65
0
10
20
30
40
50
60
Wa
ter
flu
x J
10
4 (
m3/m
2 s
)
Time (min)
0.1769 m/s
0 69 138 207
0
10
20
30
40
50
60
Av
era
ge
wa
ter
flu
x J1
04 (
m3/m
2 s
)
Applied pressure (kPa)
Figure 5.4: The variation of water flux of TiO2-Fly ash composite membrane (filled
symbol) and M2 (unfilled symbol) membranes with various applied pressures at
different cross flow velocities (■,□ - 69 kPa; ●,○ - 138 kPa; ▲,Δ - 207 kPa)
5.2.4 Water flux
Fig. 5.4 illustrates the variation of membrane pure water flux with variations in cross flow
velocity at variant applied pressures. Constant flux was observed during entire filtration time
for all cases. Further, it was in accordance with Darcy’s law and increased linearly with
increasing pressure value. For all cases, the water flux values for TiO2-Fly ash membrane are
higher than those obtained for the M2 membrane due to its higher hydrophilic nature. At 207
kPa and 0.1769 m/s experimental conditions, maximum water flux value of 61.3545×10⁻⁴

152
m3/m2 s and 59.6213×10⁻⁴ m3/m2 s was obtained for TiO2-Fly ash and M2 membranes,
respectively.
5.2.5 Cross-flow MF of oil-in-water emulsions
5.2.5.1 Effect of applied pressure
Fig. 5.5 depicts the variation of time dependent membrane flux at different applied pressures
and cross flow velocities. Membrane flux increases with increasing applied pressure due to
enhancement in driving force (Chakrabarty et al., 2008). For all cases, flux decline trends
indicate that the flux reduced slightly up to 5 min and thereafter, the variation of permeate
flux with time is almost negligible for 1 h operation. This may be due to the pore blocking at
early stages, after that this effect is negligible (Mittal et al., 2011). Higher applied pressure
contributed to membrane fouling due to which flux decline rate is slightly enhanced for all
cases. This may be due to the collision between the emulsion droplets, thereby larger droplet
forms which further create an oil layer just over the membrane surface. Further, the oil
droplets were pressed and squeezed by higher pressure to penetrate in to the pores causing
fouling (Mittal et al., 2011). For the M2 membrane, the flux decline rate is higher than that
existent for the TiO2-Fly ash membrane. This is confirmed with the maximum average
permeate flux value (42.8495×10⁻⁴ (m3/m2 s) and 40.9045×10⁻⁴ (m3/m2 s) for TiO2-Fly ash
and M2 membrane, respectively) after 1 h of cross flow MF at the experimental conditions of
207 kPa, 0.1769 m/s and 200 mg/L feed concentration. This is due to the hydrophilic nature
generated by TiO2 layer, which results in reducing the effect of membrane fouling.

153
0
10
20
30
40
50
55
100 mg/L
0.0885 m/s
0
10
20
30
40
50
60
100 mg/L
0.1327 m/s
0
10
20
30
40
50
60100 mg/L
0.1769 m/s
0
10
20
30
40
50150 mg/L0.0885 m/s
Per
mea
te f
lux
104
(m3 /m
2 s)
0
10
20
30
40
50150 mg/L0.1327 m/s
0
10
20
30
40
50 150 mg/L0.1769 m/s
0 10 20 30 40 50 600
10
20
30
40
50200 mg/L0.0885 m/s
0 10 20 30 40 50 600
10
20
30
40
50200 mg/L0.1327 m/s
Time (min)
0 10 20 30 40 50 600
10
20
30
40
50200 mg/L0.1769 m/s
Figure 5.5: The variation of permeate flux of TiO2-Fly ash composite membrane (filled symbol) and M2 (unfilled symbol) membranes
with various applied pressures and cross flow velocities at different feed concentrations (■,□ - 69 kPa; ●,○ - 138 kPa; ▲,Δ - 207 kPa)

154
86
88
90
92
94
96
98
100
100 mg/L
0.0885 m/s
86
88
90
92
94
96
98
100
100 mg/L
0.1327 m/s
86
88
90
92
94
96
98
100
100 mg/L
0.1769 m/s
86
88
90
92
94
96
98
100
150 mg/L0.0885 m/s
Rej
ecti
on (%
)
86
88
90
92
94
96
98
100
150 mg/L
0.1327 m/s
86
88
90
92
94
96
98
100
150 mg/L
0.1769 m/s
0 5 10 15 20 25 30 35 40 45 50 55 60 6596
97
98
99
100
200 mg/L
0.0885 m/s
0 5 10 15 20 25 30 35 40 45 50 55 60 6596
97
98
99
100
200 mg/L
Time (min)
0.1327 m/s
0 5 10 15 20 25 30 35 40 45 50 55 60 6596
97
98
99
100
200 mg/L
0.1769 m/s
Figure 5.6: The variation of rejection of TiO2-Fly ash composite membrane (filled symbol) and M2 (unfilled symbol) membranes with
various applied pressures and cross flow velocities at different feed concentrations (■,□ - 69 kPa; ●,○ - 138 kPa; ▲,Δ - 207 kPa)

155
Fig. 5.6 depicts of time dependent variation of oil rejection with applied pressure. At 0.0885
m/s cross flow velocity, for M2 membrane, the average rejection values varied from 97.91-
94.68%, 98.24-97.14% and 99.45-98.82% for three feed concentrations (100-200) at different
applied pressures (69-207 kPa). However, for same experimental conditions, the TiO2-fly
ash membrane exhibited the rejection variations of about 98.53-96.48%, 98.67-97.35% and
99.53-99.15%. The higher applied pressure facilitated greater wetting and coalescence of oil
droplets and hence, greater permeate concentrations due to significant passage of oil droplets
through the ceramic membranes. The enhancement in the rejection rate with time is due to
pore blocking that occurred after a certain time frame during the cross flow MF run. The oil
rejection has been evaluated to be a highly dependent upon membrane pore size and applied
pressure with higher rejection obtained for the TiO2-fly ash composite membranes in
comparison with those obtained for the M2 membrane (99.53% for composite membrane and
99.45% for M2 membrane at 69 kPa, 0.0885 m/s, and 200 mg/L solution concentration).
From this study, it was known that the oil rejection depends on membrane pore size and the
best operating applied pressure for obtaining better permeate flux and oil rejection was 207
kPa.
5.2.5.2 Effect of cross flow rate
The variations in trans-membrane flux and rejection with variations in cross flow velocities
(0.0885-0.1769 m/s) and applied pressure (69-207 kPa) are shown in Figs. 5.5 and 5.6. As
expected, higher membrane flux was obtained at higher cross flow velocity due to reduction
in concentration polarization. Further, an enhancement in the cross flow velocity enabled an
increase in the shear stress on the surface and thereby reduces the thickness of oil layer that
adheres on the membrane surface. Further, flux decline rate reduced with increasing cross
flow velocity. This is due to the lower cake layer formation on the membrane surface, which

156
reduces permeation resistance and hence higher flux (Chakrabarty et al., 2008; Mittal et al.,
2011); Mueller et al., 1997; Vasanth et al., 2013; Jonsson and Tragardh, 1990). For TiO2-Fly
ash membrane, the maximum average permeate flux (51.6372×10⁻⁴ m3/m2 s) was evaluated at
experimental conditions of 0.1769 m/s cross flow velocity (highest value), 207 kPa applied
pressure (highest value) and 100 mg/L feed concentration (lowest value). Corresponding
membrane flux value for M2 membrane was 49.9712×10⁻⁴ m3/m2 s.
The M2 membrane rejection has been found to decrease (94.69-92.47%, 97.14-96.42% and
98.82-98.37% for 100, 150 and 200 mg/L of feed, respectively at 207 kPa) with increasing
cross flow velocity (0.0885-0.1769 m/s). On the other hand, TiO2-Fly ash membrane
exhibited maximum rejection (96.48-96.35%, 97.35-97.07% and 99.15-98.82%). At higher
cross flow velocities, oil emulsion droplet sizes are reduced significantly and finer droplets
are facilitated to enter the permeate stream significantly to reduce the rejection. For M2
membrane, the maximum oil rejection of 98.82% has been obtained at lower cross flow
velocity (0.0885 m/s), higher feed concentration (200 mg/L) and higher pressure of 207 kPa.
Corresponding rejection value for TiO2-fly ash membranes is 99.15%. At higher cross flow
velocity values, rejection values are lower but flux values are higher and hence if maximum
membrane flux is to be considered, the higher cross flow velocity (0.1769 m/s) is the optimal
cross flow velocity. In general, ceramic membranes for application towards industrial scale
separation should provide higher combination of rejection efficiency and permeate flux.
Therefore, the optimal cross flow velocity of 0.1789 m/s is justified. At this condition, the
TiO2-Fly ash membrane provided about 98.82% of rejection with 42.8495×10⁻⁴ (m3/m2 s)
flux and M2 membrane provided 98.37% of rejection (permeate flux of 40.9045×10⁻⁴ (m3/m2
s)) at a pressure of 207 kPa and 200 mg/L feed concentration.

157
Further, as shown in Fig. 5.5, the application of a thin hydrophilic TiO2 coating did increase
membrane flux at the very beginning of the cross flow MF run. The fluxes of TiO2-Fly ash
composite membrane were higher than those of M2 membrane for all MF runs. Fig. 5.5
shows that during the MF process, a small variation in flux was observed for M2 membrane
thereby confirming that M2 underwent minimal fouling due to concentration polarization
effect under these conditions. This is also due to the fact that higher feed concentration
allows quicker formation of oil layer on the membrane surface that hinders water transport.
The fouling of fly ash membrane was typically due to the adherence of formed oil droplets to
the surface and membrane pores to deteriorate the membrane flux. However, for the TiO2-
Fly ash composite membrane, flux decline was slower than that observed for the M2
membrane (only 1% flux decline for TiO2-Fly ash composite membrane). A small reduction
in initial flux was due to rapid oil layer formation on the membrane surface. However,
significant increase in concentration polarization did not occur with time due to
hydrodynamic flow action and hence a constant flux was observed with time after the initial
small reduction in flux.
It is further interesting to note that the TiO2 thin layer coating altered the rejection
characteristics due to alterations in the interaction between oil droplets and membrane
surface. The hydrophilicity of the TiO2-Fly ash composite microfiltration membrane was
nominally improved, which was expected to repel the hydrophobic oil droplets from adhering
to membrane surface. Thus, the pore blocking tendencies of the membrane was avoided due
to high capillary repulsion force present in the hydrophilic membrane pores, which prevents
oil droplets to transport across the membrane (Zhu et al., 2016). After modification, the TiO2-
Fly ash composite membrane pores became smaller and enhanced the hydrophilic nature of
the M2 membrane. The repulsing force that generated during the process was high enough to

158
reject oil droplets, thus weakening membrane fouling, which directly minimized the influence
of surface adsorption and irreversible membrane fouling (Srijaroonrat et al., 1999; Zhou et
al., 2010).
Membrane fouling, which results from specific interactions between membrane pore surface
and oil droplets, caused a rapid (sometimes irreversible) flux decline of the whole membrane.
In order to reduce the effect of membrane fouling and to recover membrane flux, a periodic
cleaning process with detergent solution was employed in our study. During this step,
detergent solution flowed through the membrane pore structure, resulting in an effective
removal of oil droplets that adhered on membrane surface. Compared to M2 membrane,
higher flux restoration efficiency was observed for the TiO2-Fly ash composite membrane in
each run. It is realized that over 99.9% of the original flux (61.3545×10⁻⁴ m3/m2 s at 207 kPa
and 0.1769 m/s) was recovered by washing in the first cycle itself. This confirms that the
TiO2-Fly ash membrane has greater hydrophilic nature than the M2 membrane. The oil-in-
water emulsion might be barely adsorbed on the TiO2-Fly ash composite membrane surface,
and the bonding between hydrophilic TiO2 and hydrophobic oil layer could be weak and
facilitates rapid detachment. The oil droplets in the porous structure and those adhering to
the membrane surface could be readily washed with an appropriate cross-flow velocity and
washing with detergent solution. This is not the case for M2 membrane. For M2 membrane,
washing with detergent solution was not so effective for flux restoration and only 95-98%
flux recovery efficiency of the original flux (59.6213×10⁻⁴ m3/m2 s at 207 kPa and 0.1769
m/s) was observed. This indicated severity in membrane fouling. In this case, membrane
fouling was partially recoverable. This is likely due to unfavorable interaction between oil
droplets and M2 membrane surface with relatively poor hydrophilicity. Thereby, M2

159
membrane could have a progressive deterioration of membrane permeation performance with
repetitive usage for oil-in-water emulsion separation.
5.2.5.3 Performance indices
For each case, the performance indices of membrane were evaluated by multiplying the
average permeate flux with corresponding average rejection after 1 h MF operation. For a
variation in cross flow velocity from 0.0885-0.1769 m/s and applied pressure from 69-207
kPa at a feed concentration of 100 mg/L, the performance indices were evaluated to vary
from 973.7939×10⁻⁴-4620.751×10-4 (%. m3/m2 s) for M2 membrane and 1273.715×10-4-
4974.97×10-4 (%. m3/m2 s) for TiO2-fly ash membrane. The highest performance indices
have been observed for TiO2-fly ash membrane in all cross flow MF runs. This indicates that
surface hydrophilic nature enhanced with coating of TiO2 material on the surface. For the M2
membrane, the performance indices varied from 973.7939×10⁻⁴-3592.255×10-4 (%. m3/m2 s)
for a variation in applied pressure from 69 to 207 kPa, at 0.0885 m/s of cross flow velocity
and 100 mg/L of feed concentration. Thus it can be observed that applied pressure
significantly influence the performance index for M2 membrane.
The variation of membrane performance indices with cross flow velocity for fly ash
membrane (M2) and TiO2-fly ash membrane has been presented in Fig. 5.7. As shown in Fig
5.7, for TiO2-fly ash membrane, at an applied pressure of 207 kPa, the performance index
varied from 3977.025×10-4-4974.97×10-4, 3310.996×10-4-4576.418×10-4 and 3174.977×10-4-
4234.509×10-4 (%. m3/m2 s), with increasing cross flow velocities from 0.0885-0.1769 m/s,
at 100, 150 and 200 mg/L, respectively [3592.255×10-4-4620.751×10-4, 3135.382×10-4-
4299.212×10-4 and 2988.133×10-4-4023.602×10-4 (%. m3/m2 s) for fly ash membrane (M2)].

160
69 138 2070
1000
2000
3000
4000 100 mg/L
0.0885 m/s
69 138 2070
1000
2000
3000
Per
form
an
ce I
nd
ex10
4 (
%.
m3/m
2 s
)
100 mg/L
0.1327 m/s
69 138 2070
1000
2000
3000
4000
200 mg/L
0.0885 m/s
69 138 2070
1000
2000
3000
4000
200 mg/L
0.1327 m/s
0 69 138 2070
1000
2000
3000
4000
5000
Applied pressure (kPa)
200 mg/L
0.1769 m/s
0 69 138 2070
1000
2000
3000
4000
Applied pressure (kPa)
100 mg/L
0.1769 m/s
Figure 5.7: The performance indices for TiO2-Fly ash composite membrane (Filled
symbol) and M2 membrane (unfilled symbol) at different feed concentrations
(100-200 mg/L) with various cross flow velocities (0.0885-0.1768 m/s)
Thus, it can be inferred that substantial fouling occurred for fly ash membrane (M2) even for
cross flow microfiltration. This was not the case for TiO2-Fly ash membrane. Thus, TiO2
based modification of ceramic membrane is an important step to enhance membrane shelf
life. Also, an enhancement in cross flow velocity results in an improvement in the
performance index values for both membranes. This indicates that higher turbulence

161
promoted prohibition of membrane fouling (Sriharsha et al., 2014). However, the
enhancement in the performance index is significant for the TiO2-fly ash membrane case.
This is due to greater hydrophilic nature of the membrane in comparison with M2 membrane.
For both the membranes, the variation of performance indices with applied pressure for
maximum cross flow velocity case (0.1769 m/s) with 100 mg/L feed is depicted in Fig. 5.7.
As shown in Fig. 5.7, for an applied pressure variation from 69-207 kPa, the performance
indices varied from 2082.534×10-4-4620.751×10-4 (%. m3/m2 s) for M2 membrane and
2317.593×10-4-4974.97×10-4 (%. m3/m2 s) for TiO2-fly ash membrane. This indicates that
higher applied pressure minimizes membrane fouling. This is possibly due to the alteration of
pore blocking phenomena and dynamic cake filtration layer characteristics with variations in
applied pressure (Sriharsha et al., 2014). On the other hand, as shown in Fig. 5.7, at 0.1769
m/s, for a variation of applied pressure from 69-207 kPa, the performance indices varied from
1562.167×10-4-4023.602×10-4 (%. m3/m2 s) for M2 membrane and 1737.488×10-4-
4234.509×10-4 (%. m3/m2 s) for TiO2-Fly ash membrane, respectively using 200 mg/L feed
concentration. Once again, it can be confirmed that higher applied pressure and maximum
cross flow velocity and surface modification are most favorable choices to maximize the
shelf life of the developed membranes.
Amongst both the membranes, TiO2-fly ash membrane provided better performance in terms
of average permeate flux (9.1634×10⁻⁴-51.6372×10⁻⁴ m3/m2 s for TiO2-fly ash membrane and
7.0086×10⁻⁴-49.9712×10⁻⁴ m3/m2 s for M2 membrane) and performance indices
(912.0626×10⁻⁴-4974.97×10-4 (%. m3/m2 s) for TiO2-fly ash membrane and 696.9989×10⁻⁴-
4620.751×10-4 (%. m3/m2 s) for M2 membrane). The above mentioned minimum value (at 69
kPa, 0.0885 m/s, 200 mg/L condition) and maximum value (at 207 kPa, 0.1769 m/s, 100
mg/L condition) are obtained for entire MF study. Thus, it is apparent that the cross flow

162
microfiltration operation achieved the desired objective to reduce oil content in the permeate
samples and minimize the membrane fouling. Further, it is interesting to note that only when
TiO2-fly ash membrane was considered, the oil content in the permeate samples reduced to
negligible value. Thus the MF of oil-in-water emulsions with TiO2-fly ash membrane
provided high quality water which might be used for domestic usage as well with minimal
further treatment.
The obtained results in this work have been compared with the data reported in the literature.
A comparative summary of the data is presented in Table 5.1. In this regard, it can be
observed that Li et al., (2006) used surface modified Al2O3 membrane for the treatment of
(15.5 mg/L) oil-in-water emulsion to obtain 98.04% rejection, 4.1614×10⁻⁷ m3/m2 s kPa
normalized flux at 100 kPa and 7.8 m/s cross flow velocity. Similarly, Zhou et al., (2010)
achieved 98.7% of oil rejection with ZrO2-Al2O3 composite membrane for the separation of
1000 mg/L oil-in-water emulsion at 179 kPa and 5 m/s of cross flow velocity. In another
work, Zhu et al., (2016) applied TiO2-Mullite composite membrane for the treatment of 200
mg/L oil-in-water emulsion to obtain 4.1667×10⁻⁷ m3/m2 s kPa membrane normalized flux
and 97% rejection at 2.5 kPa and 0.15 m/s cross flow velocity. In the present work, TiO2-Fly
ash membrane provided maximum rejection (98.82%) and permeate flux (2.07×10⁻⁵ m3/m2 s
kPa) than that provided by the M2 membrane (98.37% rejection; 1.98×10⁻⁵ m3/m2 s kPa) at
0.1769 m/s, 207 kPa, 200 mg/L. Therefore, the results obtained in this work is comparably
better than the results reported in the literature

163
Table 5.1: Comparison between permeate flux and rejection of the TiO2-Fly ash composite membrane and M2 membrane in this work
and those reported in the literature.
Author Material
Pore
size
(μm)
Type of oil
Applied
pressure
(kPa)
Feed
Concentration
(mg/L)
Oil
droplet
size
(μm)
Cros
flow
velocity
(m/s)
Permeability
(m3/m2 s kPa)
Rejection
(%)
Li et al.,
(2006) Al2O3-PVDF -
Oil field
wastewater 100 15.5 - 7.8 4.1614×10⁻⁷ 98.04
Hua et al.,
(2007) α- Al2O3 0.05 Edible oil 100 500 - 1.68 1.775×10⁻⁷ 98.1
Zhou et al.,
(2010) ZrO2-Al2O3 0.2 Engine oil 16 1000 1.79 5 - 98.7
Chang et al.,
(2014) TiO2- Al2O3 6 Hydraulic oil 16 <4000 0.7-20 - 8.8889×10⁻⁷ >99.9
Zhu et al.,
(2016) TiO2-Mullite 0.11 Soybean oil 2.5 200 1.09 0.15 4.1667×10⁻⁷ 97TOC
This work TiO2-Fly ash 1.12 Crude oil 207 200 6.716 0.1769 2.07×10⁻⁵ 98.8227
This work M2 1.30 Crude oil 207 200 6.716 0.1769 1.98×10⁻⁵ 98.3658

164
5.2.6 ANOVA analysis
Tables 5.2 and 5.3 demonstrate the obtained response values (permeate flux and rejection)
from the three level-three factor CCD design for TiO2-Fly ash membrane and M2 membrane,
respectively. The statistically significance of the model fit revealed that the obtained response
values fit well with the quadratic model. Table 5.4 summarizes the ANOVA results obtained
for second-order polynomial model of permeate flux. The ANOVA results are highly
satisfactory and promising given the fact that F value is high (128.79) to indicate model
significance and p value is low i.e., (p–value > F) = <0.0001. This confirms that there is only
0.01% chance for model F value to have larger noise. Further, the applied pressure (X1),
concentration (X2) and cross flow velocity (X3) are the most significant terms on permeate
flux as they have p-value < 0.05. The value for lack of fit of F is 3.63 and this confirms as
well upon model significance. The model acceptability is further confirmed with the
evaluated regression coefficient (R2 = 0.99), which is in agreement with the adjusted
regression coefficient (adj R2 = 0.98) and predicted regression coefficient (pred R2 = 0.94).
The ANOVA results for rejection are summarized in Table 5.5. In case of rejection, the
quadratic model is observed as significant model with F-value of 8.86; p-value <0.001; lack
of fit F value as 0.41; model R2 of 0.8886; predicted R2 value of 0.6270 (poor but
reasonable); “adj R-squared” value of 0.7883. The model has once again confirmed that all
terms, namely applied pressure (X1), feed concentration (X2) and cross flow velocity (X3) are
significant terms.
For the TiO2-fly ash composite membrane, the regression model from ANOVA analysis in
terms of coded factors for membrane flux and rejection are presented as follows:

165
3 2
2 31 2 3 1 2 1 3
2 2 21 2 3
-Flux m /m s = 26.85 + 12.38 X 3.30 X + 4.95 X - 0.99 X X + 0.25 X X -0.27 X X
+ 0.37 X + 0.78 X + 0.29 X
(5.1)
2 31 2 3 1 2 1 3
2 2 21 2 3
+Rejection % = +97.60 - 0.56 X 1.06 X -0.36 X + 0.26 X X + 0.14 X X + 0.11 X X
+ 0.12 X + 0.21 X + 0.13 X
(5.2)
Similar expressions exist for M2 membrane and are presented as follows:
3 2
2 31 2 3 1 2 1 3
2 2 21 2 3
-Flux m /m s = 24.18 + 12.10 X 4.46 X + 5.30 X - 0.95 X X + 0.24 X X -0.58 X X
+ 0.72 X + 0.14 X + 1.60 X
(5.3)
2 31 2 3 1 2 1 3
2 2 21 2 3
+Rejection % = 97.07 -0.80 X 2.11 X - 0.64 X +0.53 X X + 0.079 X X +0.079 X X
+ 0.12 X - 0.31 X + 0.065 X
(5.4)
where, X1, X2 and X3 are the coded factors of applied pressure, feed concentration and cross
flow velocity, respectively.
The ANOVA results for M2 membrane flux and rejection are presented in Tables 5.6 and 5.7.
Their analysis is similar to that presented earlier and is therefore not elaborated further.

166
Table 5.2: RSM design and its actual and predicted values for TiO2-Fly ash membrane
Run
order
Pressure
(kPa)
Concent
ration
(mg/L)
Cross Flow
Velocity
(m/s)
Permeate flux J×104
(m3/m2s) Rejection (%)
X1 X2 X3 Actual Predicted Actual Predicted
1 69 100 0.0885 12.93 13.26 98.53 98.43
2 207 100 0.0885 41.22 39.50 96.48 96.5
3 69 200 0.0885 9.16 9.17 99.53 99.8
4 207 200 0.0885 32.02 31.47 99.15 98.91
5 69 100 0.1769 23.84 23.21 97.2 97.21
6 207 100 0.1769 51.64 50.44 96.34 95.85
7 69 200 0.1769 17.50 18.04 99.27 99.02
8 207 200 0.1769 42.85 41.33 98.82 98.7
9 21.96 150 0.1327 7.81 7.08 98.94 98.87
10 254.04 150 0.1327 46.33 48.73 96.59 96.98
11 138 65.91 0.1327 33.28 34.62 96.17 96.4
12 138 234.09 0.1327 23.18 23.52 99.86 99.96
13 138 150 0.0584 18.77 19.35 98.65 98.58
14 138 150 0.207 34.92 36.02 96.98 97.37
15 138 150 0.1327 27.33 26.85 97.71 97.6
16 138 150 0.1327 26.09 26.85 97.69 97.6
17 138 150 0.1327 25.47 26.85 97.07 97.6
18 138 150 0.1327 27.26 26.85 96.81 97.6
19 138 150 0.1327 28.25 26.85 97.71 97.6
20 138 150 0.1327 26.99 26.85 98.65 97.6

167
Table 5.3: RSM design and its actual and predicted values for M2 membrane
Run
order
Pressure
(kPa)
Concentration
(mg/L)
Cross Flow
Velocity
(m/s)
Permeate flux
J×104 (m3/m2s) Rejection (%)
X1 X2 X3 Actual Predicted Actual Predicted
1 69 100 0.0885 9.95 11.4 97.91 97.44
2 207 100 0.0885 37.94 37.03 94.69 94.62
3 69 200 0.0885 7.01 5.54 99.45 99.48
4 207 200 0.0885 30.24 27.35 98.82 98.77
5 69 100 0.1769 21.94 22.67 94.9 94.89
6 207 100 0.1769 49.97 49.28 92.47 92.38
7 69 200 0.1769 15.75 14.5 99.16 99.16
8 207 200 0.1769 40.9 37.28 98.37 98.77
9 21.96 150 0.1327 6.58 5.85 98.52 98.76
10 254.04 150 0.1327 42.78 46.56 96.2 96.05
11 138 65.91 0.1327 33.47 32.08 92.29 92.64
12 138 234.09 0.1327 12.61 17.06 99.99 99.73
13 138 150 0.0584 15.73 16.95 98.03 98.32
14 138 150 0.207 32.95 34.78 96.39 96.18
15 138 150 0.1327 24.17 24.18 97.03 97.07
16 138 150 0.1327 25.17 24.18 96.22 97.07
17 138 150 0.1327 23.17 24.18 98.18 97.07
18 138 150 0.1327 24.17 24.18 97.03 97.07
19 138 150 0.1327 24.77 24.18 96.94 97.07
20 138 150 0.1327 24.17 24.18 97.03 97.07

168
Table 5.4: ANOVA for the permeate flux response surface quadratic model of TiO2-Fly
ash membrane
Sum of
Mean F p-value
Source Squares df Square Value Prob > F
Model 2596.89 9 288.54 128.79 < 0.0001
X1-Pressure
(kPa) 2093.46 1 2093.46 934.41 < 0.0001
X2-Conc.
(mg/L) 148.69 1 148.69 66.37 < 0.0001
X3-CFV (m/s) 335.25 1 335.25 149.64 < 0.0001
X1X2 7.77 1 7.77 3.47 0.0922
X1X3 0.49 1 0.49 0.22 0.6491
X2X3 0.59 1 0.59 0.26 0.62
X12 2 1 2 0.89 0.3667
X22 8.85 1 8.85 3.95 0.075
X32 1.24 1 1.24 0.56 0.4733
Residual 22.4 10 2.24
Lack of Fit 17.57 5 3.51 3.63 0.0916
Pure Error 4.84 5 0.97
Cor Total 2619.3 19
Std. Dev. 1.5
R2 0.9914
Mean 27.84
Adj R2 0.9837
C.V. % 5.38
Pred R2 0.9459
PRESS 141.82
Adeq Precision 40.965
C.V. % =Coefficient of variation; PRESS=Predicted Residual Sum of
Squares; Cor Total=Corrected total sum of squared deviations from the
grand mean; df=Degree of freedom.

169
Table 5.5: ANOVA for the rejection response surface quadratic model of TiO2-Fly ash
membrane
Source Sum of df Mean F p-value
Squares
Square Value Prob > F
Model 23.0141 9 2.55712 8.862263 0.0010
X1-Pressure
(kPa) 4.33982 1 4.33982 15.04061 0.0031
X2-Conc.
(mg/L) 15.2291 1 15.2291 52.77981 < 0.0001
X3-CFV (m/s) 1.74106 1 1.74106 6.034037 0.0339
X1X2 0.54122 1 0.54122 1.875705 0.2008
X1X3 0.16273 1 0.16273 0.56397 0.4700
X2X3 0.09676 1 0.09676 0.335342 0.5753
X12 0.19148 1 0.19148 0.663617 0.4343
X22 0.61177 1 0.61177 2.120232 0.1760
X32 0.2576 1 0.2576 0.892758 0.3670
Residual 2.8854 10 0.28854
Lack of Fit 0.84563 5 0.16913 0.41457 0.8220
Pure Error 2.03977 5 0.40795
Cor Total 25.8995 19
Std. Dev. 0.54
R2 0.8886
Mean 97.91
Adj R2 0.7883
C.V. % 0.55
Pred R2 0.627
PRESS 9.66
Adeq Precision 10.815
C.V. % =Coefficient of variation; PRESS=Predicted Residual Sum of
Squares; Cor Total=Corrected total sum of squared deviations from the
grand mean, df=Degree of freedom.

170
Table 5.6: ANOVA for the permeate flux response surface quadratic model of
M2 membrane
Sum of
Mean F p-value
Source Squares df Square Value Prob > F
Model 2678.42 9 297.6 40.8 < 0.0001
X1-Pressure
(kPa) 2000.49 1 2000.49 274.28 < 0.0001
X2-Conc.
(mg/L) 272.16 1 272.16 37.32 0.0001
X3-CFV (m/s) 383.89 1 383.89 52.63 < 0.0001
X1X2 7.29 1 7.29 1 0.3409
X1X3 0.48 1 0.48 0.065 0.8033
X2X3 2.67 1 2.67 0.37 0.5587
X12 7.41 1 7.41 1.02 0.3374
X22 0.27 1 0.27 0.037 0.8504
X32 5.13 1 5.13 0.7 0.4213
Residual 72.94 10 7.29
Lack of Fit 70.64 5 14.13 30.7 0.0009
Pure Error 2.3 5 0.46
Cor Total 2751.36 19
Std. Dev. 2.7
R2 0.9735
Mean 25.17
Adj R2 0.9496
C.V. % 10.73
Pred R2 0.8039
PRESS 539.44
Adeq Precision 22.904
C.V. % =Coefficient of variation; PRESS=Predicted Residual Sum of
Squares; Cor Total=Corrected total sum of squared deviations from the
grand mean, df= Degree of freedom.

171
Table 5.7: ANOVA for the rejection response surface quadratic model of M2 membrane
Source
Sum of
Squares df
Mean
Square
F
Value
p-value
Prob > F
Model 81.7 9 9.08 32.83 < 0.0001
X1-Pressure (kPa) 8.84 1 8.84 31.96 0.0002
X2-Conc. (mg/L) 60.65 1 60.65 219.32 < 0.0001
X3-CFV (m/s) 5.57 1 5.57 20.15 0.0012
X1X2 2.24 1 2.24 8.09 0.0174
X1X3 0.05 1 0.05 0.18 0.6805
X2X3 2.52 1 2.52 9.11 0.0129
X12 0.21 1 0.21 0.74 0.4085
X22 1.41 1 1.41 5.08 0.0478
X32 0.061 1 0.061 0.22 0.6481
Residual 2.77 10 0.28
Lack of Fit 0.8 5 0.16 0.41 0.825
Pure Error 1.96 5 0.39
Cor Total 84.47 19
Std. Dev. 0.53
R2 0.9673
Mean 96.98
Adj R2 0.9378
C.V. % 0.54
Pred R2 0.8922
PRESS 9.11
Adeq Precision 19.767
C.V. % =Coefficient of variation; PRESS=Predicted Residual Sum of
Squares; Cor Total=Corrected total sum of squared deviations from the grand
mean, df=Degree of freedom.

172
The 3D response surface interaction effect of independent variables on the response variables
is presented in Fig. 5.8. The 3D surface and contour plots of RSM have been prepared by
varying two factors at a time and maintaining the other factor constant (at zero level). These
plots thereby allow a deeper insight into the interaction effect of two variables on the
response variables. Fig. 5.8a shows that the permeate flux increases from the low level region
to high level region. This confirms that there is significant interaction between the applied
pressures (69-207 kPa) with feed concentration (100-200 mg/L). Fig. 5.8(a) depicts that the
effect of applied pressure and feed concentration on permeate flux. It can be observed that
applied pressure has a positive effect on permeate flux in terms of driving force enhancement.
On the other hand, the feed concentration has a negative effect for permeate flux. This is
probably due to the formation of cake layer containing oil droplets that offers higher
resistance to the fluid transport. At higher feed concentration, the cake layer formation is
expected to happen at a higher rate and this enhances pore blocking and fouling at higher
rates (Salahi et al., 2013; Wang et al., 2000). Thus, the effect of applied pressure at lower oil
concentration is significant. Similar observations were also reported by Salahi et al. (2013) in
cross flow microfiltration of oily wastewater using nano-porous membrane. For example, at
feed concentration of 100 mg//L, for an enhancement of applied pressure from 69 kPa to 207
kPa, the permeate flux increased significantly. However, for the higher feed concentration at
200 mg/L, similar applied pressure variations allowed lower permeate flux. Therefore, it can
be concluded that at high feed concentration and lower pressure levels, more oil droplets get
formed on the surface and at higher pressure levels, these droplets are pushed and pressed
into the membrane surface to eventually decrease the droplet size. This may get deformed
subsequently in the constricted portions of the membrane to enforce pore blocking. Jokic et
al., (2010) reported higher flux values with an increase in the trans-membrane pressure in
cross flow microfiltration of yeast suspensions.

173
Design-Expert® Software
Flux (m³/m²s)
51.6372
7.80536
X1 = A: Pressure (kPa)
X2 = B: Conc. (mg/L)
Actual Factor
C: CFV (m/s) = 0.1327
69.00
103.50
138.00
172.50
207.00
100.00
125.00
150.00
175.00
200.00
7
17
27
37
47 F
lux J
x10^4
(m
³/m
²s)
Pressure (kPa) Conc. (mg/L)
Design-Expert® Software
Rejection (%)
99.8641
96.174
X1 = A: Pressure (kPa)
X2 = B: Conc. (mg/L)
Actual Factor
C: CFV (m/s) = 0.1327
69.00
103.50
138.00
172.50
207.00
100.00
125.00
150.00
175.00
200.00
96
97
98
99
100
R
eje
ction (
%)
Pressure (kPa) Conc. (mg/L)
Design-Expert® Software
Flux (m³/m²s)
51.6372
7.80536
X1 = A: Pressure (kPa)
X2 = C: CFV (m/s)
Actual Factor
B: Conc. (mg/L) = 150.00
69.00
103.50
138.00
172.50
207.00
0.0885
0.1106
0.1327
0.1548
0.1769
7
17
27
37
47
F
lux J
x10^4
(m
³/m
²s)
Pressure (kPa) C: CFV (m/s)
Design-Expert® Software
Rejection (%)
99.8641
96.174
X1 = A: Pressure (kPa)
X2 = C: CFV (m/s)
Actual Factor
B: Conc. (mg/L) = 150.00
69.00
103.50
138.00
172.50
207.00
0.0885
0.1106
0.1327
0.1548
0.1769
96
97
98
99
100
R
eje
ction (
%)
Pressure (kPa)
C: CFV (m/s)
Design-Expert® Software
Flux (m³/m²s)
51.6372
7.80536
X1 = B: Conc. (mg/L)
X2 = C: CFV (m/s)
Actual Factor
A: Pressure (kPa) = 138.00
100.00
125.00
150.00
175.00
200.00
0.0885
0.1106
0.1327
0.1548
0.1769
7
17
27
37
47
F
lux J
x10^4
(m
³/m
²s)
Conc. (mg/L) C: CFV (m/s)
Design-Expert® Software
Rejection (%)
99.8641
96.174
X1 = B: Conc. (mg/L)
X2 = C: CFV (m/s)
Actual Factor
A: Pressure (kPa) = 138.00
100.00
125.00
150.00
175.00
200.00
0.0885
0.1106
0.1327
0.1548
0.1769
96
97
98
99
100
R
eje
ction (
%)
Conc. (mg/L) C: CFV (m/s)
Figure 5.8: Permeate flux and rejection surface plots as a function of (a,b) pressure and
concentration, (c,d) pressure and cross flow velocity, and (e,f) concentration and cross
flow velocity for the TiO2-Fly ash composite membrane
(a) (b)
(c) (d)
(e)
(f)

174
Design-Expert® Software
Flux (m³/m²s)
49.9712
6.57576
X1 = A: Pressure (kPa)
X2 = B: Conc. (mg/L)
Actual Factor
C: CFV (m/s) = 0.1327
69.00
103.50
138.00
172.50
207.00
100.00
125.00
150.00
175.00
200.00
0
10
20
30
40
50
F
lux J
x10^4
(m
³/m
² s)
Pressure (kPa)
Conc. (mg/L)
Design-Expert® Software
Rejection (%)
99.99
92.2873
X1 = A: Pressure (kPa)
X2 = B: Conc. (mg/L)
Actual Factor
C: CFV (m/s) = 0.1327
69.00
103.50
138.00
172.50
207.00
100.00
125.00
150.00
175.00
200.00
90
92.5
95
97.5
100
R
eje
ction (
%)
Pressure (kPa)
Conc. (mg/L)
Design-Expert® Software
Flux (m³/m²s)
49.9712
6.57576
X1 = A: Pressure (kPa)
X2 = C: CFV (m/s)
Actual Factor
B: Conc. (mg/L) = 150.00
69.00
103.50
138.00
172.50
207.00
0.0885
0.1106
0.1327
0.1548
0.1769
0
10
20
30
40
50
F
lux J
x10^4
(m
³/m
² s)
Pressure (kPa)
C: CFV (m/s)
Design-Expert® Software
Rejection (%)
99.99
92.2873
X1 = A: Pressure (kPa)
X2 = C: CFV (m/s)
Actual Factor
B: Conc. (mg/L) = 150.00
69.00
103.50
138.00
172.50
207.00
0.0885
0.1106
0.1327
0.1548
0.1769
90
92.5
95
97.5
100
R
eje
ction (
%)
Pressure (kPa)
C: CFV (m/s)
Design-Expert® Software
Flux (m³/m²s)
49.9712
6.57576
X1 = B: Conc. (mg/L)
X2 = C: CFV (m/s)
Actual Factor
A: Pressure (kPa) = 138.00
100.00
125.00
150.00
175.00
200.00
0.0885
0.1106
0.1327
0.1548
0.1769
0
10
20
30
40
50
F
lux J
x10^4
(m
³/m
² s)
Conc. (mg/L)
C: CFV (m/s)
Design-Expert® Software
Rejection (%)
99.99
92.2873
X1 = B: Conc. (mg/L)
X2 = C: CFV (m/s)
Actual Factor
A: Pressure (kPa) = 138.00
100.00
125.00
150.00
175.00
200.00
0.0885
0.1106
0.1327
0.1548
0.1769
90
92.5
95
97.5
100
R
eje
ction (
%)
Conc. (mg/L)
C: CFV (m/s)
Figure 5.9: Permeate flux and rejection surface plots as a function of (a,b) pressure and
concentration, (c,d) pressure and cross flow velocity, and (e,f) concentration and cross
flow velocity for the M2 membrane
(a)
(b)
(c)
(d)
(e) (f)

175
From Fig. 5.8e, it is apparent that the interaction between feed concentration and cross flow
velocity is the best significant interaction. The plot indicates that with an increase in feed
concentration and cross flow velocity, the membrane flux is reduced. Further, the effect of
cross flow velocity is significant at lower feed concentration level. This is due to lower
concentration polarization at lower feed concentration and higher cross flow velocity. Thus,
both cross flow velocity and applied pressure are most important parameters for enhancement
in permeate flux. As shown in Fig. 5.8c the membrane flux increases with increasing
pressure. In addition, higher permeate flux is observed at higher cross flow velocity level.
This indicates that higher cross flow velocity enhances shear stress on the membrane surface
(Mueller et al., 1997). Conversely, it is alleged that oil droplets are broken into smaller
droplets under higher pressure and higher cross flow velocity condition.
Fig. 5.8 illustrates upon the rejection dependence on the interaction between feed
concentration and applied pressure (5.8b), cross flow velocity and applied pressure (5.8d) and
cross flow velocity and feed concentration (5.8f). As evidenced in Fig. 5.8(b), the percentage
of oil rejection increases when the feed concentration changes from low level to high level at
a fixed zero level of applied pressure. Similarly, at a fixed zero level of cross flow velocity,
the rejection improves with increasing feed concentration (from low level to high level) (see
5.8(f)). However, the variation in the levels of these variables (for instance cross flow
velocity (high level) and applied pressure (high level) at a fixed zero level of feed
concentration) consequences in reduction of the oil rejection percentage. This may be due to
two reasons. The first reason is that there is a reduction in formation of cake layer on
membrane surface at a higher level. Secondly, oil droplets of smaller size are prevalent at
lower level of feed concentration. From Fig. 5.9, it can be concluded that the M2 membrane
also exhibits similar behaviour to those presented for the TiO2-Fly ash composite membrane.

176
Moreover, Fig. 5.10 demonstrates the relationship between the predicted and experimental
flux values, which gave satisfactory correlation (R2 = 0.99). It can be seen that the location of
the points around the diagonal line affirm that the deviation is not significant (Fig. 5.10). The
predicted values of the response of these conditions using eqns 5.1 and 5.2 are given together
with the experimental data (Table 5.2). For M2 membrane, the experimental data and the
corresponding predicted values of permeate flux and rejection are determined from eqn 5.3
and eqn 5.4 (see Table 5.3).
0 10 20 30 40 50 60
0
10
20
30
40
50
60
RS
M m
od
el
pred
icte
d f
lux J10
4
m3/m
2 s
)
Experimental flux J104 (m
3/m
2 s)
TiO2-Fly ash
96.0 96.5 97.0 97.5 98.0 98.5 99.0 99.5 100.0
96.0
96.5
97.0
97.5
98.0
98.5
99.0
99.5
100.0
RS
M m
od
el
pred
icte
d r
eje
cti
on
(%
)
Experimental rejection (%)
TiO2-Fly ash
0 10 20 30 40 50 60
0
10
20
30
40
50
60
RS
M m
od
el
pred
icte
d f
lux J10
4
m3/m
2 s
)
Experimental flux J104 (m
3/m
2 s)
M2
96.0 96.5 97.0 97.5 98.0 98.5 99.0 99.5 100.0
96.0
96.5
97.0
97.5
98.0
98.5
99.0
99.5
100.0
RS
M m
od
el
pred
icte
d r
eje
cti
on
(%
)
Experimental rejection (%)
M2
Figure 5.10: RSM model predicted values vs experimental values

177
5.2.6.1 Validation of predicted response at the optimum condition
The optimum condition for the TiO2-Fly ash membrane to obtain the maximum permeate flux
and rejection are applied pressure = 207 kPa, feed concentration= 200 mg/L and cross flow
velocity = 0.1769 m/s. At this condition, the predicted responses were found to be
41.3301×10⁻⁴ (m3/m2 s) for membrane flux and 98.7% rejection. Additional experiments
were performed at the model predicted optimum conditions to examine the suitability of the
model equation. The permeate flux and rejection values obtained through the experimental
result were 42.8495×10⁻⁴ (m3/m2 s) and 98.82%, respectively, and these values are in good
agreement with the model predicted values for TiO2-Fly ash membrane. The same optimum
conditions are obtained for the M2 membrane through ANOVA study at which the
maximized predicted permeate flux (37.284×10⁻⁴ m3/m2 s) and rejection (98.77%) were
observed. From experimental investigations, these correspond to 40.9045×10⁻⁴ m3/m2 s,
98.37%, respectively. Hence, the developed model is expected to be effective for
implemented in process simulation, and modelling studies involving the integration of
membrane processes with other processes.
5.3 Summary
In this work, a low-cost TiO2-Fly ash composite membrane was fabricated and then utilized
to efficiently remove oil from oil-in-water emulsions. Fly ash, a bulk waste material with
limited uses, was used as main starting materials to fabricate fly ash ceramic membrane (M2),
on which a more hydrophilic TiO2 layer deposited via hydrothermal method using TiCl4 as
titania source. The TiO2-Fly ash composite membrane is more hydrophilic, which is evident
from the lower contact angle value (14.4°) than (M2) fly ash membrane (25.8°). The
enhanced hydrophilic composite membrane has prevented oil droplets to adhere with the
membrane surface and hence less membrane fouling. Amongst both the membranes, TiO2-fly

178
ash membrane provided better performance in terms of average permeate flux 51.6372×10⁻⁴
m3/m2 s (49.9712×10⁻⁴ m3/m2 s for M2 membrane) and performance indices 4974.97×10-4
(%. m3/m2 s) (4620.751×10-4 (%. m3/m2 s) for M2 membrane). From RSM study, the
optimum conditions to obtain the maximum permeate flux and rejection for the TiO2-Fly ash
membrane are applied pressure (207 kPa), feed concentration (200 mg/L) and cross flow
velocity (0.1769 m/s) at which condition, the predicted responses are evaluated to be
41.3301×10⁻⁴ (m3/m2 s) (permeate flux) and 98.7% (rejection). At the same optimum
experimental conditions, the experimental results are 42.8495×10⁻⁴ (m3/m2 s), 98.82%,
respectively. In summary, a low-cost and good performance TiO2-Fly ash composite
membrane has been prepared, which can be highly competitive for the treatment of oil-in-
water emulsions. This study is expected to outline upon an effective route to reuse waste coal
fly ash and mitigate environmental hazards associated to its disposal. The outlined
methodology in this work is to produce a value added product such as fly ash based
membrane for wastewater treatment applications. Thereby, this work is expected to envisage
upon newer options to recycle industrial solid waste coal fly ash by targeting value added
products for separation process industries.

179
CHAPTER-6
Preparation, Characterization and Application of TiO2-Clay, γ-Al2O3-Clay Composite and Clay Membranes

180

181
CHAPTER 6 Preparation, characterization and application of TiO2-clay, γ-
Al2O3-clay composite and clay membranes
Along with the comparative assessment with ceramic membranes, this chapter summarizes
the separation efficiency results obtained during dead end microfiltration performance of
TiO2-clay, γ-Al2O3-clay and clay membranes using synthetic oil-in-water emulsions. Section
6.1 presents an overview of the chapter. Eventually, the characterization results and the
comparative microfiltration performance of composite membranes and clay membranes are
presented for various feed concentration in section 6.2. Based on the research findings, the
summary of the chapter is presented in section 6.3.
6.1 Overview
This chapter explains the surface modification of clay membrane by TiO2 and γ-Al2O3
coating. It is the very first step towards the development of TiO2-clay and γ-Al2O3-clay
composite membrane. The materials used for sol preparation and the corresponding coating
conditions are discussed in the chapter 2. In the experiment, clay membrane is used as the
base support, which is fabricated using low cost clay by uni-axial pressing method.
6.2 Results and discussion
6.2.1 Particle size distribution (PSD)
Fig. 6.1 demonstrates the particle size distribution of synthesized sols (TiO2 and γ-Al2O3).
Generally, smaller sized particles deposite uniformly on the support in more quantity and
block the pores of the support and even some particles may penetrate through larger pores

182
(Steenkiste et al., 2002). Sols with larger size particles may not form uniformly on the
support and mostly create patches on the surface of the support (Saleh and Guigon, 2007). It
can be noticed from Fig. 6.1 that the particle sizes of the TiO2 and γ-Al2O3 sol are in the
range of 0.3382-0.4777 µm, and 7.192-16.912 µm, respectively, while the volume median
diameter is found to be 0.016225 and 0.001698 µm for TiO2 and γ-Al2O3, respectively. The
preparation of composite ceramic membrane would be satisfied using the particle sizes of
aforesaid range.
0 500 1000 1500 2000
0
5
10
15
20
25
30
35 5000 10000 15000 20000 25000 30000 35000 40000
0
1
2
3
4
5
Vo
lum
e (%
)
Particle size (nm)
TiO2 sol
Vo
lum
e (%
)
-Al2O
3 sol
Figure 6.1: Particle size distribution of synthesized sols (TiO2 and γ-Al2O3)
6.2.2 N2 adsorption-desorption isotherm
Nitrogen adsorption-desorption isotherm and BJH pore size distributions of γ-Al2O3 and TiO2
powder are shown in Fig. 6.2. According to the IUPAC classification, isotherm of
mesoporous TiO2 and γ-Al2O3 powder matches with a type IV group (with an H2 hysteresis

183
loop). It also displays that particles of TiO2 and γ-Al2O3 possess complex and interconnected
pores of different size and shape (Wang et al., 2007). The pore size distributions of TiO2 and
γ-Al2O3 are measured based on the desorption isotherm data by using the technique of BJH as
depicted in Fig. 6.2. From these plots, it is evident that the TiO2 and γ-Al2O3 particles contain
only mesopores. These also show a unimodel distribution with pore radius of 1.54-73.85 nm
for γ-Al2O3 and 0.15-7.36 nm for TiO2. Moreover, 90 % of pores are having the size less than
10 nm for γ-Al2O3 (1.5 nm for TiO2). BET surface area (SA) along with pore volume (PV) of
TiO2 is evaluated as 105.7 m2/g (200.3 m2/g for γ-Al2O3) and 0.4037 ml/g (0.4495 ml/g for γ-
Al2O3), respectively.
0.0 0.1 0.2 0.3 0.4 0.5 0.6 0.7 0.8 0.9 1.0
0
50
100
150
200
250
300
Vo
lum
e a
dso
rb
ed
(cc/g
) a
t S
TP
Relative Pressure (P/P0)
-Al2O
3
0 100 200 300 400 500 600 700 800
0.0
0.1
0.2
0.3
0.4
0.5
V
dV(r)
Pore radius (A)
Cu
mu
lati
ve p
ore v
olu
me V
(cc/g
)
0.000
0.004
0.008
0.012
0.016
0.020
dV
(r)
-Al2O
3
0.0 0.2 0.4 0.6 0.8 1.0
0
50
100
150
200
250
300
Vo
lum
e a
dso
rb
ed
(cc/g
) a
t S
TP
Relative Pressure (P/P0)
TiO2
0 10 20 30 40 50 60 70 80
0.0
0.1
0.2
0.3
0.4
0.5
V
dV(r)
Pore radius r (A)
Cu
mu
lati
ve p
ore v
olu
me V
(cc/g
)
0.00
0.02
0.04
0.06
0.08d
V(r
)
TiO2
Figure 6.2: N2 adsorption and desorption isotherms and BJH pore size distributions of
TiO2 and γ-Al2O3 powders

184
6.2.3 Thermo gravimetric analysis (TGA)
Fig. 6.3 illustrates the differential thermogravimetric (DTG) and thermogravimetric (TG)
plots for the TiO2 and γ-Al2O3 powder samples. TiO2 powder (before calcination) seems to
undergo two different stages of weight loss during heating. The weight loss at <195 °C is due
to the deliverance of physically adsorbed water present inside pores of the powder. The
second step of weight loss at temperature range of 195-350 °C is attributed to the structural
change of the powder from Ti(OH)4 to TiO2. After 350 °C the weight loss is negligible and
hence, the calcination temperature for the fabrication of the membrane is fixed as 400 °C. In
the DTG plot, an endothermic peak noticed around the temperature of 290 °C represents the
loss of crystallization of the TiO2 powder by changing its structure from titanium hydroxide
to TiO2. γ-Al2O3 (before calcination) sample undergoes step by step of weight loss in three
stages during the heating process. The first stage of weight loss at less than 70 °C is due to
the liberation adsorbed water existing inside the powder and the second step of weight loss
noticed between 70 °C and 250 °C corresponds to the evaporation of crystal water present in
the powder, which is also clearly evidenced in the DTG curve around 125.5 °C. The third
stage of weight loss observed from 250 °C to 550 °C is due to the dehydroxylation of the
sample to γ-Al2O3 structural change. In the DTG graph, a peak (an endothermic) at 334 °C
corresponds to the decomposition of the sample to γ-Al2O3 powder (Jones and Barron, 2007).
The weight loss at >550 °C is negligible and therefore, the optimized calcination temperature
is selected as 600 °C for the preparation of γ-Al2O3 membrane.

185
0 100 200 300 400 500 600 700 800 900 1000110012001300
0
10
20
30
40
50
60
70
80
90
100
(A, a) TiO2 powder
(B, b) Al2O
3
Temperature (C)
Weig
ht
loss
(%
)
290.57
-0.8
-0.4
0.0
0.4
DT
G (
a.u
.)
a
b
AB
125.5
334.67
Figure 6.3: TGA and DTG curves of as synthesized (before calcination) TiO2 (A, a), and
γ-Al2O3 (B, b) powder
6.2.4 FTIR
FTIR spectra of Al2O3 and TiO2 powders (before and after calcination) are shown in Fig. 6.4.
For as-synthesized Al2O3 powder (before calcination), bands at 744, 628 and 1070 cm-1 are
allotted to boehmite, and similar kind of characteristic results are reported in the literature
(Majhi et al., 2009). Bending modes of Al-O-H is observed at 1070 cm-1 for symmetric and
1160 cm-1 for asymmetric (Frost et al., 1999). The OH torsional mode is not identified at 750
cm-1 due to overlap of stretching vibrations of Al-O with OH. The intense band at 1402 cm-1

186
and 1722 cm-1 represents bending of physically presented water and the stretching mode of
adsorbed water molecule can be seen at 3118 cm-1 (Colomban, 1988).
4000 3500 3000 2500 2000 1500 1000 500
30
60
90
120
150
60
80
100
120
140
Tra
nsm
itta
nce (
%)
Wavenumber (cm-1)
TiO2
Before Calcination
2010
17521630
14023118
460
Tra
nsm
itta
nce (
%)
Al2O
3
1070
1160
744
907
628
14023118
17222010
4000 3500 3000 2500 2000 1500 1000 500
50
100
150
60
80
100
120
140
Tra
nsm
itta
nce (
%)
Wavenumber (cm-1)
TiO2
3436
1630
458
Tra
nsm
itta
nce (
%)
Al2O
3
After Calcination
36181525
1644
867 592
Figure 6.4: FTIR analysis of TiO2 powder and γ-Al2O3 powder
The weak band observed at 2010 cm-1 corresponds to a combination band in boehmite,
which is not observed in the calcined sample (see Fig.6.4, after calcination). In general,
alumina can exhibit various kinds of coordination with an oxygen molecule from its oxides.
In the as-synthesized γ-Al2O3 (before calcination), the bands of stretching modes for AlO6 are
observed at 744 and 628 cm-1 (McMillan and Piriou, 1982). After calcination of γ-Al2O3
sample at 600 °C, the bands at 1070 and 2010 cm-1 are disappeared, which confirms the
formation of γ-Al2O3 (see Fig.4). For γ-Al2O3 (after calcination), the narrow bands identified

187
at 1644, 1525, and 3618 cm-1 are because of the adsorbed water present in the sample. The
peaks observed at 592 and 867 cm-1 correspond to AlO6 and AlO4, respectively. The above
result corroborates that γ-Al2O3 (Al2O3 after calcination sample) presents two kinds of Al-O
structures i.e tetrahedral and octahedral, while γ-Al2O3 powder before calcination is purely
octahedral in nature (Cross, 1964). In the case of TiO2 samples, the band appeared around
460 cm-1 corresponds to the Ti-O stretching (Li et al., 2010). IR bands observed for sample
TiO2 (before calcination) at 1402, 1630, 1752 cm-1 are ascribed to stretching mode and the
bands appeared at 3118, and 3436 cm-1 represent bending modes of a physically adsorbed
water molecule. The weak band observed at 2010 cm-1 for TiO2 sample (before calcination) is
attributed to Ti-OH bond of the Ti(OH)4 functional group, which disappears after calcination
at 400 °C.
6.2.5 XRD analysis
The XRD analysis was carried out to recognize whether any phase transformation
occured during the course of sintering. The XRD patterns of powders (TiO2, and γ -Al2O3)
and the membrane support (before and after sintering) are presented in Fig. 6.5. During
sintering, phase transformations usually occur due to a series of reactions, and also caused by
the formation of new phases. Prior to sintering, there are few major phases seen in the
support, which are pyrophyllite, kaolin, calcium carbonate, feldspar, and quartz. Several
phase changes take place within the support at the time of sintering. However, the important
phase conversion is the change of kaolinite to mullite through metakaolinite. It is ensured
from the XRD patterns of sintered support, in which kaolin peaks are disappeared. The
consistent peaks corresponding to the quartz appear in both the support (before and after
sintering). This clearly indicates that quartz is thermally stable phase. Moreover, no
significant weight loss is observed for quartz in TGA analysis (Ezzati et al., 2005). During

188
sintering process, CaCO3 is converted to CaO and CO2, which is reflected in the XRD profile
of after sintering sample. The new phase, wollastonite (CaSiO3) is alse observed, that may be
formed due to the reaction of amorphous silica with CaO (Gualtieri, 1995).
The XRD patterns of γ-Al2O3 powder (before and after calcination) are illustrated in Fig. 6.5.
XRD peaks of γ-Al2O3 powder are well matched with JCPDS PDF (File No. 21-1307),
corresponding to the boehmite powder. The diffraction analysis of Al2O3 powder (after
calcination) is observed as γ-Al2O3 phase, which is concurrence with the standard γ-Al2O3
phase of JCPDS PDF (File No. 10-0425). The presence of (311), (400), (440) peaks in the
calcined sample of Al2O3 confirm the existence of γ-Al2O3 nanocrystallites (Liu et al., 2008).
In order to determine the crystallite size of γ-Al2O3 powder samples (before and after
calcination), three measurements were carried out for each sample synthesized in a single
batch and the average value was reported with standard deviation. The crystaline size of γ-
Al2O3 (after calcination) from (400) peak is found to be 3.5±1.03 nm, while the crystalline
size of before calcination sample is 2.3±0.92 nm, which is obtained from (020) peak. These
values reveal the existence of nano γ-Al2O3 phase (Padmaja, 2004). The XRD patterns of
TiO2 powder (before and after calcination) are also shown in Fig. 6.5. After calcination, XRD
peaks of TiO2 sample such as (101), (004), (020), (015), (024) match with JCPDS PDF File
No. 21-1272 for anatase. This reveals the formation of the nano-TiO2 powder
(Wang et al., 2010).

189
Figure 6.5: XRD profiles of the clay, TiO2, and Al2O3 powders before and after
calcination (P-Pyrophyllite, M-Mullite, C-Calcium carbonate, F-Feldspar, CaO-
Calcium oxide, W-Wollastonite, K-Kaolin and A-Anatase)
6.2.6 Porosity
For every membrane, five experiments were conducted using same composition membranes
prepared at different batches and the average value was reported with standard error. The
porosity of the clay, TiO2–clay and γ-Al2O3–clay membranes is found to be 45.57±0.65,
43.32±0.35 and 42.29±0.62%, respectively. These results elucidate that there is no significant
difference in the porosity of the membranes. However, there is a variation between clay and
0 10 20 30 40 50 60 70 80
2degree)
TiO2
Before calcination
(020)
(120)(031)
(051) (231)
Inte
nsi
ty (
a.u
.)
Al2O
3
A (004)A(101)
A(015)
C
Q
PC
K
Clay
K
Q
KF
C
0 10 20 30 40 50 60 70 80
2degree)
TiO2
After calcination
(311) (400) (440)
Al2O
3
A(101)
A(004) A(020)A(015)A(024)
CaOQ
CaO
Clay Q
M
CaOW

190
composite membranes, which is due to the formation of TiO2 and γ-Al2O3 layers on the clay
membrane.
6.2.7 FESEM images of the membrane
FESEM images of clay and composite membranes were depicted in Fig. 6.6 (a-c). It is
clearly visible that surface of clay membrane is coated with TiO2 and γ-Al2O3 particles. The
rough morphology resembles that there are no cracks and pin holes on the surface. In the
images, TiO2 nanoparticles deposited on the clay membrane are shown in a circle symbol
with arrow mark and γ-Al2O3 layers are shown in rectangular symbol with arrow mark.
Images with different magnifications display uniform coating of TiO2 and γ-Al2O3 on the
clay membrane. These layers change the surface character of the clay membrane from
hydrophobic to hydrophilic nature. Therefore, it is useful to separate oil from oily
wastewater. The hydrophilic membrane surface contributes to repel oil droplets from
adhering to the membrane surface, thus reduces the membrane fouling.
The pore size distribution of membranes was estimated from FESEM images using ImageJ
software (http:// rsbweb.nih.gov/ij/download.html) and the obtained results are presented in
the Fig. 6.7. It is apparent from Fig. 6.7 that the clay and composite membranes have
different porous structure with pore sizes ranging between 0.001 and 2.75 µm. From these
pore size distributions, the average pore diameter of the clay, TiO2-clay and γ-Al2O3-clay
membranes is estimated to be 1.01±0.036, 0.98±0.021 and 0.97±0.017 µm, respectively.
Pore size of the clay and composite membranes was also determined by N2 gas
permeation study. Fig. 6.8 depicts the effective permeability factor versus average pressure
for clay and composite membranes. The smallest pore size and the lowest value of effective
permeability factor are noticed for the TiO2-clay membrane. The average pore size obtained
from N2 gas permeation is 0.981±0.014, 0.877±0.029 and 0.786±0.041 µm for clay, TiO2-

191
clay and γ-Al2O3-clay membrane, respectively, whereas the mean pore size of clay, TiO2-clay
and γ-Al2O3-clay membrane determined from FESEM analysis is 1.01±0.036, 0.98±0.021
and 0.97±0.017 µm, respectively. The difference might be due to the fact that the FESEM
analysis deals only with the surface pores of the membrane, while gas permeation study
provides the size of inner pore channels (minimum passage, which is the neck of a funnel like
shape, to pass through the gas) of the membrane. The decrease in pore sizes with coating of
TiO2 and γ-Al2O3 particles on clay membrane is observed from both N2 gas permeation and
FESEM image analysis.
Fig. 6.6 (d-f) shows the contact angle of the clay, TiO2-clay and γ-Al2O3-clay
membrane. Five measurements were carried out for each membrane at different locations and
the average value was reported with standard error. The contact angle measurement was done
to know the wettability and surface interaction of the membrane with liquid. The contact
angle indicates the degree of wetting when a solid and liquid interact. A small contact angle
(<< 90°) corresponds to high wettability, while a larger contact angle value (>> 90°)
corresponds to low wettability. Generally, for super hydrophilic surfaces, the water contact
angle (CA) is less than 0° and at this condition, the solid surface exhibits the droplet shape
into flat puddle due to complete wetting of the surface. It is well documented in the literature
that for super hydrophobic surfaces, water contact angles are usually greater than 150°, and it
will show almost no contact between the water droplet and the solid surface (Arkles, 2006;
Yuan, 2013; Adamson and Gast, 1976; Feng et al., 2002; Chinnam, 2015). The contact angle
of the clay, TiO2-clay and γ-Al2O3-clay membrane is found to be 77.07±2.37°, 14.57±0.54°
and 19.43±1.13°, respectively. The obtained results clearly point out that the prepared TiO2
membrane is more hydrophilic in nature. Fig. 6.6 (d-f) shows that a small contact angle is
observed when the water spreads on the TiO2 membrane, while a larger contact angle is

192
observed when the water spreads on the clay membrane. Moreover, the contact angle of
TiO2-clay membrane is 14.57±0.54°, indicating that the wetting of the surface is favorable,
and the fluid will spread over a large area on the surface of TiO2-clay membrane. In contrary,
the contact angle of clay membrane is 77.07±2.37°, signifying that the wetting of surface of
clay membrane is unfavorable. Therefore, the fluid will minimize its contact with clay
membrane surface and form a compact liquid droplet. The contact angle of clay membrane is
more than that of the prepared composite membranes; hence the clay membrane has less
hydrophilic in nature compared to TiO2-clay and γ-Al2O3-clay membranes. The
hydrophilicity of the prepared membranes varies in the following trend:
TiO2-clay > γ-Al2O3-clay > Clay membrane.

193
Figure 6.6: FESEM images (a,b,c) and contact angle (d,e,f) of clay, TiO2-clay and γ-
Al2O3-clay membrane (○-TiO2 layer; □-γ-Al2O3 layer)
(a) Clay (d) Clay
(b) TiO2-clay (e) TiO2-clay
(c) γ-Al2O3-clay (f) γ-Al2O3-clay

194
0.0 0.5 1.0 1.5 2.0 2.5 3.0 3.5 4.0 4.5
0
5
10
15
20
25
30
Nu
mb
er o
f p
ore
s (%
)
Pore size (µm)
Clay
TiO2-clay
-Al2O
3-clay
Figure 6.7: Pore size distribution of the clay and composite membranes
105 110 115 120 125 130 135 140
80
100
120
140
160
Clay
TiO2-clay
Al2O
3-clay
Eff
ecti
ve
per
mea
bil
ity
fa
cto
r
10
4 K
(m
/s)
Average Pressure 10-3
P (Pa)
Figure 6.8: Effect of pressure on N2 gas permeability of clay and composite membranes.

195
6.2.8 Water flux and hydraulic permeability
0 100 200 300 400
0
5
10
15
20
Pu
re w
ate
r fl
ux
10
4 (
m3/m
2 s
)
Applied pressure (kPa)
Clay
TiO2-clay
Al2O
3-clay
Figure 6.9: Effect of pressure on pure water flux of clay and composite membranes.
The water flux or hydraulic permeability of the membrane will depend on three factors such
as hydrophilic nature of the membrane surface, pore size and porosity (Ochoa et al., 2003).
Fig. 6.9 shows the effect of applied pressure on the water flux. Despite the fact that, the pure
water flux of the clay and composite membranes increases proportionately with an increment
in the applied pressure, which is consistent with the results obtained by Shokrkar et al.,
(2012). The flux of TiO2 coated membrane is higher than that of the clay membrane. This is
mostly because of changes in the hydrophilic nature of the surface of clay membrane by TiO2
coating. Similar result was also reported in the literature (Hua et al., 2007; Zhou et al., 2010;
Yan et al., 2006). TiO2 nanoparticles coating did not decrease the water flux, but increased
the hydrophilic character of the clay surface. The water flux of the TiO2-clay membrane is

196
more than that of the γ-Al2O3-clay membrane because the hydrophilic nature of the TiO2
coating is more than that of γ-Al2O3 coating and also pore size reduction is more in the γ-
Al2O3-clay membrane. The hydraulic permeability value is estimated to be 3.12×10⁻⁹,
2.59×10⁻⁹ and 3.003×10⁻⁹ (m3/m2 s Pa) for TiO2-clay, γ-Al2O3-clay and clay membrane,
respectively. It is worth to mention that the average pore diameter of the clay, TiO2-clay and
γ-Al2O3-clay membrane is 0.981±0.014, 0.877±0.029 and 0.786±0.041 µm, respectively,
which is determined from N2 gas permeation experiments. The variation in water
permeability of the membranes is due to hydrophilic modification of the surface of the clay
membrane.
6.2.9 Dead end MF of oil-in-water emulsions
0.01 0.1 1 10 100 1000 10000 100000
0
2
4
6
8
10
50 mg/L
150 mg/L
200 mg/L
250 mg/L
Vo
lum
e (
%)
Droplet Size (µm
Figure 6.10: Droplet size distribution of oil-in-water emulsions

197
Fig. 6.10 demonstrates the droplet size distribution of oil-in-water emulsion at different feed
concentrations. For all the concentrations, it can be noticed that the droplet size of emulsion
varies in the range of 0.05-100 µm. The average droplet size (in diameter) of emulsion is
determined as 0.771, 0.989, 6.037 and 6.928 µm of 50, 150, 200 and 250 mg/L of oil
concentration, respectively.
6.2.9.1 Effect of applied pressure on oil separation
The performance of the membranes was tested at various applied pressures ranging from 69
to 345 kPa for a fixed concentration of 200 mg/L. Fig. 6.11 reveals that the rejection
decreases with increasing applied pressure for all the membranes. The reason for this trend is
that higher pressures facilitate the enhancement of wetting and coalescence of oil droplets by
increasing forced convection. This possibly allows a few oil droplets to elapse all the way
through the pores of the membrane to arrive at the permeate stream side resulting decreased
rejection. This kind of results is well documented in the literature (Monash and Pugazhenthi,
2011b; Srijaroonrat et al., 1999; Salahi et al., 2010). All the membranes display around 96-
99% rejection and the maximum rejection is obtained with TiO2-clay membrane when
compared to the γ-Al2O3-clay membrane and clay membrane.
The hydrophilic membranes show more selectivity towards water due to which the
permeability of the TiO2-clay and γ-Al2O3-clay membrane is found to be higher when
compared with the hydrophobic clay membrane (Olegovich et al., 2013). This reveals that the
hydrophilic character and nanoparticles coating on the clay membrane are responsible for
both permeate flux and oil removal (%) in the treatment of oily wastewater. Among all the
studied membranes, TiO2-clay membrane is better with respect to permeate flux and
rejection.

198
0 100 200 300 400
0
5
10
15
20
Applied pressure (kPa)
Per
mea
te f
lux
10
4 (
m3/m
2 s
)
60
70
80
90
100
Rej
ecti
on
(%
)
Figure 6.11: Variation of permeate flux and rejection of oil with applied pressure for
clay (■, □), TiO2–clay membrane (●, ○) and γ-Al2O3–clay membrane (▲, Δ)
6.2.9.2 Effect of feed concentration on oil separation
The potential of the TiO2-clay and γ-Al2O3-clay membranes was investigated by
treating synthetic oil-in-water emulsions with oil concentrations of 50, 150, 200 and 250
mg/L at an applied pressure of 207 kPa. Fig. 6.12 depicts the effect of oil concentration on
permeate flux and rejection of the TiO2-clay and γ-Al2O3-clay membranes. In general, the oil
droplet size and density increase with increasing feed concentration. This is a reason for the
increased rejection at a higher concentration. The droplet size of the emulsion varies between
0.05 to 100 µm for all the studied concentrations (50-250 mg/L). Then the resulted average
droplet size of oil (in diameter) is determined as 0.771, 0.989, 6.037 and 6.928 µm for oil
concentration of 50, 150, 200 and 250 mg/L, respectively.

199
0 50 100 150 200 250 300
0
5
10
15
20
Initial feed concentration (mg/L)
Per
mea
te f
lux
10
7 (m
3/m
2 s
)
40
50
60
70
80
90
100
Rej
ecti
on
(%
)
Figure 6.12: Variation of permeate flux and rejection (%) of oil with feed concentration
for clay (■, □), TiO2–clay membrane (●, ○) and γ-Al2O3–clay membrane (▲, Δ)
It is clear from Fig. 6.7 that the clay membrane and composite membranes have
different porous structure with pore sizes ranging between 0.001 and 2.75 µm. From these
pore size distributions (Fig. 6.7), the average pore diameter of the clay, TiO2-clay and γ-
Al2O3-clay membranes is estimated to be 1.01±0.036, 0.98±0.021 and 0.97±0.017 µm,
respectively. The average pore size obtained from N2 gas permeation is 0.981±0.014,
0.877±0.029 and 0.786±0.041 µm for clay membrane, TiO2-clay and γ-Al2O3-clay
membrane, respectively. The volume median diameter of the oil droplet (0.771-6.928 µm) is
higher than the pore diameter of the clay membrane (0.981±0.014 µm) and composite
membranes (0.877±0.029, 0.786±0.041 µm), suggesting a greater possibility for the rejection

200
of oil droplets. The oil droplet sizes greater than the pore sizes of the membrane are retained
on the membrane surface during microfiltration of oil-in-water emulsion according to sieving
mechanism. In general, the permeability depends on the pore diameter as well as surface
characteristics of the membrane pores. If the membrane possesses superior percentage of pore
sizes that are larger than the emulsion droplet sizes along with greater hydrophilic surface,
then the membrane will display better removal efficiency with good permeate flux, which is
highly essential for industrial point of view. Higher concentration of the oil leads to
coalescence of the oil droplets forming a bigger droplet that result in a higher rejection.
When oil concentration increases from 50 to 250 mg/L, the permeate flux decreases because
the size of oil droplet is higher than the pore diameter of the membranes at higher
concentrations. Also, this may be due to the pore blocking mechanism of oil with the
membrane (Mittal et al, 2011; Vasanth et al., 2013). For hydrophilic membranes, the bond
between the oil droplets and membrane surface is weak and can be broken easily because of
hydrophilic nature of the membrane surface. Therefore, the oil rejection and flux of the TiO2-
clay and γ-Al2O3-clay membranes are higher than that of the clay membrane having a
hydrophobic surface (Abbasi et al., 2010).
The performance of the TiO2-clay membrane (98.95% of oil rejection as well as
8.481×10⁻⁵ m3/m2 s of permeate flux for the feed oil concentration of 200 mg/L at 69 kPa)
and γ-Al2O3-clay membrane (oil rejection of 98.46 % with permeate flux of 6.1185×10⁻⁵
m3/m2 s for the feed oil concentration of 200 mg/L at an applied pressure of 69 kPa) is
comparable with the available literature data (Vasanth et al., 2013). A clay based ceramic
membrane developed by Vasanth et al., (2013) showed about 96% rejection with permeate
flux of 0.006×10⁻⁵ m3/m2 s for the feed oil concentration of 200 mg/L at an applied pressure
of 69 kPa. A maximum oil removal of 92.54% was obtained using cellulose acetate
membrane having pore size of 0.028 µm at an applied pressure of 138 kPa for the oil-in-water

201
emulsion concentration of 200 mg/L (Mittal et al., 2011). In the work reported by Singh et
al., (2011), the polyamide membrane with the mean pore size of 1.116 µm displayed ~
97.80% removal efficiency of oil with permeate flux of 0.0335×10⁻⁴ m3/m2 s. Salahi et al.,
(2010) investigated the ability of the polysulfone membrane (with an average pore diameter
of 0.1 µm) to remove oil from oil-in-water emulsion (200 mg/L) and the membrane
demonstrated about 95% oil rejection. Till date, only few researchers have investigated upon
the performance of ceramic membrane technology for the separation of oil from its
emulsions. A critical analysis of the available literature provides several insights. Firstly, the
literature is highly focused towards higher concentration oil-in-water emulsions treatment
applications but not lower concentration, which are also important from the perspective of
industrial waste disposal. Therefore, low cost ceramic membrane technology might be
promising in such scenarios. Cui et al., (2008) studied upon the efficacy of α-Al2O3
membrane with pore size of 1.2 µm for oil-in-water emulsion applications. They presented a
detailed investigation with respect to oil removal from oil-in-water emulsions (100 mg/L) at
applied pressure of 100 kPa. Then they achieved 98.80% of oil rejection with 0.1667×10⁻⁴
m3/m2 s of permeate flux. The research work of Song et al., (2006) has proven that coal
membrane with a pore size 1 µm was also efficient for treatment of 120 mg/L feed oil at an
applied pressure of 100 kPa. The permeate flux of 0.1786×10⁻⁴ m3/m2 s and oil removal of
97.80% were observed. In work of chakrabarty et al., (2008), the polysulfone membrane
(average pore size 0.00362 µm) displayed oil separation efficiency was 97.57% and permeate
flux of 0.2399×10⁻⁴ m3/m2 s for a feed oil concentration of 100 mg/L and applied pressure of
69 kPa.
A vital concern of the fabricated ceramic membranes is to achieve 100% separation
efficiency with good flux, which is very much dependent on pore size distributions,

202
morphologies, surface characteristics (hydrophilic/hydrophobic) and feed concentration of
the oil-in-water emulsions. Thus, it is apparent that significant amount of research activity
needs to be dovetailed towards the development and application of ceramic membranes for
oil-in-water emulsion filtration applications. In view of this, a systematic investigation that
accounts for the modification of surface characteristics of the membrane to suite the desired
application is very important.
The resistances of different membranes to survive in severe ecological surroundings
and possessing extensive serviceable life are of important task. In this context, clay based
membrane is unique choice that can be used for many industrial applications, since it was
tested and justified to have a superior serviceable life and endurance for the treatment of
wastewater. However for comparable view point, it can be noticed that the highest oil
removal ability of fly ash membrane recorded by Fang et al., (2013) was 95.30% with
permeate flux of 0.4417×10⁻⁴ m3/m2 s, which is very low. Therefore, this effort involved to
concentrate on productive and economical manufacturing methods as well as coating
materials to attain excellent quality of membrane, which can provide better separation
efficiency and superior permeate flux than the published data are highly valuable.
It can be concluded that the studied membranes demonstrate better performance on the basis
of rejection and flux as compared to other membranes listed in literature. Table 6.1
summarizes the comparison of present membrane performance for the separation of oil from
the oil-in-water emulsions with the data available for different membranes listed in the
literature (Cui et al., 2008; Monash and Pugazhenthi, 2011; Adamson and Gast, 1976; Suresh
and Pugazhenthi, 2016; Ochoa et al., 2003; Shokrkar et al., 2012; Yan et al., 2006;
Srijaroonrat et al., 1999; Salahi et al., 2010; Olegovich et al., 2013; Abbasi et al., 2010). It
can be observed that the rejection values of the membranes are comparable with those

203
membranes reported in the literature. In comparison with clay membrane, TiO2-clay and
Al2O3-clay membranes display the highest oil removal efficiency along with good flux owing
to the enhanced hydrophilic characteristics of the surface modified membrane. Amongst the
available data, the result obtained for the TiO2-clay membrane is the finest in terms of
superior permeate flux (0.8481×10⁻⁴ m3/m2 s) and maximum oil rejection (98.96%) for the
feed oil concentration of 200 mg/L at an applied pressure of 69 kPa. The membrane
performance ability is estimated on the basis of it’s permeate flux and rejection values, which
are found to be acceptable range and hence, the fabricated composite membranes are opined
to be chosen for more efficient in separation of oil from oil-in-water emulsions.

204
Table 6.1: Comparison of membrane performance with other reported membranes
Membrane
materials
Average pore
size (µm) Type of oil
Applied
pressure
(kPa)
Feed oil
concentration
(mg/L)
Permeate
flux×104
(m3/m2 s)
Oil
rejection
(%)
Author
Clay materials 1.21 Crude oil 69 200 0.0006 96.00 Vasanth et al., (2013a)
Cellulose Acetate 0.028 Crude oil 138 200 0.389 92.54 Mittal et al., (2011)
Clay materials 0.98 Crude oil 345.4 200 0.7978 96.00 Monash and Pugazhenthi, (2011b)
Polyamide 1.16 Crude oil 207 192 0.0335 97.80 Singh et al., (2011)
Clay materials 0.285 Crude oil 69 125 0.054 98.40 Nandi et al., (2009)
Clay materials 1.3 Crude oil 276.4 125 6.1084 85.00 Vasanth et al., (2011b)
Coal 1 Crude oil 100 120 0.1786 97.80 Song et al., (2006)
NaA1/α-Al2O3 1.2 Lubricant oil 100 100 0.1667 98.80 Cui et al., (2008)
Polysulfone 0.00362 Crude oil 69 100 0.2399 97.57 Chakrabarty et al. (2008)
Clay materials 1.06 Crude oil 207 100 0.554 87.00 Vasanth et al., (2013b)
Polysulfone 0.1 Gas-oil 300 78 0.2111 95.00 Salahi et al., (2010)
Fly ash 0.77 Crude oil 100 75 0.4417 95.30 Fang et al., (2013)
α-Al2O3 0.2 Refinery oil 125 26 0.6944 84.61 Abadi et al., (2011)
TiO2-clay 0.98 Crude oil 69 200 0.8481 98.96 Present work
γ-Al2O3-clay 0.97 Crude oil 69 200 0.6119 98.46 Present work

205
6.3 Summary
Clay based ceramic membrane has been successfully fabricated by a uniaxial pressing
method and sintered at 950 oC. TiO2-clay and γ-Al2O3-clay composite membranes were
fabricated using inexpensive titanium tetrachloride and aluminium chloride as source
material, respectively. Hydrothermal method was adopted to coat the TiO2 and γ-Al2O3
nanoparticles on the clay membrane and modified the surface character of the clay membrane
from hydrophobic to hydrophilic. The porosity of clay, TiO2-clay and γ-Al2O3-clay
membranes is found to be 45.57±0.65, 43.32±0.35 and 42.29±0.62%, respectively. The
average pore diameter of the clay, TiO2-clay and γ-Al2O3-clay membranes is estimated to be
0.981±0.014, 0.877±0.029, 0.786±0.041 µm, respectively. The above prepared TiO2-clay and
γ-Al2O3-clay membranes show better rejection and permeate flux in separation of oil-in-water
emulsions than that of the clay membrane.

206

207
CHAPTER-7
Cross Flow Microfiltration Studies for TiO2-clay and Clay membranes

208

209
CHAPTER 7 Cross flow microfiltration studies for TiO2-clay and clay
membranes
After a brief overview of cross flow MF of oil-in-water emulsion with TiO2-clay and clay
membranes in section 7.1, Section 7.2 summarizes the flux profiles and fouling analysis using
the pore blocking models. Finally, section 7.3 presents a summary of the cross flow
microfiltration data.
7.1 Overview
This chapter presents studies upon the application of prepared TiO2-clay composite
membrane for the treatment of oil-in-water emulsions. Synthetic oil-in-water emulsions were
subjected to microfiltration in cross flow mode of operation. The aim of these experiments
was to evaluate the effect of applied pressure as well as cross flow velocity on the permeate
flux and oil rejection of both clay and TiO2-clay composite membrane. Subsequently, the
fouling analysis was done using different pore blocking models such as standard pore
blocking, complete pore blocking, intermediate pore blocking and cake filtration to gain
insights into the nature of membrane fouling during permeation studies.
7.2 Results and discussion
7.2.1 Determination of pure water flux in cross flow mode
Both clay and TiO2–clay membrane were subjected to evaluate their pure water permeate flux
in cross flow mode. The permeated pure water flux was calculated at different applied
pressures (69-207 kPa) with cross flow velocity of 0.0885 m/s for 30 min. Fig. 7.1 depicts the
effect of applied pressure on the water flux of clay and TiO2–clay membrane. As can be seen,
the flux increases linearly with an increase in the applied pressure, which is due to an

210
enhancement of driving force with increasing pressure. The variation in pure water flux
depends on physical properties of the membrane, such as hydrophilic nature of the membrane
surface, pore size and porosity (Shokrkar et al., 2012; Ochoa, 2003). The water flux of the
TiO2–clay membrane is more than that of clay membrane, which is due to modification of the
surface of the clay membrane from hydrophobic to hydrophilic by TiO2 coating. Similar
observations were also reported in literature for TiO2-Al2O3 and Al2O3-PVDF composite
membranes (Chang et al., 2014; Yan et al., 2006).
0 3 6 9 12 15 18 21 24 27 30 33
0
50
100
150
200
0 69 138 207
0
10
20
30
Wate
r fl
ux J
10
5 (
m3/m
2 s
)
Applied pressure (kPa)
69
138
207
Wate
r f
lux J105 (
m3/m
2 s)
Time (min)
Clay membrane
0 3 6 9 12 15 18 21 24 27 30 33
0
50
100
150
200
0 69 138 207
0
20
40
60
Wate
r fl
ux J
10
5 (m
3/m
2 s
)
Applied pressure (kPa)
Wate
r f
lux J10
5 (
m3/m
2 s
)
Time (min)
69 kPa
138 kPa
207 kPa
TiO2-clay
Figure 7.1: Variation of pure water flux of clay and TiO2-clay membrane in cross flow
mode with applied pressures (69-207 kPa) at cross flow velocity of 0.0885 m/s
In the work of Yan et al., (2006), the modified PVDF membrane demonstrated superior water
flux (123.547 L/m2 h at 0.1 MPa) than that of unmodified membrane (31.9767 L/m2 h at 0.1
MPa). It is apparent that the coating of TiO2 nanoparticles on the support does not reduce the
water flux but increased the hydrophilic character of the surface of the clay membrane. This
hydrophilic nature contributes to increase the flux of the composite membrane as compared
to clay membrane. This type of TiO2–clay membrane with high water flux is quite useful for
industrial applications (Zhou et al., 2009). It is worth to mention that there is a difference in

211
the average pore size of the clay and composite membrane as evidenced from N2 gas
permeation analysis, however, an increment in the water flux is due to the hydrophilic nature
of the membrane.
7.2.2 Cross- flow microfiltration of oil-in-water emulsions
Oil-in-water emulsion with concentration of 200 mg/L was prepared and utilized for
microfiltration experiments. The droplet size of emulsion is in the ranges of 0.05 - 100 µm
for the concentration of 200 mg/L and the average diameter of droplet is found to be 6.928
µm. The separation potential of the clay and TiO2-clay membrane was tested with the oil-in-
water emulsion concentration of 200 mg/L at various applied pressures ranging between 69
and 207 kPa and different cross flow velocities in the ranges of 0.0885-0.1769 m/s.
The variations of the permeate flux of clay membrane and TiO2-clay membrane with time for
three different applied pressures and three cross flow velocities (0.0885-0.1769 m/s) are
shown in Figs. 7.2 and 7.3, respectively. The transport resistance, which arises as a result of
concentration polarization and adsorption, leads to the decline of permeate flux with an
increment in filtration time. The membrane fouling arises due to the thin layer of oil which
sticks to the surface of the membrane. The rate of flux decline is comparatively slow, due to
the fact that slow concentration polarization influences the rejection during the process. The
permeate flux increases with increasing applied pressure, which is due to an enhancement of
the driving force across the membrane with increasing pressure.
At higher pressures, the decline rate of flux is more, which can be seen in the obtained
results. The reason for this trend is quick formation of oil layer over the surface, which leads
to the fouling of the membrane. It is also evident from Figs. 7.2 and 7.3 that the flux decline
increases with an increase in separation time, which is due to the formation of oil layer and

212
blocking of the membrane pores. The rate of flux decline is lower for TiO2-clay membrane in
comparison with clay membrane as evidenced from Figs. 7.2 and 7.3. This is mainly due to
the hydrophilic nature of the TiO2-clay membrane surface that prevents the oil droplets
penetrating into the membrane pores. At an applied pressure of 207 kPa, the maximum
permeate flux of clay membrane and TiO2-clay membrane after 30 min of operation is found
to be 8.70×10⁻⁵ and 18.66×10⁻⁵ m3/m2 s, respectively. This result proves the surface
modification of the TiO2-clay membrane with more hydrophilic characteristics.
The influence of cross flow velocity on permeate flux is measured by considering
three different cross flow velocities viz. 0.0885, 0.1327 and 0.1769 m/s as shown in Figs. 7.2
and 7.3. It is apparent that an increase in the cross flow velocity leads to an improvement in
permeates flux. An increment in the cross flow velocity reduces the concentration
polarization, and also adds to enhance the shear stress on the surface of the membrane, which
diminishes the profundity of the oil layer on the membrane surface. The permeate flux of clay
membrane is inferior as compared to the TiO2-clay membrane during the entire cross flow
velocity investigation due to its hydrophobic nature. It is seen from this pattern that an
increment in the cross flow velocity decreases the development of cake layer on the surface
of the membrane. The highest permeate flux of 10.36×10⁻⁵ and 19.35×10⁻⁵ m3/m2 s is
obtained at the beginning of the filtration process for the clay membrane and TiO2-clay
membrane, respectively, with the cross flow velocity of 0.1769 m/s and an applied pressure
of 207 kPa.

213
0 3 6 9 12 15 18 21 24 27 30 33
0
2
4
6
8
Perm
eate
flu
x J10
5 (
m3/m
2 s
)
Time (min)
69 kPa
138 kPa
207 kPa 0.0885 m/s
0 3 6 9 12 15 18 21 24 27 30 33
0
2
4
6
8
10
12
14
16
Perm
eate
flu
x J10
5 (
m3/m
2 s
)
Time (min)
69 kPa
138 kPa
207 kPa
0.1327 m/s
0 3 6 9 12 15 18 21 24 27 30 33
0
2
4
6
8
10
12
Perm
eate
flu
x J10
5 (
m3/m
2 s
)
Time (min)
69 kPa
138 kPa
207 kPa0.1769 m/s
69 138 207
0
2
4
6
8
10
12
0.0885 m/s
0.1327 m/s
0.1769 m/s
Cu
mu
lati
ve
per
meate
flu
x J105 (
m3/m
2s)
Applied pressure (kPa)
Clay membrane
Figure 7.2: Variation of permeate flux of clay membrane at three cross flow velocities
and applied pressures

214
0 3 6 9 12 15 18 21 24 27 30 33
0
5
10
Perm
eate
flu
x J10
5 (
m3/m
2 s
)
Time (min)
69 kPa
138 kPa
207 kPa 0.0885 m/s
0 3 6 9 12 15 18 21 24 27 30 33
0
5
10
15
Perm
eate
flu
x J10
5 (
m3/m
2 s
)
Time (min)
69 kPa
138 kPa
207 kPa0.1327 m/s
0 3 6 9 12 15 18 21 24 27 30 33
0
5
10
15
20
Perm
eate
flu
x J10
5 (
m3/m
2 s
)
Time (min)
69 kPa
138 kPa
207 kPa0.1769 m/s
69 138 207
0
5
10
15
20
0.0885 m/s
0.1327 m/s
0.1769 m/sC
um
ula
tive p
erm
eate
flu
x J105 (
m3/m
2 s
)
Applied pressure (kPa)
TiO2-clay membrane
Figure 7.3: Variation of permeate flux of TiO2–clay membrane at three cross flow
velocities and applied pressures
The variation of oil rejection with increasing applied pressure is presented in Fig. 7.4.
As evidenced from Fig. 7.4, the rejection of clay membrane is found to be reduced marginally
with augmenting cross flow velocity. This is due to the fact that increasing cross flow
velocity reduces the formation of cake layer on the surface of clay membrane. Therefore, the
resistance to the permeate flow decreases. When the cross flow velocity increased, it leads to
increase in the surface shear stress, which in turn caused to decrease the surface cake layer

215
formation. This results in the reduction of the resistance to the permeate flow. Owing to
above reasons, some oil droplets pass through the pores to reach the permeate stream, which
results in the decreased oil rejection. Similar observations were also reported in the literature
(Monash and Pugazhenthi et al., 2011b; Chinnam et al., 2015). Additionally, a higher cross
flow velocity empowers droplets of the oil to deform its shape due to flush of the feed.
69 138 207
0
20
40
60
80
100
Reje
cti
on
(%
)
Applied pressure (kPa)
0.0885 m/s
0.1327 m/s
0.1769 m/s
Clay membrane
69 138 207
0
20
40
60
80
100
Reje
cti
on
(%
)
Applied pressure (kPa)
0.0885 m/s
0.1327 m/s
0.1769 m/s
TiO2-clay membrane
Figure 7.4: The effect of applied pressure and cross flow velocity on rejection for clay
and TiO2-clay membrane
On the other hand, no significant variation in the rejection is observed with increasing
applied pressure for the TiO2-clay membrane. This is because of the impact of higher
hydrophilic nature of the surface of the TiO2-clay membrane when compared to clay
membrane. This helps to repel the oil droplets from the membrane surface (Chang et al.,
2014; Salahi et al., 2010). As per the outcomes indicated in Fig. 7.4, the fabricated TiO2-clay
membrane offers better values of oil rejection. A maximum oil rejection of 99.94% is
achieved at an applied pressure of 69 kPa with TiO2 membrane. The acquired results
demonstrate that the dismissal of oil relies on the pore size of the membrane and surface
tendency. The hydrophilic membrane shows more selectivity towards water due to which, the
permeate flux of the hydrophilic TiO2-clay membrane is higher as compared to the

216
hydrophobic clay membrane (Olegovich et al., 2013). This reveals that the hydrophilic
character and nanoparticles coating on the clay membrane are responsible for both improved
permeate flux and rejection of oil in the treatment of oil-in-water emulsion. Extensive lab
scale investigations were conducted to evaluate cross flow microfiltration of oil-in-water
emulsions using clay membrane and TiO2-clay membrane with synthetic oil-in-water
emulsions. Overall summary is presented in Table 7.1.
Table 7.1 summarizes the most appropriate research findings of this work along with
the few competent literature data. With careful observation of the table, the following can be
outlined as the promising output of the work. It can be seen that the permeate flux and oil
removal efficiency for clay membrane varied from 2.3498-8.708×10⁻⁵ m3/m2 s and 99.55-
93.24%, respectively. Similarly for TiO2-clay membrane, these parameters vary from 3.386-
18.660×10⁻⁵ (m3/m2 s) and 99.94-99.56%, respectively. Thus, it is apparent that the
microfiltration of oil using clay membrane provides lower permeate flux and oil removal (%)
in comparison with TiO2-clay membrane. This is due to the surface nature of the TiO2-clay
membrane and hydrophilic character influences the separation characteristics. A comparative
assessment of permeate flux and oil rejection obtained for clay membrane and TiO2-clay
membrane as well as literature data is presented in Table 7.1. Various clay membranes have
used for the oil removal from synthetic oil-in-water emulsions (Vasanth et al., 2013b; Nandi
et al., 2010; Song et al., 2006; Cui et al., 2008; Abbasi et al., 2010; Mueller et al., 1997).
Also, existing literature have focused towards the synthetic oil-in-water emulsions whose
chemical constitution is simpler in comparison with the real industrial oily wastewater
streams where solution chemistry is bound to be complex (Wang et al., 2008). Two important
studies in the literature have elaborated upon the application of fly ash (Fang et al., 2013) and
ZrO2 membrane (Yang et al., 1998). For ZrO2 membrane, the oil rejection (94.3%) has been

217
reported to have lower than that of the fly ash membrane (98.2%). This was not the case for
the clay membranes. However, despite having the lower rejection (87 and 88.35%) than fly
ash membrane (98.2%), clay membranes (Vasanth et al., 2013; Emani et al., 2014) were able
to provide better permeate flux (55.4×10⁻⁶, 44.1×10⁻⁶ m3/m2 s) than those obtained with the
fly ash membrane (25.83×10⁻⁶ m3/m2 s). However, the same has not been studied for the feed
oil concentration. This work summarizes the results obtained during the cross flow
microfiltration of oil-in-water emulsions for various membranes. It is evident that the
separation characteristics of TiO2-clay membrane are more than those evaluated for other
membranes (ZrO2, fly ash and clay membranes). For the optimized choice of cross flow
microfiltration parameters (cross flow velocity of 0.1769 m/s, applied pressure of 207 kPa
and operation time of 0.5 h), the TiO2-clay membrane provides permeate flux and oil removal
efficiency of 186.60×10⁻⁶ m3/m2 s and 99.56 %, respectively for the feed oil concentration of
200 mg/L using cross flow microfiltration.

218
Table 7.1: Comparison study of permeate flux and rejection data of present work with other membranes published in literature for
separation of oil-in-water emulsion.
Material
Pore
size
(µm)
Type of oil
Oil
Conc.
(mg/L)
Pressure
(kPa)
Cross flow
velocity (m/s)
Time
(h)
Permeate
flux×106
(m3/m2 s)
Oil
Rejection
(%)
Author
Carbon
membrane 1.0 Crude oil 120 100 0.1 1.67 17.86 97.8 Song et al., (2006)
NaAl/α-
Al2O3 1.20 Lubricant oil 100 100 0.01 10 16.67 98.8 Cui et al., (2008)
Mullite
membrane 0.289
Condensate gas
(C8-C12) 1000 300 1 2 11.11 94 Abbasi et al., (2010)
Kaolin,
quartz, etc. 0.285 Crude oil 125 69 - 1 5.40 98.4 Nandi et al., (2010)
α-Al2O3
membrane 0.80 Crude oil 250 69 0.24 2 8.33 99.9 Mueller et al., (1997)
ZrO2/α-Al2O3 1.0 Vegetable oil 5500 100 3-5 4 7.50 94.3 Yang et al., (1998)
α-Al2O3
membrane 0.20 Refinery oil 141 125 2.25 1.5 80.55 97.8 Abadi et al., (2011)
Fly ash
membrane 0.77 Crude oil 2000 100 4 10 25.83 98.2 Fang et al., (2013)
Clay
membrane 3.06 Crude oil 400 207 0.2688 0.5 44.1 88.35 Emani et al., (2014)
Clay
membrane 1.06 Crude oil 100 207 13.9×10⁻⁷ (m3/s) 1 55.4 87 Vasanth et al., (2013)
Clay
membrane 1.00 Crude oil 200 207 0.1769 0.5 87.08 93.24 This work
TiO2–clay 0.9 Crude oil 200 207 0.1769 0.5 186.60 99.56 This work

219
7.2.3 Analysis of fouling
Four distinctive filtration models were utilized to study the flux decline of clay
membrane and TiO2-clay composite membrane in the cross flow microfiltration of oil-in-
water emulsions. These models were fitted utilizing the filtration data obtained from clay
membrane and TiO2-clay membrane. Fig. 7.5 displays the correlation of the distinctive pore
blocking models for clay membrane and TiO2-clay membrane at three applied pressures (69-
207 kPa) and a constant cross flow velocity of 0.0885 m/s. As evidenced, the cake filtration
model furnishes great concurrence with experimental results at all applied pressures when
contrasted with alternate models for clay membrane. In the case of TiO2-clay membrane, it is
observed that the cake filtration model is well fitted at lower pressure, while at higher applied
pressures, complete pore blocking model provides good agreement with experimental values.
The model parameters, for example, permeate flux values (J0 at t=0), slope,
correlation coefficient (R2) obtained with various models for clay membrane and TiO2-clay
composite membrane are presented in Table 7.2. It is noteworthy to mention that the cake
filtration model offers the highest R2 value for ceramic support at all applied pressure. In case
of TiO2-clay membrane, the cake filtration model provides the highest R2 value at lower
pressure, and the complete pore blocking model gives the best R2 value with increasing
pressure. In this manner, it can be presumed that the cake filtration model depicts well the
fouling mechanism for clay membrane and complete pore blocking model for TiO2-clay
membrane.

220
0 3 6 9 12 15 18 21 24 27 30 33
0
5
10
15
20
25
30
35
40
1/J
210
-8,1
/J10
-3,1
/J0.510
-1, an
d L
n(1
/J)
Time (min)
TiO2-clay 69 kPa
0 3 6 9 12 15 18 21 24 27 30 33
0
20
40
60
80
100
120
140
160
180
200
1/J
210
-8, 1/J10
-3, 1/J
0.5
10
-1, an
d l
n(1
/J)
Time (min)
Clay membrane69 kPa
0 3 6 9 12 15 18 21 24 27 30 33
0
3
6
9
12
15
1/J
210
-8,1
/J10
-3,1
/J0.510
-1, an
d L
n(1
/J)
Time (min)
TiO2-clay 138 kPa
0 3 6 9 12 15 18 21 24 27 30 33
0
10
20
30
40
50
60
70
80
90
100
110
1/J
210
-8, 1/J10
-3, 1/J
0.5
10
-1, an
d l
n(1
/J)
Time (min)
Clay membrane138 kPa
0 3 6 9 12 15 18 21 24 27 30 33
0
3
6
9
12
1/J
210
-8,1
/J10
-3,1
/J0.510
-1, an
d L
n(1
/J)
Time (min)
TiO2-clay 207 kPa
0 3 6 9 12 15 18 21 24 27 30 33
0
10
20
30
40
1/J
210-8
, 1/J10-3
, 1/J
0.5
10-1
, an
d l
n(1
/J)
Time (min)
Clay membrane 207 kPa
Figure 7.5: Effect of pressure on four different pore blocking models. (■ Complete pore
blocking, ● Standard pore blocking, ▲ Intermediate pore blocking, ▼ Cake filtration)

221
As per Emani et al., (2014) observation, the cake filtration model produced the
highest R2 values to address the reduction of flux values in the treatment of oil-in-water
emulsions. In the work reported by Vasanth et al., (2013) four different models were used for
analyzing the experimental results and it was found that the cake filtration model with kaolin
based membrane was considered to be the best model for representing the experimental data.
Table 7.2 also illustrates the value of model parameters (k) determined from various
filtration models for clay and TiO2–clay membrane. According to the definition and physical
meaning of Hermia’s model parameters, the value of ‘k’ represents the severity of fouling. It
can be understood from Table 7.2 that for all the model fittings, the value of ‘k’ is higher for
clay membrane compared to TiO2–clay membrane. This can be explained by higher rate of
fouling in clay membrane.

222
Table 7.2: Model parameters acquired for distinctive pore blocking models with clay and TiO2–clay composite membrane at three
pressures. (Coefficient of correlation (R2), initial permeate flux (J0) and slopes (k))
Clay 69 kPa 138 kPa 207 kPa
Model
Correlation
coefficient
(R2)
Slope
(k)
Initial
permeate
flux, J0 m/s
Correlation
coefficient
(R2)
Slope
(k)
Initial
permeate flux,
J0 m/s
Correlation
coefficient
(R2)
Slope
(k)
Initial
permeate
flux, J0 m/s
Complete 0.924
0.00718
s-1
2.90×10⁻⁵ 0.979
0.02396
s-1
6.35×10⁻⁵ 0.942
0.00874
s-1
6.84×10⁻⁵
Standard 0.924
0.07805
s0.5 m-0.5
2.91×10⁻⁵ 0.990
0.18136
s0.5 m-0.5
6.53×10⁻⁵ 0.951
0.05635
s0.5 m-0.5
6.86×10⁻⁵
Intermediate 0.925
0.27987
m-1
2.92×10⁻⁵ 0.997
0.55274
m-1
6.78×10⁻⁵ 0.958
0.14554
m-1
6.88×10⁻⁵
Cake
filtration
0.926
2.18682
s m-2
2.94×10⁻⁵ 0.997
2.61507
s m-2
7.89×10⁻⁵ 0.972
0.48678
s m-2
6.93×10⁻⁵

223
TiO2-clay 69 kPa 138 kPa 207 kPa
Model
Correlation
coefficient
(R2)
Slope
(k)
Initial
permeate
flux, J0 m/s
Correlation
coefficient
(R2)
Slope
(k)
Initial
permeate
flux, J0 m/s
Correlation
coefficient
(R2)
Slope (k)
Initial permeate
flux, J0 m/s
Complete 0.966
0.00754
s-1
4.23×10⁻⁵ 0.967
0.00401
s-1
8.5×10⁻⁵ 0.968
0.00263
s-1
12.6×10⁻⁵
Standard 0.969
0.07805
s0.5 m-0.5
4.24×10⁻⁵ 0.967
0.02248
s0.5 m-0.5
8.51×10⁻⁵ 0.967
0.01196
s0.5 m-0.5
12.6×10⁻⁵
Intermediate 0.972
0.27987
m-1
4.26×10⁻⁵ 0.966
0.05049
m-1
8.51×10⁻⁵ 0.967
0.02177
m-1
12.6×10⁻⁵
Cake
filtration
0.976
2.18682
s m-2
4.29×10⁻⁵ 0.965
0.01274
s m-2
8.53×10⁻⁵ 0.966
0.0036
s m-2
12.7×10⁻⁵

224
7.3 Summary
The uniaxial pressing method has been applied for the fabrication of porous clay
membrane using clay mixture composition of kaolin, quartz, ball clay, pyrophyllite, calcium
carbonate and feldspar. It was sintered at 950 °C to examine the performance by separation of
oil-in-water emulsions. TiO2 composite membrane was fabricated using inexpensive titanium
tetrachloride by hydrothermal method. The surface character of the clay membrane was
modified from hydrophobic to hydrophilic, which was verified by the contact angle
measurements. The above prepared TiO2-clay membrane showed better rejection and
permeate flux in separation of oil-in-water emulsions than that of the clay membrane in cross
flow mode.

225
CHAPTER-8
Conclusions and Future Work

226

227
CHAPTER 8 Conclusions and Future work
Section 8.1 summarizes conclusions obtained from the research findings of the thesis. Section
8.2 presents possible scope for the future research work.
8.1 Conclusion
In this work, the inexpensive ceramic membrane fabrication involved three stages. The first
stage involved the development of low cost ceramic membranes. During this phase, new
inexpensive compositions were identified by trial and error based approach to prepare
ceramic membranes SP1-SP4 (2.97-1.32 µm average pore size) and sub-micron range
microfiltration membranes M1-M3 (1.36-1.44 µm average pore size). Morphological and
structural characterization have affirmed that the membranes possess desired properties and
are effective for oil-in-water emulsion treatment application. The second stage involved the
preparation of TiO2-Fly ash composite membrane using in-situ hydrothermal crystallization
method and subsequent application of this membrane for the cross flow microfiltration of oil-
in-water emulsions and process parametric optimization using response surface methodology.
Finally, the last stage involved the fabrication of clay membrane and its surface nature was
modified by coating of TiO2 and γ-Al2O3 materials via hydrothermal method. The
performance of the TiO2 and γ-Al2O3 composite membranes was carried out by conducting
separation studies on oil-in-water emulsions. In these studies, the effect of process parameters
on permeates flux and oil rejection was evaluated. The conclusions drawn from experimental
investigations are presented as follows:
Among SP1-SP4 inexpensive membranes, SP4 membrane (48% porosity, 1.32 µm
average pore size and 13.82 MPa mechanical strength) provided optimal performance
for oil-in-water emulsion treatment to obtain 4.1×10⁻⁸ (m3/m2 s) membrane flux and
99.2% rejection at 69 kPa and 200 mg/L initial oil concentration.

228
Among M1-M3 membranes that were prepared with maximum constitution of fly ash,
M2 membrane provided optimal combinations of rejection (81-99%) and membrane
flux (4.42-0.337×10⁻⁴ (m3/m2 s)). Further, the RSM based assessment of optimal
parameters and variables corresponds to 345 kPa applied pressure, 176.07 mg/L feed
concentration, 2.6×10⁻⁴ m3/m2 s membrane flux, 96.97% rejection and 0.77
desirability.
The TiO2-fly ash composite membrane prepared with the M2 membrane support
provided optimal performance during oil-in-water emulsion treatment with cross-flow
microfiltration. The membrane provided an 51.6372×10⁻⁴ m3/m2 s average membrane
flux, 0.4974 m3/m2 s performance index which was better than those obtained for the
M2 membrane (49.9712×10⁻⁴ m3/m2 s and 0.4620 (m3/m2 s) (%)). For the titania-fly
ash composite membrane, the RSM based optimal parameters and variables
correspond to 207 kPa applied pressure, 200 mg/L feed concentration, 0.1769 m/s
cross flow velocity, 41.3301×10⁻⁴ (m3/m2 s) membrane flux and 98.7% rejection.
Corresponding optimal flux and rejection based on experimental investigations are
42.74×10⁻⁴ m3/m2.s and 98.5% respectively.
In view to compare fly ash membranes and clay membranes, the clay membrane was
manufactured by means of a uniaxial dry pressing technique with clay powders
available locally. TiO2–clay and γ-Al2O3-clay membranes were prepared on the clay
membrane by in-situ hydrothermal crystallization technique using TiCl4 and AlCl3 as
a source material, respectively. It was observed that the surface character of the clay
membrane was modified from hydrophobic to hydrophilic. Clay, TiO2-clay and γ-
Al2O3-clay membranes were subjected to dead end flow microfiltration of oil-in-water
emulsions. Amongst the studied membranes, the result obtained for the TiO2
membrane is the finest in terms of superior permeate flux (0.8481×10⁻⁴ m3/m2 s) and

229
maximum oil rejection (98.96%) for the feed oil concentration of 200 mg/L at an
applied pressure of 69 kPa.
Among TiO2–clay and clay membranes tested for MF of oil-in-water emulsion in cross
flow mode, the separation characteristics of TiO2-clay membrane in terms of permeate
flux (1.866×10⁻⁴ m3/m2.s) and rejection (99.56%) are found to be better for the feed
oil concentration of 200 mg/L at an applied pressure of 207 kPa with cross flow
velocity of 0.1769 m/s. Further, complete pore blocking is found to be best fit model
to represent pertinent flux decline at higher applied pressures.
Among all the membranes, TiO2-Fly ash composite membrane provided best
combinations of membrane flux and rejection for oil-in-water emulsion treatment.
In summary, the membrane reported in the thesis along with identified novel precursor
formulations for inexpensive MF membranes provided satisfactory and comparatively better
performance than those reported in the literature for oil-in-water emulsion separation.
8.2 Future work
Based on the conclusions of this work, few proposals for future research have been presented
as follows:
Ceramic membrane fabrication and characterization
Develop fly ash based tubular ceramic membranes with significantly higher
constitution of fly ash by adopting extrusion method.
Investigate upon the effect of extrusion process parameters (such as velocity) on the
morphology and structural properties of membranes.
Investigate upon the role of various binders (polyvinyl alcohol, polyethylene glycol and
carboxy methyl cellulose) on the membrane morphological properties and separation
efficacy.

230
Evaluate average membrane pore size using either mercury porosimetry approach or
molecular weight cutoff (MWCO) characterization methods.
Target the fabrication of multi-layered asymmetric tubular ceramic composite
membranes with fly ash as a skin layer.
Microfiltration applications of fly ash based tubular and multi-layered ceramic
membranes
Treatment of real oil-in-water emulsion effluents produced from industries to obtain
confidence levels for the commercial application of low cost ceramic membranes.
Pilot plant studies for oil-in-water emulsion treatment using low cost ceramic MF and
UF membranes.

231
References

232

233
References
Abadi, S. R. H., Sebzari, M., Hemati, M., Rekabdar, F., Mohammadi, T., Ceramic membrane
performance in microfiltration of oily wastewater, Desalination 265 (2011) 222-228.
Abadikhah, H., Ashtiani, F. Z., Fouladitajar, A., Nanofiltration of oily wastewater containing
salt; experimental studies and optimization using response surface methodology,
Desalination Water Treatment 56 (2015) 2783-2796.
Abbasi, M., Mirfendereski, M., Nikbakht, M., Golshenas, M., Mohammadi, T., Performance
study of mullite and mullite-alumina ceramic MF membranes for oily wastewaters
treatment, Desalination 259 (2010) 169-178.
Abbasi, M., Salahi, A., Mirfendereski, M., Mohammadi, T., Park, A., Dimensional analysis
of permeation flux for microfiltration of oily wastewaters using mullite ceramic
membranes, Desalination 252 (2010) 113-119.
Adamson, A.W., Gast, A. P., Physical Chemistry of Surfaces, John Wiley & Sons, Inc., New
York, USA, 1976.
Ahmad, A., Majid, M., Ooi, B., Functionalized PSf/SiO2 nanocomposite membrane for oil-in-
water emulsion separation, Desalination 268 (2011) 266-269.
Ahmadun, F. R., Pendashteh, A., Abdullah, L. C., Biak, D. R. A., Madaeni, S. S., Abidin, Z.
Z., Review of technologies for oil and gas produced water treatment, Journal of
Hazardous Materials 170 (2009) 530-551.
Ahmaruzzaman, M., A review on the utilization of fly ash, Progress in Energy Combustion
Science 36 (2010) 327-363.
Akgerman, A., Zardkoohi, M., Adsorption of phenolic compounds on fly ash, Journal of
Chemical Engineering Data 41 (1996) 185-187.

234
Aleboyeh, A., Daneshvar, N., Kasiri, M. B., Optimization of C.I. Acid Red 14 azo dye
removal by electrocoagulation batch process with response surface methodology,
Chemical Engineering and Processing: Process Intensification 47 (2008) 827-83.
Alem, A., Sarpoolaky, H., Keshmiri. M., Sol gel preparation of titania multilayer membrane
for photocatalytic applications, Ceramics International 35 (2009b) 1837-1843.
Alem, A., Sarpoolaky, H., Keshmiri, M., Titania ultrafiltration membrane: Preparation,
characterization and photocatalytic activity, Journal of the European Ceramic Society
29 (2009a) 629-635.
Almandoza, M. C., Marchese, J., Prádanos, P., Palacio, L., Hernández, A., Preparation and
characterization of non-supported micro-filtration membranes from alumino silicates,
Journal of Membrane Science 241 (2004) 95-103.
Al-Shamrani, A. A., James, A., Xiao, H., destabilization of oil-water emulsions and
separation by dissolved air flotation, Water Research 36 (2002) 1503-1512.
Alzahrani, S., Mohammad, A.W., Challenges and trends in membrane technology
implementation for produced water treatment: A review, Journal of Water Process
Engineering 4 (2014) 107-133.
Apak, R., Tutem, E., Hugul, M., Hizal, J., Heavy metal cation retention by unconventional
sorbents (red muds and fly ashes), Water Research 32 (1998) 430-440.
Arkles, B., Hydrophobicity, Hydrophilicity and Silanes, Paint & Coatings Industry magazine,
Gelest Inc., Morrisville, PA, USA, 2006.
Arnot, A., Field, R. W., Koltuniewicz, A. B., Cross-flow and dead-end microfiltration of oily-
water emulsions part II. Mechanisms and modelling of flux decline, Journal of
Membrane Science 169 (2000) 1-15.

235
Arzani, M., Mahdavi, H .R., Bakhtiari, O., Mohammadi, T., Preparation of mullite ceramic
microfilter membranes using Response surface methodology based on central
composite design, Ceramics International 42 (2016) 8155-8164.
Baker, R. W., Membrane technology and applications, John Wiley & Sons Ltd, West Sussex,
England, (2004).
Banerjee, S. S., Jayaram, R. V., Joshi, M. V., Removal of nickel (II) and zinc (II) from
wastewater using fly ash and impregnated fly ash, Separation Science Technology 38
(2003) 1015-1032.
Banerjee, S. S., Joshi, M. V., Jayaram, R. V., Removal of Cr(VI) and Hg(II) from aqueous
solutions using fly ash and impregnated fly ash, Separation Science Technology 39
(2004) 1611-1629.
Bashir, M. J. K., Aziz, H. A., Yusoff, M. S., Adlan, M. N., Application of response surface
methodology (RSM) for optimization of ammonical nitrogen removal from semi-
aerobic landfill leachate using ion exchange resin, Desalination 254 (2010) 154-161.
Bashir, M. J. K., Aziz, H. A., Yusoff, M.S., Aziz, S. Q., Mohajeri, S., Stabilized sanitary
landfill leachate treatment using anionic resin: Treatment optimization by response
surface methodology, Journal of Hazardous Materials 182 (2010) 115-122.
Basumatary, A. K., Kumar, R.V., Ghoshal, A. K., Pugazhenthi, G., Crossflow ultrafiltration
of Cr (VI) using MCM-41, MCM-48 and Faujasite (FAU) zeolite ceramic composite
membranes, Chemosphere 153 (2016) 436-446.
Basumatary, A. K., Kumar, R.V., Ghoshal, A. K., Pugazhenthi, G., Removal of FeCl3from
aqueous solution by ultrafiltration using ordered mesoporous MCM-48 ceramic
composite membrane, Separation Science and Technology 51 (2016) 2038-2046

236
Benito, J. M., Conesa, A., Rubio, F., Rodriguez, M. A., Preparation and characterization of
tubular ceramic membranes for treatment of oil emulsions, Journal of European
Ceramic Society 25 (2005) 1895-1903.
Bensadok, K., Benammar, S., Lapicque, F., Nezzal, G., Electrocoagulation of cutting oil
emulsions using aluminium plate electrodes, Journal of Hazardous Materials 152
(2008) 423-430.
Berg, G. B. V. D., Smolders, C. A., Flux decline in ultrafiltration processes, Desalination 77
(1990) 101-133.
Blissett, R. S., Rowson, N. A., A review of the multi-component utilization of coal fly ash,
Fuel 97 (2012) 1-23.
Boudaira, B., Harabia, A., Bouzerara, F., Condom, S., Preparation and characterization of
microfiltration membranes and their supports using kaolin (DD2) and CaCO3,
Desalination and Water Treatment 9 (2009) 142-148.
Bouzerara, F, Harabi, A, Achour, S, Larbot, A, Porous ceramic supports for membranes
prepared from kaolin and doloma Mixtures, Journal of European Ceramic Society 26
(2006) 1663-1671.
Bruggen, B. V. D., Manttari, M., Nystrom, M., Drawbacks of applying nanofiltration and
how to avoid them: A review, Separation and Purification Technology 63 (2008) 251-
263.
Ceramiques techniques & industrielles, SA, France, 2007.http://perso.orange.fr/ctisa.
Chakrabarty, B., Ghoshal, A. K., Purkait, M. K., Ultrafiltration of stable oil-in-water
emulsion by polysulfone membrane, Journal of Membrane Science 325 (2008) 427-
437.
Chang, Q., Zhou, J., Wang, Y., Liang, J., Zhang, X., Cdfneaux, S., Wang, X., Zhu, Z., Dong,
Y., Application of ceramic microfiltration membrane modified by nano-TiO2 coating

237
in separation of a stable oil-in-water emulsion, Journal of Membrane Science 456
(2014) 128-133.
Chavalparit, O., Ongwandee, M., Optimizing electrocoagulation process for the treatment of
biodiesel wastewater using response surface methodology, Journal of Environmental
Sciences 21 (2009) 1491-1496.
Cheryan, M., Ultrafiltration and microfiltration handbook, Technomic publishing company,
Basel, Switzerland, 1998.
Chinnam, J., Das, D., Vajjha, R., Satti, J., Measurements of the contact angle of nanofluids
and development of a new correlation, International Communication in Heat and
Mass Transfer 62 (2015) 1-12.
Chou, K. S., Kao, K. B., Huang, C. D., Chen, C. Y., Coating and characterization of titania
membrane on porous ceramic supports, Journal of Porous Materials 6 (1999) 217-
225.
Chowdhury, S. R, Schmuhl, R., Keizer, K., Elshof, J. E. T., Blank, D. H., Pore size and
surface chemistry effects on the transport of hydrophobic and hydrophilic solvents
through mesoporous γ-alumina and silica MCM-48, Journal of Membrane Science
225 (2003) 177-186.
Colomban, P. H., Raman study of the formation of transition alumina single crystal from
protonic β/β`` aluminas, Journal of Materials Science Letters 7 (1988) 1324-1326.
Cross, A. D., An Introduction to practical IR Spectroscopy, 2nd edition, Butterworth,
London, 1964.
Cui, J., Zhang, X., Liu, H., Liu, S., Yeung, K. L., Preparation and application of
zeolite/ceramic microfiltration membranes for treatment of oil contaminated water,
Journal of Membrane Science 325 (2008) 420-426.

238
Cultrone, G., Navarro, C. R., Sebastian, E., Cazalla, O., Torre, M. J., Carbonate and silicate
phase reactions during ceramic firing, European Journal of Mineralogy 13 (2001)
621-634.
Cumming, I. W., Holdich, R. G., Smith, I. D., The rejection of oil by microfiltration of a
stabilized kerosene/water emulsion, Journal of Membrane Science 169 (2000) 147-
155.
Daifullah, A. E. H., Gad, H., Sorption of semi-volatile organic compounds by bottom and fly
ashes using HPLC. Adsorption Science Technology 16 (1998) 273-283.
Davini, P., Flue gas treatment by activated carbon obtained from oil-fired fly ash. Carbon 40
(2002) 1973-1979.
DeFriend, K. A., Wiesner, M. R., Barron, A. R., Alumina and aluminate ultrafiltration
membranes derived from alumina nanoparticles, Journal of Membrane Science 224
(2003) 11-28.
Delagrave, A., Marchand, J., Pigeon, M., Boisvert, J., Deicer salt scaling resistance of roller
compacted concrete pavements. ACI Materials Journal 96 (1997) 164-169.
Dong, Y. C., Liu, X. Q., Ma, Q. L., Meng, G.Y., Preparation of cordierite-based porous
ceramic micro-filtration membranes using waste fly ash as the main raw material,
Journal of Membrane Science 285 (2006) 173-181.
Dong, Y., Feng, X., Dong, D., Wang, S., Yang, J., Gao, J., Liu, X., Meng, G., Elaboration
and chemical corrosion resistance of tubular macro-porous cordierite ceramic
membrane supports, Journal of Membrane Science 304 (2007) 65-75.
Dong, Y., Hampshire, S., Zhou, J., Ji, Z., Wang, J., Meng, G., Sintering and characterization
of fly ash based mullite with MgO addition, Journal of the European Ceramic Society
31 (2011) 687-695.

239
Dong, Y., Hampshire, S., Zhou, J., Lin, B., Ji, Z., Zhang, X., Meng, G., Recycling of fly ash
for preparing porous mullite membrane supports with titania addition, Journal of
Hazardous Materials 180 (2010) 173-180.
Ebrahimi, M., Ashaghi, K. S., Engel, L., Willershausen, D., Mund, P., Bolduan, P., Czermak,
P., Characterization and application of different ceramic membranes for the oil-field
produced water treatment, Desalination 245 (2009) 533-540.
Ebrahimi, M., Willershausen, D., Ashaghi, K. S., Engel, L., Placido, L., Mund, P., Bolduan,
P., zermak, P.C., Investigations on the use of different ceramic membranes for
efficient Oil-field produced water treatment, Desalination 250 (2010) 991-996.
Emani, S., Uppaluri, R., Purkait, M. K., Cross flow microfiltration of oil-water emulsions
using kaolin based low cost ceramic membranes, Desalination 341 (2014) 61-71.
Emani, S., Uppaluri, R., Purkait, M. K., Preparation and characterization of low cost ceramic
membranes for mosambi juice clarification, Desalination 317 (2013) 32-40.
Erdem, I., Ciftcioglu, M., Harsa, S., Separation of whey components by using ceramic
composite membranes. Desalination 189 (2006) 87-91.
Ezzati, A., Gorouhi, E., Mohammadi, T., Separation of water in oil emulsions using
microfiltration, Desalination 185 (2005) 371-382.
Falamaki, C., Afarani, M. S., Aghaie, A., Initial sintering stage pore growth mechanism
applied to the manufacture of ceramic membrane supports, Journal of European
Ceramic Society 24 (2004) 2285-2292.
Falamaki, C., Naimi, M., Aghaie, A., Dual behavior of CaCO3 as a porosifier and sintering
aid in the manufacture of alumina membrane/catalyst supports, Journal of the
European Ceramic Society 24 (2004) 3195-3201.

240
Fang, J., Qin, G. T., Wei, W., Zhao, X. Q., Preparation and characterization of tubular
supported ceramic microfiltration membranes from fly ash, Separation and
Purification Technology 80 (2011) 585-591.
Fang, J., Qin, G., Wei, W., Zhao, X., Jiang, L., Elaboration of new ceramic membrane from
spherical fly ash for microfiltration of rigid particle suspension and oil-in-water
emulsion, Desalination 311 (2013) 113-126.
Feng, L., Li, S., Li, Y., Li, H., Zhang, L., Zhai, J., Song, Y., Liu, B., Jiang, L., Zhu, D.,
Super-hydrophobic surfaces: From natural to artificial, Advanced Materials 4 (2002)
1857-1860.
Frost, R. L., Kloprogge, J., Russell, S. C., Szetu, J. L., Dehydroxylation and structure of
alumina gels prepared from trisecbutoxyaluminium, Thermochimica Acta 329 (1999)
47-56.
Fukui, K., Arimitsu, N., Jikihara, K., Yamamoto, T., Yoshida, H., Performance of fuel cell
using calcium phosphate hydrogel membrane prepared from waste incineration fly ash
and chicken bone powder, Journal of Hazardous Materials 168 (2009) 1617-1621.
Gao, P., Lu, X., Lin, H., Li, X., Hou, J., Effects of fly ash on the properties of
environmentally friendly dam concrete, Fuel 861 (2007) 208-211.
Garcia, C., Hernandez, E. R., Lopez, L. Z. F., Gomez, H. E., Effect of the membrane
characteristics and operation modes, in the fouling of ultrafiltration membranes by
natural organic matter (NOM), Journal of the Chilean Chemical Society 57 (2012)
1083-1086.
Gengec, E., Kobya, M., Demirbas, E., Akyol, A., Oktor, K., Optimization of baker’s yeast
wastewater using response surface methodology by electrocoagulation, Desalination
286 (2012) 200-209.

241
Ghaedi, M., Kokhdan, S. N., Removal of methylene blue from aqueous solutions by wood
millet carbon optimization using response surface methodology, Spectrochimica Acta
Part A: Molecular and Biomolecular Spectroscopy 136 (2015) 141-148.
Ghafari, S., Aziz, H. A., Isa, M. H., Zinatizadeh, A. A., Application of response surface
methodology (RSM) to optimize coagulation-flocculation treatment of leachate using
poly-aluminum chloride (PAC) and alum, Journal of Hazardous Materials 163 (2009)
650-656.
Gonzalez, A., Navia, R., Moreno, N., Fly ashes from coal and petroleum coke combustion:
current and innovative potential applications, Waste Management and Research 27
(2009) 976-987.
Gualtieri, A., Bellotto, M., Artioli, G., Clark, S. M., Kinetic study of the kaolinite-mullite
reaction sequence. Part II: mullite formation, Physics and Chemistry of Minerals 22
(1995) 215-222.
Hansen, K. D., Reinhardt, W. G., Roller-compacted concrete dams. New York: McGraw-
Hill; 1991.
Hsieh, H. P., Inorganic membranes for separation and reaction, Elsevier, Amsterdam, (1996).
Hu, X., Yu, Y., Zhou, J., Wang, Y., Liang, J., Zhang, X., Chang, Q., Song, L., The improved
oil-water separation performance of graphene oxide modified Al2O3 microfiltration
membrane, Journal of Membrane Science 476 (2015) 200-204.
Hua, F. L., Tsang, Y. F., Wang, Y. J., Chan, S. Y., Chuand, H., Sin, H. N., Performance study
of ceramic microfiltration membrane for oily wastewater treatment, Chemical
Engineering Journal 128 (2007) 169-175.
Hyun, S. H., Kim, G. T., Synthesis of ceramic microfiltration membranes for oil-water
separation, Separation Science and Technology 32 (1997) 2927-2943.

242
Illic, M., Cheeseman, C., Sollars, C., Knight, J., Mineralogy and microstructure of sintered
lignite coal fly ash, Fuel 82 (2003) 331-336.
Iyer, R. S., Scott, J. A., Power station fly ash- a review of value-added utilization outside of
the construction industry, Resources, Conservation and Recycling 31 (2011) 217-228.
Jadhav, M. V., Mahajan, Y. S., Application of response surface methodology to
water/wastewater treatment using Cocconia indica, Desalination and Water
Treatment 52 (2014) 6403-6411.
Jamaly, S., Darwish, N. N., Ahmed, I., Hasan, S. W., A short review on reverse osmosis
pretreatment technologies, Desalination 354 (2014) 30-38.
Jana, S., Purkait, M. K., Mohanty, K., Preparation and characterization of low-cost ceramic
microfiltration membranes for the removal of chromate from aqueous solutions,
Applied Clay Science 47 (2010) 317-324.
Jedidi, I., Khemakhem, S., Larbot, A., Ben, A. R., Elaboration and characterization of fly ash
based mineral supports for microfiltration and ultrafiltration membranes, Ceramic
Internationals 35 (2009) 2747–2753.
Jedidi, I., Khemakhem, S., Saidi, S., Larbot, A., Ammar, N. E., Fourati, A., Charfi, A., Salah,
A. B., Amar, R. B., Preparation of a new ceramic microfiltration membrane from
mineral coal fly ash: Application to the treatment of the textile dying effluents,
Powder Technology 208 (2011) 427-432.
Jedidi, I., Saidi, S., Khmakem, S., Larbot, A., Elloumi-Ammar, N., Fourati, A., Charfi, A.,
Amar, R.B., New ceramic microfiltration membranes from mineral coal fly ash,
Arabian Journal of Chemistry 2 (2009) 31-39.
Jo, Y. M., Hutchison, R., Raper, J. A., Characterization of ceramic composite membrane
filters for hot gas cleaning, Powder Technology 91 (1997) 55-62.

243
John, D., Nanotechnology-A new way to do oil skimming?, Metal finishing 108 (2010) 35-
36.
Jokic, A., Zavargo, Z., Seres, Z., Tekic, M., The effect of turbulence promoter on cross-flow
microfiltration of yeast suspensions: A response surface methodology approach,
Journal of Membrane Science 350 (2010) 269-278.
Jones, C. D., Barron, A. R., Porosity, crystal phase, and morphology of nanoparticle derived
alumina as a function of the nanoparticle’s carboxylate substituent, Materials
Chemistry and Physics 104 (2007) 460-471.
Jonsson, A. S., Tragardh, G., Ultrafiltration applications, Desalination 77 (1990) 135-179.
Judd, S., B. Jefferson, Membranes for industrial wastewater recovery and re-use, Elsevier,
Oxford OX5 IGB, UK, 2003.
Kang, W., Guo, L., Fan, H., Meng, L., Li, Y., Flocculation, coalescence and migration of
dispersed phase droplets and oil-water separation in heavy oil emulsion, Journal of
Petroleum Science and Engineering 81 (2012) 177-181.
Kazemimoghadam, M., Pak, A., Mohammadi, T., Dehydration of water/1-1-dimethy
hydrazine mixtures by zeolite membranes, Microporous and Mesoporous Materials
70 (2004) 127-134.
Kelleher, B. P., O’Callaghan, M. N., Leahy, M. J., O’Dwyer, T. F., Leahy, J. J., The use of
fly ash from the combustion of poultry litter for the adsorption of chromium (III) from
aqueous solution, Journal of Chemical Technology and Biotechnology 77 (2002)
1212-1218.
Khataee, A. R., Dehghan, G., Optimization of biological treatment of a dye solution by macro
algae Cladophora sp. using response surface methodology, Journal of the Taiwan
Institute of Chemical Engineers 42 (2011) 26-33.

244
Khemakhem, S., Larbot, A., Amara, R. B., Study of performances of ceramic microfiltration
membrane from Tunisian clay applied to cuttlefish effluents treatment, Desalination
200 (2006) 307-309.
Khider, K., Akretche, D. E., Larbot, A., Purification of water effluent from a milk factory by
ultrafiltration using Algerian clay support. Desalination 167 (2004) 147-151.
Korbahti, B. K., Tanyolac, A., Electrochemical treatment of simulated textile wastewater
with industrial components and Levafix Blue CA reactive dye: Optimization through
response surface methodology, Journal of Hazardous Materials 151 (2008) 422-431.
Koros, W. J., Mahajan, R., Pushing the limits on possibilitie for large scale gas separation:
Which strategies, Journal of Membrane Science 172 (2000) 181-196.
Krauczyk, J. A. S., The influence of feed flow channel diameter on frictional pressure drop,
membrane performance and process cost in full-scale tubular membranes, Chemical
Engineering Research and Design 92 (2014) 174-180.
Krebs, T., Schroen, C. G. P. H., Boom, R. M., Separation kinetics of an oil-in-water emulsion
under enhanced gravity, Chemical Engineering Science 71 (2012) 118-125.
Kumar, R. V., Ghoshal, A. K., Pugazhenthi, G., Fabrication of zirconia composite membrane
by in-situ hydrothermal technique and its application in separation of methyl orange,
Ecotoxicology and Environmental Safety 121 (2015) 73-79
Kushwaha, J. P., Srivastava, V. C., Mall, I. D., Organics removal from dairy wastewater by
electrochemical treatment and residue disposal, Separation and Purification
Technology 76 (2010) 198-205.
Li, H. J., Cao, Y. M., Qin, J. J., Jie, X. M., Wang, T. H., Liu, J. H., Yuan, Q., Development
and characterization of anti-fouling cellulose hollow fiber UF membranes for oil-
water separation, Journal Membrane Science 279 (2006) 328-335.

245
Li, L., Ding, L., Tu, Z., Wan, Y., Clausse, D., Lanoiselle, J. L., Recovery of linseed oil
dispersed within an oil-in-water emulsion using hydrophilic membrane by rotating
disk filtration system, Journal of Membrane Science 342 (2009) 70-79.
Li, S., Shen, Q., Zong, J., Yang, H., Simple preparation of sub-micron mesoporous TiO2
spheres consisting of anatase nanocrystals, Journal of Alloys and Compounds 508
(2010) 99-105.
Li, Y., Chen, H., Liu, J., Yang, W., Microwave synthesis of LTA zeolite membranes without
seeding, Journal of Membrane Science 277 (2006) 230-239.
Li, J., Wang, X., Wang, L., Hao, Huang, Y., Zhang, Y., Sun, Liu, X., Preparation of alumina
membrane from aluminium chloride, Journal of Membrane Science 275 (2006) 6–11.
Lin, K. L., Feasibility study of using brick made from municipal solid waste incinerator fly
ash slag, Journal of Hazardous Materials B 137 (2006) 1810–1816.
Lin, Y. S., Burggraaf, A. J., Preparation and characterization of high-temperature thermally
stable alumina composite membrane, Journal of American Ceramic Society 74
(1991) 219-224.
Liu, H. L., Chiou, Y. R., Optimal decolorization efficiency of Reactive Red 239 by UV/TiO2
photocatalytic process coupled with response surface methodology, Chemical
Engineering Journal 112 (2005) 173-179.
Liu, Y., Ma, D., Han, X., Bao, X., Frandsen, W., Wang, D., Su, D., Hydrothermal synthesis
of microscale boehmite and gamma nanoleaves alumina, Materials Letters 62 (2008)
1297-1301.
Lobo, A., Cambiella, A., Benito, J. M., Pazos, C., Coca, J., Ultrafiltration of oil-in-water
emulsions with ceramic membranes: Influence of pH and crossflow velocity, Journal
of Membrane Science 278 (2006) 328-334.

246
Majhi, A., Monash, P., Pugazhenthi, G., Fabrication and characterization of γ-Al2O3-clay
composite ultrafiltration membrane for the separation of electrolytes from its aqueous
solution, Journal of Membrane Science 340 (2009) 181-191.
Marchese, J., Pagliero, C. L., Characterization of asymmetric polysulphone membranes for
gas separation, Gas Separation and Purification 5 (1991) 215-221.
Masmoudi, S., Larbot, A., Feki, H. E., Amar, R. B., Elaboration and characterization of
apatite based mineral supports for microfiltration and ultrafiltration membranes,
Ceramics Internationals 33 (2007) 337-344.
Masoudnia, K., Raisi, A., Aroujalian, A., Fathizadeh, M., Treatment of oily wastewater using
the microfiltration process: Effect of operating parameters and membrane fouling
study, Separation Science and Technology 48 (2013) 1544-1555.
Mathur, A. K., Ash utilisation in NTPC. In: Proceedings of the workshop on fly ash
utilisation: issues and strategies; 2000.
McMillan, P., Piriou, B., The structures and vibrational spectra of crystals and galsses in the
silica-alumina system, Journal of Non-Crystalline Solids 53 (1982) 279-298.
Mittal, P., Jana, S., Mohanty, K., Synthesis of low cost hydrophilic ceramic-polymeric
composite membrane for treatment of oily wastewater, Desalination 282 (2011) 54-
62.
Mohajeri, S., Aziz, H. A., Isa, M. H., Zahed, M. A., Bashir, M. J. K., Adlan, M. N.,
Application of the central composite design for condition optimization for semi-
aerobic landfill leachate treatment using electrochemical oxidation, Water Science &
Technology 61 (2010) 1257-1266.
Mohammad, A. W., Teow, Y. H., Ang, W. L., Chung, Y. T., Radcliffe, D. L. O., Hilal, N.,
Nanofiltration membranes review: Recent advances and future prospects,
Desalination 356 (2015) 226-254.

247
Mohammadi, T., Pak, A., Karbassian, M., Golshan, M., Effect of operating conditions on
microfiltration of an oil–water emulsion by a kaolin membrane, Desalination, 168
(2005) 201-205.
Monash, P., Pugazhenthi, G., Development of ceramic supports derived from low cost clays
for membrane applications and its optimization based on sintering temperature,
International Journal of Applied Ceramic Technology 8 (2011a) 227-238.
Monash, P., Pugazhenthi, G., Effect of TiO2 addition on the fabrication of ceramic membrane
supports: A study on the separation of oil droplets and bovine serum albumin (BSA)
from its solution, Desalination 279 (2011b) 104-114.
Montgomery, D. C., Response Surface Methods and other Approaches to Process
Optimization Design and Analysis of Experiments, fifth ed., John Wiley & Sons, New
York, NY, 2001.
Mott Metallurgical Corporation, USA, 2007. http://www.mottcorp.com.
Mueller, J., Cen, Y., Davis, R. H., Cross flow microfiltration of oily water, Journal of
membrane Science 129 (1997) 221-235.
Mulder. M., Basic Principles of Membrane Technology, Kluwer Academic Publishers,
Dordrecht, (1991).
Nandi, B. K., Moparthi, A., Uppaluri, R., Purkait, M. K., Treatment of oily wastewater using
low cost ceramic membrane: Comparative assessment of pore blocking and artificial
neural network models, Chemical Engineering Research and Design 88 (2010) 881-
892.
Nandi, B. K., Uppaluri, R., Purkait M. K., Preparation and characterization of low cost
ceramic membranes for microfiltration applications, Applied Clay Science 42 (2008)
102-110.

248
Nandi, B. K., Uppaluri, R., Purkait, M. K., Identification of optimal membrane
morphological parameters during microfiltration of mosambi juice using low cost
ceramic membranes, LWT- Food Science and Technology 44 (2011) 214 -223.
Nandi, B. K., Uppaluri, R., Purkait, M. K., Treatment of oily wastewater using low-cost
ceramic membrane: Flux decline mechanism and economic feasibility, Separation
Science and Technology 44 (2009) 2840-2869.
Nanni, A., Ludwig, D., Shoenberger, J., Roller compacted concrete for highway pavements.
Concrete International 18 (1996) 33–38.
Neelakandan, C., Pugazhenthi, G., Kumar, A., Preparation of NOx modified PMMA–EGDM
composite membrane for the recovery of chromium (VI), European Polymer Journal
39 (2003) 2383–2391.
Nunes, S. P., Peinemann, K.V., Membrane technology in the chemical industry, 1st ed. Wiley,
New York, 2001.
Ochoa, N. A., Masuelli, M., Marchese, J., Effect of hydrophilicity on fouling of an emulsified
oil wastewater with PVDF/PMMA membranes, Journal of Membrane Science 226
(2003) 203-211.
Olegovich, D. V., Gilmanovich, S. I., Bonev, B. S., Shaukatovich, A. I., Nenov, V. A., Oily
wastewater treatment using membranes modified by plasma, Energy and
Environmental Engineering 1 (2013) 105-110.
Olmez, T., The optimization of Cr (VI) reduction and removal by electrocoagulation using
response surface methodology, Journal of Hazardous Materials 162 (2009) 1371-
1378.
Padaki, M., Murali, R. S., Abdullah, M. S., Misdan, N., Moslehyani, A., Kassinm, M. A.,
Hilal, N., Ismail, A. F., Membrane technology enhancement in oil-water separation. A
review, Desalination 357 (2015) 197-207.

249
Padmaja, P., Krishnapillai, P., Warrier, K. G. K., Adsorption isotherm and pore
characteristics of nano alumina derived from sol-gel boehmite, Journal of Porous
Materials 11 (2004) 147-155.
Pan, Y., Wang, T., Sun, H., Wang, W., Preparation and application of titanium dioxide
dynamic membranes in microfiltration of oil-in-water emulsions, Separation and
Purification Technology 89 (2012) 78-83.
Pattanayak, J., Mondal, K., Mathew, S., Lalvani, S. B., A parametric evaluation of the
removal of As(V) and As(III) by carbon-based adsorbents, Carbon 38 (2000) 589-
596.
Patterson, V. A., Krieg, H. M., Kriek, R. J., Bisset, H., Direct synthesis of a titania membrane
on a centrifugally casted tubular ceramic support, Journal of Membrane Science 285
(2006) 1-3.
Potdar, A., Shukla, A., Kumar, A., Effect of gas phase modification of analcime zeolite
composite membrane on separation of surfactant by ultrafiltration, Journal of
Membrane Science 210 (2002) 209-225.
Pugazhenthi, G., Sachan, S., Kishore, N., Kumar, A., Separation of chromium (VI) using
modified ultrafiltration chargedcarbon membrane and its mathematical modeling,
Journal of Membrane Science 254 (2005) 229-239.
Querol, X., Alastuey, A., Jose, L. F. T., Angel, L. S., Synthesis of zeolites by alkaline
activation of ferro-aluminous fly ash, Fuel 74 (1995) 1226-1231.
Rastegar, S. O., Mousavi, S. M., Shojaosadati, S. A., Sheibani, S., Optimization of petroleum
refinery effluent treatment in a UASB reactor using response surface methodology,
Journal of Hazardous Materials 197 (2011) 26-32.

250
Rezvanpour, A., Roostaazad, R., Hesampour, M., Nystrom, M., Ghotbi, C., Effective factors
in the treatment of kerosene-water emulsion by using UF membranes, Journal of
Membrane Science 161 (2009) 1216-1224.
Sadeghian, M., Sadeghi, M., Hesampour, M., Moheb, A., Application of response surface
methodology (RSM) to optimize operating conditions during ultrafiltration of oil-in-
water emulsion, Desalination and Water Treatment 55 (2015) 615-623.
Saffaj, N., Persin, M., Younsi, S. A., Albizane, A., Cretin, M., Larbot, A., Elaboration and
characterization of microfiltration and ultrafiltration membranes deposited on raw
support prepared from natural Moroccan clay: application to filtration of solution
containing dyes and salts, Applied Clay Science 31 (2006) 110-119.
Saffaj, N., Persin, M., Younssi, S. A., Albiza, A., Bouhria, M., Loukili, H., Dacha, H.,
Larbot, A., Removal of salts and dyes by low ZnAl2O4–TiO2 ultrafiltration
membrane deposited on support made from raw clay, Separation and Purification
Technology 47 (2005) 36-42.
Saffaj, N., Loukili, H., Younssi, S. A., Albizane, A., Bouhria, Persin, M. M., Larbot, A.,
Filtration of solution containing heavy metals and dyes by means of ultrafiltration
membranes deposited on support made of Moroccan clay, Desalination 168 (2004)
301-306.
Salahi, A., Gheshlaghi, A., Mohammadi, T., Madaeni, S. S., Experimental performance
evaluation of polymeric membranes for treatment of an industrial oily wastewater,
Desalination 262 (2010) 235-242.
Salahi, A., Noshadi, I., Badrnezhad, R., Kanjilal, B., Mohammad, T., Nano-porous membrane
process for oily wastewater treatment: Optimization using response surface
methodology, Journal of Environmental Chemical Engineering 1 (2013) 218-225.

251
Salam, K. K., Alade, A. O., Arinkoola, A. O., Opawale, A., Improving the demulsification
process of heavy crude oil emulsion through blending with diluent, Journal of
Petroleum Engineering 2013 (2013) 6.
Saleh, K., Guigon, P., Coating and encapsulation processes in powder technology, 1st edition,
Elsevier, Handbook of powder technology, 2007, Chapter 7, 323-375.
Santos, S. C. R., Boaventira, R. A. R., Adsorption modelling of textile dyes by sepiolite,
Applied Clay Science 42 (2008) 137-145.
Savasari, M., Emadi, M., Bahmanyar, M. A., Biparva, P., Optimization of Cd (II) removal
from aqueous solution by ascorbic acid stabilized zero valent iron nanoparticles using
response surface methodology, Journal of Industrial and Engineering Chemistry 21
(2015) 1403-1409.
Shi, J., Wang, X., Wang, X., Optimizing oily wastewater treatment via wet peroxide
oxidation using response surface methodology, Journal of the Korean Chemical
Society 58 (2014) 80-84.
Shokrkar, H., Salahi, A., Kasiri, N., Mohammadi, T., Prediction of permeation flux decline
during MF of oily wastewater using genetic programming, Chemical Engineering
Research and Design 90 (2012) 846-853.
Shqau, K., Mottern, M. L., Yu, D., Verweij, H., Preparation and propertis of porous α-Al2O3
membrane supports, Journal of the American Ceramic Society 89 (2006) 1790-1794.
Shukla, A., Kumar, A., Separation of Cr(VI) by zeolite-clay composite membranes modified
by reaction with NOx, Separation Purification Technology (52) (2007) 423-429.
Singh, V., Purkait, M. K., Das, C., Cross-flow microfiltration of industrial oily wastewater:
experimental and theoretical consideration, Separation Science and Technology 46
(2011) 1213-1223.

252
Singh, R., Membrane technology and engineering for water purification application, systems
design and operation, 2nd edition,USA, Elsevier (2015).
Song, C. W., Wang, T. H., Pan, Y. Q., Qiu, J. S., Preparation of coal-based microfiltration
carbon membrane and application in oily wastewater treatment, Separation and
Purification Technology 51 (2006) 80-84.
Sriharsha, E., Uppaluri, R., Purkait, M. K., Cross flow microfiltration of oil-water emulsions
using kaolin based low cost ceramic membranes, Desalination 341 (2014) 61-71.
Srijaroonrat, P., Julien, E., Aurelle, Y., Unstable secondary oil/water emulsion treatment
using ultrafiltration: fouling control by back flushing, Journal of Membrane Science
159 (1999) 11-20.
Steenkiste, T. H. V., Smith, J. R., Teets, R. E., Aluminum coatings via kinetic spray with
relatively large powder particles, Surface and Coatings Technology 154 (2002) 237-
252.
Suresh, K., Pugazhenthi, G., Development of ceramic membranes from low-cost clays for the
separation of oil-water emulsion, Desalination and Water Treatment 57 (2016) 1927-
1939.
Suresh, K., Srinu, T., Ghoshal, A. K., Pugazhenthi, G., Preparation and Characterization of
TiO2 and γ-Al2O3 composite membranes for the separation of oil-water emulsions,
RSC Advances 6 (2016) 4877-4888.
Tennison, S., Current hurdles in the commercial development of inorganic membrane
reactors, Membrane Technology 2000 (2000) 4-9.
Thirugnanasambandham, K., Sivakumar, V., Prakash M. J., Response surface modelling and
optimization of treatment of meat industry wastewater using electrochemical
treatment method, Journal of the Taiwan institute of Chemical Engineers 46 (2015)
160-167.

253
Tir, M., Moulai-Mostefa, N., Optimization of oil removal from oily wastewater by
electrocoagulation using response surface method, Journal of Hazardous Materials
158 (2008) 107-115.
Trinh, T. K., Kang, L. S., Response surface methodological approach to optimize the
coagulation-flocculation process in drinking water treatment, Chemical Engineering
Research and Design 89 (2011) 1126-1135.
Tsuru, T., Narita, M., Shinagawa, R., Yoshioka, T., Nanoporous titania membranes for
permeation and filtration of organic solutions, Desalination 233 (2008) 1-9.
Tsuru, T., Inorganic porous membranes for liquid phase separation, Separation and
Purification Methods 30 (2001) 191-220.
Un, U.T., Kandemir, A., Erginel, N., Ocal, S. E., Continuous electrocoagulation of cheese
whey wastewater: An application of Response Surface Methodology, Journal of
Environmental Management 146 (2014) 245-250.
Vasanth, D., Pugazhenthi, G., Uppaluri, R., Influence of sintering temperature on the
properties of porous ceramic support prepared by uniaxial dry compaction Method
using low cost raw materials for membrane applications, Separation Science and
Technology 46 (2011a) 1241-1249.
Vasanth, D., Pugazhenthi, G., Uppaluri, R., Fabrication and properties of low cost ceramic
microfiltration membranes for separation of oil and bacteria from its solution, Journal
of Membrane Science 379 (2011b) 154-163.
Vasanth, D., Pugazhenthi, G., Uppaluri, R., Performance of low cost ceramic microfiltration
membranes for the treatment of oil-in-water emulsions, Separation Science and
Technology 48 (2013a) 849-858.
Vasanth, D., Pugazhenthi, G., Uppaluri, R., Cross-flow microfiltration of oil-in-water
emulsions using low cost ceramic membranes, Desalination 320 (2013b) 86-95.

254
Vassilev, S. V., Vassileva, C. G., A new approach for the classification of coal ashes based
on their origin, composition, properties, and behavior, Fuel 86 (2007) 490-512.
Wang, C., Ao, Y., Hou, P., Qian, J., A facile method for the preparation of titania-coated
magnetic porous silica and its photocatalytic activity under UV or visible light,
Colloids and Surfaces A: Physicochemical and Engineering Aspects 360 (2010) 184-
189.
Wang, J. P., Chen, Y. Z., Ge, X. W., Yu, H. Q., Optimization of coagulation-flocculation
process for a paper-recycling wastewater treatment using response surface
methodology, Colloids and Surfaces A : Physicochemical Engineering Aspects 302
(2007) 204-210.
Wang, J. P., Chen, Y. Z., Wang, Y., Yuan, S. J., Yu, H. Q., Optimization of the coagulation-
flocculation process for pulp mill wastewater treatment using a combination of
uniform design and response surface methodology, Water Research 45 (2011) 5633-
5640.
Wang, J., Guan, J., Santiwong, S. R., Waite, T. D., Characterization of floc size and structure
under different monomer and polymer coagulants on microfiltration membrane
fouling, Journal of Membrane Science 321 (2008) 132-138.
Wang, Y. H., Tian, T. F., Liu, X. Q., Meng, G. Y., Titania membrane preparation with
chemical stability for very hash environments applications, Journal of Membrane
Science 280 (2006) 261-269.
Wang, Y., Chen, K., Mo, L., Li, J., Xu, J., Optimization of coagulation-flocculation process
for papermaking-reconstituted tobacco slice wastewater treatment using response
surface methodology, Journal of Industrial and Engineering Chemistry 20 (2014)
391-396.

255
Wang, Y. H., Zhang, Y., Liu, X. Q., Meng, G. Y., Sol-coated preparation and
characterization of macroporous α-Al2O3 membrane support, Journal of Sol-Gel
Science and Technology 41 (2007) 267-275.
Wang. P., Xu. N., Shi. J., A pilot study of the treatment of waste rolling emulsion using
zirconia microfiltration membranes, Journal of Membrane Science 173 (2000) 159-
166.
Wang, Y. H., Liu, X. Q., Meng, G. Y., Preparation of asymmetric pure titania ceramic
membranes with dual functions, Materials Science and Engineering A 445-446
(2007) 611–619.
Weir, W. R., Rutinduka, E., Detellier, C., Feng, C. Y., Wang, Q., Matsuura, T., Le VanMao,
R., Fabrication, characterization and preliminary testing of all-inorganic ultrafiltration
membranes composed entirely of a naturally occurring sepiolite clay mineral, Journal
of Membrane Science 182 (2001) 41-50.
Wijmans, J. G., Nakao, S., Smolders, C. A., Flux limitation in ultrafiltration: Osmotic
pressure model and gel layer model, Journal of Membrane Science 20 (1984) 115-
124.
Workneh, S., Shukla, A., Synthesis of sodalite octahydrate zeolite-clay composite membrane
and its use in separation of SDS, Journal Membrane Science 309 (2008)189-195.
Xia, C., Liu, M., A Simple and Cost-Effective Approach to Fabrication of Dense Ceramic
Membranes on Porous Substrates, Journal of American Ceramic Society 84 (2001)
1903-1905.
Yan, L., Li, Y. S., Xiang, C. B., Xianda, S., Effect of nano-sized Al2O3-particle addition on
PVDF ultrafiltration membrane performance, Journal of Membrane Science 276
(2006) 162-167.

256
Yang, C., Zhang, G., Xu, N., Shi, J., Preparation and application in oil-water separation of
ZrO2 / α-Al2O3 MF membrane, Journal of Membrane Science 142 (1998) 235-243.
Yi, X. S., Yu, S. L., Shi, W. X., Sun, N., Jin, L. M., Wang, S., Zhang, B., Ma, C., Sun, L. P.,
The influence of important factors on ultrafiltration of oil/water emulsion using PVDF
membrane modified by nano-sized TiO2/Al2O3, Desalination 281 (2011) 179-184.
Yoshino, Y., Suzuki, T., Nair, B. N., Taguchi, H., Itoh, N., Development of tubular
substrates, silica based membranes and membrane modules for hydrogen separation at
high temperature, Journal of Membrane Science 267 (2005) 8-17.
Yuan, Y., Lee, T. R., Contact angle and wetting properties In: Bracco, G., Holst, B., (eds),
Surface Science Techniques, Springer, Berlin, Heidelberg, 2013, Chapter 1, pp 3-34.
Yue, L., Wang, L., Shi, F., Guo, J., Yang, J., Lian, J., Luo, X., Application of response
surface methodology to the decolorization by the electrochemical process using
FePMo12O40 catalyst, Journal of Industrial and Engineering Chemistry 21 (2015)
971-979.
Zhang, Y., Xiong, G., Yao, N., Yang, W., Fu, X., Preparation of titania-based catalysts for
formaldehyde photocatalytic oxidation from TiCl4 by the sol gel method. Catalysis
Today, 68 (2001) 89-95.
Zhong, J., Sun, X., Wang, C., Treatment of oily wastewater produced from refinery processes
using flocculation and ceramic membrane filtration, Separation and Purification
Technology 32 (2003) 93-98.
Zhou, J., Chang, Q., Wang, Y., Wang, J., Meng, G., Separation of stable oil–water emulsion
by the hydrophilic nano-sized ZrO2 modified Al2O3 microfiltration membrane,
Separation and Purification Technology 75 (2010) 243–248.

257
Zhou, J., Zhang, X., Wang, Y., Hu, X., Larbot, A., Persin, M., Electrokinetic characterization
of the Al2O3 ceramic MF membrane by streaming potential measurements,
Desalination 235 (2009) 102-109.
Zhu, L., Chen, M., Dong, Y., Tang, C. Y., Huang, A., Li, L., A low-cost mullite-titania
composite ceramic hollow fiber microfiltration membrane for highly efficient
separation of oil-in-water emulsion, Water Research 90 (2016) 277-285.
Zouboulis, A. I., Avranas, A., Treatment of oil-in-water emulsions by coagulation and
dissolved-air flotation, Colloids and Surfaces A: Physicochemical Engineering
Aspects 172 (2000) 153-161.

258

259
List of Publications
In Journals:
1. Kanchapogu Suresh and G. Pugazhenthi, Development of ceramic membranes from
low cost clays for the separation of oil-water emulsion, Desalination and Water
Treatment, 57 (2016) 1927-1939.
2. Kanchapogu Suresh, Tekula Srinu, Aloke Kumar Ghoshal and G. Pugazhenthi,
Preparation and characterization of TiO2 and γ-Al2O3 composite membranes for the
separation of oil-water emulsions, RSC advances, 6 (2016) 4877-4888.
3. Kanchapogu Suresh, R. Uppaluri and G. Pugazhenthi, Fly ash based ceramic
microfiltration membranes for oil-water emulsion treatment: Parametric optimization
using Response Surface Methodology, Journal of Water Process Engineering, 13
(2016) 27-43.
4. Kanchapogu Suresh and G. Pugazhenthi, Cross flow microfiltration of oil-water
emulsions using clay based ceramic support and TiO2 composite membrane,
Egyptian Journal of Petroleum (accepted).
5. Kanchapogu Suresh, R. Uppaluri and G. Pugazhenthi, Preparation and
characterization of hydrothermally engineered TiO2-Fly ash composite membranes,
Frontiers of Chemical Science and Engineering (accepted).
Conferences:
1. Kanchapogu Suresh and G. Pugazhenthi, Performance evaluation of microfiltration
ceramic membrane from fly ash by treatment of oily wastewater, DAE-BRNS
Symposium on Emerging Trends in Separation Science and Technology
(SESTEC-2014), 25-28 February 2014, Bhabha Atomic Research Center, Mumbai,
Maharashtra.

260
2. Kanchapogu Suresh and G. Pugazhenthi, Treatment of oily wastewater by ceramic
membrane from fly ash, Annual Chemical Engineering Symposium (Reflux 2.0),
29-30 March 2014, Indian Institute of Technology Guwahati, Guwahati, Assam.
3. Kanchapogu Suresh and G. Pugazhenthi, Utilization of fly ash in fabrication of
ceramic membrane, Annual Symposium on Solid Waste Management (RECYCLE
2014), 6 April 2014, Indian Institute of Technology Guwahati, Guwahati, Assam.
4. Tekula Srinu, Kanchapogu Suresh, Aloke Kumar Ghoshal and G. Pugazhenthi,
Treatment of Oily Wastewater using TiO2 Microfiltration Membrane Prepared on
Ceramic Support, International Conference on Advances in Chemical
Engineering & Technology (ICACE ’14), 16-18 October 2014, Thangal Kunju
Musaliar College of Engineering, Kollam, Kerala.
5. Kanchapogu Suresh and G. Pugazhenthi, Development and characterization of
thermally stable novel ceramic membrane from inorganic clay materials for treatment
of synthetic oil-water emulsions, National Seminar on Recent Trends in
Fundamental and Applied Chemical Sciences (RTFACS-2014), 19-21 November
2014, Dibrugarh University, Dibrugarh, Assam.
6. Kanchapogu Suresh, Manpadu Ramesh and G. Pugazhenthi, Low cost ceramic
microfiltration membrane for treatment of oil-water emulsions in cross flow mode,
International Conference on New Frontiers in Chemical, Energy and
Environmental Engineering (INCEEE-2015), 20-21 March 2015, National Institute
of Technology Warangal, Warangal, Telangana.

261
Appendix

262

263
Appendix I: Detailed cost analysis of membranes (M1-M3) and Separation cost
The following calculations represent the cost of the membranes. In these cost calculations, raw materials cost, labor, sonication, electricity,
equipment cost and depreciation cost have also been considered.
(1) Membrane cost
The unit prices of various raw materials are as follows: Quartz- Rs. 10/kg; CaCO3- Rs. 240/kg; Fly ash- Rs. 28/kg and polyvinyl alcohol (PVA) -
Rs. 720/kg.
Inorganic precursor formulation for membrane (M1-M3) on weight basis:
Raw materials Membrane M1 (Wt. %) Membrane M2 (Wt. %) Membrane M3 (Wt. %)
Fly ash 80 80 70
Quartz 20 10 20
CaCO3 - 10 10
PVA 0.8 0.8 0.8
Cost of one support (22 g
for support)
1000100
720)×22×0.8
+10×22×20+28×22×(80
= Rs. 0.663
1000100
720)×22×0.8+2402210
10×22×10+28×22×(80
= Rs. 1.169
1000100
720)×22×0.8+2402210
10×22×20+28×22×(70
= Rs. 1.130
The currency conversion factor used in all calculations is 1 Rs = 0.015 $
The area of the membrane supports (55 mm diameter and 5 mm thickness) (M1-M3) = 23.736 cm2
Membrane support disc cost
(Rs./cm2) 0.0279 0.0492 0.0476
(A) Membrane support disc
cost ($/m2) 4.1913 7.3876 7.1375
The laboratory ball mill enables for the mixing of raw materials of 20 membrane supports in one run (0.33 h).

264
The laboratory hydraulic press and circular shaped mould are used for pressing of 20 membrane supports in 1 h operation
The hot air oven is used for initial drying at 100 and 200°C of 20 membrane supports in one run (48 h).
The laboratory grade muffle furnace enables the fabrication of 20 membrane supports in one sintering run (17 h).
Silicon Carbide (SiC) abrasive papers 5 used for polishing of 20 membrane supports with time required of (5 h- 2.5 h sonication
time) 2.5 h.
Sonication bath used for cleaning of 20 membrane supports with operation time of 2.5 h.
Manpower requirement = 500 Rs/Day; here working hours 8 h per day
Total manpower requirement is for 10 h [(10×1/8 day) = 1.25 days ] to fabricate 20 membrane supports
(B) Manpower cost= 2
500( / ) 1.25
20 23.746
Rs day days
cm
= 1.31601 Rs/cm2 = 197.4017 $/m2
Electricity tariff charge = 6.45 Rs/kW. h (1 hp = 746 W = 0.746 kW; 1 W = 1 J/s)
Electricity consumed to fabricate 20 membrane supports
(a) Ball mill = 5 hp = 3.73 kW; [(0.33 h×3.73 kW×6.45 (Rs/kW. h))/(20×23.746 cm2)] = 0.01672 Rs/cm2
(Time required for mixing of raw materials for 20 supports = 0.33 h)
(b) Hydraulic press = 2 hp = 1.492 kW; [(1 h×1.492 kW×6.45 (Rs/kW. h))/(20×23.746 cm2)] = 0.02026 Rs/cm2
(Time required to press 20 supports = 1 h)
(c) Hot air oven = 2.5 kW; [(48 h×2.5 kW×6.45 (Rs/kW. h)/(20×23.746 cm2)] = 0.08149 Rs/cm2
(Time consumed for drying of 20 supports at 100 and 200°C = 2 days = 48 h)
(d) Muffle furnace = 4 kW; [(17 h×4 kW×6.45 (Rs/kW. h)/(20×23.746 cm2)] = 0.92352 Rs/cm2
(Sintering time required to fabricate 20 membrane supports = 17 h)
(e) Sonication bath = 85 W= 0.085 kW; [(2.5 h×0.085 kW×6.45 (Rs/kW. h)/(20×23.746 cm2)] = 0.00289 Rs/cm2
(Sonication time to clean 20 membrane supports = 2.5 h)
(C) Total electricity cost (a+b+c+d+e) = 0.01672 + 0.02026 + 0.08149 + 0.92352 + 0.00289
= 1.04488 Rs/cm2 = 156.7317 $/m2
Equipment cost (straight line depreciation method applied for all equipment’s with assumed 10 years of life time for each equipment)

265
(a) Ball mill cost = [(0.33 h×0.64103 Rs/h)/(20×23.746 cm2)] = 0.0004 Rs/cm2
(b) Circular shaped mould cost = [(1 h×0.11218 Rs/h)/(20×23.746 cm2)] = 0.0002 Rs/cm2
(c) Hydraulic press cost = [(1 h×1.60256 Rs/h)/(20×23.746 cm2)] = 0.0034 Rs/cm2
(d) Hot air oven cost = [(48 h×0.64103 Rs/h)/(20×23.746 cm2)] = 0.0648 Rs/cm2
(e) Muffle furnace cost (Programmable) = [(30 h×4.80769 Rs/h)/(20×23.746 cm2)] = 0.3037 Rs/cm2
(f) Ultrasonic bath cost = [(2.5 h×0.40064 Rs/h)/(20×23.746 cm2)] = 0.0021 Rs/cm2
(D) Total equipment consumed cost (a+b+c+d+e+f) = 0.0004+0.0002+0.0034+0.0648+0.3037+0.0021
= 0.3746 Rs/cm2 = 56.1900 $/m2
Miscellaneous cost
(a) 5 SiC abrasive papers required for polishing of 20 membrane supports = 5×8 = Rs 40;
[40 Rs/(20×23.746 cm2)] = 0.0842 Rs/cm2
(b) 3 tissue rolls required for cleaning of ball mill and mould for making of 20 membrane supports= 3×25 = Rs 75;
[75 Rs/(20×23.746 cm2)] = 0.1579 Rs/cm2
(c) 100 ml acetone required for cleaning mould during making of 20 membrane supports =
[(813 Rs ×100 ml )/(2500 ml ×20×23.746 cm2)] = 0.0685 Rs/cm2
(E) Overall miscellaneous cost = (a)+(b)+(c) = 0.0842+0.1579+0.0685= 0.3106 Rs/cm2 = 46.5931 $/m2
(F) Total cost required for Manpower (B) + Electricity (C) + Equipment (D) + Miscellaneous (E) =
= 1.13601 Rs/cm2 + 1.04488 Rs/cm2 + 0.37465 Rs/cm2 + 0.31062 Rs/cm2 = 2.80213 Rs/cm2
= 197.4017 $/m2 + 156.7317 $/m2 + 56.1900 $/m2 + 46.5931 $/m2 = 456.9165 $/m2
Membrane M1 Membrane M2 Membrane M3
The overall fabrication cost of membrane support (Raw
materials cost + Manpower cost + Electricity cost + Equipment
cost + Miscellaneous cost) (Rs/cm2) [(A)+(B)+(C)+(D)+(E)]
2.83003
(3 Rs/cm2)
2.85133
(3 Rs/cm2)
2.84973
(3 Rs/cm2)
The overall fabrication cost of membrane support (Raw
materials cost + Manpower cost + Electricity cost + Equipment
cost + Miscellaneous cost) ($/m2) [(A)+(B)+(C)+(D)+(E)]
461.1078
(462 $/m2)
464.3041
(465 $/m2)
464.054
(465 $/m2)
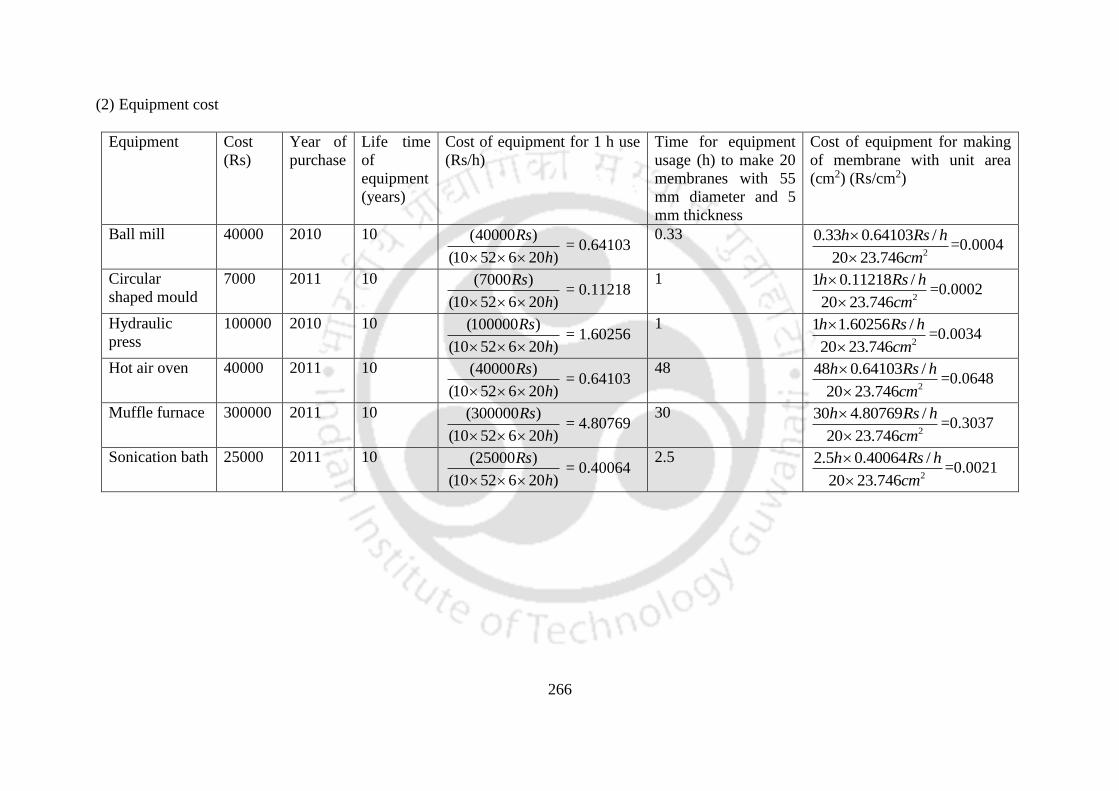
266
(2) Equipment cost
Equipment Cost
(Rs)
Year of
purchase
Life time
of
equipment
(years)
Cost of equipment for 1 h use
(Rs/h)
Time for equipment
usage (h) to make 20
membranes with 55
mm diameter and 5
mm thickness
Cost of equipment for making
of membrane with unit area
(cm2) (Rs/cm2)
Ball mill 40000 2010 10 (40000 )
(10 52 6 20 )
Rs
h = 0.64103
0.33 2
0.33 0.64103 /
20 23.746
h Rs h
cm
=0.0004
Circular
shaped mould
7000 2011 10 (7000 )
(10 52 6 20 )
Rs
h = 0.11218
1 2
1 0.11218 /
20 23.746
h Rs h
cm
=0.0002
Hydraulic
press
100000 2010 10 (100000 )
(10 52 6 20 )
Rs
h = 1.60256
1 2
1 1.60256 /
20 23.746
h Rs h
cm
=0.0034
Hot air oven 40000 2011 10 (40000 )
(10 52 6 20 )
Rs
h = 0.64103
48 2
48 0.64103 /
20 23.746
h Rs h
cm
=0.0648
Muffle furnace 300000 2011 10 (300000 )
(10 52 6 20 )
Rs
h = 4.80769
30 2
30 4.80769 /
20 23.746
h Rs h
cm
=0.3037
Sonication bath 25000 2011 10 (25000 )
(10 52 6 20 )
Rs
h = 0.40064
2.5 2
2.5 0.40064 /
20 23.746
h Rs h
cm
=0.0021

267
(3) Separation cost
Oil-in-water emulsions treatment cost Membrane M1 Membrane M2 Membrane M3
Permeate flux through unit (m2) area of
membrane at applied pressure of 69 kPa and
feed concentration of 200 mg/L
4.15×10⁻⁵
(m3/m2 s)
3.37×10⁻⁵
(m3/m2 s)
4.13×10⁻⁵
(m3/m2 s)
Amount of oil-in-water emulsions processed
per year
310752
(L/Year)
252345.6
(L/Year)
309254.4
(L/Year)
Total direct (fixed) cost [Empty N2 cylinder
cost + dead end flow filtration set up cost)
52 ($/Year) 52 ($/Year) 52 ($/Year)
Operating cost (N2 gas consumable cost per
year for treatment of oil-in-water emulsion by
each membrane)
10 ($/Year) 10 ($/Year) 10 ($/Year)
Membrane cost 462 ($/m2) 465 ($/m2) 465 ($/m2)
Depreciation 66 ($/Year) 67 ($/Year) 67 ($/Year)
Membrane cleaning and maintenance cost (@
3% of total cost of the membrane system)
1.56 ($/Year) 1.56 ($/Year) 1.56 ($/Year)
Labor cost (@ 2% of total cost of the
membrane system)
1.04 ($/Year) 1.04 ($/Year) 1.04 ($/Year)
The overall cost for the treatment of oil-in-
water emulsions ($/Year)
525 ($/Year) 525 ($/year) 525 ($/Year)