Development a picosecond MCP based particle detector · dependences of TTS, gain (G) and...
22
Development a picosecond MCP based particle detector A.Yu. Barnyakov 1,2,3 , M.Yu. Barnyakov 1,2 , V.E. Blinov 1,2,3 , V.S. Bobrovnikov 1,2 , A.V. Bykov 1,2 , V.Ya. Ivanov 1,4 , A.A. Katcin 1,2 , E.V. Mamoshkina 1,2 , I.V. Ovtin 1,2 , K. Petruhin 1,3 , V.G. Prisekin 1,2 , S.G. Pivovarov 1,2,3 , E.E. Pyata 1,2 1 Novosibirsk State University, Novosibirsk, Russia 2 Budker Institute of Nuclear Physics, Novosibirsk, Russia 3 Novosibirsk State Technical University, Novosibirsk, Russia 4 Institute of Computational Technologies, Novosibirsk, Russia Outline • Motivation • Conception • N ph.e. estimation • Tests in magnetic field • Prototyping • Summary
Transcript of Development a picosecond MCP based particle detector · dependences of TTS, gain (G) and...

Development a picosecond MCP based particle detector
A.Yu. Barnyakov1,2,3, M.Yu. Barnyakov1,2, V.E. Blinov1,2,3, V.S. Bobrovnikov1,2, A.V. Bykov1,2, V.Ya. Ivanov1,4, A.A. Katcin1,2, E.V. Mamoshkina1,2, I.V. Ovtin1,2, K. Petruhin1,3, V.G. Prisekin1,2,
S.G. Pivovarov1,2,3, E.E. Pyata1,2 1 Novosibirsk State University, Novosibirsk, Russia
2 Budker Institute of Nuclear Physics, Novosibirsk, Russia3 Novosibirsk State Technical University, Novosibirsk, Russia
4 Institute of Computational Technologies, Novosibirsk, Russia
Outline • Motivation • Conception • Nph.e. estimation • Tests in magnetic field • Prototyping • Summary
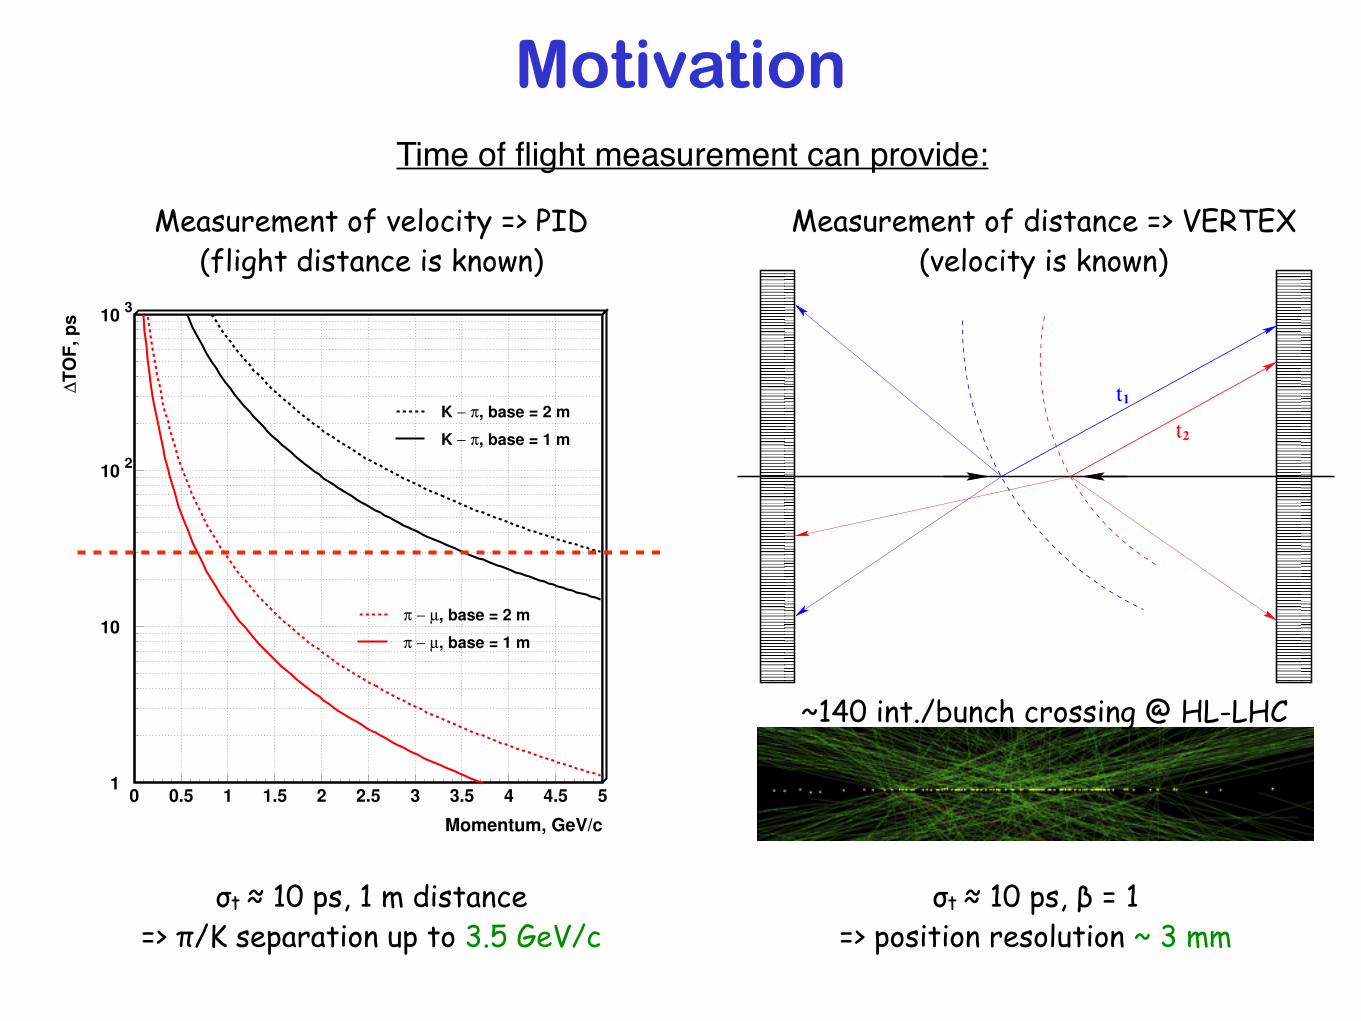
MotivationTime of flight measurement can provide:
Momentum, GeV/c
∆T
OF
, p
s
K − π, base = 1 m
π − µ, base = 1 m
K − π, base = 2 m
π − µ, base = 2 m
1
10
102
103
0 0.5 1 1.5 2 2.5 3 3.5 4 4.5 5
t1t2
Measurement of velocity => PID (flight distance is known)
Measurement of distance => VERTEX (velocity is known)
σt ≈ 10 ps, 1 m distance => π/K separation up to 3.5 GeV/c
σt ≈ 10 ps, β = 1 => position resolution ~ 3 mm
~140 int./bunch crossing @ HL-LHC
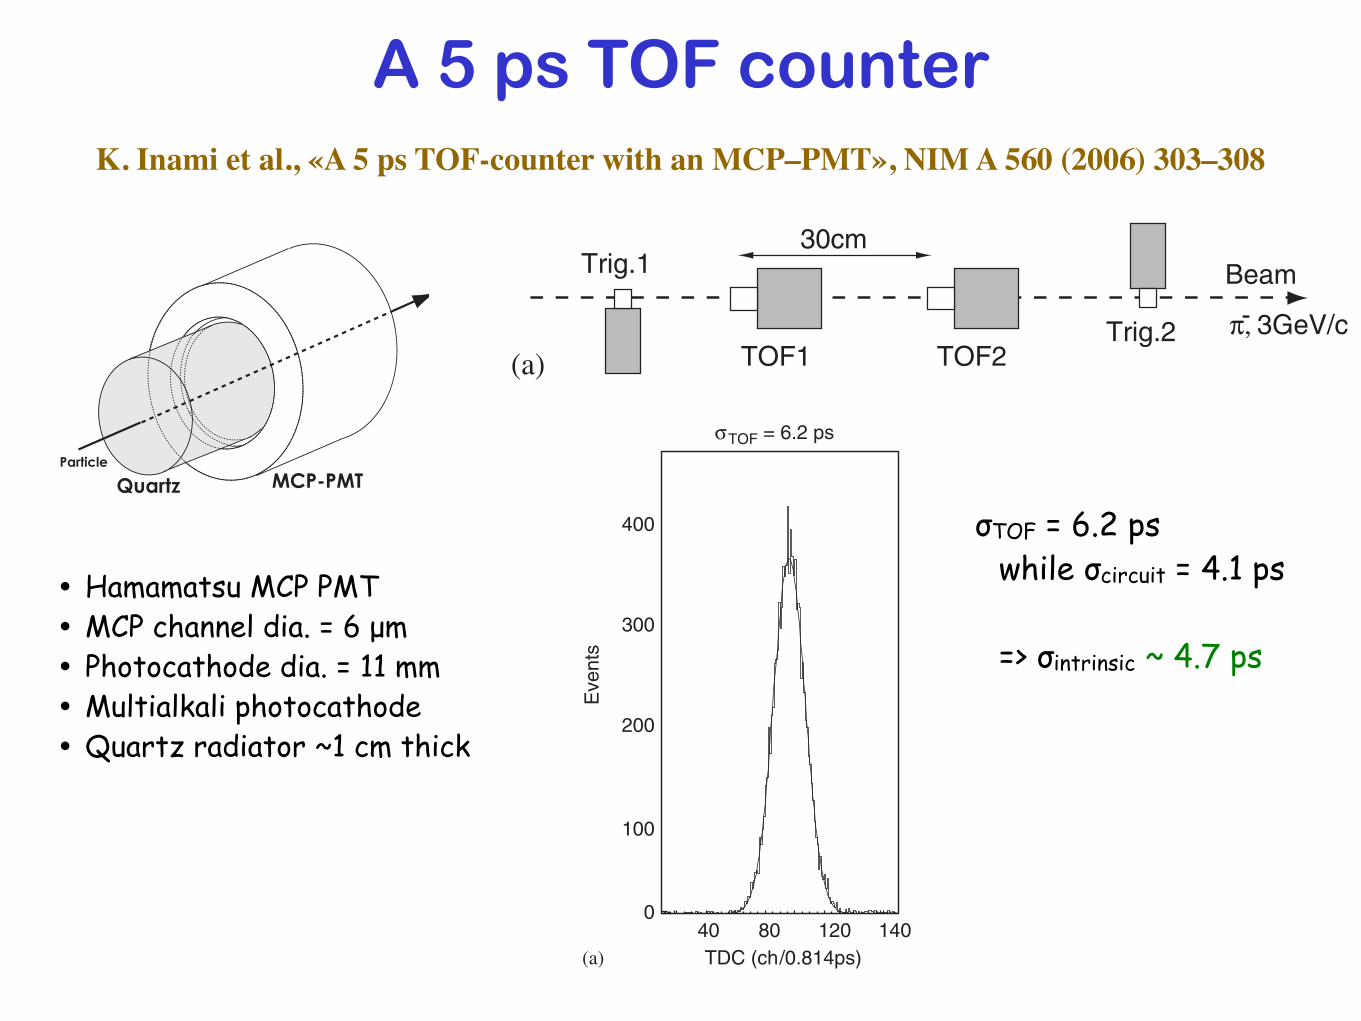
A 5 ps TOF counterK. Inami︎ et al., «A 5 ps TOF-counter with an MCP–PMT», NIM A 560 (2006) 303–308
The best resolution, sTOF ¼ 6:2 ps, was attained with‘ ¼ 13mm, and at ‘413mm sTOF deteriorated with ‘,even though Np:e: increased. This was because the arrivaltime spread of the Cherenkov photons became influentialwith a larger ‘.
4.3. Extra photo-electrons from the first MCP-layer
By irradiating the counters with the pion beam, wesupplied the same high-voltage on both the photo-cathode
and the first MCP layer, so that the photo-electrons fromthe photo-cathode could not be accelerated and, resul-tantly, could not have sufficient energy to producesecondaries even though they arrived at the first MCPlayer. Therefore, the primary photo-electrons emitted fromthe photo-cathode were suppressed, and only the extraphoto-electrons could be detected if they were produceddownstream of the photo-cathode, probably at the firstMCP-layer. Fig. 7 is the observed ADC distribution;Np:e:"1. It suggests that the extra photo-electrons did not
ARTICLE IN PRESS
0
100
200
300
TDC
Eve
nts
40 80 120
100
200
300
400
40 80 120 1400
TDC (ch/0.814ps)
100
200
300
40 80 120 1400
TDC
σTOF = 6.2 ps σTOF = 7.7 ps σcircuit = 4.1 ps
(c)(b)(a)
Fig. 5. TOF resolutions obtained using 3GeV=c pion beams. (a) is with a 10mm-thick quartz radiator and (b) is without a radiator. (c) is the SPC moduleresolution.
2
4
6
8
10
12
14
Beam-test Simulation
100
200
300
20 4010 30 50Quartz thickness (mm)
σ TO
F (
ps)
Np.
e.
counter 1
Simulationcounter 2
0 20 4010 30 50Quartz thickness (mm)
0(b)(a)
Fig. 6. Np:e: and sTOF dependence on the quartz thickness. Closed and open circles are of observed data and by Monte-Carlo simulation.
K. Inami et al. / Nuclear Instruments and Methods in Physics Research A 560 (2006) 303–308306
above were separated by 30 cm along the beam line. Triggercounters with scintillators of 5mmW ! 5mmH ! 10mmt
defined the beam position.The readout electronics was the time-correlated single-
photon counting module (SPC-134), Becker & HicklGmbHs, that exhibits a channel resolution of 813 fs, atime resolution of 4 ps in rms, and repetition rates up to200MHz. Our system was composed of 4 modules, each ofthem comprising constant fraction discriminators (CFD), atime-to-amplitude converter (TAC), an ADC and a multi-channel analyzer (MCA).
The output signals of the TOF counters were directly fedto SPC modules, as illustrated in Fig. 2(b). A coincidencebetween the two trigger counters was prepared to give astop timing signal for the SPCs. We took a differencebetween TDC outputs of the two TOF counters in theanalysis, so that timing fluctuation of the stop signal wasineffective.
3. Performance of MCP–PMT
The performance of HPK6 was measured using single-photons from a light pulser. Figs. 3(a) and (b) show theoutput signals and TDC distribution, respectively. The HV
dependences of TTS, gain (G) and photo-electron collec-tion efficiency (CE) can be seen in (c), (d) and (e),respectively. The HPK6’s used exhibited sTTS ¼ 32233 pswith GX106.HV of 3.4 kV was applied on the both TOF counters
during the beam test.
4. Beam test
4.1. Timing resolutions
Fig. 4(a) shows the output signals of the TOF counterfor 3GeV=c pions. An ADC vs TDC scatter plot is shownin (b): CFD functioned so as to keep the TDC distributionflat regardless of the ADC size.Fig. 5(a) is for the TOF counters with 10mm-thick
quartz radiator, and (b) is without a radiator.Each provided sTOF ¼ 6:2 ps and 7.7 ps, respectively. Fig.5(c) shows the SPC module resolution obtained by feedingthe same signals into the start and stop modules:scircuit ¼ 4:1 ps. The TOF counter therefore exhibitedits intrinsic timing resolution of sTOF ¼ 4:7 ps
(¼ffiffiffiffiffiffiffiffiffiffiffiffiffiffiffiffiffiffiffiffiffiffi6:22 # 4:12
p) with ‘ ¼ 13mm, and 6.5 ps without
radiator (‘ ¼ 3).
4.2. ‘ dependence of sTOF and Np:e:
Np:e: and sTOF were measured by changing the quartzthickness, as plotted in Fig. 6(a) and (b), respectively,where open circles indicate results of a Monte-Carlosimulation. GEANT program was used in the Monte-Carlo simulation to consider interactions of pions with thequartz; Cherenkov radiations by the beam-pions andcharged particles, including d-rays, resulted from GEANTwere next simulated in our program as well as theirpropagation in the quartz and the PMT performance.
Np:e: was evaluated by comparing the signal amplitudesto that of the single-photons. Since HPK6 has a quartzwindow of 3mm-thickness, Np:e: is expected to be $20 at
ARTICLE IN PRESS
Table 1Characteristics of HPK6 and HPK10. Both PMTs are of two-stage typewith the single-anode. The fourth raw indicates the distance from thephoto-cathode to MCP, the thickness of MCP plates, and the distancefrom the MCP to anode
MCP–PMT HPK6 HPK10
Diameter of MCP–PMT (mm) 45f 52f
Diameter of effective size (mm) 11f 25f
Photo-cathode Multi-alkali Multi-alkaliGaps (mm) 2:1=0:03=1:0 1:1=0:03=0:94Da (mm) 6 10a ¼ L=Da 40 43Bias angle (deg) 13 12Max. voltage (kV) 3.6 3.6Voltage-divider ratio 2:4:1 2:4:1Gain 2! 106 4! 105
aD and L are the diameter and length of the MCP plate, respectively,and a ¼ L=D.
Fig. 1. Schematic drawing of the TOF counter.
BeamTrig.1
Trig.2TOF1 TOF2
30cm
Trig.1 Coinc. Discri.Divider
Trig.2
TOF2
TOF1PowerSpliter
Discri.
Discri.Divider
Start Stop
π, 3GeV/c-
SPC-134
(a)
(b)
Fig. 2. (a) Setup of the beam test, and (b) configuration of readoutelectronics.
K. Inami et al. / Nuclear Instruments and Methods in Physics Research A 560 (2006) 303–308304
• Hamamatsu MCP PMT • MCP channel dia. = 6 µm • Photocathode dia. = 11 mm • Multialkali photocathode • Quartz radiator ~1 cm thick
σTOF = 6.2 ps while σcircuit = 4.1 ps
=> σintrinsic ~ 4.7 ps
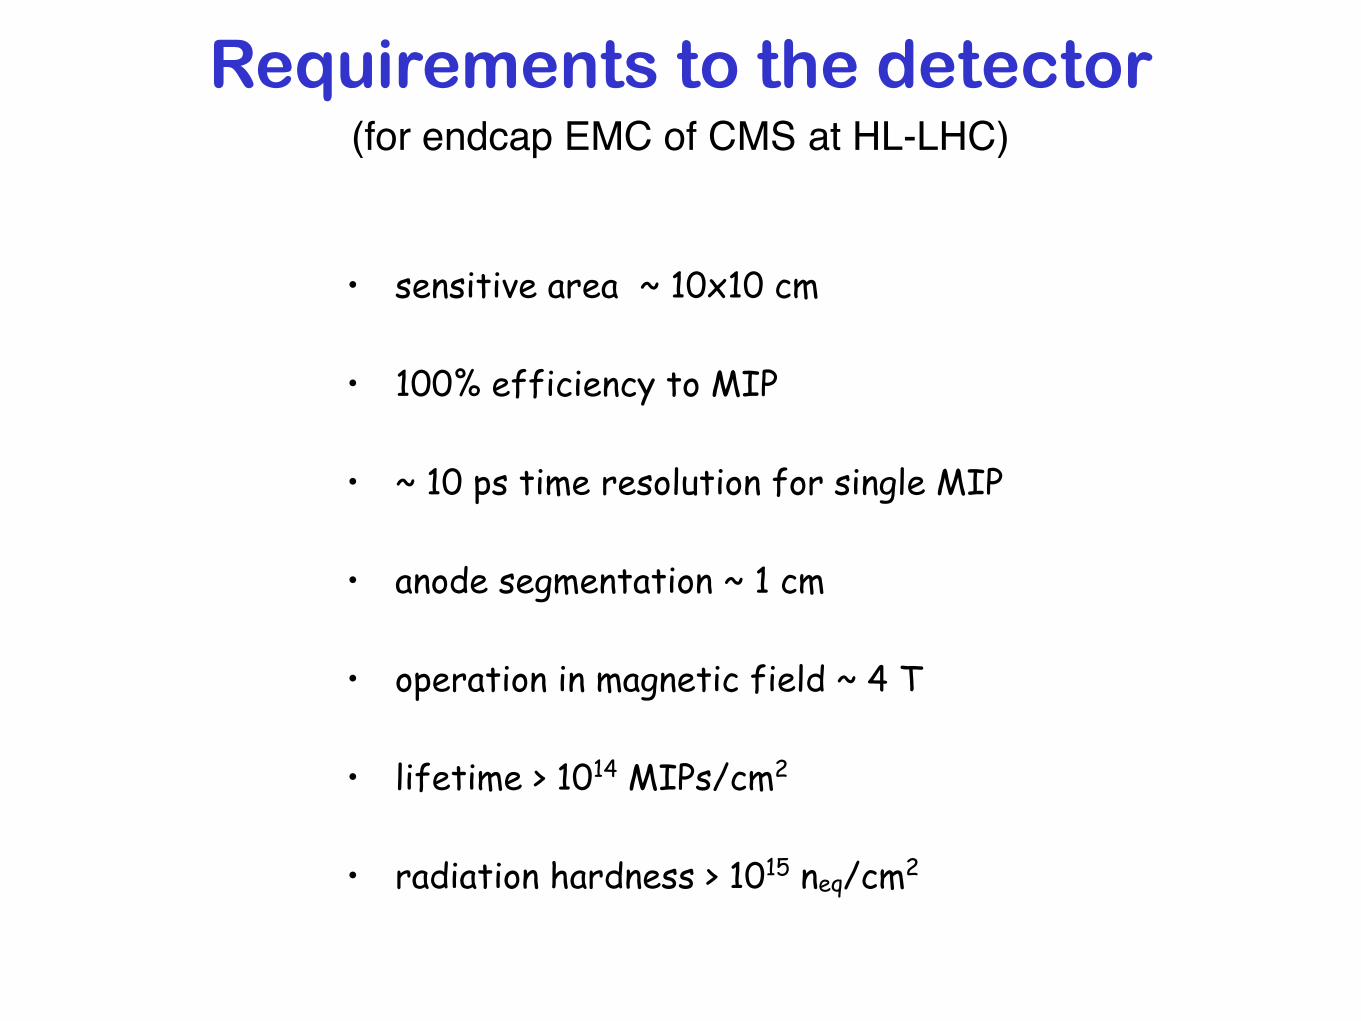
Requirements to the detector
• sensitive area ~ 10x10 cm
• 100% efficiency to MIP
• ~ 10 ps time resolution for single MIP
• anode segmentation ~ 1 cm
• operation in magnetic field ~ 4 T
• lifetime > 1014 MIPs/cm2
• radiation hardness > 1015 neq/cm2
(for endcap EMC of CMS at HL-LHC)
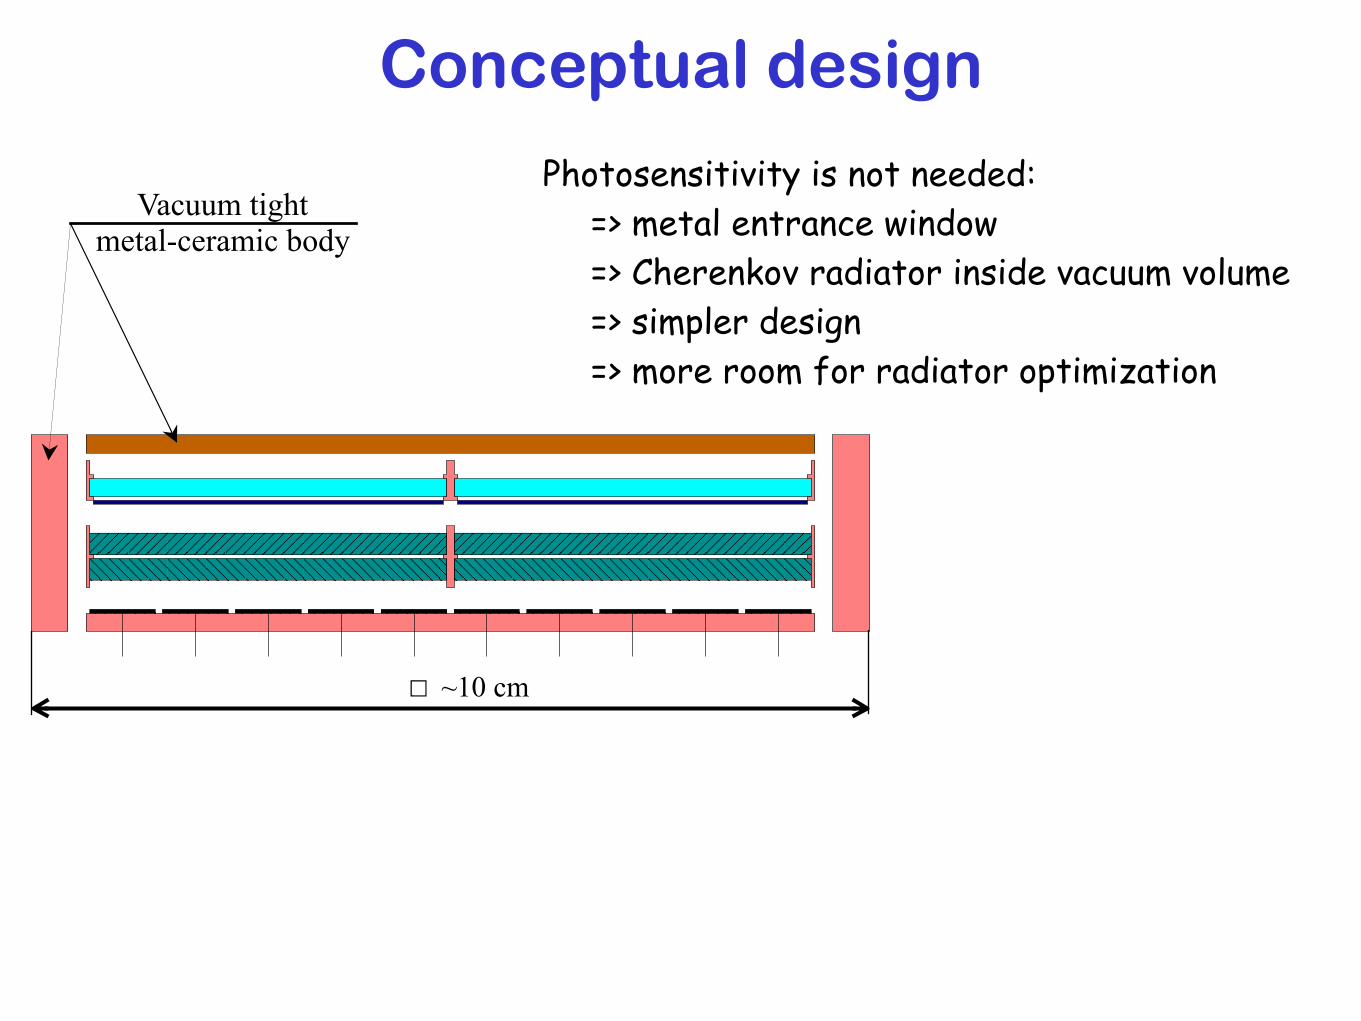
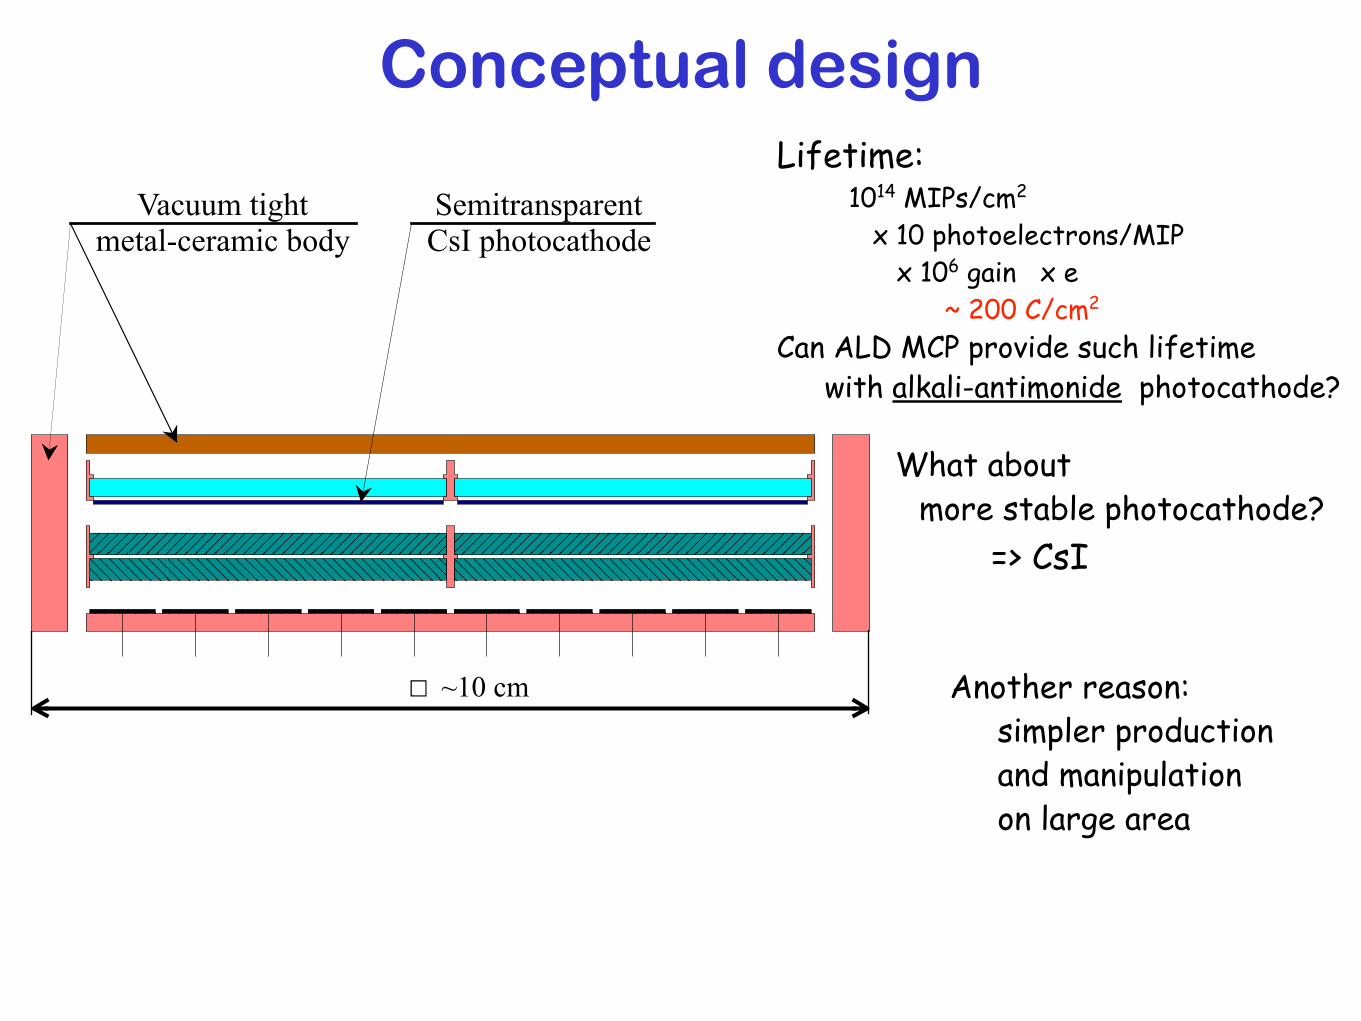
Conceptual design
☐ ~10 cm
Photosensitivity is not needed: => metal entrance window => Cherenkov radiator inside vacuum volume => simpler design => more room for radiator optimization
Vacuum tight metal-ceramic body
Conceptual design
☐ ~10 cm
Lifetime: 1014 MIPs/cm2
x 10 photoelectrons/MIP x 106 gain x e
~ 200 C/cm2 Can ALD MCP provide such lifetime
with alkali-antimonide photocathode?
What about more stable photocathode?
=> CsI
Another reason: simpler production and manipulation on large area
Semitransparent CsI photocathode
Vacuum tight metal-ceramic body
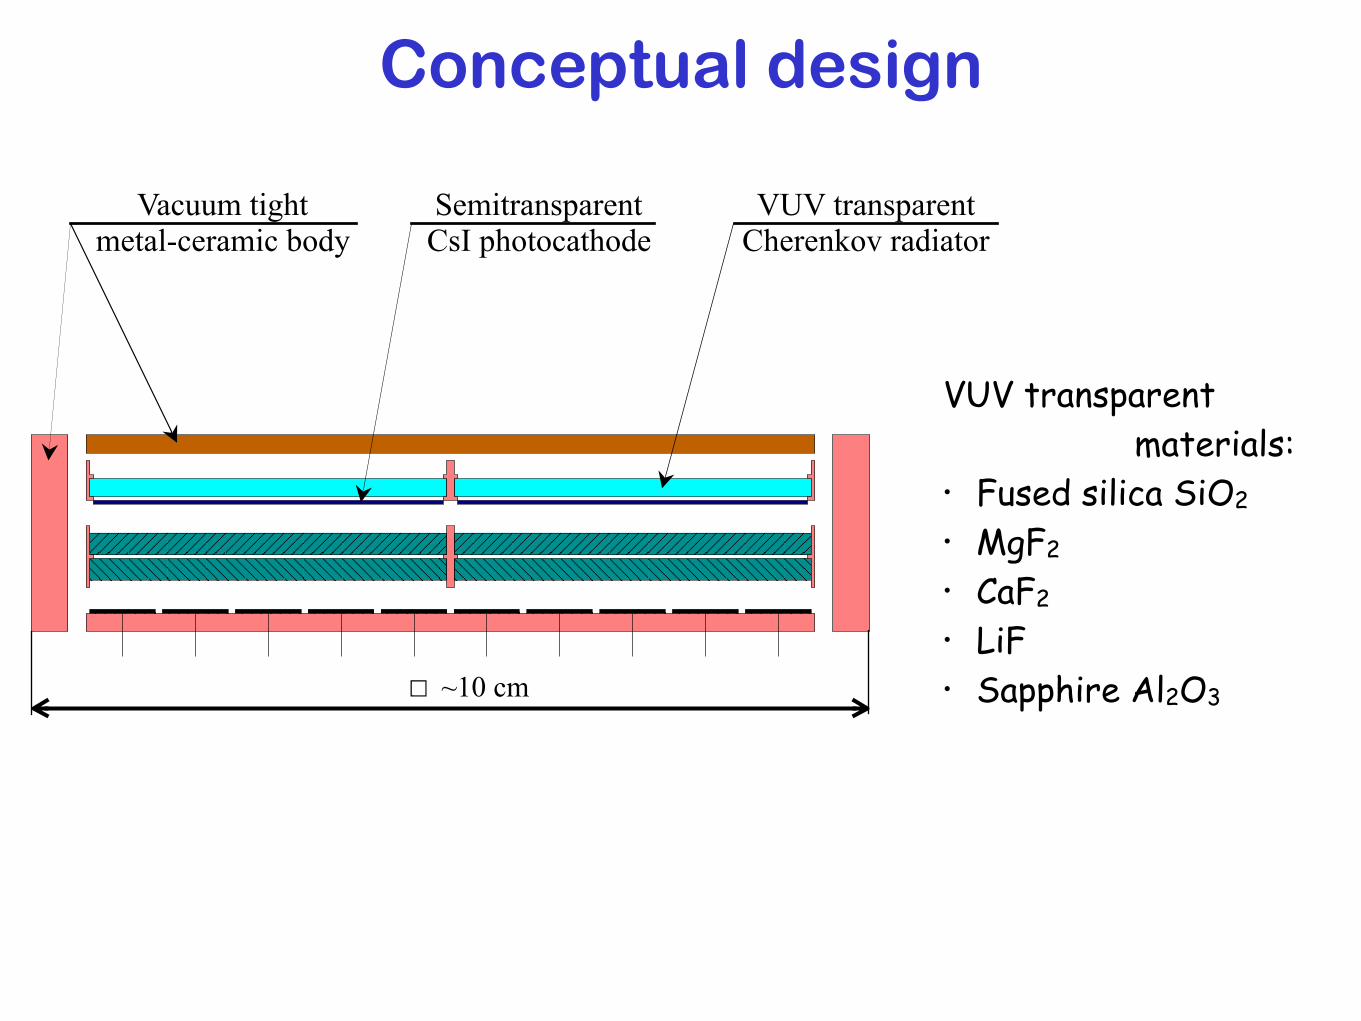
Conceptual design
☐ ~10 cm
VUV transparent materials:
• Fused silica SiO2 • MgF2 • CaF2 • LiF • Sapphire Al2O3
Semitransparent CsI photocathode
Vacuum tight metal-ceramic body
VUV transparent Cherenkov radiator
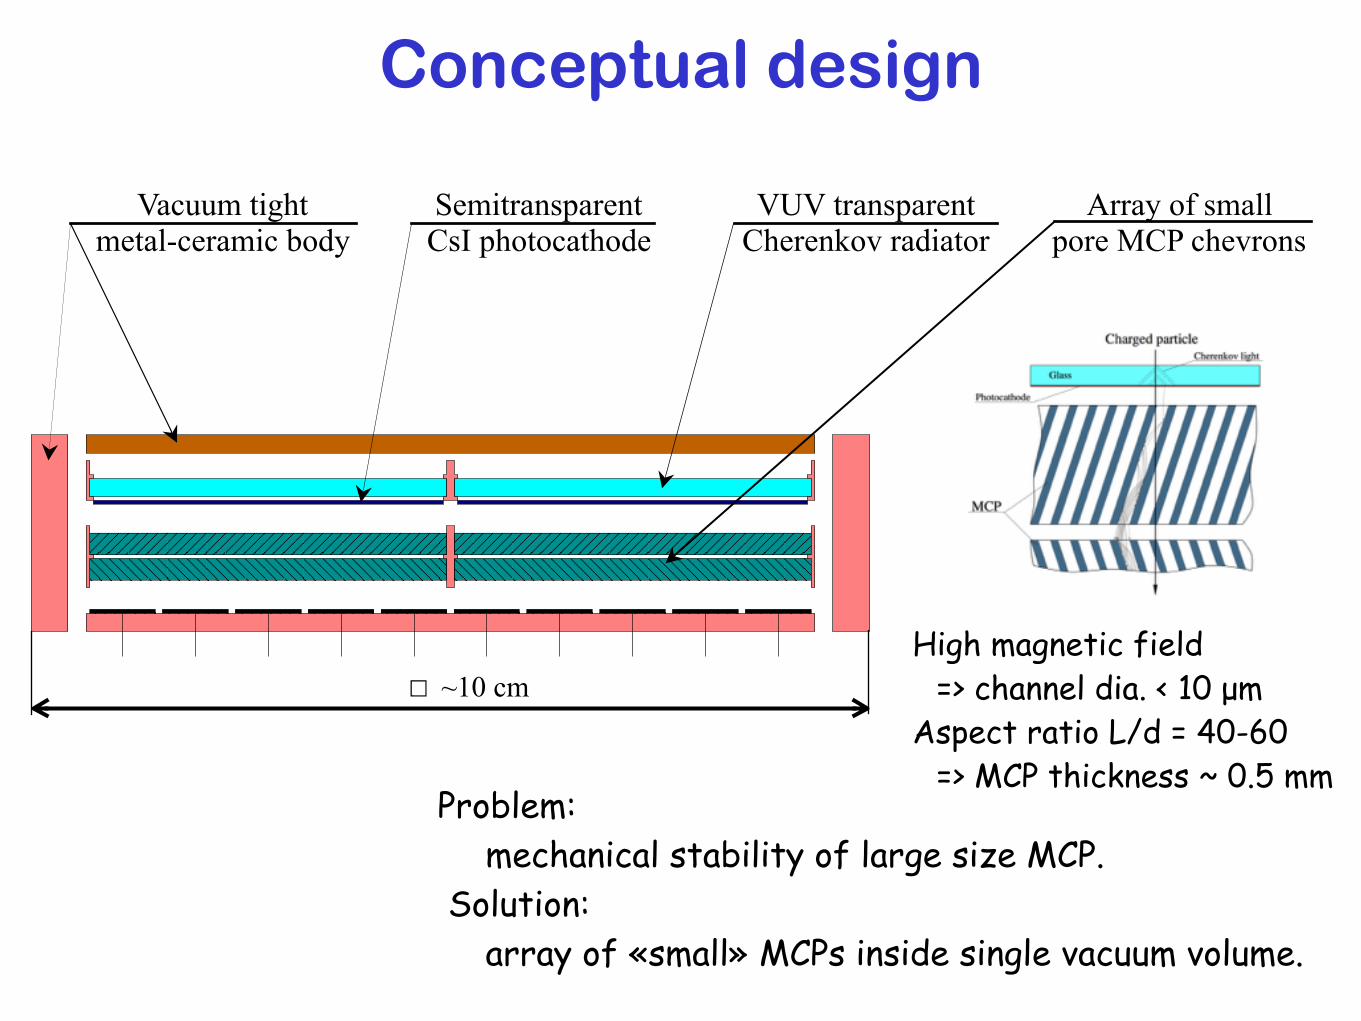
Conceptual design
Semitransparent CsI photocathode
☐ ~10 cm
Vacuum tight metal-ceramic body
VUV transparent Cherenkov radiator
Array of small pore MCP chevrons
High magnetic field => channel dia. < 10 µm
Aspect ratio L/d = 40-60 => MCP thickness ~ 0.5 mm
Problem: mechanical stability of large size MCP.
Solution: array of «small» MCPs inside single vacuum volume.

Conceptual design
Segmented anode
☐ ~10 cm
Semitransparent CsI photocathode
Vacuum tight metal-ceramic body
VUV transparent Cherenkov radiator
Array of small pore MCP chevrons
Anode size should be small enough to avoid degradation of time resolution
~ 1 x 1 cmΔt
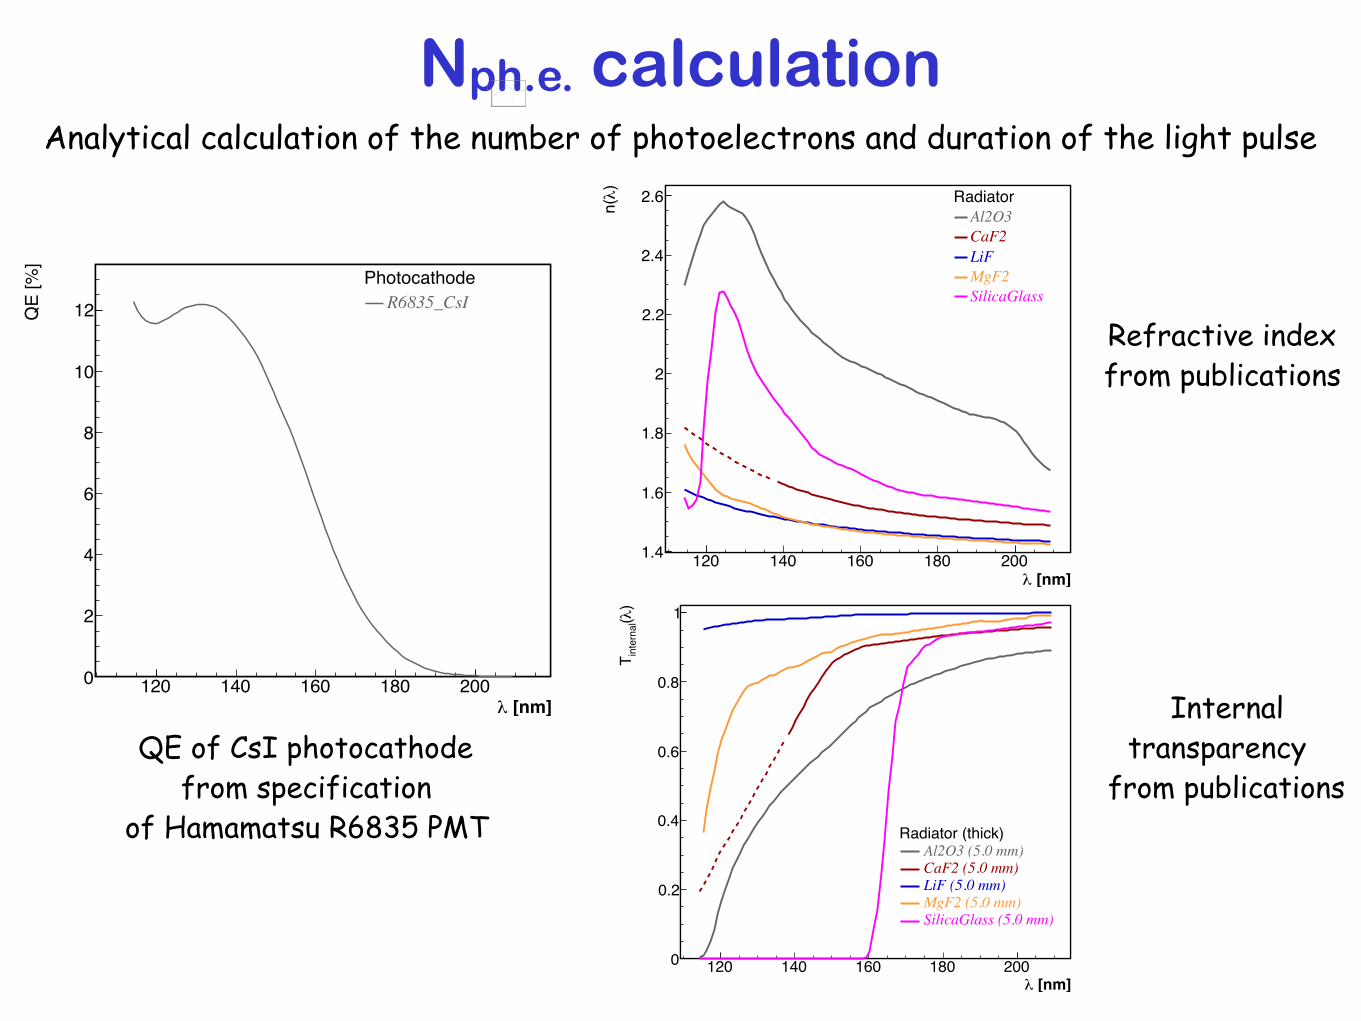
Nph.e. calculation
[nm]λ 60 80 100 120 140 160 180 200 220
)λ
n(
0
0.5
1
1.5
2
2.5
SilicaGlassTanLemonFrenchBachNeurothUSSR GOSTaverage Результаты, толщина радиатора 5 мм
Сравнение внутренней прозрачности Tinternal(�)
[nm]λ 120 140 160 180 200
)λ(
inte
rnal
T
0
0.2
0.4
0.6
0.8
1
Radiator (thick)Al2O3 (5.0 mm)CaF2 (5.0 mm)LiF (5.0 mm)MgF2 (5.0 mm)SilicaGlass (5.0 mm)
Date: 29/08/16 17:23
10 / 20Расчет черенковского света для разных материалов , 114 ÷ 200 нм
N
[nm]λ 60 80 100 120 140 160 180 200 220
)λ
n(
0
0.5
1
1.5
2
2.5
SilicaGlassTanLemonFrenchBachNeurothUSSR GOSTaverage Фотокатод
Полупрозрачный CsI фотокатод от ФЭУ Hamamatsu R6835, для которого естьпаспортные данные в диапазоне � = 114.3÷ 210.0 нм
[nm]λ120 140 160 180 200
QE
[%]
0
2
4
6
8
10
12
PhotocathodeR6835_CsI
Date: 29/08/16 17:28
2 / 20Расчет черенковского света для разных материалов , 114 ÷ 200 нм
N
[nm]λ 60 80 100 120 140 160 180 200 220
)λ
n(
0
0.5
1
1.5
2
2.5
SilicaGlassTanLemonFrenchBachNeurothUSSR GOSTaverage Рассмотренные материалы (радиаторы)
Сравнение показателей преломления, пунктирной линией обозначеноэкстраполирование данных
[nm]λ 120 140 160 180 200
)λ
n(
1.4
1.6
1.8
2
2.2
2.4
2.6 RadiatorAl2O3CaF2LiFMgF2SilicaGlass
Date: 29/08/16 17:28
7 / 20Расчет черенковского света для разных материалов , 114 ÷ 200 нм
N
QE of CsI photocathode from specification
of Hamamatsu R6835 PMT
Analytical calculation of the number of photoelectrons and duration of the light pulse
Refractive index from publications
Internal transparency
from publications
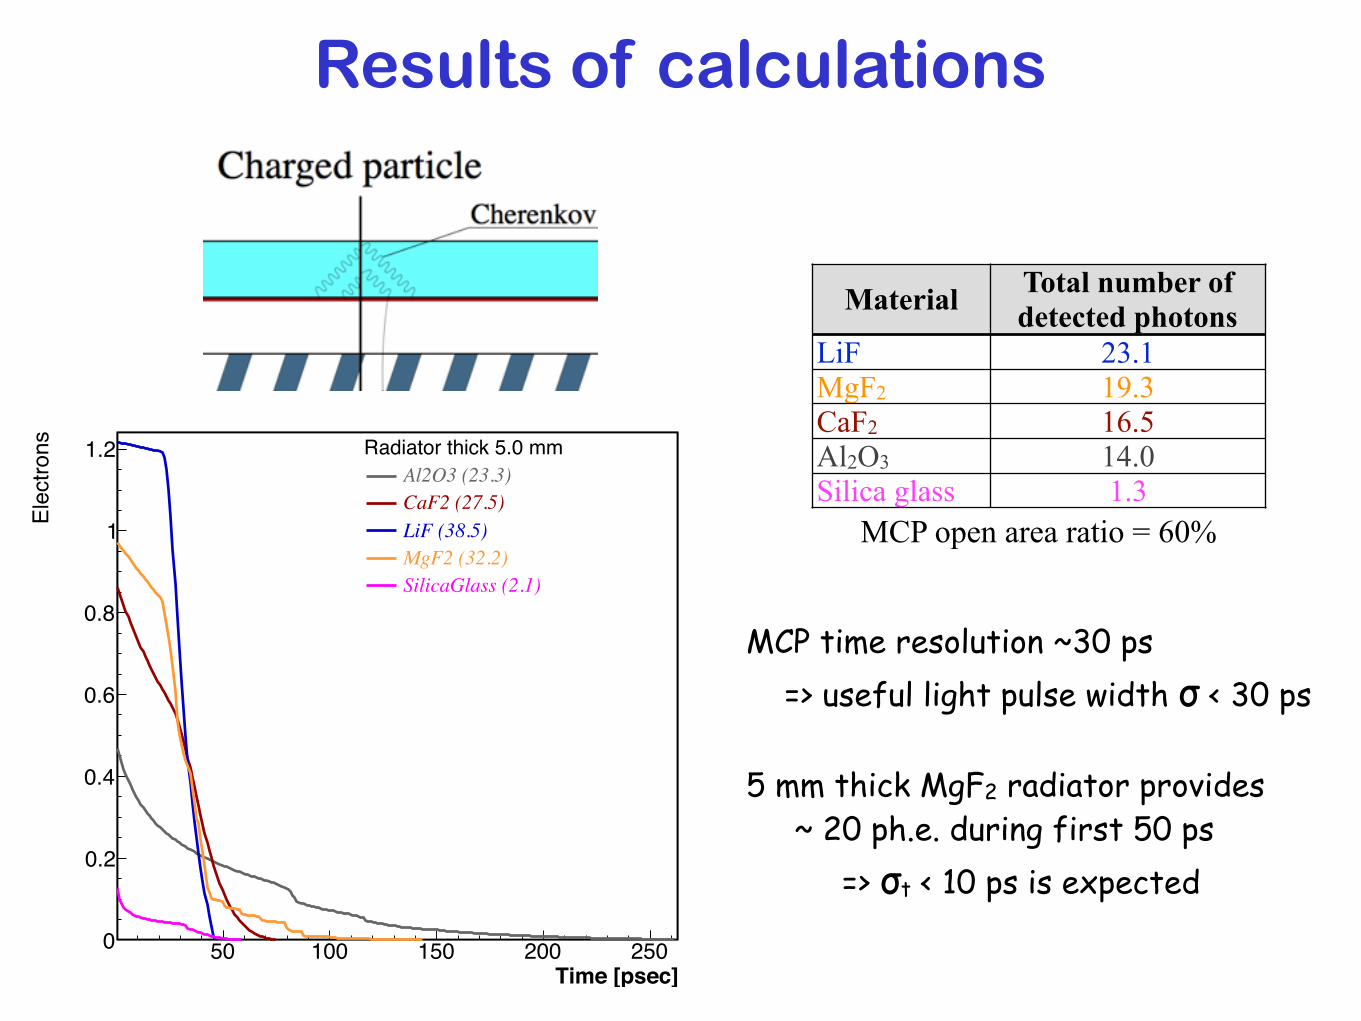
Results of calculations [nm]λ
60 80 100 120 140 160 180 200 220
)λ
n(
0
0.5
1
1.5
2
2.5
SilicaGlassTanLemonFrenchBachNeurothUSSR GOSTaverage Результаты, толщина радиатора 5 мм
Распределение черенковских фотонов по длине волны (слева) и фотоэлектронов повремени прихода (справа)
[nm]λ 120 140 160 180 200
Pho
tons
0
2
4
6
8
10 Radiator thick 5.0 mmAl2O3 (400.1)CaF2 (416.3)LiF (506.4)MgF2 (446.1)SilicaGlass (175.0)
Date: 29/08/16 17:23
Time [psec]50 100 150 200 250
Ele
ctro
ns
0
0.2
0.4
0.6
0.8
1
1.2 Radiator thick 5.0 mmAl2O3 (23.3)CaF2 (27.5)LiF (38.5)MgF2 (32.2)SilicaGlass (2.1)
Date: 29/08/16 17:23
11 / 20Расчет черенковского света для разных материалов , 114 ÷ 200 нм
N
Material Total number of detected photons
LiF 23.1MgF2 19.3CaF2 16.5Al2O3 14.0Silica glass 1.3
MCP open area ratio = 60%
MCP time resolution ~30 ps => useful light pulse width σ < 30 ps
5 mm thick MgF2 radiator provides ~ 20 ph.e. during first 50 ps
=> σt < 10 ps is expected
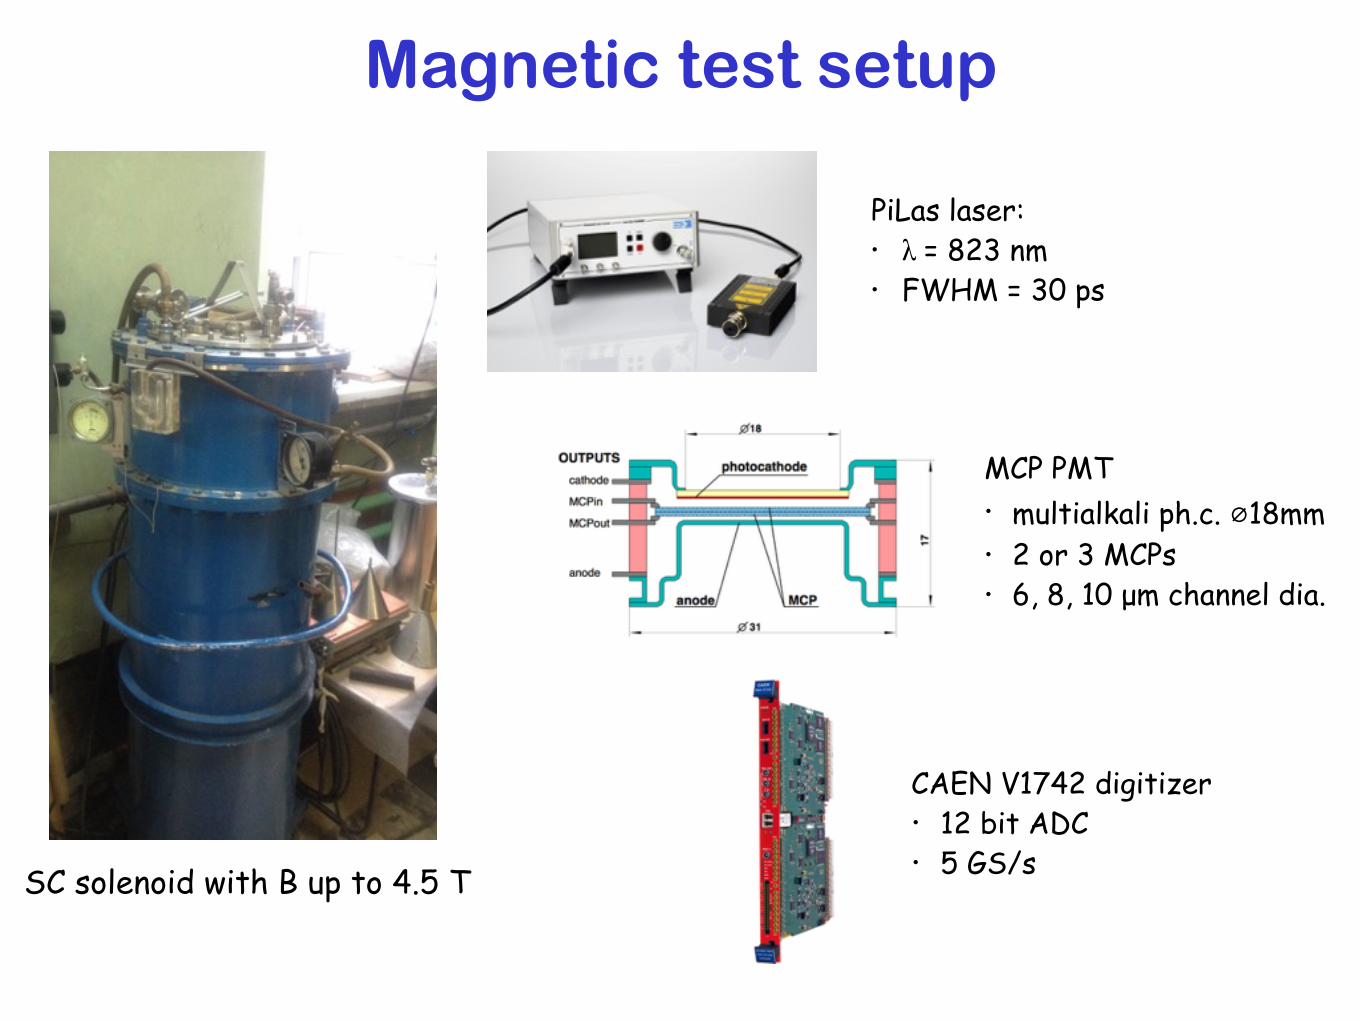
Magnetic test setup
SC solenoid with B up to 4.5 T
PiLas laser: • λ = 823 nm • FWHM = 30 ps
CAEN V1742 digitizer • 12 bit ADC • 5 GS/s
MCP PMT • multialkali ph.c. ⌀18mm • 2 or 3 MCPs • 6, 8, 10 µm channel dia.

Magnetic test results
a Gaussian approximation of the peak in the Δt distribution. Inorder to estimate the intrinsic time resolution of our circuit andthe time restoring procedure we have split one pulse from thegenerator. One part of the signal goes directly to the digitizer in-put, the second part through cable delay, amplifier and attenuatorin the same way as a PMT signal goes to the other digitizer inputchannel. It was found that in this scheme the best time resolutioncould be obtained for pulses with an amplitude bigger than 1000channels of the ADC. Therefore, to minimize the influence of thesignal amplitude on the time resolution measurements in all datataking runs we kept the average amplitude of the PMT signals in arange between 1000 and 2000 ADC channels by proper amplifierand attenuator adjustment.
4. Results
Several exemplars of MCP PMTs with different MCP stage de-signs were tested in magnetic fields up to 4.5 T. All of them wereproduced in Novosibirsk and equipped with multi-alkali photo-cathodes with a diameter of 18 mm. The principal scheme of suchdevices can be found in [4–6]. The following exemplars weretested:
! PMT with two MCPs of 10 μm pore diameter (2MCP 10 μm);! PMT with two MCPs of 8 μm pore diameter (2MCP 8 μm)
! PMT with two MCPs of 6 μm pore diameter (2MCP 6 μm)! PMT with three MCPs of 8 μm pore diameter (3MCP 8 μm)
4.1. Gain
In order to separate effects of an eventual change of the photondetection efficiency in a magnetic field from a change of the gain,we have adjusted the intensity of the light source to provide aprobability of nonzero events
= Σ> >P N N/0 0
at the level of 0.1C0.3. >N 0 and ΣN are the number of nonzeroevents and the total number of triggered events, respectively. Inthis low level, most events with nonzero amplitude are just asingle photoelectron. Assuming a Poissonian distribution of thenumber of photoelectrons, the amplitude (a1pe) of such a singlephotoelectron event could be evaluated from
= · − ( − )Σ
Σ>
>
>a A N N
ln N N/
1 /,pe1 0
0
0
where >A 0 is the mean amplitude of nonzero events. The magneticfield dependency of a1pe corresponds to that of the MCP PMT gain.The high voltage on the PMTs was adjusted in zero magnetic fieldto provide the gain in range ( ÷ ) ×2 5 106.
In Fig. 3 the dependency of the gain on the strength of an axialmagnetic field is presented for different MCPs exemplars. It isshown that in magnetic field of 4 T the gain drops in about
– 4 times for 2MCP 6 μm– 15 times for 2MCP 8 μm– 25 times for 2MCP 10 μm– 80 times for 3MCP 8 μm
4.2. Time resolution
To obtain the time resolution in MCP PMT the same data as forthe evaluation of the gain were used. Subtraction of the electronicsintrinsic time resolution from the measured results is a complextask demanding further and detailed investigations and hence waspostponed for the moment. However, for all the MCP PMT ex-emplars with different design which we have tested in a magneticfield of up to 4.5 T a time resolution σ ≤t 50 ps was obtained.
4.3. Angular dependence
The 2MCP 6 μm tube was tested in a magnetic field under
Time, ns0 50 100 150 200
Ampl
itude
, ch
500
1000
1500
2000
2500
3000
3500
t∆
PiLas sync.
PMT signal
Half
of A
mpl
.
Half of Ampl.
Fig. 1. Digitized signals of the PILAS synchronization and the MCP PMT output.
Fig. 2. An example of the distribution of the measured time differences Δt .
Magnetic Field, T0 0.5 1 1.5 2 2.5 3 3.5 4 4.5
Rela
tive
Gai
n
2−10
1−10
1
mµ2MCP 6 mµ2MCP 8 mµ2MCP 10
mµ3MCP 8
Fig. 3. The relative gain of the different MCP PMTs as a function of magnetic field.
A.Y. Barnyakov et al. / Nuclear Instruments and Methods in Physics Research A 845 (2017) 588–590 589
MCP typeGain degradatin
@ B=4TTwo MCPs 6 µm 4 timesTwo MCPs 8 µm 15 timesTwo MCPs 10 µm 25 timesThree MCPs 8 µm 80 times
A. Yu Barnyakov et al., NIM A845 (2017) 588-590
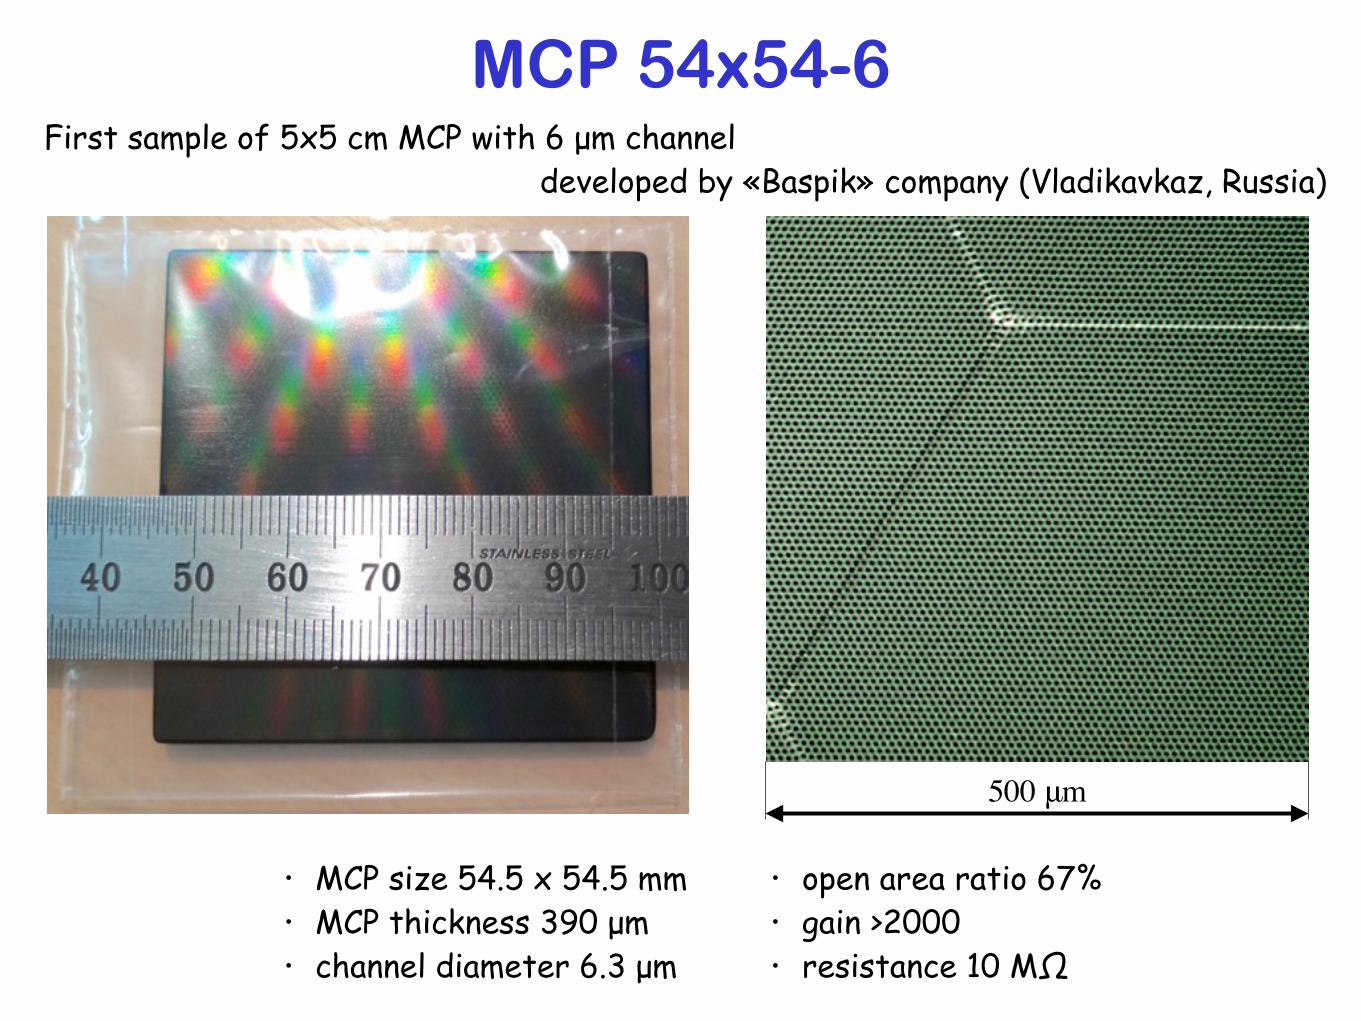
MCP 54x54-6First sample of 5x5 cm MCP with 6 µm channel developed by «Baspik» company (Vladikavkaz, Russia)
500 μm
• MCP size 54.5 x 54.5 mm • MCP thickness 390 µm • channel diameter 6.3 µm
• open area ratio 67% • gain >2000 • resistance 10 MΩ
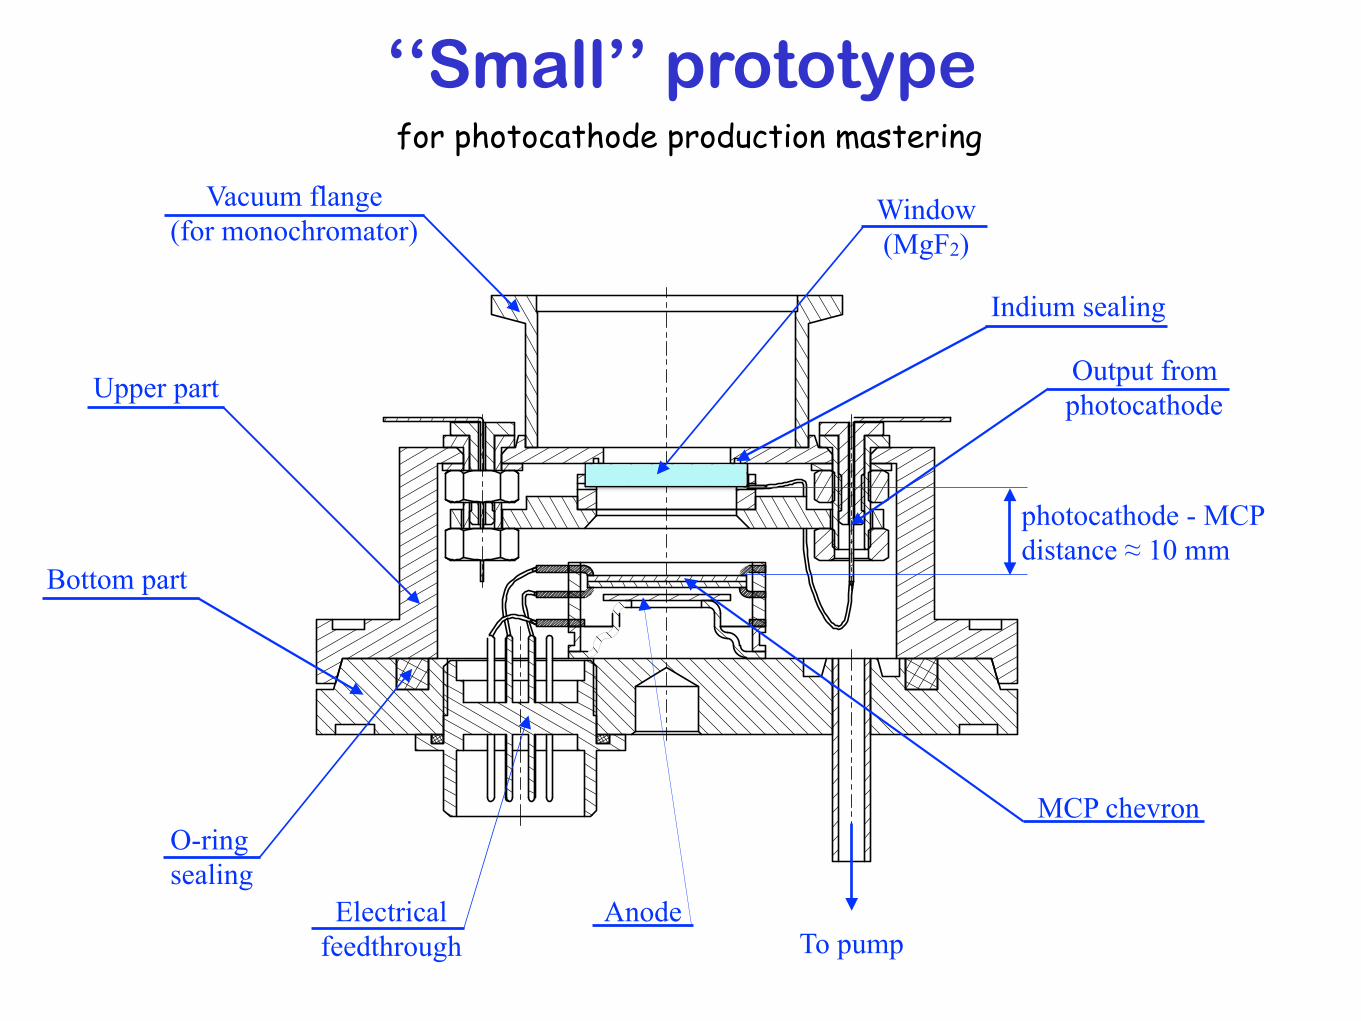
‘‘Small’’ prototype
A-A ( 2 : 1 )
B-B ( 2 : 1 )
A
A
B
B
for photocathode production mastering
O-ring sealing
Electrical feedthrough
MCP chevron
Anode
Output from photocathode
Indium sealing
Window (MgF2)
To pump
Vacuum flange (for monochromator)
Bottom part
Upper part
photocathode - MCP distance ≈ 10 mm
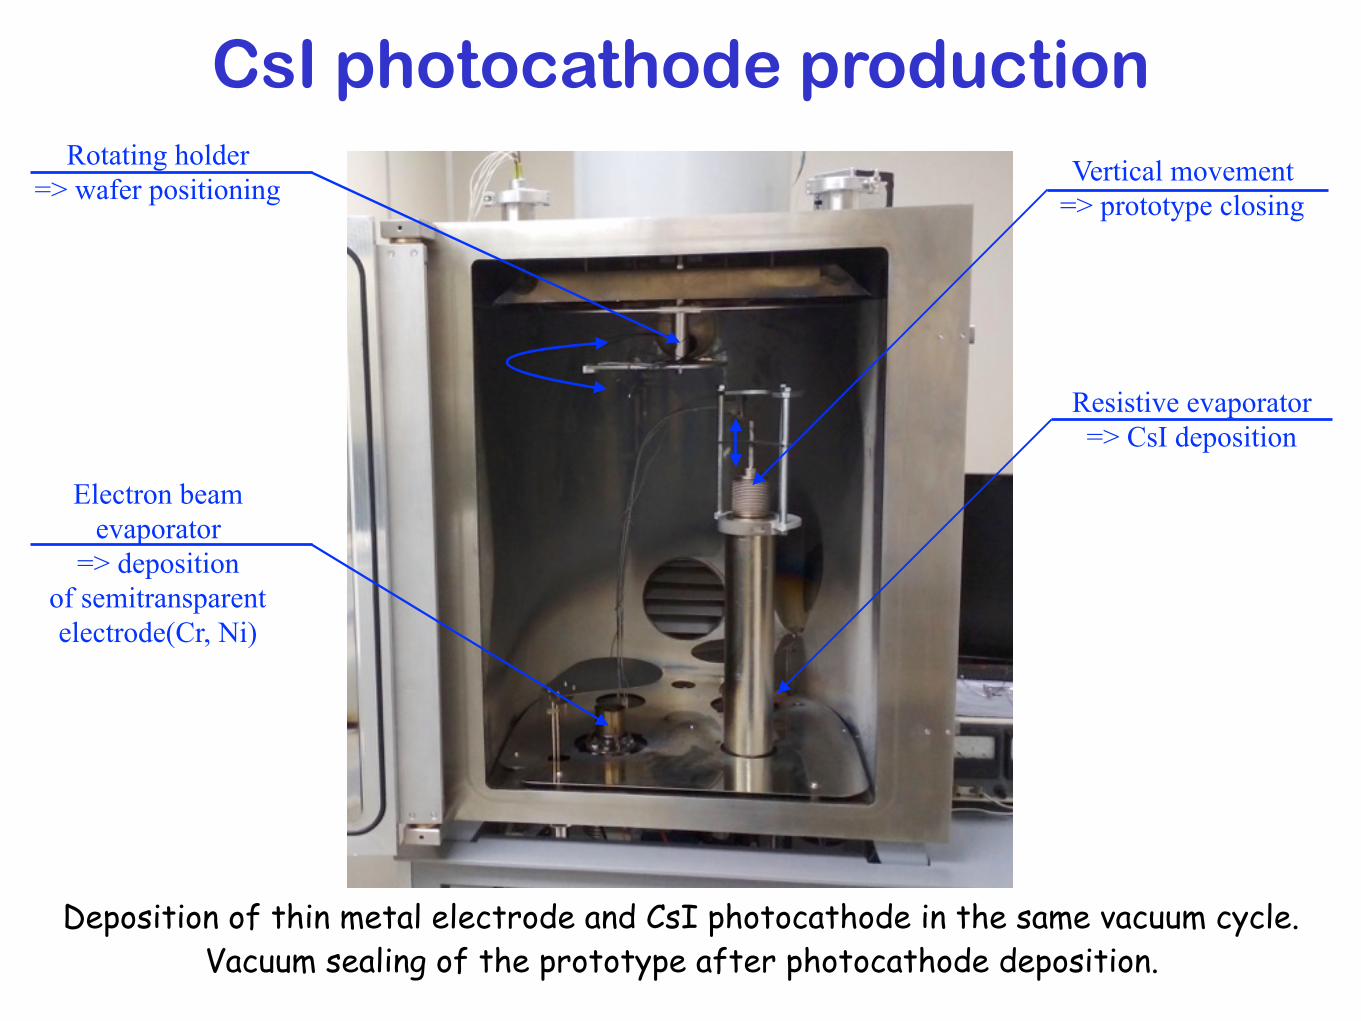
CsI photocathode productionRotating holder
=> wafer positioning Vertical movement => prototype closing
Electron beam evaporator
=> deposition of semitransparent electrode(Cr, Ni)
Resistive evaporator => CsI deposition
Deposition of thin metal electrode and CsI photocathode in the same vacuum cycle. Vacuum sealing of the prototype after photocathode deposition.
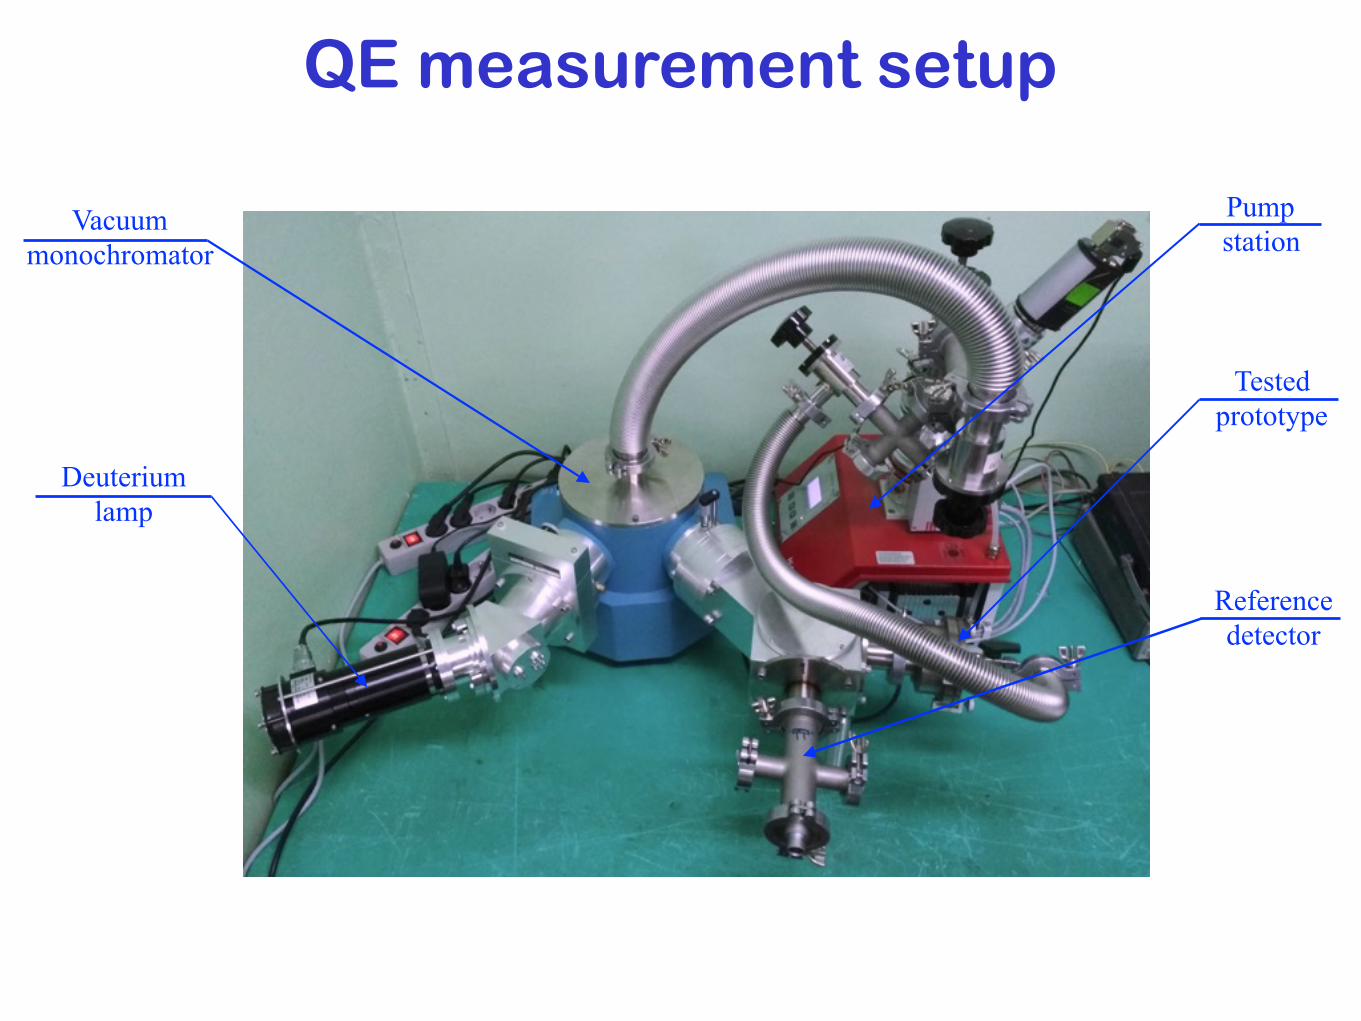
QE measurement setup
Pump station
Tested prototype
Reference detector
Vacuum monochromator
Deuterium lamp
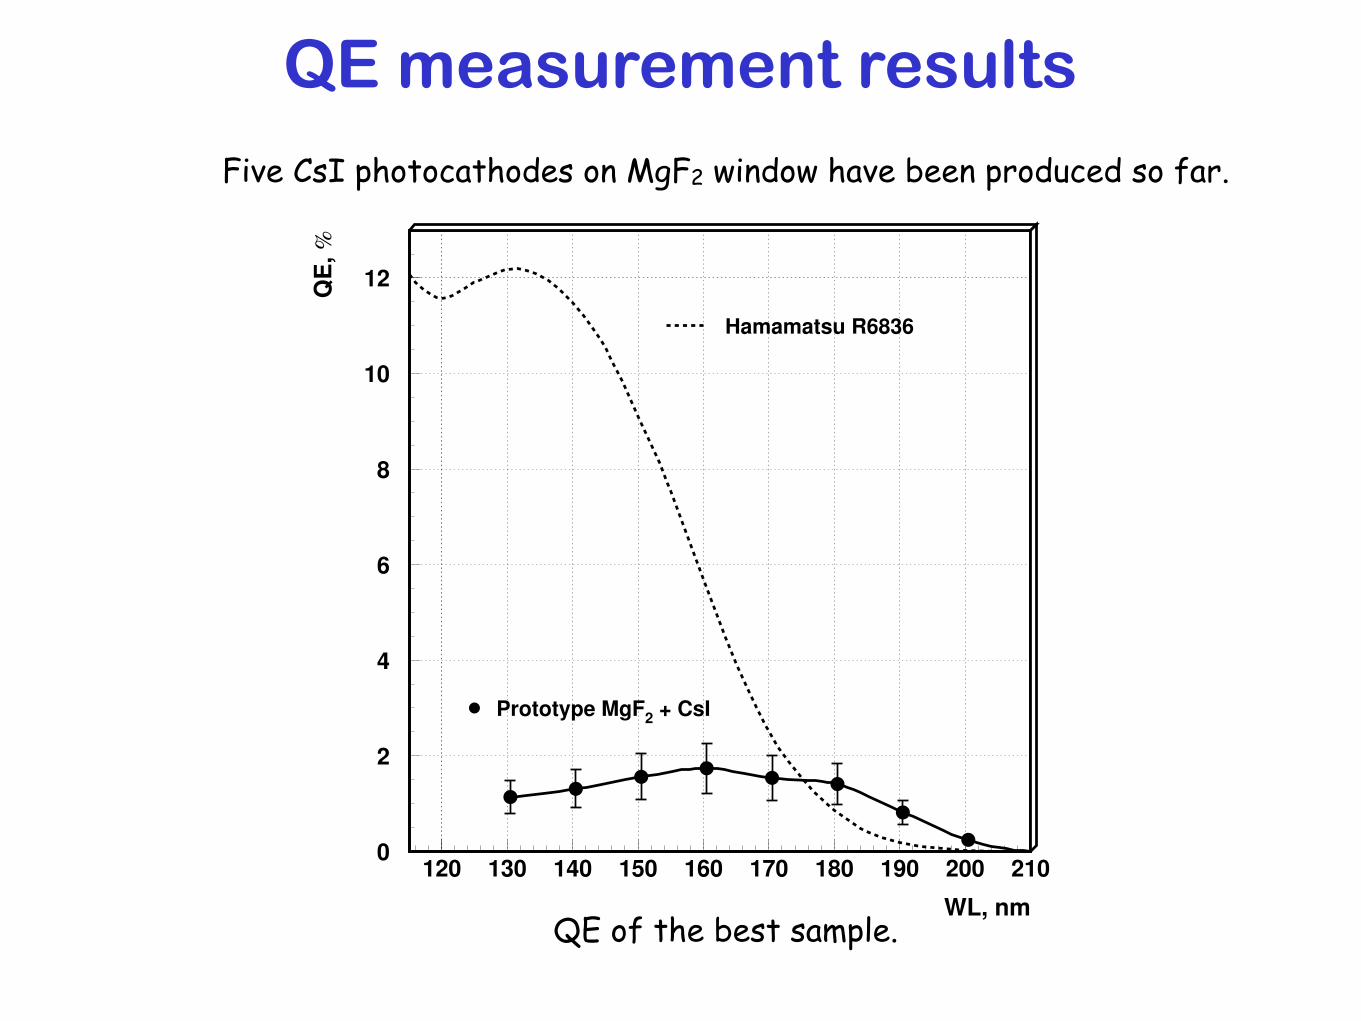
QE measurement results
WL, nm
QE
, %
Prototype MgF2 + CsI
Hamamatsu R6836
0
2
4
6
8
10
12
120 130 140 150 160 170 180 190 200 210
Five CsI photocathodes on MgF2 window have been produced so far.
QE of the best sample.

Beam test setupTrigger counters
Prototype under test
1 GeV e–
CAEN V1742 digitizer

Beam test resultshtemp
Entries 55140Mean 10.89Std Dev 0.5352
/ ndf 2χ 194.6 / 5Constant 51.1± 6515 Mean 0.00± 11.33 Sigma 0.00030± 0.04923
T, ns∆9.5 10 10.5 11 11.5 120
1000
2000
3000
4000
5000
6000
htempEntries 55140Mean 10.89Std Dev 0.5352
/ ndf 2χ 194.6 / 5Constant 51.1± 6515 Mean 0.00± 11.33 Sigma 0.00030± 0.04923
From
MC
P
2Fr
om M
gF
ADC, channels0 200 400 600 800 1000 1200 1400 1600 1800 2000
T, n
s∆
9.5
10
10.5
11
11.5
12
0
500
1000
1500
2000
2500
2From MgF
From MCP
0 500 1000 1500 2000 2500Amplitude
0
100
200
300
400
500
600
700
800
900
1000
Events
Amplitude Time
<Nph.e.> ≈ 0.4
σ ≈ 50 ps
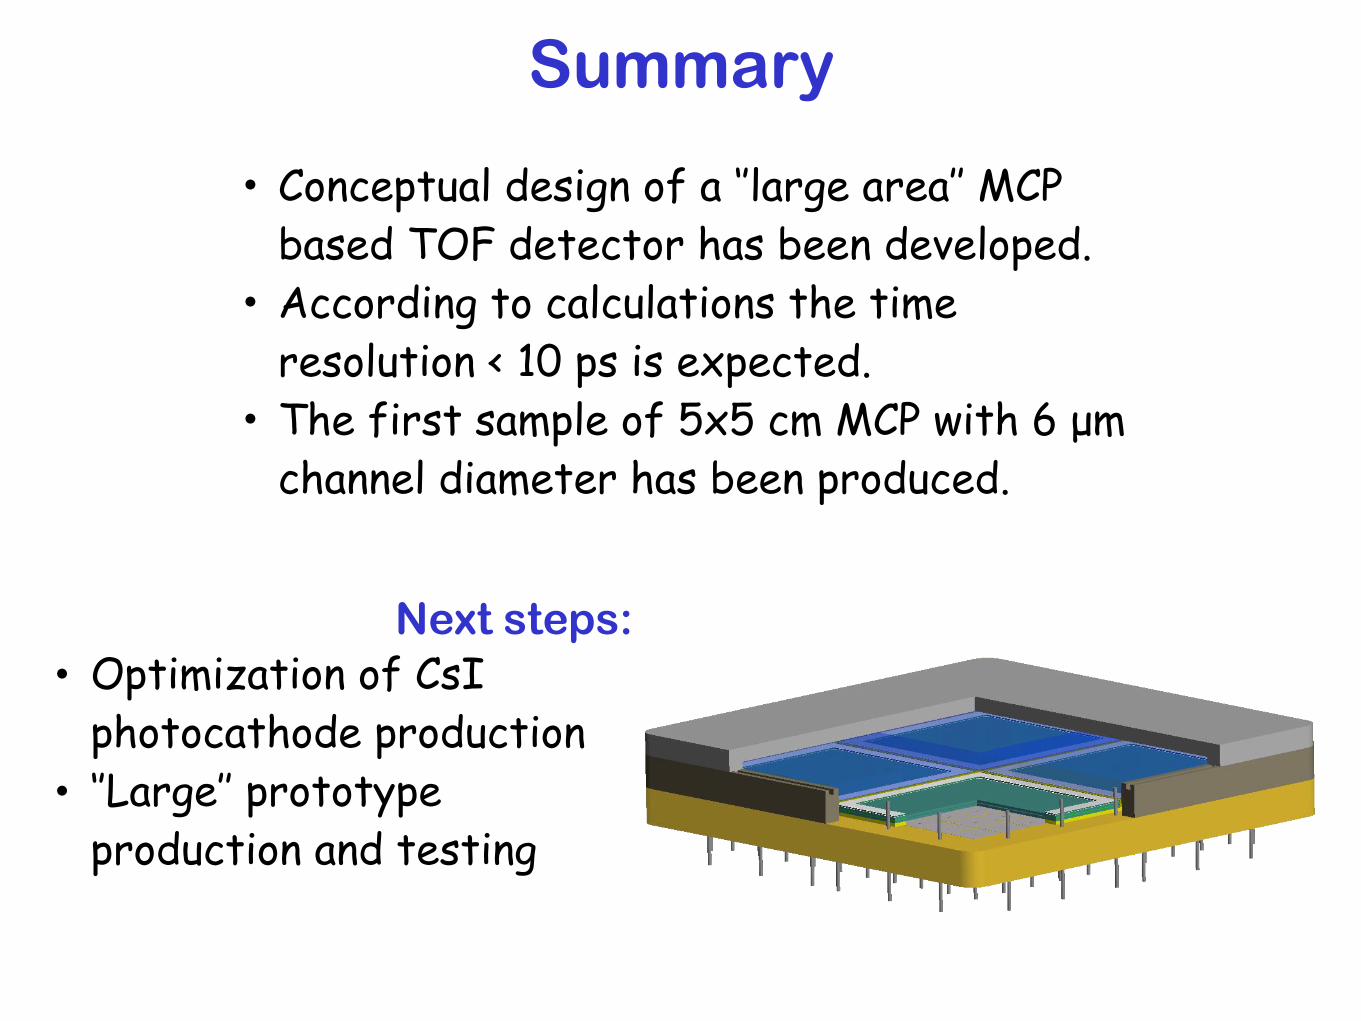
Summary
• Conceptual design of a ‘’large area’’ MCP based TOF detector has been developed.
• According to calculations the time resolution < 10 ps is expected.
• The first sample of 5x5 cm MCP with 6 µm channel diameter has been produced.
Next steps: • Optimization of CsI
photocathode production • ‘’Large’’ prototype
production and testing

Thank you!