Developing the Leuven Embedded Figures Test (L-EFT ... · different levels of processing or...
16
Submitted 20 September 2016 Accepted 4 December 2016 Published 24 January 2017 Corresponding author Lee de-Wit, [email protected] Academic editor Anthony Barnhart Additional Information and Declarations can be found on page 14 DOI 10.7717/peerj.2862 Copyright 2017 De-Wit et al. Distributed under Creative Commons CC-BY 4.0 OPEN ACCESS Developing the Leuven Embedded Figures Test (L-EFT): testing the stimulus features that influence embedding Lee de-Wit 1 ,2 ,3 ,* , Hanne Huygelier 3 ,* , Ruth Van der Hallen 3 , Rebecca Chamberlain 3 and Johan Wagemans 3 1 Institute of Continuing Education, University of Cambridge, Cambridge, United Kingdom 2 Department of Psychology and Language Sciences, University College London, London, United Kingdom 3 Laboratory of Experimental Psychology, Katholieke Universiteit Leuven, Leuven, Belgium * These authors contributed equally to this work. ABSTRACT Background. The Embedded Figures Test (EFT, developed by Witkin and colleagues (1971)) has been used extensively in research on individual differences, particularly in the study of autism spectrum disorder. The EFT was originally conceptualized as a measure of field (in)dependence, but in recent years performance on the EFT has been interpreted as a measure of local versus global perceptual style. Although many have used the EFT to measure perceptual style, relatively few have focused on understanding the stimulus features that cause a shape to become embedded. The primary aim of this work was to investigate the relation between the strength of embedding and perceptual grouping on a group level. Method. New embedded figure stimuli (both targets and contexts) were developed in which stimulus features that may influence perceptual grouping were explicitly manip- ulated. The symmetry, closure and complexity of the target shape were manipulated as well as its good continuation by varying the number of lines from the target that continued into the context. We evaluated the effect of these four stimulus features on target detection in a new embedded figures task (Leuven Embedded Figures Test, L- EFT) in a group of undergraduate psychology students. The results were then replicated in a second experiment using a slightly different version of the task. Results. Stimulus features that influence perceptual grouping, especially good contin- uation and symmetry, clearly affected performance (lower accuracy, slower response times) on the L-EFT. Closure did not yield results in line with our predictions. Discussion. These results show that some stimulus features, which are known to affect perceptual grouping, also influence how effectively a stimulus becomes embedded in different contexts. Whether these results imply that the EFT measures individual differences in perceptual grouping ability must be further investigated. Subjects Psychiatry and Psychology Keywords Perceptual organization, Embedded figures, Field dependence, Perceptual style, Autism, Local global perception, Perceptual grouping, Good continuation, Gestalt How to cite this article De-Wit et al. (2017), Developing the Leuven Embedded Figures Test (L-EFT): testing the stimulus features that influence embedding. PeerJ 5:e2862; DOI 10.7717/peerj.2862
Transcript of Developing the Leuven Embedded Figures Test (L-EFT ... · different levels of processing or...

Submitted 20 September 2016Accepted 4 December 2016Published 24 January 2017
Corresponding authorLee de-Wit,[email protected]
Academic editorAnthony Barnhart
Additional Information andDeclarations can be found onpage 14
DOI 10.7717/peerj.2862
Copyright2017 De-Wit et al.
Distributed underCreative Commons CC-BY 4.0
OPEN ACCESS
Developing the Leuven EmbeddedFigures Test (L-EFT): testing the stimulusfeatures that influence embeddingLee de-Wit1,2,3,*, Hanne Huygelier3,*, Ruth Van der Hallen3, RebeccaChamberlain3 and Johan Wagemans3
1 Institute of Continuing Education, University of Cambridge, Cambridge, United Kingdom2Department of Psychology and Language Sciences, University College London, London, United Kingdom3 Laboratory of Experimental Psychology, Katholieke Universiteit Leuven, Leuven, Belgium*These authors contributed equally to this work.
ABSTRACTBackground. The Embedded Figures Test (EFT, developed by Witkin and colleagues(1971)) has been used extensively in research on individual differences, particularlyin the study of autism spectrum disorder. The EFT was originally conceptualized as ameasure of field (in)dependence, but in recent years performance on the EFT has beeninterpreted as a measure of local versus global perceptual style. Although many haveused the EFT to measure perceptual style, relatively few have focused on understandingthe stimulus features that cause a shape to become embedded. The primary aim of thiswork was to investigate the relation between the strength of embedding and perceptualgrouping on a group level.Method. New embedded figure stimuli (both targets and contexts) were developed inwhich stimulus features that may influence perceptual grouping were explicitly manip-ulated. The symmetry, closure and complexity of the target shape were manipulatedas well as its good continuation by varying the number of lines from the target thatcontinued into the context. We evaluated the effect of these four stimulus features ontarget detection in a new embedded figures task (Leuven Embedded Figures Test, L-EFT) in a group of undergraduate psychology students. The results were then replicatedin a second experiment using a slightly different version of the task.Results. Stimulus features that influence perceptual grouping, especially good contin-uation and symmetry, clearly affected performance (lower accuracy, slower responsetimes) on the L-EFT. Closure did not yield results in line with our predictions.Discussion. These results show that some stimulus features, which are known to affectperceptual grouping, also influence how effectively a stimulus becomes embeddedin different contexts. Whether these results imply that the EFT measures individualdifferences in perceptual grouping ability must be further investigated.
Subjects Psychiatry and PsychologyKeywords Perceptual organization, Embedded figures, Field dependence, Perceptual style,Autism, Local global perception, Perceptual grouping, Good continuation, Gestalt
How to cite this article De-Wit et al. (2017), Developing the Leuven Embedded Figures Test (L-EFT): testing the stimulus features thatinfluence embedding. PeerJ 5:e2862; DOI 10.7717/peerj.2862
INTRODUCTIONVisual processing involves more than mere linear summations of visual input. This partic-ular insight, that the whole is different than the sum of its parts, is one of the key principlesof Gestalt psychology (Wagemans et al., 2012). It has become increasingly clear, however,that whilst this principle constitutes a universal feature of visual information processing,there are also pronounced inter-individual differences (De-Wit & Wagemans, 2015).
These individual differences were first conceptualized byWitkin and colleagues in termsof field dependence and field independence (Witkin et al., 1954). Field dependence refers to acognitive style in which the perception of a local element is influenced by the surroundingcontext, while this is not (or much less) the case in field independence (Goodenough &Witkin, 1977; Witkin et al., 1954; Witkin et al., 1975). The concept of perceptual style wasin part motivated by the observation of individual differences in the rod-and-frame test,in which some observers’ judgements of the orientation of a rod proved to be dependenton the frame surrounding it, whilst some observers could make judgements of the rod’sorientation independent from the frame (Goodenough & Witkin, 1977; Witkin, 1950). Theconstruct of field dependence was then further supported by the observation that observerswho could judge the orientation of the rod independent of the frame were also better atthe Gottschaldt embedded figures (Adevai, Silverman & Gough, 1968; Witkin, 1950).
Later on, Witkin and colleagues developed the Embedded Figures Test (EFT; Witkin etal., 1971) to measure field (in)dependence. In their EFT, participants are required to locateand trace the outline of a target (a simple closed shape) within an embedding context(a larger, more complex line pattern). The simple shape becomes difficult to detect byincorporating it as a part of the embedding context that then constitutes a perceivedwhole. Consequently, the complex line pattern dominates perception and the target shapebecomes hidden or ‘‘embedded’’ within the context (Goodenough & Witkin, 1977).
Witkin’s EFT has been used extensively in research on individual differences insubsequent years, particularly in the study of autism spectrum disorders and often tomeasure local versus global perceptual style (e.g., Jolliffe & Baron-Cohen, 1997; Cribb et al.,2016; Panton, Badcock & Badcock, 2016). Yet, relatively few studies have focused on actuallyunderstanding the stimulus features that drive embedding. Prior toWitkin’s development ofthe EFT as a tool tomeasure individual differences,Gottschaldt (1926)had identified that thefamiliarity of a figure did not influence the extent to which a shape would become effectivelyembedded. Beyond the fact that familiarity had no influence on embedding strength, littleis known about what really causes a ‘part’ to become embedded in a larger ‘whole.’
Visual inspection of Witkin’s embedded figures suggests that target shapes wereembedded within the contexts on the basis of a number of different factors, amongstwhich numerous related to perceptual grouping. For instance, shaded areas were used toevoke grouping of particular regions in a way that could hinder target detection. For otherfigures, target detection was complicated by including parallel lines and/or line repetitionswhich create strong patterns that may dominate perception (and for some shapes may evencreate 3D percepts). Clearly, some aspects of perceptual grouping are involved in stimulusembedding, but perceptual grouping is a broad concept that could be underpinned bymany
De-Wit et al. (2017), PeerJ, DOI 10.7717/peerj.2862 2/16

different levels of processing or perceptual effects (De-Wit & Wagemans, 2015; Wagemanset al., 2012). Furthermore, these potential factors used to embed the target shapes were notexplicitly manipulated nor discussed, and therefore it remains unclear to what extent andin what way different perceptual grouping factors may influence perceived embedding.
There are a wide range of potential visual properties that could influence perceptualgrouping, for example the original work of Wertheimer (1923) proposed factors includingproximity, similarity and good continuation. Later research has confirmed that many ofthe principles first proposed by Wertheimer influence visual detectability. For example,Prinzmetal & Banks (1977) have shown that good continuation can affect visual detection,even with brief presentation of stimuli. Further work has also suggested additional groupingfactors (Wagemans et al., 2012), for instance, mirror symmetry is a factor that has a smallpositive effect on figure-ground segmentation (Machilsen, Pauwels & Wagemans, 2009).Closure has also been proposed as an additional grouping factor (Elder & Zucker, 1993;Kovács & Julesz, 1993), but it is unclear whether closure has an influence beyond proximityand good continuation (Tversky, Geisler & Perry, 2004). So far, it is unclear which, if any,of these factors influence perceptual embedding.
Current studyAlthough research regarding the EFT has traditionally focused on inter-individualdifferences, the primary aim of this work was to design a new embedded figures task(Leuven Embedded Figures Test, L-EFT), in which specific stimulus features were explicitlymanipulated in order to investigate the role of perceptual grouping in embedding on agroup level. With respect to the target, we manipulated a number of factors which, basedon previous research, were expected to influence the detectability of the target. Morespecifically, we manipulated the symmetry and closure of the targets with the predictionthat closed, symmetric shapes would be easier to detect than open, non-symmetric shapes.Additionally, we manipulated the complexity of the target shapes (simply defined as thenumber of lines that make up the target), with the expectation that simple shapes wouldme more easily detected than complex shapes.
With respect to the embedding context, we explored towhat extent the number of lines ofthe target shape that continued into the context would determine the degree of embedding(Fig. 1E). We predicted that, in line with the general principle of good continuation, targetshapes with more lines continued into the context would be more difficult to detect. Thisfactor of good continuation was systematically manipulated across the different targettypes, such that each of the different target types was embedded in four different contextswith progressively increasing number of continued lines. This enabled us to test for theinteraction between target and context embedding effects.
We decided to manipulate these factors within a new computerized version of the EFT,which would more easily enable us to reliably measure reaction time and more easilyquantify accuracy. The format of this task was developed from the Leuven PerceptualOrganization Screening Test (L-POST), using a matching to sample task (see Methods-Procedure) (Torfs et al., 2013). This format was adapted to form a new embedded figurestest, which we will refer to as the Leuven Embedded Figures Test (L-EFT).
De-Wit et al. (2017), PeerJ, DOI 10.7717/peerj.2862 3/16

Figure 1 L-EFT target shapes and embedding contexts with increasing levels of continued lines.
This study involved two separate waves of data collection (Experiment 1 and 2) in twolarge, non-overlapping samples of undergraduate students. Experiment 1 served to testwhich stimulus features would influence item difficulty on a group level, while Experiment2 was conducted to replicate the findings of Experiment 1 with a new dataset and to verifywhether the results would be robust to small changes in the task procedure.
EXPERIMENT 1Materials & methodsParticipantsA sample of 255 undergraduate psychology students participated in this study for coursecredits. All participants were naïve to the purpose of the study. The median age ofsubjects was 19 years (SD= 2.4). The sample was primarily female (87%). All proceduresperformed in this study were in accordance with the ethical standards of the institutionalethical committee and approved by the ethical committee of the KU Leuven university(SMEC approval code: S58409) as well as in accordance with the 1964 Helsinki declaration
De-Wit et al. (2017), PeerJ, DOI 10.7717/peerj.2862 4/16

and its later amendments or comparable ethical standards. Written informed consent foreach participant was obtained prior to testing.
StimuliA total of 16 simple line drawings (targets) were presented which varied in the numberof lines (3, 4, 6 and 8 lines), whether the target was symmetric around its vertical axis(Figs. 1A and 1C vs 1B and 1D) and whether the target formed an open (Figs. 1C and 1D)or closed shape (Figs. 1A and 1B). For each of these target shapes four complex line shapes(embedding contexts) were developed that varied in the number of target lines that werecontinued into the embedding contexts ranging from 0 lines to a maximum that is equal tothe number of target lines (Fig. 1E). This combination of 16 shapes and 4 levels of good (line)continuation resulted in 64 trials. The embedding context always contained the target only atone location. For each trial, two additional contexts where constructed that did not containthe target shape (used as distractors, see Procedure). These distractors had the same numberof lines as the embedding context that contained the target and no rotated or scaled versionsof the target shapes. For some embedding contexts lines crossing the target shapewere added(ranging from 2 to 5 lines), manipulated independently from closure and symmetry. Nocontexts had curved lines and care was taken to ensure that none of the targets or contextswould be perceived as 3D. The size of the contexts was constant. The L-EFT figures werecreated using an open source drawing program (Scribus). The complete stimulus setis made publicly available on Figshare (https://dx.doi.org/10.6084/m9.figshare.3807885,https://dx.doi.org/10.6084/m9.figshare.3807894).
ProcedureThe L-EFT consisted of 64 trials that were presented in a randomized order. For each trial,a matching-to-sample paradigm was used in which the participant was presented with thetarget (above) and three response options (below). Of these three response options, onecontained the target, and two were distractor contexts (Fig. 2). Participants had to choosewhich context contained the target as quickly and accurately as possible by clicking on theresponse alternative using the computer mouse. The stimuli were presented on the screenuntil the participant gave a correct response (no time limit). If they provided a wronganswer, visual feedback was given on their performance (a red square was shown aroundthe chosen, incorrect alternative) and they were prompted to give a new response untilthey provided the correct answer. This procedure was put in place to ensure participantswould be motivated to actively find the target shape prior to providing an answer, reducingthe likelihood of participants randomly guessing to advance through the task. The threeembedding contexts were presented at three fixed locations on the screen and their positionout of these three locations was picked at random. Stimulus presentation and responseregistration were controlled using custom software written in C# developed in VisualStudio. The L-EFT was administered individually to participants in small groups during aone-hour session in quiet and slightly darkened computer rooms on Dell Inspiron desktopcomputers with a 23’’ monitor. Each group consisted of 15 participants on average. TheL-EFT was administered together with two different test batteries during these sessions and
De-Wit et al. (2017), PeerJ, DOI 10.7717/peerj.2862 5/16

Figure 2 Matching-to-sample task with three response alternatives.
the order of presentation was counterbalanced with these two test batteries. The L-EFTtakes about 10 min to complete.
Data analysisFor each trial the participant was prompted to provide a new response when their previousresponse was incorrect, up until the point a correct answer was provided. However, for thedata analyses, only the accuracy and response times of the first response on each trial wereused. A mixed model logistic regression was used to predict accuracy data on each trialtaking into account a chance level of .33. All models were estimated with the R packagelme4 (Bates et al., 2014; R Core Team, 2016). The 99% confidence interval of the odds ratiowere estimated as a measure of effect size. An odds ratio equal to 1 indicates no effect.Effects were evaluated against an alpha level of .01.
ResultsOutliersOn average, participants performed highly accurately on this task (M = .86, SD= 0.08),taking 2.4 s to correctly detect the target (SD= 6.54). None of the participants had morethan 15% ‘‘fast errors’’, defined as inaccurate trials for which the respondent answeredwithin 1.5 s. Additionally, no subjects performed below chance level (<.33). Therefore, noparticipants were excluded, and data analyses was performed on the entire sample.
Speed-accuracy trade-offThere was a moderate speed-accuracy trade-off, r(253)= .39, p< .001, 95% CI [.28,.49].Therefore, statistical analyses were performed on accuracy and on response times foraccurate trials.
De-Wit et al. (2017), PeerJ, DOI 10.7717/peerj.2862 6/16

Table 1 Regression analysis (N = 255).
Predictors Accuracy Log transformed response times
Estimate Z P Odds Ratio 99% CI Estimate T P
Intercept 1.64 20.45 <.001 [4.18, 6.31] 3.54 518.0 <.001Target lines 0.73 17.00 <.001 [1.86, 2.32] −0.06 −24.4 <.001Continued lines −1.70 −25.43 <.001 [0.15, 0.22] 0.22 52.4 <.001Closurea −0.10 −1.47 .14 [0.77, 1.07] −0.04 −10.0 <.001Symmetryb 0.35 5.40 <.001 [1.20, 1.68] −0.03 −6.0 <.001Target lines× Continued lines 0.33 8.76 <.001 [1.27, 1.54] −0.05 −17.0 <.001Closure× Continued lines 0.18 2.86 .00 [1.02, 1.40] −0.02 −4.7 <.001Symmetry× Continued lines −0.14 −2.26 .02 [0.74, 1.02] −0.01 −1.9 .06
Notes.Number of target lines and number of continued lines were standardized. Due to this procedure the odds ratio can be interpreted as a measure of effect size independent of mea-surement scale.
aClosed shapes= 1, open shapes= 0.bSymmetry= 1, asymmetry= 0.
Effect of stimulus featuresThe logistic regression model for accuracy and the linear regression model for responsetimes that were tested, included the fixed effects of the number of target lines, closure,symmetry and the number of continued lines. Additionally, the pairwise interactionsbetween the number of continued lines and the other predictors were included in themodel. Furthermore, a random intercept for participants was included. For responsetimes, the data were logarithmically transformed to correct for a positive skew. The resultsof the logistic and linear regression are reported in Table 1.
For accuracy, there was a significant effect of number of target lines, number of continuedlines, and symmetry. Accuracy was higher for symmetric shapes, shapes consisting of morelines, and for contexts with fewer continued lines. There was also an interaction betweenthe number of continued lines and target lines, and an interaction between the number ofcontinued lines and closure. The significant interaction between continued lines and targetlines indicates that the effect of continued lines was weaker for target shapes that weremade up of more lines. The main effect of closure and the interaction between continuedlines and symmetry were not significant.
The analysis on response times mostly mirrored the accuracy results: a stimulus featurethat increased accuracy also resulted in faster response times for target detection. However,for the effect of closure the results of response times were inconsistent with the observedtrend for accuracy: response times were significantly faster for closed shapes in comparisonto open shapes, while accuracy was slightly lower for closed shapes than open shapes. Theinteraction of number of target lines and the number of continued lines for accuracy andmedian response times on accurate trials are visualized in Fig. 3.
DiscussionThe L-EFT figures were designed to test how particular features of a target shape (closure,symmetry and complexity) and embedding context (the number of continued lines)influence task difficulty. The results supported the notion that symmetry made a target
De-Wit et al. (2017), PeerJ, DOI 10.7717/peerj.2862 7/16

Figure 3 The interaction of number of target lines and the number of continued lines for accuracy andmedian response times on accurate trials. The shaded area represents half a standard deviation.
easier to find (or more difficult to embed). There was also a very clear influence ofthe number of continued lines, such that targets with more lines continued into theembedding context were harder to find. This clearly supports the idea that the goodcontinuation between the target and its context is an important factor in influencing thestrength of the perceptual embedding. The effect of target complexity—operationalized asan increasing number of target lines—did not affect performance in the expected direction.That is, shapes with more target lines were easier to detect. This could be because a shapewith more target lines is a more unique occurrence in the embedding context, thereforeenhancing the likelihood of target detection.
The results also indicated that the influence of good continuation interacted with some ofthe stimulus features of the figure. The interaction between the number of continued linesand the number of target lines shows that accuracy mostly depended on the proportion oftarget lines that are continued into the context (see Fig. 3). Additionally, the interaction ofthe number of continued lines and closure was significant. One could argue that the ‘‘goodGestalt’’ of a closed shape rendered it less susceptible to the influence of continued lines, butthis interpretation is hard to reconcile with the fact that symmetric shapes (which shouldalso form a good Gestalt) did not render these shapes less susceptible to the manipulationof continued lines and with the absence of a main effect of closed target shapes (whichsuggests that closed shapes were no better Gestalt compared to open shapes within thisL-EFT stimulus set).
De-Wit et al. (2017), PeerJ, DOI 10.7717/peerj.2862 8/16

EXPERIMENT 2Experiment 2 aimed to replicate the results of Experiment 1 and to optimize certain taskfeatures of the L-EFT. More specifically, a time limit was introduced for each trial toincrease the task difficulty and reduce the speed-accuracy trade-off.
Materials & methodsParticipantsA sample of 188 undergraduate psychology students participated in this study for coursecredits. All participants were naïve to the purpose of the study. None of the participantsparticipated in Experiment 1. The median age of subjects was 18 years (SD= 1.99). Thesample was primarily female (79%). All procedures performed in this study were inaccordance with the ethical standards of the institutional ethical committee and approvedby the ethical committee of the KU Leuven university (SMEC approval code: S58409)as well as in accordance with the 1964 Helsinki declaration and its later amendments orcomparable ethical standards. Written informed consent for each participant was obtainedprior to testing.
StimuliThe same target and context shapes as in Experiment 1 were used.
ProcedureThe task procedure of the L-EFT was slightly altered compared to the L-EFT versionused in Experiment 1. All 64 figures were presented twice in a randomized order (128trials). Subjects were asked to provide one answer and were not given the opportunityto change their initial response. No response feedback was provided. A forced choicematching-to-sample paradigm was used, similar to Experiment 1, but the target and thethree response alternatives were only presented for a limited duration (3 s). The stimuluspresentation and response registration were controlled using custom software written inPython using PsychoPy (Peirce, 2007).
Data analysisTo evaluate whether the results of Experiment 1 could be replicated, the same analyses asin Experiment 1 were performed. In line with the changes made to the task procedure, theaccuracy and response times of the first and only response of the participant for each trialwas taken into account.
ResultsOutliersOn average, participants were highly accurate on this task (M = .82, SD= 0.06), taking2.01 s to detect the target (SD= 0.64). Participants with a high number of fast errors on thetask were deemed unmotivated and were removed from the data (1.59% of participants).Fast errors were defined as inaccurate trials in which the respondent answered within 1.5 s.A cut-off of 15% fast errors was used. None of the subjects performed below chance level(<.33).
De-Wit et al. (2017), PeerJ, DOI 10.7717/peerj.2862 9/16

Table 2 Regression analysis (N = 185).
Predictors Accuracy Log transformed response times
Estimate Z P Odds Ratio 99% CI Estimate T P
Intercept 1.28 22.13 <.001 [3.10, 4.17] 0.28 36.75 <.001Target lines 0.82 23.88 <.001 [2.08, 2.48] −0.06 −46.82 <.001Continued lines −2.24 −36.67 <.001 [0.09, 0.13] 0.16 68.69 <.001Closurea −0.25 −4.80 <.001 [0.68, 0.89] −0.04 −16.93 <.001Symmetryb 0.40 7.77 <.001 [1.31, 1.70] 0.00 2.09 .04Target lines× Continued lines 0.39 12.00 <.001 [1.35, 1.60] −0.03 −21.49 <.001Closure× Continued lines 0.41 7.65 <.001 [1.31, 1.73] −0.00 −0.41 .68Symmetry× Continued lines 0.12 2.31 .02 [0.99, 1.29] −0.00 −1.00 .32
Notes.Number of target lines and number of continued lines were standardized. Due to this procedure the odds ratio can be interpreted as a measure of effect size independent of mea-surement scale.
aClosed shapes= 1, open shapes= 0.bSymmetry= 1, asymmetry= 0.
Speed-accuracy trade-offThere was no significant correlation between mean accuracy and median response timesof participants, r(183)= .01, p= .85, 95% CI [−.13, .16].
Effect of stimulus featuresThe same models were used as in Experiment 1. The results of the logistic and linearregression are reported in Table 2. Response times were logarithmically transformed tocorrect for a positive skew. The results of the accuracy analysis were highly consistent withthe findings of Experiment 1. Detection is better for symmetric shapes with more targetlines and for shapes with fewer lines continued into the embedding context. In contrast tothe results of Experiment 1, the effect of closure on accuracy now proved significant (eventhough the manipulation of closure was the same as in Experiment 1). Accuracy was higherfor open than closed shapes. The two-way interaction between the number of target linesand continued lines was significant, which indicates that the effect of continued lines wasweaker for shapes with more target lines. The interaction between closure and continuedlines was also significant and indicates that the effect of continued lines is weaker for closedthan for open target shapes. The interaction between continued lines and symmetry wasnot significant.
The results of the response times are mostly consistent with the accuracy data. However,the main effect of closure on response times indicated that participants were slightly fasterto detect closed shapes compared to open shapes, which contradicts the accuracy results.Additionally, there was no significant effect of symmetry on response times and there wasno significant interaction between the number of continued lines and the target featuresof closure and symmetry. The interaction of the number of target lines and number ofcontinued lines for accuracy and median response times on accurate trials is visualizedin Fig. 4.
De-Wit et al. (2017), PeerJ, DOI 10.7717/peerj.2862 10/16
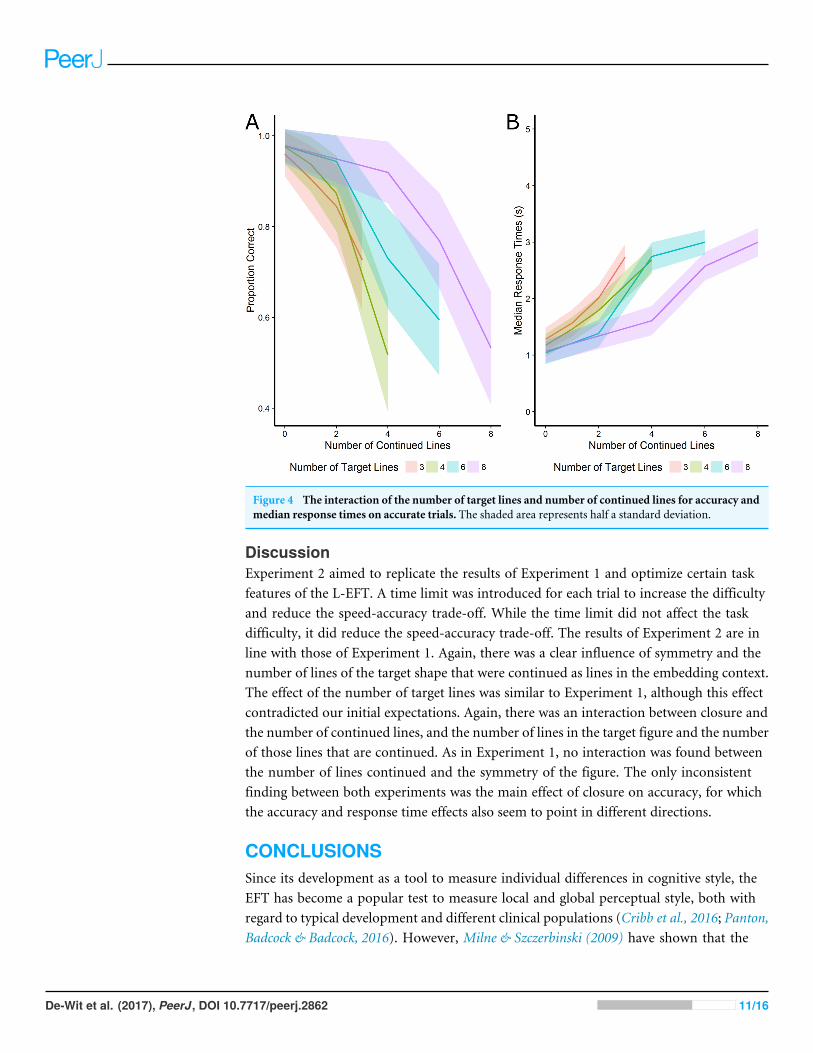
Figure 4 The interaction of the number of target lines and number of continued lines for accuracy andmedian response times on accurate trials. The shaded area represents half a standard deviation.
DiscussionExperiment 2 aimed to replicate the results of Experiment 1 and optimize certain taskfeatures of the L-EFT. A time limit was introduced for each trial to increase the difficultyand reduce the speed-accuracy trade-off. While the time limit did not affect the taskdifficulty, it did reduce the speed-accuracy trade-off. The results of Experiment 2 are inline with those of Experiment 1. Again, there was a clear influence of symmetry and thenumber of lines of the target shape that were continued as lines in the embedding context.The effect of the number of target lines was similar to Experiment 1, although this effectcontradicted our initial expectations. Again, there was an interaction between closure andthe number of continued lines, and the number of lines in the target figure and the numberof those lines that are continued. As in Experiment 1, no interaction was found betweenthe number of lines continued and the symmetry of the figure. The only inconsistentfinding between both experiments was the main effect of closure on accuracy, for whichthe accuracy and response time effects also seem to point in different directions.
CONCLUSIONSSince its development as a tool to measure individual differences in cognitive style, theEFT has become a popular test to measure local and global perceptual style, both withregard to typical development and different clinical populations (Cribb et al., 2016; Panton,Badcock & Badcock, 2016). However, Milne & Szczerbinski (2009) have shown that the
De-Wit et al. (2017), PeerJ, DOI 10.7717/peerj.2862 11/16

factor underlying EFT performance is better represented by a more narrow construct ofdisembedding instead of a local/global perceptual style. The interpretation of good EFTperformance as a reflection of a local perceptual style is problematic, because it is unclearhow a local perceptual style would affect the level of perceptual grouping an individualtends to perform and it is also unclear what the local and global levels are in the embeddedfigures. Our new version of the EFT does not necessitate the interpretation of the results aseither a reflection of a local/global perceptual style, but assesses how people are affected bydifferent target and context features. With that purpose, the L-EFT was developed with afocus on a controlled and parameterized stimulus set, made freely available to others thatallows to test to what extent embeddedness of target shapes depends on different featuresof the target and context.
Three key factors relating to the target shape were explicitly manipulated in twoexperiments, namely the complexity of the shape (defined simply as the number of linesmaking up the target), its symmetry (specifically around the vertical axis) and whether ornot the target shape was an open or closed shape. Across the two experiments, there wasconsistent evidence that symmetric shapeswere easier to detect. This suggests that the factorsthat contribute towards the formation of a good Gestalt can also influence embeddedness ofshapes. Unexpectedly however, evidence wasmixed with regard to closure as themain effectof closure was not significant in Experiment 1 and had inconsistent effects for accuracyand response times in Experiment 2.
Whilst previous evidence has already indicated that closed shapes do form a goodGestalt (Elder & Zucker, 1993; Kovács & Julesz, 1993), the openness of the target shape didnot influence target shape embedding in the L-EFT as predicted. It is not entirely clearwhy symmetry influenced resistance to embedding, while closure did not. It could be thatsymmetry is a more independent feature of the configuration of line segments compared tothe closure of a target shape in the embedded figures test. That is, in contrast to symmetry,closure is inherently ill-defined in embedding contexts, because one does not yet knowwhich line segments belong to the figure and which line segments belong to the context.Therefore closure may not be able to act as a protective factor against embedding. Theeffect of target complexity was also not in line with our expectations. The target shapesmade up of more lines were easier to detect, which may be explained by the fact that theobserver has more information about the target shape and can therefore find the shapemore easily.
However, the latter result does not imply that the complexity of the target shape did notaffect embeddedness. That is, target complexity depends on more than just the number oflines a shape consists of. Asymmetric and irregular shapes aremore complex than symmetricregular shapes, therefore the complexity of the target contour in our stimulus set did notcorrelate perfectly with the number of target lines. If we define target complexity morebroadly than just the number of target lines, the results could be interpreted as showingthat target complexity indeed contributed to a higher degree of embeddedness, becausesymmetric shapes were more easily detected. Therefore, we can conclude that target shapesthat form better Gestalts are more easily detected in the embedded figures task. Whetherthis effect arises from a better representation of the Gestalt in working memory (whilst
De-Wit et al. (2017), PeerJ, DOI 10.7717/peerj.2862 12/16

searching for the target shape) or whether this effect relates to a better representation of thetarget shape in the embedding context itself cannot be disentangled based on the currentstudy. It seems likely that both aspects contribute to better target detection.
In addition to manipulating the nature of the target shape, we also systematicallymanipulated the level of good continuation between the target and context shape byvarying the number of lines of the target figure that were continued into the embeddingcontext. Across the two experiments, we found clear evidence that this manipulation washighly effective in influencing the strength of embedding, such that more continued linesled to both lower accuracies and longer response times. That is, across both experiments wefound that detection of the target became approximately five to ten times more likely whenthe number of continued lines was reduced by 1 standard deviation. This finding supportsthe notion that good continuation is one of the most important factors in influencing theeffectiveness of perceptual embedding.
The specific means of manipulating good continuation in terms of the number ofcontinued lines was motivated by Rao & Ballard’s (1999) predictive coding account of‘end-stopping.’ End-stopping is a property of certain neurons in the primary visual cortexthat fire in response to an edge that ‘ends’ at a particular point in space, but stop firingwhen that edge is continued into a longer line. Rao and Ballard argued that this responseproperty (end-stopping) actually indicates that neurons which behave in this way are notfiring to the presence of an edge, but are firing to signal an ‘error’ based on a predictionat higher areas that that edge should be part of a longer line. Our results regarding theeffect of good continuation could be interpreted as suggesting that the detectability ofindividual lines (and the capacity for those lines to be grouped into a target shape) isreduced when they can be interpreted as longer lines, and the cells in early visual areasno longer signal the ‘error’ of these ‘unpredicted’ shorter lines. This is of course only oneof many possible explanations for this effect, however it seems pertinent to outline thispotential explanation here as the EFT test has been consistently related to ASD (Cribbet al., 2016), and some theories of ASD conceptualize perceptual differences in terms ofan overweighing of prediction errors (Van de Cruys et al., 2014). Clearly, further researchwould be needed to test the validity of this interpretation and its implications for ASD.
Our results clearly show how and to what extent perceptual grouping is involved inthe effective embedding of different line shapes on a group level. The fact that differentperceptual properties influence the strength of embedding suggests that the traditionalEFT is likely to offer a complex aggregated measure of numerous different perceptual (inaddition to cognitive) processes. That is, inter-individual differences in EFT performancemay relate to differences in the effect of target and context features. For instance, themanipulation of target features could have a stronger effect on people who have a morelimited memory span, because targets that form a good Gestalt could benefit people withsmall memory spans more. Additionally, inter-individual differences in sensitivity to goodcontinuation may also be a source of EFT variance given the fact that good continuationhad a strong effect on target embeddedness on a group level. In addition to these potentialsources of inter-individual differences, differences may also arise frommore pure cognitiveprocesses, such as differences in fluid intelligence or cognitive flexibility. In future work
De-Wit et al. (2017), PeerJ, DOI 10.7717/peerj.2862 13/16

we will test whether inter-individual differences in this complex aggregate score primarilyreflect ‘perceptual style’ (as often assumed) or other perceptual or cognitive constructs bytesting the extent to which performance on the traditional EFT and our new L-EFT taskcorrelates with inter-individual differences on different perceptual, executive and problemsolving tasks.
ADDITIONAL INFORMATION AND DECLARATIONS
FundingLee de-Wit andRebeccaChamberlain received a post-doctoral fellowship from the ResearchFoundation–Flanders (FWO). This work was also supported by the Methusalem programby the Flemish Government (METH/08/02, METH/14/02), awarded to Johan Wagemans.The funders had no role in study design, data collection and analysis, decision to publish,or preparation of the manuscript.
Grant DisclosuresThe following grant information was disclosed by the authors:Research Foundation–Flanders (FWO).Methusalem program: METH/08/02, METH/14/02.
Competing InterestsThe authors declare there are no competing interests.
Author Contributions• Lee de-Wit conceived and designed the experiments, wrote the paper.• Hanne Huygelier conceived and designed the experiments, performed the experiments,analyzed the data, wrote the paper, prepared figures and/or tables.• Ruth Van der Hallen and Rebecca Chamberlain conceived and designed the experiments,performed the experiments, reviewed drafts of the paper.• Johan Wagemans reviewed drafts of the paper.
Human EthicsThe following information was supplied relating to ethical approvals (i.e., approving bodyand any reference numbers):
The Social and Societal Ethics Committee of the KU Leuven (SMEC) approved thisstudy (Ethical Application Reference: S58409).
Data AvailabilityThe following information was supplied regarding data availability:
The raw data has been supplied as a Supplementary File.
Supplemental InformationSupplemental information for this article can be found online at http://dx.doi.org/10.7717/peerj.2862#supplemental-information.
De-Wit et al. (2017), PeerJ, DOI 10.7717/peerj.2862 14/16

REFERENCESAdevai G, Silverman AJ, GoughWEM. 1968. Perceptual correlates of the rod-and-frame
test. Perceptual and Motor Skills 26(3):1055–1064 DOI 10.2466/pms.1968.26.3c.1055.Bates D, Mächler M, Bolker B,Walker S. 2014. Fitting linear mixed-effects models using
lme4. Journal of Statistical Software 67(1):1–48 DOI 10.18637/jss.v067.io1.Cribb SJ, Olaithe M, Di Lorenzo R, Dunlop PD, Maybery MT. 2016. Embedded figures
test performance in the broader autism phenotype: a meta-analysis. Journal of Autismand Developmental Disorders 46(9):2924–2939 DOI 10.1007/s10803-016-2832-3.
De-Wit L, Wagemans J. 2015. Individual differences in local and global perceptualorganization. In: Oxford handbook of perceptual organization. Oxford: OxfordUniversity Press, 601–620.
Elder J, Zucker S. 1993. The effect of contour closure on the rapid discrimination of two-dimensional shapes. Vision Research 33(7):981–991DOI 10.1016/0042-6989(93)90080-G.
Goodenough DR,Witkin HA. 1977. Origins of the field-dependent and field-independent cognitive styles. ETS Research Bulletin Series 1977(1):i–80DOI 10.1002/j.2333-8504.1977.tb01134.x.
Gottschaldt K. 1926. Über den Einfluß der Erfahrung auf die Wahrnehmung vonFiguren. Psychologische Forschung 8(1):261–317 DOI 10.1007/BF02411523.
Jolliffe T, Baron-Cohen S. 1997. Are people with autism and asperger syndrome fasterthan normal on the embedded figures test? Journal of Child Psychology and Psychiatry38(5):527–534 DOI 10.1111/j.1469-7610.1997.tb01539.x.
Kovács I, Julesz B. 1993. A closed curve is much more than an incomplete one: effectof closure in figure-ground segmentation. Proceedings of the National Academy of Sci-ences of the United States of America 90(16):7495–7497 DOI 10.1073/pnas.90.16.7495.
Machilsen B, Pauwels M,Wagemans J. 2009. The role of vertical mirror symmetry invisual shape detection. Journal of Vision 9(12):1–11 DOI 10.1167/9.12.11.
Milne E, Szczerbinski M. 2009. Global and local perceptual style, field-independence,and central coherence: an attempt at concept validation. Advances in CognitivePsychology 5(1):1–26 DOI 10.2478/v10053-008-0062-8.
Panton KR, Badcock DR, Badcock JC. 2016. A metaanalysis of perceptual orga-nization in schizophrenia, schizotypy, and other high-risk groups based onvariants of the embedded figures task. Frontiers in Psychology 7(237):1–11DOI 10.3389/fpsyg.2016.00237.
Peirce JW. 2007. PsychoPy—Psychophysics software in Python. Journal of NeuroscienceMethods 162(1–2):8–13 DOI 10.1016/j.jneumeth.2006.11.017.
Prinzmetal W, BanksWP. 1977. Good continuation affects visual detection. Perception& Psychophysics 21(5):389–395 DOI 10.3758/BF03199491.
R Core Team. 2016. R: a language and environment for statistical computing. Vienna: RFoundation for Statistical Computing. Available at https://www.r-project.org .
De-Wit et al. (2017), PeerJ, DOI 10.7717/peerj.2862 15/16

Rao RPN, Ballard DH. 1999. Predictive coding in the visual cortex: a functional interpre-tation of some extra-classical receptive-field effects. Nature Neuroscience 2(1):79–87DOI 10.1038/4580.
Torfs K, Vancleef K, Lafosse C,Wagemans J, De-Wit L. 2013. The Leuven PerceptualOrganization Screening Test (L-POST), an online test to assess mid-level visual per-ception. Behavior Research Methods 46(2):472–487 DOI 10.3758/s13428-013-0382-6.
Tversky T, GeislerWS, Perry JS. 2004. Contour grouping: closure effects are ex-plained by good continuation and proximity. Vision Research 44(24):2769–2777DOI 10.1016/j.visres.2004.06.011.
Van de Cruys S, Evers K, Van der Hallen R, Van Eylen L, Boets B, De-Wit L, WagemansJ. 2014. Precise minds in uncertain worlds: predictive coding in autism. PsychologicalReview 121(4):649–675 DOI 10.1037/a0037665.
Wagemans J, Elder JH, KubovyM, Palmer SE, PetersonMA, SinghM, Von derHeydt R. 2012. A century of Gestalt psychology in visual perception: I. Perceptualgrouping and figure–ground organization. Psychological Bulletin 138(6):1172–1217DOI 10.1037/a0029333.
WertheimerM. 1923. Untersuchungen zur Lehre von der Gestalt, II. PsychologischeForschung 4:301–350. (Translated as ‘‘Investigations on Gestalt principles.’’ InL. Spillmann (Ed.), (2012). Max Wertheimer. On perceived motion and figuralorganization (pp. 127–182). Cambridge: M.I.T. Press.).
Witkin HA. 1950. Individual differences in ease of perception of embedded figures.Journal of Personality 19(1):1–15 DOI 10.1111/j.1467-6494.1950.tb01084.x.
Witkin H, Lewis H, HertzmanM,Machover K, Bretnall P, Wapner S. 1954. Personalitythrough perception: an experimental and clinical study (Vol. 26). Oxford: Harper.
Witkin HA, Moore CA, Goodenough DR, Cox PW. 1975. Field-dependent and field-independent cognitive styles and their educational implications. ETS ResearchBulletin Series 1975(2):1–64 DOI 10.1002/j.2333-8504.1975.tb01065.x.
Witkin HA, Oltman PK, Raskin E, Karp SA. 1971. A manual for the embedded figurestests. Palo Alto: Consulting Psychologists Press.
De-Wit et al. (2017), PeerJ, DOI 10.7717/peerj.2862 16/16