
DEVELOPING PREDICTION MODEL FOR STOCK · PDF fileInternational Research Journal of...
6
International Research Journal of Engineering and Technology (IRJET) e-ISSN: 2395 -0056 Volume: 03 Issue: 05 | May-2016 www.irjet.net p-ISSN: 2395-0072 © 2016, IRJET | Impact Factor value: 4.45 | ISO 9001:2008 Certified Journal | Page 1410 DEVELOPING PREDICTION MODEL FOR STOCK EXCHANGE DATA SET USING HADOOP MAP REDUCE TECHNIQUE Mrs. Lathika J Shetty 1 , Ms. Shetty Mamatha Gopal 2 1 Computer Science & Engineering, Sahyadri College of Engineering and Management, Mangalore, Karnataka, India 2 Computer Science & Engineering, Sahyadri College of Engineering and Management, Mangalore, Karnataka, India ---------------------------------------------------------------------***--------------------------------------------------------------------- ABSTRACT- Stock Market has high profit and high risk features which tells why its prediction must be close to accurate. The main issue about such data sets is that these are very complex nonlinear functions and can only be learnt by a data mining methods to recognize the future market trend. Companies provide daily statistics of their market trend and in time, generating a great deal of information which is dumped into their database. Forecasting stock price is an important task for investment and financial decision making process. This is considered as one of the biggest challenges. In this paper the proposed system goal is to develop a prediction model using MapReduce with the help of time-series analysis in Hadoop which can be used to predict the future stock closing price. This system will be a Hadoop based Stock Prediction Model generator for the people interested to know the future market trend of a particular company. The target clients are shareholders and the company officials. The developed model can be deployed and used by companies and shareholders to adjust their strategies based on the results of the analysis done. Key Words: Hadoop, HDFS, Map reduce, prediction model, stock exchange data set, prediction model 1. INTRODUCTION Stock Market has high profit and high risk features which tells why its prediction must be close to accurate. The main issues about such data sets are that these are very complex nonlinear functions and can only be learnt by a data mining methods to recognize the future market trend. Companies provide daily statistics of their market trend and in time, generating a great deal of information which is dumped into their database. The project goal is to develop a prediction model using Map Reduce technique with the help of time-series analysis in Hadoop which can be used to predict the future stock closing price. Hadoop is a Java based open source framework which uses simple programming models to allow storing and processing of Big Data in a distributed computing environment across clusters of computers. It is a part of the Apache Software foundation. It provides a design to scale up from single servers to thousands of machines and each offering local computation and storage. One of the most efficient solutions for processing of large data sets is Hadoop. The main components of Hadoop framework is HDFS and Map reduce. HDFS (Hadoop Distributed File System) is a block structured distributed file system which holds large amount of Big Data. It provides high throughput access to application data. HDFS uses master/slave architecture. Master consists of a single name node that manages the file system metadata and one or more slave data nodes that store the actual data. Hadoop MapReduce- Hadoop runs applications using map reduce algorithm which is a programming framework for distributed computing. Here divide and conquer method is used to break large complex data. A time series is a sequence of numerical data points in successive order, usually occurring in uniform intervals. In general, a time series can be defined as a sequence of numbers collected at regular intervals over a period of time. A stock is a share in the ownership of a company. Stock represents a claim on the company's assets and earnings. As you acquire more stock, your ownership stake in the company becomes greater. 2. LITERATURE SURVEY Various contributions are made in the direction of building prediction models for historical stock exchange data set. Works carried out in this field are as follows: [1] Time Series Forecasting Of Nifty Stock Market(NSE) Using Weka by Raj Kumar, Anil Balara in 2010, JRPS: Here the researchers utilized Weka 3.7.8 tool to obtain more accurate stock prediction price using time series forecasting package of weka for the work. Weka tool has been used and it analyzed and compared results by plot graphs.
Transcript of DEVELOPING PREDICTION MODEL FOR STOCK · PDF fileInternational Research Journal of...

International Research Journal of Engineering and Technology (IRJET) e-ISSN: 2395 -0056
Volume: 03 Issue: 05 | May-2016 www.irjet.net p-ISSN: 2395-0072
© 2016, IRJET | Impact Factor value: 4.45 | ISO 9001:2008 Certified Journal | Page 1410
DEVELOPING PREDICTION MODEL FOR STOCK EXCHANGE DATA SET
USING HADOOP MAP REDUCE TECHNIQUE
Mrs. Lathika J Shetty1, Ms. Shetty Mamatha Gopal2
1 Computer Science & Engineering, Sahyadri College of Engineering and Management, Mangalore, Karnataka, India
2 Computer Science & Engineering, Sahyadri College of Engineering and Management, Mangalore, Karnataka, India
---------------------------------------------------------------------***---------------------------------------------------------------------ABSTRACT- Stock Market has high profit and high risk features which tells why its prediction must be close to accurate. The main issue about such data sets is that these are very complex nonlinear functions and can only be learnt by a data mining methods to recognize the future market trend. Companies provide daily statistics of their market trend and in time, generating a great deal of information which is dumped into their database. Forecasting stock price is an important task for investment and financial decision making process. This is considered as one of the biggest challenges. In this paper the proposed system goal is to develop a prediction model using MapReduce with the help of time-series analysis in Hadoop which can be used to predict the future stock closing price. This system will be a Hadoop based Stock Prediction Model generator for the people interested to know the future market trend of a particular company. The target clients are shareholders and the company officials. The developed model can be deployed and used by companies and shareholders to adjust their strategies based on the results of the analysis done.
Key Words: Hadoop, HDFS, Map reduce, prediction
model, stock exchange data set, prediction model
1. INTRODUCTION
Stock Market has high profit and high risk features which tells why its prediction must be close to accurate. The main issues about such data sets are that these are very complex nonlinear functions and can only be learnt by a data mining methods to recognize the future market trend. Companies provide daily statistics of their market trend and in time, generating a great deal of information which is dumped into their database. The project goal is to develop a prediction model using Map Reduce technique with the help of time-series analysis in Hadoop which can be used to predict the future stock closing price.
Hadoop is a Java based open source framework which uses simple programming models to allow storing and processing of Big Data in a distributed computing environment across clusters of computers. It is a part of the
Apache Software foundation. It provides a design to scale up from single servers to thousands of machines and each offering local computation and storage. One of the most efficient solutions for processing of large data sets is Hadoop.
The main components of Hadoop framework is HDFS and Map reduce. HDFS (Hadoop Distributed File System) is a block structured distributed file system which holds large amount of Big Data. It provides high throughput access to application data. HDFS uses master/slave architecture. Master consists of a single name node that manages the file system metadata and one or more slave data nodes that store the actual data. Hadoop MapReduce- Hadoop runs applications using map reduce algorithm which is a programming framework for distributed computing. Here divide and conquer method is used to break large complex data.
A time series is a sequence of numerical data points in successive order, usually occurring in uniform intervals. In general, a time series can be defined as a sequence of numbers collected at regular intervals over a period of time.
A stock is a share in the ownership of a company. Stock represents a claim on the company's assets and earnings. As you acquire more stock, your ownership stake in the company becomes greater.
2. LITERATURE SURVEY
Various contributions are made in the direction of building prediction models for historical stock exchange data set. Works carried out in this field are as follows: [1] Time Series Forecasting Of Nifty Stock Market(NSE) Using Weka by Raj Kumar, Anil Balara in 2010, JRPS: Here the researchers utilized Weka 3.7.8 tool to obtain more accurate stock prediction price using time series forecasting package of weka for the work. Weka tool has been used and it analyzed and compared results by plot graphs.

International Research Journal of Engineering and Technology (IRJET) e-ISSN: 2395 -0056
Volume: 03 Issue: 05 | May-2016 www.irjet.net p-ISSN: 2395-0072
© 2016, IRJET | Impact Factor value: 4.45 | ISO 9001:2008 Certified Journal | Page 1411
Comparision among various prediction functions were made throughout the work. After comparision it is found that the SMO regression function predicted the stock prize of NSE more accurately than the other prediction functions such as Gaussian process, linear regression. [2]Applying Data Mining Techniques to Stock Market Analysis by Gabriel Fiol-Roig, Margaret Miro-Julia, and Andreu Pere Isern-Deya in 2010, Springer:* Here the researchers viewed the stock market analysis as an artificial intelligence problem. First, data mining techniques will be used to evaluate past stock prices and acquire useful knowledge through the calculation of some financial indicators. Next they applied artificial intelligence strategies to construct decision making trees and predictions are made. [3] A Decision Tree- Rough Set Hybrid System for Stock Market Trend Prediction by Binoy.B.Nair, V.P Mohandas and N. R. Sakthivel in 2010, IJCA They have used hybrid decision tree rough set based system for prediction. First, the relevant feturese selected using decision tree and then a rough set based classifier is used for stock price trend forecasting. Overall, it is based on soft computing technique. [4] The use of data mining and neural networks for forecasting stock market returns by Thawronwong in 2012, Journal of Computers: Here in this study an attempt has been made to investigate the predictive power of financial and economic variables by adopting the analysis technique in machine learning for data mining. Selecting the appropriate variable for analysis is the major task. [5] Machine Learning in Stock price trend forecasting, by Yuqing Dai, Yuning Zhang in 2012: Here the researchers have used Machine learning techniques to obtain their result. Machine Learning techniques are very popular due to the capacity of identifying stock trend from massive amounts of data that capture the underlying stock price dynamics. In this work, they used supervised learning methods to stock price trend forecasting. [6] Predicting stock prices using data mining techniques by Qasem a. Al-radaideh, Adel abu assaf and Eman in 2013,ACIT: Here the method is based on decision tree classifier which is one of the data mining technique. Also the CRISP-DM(Cross- Industry Standard process for data mining) is applied over the historical stock exchange data to predict the future stock market price . [7] Stock Price Prediction Using K-Nearest Neighbor (kNN) Algorithm by Khalid Alkhatib Hassan Najadat Ismail Hmeidi Mohammed K. Ali Shatnawi in 2013 , IJBHT : In this methodology, the researchers applied k-nearest neighbor algorithm and non-linear regression approach in order to predict stock prices. In classification approaches, a data set is divided into two sub sets such as training data set and testing set. kNN algorithm uses similarity metrics to
compare a given test entity with the training data set to aid in the prediction process. [8] Clustering-Classification Based Prediction of Stock Market Future Prediction by Abhishek Gupta, Dr.Samidha D Sharma in 2014, IJSCIT The methodology implemented here for the prediction of stock market is Clustering classisfication based prediction such as applying clustering algorithm such as K-means and decision tree algorithm. The particular methods has been applied in term of two stages and prediction is made. [9] Predicting Closing Stock Price using Artificial Neural Network and Adaptive Neuro Fuzzy Inference System (ANFIS) by Mustain Billah, Sajjad Waheed andAbu Hanifa in 2015 , IJCA : An attempt has been made in this study to discover the efiicient soft computing technique. Two techninques such as ANN(Artificial Neural Network) and ANFIS(Adaptive Neuro Fuzzy Inference System ) Has been applied for the historical stock exchange dataset. The outcomes of both the method is compared and it is found that the ANFIS technique is more efficient and effective in predicting the future stock closing price. Overview: All the above researchers have been successful in analyzing the dataset related to stock exchange using various approaches like Neural Network, Regression , clustering, classification and different algorithms like K-means clustering. Most of them used Neural Network approach to build the prediction model but an attempt to build prediction model using hadoop is not made yet.In this project an attempt to analyze the dataset using Hadoop map reduce technique and time series algorithm is done.
3. SYSTEM ANALYSIS
3.1 Existing system
As discussed many researchers have been successful in analyzing the dataset related to stock exchange using various approaches like Regression based datamining , clustering, classification and different algorithms like K-means clustering. Most of them used Nueral Network approach to build the prediction model . Thus all these prediction models were developed using data mining tools like Oracle data Miner, Weka etc.
3.2Limitations of Existing Systems
All the researchers have been successful in analyzing the stock data set and developing good prediction models. But most of them used tools like weka and oracle data miner and few of them used tools like Tanagra. But these methods aren’t efficient. Also an attempt to build prediction model using hadoop is not made yet. Hadoop can work using a cluster of nodes to work on a large unstructured data set in parallel and produce faster results.

International Research Journal of Engineering and Technology (IRJET) e-ISSN: 2395 -0056
Volume: 03 Issue: 05 | May-2016 www.irjet.net p-ISSN: 2395-0072
© 2016, IRJET | Impact Factor value: 4.45 | ISO 9001:2008 Certified Journal | Page 1412
3.3Proposed System
The proposed system (fig 3.1) focuses on building a prediction model using Hadoop map reduce technique. The Hadoop Software library gives a major advantage of distributed processing of bulky data sets and it also provides high availability of data. Hence, Hadoop has been taken as a framework for developing the prediction model. In this system, a company’s daily stock data set is chosen as a training data set, , and after analyzing the data set completely, a prediction model is developed, it can be used to predict how the stock will be for the next quarter.
Fig 3.1: Proposed System
3.4Objectives
There are 3 major requirements to be satisfied in the order: 1.Acquiring the stock exchange dataset. 2.Designing an appropriate prediction algorithm. 3.Applying prediction algorithm on test input data and getting output.
3.5Specific Requirements
3.5.1 Hardware Requirements This system will be designed to work on general
purpose computers with processor Intel dual core and above. The data is acquired from finance.yahoo.com. It is a .csv file (comma separated value file). It is a structured dataset. It contains daily stock data of a company which includes attributes – date, low, high, open, close and volume. The nodes are interconnected using an algorithm which implements the MapReduce model developed by Google.
Hadoop will take care of how the data and processing are managed through multiple nodes.
3.5.2 Software Requirements
The system uses historical stock dataset acquired from finance.yahoo.com to predict a company’s future quarter closing prices.
Operating system used is Ubuntu which is based on Linux
Terminal is used for the commands.
3.5.3 Functional Requirements
1) 3.5.3.1 Create Prediction model
Introduction: This function will take a stock dataset and provide a prediction model
Inputs: Stock dataset of a company Processing: Workload will be shared among
multiple nodes using an algorithm which implements MapReduce and using time series analysis algorithm, it will produce the prediction model.
Outputs: Prediction Model Figure 3.2 depicts the activity diagram for the proposed system.
Fig 3.2: Activity diagram
International Research Journal of Engineering and Technology (IRJET) e-ISSN: 2395 -0056
Volume: 03 Issue: 05 | May-2016 www.irjet.net p-ISSN: 2395-0072
© 2016, IRJET | Impact Factor value: 4.45 | ISO 9001:2008 Certified Journal | Page 1413
4. IMPLEMENTATION
4.1 Module Implementation
4.1.1 Time series analysis
Time series analysis technique consists of methods to analyze the time series data such as in the proposed system the historical stock exchange data, which is helpful in obtaining the statistics and various characteristics that are useful in decision making process. This particular technique make use of the observed values in order to predict the future values.
Natural temporal ordering being one of the feature of time series data, makes time series analysis distinct from cross-sectional studies. In the cross-sectional studies there is no natural ordering means individual’s data could be entered in any order. Also time series is different from that of spatial data analysis where in later analysis the focus is given on geographical locations. It has been observed that the stochastic model for a time series will generally reflect the fact that observations made with time are close related to the accurate results. In addition to all the above features, in time series the values for a given period has been derived by using some methods from the past (historical) values rather than making use of future values.
Time series is considered to be a sequence of data points with following features:
1) Over a continuous time interval
2) Successive measurements across the particular interval
3) By making use of equal spacing between every two consecutive measurements
4.1.2 Time series algorithm
y is a variable. It is collected data over time t. Time (t) is in quarters. y is the average closing price for that quarter. y=TSI Where T is Trend. I is the irregularity constant. S is the seasonal change in the y value. T is the trend calculated using variables b0 and b1. Sumt is the total summation of t values. Sumy is the total summation of y values Sumty is calculating t*y then total summation of t*y Sumt2 is total summation of t*t We Calculate all the variables (sumt, sumy, etc) Then we calculate b0 and b1. We calculate the future Trend using formula:
T=b0+tb1 Then we correct the prediction by applying the
seasonal and irregular effects
Predictiondone.
5. RESULTS AND SNAPHSHOTS
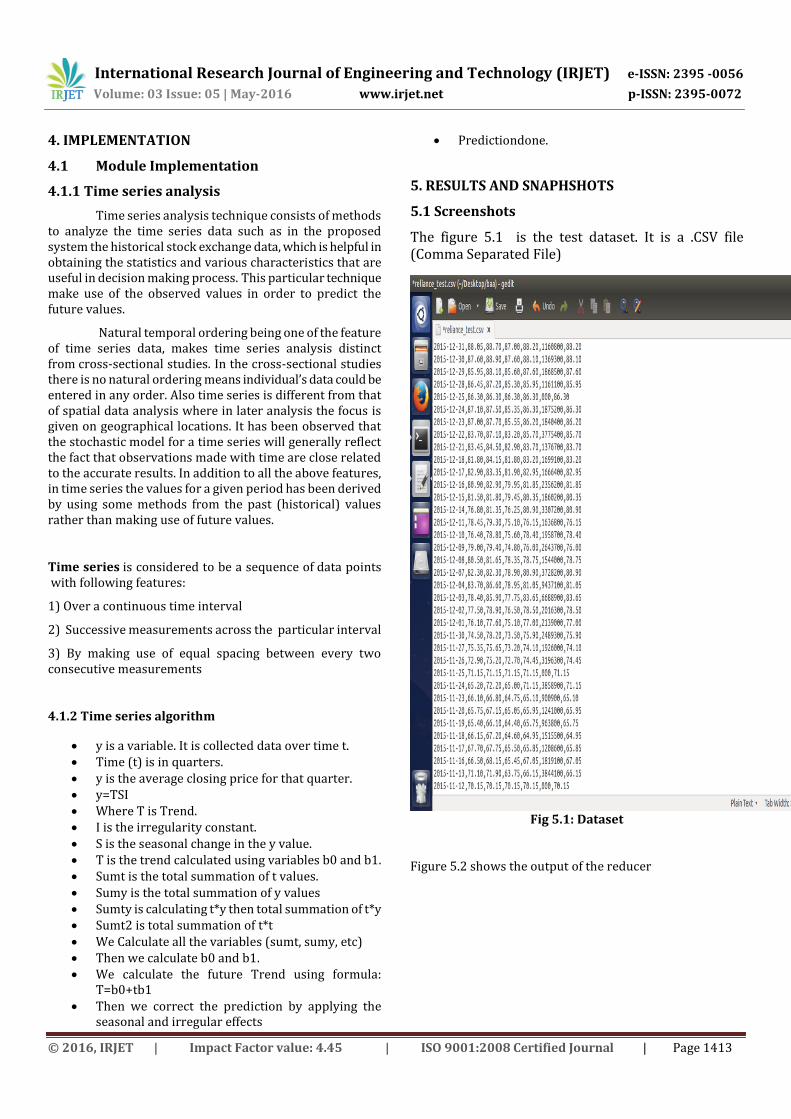
5.1 Screenshots
The figure 5.1 is the test dataset. It is a .CSV file (Comma Separated File)
Fig 5.1: Dataset
Figure 5.2 shows the output of the reducer

International Research Journal of Engineering and Technology (IRJET) e-ISSN: 2395 -0056
Volume: 03 Issue: 05 | May-2016 www.irjet.net p-ISSN: 2395-0072
© 2016, IRJET | Impact Factor value: 4.45 | ISO 9001:2008 Certified Journal | Page 1414
Fig 5.2: Prediction Model
Figure 5.3 shows the output of the prediction algorithm on
the test data set.
Fig 5.3: Prediction
5.2 Results: Closing Prices
The table below shows the value when comparison is made with the predicted average and actual average using the proposed system . The actual average is the closing price average for the 2016’s first quarter.
Table 5.1 Results
Actual average Predicted average
Reliance 60 64.98
Google 750 829.91
General electric
29 32.43
In average, reduction is dataset size after MapReduce execution is approximately 98.5%.
5.3 Discussion
Using the proposed system, the value of next quarter can be predicted. This will help the shareholders and the company people to make better decisions to attain higher profits. Also enables to quickly learn patterns within large data sets and make intelligent predictions. It is possible to utilise multiple systems to work together for the output.
6. CONCLUSION AND FUTURE WORK
6.1Conclusion Using the proposed system, we will be able to: -Help the shareholders and the company people to make better decisions to attain higher profits. -Quickly learn patterns within large data sets and make intelligent predictions. -Utilise multiple systems to work together for the output.
6.2Future work -Make use of the current news for better prediction of stock prices. -Use a prediction algorithm which can produce better predictions for a broader choice of datasets. REFERENCES [1] Raj Kumar,Anil Balara, “Time Series Forecasting Of Nifty Stock Market Using Weka” , 2010, JRPS
International Research Journal of Engineering and Technology (IRJET) e-ISSN: 2395 -0056
Volume: 03 Issue: 05 | May-2016 www.irjet.net p-ISSN: 2395-0072
© 2016, IRJET | Impact Factor value: 4.45 | ISO 9001:2008 Certified Journal | Page 1415
[2] Gabriel Fiol-Roig, Margaret Miro-Julia, and Andreu Pere Isern-Deya, “Applying Data Mining Techniques to Stock Market Analysis”,2010, Springer [3] Binoy.B.Nair, V.P Mohandas, N. R. Sakthivel , “A Decision Tree- Rough Set Hybrid System for Stock Market Trend Prediction”, 2010, IJCA [4] Thawronwong, “The use of data mining and neural networks for forecasting stock market returns”, 2012, Journal of Computers [5] Yuqing Dai, Yuning Zhang , “Machine Learning in Stock price trend forecasting” , 2012 [6] Qasem a. Al-radaideh, Adel abu assaf ,Eman, “ Predicting stock prices using data mining techniques” ,2013,ACIT [7] Khalid Alkhatib Hassan Najadat Ismail Hmeidi Mohammed K. Ali Shatnawi, “Stock Price Prediction Using K-Nearest Neighbor (kNN) Algorithm”, 2013 , IJBHT [8] Abhishek Gupta, Dr.Samidha D Sharma, “ Clustering-Classification Based Prediction of Stock Market Future Prediction”, 2014, IJSCIT [9] Mustain Billah, Sajjad Waheed,Abu Hanifa, “Predicting Closing Stock Price using Artificial Neural Network and Adaptive Neuro Fuzzy Inference System(ANFIS)”, 2015 , IJCA [10] https://www.youtube.com/watch?v=2S5kf73Cdws, Time series analysis video [11] Apache Hadoop, http://Hadoop.apache.org. [12] Tom White. Hadoop: The Definitive Guide. O’Reilly, Sebastopol, California, 2009. [13] http://www.michael-noll.com/tutorials/running-hadoop-on-ubuntu-linux-single-node-cluster/


