Developing Evidence Based Messages on Air Pollution and Health Dr. Colin Ramsay
27
STEP Conference 2014 – Cleaner Air, Healthier Places Developing evidence-based messages on air pollution and health 18 th November 2014 Dr. Colin N. Ramsay Consultant Epidemiologist Health Protection Scotland
-
Upload
stepscotland -
Category
Environment
-
view
86 -
download
0
Transcript of Developing Evidence Based Messages on Air Pollution and Health Dr. Colin Ramsay

STEP Conference 2014 – Cleaner Air, Healthier Places
Developing evidence-based messages on
air pollution and health
18th November 2014
Dr. Colin N. Ramsay Consultant Epidemiologist Health Protection Scotland

Presentation Aims
To outline the rationale for the Scottish Government /
SEPA / SUAQ Programme project on Air Pollution and
Health Impacts (APHIP)
• Air Pollution and Health in Scotland – the issues behind the
project.
• Why do we need this particular project – the questions the
project aims to address.
• How do we plan to address the questions.
• What do we hope to achieve – the intended outcomes.
2

3
Air Pollution Today – Global Phenomenon
Nasa satellite image reveals the extent of
China's air pollution
4
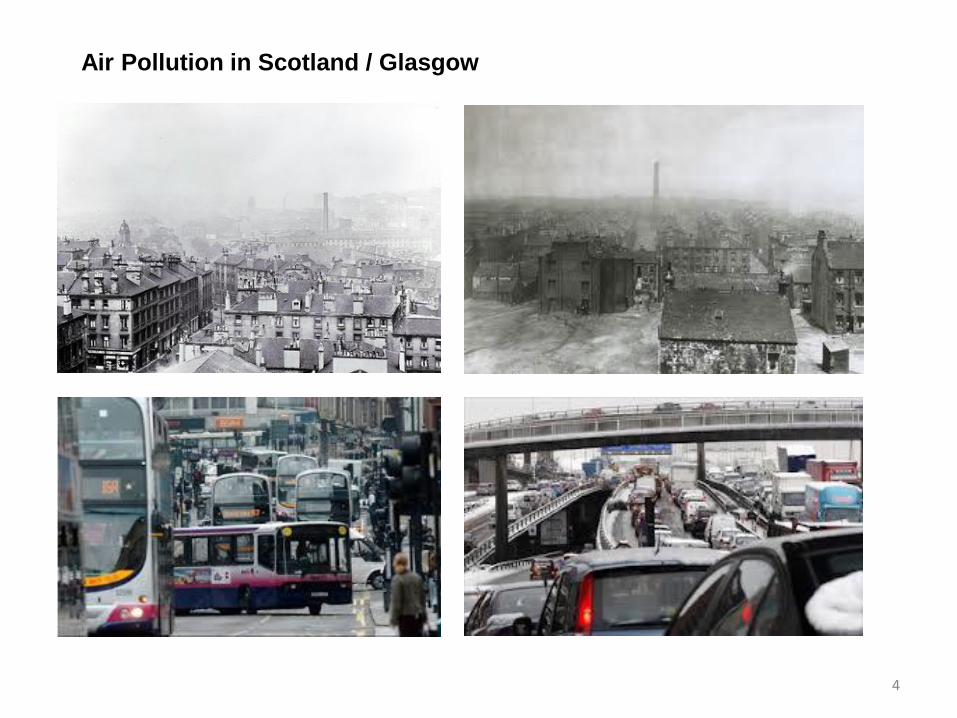
Air Pollution in Scotland / Glasgow
5

6
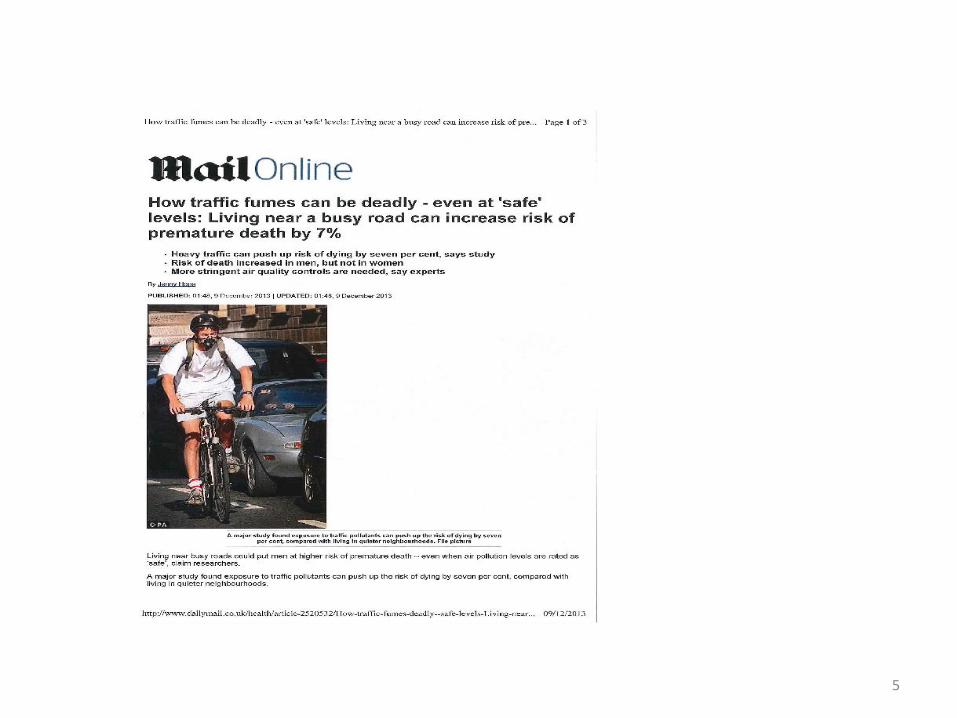
• Death risk increased even with low exposure.
• The greatest health threat was from long-term exposure to fine-particle air pollution with a
diameter of less than 2.5 micrometers (PM2.5).
• It was found that for every increase of 5 µg/m3 in annual exposure to PM2.5, the risk of
dying from natural causes increases by 7%.
"Our findings show that long-term exposure to fine particulate air pollution is associated with
natural-cause mortality, even at concentration ranges well below the present European annual
mean limit value.”
Effects of long-term exposure to air pollution on natural-cause mortality: an analysis of 22
European cohorts within the multicentre ESCAPE project
Background
Few studies on long-term exposure to air pollution and mortality have been reported from Europe.
Within the multicentre European Study of Cohorts for Air Pollution Effects (ESCAPE), we aimed to
investigate the association between natural-cause mortality and long-term exposure to several air pollutants.

Project Title:
Air Pollution and Health Impacts Project (APHIP)
Project Aim: • To develop an evidence-based set of key messages on air
pollution and health impacts focused on encouraging people
to adopt healthier and less polluting transport options.
Funding: • By Scottish Government Environment Directorate and SEPA
– Scottish Environment on the web (SEWEB) project via
Scottish Urban Air Quality Steering Group
as part of Research Programme.
7

The Issue
- Air Pollution and Health Impacts in Scotland
Current consensus of views on air pollution and health
• Air pollution is not good for human health.
• Multiple sources of air pollution; natural and man made
(anthropogenic).
• Anthropogenic air pollution should be controllable, ideally
preventable.
• Transport (road traffic) sourced pollution (particulates, NOx,
ozone) is a major contributor to anthropogenic air pollution and
health impacts.
• Changing the pattern of road transport use could reduce air
pollution, especially in urban areas.
• People need to be “encouraged” to change their travel habits
and choice of transport: need “key messages”. 8
The Questions (1)
If we want to persuade people to change their behaviour,
we have to have a sound evidence-base.
- Are we sure the current consensus view is correct?
• What are the current trends in road transport use in Scotland?
• How bad is (traffic related) air pollution in Scotland?
9
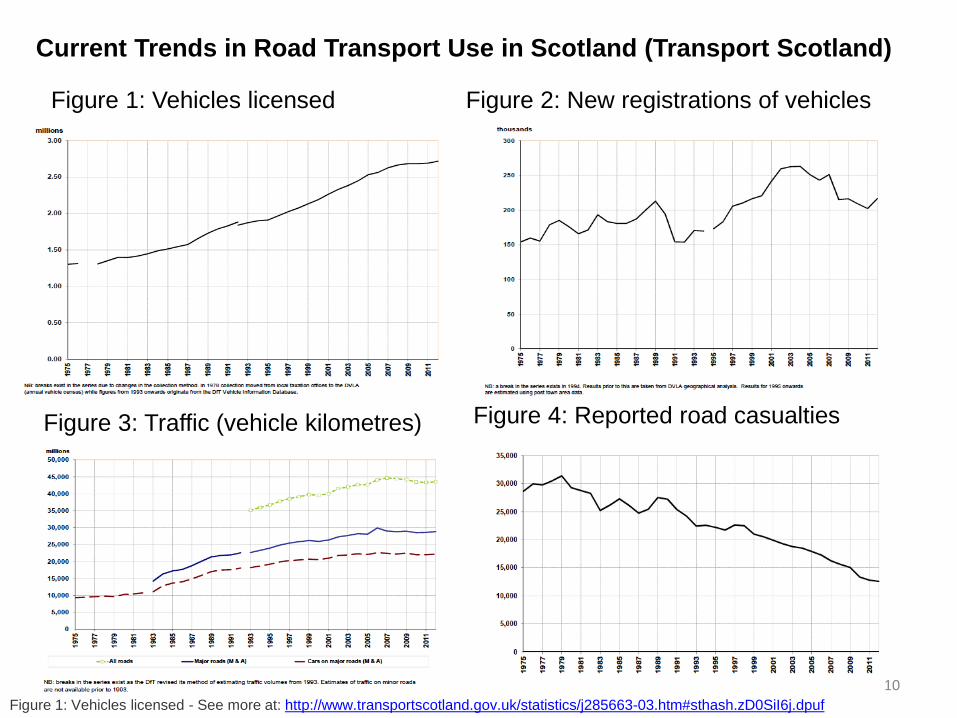
10 Figure 1: Vehicles licensed - See more at: http://www.transportscotland.gov.uk/statistics/j285663-03.htm#sthash.zD0SiI6j.dpuf
Figure 1: Vehicles licensed Figure 2: New registrations of vehicles
Figure 3: Traffic (vehicle kilometres) Figure 4: Reported road casualties
Current Trends in Road Transport Use in Scotland (Transport Scotland)

11
Overview of travel in Scotland
2007-08 2012-13 Change
Car Traffic (m/veh km) on all
roads 34,545 33,777 -2%
Pedal Cycles (m/veh km) on
all roads 240 310 29%
ScotRail Passengers (millions) 74.5 83.3 12%
Bus Passengers (millions) 488 423 -13%
Air Passengers (millions) 25,132 22,207 -12%
Ferry Passengers (millions) 10.7 9.7 -9%
Source: STS 2013
Transport Scotland Statistics

Trends in PM2.5 in Scotland (de-seasonalised)
2007 - 2013
12 HPS Air Quality (PM2.5 particulate air pollution) and Mortality in Scotland - Briefing Document: http://www.hps.scot.nhs.uk/enviro/spotlightdetail.aspx?id=629

13
Trends in NO2 in Scotland
“Air pollution: the mass killer that keeps on killing”
Sunday Herald New Era magazine, 19 May 2013
“By far the highest pollution was found on the
Glasgow subway”
Maps based on monitoring for nitrogen dioxide,
analysed by Friends of the Earth Scotland.
The Questions (2)
Assuming the evidence supports the consensus view
How do we create “Cleaner Air, Healthier Places”?
- What questions is this project trying to answer?
• What are the health impacts of anthropogenic (traffic related) air
pollution generally and in Scotland particularly?
• How do we effectively encourage people to change their travel
habits and choice of transport?
14

COMEAP – Mortality Effects on Long Term Exposure
to Particulate Air Pollution in the UK (2010) • Review of evidence of health impacts / mortality burden associated with
man made (anthropogenic) particulate air pollution (based on 2008 UK air
pollutant data).
• Effect of anthropogenic particulate pollutant was equivalent to 29,000
deaths in UK at typical ages; equivalent to loss of 340,000 life years
(allowing for variation in age at time of death).
• Measures are averages / aggregates across the population.
– not known how effects distributed among individuals.
• “As everyone dies eventually, no lives are ever saved by reducing
environmental exposures – deaths are delayed resulting in increased life
expectancy”.
15
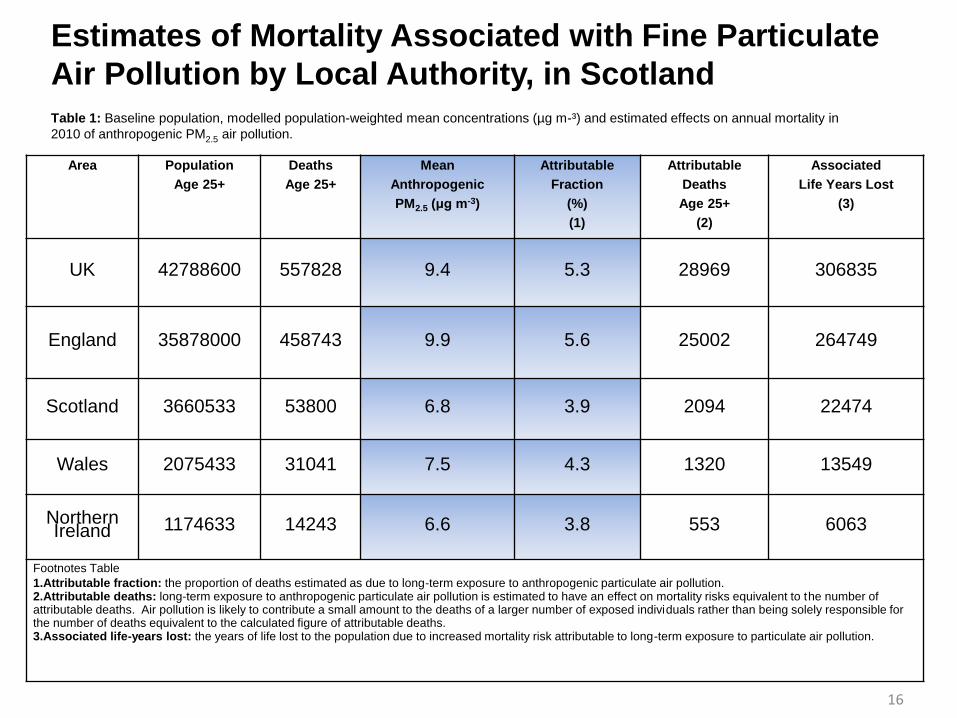
Estimates of Mortality Associated with Fine Particulate
Air Pollution by Local Authority, in Scotland
Area Population
Age 25+
Deaths
Age 25+
Mean
Anthropogenic
PM2.5 (μg m-3)
Attributable
Fraction
(%)
(1)
Attributable
Deaths
Age 25+
(2)
Associated
Life Years Lost
(3)
UK 42788600 557828 9.4 5.3 28969 306835
England 35878000 458743 9.9 5.6 25002 264749
Scotland 3660533 53800 6.8 3.9 2094 22474
Wales 2075433 31041 7.5 4.3 1320 13549
Northern Ireland 1174633 14243 6.6 3.8 553 6063
Footnotes Table
1.Attributable fraction: the proportion of deaths estimated as due to long-term exposure to anthropogenic particulate air pollution. 2.Attributable deaths: long-term exposure to anthropogenic particulate air pollution is estimated to have an effect on mortality risks equivalent to the number of attributable deaths. Air pollution is likely to contribute a small amount to the deaths of a larger number of exposed individuals rather than being solely responsible for the number of deaths equivalent to the calculated figure of attributable deaths. 3.Associated life-years lost: the years of life lost to the population due to increased mortality risk attributable to long-term exposure to particulate air pollution.
Table 1: Baseline population, modelled population-weighted mean concentrations (µg m-³) and estimated effects on annual mortality in
2010 of anthropogenic PM2.5 air pollution.
16

17
Estimates of Mortality Associated with Fine Particulate
Air Pollution by Local Authority, in Scotland (cont:)
Scotland Council
Area
Population
Age 25+
Deaths
Age 25+
Mean
Anthropogenic
PM2.5 (μg m-3)
Attributable
Fraction
(%)
(1)
Attributable
Deaths
Age 25+
(2)
Associated
Life Years Lost
(3)
Aberdeen City 150600 2049 7.4 4.2 86 936
Aberdeenshire 172300 2198 5.6 3.2 70 749
Dumfries &
Galloway 109067 1790 5.8 3.3 60 597
Dundee City 97900 1677 7.3 4.1 69 774
Edinburgh,
City of 339533 4169 8.6 4.9 205 2269
Eilean Siar 19400 349 4.2 2.4 8 85
Fife 253733 3770 6.8 3.9 146 1569
Glasgow, City
of 408333 6508 8.3 4.7 306 3333
Highland 160167 2296 4.3 2.5 57 641
Table 2: Baseline population, modelled population-weighted mean concentrations (µg m‾³) and estimated effects on annual mortality
in 2010 of anthropogenic PM2.5 air pollution.

18
APHEKOM
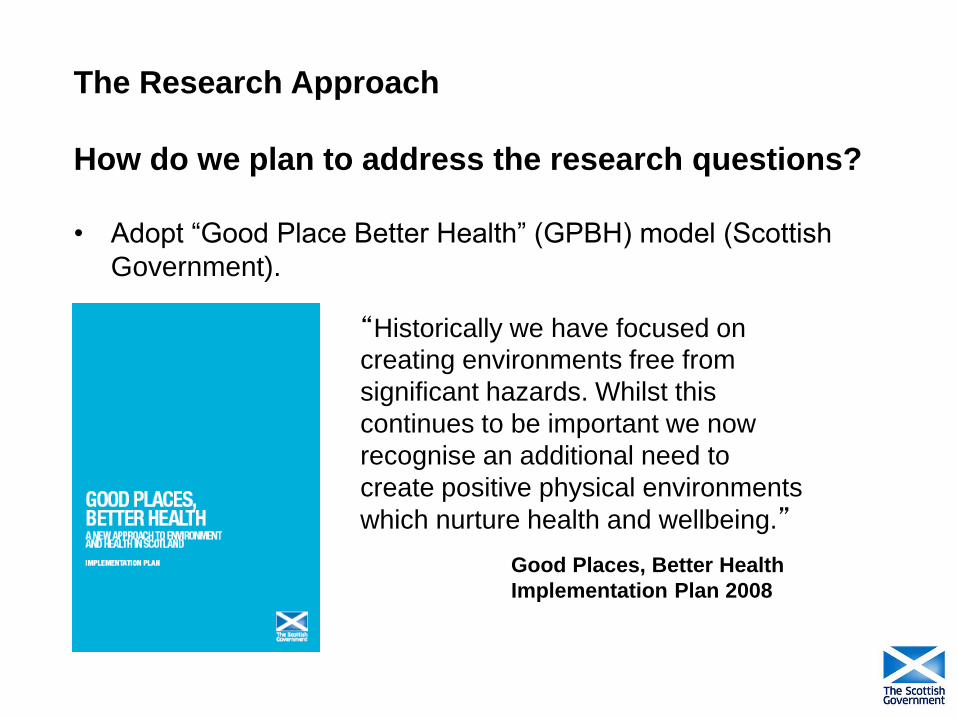
The Research Approach
How do we plan to address the research questions?
• Adopt “Good Place Better Health” (GPBH) model (Scottish
Government).
19
“Historically we have focused on
creating environments free from
significant hazards. Whilst this
continues to be important we now
recognise an additional need to
create positive physical environments
which nurture health and wellbeing.”
Good Places, Better Health
Implementation Plan 2008

Good Places Better Health Method - Project
Three components:
• A review of published evidence on health impacts of air pollution.
• A review of published evidence on strategies and methods of
changing people’s behaviour on transport choices.
• A review of key factors and influences that create the current
patterns of air pollution and determine people’s choice of
transport:
- using modified DPSEEA conceptual model to frame and map
issues
20

Research Evidence on Air Pollution and Health Impacts Journal publications 2012 / 2013:
• Occupational and Environmental Medicine: 85 papers
• Lancet: 102 papers
• Epidemiology: 138 papers
• Research findings sometimes inconsistent / contradictory.
• Study locations / populations are heterogeneous, hence may not be
representative of experience in UK / Scotland.
• Reliance on systematic reviews of evidence to determine the most robust
estimates of health effects.
• Reliance on expert groups (e.g. COMEAP) and consensus statements
for conclusions on impacts of air pollution, for use in policy
formulation and to guide public health action.
21

EU / WHO Initiatives
Review of Evidence on Health Aspects of Air Pollution
(REVIHAAP) (2013)
Provides additional support for effects of PM10 and PM2.5 on short and long
term exposures on mortality and morbidity.
• Long term exposure to PM2.5 is a cause of cardiovascular morbidity and
mortality.
• Evidence of association between PM2.5 and atherosclerosis, adverse
birth outcomes, childhood respiratory disease (asthma).
• Emerging evidence of association between long term PM2.5 exposure
and neurodevelopmental / cognitive function (dementia) and chronic
metabolic conditions e.g. diabetes.
22

Review of
Evidence on
Efforts to
Change
People’s
Transport
Choices

POLICY
and
ACTION
Modified DPSEEA Process
Upstream factors
Downstream factors
Good Places Better Health Methodology
Modifiers

mDPEESA Conceptual Model – Upstream Factors
Drivers Pressures Environmental State
Driver - Transport policy to date: • Geared to efficient movement of people and goods;
• Bur recognition that transport systems have significant impacts
on quality of life and health.
Driver - Transport in future: • Should be aimed at protecting and promoting good health
minimising CO2 production as well as providing effective means
of moving people and goods.
25
• N.B. The law of unintended consequences e.g. use of diesel engines in cars; CO2 but NOx
• Hence S.Gov. Low Emission Strategy (LES).
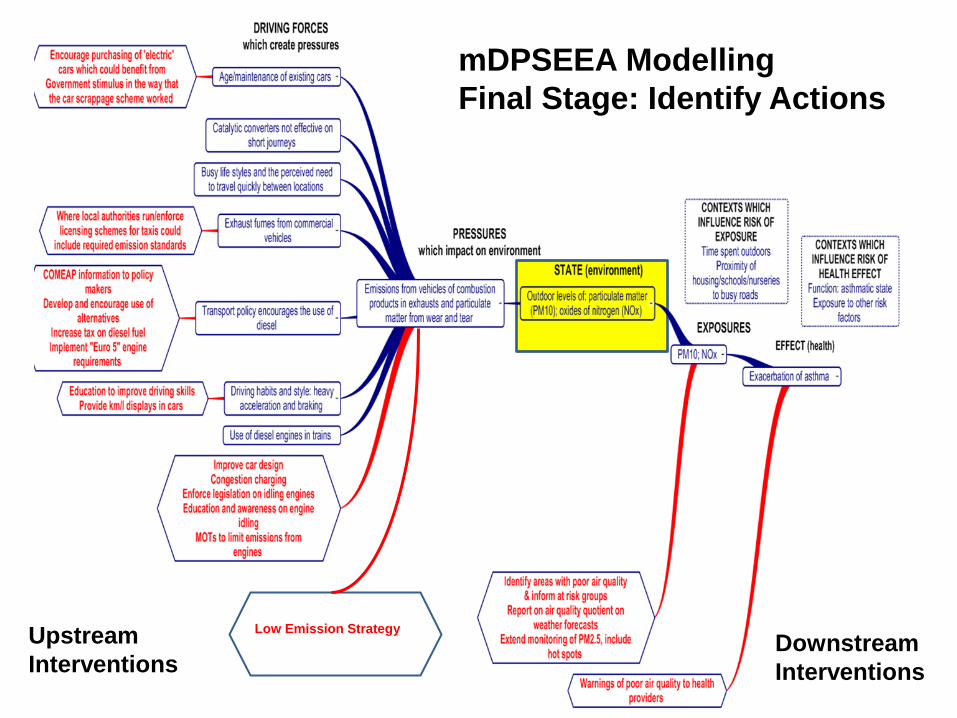
mDPSEEA Modelling
Final Stage: Identify Actions
Low Emission Strategy Upstream
Interventions Downstream
Interventions

By-products:
• Review of evidence on air pollution and health impacts with key
messages based on best evidence.
• Review of evidence on influencing and modifying behaviour
linked to reducing air pollution associated with transport use, with
key messages on what works in practice, in behaviour
modification.
• mDPSEEA map of relationships between upstream and
downstream factors that influence the current environmental
state of road traffic related air pollution.
Main Output:
• Formulate key messages aimed at the public, policy makers (and
potentially politicians) based on research evidence-base and
mDPSEEA map. 27
Intended Project Outputs and Outcomes