
DEVELOPING DRUNK DRIVING DETECTION AND AUTO- …
61
ADAMA SCIENCE AND TECHNOLOGY UNIVERSITY SCHOOL OF ELECTRICAL ENGINEERING AND COMPUTING DEPARTMENT OF ELECTRICAL AND COMPUTER ENGINEERING DEVELOPING DRUNK DRIVING DETECTION AND AUTO- MATIC ENGINE LOCKING SYSTEM A THESIS SUBMITTED TO ADAMA SCIENCE AND TECHNOLOGY UNIVERSITY, DEPARTMENT OF ELECTRICAL AND COMPUTER ENGINEERING, IN PARTIAL FULFILLMENT OF THE REQUIREMENT FOR THE DEGREE OF MASTERS OF SCIENCE IN INDUSTRIAL AUTOMATION AND CONTROL BY: MOHAMMED MAHADE MOHAMMED IBRAHIM KEDIR MOHAMMED ADVISOR: DR. SATEESHSUKHAVASI JUNE, 2016 ADAMA, ETHIOPIA
Transcript of DEVELOPING DRUNK DRIVING DETECTION AND AUTO- …

ADAMA SCIENCE AND TECHNOLOGY UNIVERSITY
SCHOOL OF ELECTRICAL ENGINEERING AND COMPUTING
DEPARTMENT OF ELECTRICAL AND COMPUTER ENGINEERING
DEVELOPING DRUNK DRIVING DETECTION AND AUTO-
MATIC ENGINE LOCKING SYSTEM
A THESIS SUBMITTED TO
ADAMA SCIENCE AND TECHNOLOGY UNIVERSITY, DEPARTMENT OF
ELECTRICAL AND COMPUTER ENGINEERING, IN PARTIAL FULFILLMENT OF
THE REQUIREMENT FOR THE DEGREE OF MASTERS OF SCIENCE
IN INDUSTRIAL AUTOMATION AND CONTROL
BY:
MOHAMMED MAHADE
MOHAMMED IBRAHIM
KEDIR MOHAMMED
ADVISOR: DR. SATEESHSUKHAVASI
JUNE, 2016
ADAMA, ETHIOPIA

DECLARATION
We hereby declare that this project entitled “Developing Drunk Driving Detection and Auto-
matic Engine Locking System” in partial fulfillment for the requirements for the award of the
degree of Master of Science in Industrial Automation and Control Technology Management is
the result of our own research except as cited in references. The work carried out from March to
May 2016 under the supervision of Dr. Sateesh Sukhavasi, Department of Electrical and Com-
puter Engineering, in Adama Science and Technology University. The matter embodied in thesis
project has not been accepted for any degree and is not submitted in candidature of any other de-
gree or diploma.
Name Signature Date
Mohammed Mahade ________________________ ______________
Mohammed Ibrahim ________________________ _______________
Kedir Mohammed ________________________ _______________
I, the advisor, hereby declare I have read this project and in my opinion this thesis project is suf-
ficient in terms of scope and quality. This thesis project has been submitted for examination with
my approval.
Dr. SateeshSukhavasi ________________________ _______________
(Advisor) Signature Date

APPROVED BY BOARD OF EXAMINERS
______________________ _____________________
Chairman, Department of ECE Signature
______________________ _____________________
Internal Examiner Signature
______________________ ______________________
External Examiner Signature

i
ACKNOWLEDGEMENTS
We would like to extend our gratitude to many people who contributed to bring this thesis frui-
tion. First, we would like to thank our advisor; Dr. Sateesh Sukhavasi for his guidance
and provide suggestions and comments that make the work very simple, clear and efficient.
Secondly; we would like to express our secrete appreciation and gratitude to Mr. Mohammed
Aba Jobir for crucial support on developing codes for this project; without his contribution the
completion of this project was blemished and Dr.Vnill for his providing support for burning
source code on microcontroller and suggesting important ideas on hardware development.
Particular thanks go to Adama Science and Technology University, especially Electrical and
Computer Engineering Department for their facilitating and handling in all corners until the
completion of this thesis.
Finally we would like to give our appreciation for Automotive engineering Department staffs,
especially Mr. Nuguse for he giving us key concepts on Electric Fuel Pump Motor and its prin-
ciple of operation.
ii
ABSTRACT
With the development of economy, more and more cars appear in the roads. As the number of
vehicles increased traffic accidents also increased. One of the causes for these accidents is drink-
ing and driving. Many drivers ignore the danger about driving after drinking, so that drunk driv-
ing causes a large number of traffic accidents all over the world. Drunk driver will not in stable
condition and so the rash driving is inconvenience for road users and also question of life and
death for drunk driver and others. The high amounts of properties are also destroying within the-
se accidents. To reduce accidents caused by drunk driving, the vital mechanism to prevent acci-
dents should be established. In this thesis work, the implementation of drunk driving detection
and automatic engine locking system is present. Regarding to this project sufficient data was col-
lected from different sources and analyzed. The project circuitry was developed around micro-
controller PIC16F77A. The C language code was developed with MikroC PRO compiler for mi-
crocontroller PIC16F77A. System model was simulated using Proteus software and its prototype
was constructed and tested accordingly.
Key Words: Drunk Driving,Alcohol Sensor, Microcontroller, Engine/Motor

iii
TABLE OF CONTENTS
Contents Page
ACKNOWLEDGEMENTS......................................................................................................... i
ABSTRACT .............................................................................................................................. ii
TABLE OF CONTENTS .......................................................................................................... iii
LIST OF FIGURES ....................................................................................................................v
LIST OF TABLES .................................................................................................................... vi
ACRONYMS and ABBREVIATIONS .................................................................................... vii
CHAPTER ONE .........................................................................................................................1
INTRIODUCTION .....................................................................................................................1
1.1. Statement of the Problem ..................................................................................................2
1.2.Objectives of the Project ....................................................................................................2
1.2.1. General Objective .........................................................................................................2
1.2.2. Specific Objectives........................................................................................................2
1.3. Research Questions ...........................................................................................................2
1.5. Significance of the Project ................................................................................................2
1.6. Scope of the Project ..........................................................................................................3
1.7. Limitation of The Project ..................................................................................................3
1.8. Organization of the Project ...............................................................................................3
CHAPTER TWO ........................................................................................................................4
LITERATURE REVIEW ............................................................................................................4
2.1.Dynamics of Road Traffic Accidents .................................................................................4
2.1.1. Globally ........................................................................................................................4
2.1.2. Ethiopian Scenario ........................................................................................................6
2.2.Mechanisms for Preventing Accidents ...............................................................................7
CHAPTER THREE ................................................................................................................... 10
SYSTEM description ................................................................................................................ 10
3.1. Block Diagram ................................................................................................................ 10
3.2. Description ..................................................................................................................... 10
3.4.Components Description .................................................................................................. 14

iv
CHAPTER FOUR ..................................................................................................................... 33
METHODOLOGY.................................................................................................................... 33
4.1. Data collection ................................................................................................................ 33
4.2.Data Analysis .................................................................................................................. 33
4.3. Required Materials .......................................................................................................... 34
4.3.1. Hardware Components ................................................................................................ 34
4.3.2. Software Components ................................................................................................. 34
CHAPTER FIVE ...................................................................................................................... 40
RESULT AND DISCUSSION .................................................................................................. 40
5.1. Modeling and Simulation ................................................................................................ 40
5.2.Hardware Developmentand Testing ................................................................................. 42
CHAPTER SIX ......................................................................................................................... 45
DISCUSSION, CONCLUSION AND RECOMMENDATION ................................................. 45
6.1. Discussion ...................................................................................................................... 45
6.2. Conclusion ...................................................................................................................... 45
6.3. Recommendation ............................................................................................................ 46
REFERENCES ......................................................................................................................... 47
APPENDIXES .......................................................................................................................... 49
Appendix - I: Source Code .................................................................................................... 49
Appendixes-II ........................................................................................................................ 51
PIC16F877A Pin Configurationanddescription ...................................................................... 51
Appendixes-III- Simulations and Photos ................................................................................ 53

v
LIST OF FIGURES
Page
Fig.2.1 Contribution factors for car accident ...................................................................... 7
Fig.3.1 Block diagram of drunk driving detection & automatic engine locking system ...... 10
Fig.3.2 System Flow Chart ................................................................................................ 11
Fig.3.3 Circuit Diagram..................................................................................................... 13
Fig.3.4 MQ-3 Alcohol sensor internal connection.............................................................. 15
Fig.3.5 Sensor pins and its internal structure...................................................................... 15
Fig.3.7 L7805 Regulator Photo ......................................................................................... 18
Fig.3.8 NPN Transistor symbols........................................................................................ 18
Fig.3.9 Two metal plates separated by an insulating dielectric ........................................... 20
Fig.3.10 Capacitor symbols, (a) non polarized capacitor while (b) polarized capacitor ... 20
Fig.3. 11 Capacitors photo................................................................................................. 21
Fig.3.13a) Diode symbol and b) Diode voltage-current curve, I-V curve ........................... 22
Fig.3.14 Electric Fuel Pump Motor ................................................................................... 24
Fig.3. 15 Electronic fuel pump wring diagram ................................................................... 24
Fig.3.16 Buzzer's photo and symbols ................................................................................. 25
Fig.3.17 Relay photo ......................................................................................................... 26
Fig.3.18 Relay internal connection .................................................................................... 27
Fig.3.19 PIC16F877A Photo ............................................................................................. 27
Fig.3.20 Crystal oscillator ................................................................................................. 30
Fig.3.21 LCD's photo ........................................................................................................ 31
Fig.3.22 Pin diagram of LCD ............................................................................................ 32
Fig.5.1 System Simulations Under Normal Condition ....................................................... 40
Fig.5.2 System Simulations Under Influence of Alcohol ................................................... 41
Fig.5.3 Condition when Alcohol does not detected by sensor ............................................ 44
Fig.5.4 Condition when Alcohol detected by sensor .......................................................... 44

vi
LIST OF TABLES
Page
Table 3.1 Concentration of alcohol in breath and their corresponding BAC value .............. 12
Table 3.2 Voltage values and corresponding BAC values .................................................. 12
Table 3.3 MQ3 sensor specification .................................................................................. 16
Table 3.4 1602A LCD Pin Description .............................................................................. 32
Table 5.1 Input and output values of voltage regulator ...................................................... 42
Table 5.2 Input and output values of the sensor ................................................................. 42
Table 5.3 Input, output voltage, Buzzer, LCD and Fuel pump motor status ....................... 43

vii
ACRONYMS AND ABBREVIATIONS
A/D Analog to Digital Converter
BAC Blood Alcohol Concentration
BrAC Breath Alcohol Concentration
DADSS Driving Alcohol Detection System for Safety
DB Data Bus
DDDS Drunk Drive Detection System
DUI Driving Under Intoxication
DWI Driving While Intoxicated
En Enable
EU Europeans Union
GMS Global System for Mobile Communication
GNP Gross National Product
GPS General Position System
LCD Liquid Crystal Display
LED Light Emitting Diode
mg/L Milligram Per Litter
MQ-3 Alcohol Sensor
ppm Percent Per Million
R/W Read/ Write Signal
Rl Load Resistor
Rs Sensor Resistor
Rv Variable Resistor
Vcc Positive Voltage
Vdd Positive Power Supply
Vin/Vout Input Voltage/Output Voltage
Vref Reference Voltage
Vss Negative Power Supply
WHO World Health Organization
Ԑr Dielectric Relative Permittivity

1
CHAPTER ONE
INTRIODUCTION
Now days, many accidents are happening because of the alcohol consumption of the driver or the
person who is driving the vehicle under intoxication. Intoxicated drivers are not in stable condi-
tion and so the rash driving is inconvenience for other road users and also questions of life and
death for drivers themselves and others [3, 4]. Thus Drunk and driving is a major reason of acci-
dents in almost all countries all over the world. Absorption of alcohol into the blood stream af-
fects people by making them intoxicated. Technically it is determined by the driver's blood alco-
hol level called the ‘blood alcohol concentration’ (BAC), which indicates the degree of intoxica-
tion. In many countries 0.08 grams of alcohol per 100 mL of blood (BAC 0.08) is set as the legal
limit beyond which the driver is considered to be legally drunk. Any driver with BAC > 0.08 can
be considered to be driving under the influence of alcohol (DUI) or driving while intoxicated
(DWI) and should not be allowed to drive, because, it affects the central nervous system of a per-
son which instable the driver's ways of thinking [2& 5].
In order to illuminate drunk driving many countries was developed technologies that detects
driver breath and control the vehicles from accidents in different ways. By revising and analyz-
ing previous works we developed new technology that should be fitted / installed in the modern
vehicles and integrated with electric fuel pump motor. This part is chosen for control based on its
ease, safe, efficient controllability and capability of controlling vehicle’s ignition system.
The system was made from a compact circuitry built around PIC microcontroller, alcohol sensor
and other drive circuits. The heart of this project is alcohol sensor while brain is microcontroller.
The function of alcohol sensor MQ3 is to detect the alcohol concentration from driver's breath
and generates input voltage for microcontroller. The microcontroller produces the output signal
depending on the blood concentration in the driver's breath. When the driver's blood concentra-
tion is above the set limit it deactivates and activates its output pins according to program code
installed in it. As a result buzzer and LCD displays are activated. After a few delay time fuel
pump motor driver circuit also energized. This is time we expected that the driver places the car
at appropriate position and stop smoothly.

2
1.1. Statement of the Problem
Today we observing that the accidents of vehicles are coming widely in which a lot of people are
died and millions of property are destroyed in similar. In Ethiopia every morning different medi-
as reporting that these much accidents are happened and these much peoples are died and injured
and also lots of properties are destroyed. The causes of these accidents are estimated as the prob-
lem of over loading, over speed, illegal road use, inefficient for driving and alcohol consumption.
Among these, alcohol consumption is most and highly estimated as the reason for car accidents
[21]. Some drivers use alcohol on their journey, especially they take beer for refreshment and at
their lunch time. This may bring them to serious accidents, because alcohol in nature can affects
internal nervous system of the people.
1.2.Objectives of the Project
1.2.1. General Objective
The main objective of this project is to develop a system that can detect the alcohol content in the
air exhaled by the driver and automatically turn off the car if Alcohol concentration exceeds the
legal limit.
1.2.2. Specific Objectives
To minimize the traffic accidents arisen do to drunk driving.
To increase the accuracy of traffic police decision on driver.
To keep personality traits and mental health of driver.
1.3. Research Questions
1. What are the causes beyond the traffic accidents?
2. What is the contribution of alcohol consumption on traffic accidents?
3. How does alcohol detection plays vital role on preventing vehicle accidents?
4. Is there any mechanisms used to prevent drunk driving as Ethiopian context?
1.5. Significance of the Project
This project plays great role in preventing the traffic accidents arisen with drunk driving. It
brings the accurate decision on drunk driving and increases the safety and health of driver and
other people. So alcohol detection system in an automobile is a must feature which every car or

3
bus should have. It is inessential for traffic police for he can easily identify impaired driver. It is
important in reducing tax load on traffic police and saving people’s properties.
1.6. Scope of the Project
This project mainly focused on development of drunk driving detection and automatic engine
locking system using alcohol sensor and microcontroller. The project consists of program devel-
opment, Model development and simulation, and hardware development and testing. The proto-
type output is demonstrated using electric fuel pump motor, LCD and BUZZER.
1.7. Limitation of The Project
The study of this thesis was proceeding from data collection. In our country the causes of traffic
accidents are not recorded specifically. Only the annual or daily number of accidents, death, inju-
ries and property destroyed are recorded and documented. This is difficult to know which causes
at what volume it may cause the accidents. Specially the amount of alcohol concentration in hu-
man blood at which it can affects driver's mentality should be scientifically examined. In other
ways the standardized materials required for this project are also challenge to found.
1.8. Organization of the Project
This thesis paper is organized under six chapters with different sub-sections. The preceding
Chapter is an introductory part, which includes general back ground of the study, statement of
the problem, objectives of the study, research questions, scope of the study, significance of the
study, limitation and delimitation of the study, deferent materials and methods. Chapter two
highlights review of literature studies on road traffic accidents and technological mechanisms
used by different countries. Chapter three deals with system block system description (it includes
block diagram, components description and system description). Chapter four describes and jus-
tifies the data gathering methods used and outlines how data was analyzed. Chapter five is about
Analysis and Findings (model, simulation). Chapter six is about discussions, Conclusion and
Recommendations.

4
CHAPTER TWO
LITERATURE REVIEW
2.1. Dynamics of Road Traffic Accidents
2.1.1. Globally
Road traffic accidents-the leading cause of death by injury and the tenth-leading cause of all
deaths globally. An estimated 1.2 million people are killed in road crash each year, and as 50
million are injured, occupying 30 percent to 70 percent of orthopedic beds in developing coun-
tries hospitals. When the present trends continue, road traffic injuries are predicted to be the third
leading contributor to the global burden of disease and injury by 2020. Road traffic accident inju-
ries are predictable and preventable, but good data are important to understand the ways in which
road safety interventions and technology can be successful transferred from developed nations
where they have proven effective. Awareness of the consequences of road traffic injuries is lag-
ging among policy makers and the general public. What needed is in corporation of comprehen-
sive road safety programs in to national planning in developing countries [13 & 14].
According to the World Bank (2012) estimation, road traffic injuries cost 1 percent to 2 percent
of the Gross National Product (GNP) of developing countries, or twice the total amount of de-
velopment aid received worldwide by developing countries. As in developed countries, driver
impairment component of road traffic accidents in developing countries. Driving at excess
speeds, while under the influence of alcohol or drugs, while sleepy or tired, when visibility is
composed, or without protective gear for all vehicle occupants are major factors in crashes,
deaths and serious injuries [17].
In July 2010 the European Commission adopted the Policy Orientations on Road Safety for
2010-2020. One of the strategic objectives identified by the Commission is the enforcement of
road safety rules. Among the Commission’s priorities in this field is the prevention of driving
under the influence of alcohol (drink-driving). As part of the continued effort to prevent drink-
driving, thereby increasing road safety, the Commission wants to examine the possibility to
make alcohol interlock devices mandatory for certain categories of drivers or vehicles. To this
end the present study analyses the role of alcohol in road safety and the experience with alcohol
interlocks in the EU and third countries in the prevention of drink-driving. It further explores the

5
advantages and disadvantages of possible (legal) measures by the European Union, among which
socio-economic costs and benefits. [6]
An extensive review of existing literature has been carried out, leading to the following conclu-
sions [7]:
Alcohol affects the driving skills already at low levels. The effect is gradual, there is no
sudden transition from unimpaired to impaired driving capability;
The fatality risk increases exponentially with the blood alcohol content (BAC) level of the
driver. The risk for drivers with low BAC levels (0.1 to 0.5 g/L) is 1 to 3 times the risk of
sober drivers. For drivers with a BAC level of 0.5 to 0.8 g/L it is already up to 20 times
higher, increasing to 5-30 times for drivers with BAC levels of 0.8 to 1.2 g/L. For high
BAC offenders the risk is 20-200 times higher that of sober drivers.
On the basis of available studies the following conclusions can be drawn on drink-driving in Eu-
rope [7]:
Drink-driving occurs frequently in the EU. The share of drivers having been driving with
BAC- levels above the legal limit in the past month varies from 2% in some Member States,
to above 30% in others.
On the basis of an extensive study on alcohol use in Europe, it has been concluded that
3.45% of all passenger car kilometers in Europe are being driven by drivers under the influ-
ence of alcohol (0.1 g/L or higher), while 0.4% of all kilometers are being driven with a
BAC level of 1.2 g/L or higher.
Based on a detailed assessment by Member State, it is concluded that 20 to 28 % of all road
fatalities in the EU in 2012 can be attributed to drink-driving. This equals 6,000 to 8,500
road fatalities in that year.
On average almost 75% of all seriously injured and killed drivers who were positive for alcohol
had a BAC level above 1.2 g/L. This leads to the conclusion that high BAC offenders are respon-
sible for the vast majority of alcohol related road accidents.
The Global Status Report Road Safety (2013) has found that the risk of dying as a result of road
traffic injury is highest in African region. The African continent recorded an average of 24.1 out
of 100,000 populations dying as a result of road crash in a year. The severity of road traffic
crashes is likely to be much greater in Africa than any were else, because many vulnerable road

6
users are involved, poor transport conditions such as lack of seat belts, mobile phoning while
driving, and hazardous vehicle environments. African countries experience a dramatic increase
in the number of vehicles on the road. Very often, such increases in road traffic accident are not
matched by adequate improvements in infrastructure and road safety legislation. This results in
lag between private expenditure on vehicles and the public expenditure necessary to accommo-
date increased motorization. [18]
In developed countries there is a legal limit of blood alcohol concentrations (BACs). 0.08 mg/L
is legal limit in all 50 U.S. States and European countries.
2.1.2. Ethiopian Scenario
Ethiopia is one of the worst countries in the world where road transportation kills and injuries are
in large number of road users every year. In Ethiopia, traffic police reports are the official
sources of data for road-related incidents. In Ethiopia, the rate of road traffic accidents is very
high; because of road transport is the major transportation mechanism along with poor road in-
frastructure, poor enforcement of traffic laws and other factors .[19]
Like other low income countries, the traffic controlling system is not that much supported by
modern technological instruments in Ethiopia. Currently, the country is almost using relatively
simple and outdated controlling methods which had been applicable before several decades. It
seems that more sophisticated optimization methods are failed for networks. Modern instruments
such as traffic speed enforcement hand-held radar and alcohol breath tester, among others, is still
not introduced in the country. Of course, according to studies most traffic accidents are the result
of speed, lack of road signs and driver’s impairment of judgment. Many say that speed, drunk
driving and lack of enforcement are said to be the causes of the major failures of the traffic sys-
tem in Ethiopia. Within a year, over 2,000 people die while over 8,000 are vulnerable to light
and heavy injuries and properties worth over 500 million birr get damaged in the country be-
cause of road traffic accidents.[15&16]
In 2010, Ethiopia launched the Growth and Transformation Plan (GTP) with the aim of signifi-
cantly cutting traffic fatality rates by 80%. However with the GTP coming to an end in 2015,
traffic accident death toll stands at 72 deaths per 10,000 vehicle accidents annually. Statistics
show that on average 8 people die per day in traffic related accidents in Ethiopia. The federal

7
Transport Authority said it is working towards introducing new methods to curb the high rates of
accidents including raising awareness among road users in the country [10].
In 2013, Ethiopian car accidents statics shows the causes of accidents and their volumes as the
following pi chart.
Fig.2.1 Contribution factors for car accident[21]
According to the world health organization (WHO) report, published in April 2014, traffic acci-
dents in Ethiopia account for the deaths 37.28 persons per 100,000 deaths. This is 2.77 percent of
the total deaths in the country, placing the Ethiopia 12th in the world. Data from the bureau indi-
cates that 80% of the accidents occurring in the city can be blamed on faulty driving. Again data
indicates that most of accidents occur on straight and suitable roads as well as in good weather
condition [11].
In order to tackle traffic accidents and minimize fatalities, the Ethiopian traffic agencyin collabo-
ration with the city administration, is to start mobile traffic monitoring, which will allow the au-
thorities to spot check problems and solve then. The Traffic Management Agency, which was
previously under the AATB, is now being established to facilitate the control system of traffic
flow. [21]
2.2.Mechanisms for Preventing Accidents
Many developed countries have been introducing different traffic accident prevention mecha-
nisms at different time. The potential for in-vehicle technology that could prevent alcohol-
impaired driving has been recognized. Current aftermarket breath testing devices, in use for sev-
eral decades, can be installed in vehicles and measure a driver’s BAC. These devices predomi-
80%
9%
6%5%
Driver Fault 80%
Defect on road sign andmaintenance 9%
Weather andenvironmental condition6%Defect of car 5%

8
nantly used by drivers convicted of driving while intoxicated (DWI), and require drivers to provide
breath samples before starting their vehicles. If a positive Breath Alcohol Concentration (BrAC)
is registered, the vehicle cannot be started. Studies indicate that while these devices are on the
vehicles of convicted DWI offenders, they can reduce recidivism by about two-thirds. [9]
The American government has been advising its citizens not to drink and drive for decades. cur-
rently they introduced a new system called the Driver Alcohol Detection System for safety
(DADSS) which is actually prevent a car from starting if its driver is intoxicated. Last year
(2014/2015) in Washington, the National Highway Traffic Safety Administration unveiled the
revolutionary new technology, which has been the culmination of work and research that has
been ongoing since 2008.DADSS detects alcohol levels by way of two key mechanisms, the first
is a breathalyzer system located either on the steering wheel or the driver’s side door that is ca-
pable of detecting alcohol in the air particles around it. This means that even if the driver doesn’t
have the foresight to blow into the device, or doesn’t want to, the system will still be able to de-
termine how many drinks he or she has imbibed. The other method involves a touch sensor
mounted either on an ignition button or a gear shift that employs near-infrared tissue spectrosco-
py to determine the driver’s blood alcohol content. Like the breathalyzer system, if it registers
over the legal limit of 0.08, the system will disable the car, and driving simply won’t be physical-
ly possible. Additional features include programming cars to shut down if the driver is under in-
toxicated and has had anything at all to drink. DADSS is still several years away from being im-
plemented in real cars. While the NHTSA would certainly advocate for automakers to install the
technology in their vehicles, it would not be a required feature. The agency hopes that with a
successful initial launch, DADSS will eventually become common place. Still, the system has
met with some opposition, with skeptics claiming that it will not curb drunk driving as much as it
will simply prevent casual drinkers from getting home safely. They are still on a great deal of
work to do, but they need support from Congress and the industry to achieve key research and
development milestones. DADSS has enormous potential to prevent drunk driving in specific
populations such as teen drivers and commercial fleets, and making it an option available to ve-
hicle owners would provide a powerful new tool in the battle against drunk driving deaths.[9]
Few later a go the technology that could prevent alcohol-impaired driving has been invented by
using micro controller and other circuitry in many country like India. This is used for indicating

9
sign either by displaying on board or alerting to help traffic police for control as well as for pas-
sengers in order to shout for their rights. Since few years ago this technology was imbedded with
vehicle’s engine system to activate the ignition relay as it capable to make ON and OFF the relay
depending on presence and absence of alcohol in driver breath. Currently microcontroller based
alcohol detector and auto engine locking system is popular in many developed countries such as
USA, India, Canada, etc. Even in some developed countries the system was integrated with GPS
and GMS [12], which helps the traffic to control the drunk drivers easily and to inform the fami-
ly/ relatives of the driver for the safety of the driver.

10
CHAPTER THREE
SYSTEM DESCRIPTION
3.1. Block Diagram
Fig.3.1 Block diagram of drunk driving detection & automatic engine locking system
3.2. Description
The term “alcohol” in its purest sense denotes “ethyl alcohol or ethanol”, a liquid which is ob-
tained from the action of yeast on sugar, but in colloquial terms it usually refers to “a drink such
as beer, wine and whiskey that can make people drunk”.(Collins English Dictionary)
If the driver or a person nearest to the driver has consumed alcohol then it is detected by the sen-
sor. Sensor gives this signal as input to Pin2 or Pin3 of microcontroller which is built in as A/D
converter circuit. Then the microcontroller checks the signal with the sat limit. If the driver's
blood alcohol concentration is above the set limit the microcontroller output ports activated, as a
result buzzer is ON and LCD displays “DRUNK DRIVER". After a few delay time the fuel
pump motor driver circuit energized, thus, the fuel pump motor works for a few delay time. It is
the time that enables the driver to take the car into appropriate position and stops safely.
12v dc
/battery /
PIC16F77A
M/CNTROLER
ECU
Electric Fuel
pump mo-
tor
Converter
Alcohol
sensor
Crystal
Relay
Relay driver
Buzzer
LCD
Power Flow
Signal Flow

11
NO YES
Fig.3.2 System Flow Chart
The main unit of this project is an “Alcohol sensor”. The sensor consists of a tin dioxide sensi-
tive layer inside aluminum oxide micro tubes, measuring electrode and a heating element inside
a tubular aluminum casing. The front end of the sensor is covered using a stainless steel net and
the rear side holds the connection terminals. The ethyl alcohol present in the breath is oxidized
into acetic acid while passing over the heating element. The ethyl alcohol present in the breath is
oxidized into acetic acid while passing over the heating element. This ethyl alcohol falls on the
tin dioxide sensing layer and as a result its resistance decreases. This resistance variation is con-
verted into a suitable voltage variation using an external load resistor [1, 6, 8, 9].
It is necessary to devise a method to create test gas concentrations to mimic various BAC’s. The
blood alcohol concentration is defined to be the percentage of alcohol, in grams, in 100mL of
Start
Alcohol sen-
sor detects
driver’s
If alcohol
concentration
is low (<2v)
Buzzer ON
LCD “Drunk Driver”
Motor STOP
Buzzer OFF
LCD” Safe to Drive”
Motor RUN
End

12
blood. Therefore, 0.08% BAC is 80mg of alcohol within 100mL of blood. Since the sensor de-
tects the presence of alcohol in air, not blood, a relatively constant ratio of 2100:1 was imple-
mented to create these mock solutions. This ratio comes from a scientifically agreed upon notion
that the Breath Alcohol Concentration is defined as the amount of alcohol, in grams, in 210L of
air. [20]. There is standard conversion from breath alcohol content to blood alcohol contents. So,
��� = �����ℎ��
�∗ 0.21
Table 3.1 Concentration of alcohol in breath and their corresponding BAC value
Concentration of alcohol in breath (gram/litter) BAC (%) 0 0.00
9.5 x 10⁻⁶ 0.02 1.9x 10⁻⁵ 0.04 2.8x 10⁻⁵ 0.06 3.8x 10⁻⁵ 0.08 4.7x 10⁻⁵ 0.10 5.7x 10⁻⁵ 0.12 9.5x 10⁻⁵ 0.20
Table 3.2 Voltage values and corresponding BAC values
Voltage (V) BAC (%) 0 0.00
4.02 0.02 4.14 0.04 4.25 0.06 4.32 0.08 4.42 0.10 4.75 0.20

13
Hereunder the complete system model circuit was developed by using Proteus software.
Fig.3.3 Circuit Diagram
In the above circuit instead of alcohol sensor variable input voltage is applied to microcontrol-
ler's analog input pin (RA1 pin) in the form of voltage divider rule through potentiometer (R1
and dRv1), where d is the coefficient of change of potentiometer. The value of input voltage in
the range of(2V to 5V) able to control the micro controller output pins based on program stored
in microcontroller memory. In many countries 2V is scientifically improved that as the minimum
blood alcohol concentration that can disturbs the driver's mentality. Below this value it is accept-
ed scientifically as it does not affect human mind.

14
3.4.Components Description
Power Supply
For the prototype to operate properly there is a need for a power system to supply electrical pow-
er to the MQ3 alcohol sensors, Microcontroller, LCD, Buzzer, Fuel Pump Motor and other elec-
tronic circuits. In this system Fuel Pump Motor and Buzzer need 12Vdc supply while Microcon-
troller, MQ3 sensor and LCD are used 5Vdc power supply. Normally the system supplied from
car battery when it installed in the vehicles. For our demonstration purpose, instead of car battery
we used 12Vdc adapter for Fuel Pump and Buzzer and also converted it to 5Vdc by using
LM7805 regulator for Microcontroller, MQ3 sensor and LCD.
MQ-3Alcohol Sensor
MQ-3 is a stable and sensitive gas sensor which can detect ammonia, carbon dioxide, alcohol,
smoke, nitrogen dioxide etc. The sensor consists of a tin dioxide sensitive layer inside aluminum
oxide micro tubes, measuring electrode and a heating element inside a tubular aluminum casing.
The front end of the sensor is covered using a stainless steel net and the rear side holds the con-
nection terminals.
MQ-3 has different resistance values at different temperature and different concentration of gas-
es. The manufacturer recommends calibrating the sensor at 100ppm of ammonia or 50ppm of
alcohol. The recommended value of the load resistor is between 10K to 47K.

15
The typical connection arrangement of an MQ-3 alcohol sensor is shown below.
Fig.3.4 MQ-3 Alcohol sensor internal connection
Typically, it is used as part of the breathalyzers or breath testers for the detection of ethanol in
human breath. Basically it has 6 pins, the cover and the body. These pins are H-H,A-A and B-B
as shown in figure below. H-H is a tiny heater coil which is coated with ceramic Al2o3 and cov-
ered with sno2, when alcohol gas detected in air the chemical reaction of alcohol gas with Al2o3
takes place and the coil gets heated and flow of electrons will be increased (voltage increased).
So, when there is no alcohol gas, the flow of electrons will be normal. A-A & B-B are the input
and output which can interchanged as inputs or outputs.
Fig.3.5 Sensor pins and its internal structure
16
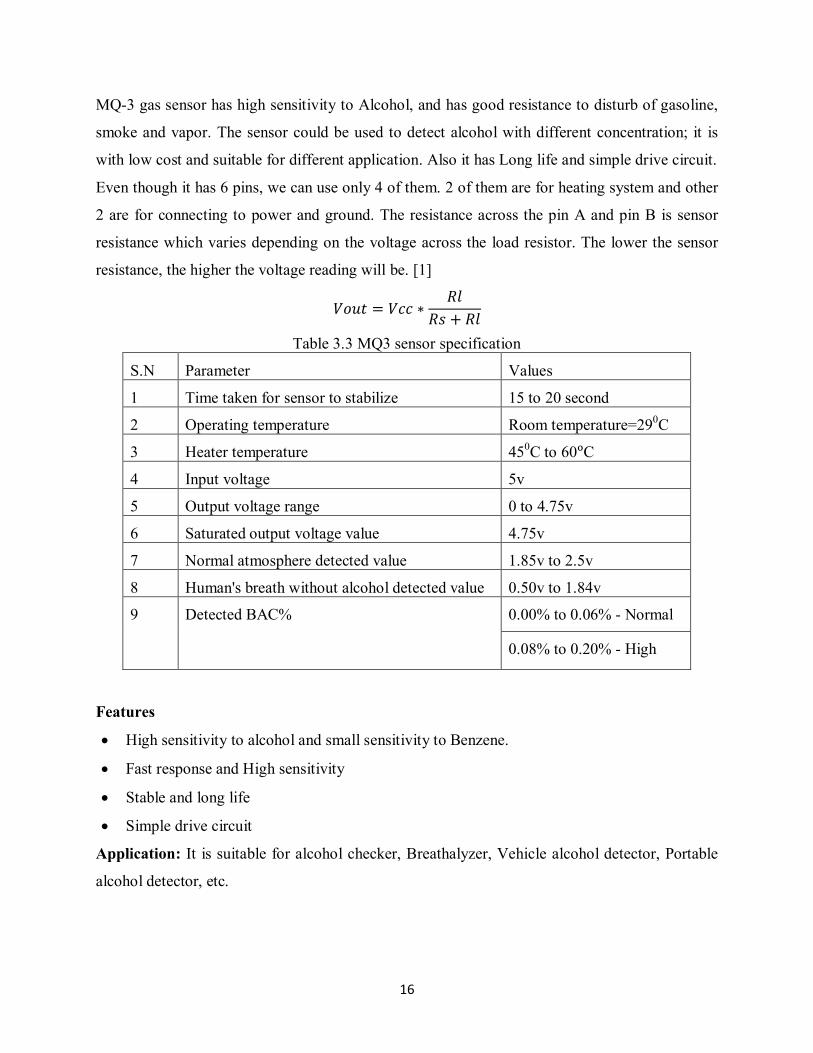
MQ-3 gas sensor has high sensitivity to Alcohol, and has good resistance to disturb of gasoline,
smoke and vapor. The sensor could be used to detect alcohol with different concentration; it is
with low cost and suitable for different application. Also it has Long life and simple drive circuit.
Even though it has 6 pins, we can use only 4 of them. 2 of them are for heating system and other
2 are for connecting to power and ground. The resistance across the pin A and pin B is sensor
resistance which varies depending on the voltage across the load resistor. The lower the sensor
resistance, the higher the voltage reading will be. [1]
���� = ��� ∗��
�� + ��
Table 3.3 MQ3 sensor specification S.N Parameter Values
1 Time taken for sensor to stabilize 15 to 20 second
2 Operating temperature Room temperature=290C
3 Heater temperature 450C to 60ᵒC
4 Input voltage 5v
5 Output voltage range 0 to 4.75v
6 Saturated output voltage value 4.75v
7 Normal atmosphere detected value 1.85v to 2.5v
8 Human's breath without alcohol detected value 0.50v to 1.84v
9 Detected BAC% 0.00% to 0.06% - Normal
0.08% to 0.20% - High
Features
High sensitivity to alcohol and small sensitivity to Benzene.
Fast response and High sensitivity
Stable and long life
Simple drive circuit
Application: It is suitable for alcohol checker, Breathalyzer, Vehicle alcohol detector, Portable
alcohol detector, etc.

17
Voltage Regulator
The 78xx (sometimes L78xx, LM78xx, MC78xx...) is a family of self-contained fixed linear
voltage regulator integrated circuits. The 78xx family is commonly used in electronic circuits
requiring a regulated power supply due to their ease-of-use and low cost. For ICs within the fam-
ily, the xx is replaced with two digits, indicating the output voltage (for example, the 7805 has a
5-volt output, while the 7812 produces 12 Volts). The 78xx line are positive voltage regulators:
they produce a voltage that is positive relative to a common ground.
The LM7805, like most other regulators, is three pin IC. Pin 1(input pin): the input pin is the pin
that accepts the incoming Dc voltage, which the voltage regulator will eventually regulate down
to 5volts. Pin 2(ground pin): ground pin establishes the ground for the regulator. Pin3 (output
pin): the output pin is the regulated 5Volts dc. This is required for some components operate
with 5volts.
Input Voltage: Output Voltage:
7-36 volts DC Vin 1 2 Vout Regulated 5 volts DC
3
Ground
Fig. 3.6 Voltage Regulator
Be advised, that though this voltage regulator can accept an input voltage of 36 Volts, it is rec-
ommended to limit the voltage to 2-3 Volts higher than the output regulated voltage. For a 5-Volt
regulator, no more than 8 volts should be applied as the input voltage. The difference between
the input and output voltage appears as heat. The greater the difference between the input and
output voltage, the more heat is generated. If too much heat is generated, through high input
voltage, the regulator can overheat. If the regulator does not have a heat sink to dissipate this
heat, it can be destroyed and malfunction. So the two options are, design your circuit so that the
input voltage going into the regulator is limited to 2-3 Volts above the output regulated voltage
or place a heat sink in your circuit to dissipate the created heat.
7805 Voltage
Regulator

18
Fig.3.6 L7805 Regulator Photo Transistors
A Transistor is a semiconductor device used to amplify and switch electronic signals and electri-
cal power.
The NPN transistor can be used in two different modes: forward biased mode and the reverse
biased mode. In forward biased mode, the electric current can easily flow through it. So it acts
like a CLOSED SWITCH. However, in reverse biased mode, the current through it is practically
zero and thus, it acts like an OPEN SWITCH.
So in this project the transistors are used in relay driver circuit and acts as switch to deactivates
the relay as a result of base current triggered by alcohol sensor when alcohol is detected and
consequently buzzer and LCD are activated.
Fig.3.7 NPN Transistor symbols

19
We are really that all NPN transistors are used for this project. However for their availability, we
used BC547 transistors. BC547 is an NPN Bi-polar junction transistor (BJT). A transistor, stands
for transfer of resistance, is commonly used to amplify current. A small current at its base con-
trols a larger current at collector & emitter terminals.
Together with other electronic components, such as resistors, coils, and capacitors, it can be used
as the active component for switches and amplifiers. Like all other NPN transistors, this type has
an emitter terminal, a base or control terminal, and a collector terminal as shown in figure 9. In a
typical configuration, the current flowing from the base to the emitter controls the collector cur-
rent. A short vertical line, which is the base, can indicate the transistor schematic for an NPN
transistor, and the emitter, which is a diagonal line connecting to the base, is an arrowhead point-
ing away from the base.
BC547 is mainly used for amplification and switching purposes. It has a maximum current gain
of 800. The transistor terminals require a fixed DC voltage to operate in the desired region of its
characteristic curves. This is known as the Biasing. For amplification applications, the transistor
is biased such that it is partly on for all input conditions. The input signal at base is amplified and
taken at the emitter. BC547 is used in common emitter configuration for amplifiers. The voltage
divider is the commonly used biasing mode. For switching applications, transistor is biased so
that it remains fully on if there is a signal at its base. In the absence of base signal, it gets com-
pletely off.
Capacitors
Capacitors are used in this project for energy storage and for power filtering purpose in oscillator
and voltage regulator circuits.
A capacitor is created out of two metal plates and an insulating material called a dielectric. The
metal plates are placed very close to each other in parallel, but the dielectric sits between them to
make sure they don’t touch each other.

20
Fig.3.8 Two metal plates separated by an insulating dielectric
The dielectric can be made out of all sorts of insulating materials: paper, glass, rubber, ceramic,
plastic, or anything that will impede the flow of current. The plates are made of a conductive ma-
terial: aluminum, tantalum, silver, or other metals. They’re each connected to a terminal wire,
which is what eventually connects to the rest of the circuit.
What makes capacitors special is their ability to store energy; they’re like a fully charged elec-
tric battery. Capacitors, as we usually refer to them, have all sorts of critical applications in cir-
cuits. Common applications include local energy storage, voltage spike suppression, and com-
plex signal filtering.
a) b)
Fig.3.9 Capacitor symbols, (a) non polarized capacitor while (b) polarized capacitor
The capacitance of a capacitor tells you how much charge it can store, more capacitance means
more capacity to store charge. The standard unit of capacitance is called the farad, which is ab-
breviated F.
It turns out that a farad is a lot of capacitance, even 0.001F (1 milifarad – 1mF) is a big capacitor.
Usually we’ll see capacitors rated in the Pico- (10-12) to microfarad (10-6) range.
The total capacitance of a capacitor can be calculated with the equation:
� = �� ∗�
���

21
Where:
εr is the dielectric’s relative permittivity (a constant value determined by the dielectric
material),
A is the amount of area the plates overlap each other, and
d is the distance between the plates.
Fig.3. 10 Capacitors photo
Metal film resistors
Metal film resistors have a thin metal layer as resistive element on a non-conducting body. They
are amongst the most common types of axial resistors. Other film type resistors are carbon film
and thick and thin film resistors. In most literature referrals to metal film, usually it is a cylindri-
cal axial resistor. However, thin film chip resistors use the same manufacturing principle for the
metal layer. The appearance of metal film resistors is similar to carbon film resistors, but their
properties for stability, accuracy and reliability are considerably better.
Typical applications
Metal film resistors have good characteristics for tolerance and stability. Furthermore, the resis-
tors feature low noise properties and a high linearity because of a low voltage coefficient. There-
fore, in circuits where tight tolerance, low temperature coefficient and low noise properties are
important, often metal film resistors are used. Examples of applications are active filters or
bridge circuits.

22
Reliability of metal film resistors
For a good reliability, metal film resistors are normally operated between 20 and 80 percent of
their specified power rating. Reliability is generally increased by de-rating 50%. However, in
very specific situations, at lower than 20% of the power rating in a humid environment the relia-
bility decreases. Compared to wire wound or carbon composition resistors, these resistors are
easier damaged by voltage surges and power overloads.
Freewheeling Diode
Some elements are linear (resistors, capacitors, inductors), which means that doubling the ap-
plied signal (let us say a voltage) produces a doubling of the response (let us say a current). They
are also passive – they do not have built-in source of power. They are two-terminal devices,
(which is self-explanatory).Diode is also two-terminal, passive but non-linear a device.
a) b)
Fig.3.11a) Diode symbol and b) Diode voltage-current curve, I-V curve
The diode arrow, anode terminal, shows the direction of forward current flow. If the diode is in a
circuit in which a current of 10mA=10 x10-3A is flowing from anode to cathode, then the anode
is approximately 0.5 volt more positive than cathode. We call it the forward voltage drop. The
reverse current is measured in nanoampers and 1nA=1x10⁻⁹A. It is so small in comparison to
mA, that can be neglected until we reach the reverse breakdown voltage. Typically it is approx-
imately 75V and normally we never subject a diode to voltage large enough to cause reverse
breakdown.
23
Similarly, the forward voltage drop, which is about 0.5 or 0.8 V, is of little concern. For these
reasons we treat the diode as a good approximation of an ideal one-way conductor. Commer-
cially available diodes are described also by other important characteristics, e.g.: maximum for-
ward current, capacitance (measured in pF), leaking current, reverse recovery time (measured in
nanoseconds, 0-2-4-5000).
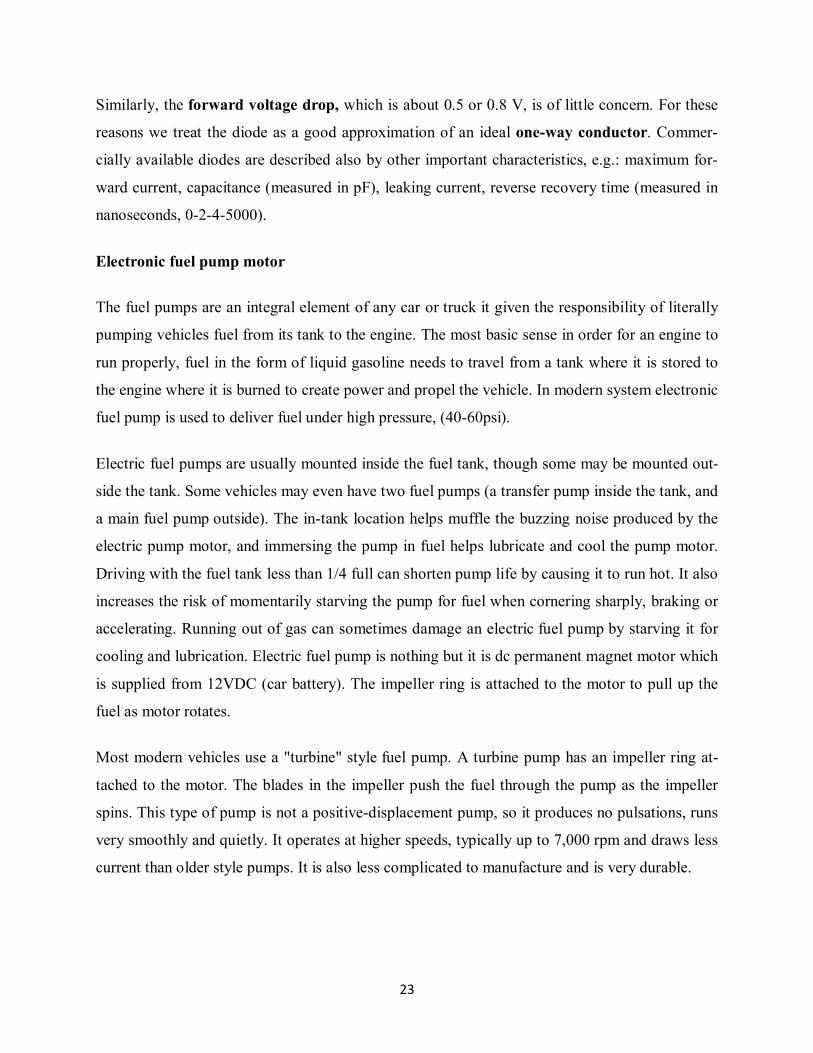
Electronic fuel pump motor
The fuel pumps are an integral element of any car or truck it given the responsibility of literally
pumping vehicles fuel from its tank to the engine. The most basic sense in order for an engine to
run properly, fuel in the form of liquid gasoline needs to travel from a tank where it is stored to
the engine where it is burned to create power and propel the vehicle. In modern system electronic
fuel pump is used to deliver fuel under high pressure, (40-60psi).
Electric fuel pumps are usually mounted inside the fuel tank, though some may be mounted out-
side the tank. Some vehicles may even have two fuel pumps (a transfer pump inside the tank, and
a main fuel pump outside). The in-tank location helps muffle the buzzing noise produced by the
electric pump motor, and immersing the pump in fuel helps lubricate and cool the pump motor.
Driving with the fuel tank less than 1/4 full can shorten pump life by causing it to run hot. It also
increases the risk of momentarily starving the pump for fuel when cornering sharply, braking or
accelerating. Running out of gas can sometimes damage an electric fuel pump by starving it for
cooling and lubrication. Electric fuel pump is nothing but it is dc permanent magnet motor which
is supplied from 12VDC (car battery). The impeller ring is attached to the motor to pull up the
fuel as motor rotates.
Most modern vehicles use a "turbine" style fuel pump. A turbine pump has an impeller ring at-
tached to the motor. The blades in the impeller push the fuel through the pump as the impeller
spins. This type of pump is not a positive-displacement pump, so it produces no pulsations, runs
very smoothly and quietly. It operates at higher speeds, typically up to 7,000 rpm and draws less
current than older style pumps. It is also less complicated to manufacture and is very durable.
24
Fig.3.12 Electric Fuel Pump Motor
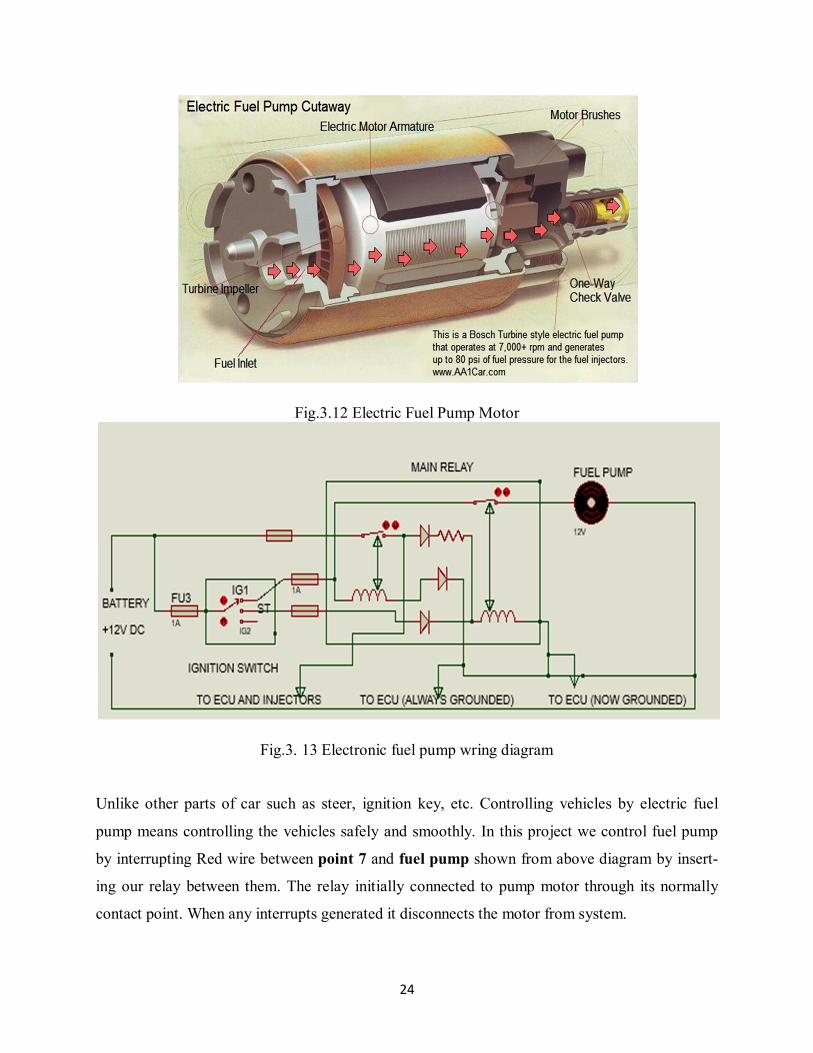
Fig.3. 13 Electronic fuel pump wring diagram
Unlike other parts of car such as steer, ignition key, etc. Controlling vehicles by electric fuel
pump means controlling the vehicles safely and smoothly. In this project we control fuel pump
by interrupting Red wire between point 7 and fuel pump shown from above diagram by insert-
ing our relay between them. The relay initially connected to pump motor through its normally
contact point. When any interrupts generated it disconnects the motor from system.

25
Buzzer
Buzzers are frequently employed to give a user or operator an audio indication of the stage of a
mechanical device. This high reliability electromagnetic buzzer is applicable to automobile
equipment. Compact, pin terminal type electromagnetic buzzer with 2048Hz. Pin type terminal
construction enables direct mounting onto printed circuit boards. it produces sound so that the
polices and peoples in the car understand that the driver consumed alcohol.
Fig.3.14 Buzzer's photo and symbols Relay
A relay is an electrical switch that opens and closes under control of another electrical circuit.
When electricity is applied to the wire, the rod becomes magnetic. A movable contact arm above
the rod is then pulled toward the rod until it closes a switch contact. When the electricity is re-
moved, a small spring pulls the contact arm away from the rod until it closes a second switch
contact.
There are four parts in every relay:
Electromagnet
Armature that can be attracted by the electromagnet
Spring
Set of electrical contacts

26
Fig.3.15 Relay photo Main Feature:
1. AZ Relay Performs high reliability in dry circuit.
2. High density design is available on P.C. Board with size of 10.4x15.4x11.2 in mm and the weight of
3.5 grams.
3. The Employment of 2.54mm terminal pitch is equal to I.C.’s terminal pitch.
4. The low power consumption of AZ-L type and general power consumption type of AZ-D are pre-
pared for user’s wide selection.
5. Complete protective construction is designed from dust and soldering flux. In addition, the plastic
sealed type is prepared for washing procedure.
Application: Telecommunication, Domestic Appliances, Office Machine, Audio Equipment, etc
In general, relay is used to move an armature that is able to switch a much larger amount of pow-
er by using a small amount of electromagnet power which came from a small dashboard switch
or a low-power electronic circuit. When the coil is energized with direct current, a diode is of-
ten placed across the coil to dissipate the energy from the collapsing magnetic field at deactiva-
tion, which would otherwise generate a voltage spike dangerous to semiconductor circuit com-
ponents.
In this project relay is used to control the flow of fuel in the car by controlling the electric fuel
pump motor.

27
Fig.3.16 Relay internal connection
Microcontroller
The PIC microcontroller PIC16f877a is one of the most renowned microcontrollers in the indus-
try. This controller is very convenient to use, the coding or programming of this controller is also
easier. One of the main advantages is that it can be write-erase as many times as possible because
it use FLASH memory technology. It has a total number of 40 pins and there are 33 pins for in-
put and output. PIC16F877A is used in many PIC microcontroller projects. PIC16F877A also
have many applications in digital electronics circuits.
Fig.3.17 PIC16F877A Photo

28
PIC16f877a finds its applications in a huge number of devices. It is used in remote sensors, secu-
rity and safety devices, home automation and in many industrial instruments. An EEPROM is
also featured in it which makes it possible to store some of the information permanently like
transmitter codes and receiver frequencies and some other related data. The cost of this controller
is low and its handling is also easy. It’s flexible and can be used in areas where microcontrollers
have never been used before as in coprocessor applications and timer functions etc.
The PIC16F877A features 256 bytes of EEPROM data memory, self-programming, an ICD, 2
Comparators, 8 channels of 10-bit Analog-to-Digital (A/D) converter, 2 capture/compare/PWM
functions, the synchronous serial port can be configured as either 3-wire Serial Peripheral Inter-
face (SPI™) or the 2-wire Inter-Integrated Circuit (I²C™) bus and a Universal Asynchronous
Receiver Transmitter (USART). All of these features make it ideal for more advanced level A/D
applications in automotive, industrial, appliances and consumer applications
As it has been mentioned before, there are 40 pins of this microcontroller IC. It consists of two 8
bit and one 16 bit timer. Capture and compare modules, serial ports, parallel ports and five in-
put/output ports are also present in it.
How to Program the Input and Output Ports of PIC16F877A
As we have studied 5 input and output ports namely PORTA, PORTB, PORTC, PORTD and
PORTE which can be digital as well as analog. We configured them according to our require-
ments. But in case of analog mode, the pins or the ports can only act as inputs. There is a built in
A to D converter which is used in such cases. Multiplexer circuits are also used. But in digital
mode, there is no restriction. We configured the PORTB and PORTD as output and PORTA as
input. This is done through programming. For PIC the preferable compiler is MikroC pro which
can be downloaded from their website. There is a register named as ‘TRIS’ which controls the
direction of ports. For different ports there are different registers such as TRISA, TRISB etc.
If we set a bit of the TRIS register to 0, the corresponding port bit will act as the digital
output.
If we set a bit of the TRIS register to 1, the corresponding port bit will act as the digital
input.

29
Features of PIC16F77A
-High-performance RISC CPU
- Only 35 single word instructions to learn
- All instructions are single cycle (1µs) except for program branches
- Operating speed: DC - 20MHz clock input
- 8 k Bytes Flash Program Memory
- 368 Byte RAM Data Memory
- 256 Byte EEPROM Data Memory
- In-circuit Serial Programming
- Interrupt Capability (up to 10 sources)
Peripheral Features
- Two 8-bit timer/counter(TMR0, TMR2) with 8-bit programmable pre scalar
- One 16 bit timer/counter (TMR1)
- High current source/sink for direct LED drive
- Watchdog Timer (WDT) with Separate RC Oscillator
- Two Capture, Compare, PWM Modules
- Synchronous Serial Port with SPI and I²C
- Eight Channel, 10-bit Analog to Digital Converter
- Universal Synchronous Asynchronous Receiver Transmitter (USART)
Special Microcontroller Features
- Power-On Reset
- Power-up Timer (PWRT) and Oscillator Start-Up Timer (OST)
- 1,000 erase/write cycles Enhanced Flash Program Memory
- 1,000,000 typical erase/write cycles EEPROM Data Memory
- Selectable Oscillator Options

30
CMOS Technology
- Low power, high speed CMOS FLASH technology
- Fully Static Design
- Low Power Consumption
I/O and Packages
-33 I/O pins with individual direction control
- 40-pin DIP
Advantages of PIC Microcontroller:
PIC microcontrollers are consistent and faulty of PIC percentage is very less. The per-
formance of the PIC microcontroller is very fast because of using RISC architecture.
When comparing to other microcontrollers, power consumption is very less and pro-
gramming is also very easy.
Interfacing of an analog device is easy without any extra circuitry
Disadvantages of PIC Microcontroller:
The length of the program is high due to using RISC architecture (35 instructions)
One single accumulator is present and program memory is not accessible.
Crystal oscillator
A crystal resonator is connected between pin 13 and 14 to provide external clock to the micro-
controller. ¼ of the frequency of OSC1 is outputted by OSC2 in case of RC mode. This indicates
the instruction cycle rate.
Fig.3.18 Crystal oscillator

31
LCD
LCD (Liquid Crystal Display) screen is an electronic display module and find a wide range of
applications. A 1602A LCD display is very basic module and is very commonly used in various
devices and circuits. These modules are preferred over seven segments and other multi segment
LEDs. The reasons being: LCDs are economical; easily programmable; have no limitation of
displaying special & even custom characters (unlike in seven segments), animations and so on.
A 1602A LCD means it can display 16 characters per line and there are 2 such lines. In this LCD
each character is displayed in 5x7 pixel matrix. This LCD has two registers, namely, Command
and Data.
The command register stores the command instructions given to the LCD. A command is an in-
struction given to LCD to do a predefined task like initializing it, clearing its screen, setting the
cursor position, controlling display etc. The data register stores the data to be displayed on the
LCD. The data is the ASCII value of the character to be displayed on the LCD.
Fig.3.19 LCD's photo
32
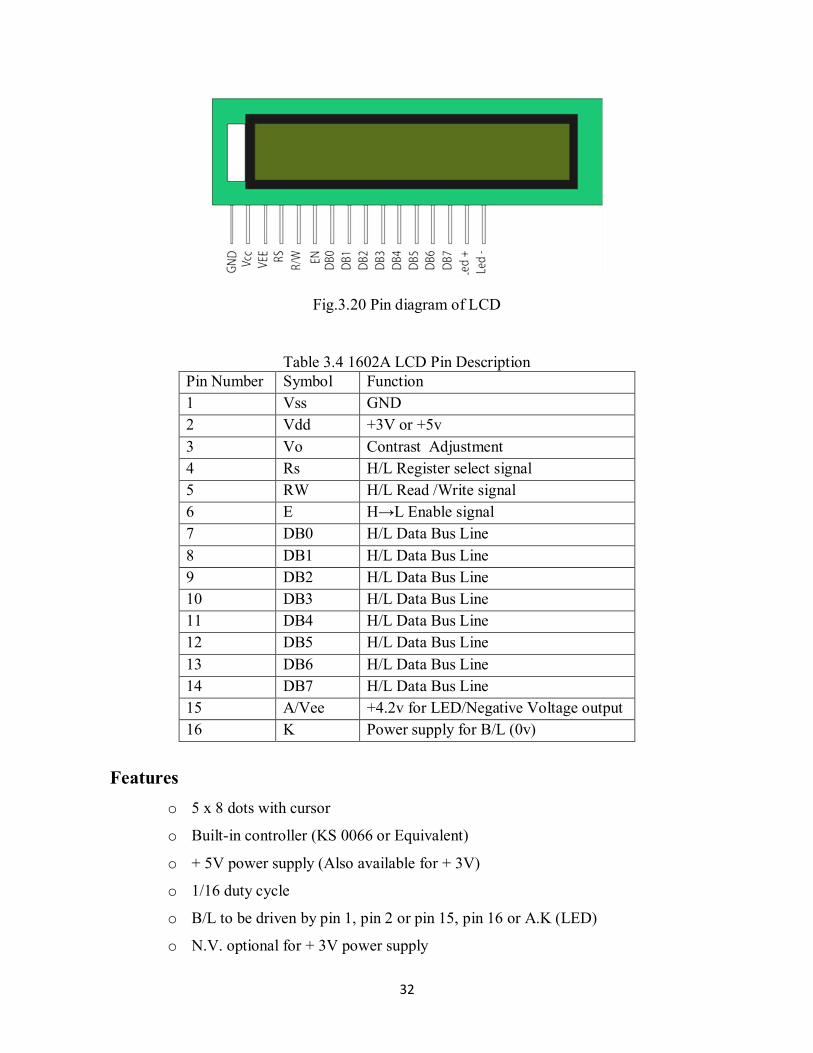
Fig.3.20 Pin diagram of LCD
Table 3.4 1602A LCD Pin Description Pin Number Symbol Function
1 Vss GND
2 Vdd +3V or +5v
3 Vo Contrast Adjustment
4 Rs H/L Register select signal
5 RW H/L Read /Write signal
6 E H→L Enable signal
7 DB0 H/L Data Bus Line
8 DB1 H/L Data Bus Line
9 DB2 H/L Data Bus Line
10 DB3 H/L Data Bus Line
11 DB4 H/L Data Bus Line
12 DB5 H/L Data Bus Line
13 DB6 H/L Data Bus Line
14 DB7 H/L Data Bus Line
15 A/Vee +4.2v for LED/Negative Voltage output
16 K Power supply for B/L (0v)
Features
o 5 x 8 dots with cursor
o Built-in controller (KS 0066 or Equivalent)
o + 5V power supply (Also available for + 3V)
o 1/16 duty cycle
o B/L to be driven by pin 1, pin 2 or pin 15, pin 16 or A.K (LED)
o N.V. optional for + 3V power supply

33
CHAPTER FOUR
METHODOLOGY
4.1. Data collection
Technical and non-technical data were collected from different source. The main sources of data
for this thesis were primary and secondary data. More of these data collection methods were
based on secondary data collection. However, as primary data we used as a chance observation
and oral question at some where accidents occurred during our study. But this is not has so much
acceptance, instead it is base for our motivation for study this problem and collecting secondary
data. Secondary data was obtained from the Adama Traffic Police Department, and Ethiopian
Federal Transport Agency. Moreover, different books, journals of World Health Organization
(WHO) and World Bank, articles and reports publication were also conducted. Furthermore, so
as to get a general picture of road safety problems specifically drunk driving detection, a good
closure was made with internet web sites.
4.2.Data Analysis
In order to systematically solve the problems, the quantitative research methodology was used in
this study. This type of research methodology was used to generate the road accident statistics
from the traffic police and part from the respondents.
The tasks of this thesis were classified into three phases:
Phase1: Review, Data collection and Analysis
Data was collected from different sources including general literature, website, interna-
tional journals, different books, You Tubes and online information
Technical and electrical parts of modern vehicles were studied.
Operations and features of Breathalyzer devices were detail outlined.
Phase2: Developing a Model and Simulation.
By using technicalmethods related to vehicle system and breathalyzer devices drunk driv-
ing detection and automatic engine locking system circuit was developed and simulation
is carried out by using Proteus software and MikroCPRO compiler.
Graphical simulation is carried out by Digital Oscilloscope

34
Phase 3: Hardware development and test.
Appropriate materials and components used for system were supplied.
The model was developed on bridge board and tested for realization.
The prototype of the project was carried out on PCB board.
The constructed prototype was tested by using LCD, Buzzer, and Fuel Pump Motor.
4.3. Required Materials
4.3.1. Hardware Components
1. Power supply( 12v DC)
2. Alcohol sensor-MQ3
3. Microcontroller (PIC16F877A)
4. Buzzer 12VDC
5. Regulator-7805
6. Relay 12VDC ,5pins
7. Diode 1N4004
8. LED (Green & Yellow)
9. Transistors (NPN)
10. LCD 16x2
11. DC Motor/ Electric fuel pump motor (Permanent magnet 12v DC,7000 Psai)
12. Resistors(10k)& potentiometer(100k)
13. Capacitor22pF & 0.1µF(ceramic type)
14. Crystal 8MHz
4.3.2. Software Components
1. Proteus
2. MikroC PRO compiler

40
CHAPTER FIVE
RESULTS
5.1. Modeling and Simulation
Complete Circuit Simulation Results
Here we used variable resistor to produce different input voltages for microcontroller as input
through R1 and RV1. We used 5V DC from Regulator output and varied it through variable resis-
tor by applying voltage divider rule with resistor R1 as following equation:
��� = ��������1
�����1 + �1
Where Vdd is supply voltage, d is coefficient by which variable resistor is changed. When d is
equal to 1, then the value of����� = 5 ∗��
�����= 3.33� > 2, this is found in the range at which
the relay can be disabled.
Based on the program developed and burned on microcontroller the model circuit is simulated
and result input output results are taken as shown in the following diagram.
Fig.5.1 System Simulations Under Normal Condition

41
From the above simulation we see that the potentiometer resistor center tapped pointer is on the
top position which shows that the Rv1 is very low and Vin is <<2. This indicates that therewas
no alcohol disturbance in the vehicle. So the system is operating under the normal condition.
Hence motor is on running, LCD shows that the driver is "SAVE TO DRIVE" and buzzer is
OFF.
Fig.5.2 System Simulations Under Influence of Alcohol
Now the pointer is below half of the resistor. This indicates that the resistor is increased, Vin in-
creased and micro controller activates the output pins, thus the relay disconnects the power
from motor, and buzzer is alerted, also LCD displayed the warning words "DRUNK DRIVER".
The push button seen on the diagram is used as RESET. When it pressed all functions of micro-
controller are stopped and when it reset the operation is continued. This is needed for keeing the
vehicles from further accidents. In the case when vehicle is at inappropriate place to stop and at
the same time the disturbance of alcohol going to stop the car, the only solution is stopping the
microcontroller functions and after he passed the obstacle he should reset the microcontroller to

42
continue its operation. This time fuel pump motor continued to run, however LCD remain with
displaying warning. This is the best and most consideration when designing this project.
5.2.Hardware Developmentand Testing
Proper testing of the voltage regulator is essential. The completed circuit of the voltage regulator
was constructed and tested using LED putting with 10ohm resister in series and the correspond-
ing output voltage across the LED and resister was read 4.99V using digital multi meter.
The input and output voltage and current values of the voltage regulator are shown in the table
below.
Table 5.1 Input and output values of voltage regulator
Parameter Voltage (V) Current (mA)
Input 9.8 100.0
Output 4.91 50.0
The voltage and current values of the sensor is given in the table below. The input voltage and
current for the sensor driver are 5V and 25mA respectively while the output voltage is varies
from 0V to 4.75V and the output current for the sensor driver is same as input current which is
25mA. There is only small current value in order to protect the sensor from damage.
Table 5.2 Input and output values of the sensor Parameter Voltage (V) Current (mA)
Input 5 25
Output 0 to 4.75 25
The input voltage that was fed into the microcontroller was not entirely linear over all concentra-
tions of ethanol. Hence, careful attention had to be placed so that calibration was over the linear,
or near-linear, region. Attention was also paid to the possibility of saturating or even damaging
the sensor if too high concentration was placed on the sensor. First, the completed circuit without
the alcohol sensor was put through functional testing. The sensor voltage was replaced by a vari-
able resistor. When we moved potentiometer clockwise and anti-clockwise direction the value of

43
input voltage Vin to microcontroller was been increased and decreased respectively with the
principle of voltage divider rule. When the input voltage is below (2V), the microcontroller out-
put pins were deactivated, buzzer OFF, LCD displayed "SAVE TO DRIVE" according to set
program. When the input voltage is above (2V), the microcontroller output pins were activated,
buzzer ON, LCD displayed "DRUN DRIVER" and the system checks the process every 500ms.
Table 5.3 Input, output voltage, Buzzer, LCD and Fuel pump motor status Variable Resistor
Input voltage in (v)
Output volt-age
Buzzer LCD Motor
10k 0.8 0 OFF Save To Drive RUN 20k 1.0 0 OFF Save To Drive RUN 30k 1.5 0 OFF Save To Drive RUN 40k 1.8 0 OFF Save To Drive RUN 50k 2.0 5 ON Drunk Driver STOP 60k 2.45 5 ON Drunk Driver STOP 70k 2.85 5 ON Drunk Driver STOP 80k 3.5 5 ON Drunk Driver STOP 90k 4.5 5 ON Drunk Driver STOP 100k 4.75 5 ON Drunk Driver STOP
Once this calibration was done the sensor was connected to the rest of the circuit. After fixing the
sensor to the driver and connecting it to the circuit board, the output voltage from the sensor at
normal room temperature was taken. This output voltage was set as the reference voltage for the
calibration process. Then, human breath sample was blown to the sensor and the subsequent out-
put voltage was taken. Finally, the sensor was tested using alcohol substance and its output volt-
age was taken as well. The voltages set in the programming were adjusted according to the volt-
age measured during calibration and the hardware was again tested to verify the BAC percentage
produced.

44
Fig.5.3 Condition when Alcohol does not detected by sensor
Fig.5.4 Condition when Alcohol detected by sensor

45
CHAPTER SIX
DISCUSSION, CONCLUSION AND RECOMMENDATION
6.1. Discussion
The purpose of the thesis work is to construct a drunk driving detection and automatic engine
locking system, including an alcohol sensing circuit, and incorporate a microcontroller and a dis-
play to show the results of alcohol concentration, alerting buzzer and controlling the electric fuel
pump motor. The method is to build up the device with a PIC16F877A. Almost the final result of
the thesis work follows our research aim. However because of different air conditions, it was
found that the results of the device were not very stable. The influencing factors to the results are
humidity, ambient temperature. The defect of the method is leading to the inaccurate results.
6.2. Conclusion
Upon the completion of the project, numerous technical issues and nontechnical issues are found
related with the design of the project. Compared to other type of breath alcohol detector, semi-
conductor model has much cheaper cost and considerably effective as well. Furthermore, it can
be interfaced to a microcontroller with ease as the output yield is in voltages. However, it is
found that the value of the concentration becomes saturated for BAC (%) more than 0.20 even
though the alcohol concentration used is more than that value. When power dissipation comes
into concern, the semiconductor sensor model has very low power dissipation although it works
with presence of heat because it only needs low voltage value in the range of 3.3V to 5V as its
input. The sensitivity of the sensor is also relatively high compared to the other models. Alt-
hough the sensor is capable of detecting other substances and misinterpret it as alcohol, but the
sensitivity towards alcohol is much higher and this makes it a very reliable alcohol detecting de-
vice.

46
6.3. Recommendation
Below are the suggestions of further research and work to improve the design ofthe system:
a) Interfacing the system to a wireless signal transmission unit such as GSM and GPS net-
work so that signals can be sent to the authority or family members if high levels are de-
tected.
b) Replacing a sensor which only detects alcohol to increase the accuracy of the BAC (%)
reading.
c) Interfacing the system to a voice recognition system so that only the owner of the vehicle
is allowed to provide the breath sample.
d) Add a temperature and humidity sensor for offering condition compensation.
e) Select more advanced chip to fasting the running speed of the system.

47
REFERENCES
[1] Jimmy James, Aparna C, Teena P John, Alcohol Detection System, International Journal of
Research in Computer and Communication Technology, Vol 3, Issue 1, January- 2014.
[2] David Tin Win,Breath Alcohol Testers - Prevents Road Accidents, AU J.T. 10(2): pp.75-80
Oct. 2012.
[3] B.VINEETHA (11RQ1A0486), “Microcontroller Based Automatic Engine Locking System
for Drunken Drivers”, T.G 2015.
[4] Pratiksha Bhuta, Karan Desai, Archita Keni, “Alcohol Detection and Vehicle Controlling”,
International Journal of Engineering Trends and Applications (IJETA) – Volume 2 Issue 2,
Mar-Apr 2015.
[5] John K. Pollard, Eric D. Nadler, Mary D. Stearns1, Review of Technology to Prevent Alco-
hol-Impaired Crashes (TOPIC), OMB No. 0704-0188, September 2010.
[6] Studyon the prevention of drink-driving by the use of alcohol interlock devices, European
Commission, DG for Mobility and Transport, 18 February 2014, and Rotterdam.
[7] M. Kousikan, M. Sundaraj, “Automatic Drunken Drive Prevention System”, International
Journal of Students Research in Technology & Management Vol 2 (02), pg. 74-77, March-
April 2014.
[8] S.P. Bhumkar, V.V. Deotare, R.V.Babar, Accident Avoidance and Detection On Highways,
International Journal of Engineering Trends and Technology- Volume3, 2012.
[9] Susan A. Ferguson, Eric Traube, Abdullatif Zaouk, Robert Strassburger, DRIVER Alcohol
Detection System For Safety (DADSS),Paper Number 09-0464, November 2013.
[10] Fikadu Mekasha Admassie, Road Traffic Accident: Causes And Control Mechanisms: The
Case of Addis Ababa City, pp 31-32, June 2015.
[11] Ethiopia among worst in Traffic safety _Addis foretune, 13 April 2015.

48
[12] M.H Mohamad, Mohd Amin Bin Hasanuddin, and Mohd Hafizzie Bin Ramli:Vehicle Ac-
cident Prevention System Embedded with Alcohol Detector, 4 October 2013.
[13] (Sains&Kej.) Keluaran Khas, Breath Alyzer Enabled Ignition Interlock System, Jan. 2011:
1-12, University Teknology Malaysia.
[14] Jianan Shi, Design and Implementation of an Alcohol Meter, Bachelor’s Thesis in Elec-
tronics, June 2013.
[15] Hailegnaw Getaneh, A Web Based Road Traffic Accident Reporting System for Ethiopia,
A Project paper, June, 2010.
[16] Berhane G/Yesus,GIS Based Assessment of Road Traffic Accidents in Adama (Nazareth)
City,Thesis,Addis Ababa University, June 2015.
[17] World Bank (2012), International Perspectives in Accident Investigation.
[18] Mark Eshbaugh, Gregmaly, Jonathan D Moyer and Erin Torkelson, “Putting the Brakes on
Road Traffic Fatalities in Africa”, African Futures Brief, 27 March 2012.
[19] Bulletin, Khat, drivers’ Impairment and Road traffic Injuries: a view from Ethiopia, WHO
(2010).
[20] Syed Daud Bin Syed Hassan, Breathalyzer Enabled Ignition Switch System, 15 April 2010.
[21] Ethiopian Federal Police Report, 2010/2011.

49
APPENDIXES
Appendix - I: Source Code
This program was written with C language by using MikroC Pro Compiler.
sbit LCD_EN at RB4_bit;
sbit LCD_RS at RB5_bit;
sbit LCD_D4 at RB0_bit;
sbit LCD_D5 at RB1_bit;
sbit LCD_D6 at RB2_bit;
sbit LCD_D7 at RB3_bit;
sbitLCD_EN_Direction at TRISB4_bit;
sbitLCD_RS_Direction at TRISB5_bit;
sbit LCD_D4_Direction at TRISB0_bit;
sbit LCD_D5_Direction at TRISB1_bit;
sbit LCD_D6_Direction at TRISB2_bit;
sbit LCD_D7_Direction at TRISB3_bit;
floatmvactualval;
char temper[7];
char *text;
unsignedintadc;
void main()
{
Lcd_Init();
Lcd_Cmd(_LCD_CURSOR_OFF);
Lcd_Cmd(_LCD_CLEAR);
text="DRUNK DRIVER";
Lcd_Out(1,1,text);
text="DETECT SYSTEM";
Lcd_Out(2,1,text);
Delay_ms(200);
ADCON1=0X80;

50
TRISA=0xff;
TRISB=0;
TRISD=0;
PORTD=0;
do
{
Lcd_Cmd(_LCD_CURSOR_OFF);
Lcd_Cmd(_LCD_CLEAR);
adc=ADC_Read(1);
mvactualval=(adc*5)/1023;
if(mvactualval>=2)
{
Lcd_Out(1,1,"DRUNK DRIVER");
Lcd_Out(2,1"BAC>>0.08%");
Delay_ms(200);
PORTD.F0=1;
Delay_ms(5000);
PORTD.F1=1;
}
else
{
Lcd_Out(1,1,"SAVE TO DRIVE");
PORTD.F0=0;
PORTD.F1=0;
}
Delay_ms(500);
// PORTB=adc;
//PORTC=adc>>2;
}
while(10);
}
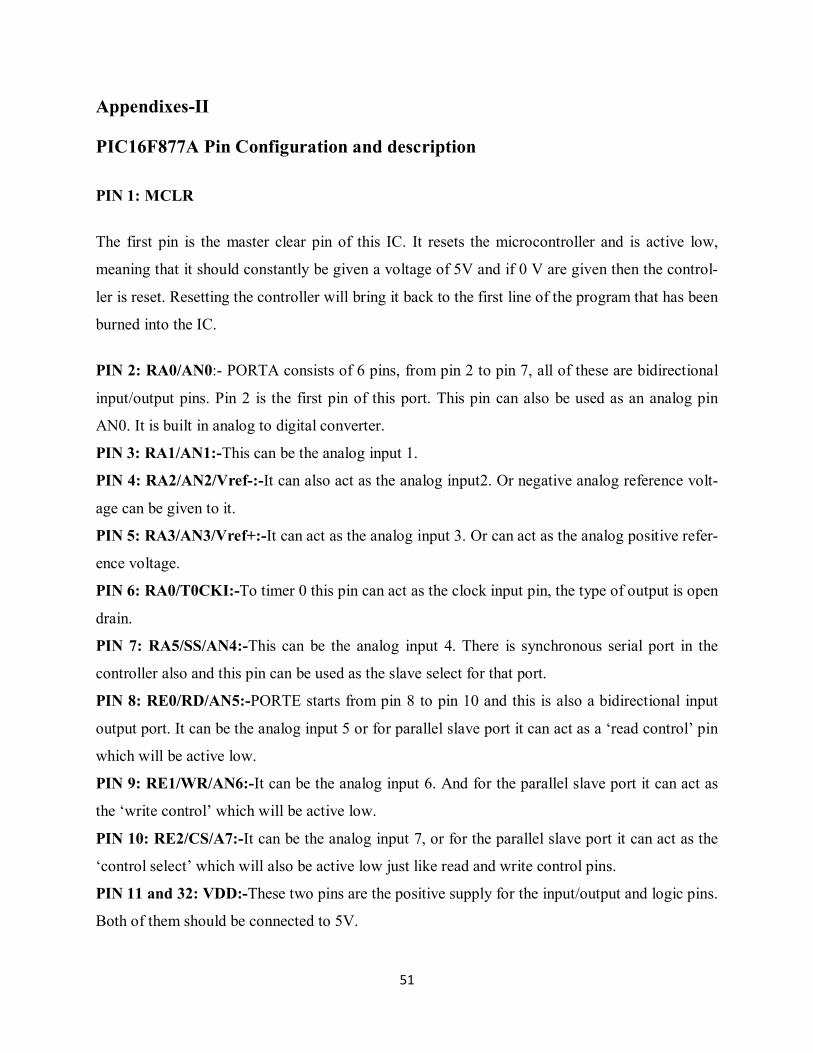
51
Appendixes-II
PIC16F877A Pin Configuration and description
PIN 1: MCLR
The first pin is the master clear pin of this IC. It resets the microcontroller and is active low,
meaning that it should constantly be given a voltage of 5V and if 0 V are given then the control-
ler is reset. Resetting the controller will bring it back to the first line of the program that has been
burned into the IC.
PIN 2: RA0/AN0:- PORTA consists of 6 pins, from pin 2 to pin 7, all of these are bidirectional
input/output pins. Pin 2 is the first pin of this port. This pin can also be used as an analog pin
AN0. It is built in analog to digital converter.
PIN 3: RA1/AN1:-This can be the analog input 1.
PIN 4: RA2/AN2/Vref-:-It can also act as the analog input2. Or negative analog reference volt-
age can be given to it.
PIN 5: RA3/AN3/Vref+:-It can act as the analog input 3. Or can act as the analog positive refer-
ence voltage.
PIN 6: RA0/T0CKI:-To timer 0 this pin can act as the clock input pin, the type of output is open
drain.
PIN 7: RA5/SS/AN4:-This can be the analog input 4. There is synchronous serial port in the
controller also and this pin can be used as the slave select for that port.
PIN 8: RE0/RD/AN5:-PORTE starts from pin 8 to pin 10 and this is also a bidirectional input
output port. It can be the analog input 5 or for parallel slave port it can act as a ‘read control’ pin
which will be active low.
PIN 9: RE1/WR/AN6:-It can be the analog input 6. And for the parallel slave port it can act as
the ‘write control’ which will be active low.
PIN 10: RE2/CS/A7:-It can be the analog input 7, or for the parallel slave port it can act as the
‘control select’ which will also be active low just like read and write control pins.
PIN 11 and 32: VDD:-These two pins are the positive supply for the input/output and logic pins.
Both of them should be connected to 5V.

52
PIN 12 and 31: VSS:-These pins are the ground reference for input/output and logic pins. They
should be connected to 0 potential.
PIN 13: OSC1/CLKIN:-This is the oscillator input or the external clock input pin.
PIN 14: OSC2/CLKOUT:-This is the oscillator output pin. A crystal resonator is connected be-
tween pin 13 and 14 to provide external clock to the microcontroller. ¼ of the frequency of
OSC1 is outputted by OSC2 in case of RC mode. This indicates the instruction cycle rate.
PIN 15: RC0/T1OCO/T1CKI:-PORTC consists of 8 pins. It is also a bidirectional input output
port of them, pin 15 is the first. It can be the clock input of timer 1 or the oscillator output of tim-
er 2.
PIN 16: RC1/T1OSI/CCP2:-It can be the oscillator input of timer 1 or the capture 2 in-
put/compare 2 outputs/ PWM 2 output.
PIN 17: RC2/CCP1:-It can be the capture 1 input/ compare 1 output/ PWM 1 output.
PIN 18: RC3/SCK/SCL:-It can be the output for SPI or I2C modes and can be the input/output
for synchronous serial clock.
PIN 23: RC4/SDI/SDA:-It can be the SPI data in pin. Or in I2C mode it can be data input/output
pin.
PIN 24: RC5/SDO:-It can be the data out of SPI in the SPI mode.
PIN 25: RC6/TX/CK:-It can be the synchronous clock or USART Asynchronous transmit pin.
PIN 26: RC7/RX/DT:-It can be the synchronous data pin or the USART receive pin.
PIN 19, 20, 21, 22, 27, 28, 29, and 30:-All of these pins belong to PORTD which is again a bidi-
rectional input and output port. When the microprocessor bus is to be interfaced, it can act as the
parallel slave port.
PIN 33-40: PORT B:-All these pins belong to PORTB. Out of which RB0 can be used as the
external interrupt pin and RB6 and RB7 can be used as in-circuit debugger pins.

53
Appendixes-III- Simulations and Photos
System simulations under normal condition
System simulation result under influence of alcohol

54
Reset effects on the microcontroller
Regulator Circuit Testing

55
Testing prototype with potentiometer (Vin<2V)
Testing Prototype with potentiometer (Vin≥2V)

56
Condition when Alcohol does not detected by sensor
Condition when Alcohol detected by sensor